UNITED STATES
SECURITIES AND EXCHANGE COMMISSION
Washington, D.C. 20549
FORM N-CSR
CERTIFIED SHAREHOLDER REPORT OF REGISTERED
MANAGEMENT INVESTMENT COMPANIES
Investment Company Act file number 811-02741
Fidelity Court Street Trust
(Exact name of registrant as specified in charter)
245 Summer St., Boston, Massachusetts 02210
(Address of principal executive offices) (Zip code)
Cynthia Lo Bessette, Secretary
245 Summer St.
Boston, Massachusetts 02210
(Name and address of agent for service)
Registrant's telephone number, including area code:
617-563-7000
| |
Date of fiscal year end: | November 30 |
|
|
Date of reporting period: | November 30, 2019 |
Item 1.
Reports to Stockholders
Fidelity® Connecticut Municipal Income Fund
Fidelity® Connecticut Municipal Money Market Fund
Annual Report
November 30, 2019

See the inside front cover for important information about access to your fund’s shareholder reports.

Beginning on January 1, 2021, as permitted by regulations adopted by the Securities and Exchange Commission, paper copies of a fund’s shareholder reports will no longer be sent by mail, unless you specifically request paper copies of the reports from the fund or from your financial intermediary, such as a financial advisor, broker-dealer or bank. Instead, the reports will be made available on a website, and you will be notified by mail each time a report is posted and provided with a website link to access the report.
If you already elected to receive shareholder reports electronically, you will not be affected by this change and you need not take any action. You may elect to receive shareholder reports and other communications from a fund electronically, by contacting your financial intermediary. For Fidelity customers, visit Fidelity's web site or call Fidelity using the contact information listed below.
You may elect to receive all future reports in paper free of charge. If you wish to continue receiving paper copies of your shareholder reports, you may contact your financial intermediary or, if you are a Fidelity customer, visit Fidelity’s website, or call Fidelity at the applicable toll-free number listed below. Your election to receive reports in paper will apply to all funds held with the fund complex/your financial intermediary.
| Account Type | Website | Phone Number |
| Brokerage, Mutual Fund, or Annuity Contracts: | fidelity.com/mailpreferences | 1-800-343-3548 |
| Employer Provided Retirement Accounts: | netbenefits.fidelity.com/preferences (choose 'no' under Required Disclosures to continue to print) | 1-800-343-0860 |
| Advisor Sold Accounts Serviced Through Your Financial Intermediary: | Contact Your Financial Intermediary | Your Financial Intermediary's phone number |
| Advisor Sold Accounts Serviced by Fidelity: | institutional.fidelity.com | 1-877-208-0098 |
Contents
To view a fund's proxy voting guidelines and proxy voting record for the 12-month period ended June 30, visit http://www.fidelity.com/proxyvotingresults or visit the Securities and Exchange Commission's (SEC) web site at http://www.sec.gov.
You may also call 1-800-544-8544 to request a free copy of the proxy voting guidelines.
Standard & Poor's, S&P and S&P 500 are registered service marks of The McGraw-Hill Companies, Inc. and have been licensed for use by Fidelity Distributors Corporation.
Other third-party marks appearing herein are the property of their respective owners.
All other marks appearing herein are registered or unregistered trademarks or service marks of FMR LLC or an affiliated company. © 2020 FMR LLC. All rights reserved.
This report and the financial statements contained herein are submitted for the general information of the shareholders of the Fund. This report is not authorized for distribution to prospective investors in the Fund unless preceded or accompanied by an effective prospectus.
A fund files its complete schedule of portfolio holdings with the SEC for the first and third quarters of each fiscal year on Form N-PORT. Forms N-PORT are available on the SEC’s web site at http://www.sec.gov. A fund's Forms N-PORT may be reviewed and copied at the SEC’s Public Reference Room in Washington, DC. Information regarding the operation of the SEC's Public Reference Room may be obtained by calling 1-800-SEC-0330.
For a complete list of a fund's portfolio holdings, view the most recent holdings listing, semiannual report, or annual report on Fidelity's web site at http://www.fidelity.com, http://www.institutional.fidelity.com, or http://www.401k.com, as applicable.
NOT FDIC INSURED •MAY LOSE VALUE •NO BANK GUARANTEE
Neither the Fund nor Fidelity Distributors Corporation is a bank.
Fidelity® Connecticut Municipal Income Fund
Performance: The Bottom Line
Average annual total return reflects the change in the value of an investment, assuming reinvestment of distributions from dividend income and capital gains (the profits earned upon the sale of securities that have grown in value, if any) and assuming a constant rate of performance each year. The hypothetical investment and the average annual total returns do not reflect the deduction of taxes that a shareholder would pay on fund distributions or the redemption of fund shares. During periods of reimbursement by Fidelity, a fund’s total return will be greater than it would be had the reimbursement not occurred. How a fund did yesterday is no guarantee of how it will do tomorrow.
Average Annual Total Returns
| For the periods ended November 30, 2019 | Past 1 year | Past 5 years | Past 10 years |
| Fidelity® Connecticut Municipal Income Fund | 8.83% | 3.22% | 3.78% |
$10,000 Over 10 Years
Let's say hypothetically that $10,000 was invested in Fidelity® Connecticut Municipal Income Fund on November 30, 2009.
The chart shows how the value of your investment would have changed, and also shows how the Bloomberg Barclays Municipal Bond Index performed over the same period.
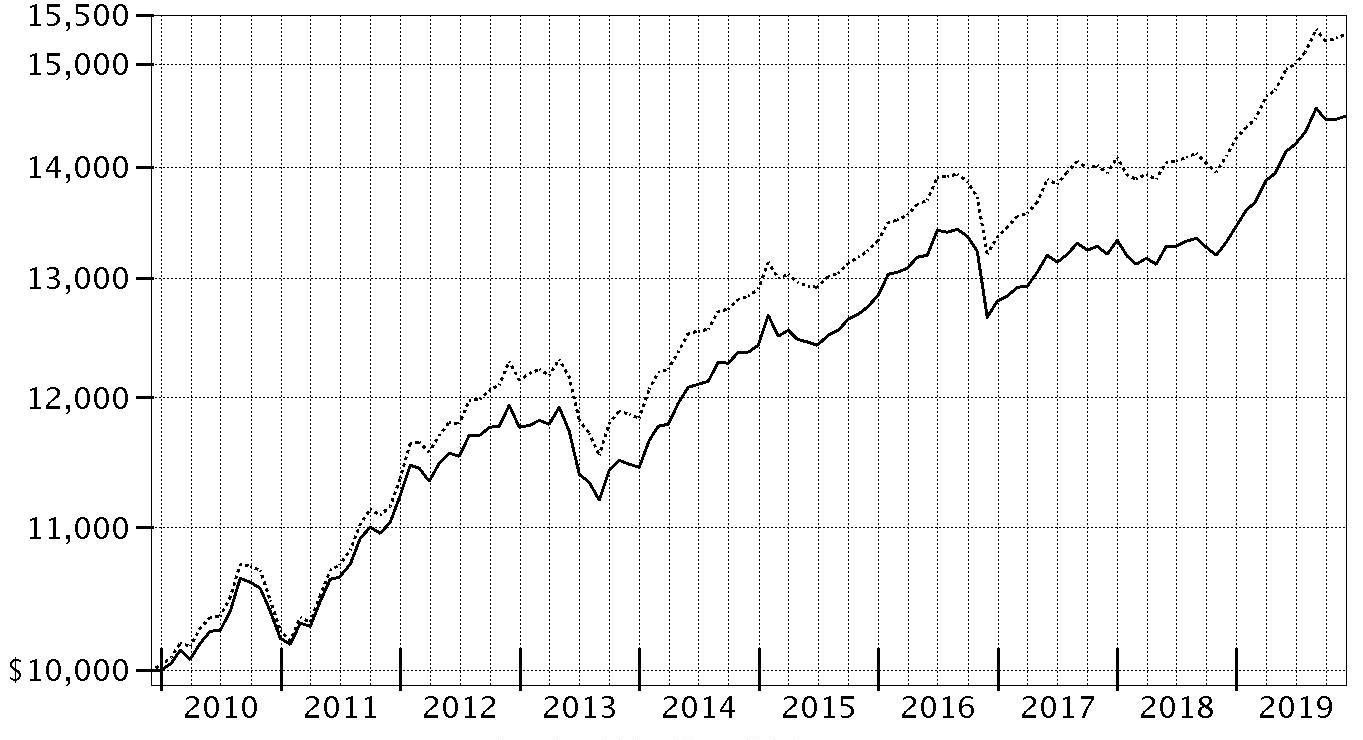
| Period Ending Values |
| $14,487 | Fidelity® Connecticut Municipal Income Fund |
| $15,300 | Bloomberg Barclays Municipal Bond Index |
Fidelity® Connecticut Municipal Income Fund
Management's Discussion of Fund Performance
Market Recap: Tax-exempt municipal bonds posted a healthy gain for the 12 months ending November 30, 2019, supported by strong supply/demand dynamics for much of the period. The Bloomberg Barclays Municipal Bond Index rose 8.49%. Gross municipal bond issuance remained below the long-term historical average, due to the elimination of tax-exempt advance refundings under the new tax law, historically a significant source of supply. The cap on the federal deduction for state and local taxes made tax-exempt debt attractive, particularly in high-tax states. The muni market rose strongly from early 2019 into mid-August amid growing evidence of a global economic slowdown and heightened international trade tension that led to a series of rate cuts by the U.S. Federal Reserve. Reversing a roughly three-year cycle of rate hikes, the Fed cut policy interest rates by 25 basis points in July. The Fed then followed with rate cuts of 25 basis points each in September and October, citing trade policy and the global economy as potential downside risks. The muni market experienced a negative return in September following the Fed’s shift on rates, as well as a less supportive technical environment. For the period, general obligation bonds gained 8.27%, while bonds tied to specific revenue streams or projects rose 8.92%.
Comments from Co-Portfolio Managers Cormac Cullen, Elizah McLaughlin and Kevin Ramundo: For the fiscal year, the fund gained 8.83%, modestly lagging, net of fees, the 9.08% advance of the Bloomberg Barclays Connecticut 2+ Year Enhanced Municipal Bond Index. In managing the fund the past 12 months, we continued to focus on longer-term objectives and sought to generate attractive tax-exempt income and competitive risk-adjusted return over time. The fund’s underweighting in debt issued by the state of Connecticut detracted versus the state benchmark; these securities ranked among some of the muni market's best performers. Additionally, overweighting certain health care securities with short call dates cost the fund some ground, given these bonds lagged the state benchmark. In contrast, duration (interest-rate sensitivity) positioning contributed to the fund’s relative return. We maintained a slightly longer duration for the fund versus the state benchmark for the 12 months, which added value as muni yields declined. The fund’s smaller-than-benchmark exposure to the lagging housing sector, as well as security selection in that segment, contributed positively to performance versus the state benchmark. Elsewhere, differences in the way fund holdings and index components were priced also contributed versus the state benchmark.
The views expressed above reflect those of the portfolio manager(s) only through the end of the period as stated on the cover of this report and do not necessarily represent the views of Fidelity or any other person in the Fidelity organization. Any such views are subject to change at any time based upon market or other conditions and Fidelity disclaims any responsibility to update such views. These views may not be relied on as investment advice and, because investment decisions for a Fidelity fund are based on numerous factors, may not be relied on as an indication of trading intent on behalf of any Fidelity fund.
Note to shareholders: Mark Sommer retired from Fidelity On December 31, 2018, after more than 25 years with the firm.
Fidelity® Connecticut Municipal Income Fund
Investment Summary (Unaudited)
Top Five Sectors as of November 30, 2019
| | % of fund's net assets |
| General Obligations | 39.8 |
| Health Care | 16.7 |
| Education | 12.6 |
| Water & Sewer | 9.4 |
| Special Tax | 7.9 |
Quality Diversification (% of fund's net assets)
| As of November 30, 2019 |
| | AAA | 3.8% |
| | AA,A | 74.0% |
| | BBB | 15.1% |
| | Not Rated | 2.4% |
| | Short-Term Investments and Net Other Assets | 4.7% |

We have used ratings from Moody's Investors Service, Inc. Where Moody's® ratings are not available, we have used S&P® ratings. All ratings are as of the date indicated and do not reflect subsequent changes.
Fidelity® Connecticut Municipal Income Fund
Schedule of Investments November 30, 2019
Showing Percentage of Net Assets
| Municipal Bonds - 95.3% | | | |
| | | Principal Amount | Value |
| Connecticut - 95.1% | | | |
| Bridgeport Gen. Oblig.: | | | |
| Series 2012 A: | | $ | $ |
| 5% 2/15/23 | | 3,510,000 | 3,754,998 |
| 5% 2/15/24 | | 645,000 | 688,563 |
| 5% 2/15/32 (Pre-Refunded to 2/15/22 @ 100) | | 1,110,000 | 1,202,807 |
| Series 2016 D: | | | |
| 5% 8/15/31 (FSA Insured) | | 1,000,000 | 1,185,410 |
| 5% 8/15/32 (FSA Insured) | | 3,090,000 | 3,654,080 |
| Series 2019 A: | | | |
| 5% 2/1/32 (Build America Mutual Assurance Insured) | | 1,000,000 | 1,215,930 |
| 5% 2/1/37 (Build America Mutual Assurance Insured) | | 1,000,000 | 1,199,660 |
| 5% 2/1/39 (Build America Mutual Assurance Insured) | | 1,000,000 | 1,191,370 |
| 5% 2/1/49 (Build America Mutual Assurance Insured) | | 1,285,000 | 1,506,585 |
| Connecticut Arpt. Auth. Customer Facility Charge Rev. (Ground Trans. Ctr. Proj.) Series 2019 A: | | | |
| 4% 7/1/49 (a) | | 2,000,000 | 2,173,440 |
| 5% 7/1/49 (a) | | 2,925,000 | 3,502,044 |
| Connecticut Gen. Oblig.: | | | |
| Series 2012 G, 5% 10/15/30 | | 4,275,000 | 4,662,785 |
| Series 2013 A: | | | |
| 5% 3/1/27 | | 5,480,000 | 6,079,019 |
| 5% 10/15/27 | | 1,000,000 | 1,128,060 |
| Series 2014 G, 5% 11/15/28 | | 7,000,000 | 8,108,030 |
| Series 2015 B: | | | |
| 5% 6/15/27 | | 4,825,000 | 5,659,243 |
| 5% 6/15/30 | | 1,290,000 | 1,497,058 |
| 5% 6/15/32 | | 5,500,000 | 6,353,765 |
| Series 2015 F, 5% 11/15/31 | | 4,000,000 | 4,671,080 |
| Series 2016 A, 5% 3/15/31 | | 6,950,000 | 8,188,212 |
| Series 2018 A: | | | |
| 5% 4/15/30 | | 2,500,000 | 3,086,900 |
| 5% 4/15/38 | | 1,700,000 | 2,046,171 |
| Series 2018 C, 5% 6/15/31 | | 725,000 | 893,555 |
| Series 2019 A: | | | |
| 4% 4/15/37 | | 1,825,000 | 2,061,447 |
| 5% 4/15/25 | | 1,140,000 | 1,344,060 |
| 5% 4/15/28 | | 7,450,000 | 9,309,222 |
| 5% 4/15/35 | | 2,000,000 | 2,474,560 |
| 5% 4/15/36 | | 2,300,000 | 2,837,625 |
| 5% 4/15/39 | | 2,450,000 | 2,992,626 |
| Connecticut Health & Edl. Facilities Auth. Rev.: | | | |
| (Fairfield Univ.): | | | |
| Series 2017 R: | | | |
| 5% 7/1/31 | | 1,825,000 | 2,200,804 |
| 5% 7/1/32 | | 1,000,000 | 1,201,210 |
| Series 2017, 5% 7/1/30 | | 2,400,000 | 2,913,192 |
| (Sacred Heart Univ., CT. Proj.) Series 2017 I-1: | | | |
| 5% 7/1/28 | | 600,000 | 738,744 |
| 5% 7/1/29 | | 350,000 | 429,013 |
| 5% 7/1/30 | | 850,000 | 1,037,111 |
| 5% 7/1/31 | | 1,300,000 | 1,580,930 |
| 5% 7/1/32 | | 1,050,000 | 1,273,556 |
| 5% 7/1/33 | | 700,000 | 847,161 |
| 5% 7/1/34 | | 750,000 | 905,888 |
| 5% 7/1/42 | | 2,000,000 | 2,371,860 |
| (Stamford Hosp. Proj.) Series I, 5% 7/1/30 | | 10,765,000 | 10,970,719 |
| (Trinity Health Proj.) Series 2010, 4.75% 11/15/29 (Pre-Refunded to 11/15/20 @ 100) | | 50,000 | 51,681 |
| Series 2011 M, 5.375% 7/1/41 (Pre-Refunded to 7/1/21 @ 100) | | 5,485,000 | 5,848,052 |
| Series 2013 N: | | | |
| 5% 7/1/24 | | 400,000 | 453,780 |
| 5% 7/1/25 | | 300,000 | 339,771 |
| Series 2014 E: | | | |
| 5% 7/1/28 | | 3,260,000 | 3,772,244 |
| 5% 7/1/29 | | 3,840,000 | 4,436,160 |
| Series 2015 L, 5% 7/1/29 | | 1,500,000 | 1,752,795 |
| Series 2016 CT, 5% 12/1/45 | | 2,850,000 | 3,305,573 |
| Series 2016 K, 4% 7/1/46 | | 7,000,000 | 7,373,870 |
| Series 2016, 5% 12/1/41 | | 5,150,000 | 6,002,377 |
| Series 2018 K3, 5% 7/1/38 | | 985,000 | 1,150,362 |
| Series 2019 A, 5% 7/1/49 (b) | | 6,000,000 | 6,466,620 |
| Series A, 5% 7/1/41 | | 3,000,000 | 3,134,520 |
| Series E: | | | |
| 5% 7/1/28 | | 1,250,000 | 1,423,188 |
| 5% 7/1/42 | | 5,000,000 | 5,569,300 |
| Series F, 5% 7/1/45 | | 4,890,000 | 5,513,182 |
| Series H1, 5% 7/1/41 | | 1,250,000 | 1,313,638 |
| Series J, 5% 11/1/25 | | 1,465,000 | 1,560,445 |
| Series K1: | | | |
| 5% 7/1/24 | | 600,000 | 679,194 |
| 5% 7/1/25 | | 1,240,000 | 1,434,519 |
| 5% 7/1/27 | | 250,000 | 299,298 |
| Series K3, 5% 7/1/48 | | 3,695,000 | 4,235,431 |
| Series L: | | | |
| 5% 7/1/26 | | 1,000,000 | 1,183,510 |
| 5% 7/1/27 | | 2,000,000 | 2,360,000 |
| Series N: | | | |
| 4% 7/1/39 (c) | | 1,850,000 | 1,990,452 |
| 5% 7/1/21 (c) | | 100,000 | 105,257 |
| 5% 7/1/22 (c) | | 400,000 | 434,800 |
| 5% 7/1/23 (c) | | 415,000 | 463,750 |
| 5% 7/1/24 (c) | | 375,000 | 429,386 |
| 5% 7/1/25 (c) | | 340,000 | 397,780 |
| 5% 7/1/27 (c) | | 430,000 | 519,741 |
| 5% 7/1/31 (c) | | 500,000 | 604,790 |
| 5% 7/1/32 (c) | | 550,000 | 660,572 |
| 5% 7/1/33 (c) | | 470,000 | 561,232 |
| 5% 7/1/34 (c) | | 425,000 | 506,294 |
| Connecticut Higher Ed. Supplemental Ln. Auth. Rev. (Chesla Ln. Prog.): | | | |
| Series 2017 A: | | | |
| 5% 11/15/20 (a) | | 950,000 | 979,776 |
| 5% 11/15/23 (a) | | 1,100,000 | 1,230,691 |
| Series 2017 B: | | | |
| 5% 11/15/22 (a) | | 975,000 | 1,064,749 |
| 5% 11/15/24 (a) | | 1,065,000 | 1,218,701 |
| Connecticut Hsg. Fin. Auth.: | | | |
| Series 2012 F, 2.75% 11/15/35 (a) | | 515,000 | 523,446 |
| Series 2013 B2, 4% 11/15/32 | | 1,400,000 | 1,444,086 |
| Series 2014 C, 4% 11/15/44 | | 570,000 | 597,417 |
| Series 2016 F, 3.5% 5/15/39 (a) | | 1,850,000 | 1,935,655 |
| Series 2019 B1, 4% 5/15/49 | | 4,000,000 | 4,445,440 |
| Series 2019 F, 3.5% 11/15/43 | | 4,000,000 | 4,314,400 |
| Connecticut Muni. Elec. Energy Coop. Pwr. Supply Sys. Rev. Series 2013 A, 5% 1/1/28 | | 1,000,000 | 1,105,620 |
| Connecticut Spl. Tax Oblig. Trans. Infrastructure Rev.: | | | |
| Series 2012 A: | | | |
| 5% 1/1/26 | | 10,000,000 | 11,066,493 |
| 5% 1/1/28 | | 1,000,000 | 1,102,760 |
| 5% 1/1/31 | | 5,000,000 | 5,490,550 |
| Series 2015 A, 5% 8/1/34 | | 6,000,000 | 6,969,360 |
| Series A, 5% 9/1/33 | | 1,000,000 | 1,140,900 |
| Greater New Haven Wtr. Poll. Cont. Auth. Reg'l. Wastewtr. Sys. Rev.: | | | |
| Series 2005 A, 5% 8/15/35 (Nat'l. Pub. Fin. Guarantee Corp. Insured) | | 10,000 | 10,030 |
| Series 2014 B: | | | |
| 5% 8/15/25 | | 450,000 | 523,364 |
| 5% 8/15/26 | | 700,000 | 811,013 |
| 5% 8/15/27 | | 750,000 | 864,885 |
| 5% 8/15/28 | | 1,000,000 | 1,150,730 |
| Hartford County Metropolitan District (Connecticut Clean Wtr. Proj.): | | | |
| Series 2013 A, 5% 4/1/32 | | 5,550,000 | 5,981,790 |
| Series 2014 A: | | | |
| 5% 11/1/28 | | 1,000,000 | 1,162,880 |
| 5% 11/1/29 | | 1,850,000 | 2,146,592 |
| 5% 11/1/30 | | 2,480,000 | 2,868,492 |
| 5% 11/1/31 | | 2,905,000 | 3,358,674 |
| 5% 11/1/42 | | 2,115,000 | 2,409,408 |
| Hartford County Metropolitan District Gen. Oblig. Series 2018: | | | |
| 5% 7/15/31 | | 1,000,000 | 1,246,820 |
| 5% 7/15/32 | | 1,250,000 | 1,552,800 |
| 5% 7/15/33 | | 1,000,000 | 1,235,670 |
| 5% 7/15/34 | | 1,000,000 | 1,231,170 |
| Hartford Gen. Oblig.: | | | |
| Series 2012 A, 5% 4/1/22 (FSA Insured) | | 1,000,000 | 1,084,960 |
| Series 2014 C, 5% 8/15/24 (Build America Mutual Assurance Insured) | | 1,835,000 | 2,139,628 |
| Series 2015 A: | | | |
| 5% 7/1/28 (FSA Insured) | | 1,000,000 | 1,174,850 |
| 5% 7/1/29 (FSA Insured) | | 1,000,000 | 1,170,850 |
| Hbr. Point Infrastructure Impt. District Series 2017, 5% 4/1/39 (b) | | 2,000,000 | 2,253,860 |
| Naugatuck Ctfs. of Prtn. (Naugatuck Incineration Facilities Proj.) Series 2014 A, 5% 6/15/22 (a) | | 1,000,000 | 1,082,350 |
| Naugatuck Gen. Oblig. 5.875% 2/15/21 (AMBAC Insured) | | 440,000 | 453,376 |
| New Britain Gen. Oblig.: | | | |
| Series 2015 A: | | | |
| 5% 3/1/26 (Pre-Refunded to 3/1/25 @ 100) | | 1,530,000 | 1,816,064 |
| 5% 3/1/27 (Build America Mutual Assurance Insured) | | 1,605,000 | 1,865,877 |
| 5% 3/1/29 (Build America Mutual Assurance Insured) | | 1,770,000 | 2,044,881 |
| 5% 3/1/30 (Build America Mutual Assurance Insured) | | 1,860,000 | 2,141,790 |
| 5% 3/1/31 (Build America Mutual Assurance Insured) | | 1,955,000 | 2,239,335 |
| Series 2017 C: | | | |
| 5% 3/1/32 (FSA Insured) | | 1,635,000 | 1,951,095 |
| 5% 3/1/33 (FSA Insured) | | 1,900,000 | 2,258,986 |
| New Haven Gen. Oblig.: | | | |
| Series 2015 B: | | | |
| 5% 8/15/26 (Build America Mutual Assurance Insured) | | 615,000 | 723,812 |
| 5% 8/15/26 (Pre-Refunded to 8/15/25 @ 100) | | 635,000 | 763,276 |
| 5% 8/15/27 (Build America Mutual Assurance Insured) | | 765,000 | 895,578 |
| Series 2016 A: | | | |
| 5% 8/15/27 (Pre-Refunded to 8/15/26 @ 100) | | 35,000 | 42,980 |
| 5% 8/15/28 (FSA Insured) | | 1,500,000 | 1,785,060 |
| 5% 8/15/30 (FSA Insured) | | 1,000,000 | 1,176,950 |
| 5% 8/15/34 (FSA Insured) | | 1,000,000 | 1,163,970 |
| 5% 8/15/35 (FSA Insured) | | 1,000,000 | 1,162,190 |
| 5% 9/1/29 (FSA Insured) | | 2,655,000 | 3,070,906 |
| 5% 9/1/31 (FSA Insured) | | 1,430,000 | 1,642,598 |
| South Central Reg'l. Wtr. Auth. Wtr. Sys. Rev.: | | | |
| Eighth Series A, 5% 8/1/33 (Pre-Refunded to 8/1/22 @ 100) | | 1,110,000 | 1,221,977 |
| Series 2013 A, 5% 8/1/43 (Pre-Refunded to 8/1/22 @ 100) | | 2,000,000 | 2,201,760 |
| Series 30 B: | | | |
| 5% 8/1/30 | | 1,150,000 | 1,327,353 |
| 5% 8/1/31 | | 2,630,000 | 3,029,444 |
| Series 32 B: | | | |
| 5% 8/1/32 | | 1,000,000 | 1,203,070 |
| 5% 8/1/33 | | 1,150,000 | 1,380,092 |
| 5% 8/1/37 | | 3,000,000 | 3,569,040 |
| 5% 8/1/38 | | 1,000,000 | 1,186,980 |
| Stratford Gen. Oblig.: | | | |
| Series 2017, 5% 7/1/30 (FSA Insured) | | 1,000,000 | 1,172,530 |
| Series 2019, 5% 1/1/27 | | 1,990,000 | 2,425,850 |
| Univ. of Connecticut Gen. Oblig.: | | | |
| Series 2011 A, 5% 2/15/27 | | 3,000,000 | 3,122,460 |
| Series 2018 A, 5% 4/15/28 | | 4,400,000 | 5,482,576 |
| West Haven Gen. Oblig.: | | | |
| Series 2017 A: | | | |
| 5% 11/1/22 | | 800,000 | 852,736 |
| 5% 11/1/25 | | 635,000 | 711,143 |
| 5% 11/1/26 | | 635,000 | 720,458 |
| Series 2017 B, 5% 11/1/32 | | 400,000 | 450,648 |
|
| TOTAL CONNECTICUT | | | 334,819,758 |
|
| Guam - 0.2% | | | |
| Guam Int'l. Arpt. Auth. Rev. Series 2013 C, 6.375% 10/1/43 (a) | | 800,000 | 922,504 |
| TOTAL MUNICIPAL BONDS | | | |
| (Cost $320,028,169) | | | 335,742,262 |
|
| Municipal Notes - 5.3% | | | |
| Connecticut - 5.3% | | | |
| Connecticut Health & Edl. Facilities Auth. Rev. (Yale Univ. Proj.) Series V2, 0.65% 12/2/19, VRDN (d) | | 2,700,000 | $2,700,000 |
| Connecticut Hsg. Fin. Auth.: | | | |
| Series 2016 B, 1.09% 12/6/19 (Liquidity Facility Wells Fargo Bank NA), VRDN (d) | | 6,500,000 | 6,500,000 |
| Series 2017 C, 1.17% 12/6/19 (Liquidity Facility TD Banknorth, NA), VRDN (a)(d) | | 2,600,000 | 2,600,000 |
| Connecticut Innovations, Inc. Rev. (ISO New England, Inc. Proj.) Series 2012, 1.12% 12/6/19, LOC TD Banknorth, NA, VRDN (d) | | 6,785,000 | 6,785,000 |
| TOTAL MUNICIPAL NOTES | | | |
| (Cost $18,585,000) | | | 18,585,000 |
| TOTAL INVESTMENT IN SECURITIES - 100.6% | | | |
| (Cost $338,613,169) | | | 354,327,262 |
| NET OTHER ASSETS (LIABILITIES) - (0.6)% | | | (2,253,946) |
| NET ASSETS - 100% | | | $352,073,316 |
Security Type Abbreviations
VRDN – VARIABLE RATE DEMAND NOTE (A debt instrument that is payable upon demand, either daily, weekly or monthly)
Legend
(a) Private activity obligations whose interest is subject to the federal alternative minimum tax for individuals.
(b) Security exempt from registration under Rule 144A of the Securities Act of 1933. These securities may be resold in transactions exempt from registration, normally to qualified institutional buyers. At the end of the period, the value of these securities amounted to $8,720,480 or 2.5% of net assets.
(c) Security or a portion of the security purchased on a delayed delivery or when-issued basis.
(d) Coupon rates for floating and adjustable rate securities reflect the rates in effect at period end.
Investment Valuation
All investments are categorized as Level 2 under the Fair Value Hierarchy. The inputs or methodology used for valuing securities may not be an indication of the risk associated with investing in those securities. For more information on valuation inputs please refer to the Investment Valuation section in the accompanying Notes to Financial Statements.
Other Information
The distribution of municipal securities by revenue source, as a percentage of total Net Assets, is as follows (Unaudited):
| General Obligations | 39.8% |
| Health Care | 16.7% |
| Education | 12.6% |
| Water & Sewer | 9.4% |
| Special Tax | 7.9% |
| Housing | 6.5% |
| Others* (Individually Less Than 5%) | 7.1% |
| | 100.0% |
* Includes net other assets
See accompanying notes which are an integral part of the financial statements.
Fidelity® Connecticut Municipal Income Fund
Financial Statements
Statement of Assets and Liabilities
| | | November 30, 2019 |
| Assets | | |
Investment in securities, at value — See accompanying schedule:
Unaffiliated issuers (cost $338,613,169) | | $354,327,262 |
| Cash | | 449,731 |
| Receivable for fund shares sold | | 8,980 |
| Interest receivable | | 4,331,066 |
| Prepaid expenses | | 522 |
| Other receivables | | 1,183 |
| Total assets | | 359,118,744 |
| Liabilities | | |
| Payable for investments purchased on a delayed delivery basis | $6,633,671 | |
| Payable for fund shares redeemed | 20,495 | |
| Distributions payable | 209,634 | |
| Accrued management fee | 102,464 | |
| Other affiliated payables | 30,012 | |
| Other payables and accrued expenses | 49,152 | |
| Total liabilities | | 7,045,428 |
| Net Assets | | $352,073,316 |
| Net Assets consist of: | | |
| Paid in capital | | $336,068,636 |
| Total accumulated earnings (loss) | | 16,004,680 |
| Net Assets | | $352,073,316 |
| Net Asset Value, offering price and redemption price per share ($352,073,316 ÷ 29,890,045 shares) | | $11.78 |
See accompanying notes which are an integral part of the financial statements.
Statement of Operations
| | | Year ended November 30, 2019 |
| Investment Income | | |
| Interest | | $10,085,007 |
| Expenses | | |
| Management fee | $1,185,178 | |
| Transfer agent fees | 259,120 | |
| Accounting fees and expenses | 86,757 | |
| Custodian fees and expenses | 2,542 | |
| Independent trustees' fees and expenses | 1,376 | |
| Registration fees | 23,652 | |
| Audit | 58,027 | |
| Legal | 3,689 | |
| Miscellaneous | 2,024 | |
| Total expenses before reductions | 1,622,365 | |
| Expense reductions | (3,821) | |
| Total expenses after reductions | | 1,618,544 |
| Net investment income (loss) | | 8,466,463 |
| Realized and Unrealized Gain (Loss) | | |
| Net realized gain (loss) on: | | |
| Investment securities: | | |
| Unaffiliated issuers | | 397,706 |
| Total net realized gain (loss) | | 397,706 |
| Change in net unrealized appreciation (depreciation) on investment securities | | 19,101,006 |
| Net gain (loss) | | 19,498,712 |
| Net increase (decrease) in net assets resulting from operations | | $27,965,175 |
See accompanying notes which are an integral part of the financial statements.
Statement of Changes in Net Assets
| | Year ended November 30, 2019 | Year ended November 30, 2018 |
| Increase (Decrease) in Net Assets | | |
| Operations | | |
| Net investment income (loss) | $8,466,463 | $8,879,211 |
| Net realized gain (loss) | 397,706 | (136,864) |
| Change in net unrealized appreciation (depreciation) | 19,101,006 | (5,802,304) |
| Net increase (decrease) in net assets resulting from operations | 27,965,175 | 2,940,043 |
| Distributions to shareholders | (8,466,425) | (10,819,308) |
| Share transactions | | |
| Proceeds from sales of shares | 49,523,566 | 32,414,976 |
| Reinvestment of distributions | 5,884,733 | 7,576,492 |
| Cost of shares redeemed | (49,310,049) | (86,133,013) |
| Net increase (decrease) in net assets resulting from share transactions | 6,098,250 | (46,141,545) |
| Total increase (decrease) in net assets | 25,597,000 | (54,020,810) |
| Net Assets | | |
| Beginning of period | 326,476,316 | 380,497,126 |
| End of period | $352,073,316 | $326,476,316 |
| Other Information | | |
| Shares | | |
| Sold | 4,284,659 | 2,888,625 |
| Issued in reinvestment of distributions | 507,582 | 676,258 |
| Redeemed | (4,305,656) | (7,695,462) |
| Net increase (decrease) | 486,585 | (4,130,579) |
See accompanying notes which are an integral part of the financial statements.
Financial Highlights
Fidelity Connecticut Municipal Income Fund
| | | | | | |
| Years ended November 30, | 2019 | 2018 | 2017 | 2016 | 2015 |
| Selected Per–Share Data | | | | | |
| Net asset value, beginning of period | $11.10 | $11.35 | $11.30 | $11.75 | $11.78 |
| Income from Investment Operations | | | | | |
| Net investment income (loss)A | .292 | .282 | .289 | .306 | .328 |
| Net realized and unrealized gain (loss) | .680 | (.191) | .185 | (.372) | .031 |
| Total from investment operations | .972 | .091 | .474 | (.066) | .359 |
| Distributions from net investment income | (.292) | (.282) | (.289) | (.306) | (.328) |
| Distributions from net realized gain | – | (.059) | (.135) | (.078) | (.061) |
| Total distributions | (.292) | (.341) | (.424) | (.384) | (.389) |
| Redemption fees added to paid in capitalA | – | – | –B | –B | –B |
| Net asset value, end of period | $11.78 | $11.10 | $11.35 | $11.30 | $11.75 |
| Total ReturnC | 8.83% | .82% | 4.26% | (.66)% | 3.10% |
| Ratios to Average Net AssetsD | | | | | |
| Expenses before reductions | .48% | .48% | .48% | .48% | .48% |
| Expenses net of fee waivers, if any | .48% | .48% | .48% | .48% | .48% |
| Expenses net of all reductions | .48% | .48% | .48% | .48% | .48% |
| Net investment income (loss) | 2.53% | 2.52% | 2.53% | 2.57% | 2.80% |
| Supplemental Data | | | | | |
| Net assets, end of period (000 omitted) | $352,073 | $326,476 | $380,497 | $424,798 | $443,037 |
| Portfolio turnover rate | 20% | 12% | 8% | 20% | 13% |
A Calculated based on average shares outstanding during the period.
B Amount represents less than $.0005 per share.
C Total returns would have been lower if certain expenses had not been reduced during the applicable periods shown.
D Expense ratios reflect operating expenses of the Fund. Expenses before reductions do not reflect amounts reimbursed by the investment adviser or reductions from expense offset arrangements and do not represent the amount paid by the Fund during periods when reimbursements or reductions occur. Expenses net of fee waivers reflect expenses after reimbursement by the investment adviser but prior to reductions from expense offset arrangements. Expenses net of all reductions represent the net expenses paid by the Fund.
See accompanying notes which are an integral part of the financial statements.
Fidelity® Connecticut Municipal Money Market Fund
Investment Summary/Performance (Unaudited)
Effective Maturity Diversification
| Days | % of fund's investments 11/30/19 |
| 1 - 7 | 72.9 |
| 8 - 30 | 0.1 |
| 31 - 60 | 5.9 |
| 61 - 90 | 2.1 |
| 91 - 180 | 7.6 |
| > 180 | 11.4 |
Effective maturity is determined in accordance with the requirements of Rule 2a-7 under the Investment Company Act of 1940.
Asset Allocation (% of fund's net assets)
| As of November 30, 2019 |
| | Variable Rate Demand Notes (VRDNs) | 45.6% |
| | Tender Option Bond | 28.7% |
| | Other Municipal Security | 21.4% |
| | Investment Companies | 4.1% |
| | Net Other Assets (Liabilities) | 0.2% |

Current 7-Day Yields
| | 11/30/19 |
| Fidelity® Connecticut Municipal Money Market Fund | 0.68% |
Yield refers to the income paid by the Fund over a given period. Yield for money market funds is usually for seven-day periods, as it is here, though it is expressed as an annual percentage rate. Past performance is no guarantee of future results. Yield will vary and it's possible to lose money investing in the Fund.
Fidelity® Connecticut Municipal Money Market Fund
Schedule of Investments November 30, 2019
Showing Percentage of Net Assets
| Variable Rate Demand Note - 45.6% | | | |
| | | Principal Amount | Value |
| Alabama - 0.5% | | | |
| Decatur Indl. Dev. Board Exempt Facilities Rev. (Nucor Steel Decatur LLC Proj.) Series 2003 A, 1.25% 12/6/19, VRDN (a)(b) | | $1,900,000 | $1,900,000 |
| Arkansas - 0.8% | | | |
| Blytheville Indl. Dev. Rev. (Nucor Corp. Proj.) Series 2002, 1.25% 12/6/19, VRDN (a)(b) | | 3,500,000 | 3,500,000 |
| Connecticut - 42.5% | | | |
| Connecticut Dev. Auth. Arpt. Facility Rev. (Embraer Aircraft Holding, Inc. Proj.) Series 2010 A, 1.11% 12/6/19, LOC Citibank NA, VRDN (b) | | 11,045,000 | 11,045,000 |
| Connecticut Dev. Auth. Wtr. Facilities Rev. (Connecticut Wtr. Co. Proj.): | | | |
| Series 2004 A, 1.27% 12/6/19, LOC RBS Citizens NA, VRDN (a)(b) | | 5,000,000 | 5,000,000 |
| Series 2004 B, 1.22% 12/6/19, LOC RBS Citizens NA, VRDN (b) | | 4,550,000 | 4,550,000 |
| Connecticut Gen. Oblig. Series 2016 C, 1.16% 12/6/19 (Liquidity Facility Bank of America NA), VRDN (b) | | 33,085,000 | 33,085,001 |
| Connecticut Health & Edl. Facilities Auth. Rev.: | | | |
| (Gaylord Hosp. Proj.) Series B, 1.11% 12/6/19, LOC Bank of America NA, VRDN (b) | | 12,900,000 | 12,900,000 |
| (Hamden Hall Country Day School Proj.) Series A, 1.2% 12/6/19, LOC RBS Citizens NA, VRDN (b) | | 14,210,000 | 14,210,000 |
| (Trinity College Proj.) Series L, 1.11% 12/6/19, LOC JPMorgan Chase Bank, VRDN (b) | | 7,685,000 | 7,685,000 |
| Series 2007 D, 1.11% 12/6/19, LOC Bank of America NA, VRDN (b) | | 8,655,000 | 8,655,000 |
| Series 2011 A, 1.13% 12/6/19, LOC HSBC Bank U.S.A., NA, VRDN (b) | | 1,750,000 | 1,750,000 |
| Series 2011 B, 1.1% 12/6/19, LOC Bank of America NA, VRDN (b) | | 8,500,000 | 8,500,000 |
| Series 2013 O, 1.11% 12/6/19, VRDN (b) | | 8,900,000 | 8,900,000 |
| Series 2014 C, 1.11% 12/6/19, VRDN (b) | | 8,325,000 | 8,325,000 |
| Connecticut Hsg. Fin. Auth.: | | | |
| (Hsg. Mtg. Fin. Proj.) Series 2012 D3, 1.16% 12/6/19 (Liquidity Facility Sumitomo Mitsui Banking Corp.), VRDN (a)(b) | | 14,805,000 | 14,805,000 |
| Series 2017 C, 1.17% 12/6/19 (Liquidity Facility TD Banknorth, NA), VRDN (a)(b) | | 4,000,000 | 4,000,000 |
| Series 2019 A, 1.12% 12/6/19 (Liquidity Facility U.S. Bank NA, Cincinnati), VRDN (a)(b) | | 1,470,000 | 1,470,000 |
| Connecticut Innovations, Inc. Rev. (ISO New England, Inc. Proj.) Series 2012, 1.12% 12/6/19, LOC TD Banknorth, NA, VRDN (b) | | 1,670,000 | 1,670,000 |
| FNMA Stamford Hsg. Auth. Multi-family Rev. 1.13% 12/6/19, LOC Fannie Mae, VRDN (a)(b) | | 31,680,000 | 31,680,000 |
| | | | 178,230,001 |
| Indiana - 0.5% | | | |
| Indiana Dev. Fin. Auth. Envir. Rev. (PSI Energy Proj.): | | | |
| Series 2003 A, 1.22% 12/6/19, VRDN (a)(b) | | 600,000 | 600,000 |
| Series 2003 B, 1.16% 12/6/19, VRDN (a)(b) | | 1,400,000 | 1,400,000 |
| | | | 2,000,000 |
| Kansas - 0.5% | | | |
| Burlington Envir. Impt. Rev. (Kansas City Pwr. and Lt. Co. Proj.): | | | |
| Series 2007 A, 1.3% 12/6/19, VRDN (b) | | 500,000 | 500,000 |
| Series 2007 B, 1.3% 12/6/19, VRDN (b) | | 200,000 | 200,000 |
| St. Mary's Kansas Poll. Cont. Rev. (Kansas Gas and Elec. Co. Proj.) Series 1994, 1.28% 12/6/19, VRDN (b) | | 1,100,000 | 1,100,000 |
| Wamego Kansas Poll. Cont. Rfdg. Rev. (Kansas Gas & Elec. Co. Proj.) Series 1994, 1.28% 12/6/19, VRDN (b) | | 100,000 | 100,000 |
| | | | 1,900,000 |
| Nebraska - 0.3% | | | |
| Stanton County Indl. Dev. Rev.: | | | |
| (Nucor Corp. Proj.) Series 1996, 1.25% 12/6/19, VRDN (a)(b) | | 1,200,000 | 1,200,000 |
| Series 1998, 1.25% 12/6/19, VRDN (a)(b) | | 100,000 | 100,000 |
| | | | 1,300,000 |
| North Carolina - 0.1% | | | |
| Hertford County Indl. Facilities Poll. Cont. Fing. Auth. (Nucor Corp. Proj.) Series 2000 A, 1.25% 12/6/19, VRDN (a)(b) | | 300,000 | 300,000 |
| South Carolina - 0.0% | | | |
| Berkeley County Indl. Dev. Rev. (Nucor Corp. Proj.) Series 1995, 1.25% 12/6/19, VRDN (a)(b) | | 100,000 | 100,000 |
| West Virginia - 0.4% | | | |
| West Virginia Econ. Dev. Auth. Solid Waste Disp. Facilities Rev. (Appalachian Pwr. Co.- Mountaineer Proj.) Series 2008 A, 1.21% 12/6/19, VRDN (a)(b) | | 1,600,000 | 1,600,000 |
| TOTAL VARIABLE RATE DEMAND NOTE | | | |
| (Cost $190,830,001) | | | 190,830,001 |
|
| Tender Option Bond - 28.7% | | | |
| Colorado - 0.0% | | | |
| Denver City & County Arpt. Rev. Bonds Series G-114, 1.35%, tender 6/1/20 (Liquidity Facility Royal Bank of Canada) (a)(b)(c)(d)(e) | | 100,000 | 100,000 |
| Connecticut - 28.3% | | | |
| Connecticut Gen. Oblig. Participating VRDN: | | | |
| Series 15 XF0222, 1.2% 12/6/19 (Liquidity Facility Toronto-Dominion Bank) (b)(c)(e) | | 8,000,000 | 8,000,000 |
| Series Floaters 014, 1.25% 1/10/20 (Liquidity Facility Barclays Bank PLC) (b)(c)(d)(e) | | 23,550,000 | 23,550,000 |
| Series Floaters 016, 1.14% 12/6/19 (Liquidity Facility Barclays Bank PLC) (b)(c)(e) | | 5,755,000 | 5,755,000 |
| Series Floaters G66, 1.13% 12/6/19 (Liquidity Facility Royal Bank of Canada) (b)(c)(e) | | 5,400,000 | 5,400,000 |
| Series Floaters XL 00 66, 1.16% 12/6/19 (Liquidity Facility Barclays Bank PLC) (b)(c)(e) | | 3,685,000 | 3,685,000 |
| Series Floaters XM 07 07, 1.16% 12/6/19 (Liquidity Facility Royal Bank of Canada) (b)(c)(e) | | 2,440,000 | 2,440,000 |
| Series Floaters YX 10 95, 1.16% 12/6/19 (Liquidity Facility Barclays Bank PLC) (b)(c)(e) | | 2,425,000 | 2,425,000 |
| Series XM 07 62, 1.16% 12/6/19 (Liquidity Facility JPMorgan Chase Bank) (b)(c)(e) | | 4,000,000 | 4,000,000 |
| Connecticut Health & Edl. Facilities Auth. Rev. Participating VRDN: | | | |
| Series 16 ZF0378, 1.14% 12/6/19 (Liquidity Facility Toronto-Dominion Bank) (b)(c)(e) | | 3,750,000 | 3,750,000 |
| Series Floaters XG 02 04, 1.13% 12/6/19 (Liquidity Facility Barclays Bank PLC) (b)(c)(e) | | 3,130,000 | 3,130,000 |
| Series Floaters XM 04 49, 1.13% 12/6/19 (Liquidity Facility JPMorgan Chase Bank) (b)(c)(e) | | 2,225,000 | 2,225,000 |
| Series RBC 2016 ZM0134, 1.13% 12/6/19 (Liquidity Facility Royal Bank of Canada) (b)(c)(e) | | 7,910,000 | 7,910,000 |
| Series ROC II R 11854, 1.13% 12/6/19 (Liquidity Facility Citibank NA) (b)(c)(e) | | 15,210,000 | 15,210,000 |
| Series XL 01 14, 1.13% 12/6/19 (Liquidity Facility Barclays Bank PLC) (b)(c)(e) | | 4,015,000 | 4,015,000 |
| Connecticut Muni. Elec. Energy Coop. Pwr. Supply Sys. Rev. Participating VRDN Series XG 00 59, 1.2% 12/6/19 (Liquidity Facility Deutsche Bank AG New York Branch) (b)(c)(e) | | 6,310,000 | 6,310,000 |
| Connecticut Spl. Tax Oblig. Trans. Infrastructure Rev.: | | | |
| Bonds Series Floaters G 110, 1.28%, tender 4/1/20 (Liquidity Facility Royal Bank of Canada) (b)(c)(d)(e) | | 6,200,000 | 6,200,000 |
| Participating VRDN Series ROC II R 14073, 1.18% 12/6/19 (Liquidity Facility Citibank NA) (b)(c)(e) | | 14,700,000 | 14,699,987 |
| | | | 118,704,987 |
| Florida - 0.3% | | | |
| Broward County Port Facilities Rev. Bonds Series G 115, 1.35%, tender 3/2/20 (Liquidity Facility Royal Bank of Canada) (a)(b)(c)(d)(e) | | 125,000 | 125,000 |
| Jacksonville Elec. Auth. Elec. Sys. Rev. Participating VRDN Series 2019, 1.4% 1/10/20 (Liquidity Facility Wells Fargo Bank NA) (b)(c)(e) | | 1,100,000 | 1,100,000 |
| | | | 1,225,000 |
| Massachusetts - 0.0% | | | |
| Massachusetts Gen. Oblig. Bonds Series Clipper 09 69, 1.28%, tender 4/2/20 (Liquidity Facility State Street Bank & Trust Co., Boston) (b)(c)(d)(e) | | 100,000 | 100,000 |
| South Carolina - 0.0% | | | |
| South Carolina Trans. Infrastructure Bank Rev. Bonds Series Floaters G 109, 1.3%, tender 4/1/20 (Liquidity Facility Royal Bank of Canada) (b)(c)(d)(e) | | 100,000 | 100,000 |
| Texas - 0.1% | | | |
| Alamo Cmnty. College District Rev. Bonds Series G-111, 1.3%, tender 5/1/20 (Liquidity Facility Royal Bank of Canada) (b)(c)(d)(e) | | 200,000 | 200,000 |
| TOTAL TENDER OPTION BOND | | | |
| (Cost $120,429,987) | | | 120,429,987 |
|
| Other Municipal Security - 21.4% | | | |
| Connecticut - 19.9% | | | |
| Bethel Gen. Oblig. BAN Series 2019, 3% 7/24/20 | | 2,000,000 | 2,021,647 |
| Bristol Gen. Oblig. Bonds Series 2011, 5% 7/15/20 | | 1,210,000 | 1,237,138 |
| Brookfield Gen. Oblig. BAN Series 2019, 2.25% 11/13/20 | | 4,200,000 | 4,239,003 |
| Connecticut Gen. Oblig. Bonds: | | | |
| Series 2012 A, 2.35% 4/15/20 (b)(f) | | 4,300,000 | 4,316,835 |
| Series 2012 C, 5% 6/1/20 | | 1,000,000 | 1,018,615 |
| Series 2013 A, 5% 10/15/20 | | 100,000 | 103,008 |
| Series 2014 B, 1.73% 3/1/20 (b)(f) | | 1,400,000 | 1,400,965 |
| Series 2017 A, 5% 4/15/20 | | 2,735,000 | 2,772,521 |
| Series 2018 E, 5% 9/15/20 | | 675,000 | 694,509 |
| Connecticut Health & Edl. Facilities Auth. Rev. Bonds: | | | |
| (Fairfield Univ. Proj.) Series O, 5% 7/1/20 (Pre-Refunded to 7/1/20 @ 100) | | 1,000,000 | 1,020,790 |
| (Yale Univ. Proj.) Series 2014 A, 1.3%, tender 2/3/20 (b) | | 7,800,000 | 7,799,570 |
| Series 2017 B, 5%, tender 7/1/20 (b) | | 5,700,000 | 5,820,053 |
| Series O, 5% 7/1/20 (Pre-Refunded to 7/1/20 @ 100) | | 100,000 | 102,181 |
| Connecticut Hsg. Fin. Auth. Bonds Series 2016 F, 1.55% 5/15/20 (a) | | 1,020,000 | 1,020,238 |
| Connecticut Spl. Tax Oblig. Trans. Infrastructure Rev. Bonds Series 2016 A, 5% 9/1/20 | | 275,000 | 282,550 |
| East Hampton Gen. Oblig. BAN Series 2019, 1.5% 9/11/20 | | 3,800,000 | 3,804,374 |
| Hartford County Metropolitan District Gen. Oblig. Bonds Series 2019 B, 5% 7/15/20 | | 1,630,000 | 1,667,576 |
| Hbr. Point Infrastructure Impt. District Bonds Series 2010 A, 7.875% 4/1/20 (Pre-Refunded to 4/1/20 @ 100) | | 13,435,000 | 13,728,639 |
| Milford Gen. Oblig. BAN Series 2019, 2.5% 11/3/20 | | 4,000,000 | 4,047,450 |
| Naugatuck Gen. Oblig. BAN Series 2019, 2.25% 2/20/20 | | 1,025,000 | 1,026,672 |
| North Haven Gen. Oblig. BAN Series 2019 B, 2.25% 11/5/20 | | 3,000,000 | 3,029,171 |
| Plainville Gen. Oblig. BAN Series 2019, 2.25% 5/21/20 | | 4,000,000 | 4,017,258 |
| Tolland Gen. Oblig. BAN Series 2019, 2% 9/17/20 | | 8,300,000 | 8,350,780 |
| Town of Somers BAN Series 2019, 2% 10/15/20 | | 4,300,000 | 4,322,535 |
| Univ. of Connecticut Gen. Oblig. Bonds Series 2013 A, 5% 8/15/20 | | 750,000 | 768,644 |
| Watertown Gen. Oblig. BAN Series 2019, 2% 10/23/20 | | 5,000,000 | 5,034,402 |
| | | | 83,647,124 |
| Florida - 0.9% | | | |
| Florida Dev. Fin. Corp. Surface T Bonds (Virgin Trains U.S.A. Passenger Rail Proj.) Series 2019 B, 1.9%, tender 3/17/20 (a)(b) | | 3,700,000 | 3,700,018 |
| Kentucky - 0.1% | | | |
| Jefferson County Poll. Cont. Rev. Bonds Series 2001 A, 1.6% tender 12/10/19, CP mode | | 300,000 | 300,000 |
| Massachusetts - 0.1% | | | |
| Massachusetts Dev. Fin. Agcy. Electrical Utils. Rev. Bonds Series 05, 1.4% tender 12/5/19 (Massachusetts Elec. Co. Guaranteed), CP mode (a) | | 400,000 | 400,000 |
| New Hampshire - 0.4% | | | |
| New Hampshire Bus. Fin. Auth. Poll. Cont. Rev. Bonds Series A1, 1.25% tender 12/4/19, CP mode (a) | | 1,800,000 | 1,800,000 |
| TOTAL OTHER MUNICIPAL SECURITY | | | |
| (Cost $89,847,142) | | | 89,847,142 |
| | | Shares | Value |
|
| Investment Company - 4.1% | | | |
| Fidelity Municipal Cash Central Fund 1.20% (g)(h) | | 16,981,037 | 16,982,569 |
| (Cost $16,982,569) | | | |
| TOTAL INVESTMENT IN SECURITIES - 99.8% | | | |
| (Cost $418,089,699) | | | 418,089,699 |
| NET OTHER ASSETS (LIABILITIES) - 0.2% | | | 925,125 |
| NET ASSETS - 100% | | | $419,014,824 |
Security Type Abbreviations
BAN – BOND ANTICIPATION NOTE
CP – COMMERCIAL PAPER
VRDN – VARIABLE RATE DEMAND NOTE (A debt instrument that is payable upon demand, either daily, weekly or monthly)
The date shown for securities represents the date when principal payments must be paid, taking into account any call options exercised by the issuer and any permissible maturity shortening features other than interest rate resets.
Legend
(a) Private activity obligations whose interest is subject to the federal alternative minimum tax for individuals.
(b) Coupon rates for floating and adjustable rate securities reflect the rates in effect at period end.
(c) Provides evidence of ownership in one or more underlying municipal bonds.
(d) Restricted securities - Investment in securities not registered under the Securities Act of 1933 (excluding 144A issues). At the end of the period, the value of restricted securities (excluding 144A issues) amounted to $30,375,000 or 7.2% of net assets.
(e) Coupon rates are determined by re-marketing agents based on current market conditions.
(f) Coupon is indexed to a floating interest rate which may be multiplied by a specified factor and/or subject to caps or floors.
(g) Information in this report regarding holdings by state and security types does not reflect the holdings of the Fidelity Municipal Cash Central Fund.
(h) Affiliated fund that is available only to investment companies and other accounts managed by Fidelity Investments. The rate quoted is the annualized seven-day yield of the fund at period end. A complete unaudited listing of the fund's holdings as of its most recent quarter end is available upon request. In addition, each Fidelity Central Fund's financial statements, which are not covered by the Fund's Report of Independent Registered Public Accounting Firm, are available on the SEC's website or upon request.
Additional information on each restricted holding is as follows:
| Security | Acquisition Date | Cost |
| Alamo Cmnty. College District Rev. Bonds Series G-111, 1.3%, tender 5/1/20 (Liquidity Facility Royal Bank of Canada) | 6/6/19 | $200,000 |
| Broward County Port Facilities Rev. Bonds Series G 115, 1.35%, tender 3/2/20 (Liquidity Facility Royal Bank of Canada) | 9/26/19 | $125,000 |
| Connecticut Gen. Oblig. Participating VRDN Series Floaters 014, 1.25% 1/10/20 (Liquidity Facility Barclays Bank PLC) | 6/29/17 - 10/9/19 | $23,550,000 |
| Connecticut Spl. Tax Oblig. Trans. Infrastructure Rev. Bonds Series Floaters G 110, 1.28%, tender 4/1/20 (Liquidity Facility Royal Bank of Canada) | 5/16/19 - 11/6/19 | $6,200,000 |
| Denver City & County Arpt. Rev. Bonds Series G-114, 1.35%, tender 6/1/20 (Liquidity Facility Royal Bank of Canada) | 6/6/19 | $100,000 |
| Massachusetts Gen. Oblig. Bonds Series Clipper 09 69, 1.28%, tender 4/2/20 (Liquidity Facility State Street Bank & Trust Co., Boston) | 11/6/19 | $100,000 |
| South Carolina Trans. Infrastructure Bank Rev. Bonds Series Floaters G 109, 1.3%, tender 4/1/20 (Liquidity Facility Royal Bank of Canada) | 5/16/19 | $100,000 |
Affiliated Central Funds
Information regarding fiscal year to date income earned by the Fund from investments in Fidelity Central Funds is as follows:
| Fund | Income earned |
| Fidelity Municipal Cash Central Fund | $340,505 |
| Total | $340,505 |
Amounts in the income column in the above table exclude any capital gain distributions from underlying funds, which are presented in the corresponding line-item in the Statement of Operations, if applicable.
Investment Valuation
All investments are categorized as Level 2 under the Fair Value Hierarchy. The inputs or methodology used for valuing securities may not be an indication of the risk associated with investing in those securities. For more information on valuation inputs please refer to the Investment Valuation section in the accompanying Notes to Financial Statements.
See accompanying notes which are an integral part of the financial statements.
Fidelity® Connecticut Municipal Money Market Fund
Financial Statements
Statement of Assets and Liabilities
| | | November 30, 2019 |
| Assets | | |
Investment in securities, at value — See accompanying schedule:
Unaffiliated issuers (cost $401,107,130) | $401,107,130 | |
| Fidelity Central Funds (cost $16,982,569) | 16,982,569 | |
| Total Investment in Securities (cost $418,089,699) | | $418,089,699 |
| Cash | | 13,080 |
| Receivable for fund shares sold | | 535,693 |
| Interest receivable | | 1,207,985 |
| Distributions receivable from Fidelity Central Funds | | 17,678 |
| Prepaid expenses | | 685 |
| Receivable from investment adviser for expense reductions | | 6,215 |
| Other receivables | | 245 |
| Total assets | | 419,871,280 |
| Liabilities | | |
| Payable for fund shares redeemed | 642,461 | |
| Distributions payable | 10,098 | |
| Accrued management fee | 124,200 | |
| Other affiliated payables | 42,490 | |
| Other payables and accrued expenses | 37,207 | |
| Total liabilities | | 856,456 |
| Net Assets | | $419,014,824 |
| Net Assets consist of: | | |
| Paid in capital | | $419,074,622 |
| Total accumulated earnings (loss) | | (59,798) |
| Net Assets | | $419,014,824 |
| Net Asset Value, offering price and redemption price per share ($419,014,824 ÷ 418,512,080 shares) | | $1.00 |
See accompanying notes which are an integral part of the financial statements.
Statement of Operations
| | | Year ended November 30, 2019 |
| Investment Income | | |
| Interest | | $6,994,525 |
| Income from Fidelity Central Funds | | 340,505 |
| Total income | | 7,335,030 |
| Expenses | | |
| Management fee | $1,610,324 | |
| Transfer agent fees | 479,171 | |
| Accounting fees and expenses | 70,938 | |
| Custodian fees and expenses | 3,726 | |
| Independent trustees' fees and expenses | 1,947 | |
| Registration fees | 24,916 | |
| Audit | 40,336 | |
| Legal | 5,953 | |
| Miscellaneous | 2,213 | |
| Total expenses before reductions | 2,239,524 | |
| Expense reductions | (56,555) | |
| Total expenses after reductions | | 2,182,969 |
| Net investment income (loss) | | 5,152,061 |
| Realized and Unrealized Gain (Loss) | | |
| Net realized gain (loss) on: | | |
| Investment securities: | | |
| Unaffiliated issuers | 1,526 | |
| Fidelity Central Funds | 451 | |
| Capital gain distributions from Fidelity Central Funds | 174 | |
| Total net realized gain (loss) | | 2,151 |
| Net increase in net assets resulting from operations | | $5,154,212 |
See accompanying notes which are an integral part of the financial statements.
Statement of Changes in Net Assets
| | Year ended November 30, 2019 | Year ended November 30, 2018 |
| Increase (Decrease) in Net Assets | | |
| Operations | | |
| Net investment income (loss) | $5,152,061 | $5,665,221 |
| Net realized gain (loss) | 2,151 | (51,559) |
| Net increase in net assets resulting from operations | 5,154,212 | 5,613,662 |
| Distributions to shareholders | (5,485,969) | (5,705,524) |
| Share transactions | | |
| Proceeds from sales of shares | 90,744,854 | 116,908,101 |
| Reinvestment of distributions | 5,284,172 | 5,530,226 |
| Cost of shares redeemed | (184,372,588) | (310,277,057) |
| Net increase (decrease) in net assets and shares resulting from share transactions | (88,343,562) | (187,838,730) |
| Total increase (decrease) in net assets | (88,675,319) | (187,930,592) |
| Net Assets | | |
| Beginning of period | 507,690,143 | 695,620,735 |
| End of period | $419,014,824 | $507,690,143 |
| Other Information | | |
| Shares | | |
| Sold | 90,744,854 | 116,908,101 |
| Issued in reinvestment of distributions | 5,284,172 | 5,530,226 |
| Redeemed | (184,372,588) | (310,277,057) |
| Net increase (decrease) | (88,343,562) | (187,838,730) |
See accompanying notes which are an integral part of the financial statements.
Financial Highlights
Fidelity Connecticut Municipal Money Market Fund
| | | | | | |
| Years ended November 30, | 2019 | 2018 | 2017 | 2016 | 2015 |
| Selected Per–Share Data | | | | | |
| Net asset value, beginning of period | $1.00 | $1.00 | $1.00 | $1.00 | $1.00 |
| Income from Investment Operations | | | | | |
| Net investment income (loss) | .011 | .010 | .004 | .001 | –A |
| Net realized and unrealized gain (loss) | .001 | –A | –A | –A | –A |
| Total from investment operations | .012 | .010 | .004 | .001 | –A |
| Distributions from net investment income | (.011) | (.010) | (.004) | (.001) | –A |
| Distributions from net realized gain | (.001) | –A | – | –A | –A |
| Total distributions | (.012) | (.010) | (.004) | (.001) | –A |
| Net asset value, end of period | $1.00 | $1.00 | $1.00 | $1.00 | $1.00 |
| Total ReturnB | 1.20% | .98% | .38% | .07% | .02% |
| Ratios to Average Net AssetsC,D | | | | | |
| Expenses before reductions | .49% | .49% | .48% | .48% | .49% |
| Expenses net of fee waivers, if any | .48% | .48% | .48% | .32% | .08% |
| Expenses net of all reductions | .48% | .48% | .48% | .32% | .08% |
| Net investment income (loss) | 1.13% | .96% | .37% | .05% | .01% |
| Supplemental Data | | | | | |
| Net assets, end of period (000 omitted) | $419,015 | $507,690 | $695,621 | $999,640 | $1,719,175 |
A Amount represents less than $.0005 per share.
B Total returns would have been lower if certain expenses had not been reduced during the applicable periods shown.
C Fees and expenses of any underlying Fidelity Central Funds are not included in the Fund's expense ratio. The Fund indirectly bears its proportionate share of the expenses of any underlying Fidelity Central Funds.
D Expense ratios reflect operating expenses of the Fund. Expenses before reductions do not reflect amounts reimbursed or waived or reductions from expense offset arrangements and do not represent the amount paid by the Fund during periods when reimbursements, waivers or reductions occur. Expenses net of fee waivers reflect expenses after reimbursement and waivers but prior to reductions from expense offset arrangements. Expenses net of all reductions represent the net expenses paid by the Fund.
See accompanying notes which are an integral part of the financial statements.
Notes to Financial Statements
For the period ended November 30, 2019
1. Organization.
Fidelity Connecticut Municipal Income Fund (the Income Fund) is a fund of Fidelity Court Street Trust. Fidelity Connecticut Municipal Money Market Fund (the Money Market Fund) is a fund of Fidelity Court Street Trust II. Each Trust is registered under the Investment Company Act of 1940, as amended (the 1940 Act), as an open-end management investment company. Fidelity Court Street Trust and Fidelity Court Street Trust II (the Trusts) are organized as a Massachusetts business trust and a Delaware statutory trust, respectively. The Income Fund is a non-diversified fund. Each Fund is authorized to issue an unlimited number of shares. Shares of the Money Market Fund are only available for purchase by retail shareholders. Share transactions on the Statement of Changes in Net Assets may contain exchanges between affiliated funds. Each Fund may be affected by economic and political developments in the state of Connecticut.
2. Investments in Fidelity Central Funds.
The Funds may invest in Fidelity Central Funds, which are open-end investment companies generally available only to other investment companies and accounts managed by the investment adviser and its affiliates. The Funds' Schedules of Investments list each of the Fidelity Central Funds held as of period end, if any, as an investment of each Fund, but do not include the underlying holdings of each Fidelity Central Fund. As an Investing Fund, each Fund indirectly bears its proportionate share of the expenses of the underlying Fidelity Central Funds.
The Money Market Central Funds seek preservation of capital and current income and are managed by Fidelity Investments Money Management, Inc. (FIMM), an affiliate of the investment adviser. Annualized expenses of the Money Market Central Funds as of their most recent shareholder report date ranged from less than .005% to .01%.
A complete unaudited list of holdings for each Fidelity Central Fund is available upon request or at the Securities and Exchange Commission (the SEC) website at www.sec.gov. In addition, the financial statements of the Fidelity Central Funds, which are not covered by the Funds' Report of Independent Registered Public Accounting Firm, are available on the SEC website or upon request.
3. Significant Accounting Policies.
Each Fund is an investment company and applies the accounting and reporting guidance of the Financial Accounting Standards Board (FASB) Accounting Standards Codification Topic 946 Financial Services – Investments Companies. The financial statements have been prepared in conformity with accounting principles generally accepted in the United States of America (GAAP), which require management to make certain estimates and assumptions at the date of the financial statements. Actual results could differ from those estimates. Subsequent events, if any, through the date that the financial statements were issued have been evaluated in the preparation of the financial statements. The following summarizes the significant accounting policies of the Funds:
Investment Valuation. Investments are valued as of 4:00 p.m. Eastern time on the last calendar day of the period. The Board of Trustees (the Board) has delegated the day to day responsibility for the valuation of the Income Fund's investments to the Fair Value Committee (the Committee) established by the Income Fund's investment adviser. In accordance with valuation policies and procedures approved by the Board, the Income Fund attempts to obtain prices from one or more third party pricing vendors or brokers to value its investments. When current market prices, quotations or currency exchange rates are not readily available or reliable, investments will be fair valued in good faith by the Committee, in accordance with procedures adopted by the Board. Factors used in determining fair value vary by investment type and may include market or investment specific events, changes in interest rates and credit quality. The frequency with which these procedures are used cannot be predicted and they may be utilized to a significant extent. The Committee oversees the Income Fund's valuation policies and procedures and reports to the Board on the Committee's activities and fair value determinations. The Board monitors the appropriateness of the procedures used in valuing the Income Fund's investments and ratifies the fair value determinations of the Committee.
Each Fund categorizes the inputs to valuation techniques used to value its investments into a disclosure hierarchy consisting of three levels as shown below:
- Level 1 – quoted prices in active markets for identical investments
- Level 2 – other significant observable inputs (including quoted prices for similar investments, interest rates, prepayment speeds, etc.)
- Level 3 – unobservable inputs (including the Fund's own assumptions based on the best information available)
Valuation techniques used to value each Fund's investments by major category are as follows:
For the Income Fund, debt securities, including restricted securities, are valued based on evaluated prices received from third party pricing vendors or from brokers who make markets in such securities. Municipal securities are valued by pricing vendors who utilize matrix pricing which considers yield or price of bonds of comparable quality, coupon, maturity and type or by broker-supplied prices. When independent prices are unavailable or unreliable, debt securities may be valued utilizing pricing methodologies which consider similar factors that would be used by third party pricing vendors. Debt securities are generally categorized as Level 2 in the hierarchy but may be Level 3 depending on the circumstances.
For the Money Market Fund, as permitted by compliance with certain conditions under Rule 2a-7 of the 1940 Act, securities are valued at amortized cost, which approximates fair value. The amortized cost of an instrument is determined by valuing it at its original cost and thereafter amortizing any discount or premium from its face value at a constant rate until maturity. Securities held by a money market fund are generally high quality and liquid; however, they are reflected as Level 2 because the inputs used to determine fair value are not quoted prices in an active market.
For the Income Fund, changes in valuation techniques may result in transfers in or out of an assigned level within the disclosure hierarchy.
Investment Transactions and Income. For financial reporting purposes, the Funds' investment holdings and NAV include trades executed through the end of the last business day of the period. The NAV per share for processing shareholder transactions is calculated as of the close of business of the New York Stock Exchange (NYSE), normally 4:00 p.m. Eastern time and includes trades executed through the end of the prior business day for the Income Fund and trades executed through the end of the current business day for the Money Market Fund. Gains and losses on securities sold are determined on the basis of identified cost. Income and capital gain distributions from Fidelity Central Funds, if any, are recorded on the ex-dividend date. Interest income is accrued as earned and includes coupon interest and amortization of premium and accretion of discount on debt securities as applicable.
Expenses. Expenses directly attributable to a fund are charged to that fund. Expenses attributable to more than one fund are allocated among the respective funds on the basis of relative net assets or other appropriate methods. Expense estimates are accrued in the period to which they relate and adjustments are made when actual amounts are known.
Income Tax Information and Distributions to Shareholders. Each year, each Fund intends to qualify as a regulated investment company under Subchapter M of the Internal Revenue Code, including distributing substantially all of its taxable income and realized gains. As a result, no provision for U.S. Federal income taxes is required. As of November 30, 2019, each Fund did not have any unrecognized tax benefits in the financial statements; nor is each Fund aware of any tax positions for which it is reasonably possible that the total amounts of unrecognized tax benefits will significantly change in the next twelve months. Each Fund files a U.S. federal tax return, in addition to state and local tax returns as required. Each Fund's federal income tax returns are subject to examination by the Internal Revenue Service (IRS) for a period of three fiscal years after they are filed. State and local tax returns may be subject to examination for an additional fiscal year depending on the jurisdiction.
Distributions are declared and recorded daily and paid monthly from net investment income. Distributions from realized gains, if any, are declared and recorded on the ex-dividend date. Income and capital gain distributions are determined in accordance with income tax regulations, which may differ from GAAP. In addition, the Fund claimed a portion of the payment made to redeeming shareholders as a distribution for income tax purposes.
Capital accounts within the financial statements are adjusted for permanent book-tax differences. These adjustments have no impact on net assets or the results of operations. Capital accounts are not adjusted for temporary book-tax differences which will reverse in a subsequent period.
Book-tax differences are primarily due to short-term gain distributions from the Fidelity Central Funds and capital loss carryforwards.
The Funds purchase municipal securities whose interest, in the opinion of the issuer, is free from federal income tax. There is no assurance that the IRS will agree with this opinion. In the event the IRS determines that the issuer does not comply with relevant tax requirements, interest payments from a security could become federally taxable, possibly retroactively to the date the security was issued.
As of period end, the cost and unrealized appreciation (depreciation) in securities, and derivatives if applicable, for federal income tax purposes were as follows for each Fund:
| | Tax cost | Gross unrealized appreciation | Gross unrealized depreciation | Net unrealized appreciation (depreciation) |
| Fidelity Connecticut Municipal Income Fund | $338,613,169 | $15,724,554 | $(10,461) | $15,714,093 |
| Fidelity Connecticut Municipal Money Market Fund | 418,089,699 | – | – | – |
The tax-based components of distributable earnings as of period end were as follows for each Fund:
| | Undistributed tax-exempt income | Undistributed long-term capital gain | Capital loss carryforward | Net unrealized appreciation (depreciation) on securities and other investments |
| Fidelity Connecticut Municipal Income Fund | $42,158 | $248,428 | $– | $15,714,093 |
| Fidelity Connecticut Municipal Money Market Fund | – | – | (49,582) | – |
Capital loss carryforwards are only available to offset future capital gains of the Funds to the extent provided by regulations and may be limited. Under the Regulated Investment Company Modernization Act of 2010 (the Act), the Funds are permitted to carry forward capital losses incurred in taxable years beginning after December 22, 2010 for an unlimited period and such capital losses are required to be used prior to any losses that expire. The capital loss carryforward information presented below, including any applicable limitation, is estimated as of fiscal period end and is subject to adjustment.
| | No expiration |
| | Short-term |
| Fidelity Connecticut Municipal Money Market Fund | $(49,582) |
The tax character of distributions paid was as follows:
| November 30, 2019 | | | |
| | Tax-Exempt Income | Ordinary Income | Total |
| Fidelity Connecticut Municipal Income Fund | $8,466,425 | $– | $8,466,425 |
| Fidelity Connecticut Municipal Money Market Fund | 5,151,998 | 333,971 | 5,485,969 |
| November 30, 2018 | | | |
| | Tax-Exempt Income | Long-term Capital Gains | Total |
| Fidelity Connecticut Municipal Income Fund | $8,878,076 | $1,941,232 | $10,819,308 |
| Fidelity Connecticut Municipal Money Market Fund | 5,665,235 | 40,289 | 5,705,524 |
Delayed Delivery Transactions and When-Issued Securities. During the period, certain Funds transacted in securities on a delayed delivery or when-issued basis. Payment and delivery may take place after the customary settlement period for that security. The price of the underlying securities and the date when the securities will be delivered and paid for are fixed at the time the transaction is negotiated. The securities purchased on a delayed delivery or when-issued basis are identified as such in each applicable Fund's Schedule of Investments. Certain Funds may receive compensation for interest forgone in the purchase of a delayed delivery or when-issued security. With respect to purchase commitments, each applicable Fund identifies securities as segregated in its records with a value at least equal to the amount of the commitment. Losses may arise due to changes in the value of the underlying securities or if the counterparty does not perform under the contract's terms, or if the issuer does not issue the securities due to political, economic, or other factors.
Restricted Securities. The Funds may invest in securities that are subject to legal or contractual restrictions on resale. These securities generally may be resold in transactions exempt from registration or to the public if the securities are registered. Disposal of these securities may involve time-consuming negotiations and expense, and prompt sale at an acceptable price may be difficult. Information regarding restricted securities is included at the end of each applicable Fund's Schedule of Investments.
4. Purchases and Sales of Investments.
Purchases and sales of securities, other than short-term securities, for the Income Fund aggregated $72,651,438 and $65,531,233, respectively.
5. Fees and Other Transactions with Affiliates.
Management Fee. Fidelity Management & Research Company (the investment adviser) and its affiliates provide the Funds with investment management related services for which the Funds pay a monthly management fee. The management fee is the sum of an individual fund fee rate and an annualized group fee rate. The individual fund fee rate is applied to each Fund's average net assets. The group fee rate is based upon the average net assets of all the mutual funds advised by the investment adviser, including any mutual funds previously advised by the investment adviser that are currently advised by Fidelity SelectCo, LLC, an affiliate of the investment adviser. The group fee rate decreases as assets under management increase and increases as assets under management decrease. For the reporting period, each Fund's annual management fee rate expressed as a percentage of each Fund's average net assets was as follows:
| | Individual Rate | Group Rate | Total |
| Fidelity Connecticut Municipal Income Fund | .25% | .10% | .35% |
| Fidelity Connecticut Municipal Money Market Fund | .25% | .10% | .35% |
Transfer Agent Fees. Fidelity Investments Institutional Operations Company, Inc. (FIIOC), an affiliate of the investment adviser, is the transfer, dividend disbursing and shareholder servicing agent for the Funds. FIIOC receives account fees and asset-based fees that vary according to account size and type of account. FIIOC pays for typesetting, printing and mailing of shareholder reports, except proxy statements. For the period, the transfer agent fees were equivalent to the following annual rates expressed as a percentage of average net assets:
| Fidelity Connecticut Municipal Income Fund | .08% |
| Fidelity Connecticut Municipal Money Market Fund | .11% |
Accounting Fees. Fidelity Service Company, Inc. (FSC), an affiliate of the investment adviser, maintains each Fund's accounting records. The fee is based on the level of average net assets for each month. For the period, the fees were equivalent to the following annual rates:
| | % of Average Net Assets |
| Fidelity Connecticut Municipal Income Fund | .03 |
| Fidelity Connecticut Municipal Money Market Fund | .02 |
Interfund Trades. The Funds may purchase from or sell securities to other Fidelity Funds under procedures adopted by the Board. The procedures have been designed to ensure these interfund trades are executed in accordance with Rule 17a-7 of the 1940 Act. For the Income Fund, interfund trades are included within the respective purchases and sales amounts shown in the Purchases and Sales of Investments note.
6. Committed Line of Credit.
The Income Fund participates with other funds managed by the investment adviser or an affiliate in a $4.25 billion credit facility (the "line of credit") to be utilized for temporary or emergency purposes to fund shareholder redemptions or for other short-term liquidity purposes. The participating funds have agreed to pay commitment fees on their pro-rata portion of the line of credit, which are reflected in Miscellaneous expenses on the Statement of Operations, and are as follows:
| Fidelity Connecticut Municipal Income Fund | $880 |
During the period, the Income Fund did not borrow on this line of credit.
7. Expense Reductions.
The investment adviser voluntarily agreed to reimburse the Money Market Fund to the extent annual operating expenses exceeded certain levels of average net assets as noted in the table below. Some expenses, for example the compensation of the independent Trustees, and certain miscellaneous expenses such as proxy and shareholder meeting expenses, are excluded from this reimbursement.
The Money Market Fund was in reimbursement during the period:
| | Expense Limitations | Reimbursement |
| Fidelity Connecticut Municipal Money Market Fund | .48% | $53,694 |
In addition, through arrangements with each applicable Fund's custodian and transfer agent, credits realized as a result of certain uninvested cash balances were used to reduce each applicable Fund's expenses. All of the applicable expense reductions are noted in the table below.
| | Custodian credits |
| Fidelity Connecticut Municipal Income Fund | $2,202 |
| Fidelity Connecticut Municipal Money Market Fund | 329 |
In addition, during the period the investment adviser reimbursed and/or waived a portion of operating expenses as follows:
| | Amount |
| Fidelity Connecticut Municipal Income Fund | $1,619 |
| Fidelity Connecticut Municipal Money Market Fund | 2,532 |
8. Other.
The Funds' organizational documents provide former and current trustees and officers with a limited indemnification against liabilities arising in connection with the performance of their duties to the Funds. In the normal course of business, the Funds may also enter into contracts that provide general indemnifications. The Funds' maximum exposure under these arrangements is unknown as this would be dependent on future claims that may be made against the Funds. The risk of material loss from such claims is considered remote.
Effective January 1, 2020, following any required regulatory notices and approvals:
Investment advisers Fidelity Investments Money Management, Inc., FMR Co., Inc., and Fidelity SelectCo, LLC, merged with and into Fidelity Management & Research Company. In connection with the merger transactions, the resulting, merged investment adviser was then redomiciled from Massachusetts to Delaware, changed its corporate structure from a corporation to a limited liability company, and changed its name to "Fidelity Management & Research Company LLC".
Fidelity Investments Institutional Operations Company, Inc. (FIIOC) converted from a Massachusetts corporation to a Massachusetts LLC, and changed its name to "Fidelity Investments Institutional Operations Company LLC".
Report of Independent Registered Public Accounting Firm
To the Board of Trustees of Fidelity Court Street Trust and Fidelity Court Street Trust II and Shareholders of Fidelity Connecticut Municipal Income Fund and Fidelity Connecticut Municipal Money Market Fund:
Opinions on the Financial Statements
We have audited the accompanying statements of assets and liabilities, including the schedules of investments, of Fidelity Connecticut Municipal Income Fund (one of the funds constituting Fidelity Court Street Trust) and Fidelity Connecticut Municipal Money Market Fund (one of the funds constituting Fidelity Court Street Trust II) (hereafter collectively referred to as the “Funds”) as of November 30, 2019, the related statements of operations for the year ended November 30, 2019, the statements of changes in net assets for each of the two years in the period ended November 30, 2019, including the related notes, and the financial highlights for each of the five years in the period ended November 30, 2019 (collectively referred to as the “financial statements”). In our opinion, the financial statements present fairly, in all material respects, the financial position of each of the Funds as of November 30, 2019, the results of each of their operations for the year then ended, the changes in each of their net assets for each of the two years in the period ended November 30, 2019 and each of the financial highlights for each of the five years in the period ended November 30, 2019 in conformity with accounting principles generally accepted in the United States of America.
Basis for Opinions
These financial statements are the responsibility of the Funds' management. Our responsibility is to express an opinion on the Funds' financial statements based on our audits. We are a public accounting firm registered with the Public Company Accounting Oversight Board (United States) (PCAOB) and are required to be independent with respect to the Funds in accordance with the U.S. federal securities laws and the applicable rules and regulations of the Securities and Exchange Commission and the PCAOB.
We conducted our audits of these financial statements in accordance with the standards of the PCAOB. Those standards require that we plan and perform the audit to obtain reasonable assurance about whether the financial statements are free of material misstatement, whether due to error or fraud.
Our audits included performing procedures to assess the risks of material misstatement of the financial statements, whether due to error or fraud, and performing procedures that respond to those risks. Such procedures included examining, on a test basis, evidence regarding the amounts and disclosures in the financial statements. Our audits also included evaluating the accounting principles used and significant estimates made by management, as well as evaluating the overall presentation of the financial statements. Our procedures included confirmation of securities owned as of November 30, 2019 by correspondence with the custodian and brokers; when replies were not received from brokers, we performed other auditing procedures. We believe that our audits provide a reasonable basis for our opinions.
PricewaterhouseCoopers LLP
Boston, Massachusetts
January 10, 2020
We have served as the auditor of one or more investment companies in the Fidelity group of funds since 1932.
Trustees and Officers
The Trustees, Members of the Advisory Board (if any), and officers of the trusts and funds, as applicable, are listed below. The Board of Trustees governs each fund and is responsible for protecting the interests of shareholders. The Trustees are experienced executives who meet periodically throughout the year to oversee each fund's activities, review contractual arrangements with companies that provide services to each fund, oversee management of the risks associated with such activities and contractual arrangements, and review each fund's performance. Each of the Trustees oversees 277 funds.
The Trustees hold office without limit in time except that (a) any Trustee may resign; (b) any Trustee may be removed by written instrument, signed by at least two-thirds of the number of Trustees prior to such removal; (c) any Trustee who requests to be retired or who has become incapacitated by illness or injury may be retired by written instrument signed by a majority of the other Trustees; and (d) any Trustee may be removed at any special meeting of shareholders by a two-thirds vote of the outstanding voting securities of the trust. Each Trustee who is not an interested person (as defined in the 1940 Act) of the trust and the funds is referred to herein as an Independent Trustee. Each Independent Trustee shall retire not later than the last day of the calendar year in which his or her 75th birthday occurs. The Independent Trustees may waive this mandatory retirement age policy with respect to individual Trustees. Officers and Advisory Board Members hold office without limit in time, except that any officer or Advisory Board Member may resign or may be removed by a vote of a majority of the Trustees at any regular meeting or any special meeting of the Trustees. Except as indicated, each individual has held the office shown or other offices in the same company for the past five years.
The fund’s Statement of Additional Information (SAI) includes more information about the Trustees. To request a free copy, call Fidelity at 1-800-544-8544.
Experience, Skills, Attributes, and Qualifications of the Trustees. The Governance and Nominating Committee has adopted a statement of policy that describes the experience, qualifications, attributes, and skills that are necessary and desirable for potential Independent Trustee candidates (Statement of Policy). The Board believes that each Trustee satisfied at the time he or she was initially elected or appointed a Trustee, and continues to satisfy, the standards contemplated by the Statement of Policy. The Governance and Nominating Committee also engages professional search firms to help identify potential Independent Trustee candidates who have the experience, qualifications, attributes, and skills consistent with the Statement of Policy. From time to time, additional criteria based on the composition and skills of the current Independent Trustees, as well as experience or skills that may be appropriate in light of future changes to board composition, business conditions, and regulatory or other developments, have also been considered by the professional search firms and the Governance and Nominating Committee. In addition, the Board takes into account the Trustees' commitment and participation in Board and committee meetings, as well as their leadership of standing and ad hoc committees throughout their tenure.
In determining that a particular Trustee was and continues to be qualified to serve as a Trustee, the Board has considered a variety of criteria, none of which, in isolation, was controlling. The Board believes that, collectively, the Trustees have balanced and diverse experience, qualifications, attributes, and skills, which allow the Board to operate effectively in governing each fund and protecting the interests of shareholders. Information about the specific experience, skills, attributes, and qualifications of each Trustee, which in each case led to the Board's conclusion that the Trustee should serve (or continue to serve) as a trustee of the funds, is provided below.
Board Structure and Oversight Function. Abigail P. Johnson is an interested person and currently serves as Chairman. The Trustees have determined that an interested Chairman is appropriate and benefits shareholders because an interested Chairman has a personal and professional stake in the quality and continuity of services provided to the funds. Independent Trustees exercise their informed business judgment to appoint an individual of their choosing to serve as Chairman, regardless of whether the Trustee happens to be independent or a member of management. The Independent Trustees have determined that they can act independently and effectively without having an Independent Trustee serve as Chairman and that a key structural component for assuring that they are in a position to do so is for the Independent Trustees to constitute a substantial majority for the Board. The Independent Trustees also regularly meet in executive session. Arthur E. Johnson serves as Chairman of the Independent Trustees and as such (i) acts as a liaison between the Independent Trustees and management with respect to matters important to the Independent Trustees and (ii) with management prepares agendas for Board meetings.
Fidelity® funds are overseen by different Boards of Trustees. The funds' Board oversees Fidelity's investment-grade bond, money market, asset allocation and certain equity funds, and other Boards oversee Fidelity's high income and other equity funds. The asset allocation funds may invest in Fidelity® funds that are overseen by such other Boards. The use of separate Boards, each with its own committee structure, allows the Trustees of each group of Fidelity® funds to focus on the unique issues of the funds they oversee, including common research, investment, and operational issues. On occasion, the separate Boards establish joint committees to address issues of overlapping consequences for the Fidelity® funds overseen by each Board.
The Trustees operate using a system of committees to facilitate the timely and efficient consideration of all matters of importance to the Trustees, each fund, and fund shareholders and to facilitate compliance with legal and regulatory requirements and oversight of the funds' activities and associated risks. The Board, acting through its committees, has charged FMR and its affiliates with (i) identifying events or circumstances the occurrence of which could have demonstrably adverse effects on the funds' business and/or reputation; (ii) implementing processes and controls to lessen the possibility that such events or circumstances occur or to mitigate the effects of such events or circumstances if they do occur; and (iii) creating and maintaining a system designed to evaluate continuously business and market conditions in order to facilitate the identification and implementation processes described in (i) and (ii) above. Because the day-to-day operations and activities of the funds are carried out by or through FMR, its affiliates, and other service providers, the funds' exposure to risks is mitigated but not eliminated by the processes overseen by the Trustees. While each of the Board's committees has responsibility for overseeing different aspects of the funds' activities, oversight is exercised primarily through the Operations and Audit Committees. In addition, an ad hoc Board committee of Independent Trustees has worked with FMR to enhance the Board's oversight of investment and financial risks, legal and regulatory risks, technology risks, and operational risks, including the development of additional risk reporting to the Board. The Operations Committee also worked and continues to work with FMR to enhance the stress tests required under SEC regulations for money market funds. Appropriate personnel, including but not limited to the funds' Chief Compliance Officer (CCO), FMR's internal auditor, the independent accountants, the funds' Treasurer and portfolio management personnel, make periodic reports to the Board's committees, as appropriate, including an annual review of Fidelity's risk management program for the Fidelity® funds. The responsibilities of each standing committee, including their oversight responsibilities, are described further under "Standing Committees of the Trustees."
Interested Trustees*:
Correspondence intended for a Trustee who is an interested person may be sent to Fidelity Investments, 245 Summer Street, Boston, Massachusetts 02210.
Name, Year of Birth; Principal Occupations and Other Relevant Experience+
Abigail P. Johnson (1961)
Year of Election or Appointment: 2009
Trustee
Chairman of the Board of Trustees
Ms. Johnson also serves as Trustee of other Fidelity® funds. Ms. Johnson serves as Chairman (2016-present), Chief Executive Officer (2014-present), and Director (2007-present) of FMR LLC (diversified financial services company), President of Fidelity Financial Services (2012-present) and President of Personal, Workplace and Institutional Services (2005-present). Ms. Johnson is Chairman and Director of Fidelity Management & Research Company LLC (investment adviser firm, 2011-present). Previously, Ms. Johnson served as Chairman and Director of FMR Co., Inc. (investment adviser firm, 2011-2019), Vice Chairman (2007-2016) and President (2013-2016) of FMR LLC, President and a Director of Fidelity Management & Research Company (2001-2005), a Trustee of other investment companies advised by Fidelity Management & Research Company, Fidelity Investments Money Management, Inc. (investment adviser firm), and FMR Co., Inc. (2001-2005), Senior Vice President of the Fidelity® funds (2001-2005), and managed a number of Fidelity® funds. Ms. Abigail P. Johnson and Mr. Arthur E. Johnson are not related.
Jennifer Toolin McAuliffe (1959)
Year of Election or Appointment: 2016
Trustee
Ms. McAuliffe also serves as Trustee of other Fidelity® funds. Ms. McAuliffe previously served as a Member of the Advisory Board of certain Fidelity® funds (2016) and as Co-Head of Fixed Income of Fidelity Investments Limited (now known as FIL Limited (FIL)) (diversified financial services company). Earlier roles at FIL included Director of Research for FIL’s credit and quantitative teams in London, Hong Kong and Tokyo. Ms. McAuliffe also was the Director of Research for taxable and municipal bonds at Fidelity Investments Money Management, Inc. Ms. McAuliffe is also a director or trustee of several not-for-profit entities.
* Determined to be an “Interested Trustee” by virtue of, among other things, his or her affiliation with the trusts or various entities under common control with FMR.
+ The information includes the Trustee's principal occupation during the last five years and other information relating to the experience, attributes, and skills relevant to the Trustee's qualifications to serve as a Trustee, which led to the conclusion that the Trustee should serve as a Trustee for the fund.
Independent Trustees:
Correspondence intended for an Independent Trustee may be sent to Fidelity Investments, P.O. Box 55235, Boston, Massachusetts 02205-5235.
Name, Year of Birth; Principal Occupations and Other Relevant Experience+
Elizabeth S. Acton (1951)
Year of Election or Appointment: 2015 or 2016
Trustee
Ms. Acton also serves as Trustee of other Fidelity® funds. Prior to her retirement in April 2012, Ms. Acton was Executive Vice President, Finance (2011-2012), Executive Vice President, Chief Financial Officer (2002-2011), and Treasurer (2004-2005) of Comerica Incorporated (financial services). Prior to joining Comerica, Ms. Acton held a variety of positions at Ford Motor Company (1983-2002), including Vice President and Treasurer (2000-2002) and Executive Vice President and Chief Financial Officer of Ford Motor Credit Company (1998-2000). Ms. Acton currently serves as a member of the Board of Directors and Audit and Finance Committees of Beazer Homes USA, Inc. (homebuilding, 2012-present). Previously, Ms. Acton served as a Member of the Advisory Board of certain Fidelity® funds (2013-2016).
Ann E. Dunwoody (1953)
Year of Election or Appointment: 2018
Trustee
General Dunwoody also serves as Trustee of other Fidelity® funds. General Dunwoody (United States Army, Retired) was the first woman in U.S. military history to achieve the rank of four-star general and prior to her retirement in 2012 held a variety of positions within the U.S. Army, including Commanding General, U.S. Army Material Command (2008-2012). She is the President of First to Four LLC (leadership and mentoring services, 2012-present). She also serves as a member of the Board of Directors and Nominating and Corporate Governance Committee of L3 Technologies, Inc. (communication, electronic, sensor, and aerospace systems, 2013-present), Board of Directors and Nomination and Corporate Governance Committees of Kforce Inc. (professional staffing services, 2016-present) and Board of Directors of Automattic Inc. (software engineering, 2018-present). Previously, General Dunwoody served as a Member of the Advisory Board of certain Fidelity® funds (2018), a member of the Board of Directors and Audit and Sustainability and Corporate Responsibility Committees of Republic Services, Inc. (waste collection, disposal and recycling, 2013-2016). Ms. Dunwoody also serves on several boards for non-profit organizations, including as a member of the Board of Directors, Chair of the Nomination and Governance Committee and member of the Audit Committee of Logistics Management Institute (consulting non-profit, 2012-present), a member of the Board of Directors of the Army Historical Foundation (2015-present), a member of the Council of Trustees for the Association of the United States Army (advocacy non-profit, 2013-present) and a member of the Board of Trustees of Florida Institute of Technology (2015-present) and ThanksUSA (military family education non-profit, 2014-present).
John Engler (1948)
Year of Election or Appointment: 2015 or 2016
Trustee
Mr. Engler also serves as Trustee of other Fidelity® funds. He serves on the board of directors for Universal Forest Products (manufacturer and distributor of wood and wood-alternative products, 2003-present) and K12 Inc. (technology-based education company, 2012-present). Previously, Mr. Engler served as interim president of Michigan State University (2018-2019), a Member of the Advisory Board of certain Fidelity® funds (2014-2016), president of the Business Roundtable (2011-2017), a trustee of The Munder Funds (2003-2014), president and CEO of the National Association of Manufacturers (2004-2011), member of the Board of Trustees of the Annie E. Casey Foundation (2004-2015), and as governor of Michigan (1991-2003). He is a past chairman of the National Governors Association.
Robert F. Gartland (1951)
Year of Election or Appointment: 2010
Trustee
Mr. Gartland also serves as Trustee of other Fidelity® funds. Mr. Gartland is Chairman and an investor in Gartland & Mellina Group Corp. (consulting, 2009-present). Previously, Mr. Gartland served as a partner and investor of Vietnam Partners LLC (investments and consulting, 2008-2011). Prior to his retirement, Mr. Gartland held a variety of positions at Morgan Stanley (financial services, 1979-2007), including Managing Director (1987-2007), and Chase Manhattan Bank (1975-1978).
Arthur E. Johnson (1947)
Year of Election or Appointment: 2008
Trustee
Chairman of the Independent Trustees
Mr. Johnson also serves as Trustee of other Fidelity® funds. Mr. Johnson serves as a member of the Board of Directors of Eaton Corporation plc (diversified power management, 2009-present) and Booz Allen Hamilton (management consulting, 2011-present). Prior to his retirement, Mr. Johnson served as Senior Vice President of Corporate Strategic Development of Lockheed Martin Corporation (defense contractor, 1999-2009). Mr. Johnson previously served as Vice Chairman (2015-2018) of the Independent Trustees of certain Fidelity® funds and on the Board of Directors of IKON Office Solutions, Inc. (1999-2008), AGL Resources, Inc. (holding company, 2002-2016), and Delta Airlines (2005-2007). Mr. Arthur E. Johnson is not related to Ms. Abigail P. Johnson.
Michael E. Kenneally (1954)
Year of Election or Appointment: 2009
Trustee
Vice Chairman of the Independent Trustees
Mr. Kenneally also serves as Trustee of other Fidelity® funds. Prior to his retirement, Mr. Kenneally served as Chairman and Global Chief Executive Officer of Credit Suisse Asset Management. Before joining Credit Suisse, he was an Executive Vice President and Chief Investment Officer for Bank of America Corporation. Earlier roles at Bank of America included Director of Research, Senior Portfolio Manager and Research Analyst, and Mr. Kenneally was awarded the Chartered Financial Analyst (CFA) designation in 1991.
Marie L. Knowles (1946)
Year of Election or Appointment: 2001
Trustee
Ms. Knowles also serves as Trustee of other Fidelity® funds. Prior to Ms. Knowles' retirement in June 2000, she served as Executive Vice President and Chief Financial Officer of Atlantic Richfield Company (ARCO) (diversified energy, 1996-2000). From 1993 to 1996, she was a Senior Vice President of ARCO and President of ARCO Transportation Company (pipeline and tanker operations). Ms. Knowles currently serves as a Director and Chairman of the Audit Committee of McKesson Corporation (healthcare service, since 2002). Ms. Knowles is a member of the Board of the Santa Catalina Island Company (real estate, 2009-present). Ms. Knowles is a Member of the Investment Company Institute Board of Governors and a Member of the Governing Council of the Independent Directors Council (2014-present). She also serves as a member of the Advisory Board for the School of Engineering of the University of Southern California. Previously, Ms. Knowles served as a Director of Phelps Dodge Corporation (copper mining and manufacturing, 1994-2007), URS Corporation (engineering and construction, 2000-2003) and America West (airline, 1999-2002). Ms. Knowles previously served as Chairman (2015-2018) and Vice Chairman (2012-2015) of the Independent Trustees of certain Fidelity® funds.
Mark A. Murray (1954)
Year of Election or Appointment: 2016
Trustee
Mr. Murray also serves as Trustee of other Fidelity® funds. Mr. Murray is Vice Chairman (2013-present) of Meijer, Inc. (regional retail chain). Previously, Mr. Murray served as a Member of the Advisory Board of certain Fidelity® funds (2016) and as Co-Chief Executive Officer (2013-2016) and President (2006-2013) of Meijer, Inc. Mr. Murray serves as a member of the Board of Directors and Nuclear Review and Public Policy and Responsibility Committees of DTE Energy Company (diversified energy company, 2009-present). Mr. Murray also serves as a member of the Board of Directors of Spectrum Health (not-for-profit health system, 2015-present). Mr. Murray previously served as President of Grand Valley State University (2001-2006), Treasurer for the State of Michigan (1999-2001), Vice President of Finance and Administration for Michigan State University (1998-1999), and a member of the Board of Directors and Audit Committee and Chairman of the Nominating and Corporate Governance Committee of Universal Forest Products, Inc. (manufacturer and distributor of wood and wood-alternative products, 2004-2016). Mr. Murray is also a director or trustee of many community and professional organizations.
+ The information includes the Trustee's principal occupation during the last five years and other information relating to the experience, attributes, and skills relevant to the Trustee's qualifications to serve as a Trustee, which led to the conclusion that the Trustee should serve as a Trustee for the fund.
Advisory Board Members and Officers:
Correspondence intended for an officer may be sent to Fidelity Investments, 245 Summer Street, Boston, Massachusetts 02210. Officers appear below in alphabetical order.
Name, Year of Birth; Principal Occupation
Elizabeth Paige Baumann (1968)
Year of Election or Appointment: 2017
Anti-Money Laundering (AML) Officer
Ms. Baumann also serves as AML Officer of other funds. She is Chief AML Officer (2012-present) and Senior Vice President (2014-present) of FMR LLC (diversified financial services company) and is an employee of Fidelity Investments. Previously, Ms. Baumann served as AML Officer of the funds (2012-2016), and Vice President (2007-2014) and Deputy Anti-Money Laundering Officer (2007-2012) of FMR LLC.
Craig S. Brown (1977)
Year of Election or Appointment: 2019
Assistant Treasurer
Mr. Brown also serves as Assistant Treasurer of other funds. Mr. Brown is an employee of Fidelity Investments (2013-present).
John J. Burke III (1964)
Year of Election or Appointment: 2018
Chief Financial Officer
Mr. Burke also serves as Chief Financial Officer of other funds. Mr. Burke serves as Head of Investment Operations for Fidelity Fund and Investment Operations (2018-present) and is an employee of Fidelity Investments (1998-present). Previously Mr. Burke served as head of Asset Management Investment Operations (2012-2018).
Jonathan Davis (1968)
Year of Election or Appointment: 2010
Assistant Treasurer
Mr. Davis also serves as Assistant Treasurer of other funds. Mr. Davis serves as Assistant Treasurer of FMR Capital, Inc. (2017-present) and is an employee of Fidelity Investments. Previously, Mr. Davis served as Vice President and Associate General Counsel of FMR LLC (diversified financial services company, 2003-2010).
Laura M. Del Prato (1964)
Year of Election or Appointment: 2018
President and Treasurer
Ms. Del Prato also serves as an officer of other funds. Ms. Del Prato is an employee of Fidelity Investments (2017-present). Prior to joining Fidelity Investments, Ms. Del Prato served as a Managing Director and Treasurer of the JPMorgan Mutual Funds (2014-2017). Prior to JPMorgan, Ms. Del Prato served as a partner at Cohen Fund Audit Services (accounting firm, 2012-2013) and KPMG LLP (accounting firm, 2004-2012).
Colm A. Hogan (1973)
Year of Election or Appointment: 2016
Assistant Treasurer
Mr. Hogan also serves as an officer of other funds. Mr. Hogan serves as Assistant Treasurer of FMR Capital, Inc. (2017-present) and is an employee of Fidelity Investments (2005-present). Previously, Mr. Hogan served as Assistant Treasurer of certain Fidelity® funds (2016-2018).
Cynthia Lo Bessette (1969)
Year of Election or Appointment: 2019
Secretary and Chief Legal Officer (CLO)
Ms. Lo Bessette also serves as Secretary and CLO of other funds. Ms. Lo Bessette serves as CLO, Secretary, and Senior Vice President of Fidelity Management & Research Company LLC (investment adviser firm, 2019-present); and CLO of Fidelity Management & Research (Hong Kong) Limited, FMR Investment Management (UK) Limited, and Fidelity Management & Research (Japan) Limited (investment adviser firms, 2019-present). She is a Senior Vice President and Deputy General Counsel of FMR LLC (diversified financial services company, 2019-present), and is an employee of Fidelity Investments. Previously, Ms. Lo Bessette served as CLO, Secretary, and Senior Vice President of FMR Co., Inc. (investment adviser firm, 2019); Secretary of Fidelity SelectCo, LLC and Fidelity Investments Money Management, Inc. (investment adviser firms, 2019). Prior to joining Fidelity Investments, Ms. Lo Bessette was Executive Vice President, General Counsel (2016-2019) and Senior Vice President, Deputy General Counsel (2015-2016) of OppenheimerFunds (investment management company) and Deputy Chief Legal Officer (2013-2015) of Jennison Associates LLC (investment adviser firm).
Chris Maher (1972)
Year of Election or Appointment: 2013
Assistant Treasurer
Mr. Maher serves as Assistant Treasurer of other funds. Mr. Maher is Vice President of Valuation Oversight, serves as Assistant Treasurer of FMR Capital, Inc. (2017-present), and is an employee of Fidelity Investments. Previously, Mr. Maher served as Vice President of Asset Management Compliance (2013), Vice President of the Program Management Group of FMR (investment adviser firm, 2010-2013), and Vice President of Valuation Oversight (2008-2010).
John B. McGinty, Jr. (1962)
Year of Election or Appointment: 2016
Chief Compliance Officer
Mr. McGinty also serves as Chief Compliance Officer of other funds. Mr. McGinty is Senior Vice President of Asset Management Compliance for Fidelity Investments and is an employee of Fidelity Investments (2016-present). Mr. McGinty previously served as Vice President, Senior Attorney at Eaton Vance Management (investment management firm, 2015-2016), and prior to Eaton Vance as global CCO for all firm operations and registered investment companies at GMO LLC (investment management firm, 2009-2015). Before joining GMO LLC, Mr. McGinty served as Senior Vice President, Deputy General Counsel for Fidelity Investments (2007-2009).
Jason P. Pogorelec (1975)
Year of Election or Appointment: 2015
Assistant Secretary
Mr. Pogorelec also serves as Assistant Secretary of other funds. Mr. Pogorelec serves as Vice President, Associate General Counsel (2010-present) and is an employee of Fidelity Investments (2006-present).
Nancy D. Prior (1967)
Year of Election or Appointment: 2014
Vice President
Ms. Prior also serves as Vice President of other funds. Ms. Prior serves as President of Fixed Income (2014-present), and is an employee of Fidelity Investments (2002-present). Previously, Ms. Prior served as President (2016-2019) and Director (2014-2019) of Fidelity Investments Money Management, Inc. (FIMM) (investment adviser firm), Vice President of Global Asset Allocation Funds (2017-2019); Vice Chairman of FIAM LLC (investment adviser firm, 2014-2018), a Director of FMR Investment Management (UK) Limited (investment adviser firm, 2015-2018), President Multi-Asset Class Strategies of FMR's Global Asset Allocation Division (2017-2018), Vice President of Fidelity's Money Market Funds (2012-2014), and President, Money Market and Short Duration Bond Group of Fidelity Management & Research Company (FMR) (investment adviser firm, 2013-2014).
Stacie M. Smith (1974)
Year of Election or Appointment: 2013
Assistant Treasurer
Ms. Smith also serves as an officer of other funds. Ms. Smith serves as Assistant Treasurer of FMR Capital, Inc. (2017-present), is an employee of Fidelity Investments (2009-present), and has served in other fund officer roles. Prior to joining Fidelity Investments, Ms. Smith served as Senior Audit Manager of Ernst & Young LLP (accounting firm, 1996-2009). Previously, Ms. Smith served as Assistant Treasurer (2013-2019) and Deputy Treasurer (2013-2016) of certain Fidelity® funds.
Marc L. Spector (1972)
Year of Election or Appointment: 2016
Deputy Treasurer
Mr. Spector also serves as an officer of other funds. Mr. Spector serves as Assistant Treasurer of FMR Capital, Inc. (2017-present) and is an employee of Fidelity Investments (2016-present). Prior to joining Fidelity Investments, Mr. Spector served as Director at the Siegfried Group (accounting firm, 2013-2016), and prior to Siegfried Group as audit senior manager at Deloitte & Touche (accounting firm, 2005-2013).
Jim Wegmann (1979)
Year of Election or Appointment: 2019
Assistant Treasurer
Mr. Wegmann also serves as Assistant Treasurer of other funds. Mr. Wegmann is an employee of Fidelity Investments (2011-present).
Shareholder Expense Example
As a shareholder of a Fund, you incur two types of costs: (1) transaction costs and (2) ongoing costs, including management fees and other Fund expenses. This Example is intended to help you understand your ongoing costs (in dollars) of investing in the Funds and to compare these costs with the ongoing costs of investing in other mutual funds.
The Example is based on an investment of $1,000 invested at the beginning of the period and held for the entire period (June 1, 2019 to November 30, 2019).
Actual Expenses
The first line of the accompanying table for each fund provides information about actual account values and actual expenses. You may use the information in this line, together with the amount you invested, to estimate the expenses that you paid over the period. Simply divide your account value by $1,000.00 (for example, an $8,600 account value divided by $1,000.00 = 8.6), then multiply the result by the number in the first line for a fund under the heading entitled "Expenses Paid During Period" to estimate the expenses you paid on your account during this period. In addition, each Fund, as a shareholder in the underlying Fidelity Central Funds, will indirectly bear its pro-rata share of the fees and expenses incurred by the underlying Fidelity Central Funds. These fees and expenses are not included in the Fund's annualized expense ratio used to calculate the expense estimate in the table below.
Hypothetical Example for Comparison Purposes
The second line of the accompanying table for each fund provides information about hypothetical account values and hypothetical expenses based on a fund's actual expense ratio and an assumed rate of return of 5% per year before expenses, which is not the Fund's actual return. The hypothetical account values and expenses may not be used to estimate the actual ending account balance or expenses you paid for the period. You may use this information to compare the ongoing costs of investing in the Fund and other funds. To do so, compare this 5% hypothetical example with the 5% hypothetical examples that appear in the shareholder reports of the other funds. In addition, each Fund, as a shareholder in the underlying Fidelity Central Funds, will indirectly bear its pro-rata share of the fees and expenses incurred by the underlying Fidelity Central Funds. These fees and expenses are not included in the Fund's annualized expense ratio used to calculate the expense estimate in the table below.
Please note that the expenses shown in the table are meant to highlight your ongoing costs only and do not reflect any transaction costs. Therefore, the second line of the table is useful in comparing ongoing costs only, and will not help you determine the relative total costs of owning different funds.
| | Annualized Expense Ratio-A | Beginning
Account Value
June 1, 2019 | Ending
Account Value
November 30, 2019 | Expenses Paid
During Period-B
June 1, 2019
to November 30, 2019 |
| Fidelity Connecticut Municipal Income Fund | .48% | | | |
| Actual | | $1,000.00 | $1,023.80 | $2.44 |
| Hypothetical-C | | $1,000.00 | $1,022.66 | $2.43 |
| Fidelity Connecticut Municipal Money Market Fund | .48% | | | |
| Actual | | $1,000.00 | $1,005.00 | $2.41 |
| Hypothetical-C | | $1,000.00 | $1,022.66 | $2.43 |
A Annualized expense ratio reflects expenses net of applicable fee waivers.
B Expenses are equal to each Fund's annualized expense ratio, multiplied by the average account value over the period, multiplied by 183/ 365 (to reflect the one-half year period).
C 5% return per year before expenses
Distributions (Unaudited)
The Board of Trustees of each fund voted to pay to shareholders of record at the opening of business on record date, the following distributions per share derived from capital gains realized from sales of portfolio securities:
| | Pay Date | Record Date | Capital Gains |
| Fidelity Connecticut Municipal Income Fund | 12/30/19 | 12/27/19 | $0.01 |
| Fidelity Connecticut Municipal Money Market Fund | 12/30/19 | 12/27/19 | $0.00 |
| | | | |
The fund hereby designates as capital gain dividend the amounts noted below for the taxable year ended November 30, 2019, or, if subsequently determined to be different, the net capital gain of such year.
| Fidelity Connecticut Municipal Income Fund | $260,842 |
|
During fiscal year ended 2019, 100% of each fund's income dividends were free from federal income tax, and 3.52% and 19.46% of Fidelity Connecticut Municipal Income Fund and Fidelity Connecticut Municipal Money Market Fund's income dividends, respectively, were subject to the federal alternative minimum tax.
The funds will notify shareholders in January 2020 of amounts for use in preparing 2019 income tax returns.
Board Approval of Investment Advisory Contracts and Management Fees
Fidelity Connecticut Municipal Income Fund / Fidelity Connecticut Municipal Money Market Fund
Each year, the Board of Trustees, including the Independent Trustees (together, the Board), votes on the renewal of the management contract with Fidelity Management & Research Company (FMR) and the sub-advisory agreements (together, the Advisory Contracts) for each fund. FMR and the sub-advisers are referred to herein as the Investment Advisers. The Board, assisted by the advice of fund counsel and Independent Trustees' counsel, requests and considers a broad range of information relevant to the renewal of the Advisory Contracts throughout the year.
The Board meets regularly and, at each of its meetings, covers an extensive agenda of topics and materials and considers factors that are relevant to its annual consideration of the renewal of each fund's Advisory Contracts, including the services and support provided to each fund and its shareholders. The Board has established four standing committees (Committees) — Operations, Audit, Fair Valuation, and Governance and Nominating — each composed of and chaired by Independent Trustees with varying backgrounds, to which the Board has assigned specific subject matter responsibilities in order to enhance effective decision-making by the Board. The Operations Committee, of which all of the Independent Trustees are members, meets regularly throughout the year and considers, among other matters, information specifically related to the annual consideration of the renewal of each fund's Advisory Contracts. The Board, acting directly and through its Committees, requests and receives information concerning the annual consideration of the renewal of each fund's Advisory Contracts. The Board also meets as needed to review matters specifically related to the Board's annual consideration of the renewal of the Advisory Contracts. Members of the Board may also meet with trustees of other Fidelity funds through joint ad hoc committees to discuss certain matters relevant to all of the Fidelity funds.
At its September 2019 meeting, the Board unanimously determined to renew each fund's Advisory Contracts. In reaching its determination, the Board considered all factors it believed relevant, including (i) the nature, extent, and quality of the services provided to each fund and its shareholders (including the investment performance of each fund); (ii) the competitiveness of each fund's management fee and total expense ratio relative to peer funds; (iii) the total costs of the services provided by and the profits realized by Fidelity from its relationships with each fund; and (iv) the extent to which, if any, economies of scale exist and are realized as each fund grows, and whether any economies of scale are appropriately shared with fund shareholders.
In considering whether to renew the Advisory Contracts for each fund, the Board reached a determination, with the assistance of fund counsel and Independent Trustees' counsel and through the exercise of its business judgment, that the renewal of the Advisory Contracts was in the best interests of each fund and its shareholders and that the compensation payable under the Advisory Contracts was fair and reasonable. The Board's decision to renew the Advisory Contracts was not based on any single factor, but rather was based on a comprehensive consideration of all the information provided to the Board at its meetings throughout the year. The Board, in reaching its determination to renew the Advisory Contracts, was aware that shareholders of each fund have a broad range of investment choices available to them, including a wide choice among funds offered by Fidelity's competitors, and that each fund's shareholders, who have the opportunity to review and weigh the disclosure provided by the fund in its prospectus and other public disclosures, have chosen to invest in that fund, which is part of the Fidelity family of funds.
Approval of Amended and Restated Advisory Contracts. At its September 2019 meeting, the Board also unanimously determined to approve amended and restated management contracts and sub-advisory agreements (Amended and Restated Contracts) in connection with an upcoming consolidation of certain of Fidelity's advisory businesses. The Board considered that, on or about January 1, 2020, Fidelity Investments Money Management, Inc. (FIMM) expects to merge with and into FMR and, after the merger, FMR expects to redomicile as a Delaware limited liability company. The Board also approved the termination of the sub-advisory agreements with FIMM upon the completion of the merger. The Board noted that references to FMR in the Amended and Restated Contracts would be updated to reflect FMR's new form of organization and considered that the definition of "group assets" for purposes of the fund's group fee would be modified to avoid double-counting assets once the reorganization is complete. The Board also noted Fidelity's assurance that neither the planned consolidation nor the Amended and Restated Contracts will change the investment processes, the level or nature of services provided, the resources and personnel allocated, trading and compliance operations, or any fees or expenses paid by the funds.
Nature, Extent, and Quality of Services Provided. The Board considered Fidelity's staffing as it relates to the funds, including the backgrounds of investment personnel of Fidelity, and also considered the funds' investment objectives, strategies, and related investment philosophies. The Independent Trustees also had discussions with senior management of Fidelity's investment operations and investment groups. The Board considered the structure of the investment personnel compensation program and whether this structure provides appropriate incentives to act in the best interests of each fund. Additionally, the Board considered the portfolio managers' investments, if any, in the funds that they manage.
Resources Dedicated to Investment Management and Support Services. The Board reviewed the general qualifications and capabilities of Fidelity's investment staff, including its size, education, experience, and resources, as well as Fidelity's approach to recruiting, managing, and compensating investment personnel. The Board noted that Fidelity has continued to increase the resources devoted to non-U.S. offices, including expansion of Fidelity's global investment organization. The Board also noted that Fidelity's analysts have extensive resources, tools and capabilities that allow them to conduct sophisticated quantitative and fundamental analysis, as well as credit analysis of issuers, counterparties and guarantors. Further, the Board considered that Fidelity's investment professionals have sufficient access to global information and data so as to provide competitive investment results over time, and that those professionals also have access to sophisticated tools that permit them to assess portfolio construction and risk and performance attribution characteristics continuously, as well as to transmit new information and research conclusions rapidly around the world. Additionally, in its deliberations, the Board considered Fidelity's trading, risk management, compliance, and technology and operations capabilities and resources, which are integral parts of the investment management process.
Shareholder and Administrative Services. The Board considered (i) the nature, extent, quality, and cost of advisory, administrative, and shareholder services performed by the Investment Advisers and their affiliates under the Advisory Contracts and under separate agreements covering transfer agency and pricing and bookkeeping services for each fund; (ii) the nature and extent of the supervision of third party service providers, principally custodians, subcustodians, and pricing vendors; and (iii) the resources devoted to, and the record of compliance with, each fund's compliance policies and procedures.
The Board noted that the growth of fund assets over time across the complex allows Fidelity to reinvest in the development of services designed to enhance the value and convenience of the Fidelity funds as investment vehicles. These services include 24-hour access to account information and market information over the Internet and through telephone representatives, investor education materials and asset allocation tools, and the expanded availability of Fidelity Investor Centers.
Investment in a Large Fund Family. The Board considered the benefits to shareholders of investing in a Fidelity fund, including the benefits of investing in a fund that is part of a large family of funds offering a variety of investment disciplines and providing a large variety of mutual fund investor services. The Board noted that Fidelity had taken, or had made recommendations that resulted in the Fidelity funds taking, a number of actions over the previous year that benefited particular funds, including: (i) continuing to dedicate additional resources to Fidelity's investment research process, which includes meetings with management of issuers of securities in which the funds invest, and to the support of the senior management team that oversees asset management; (ii) continuing efforts to enhance Fidelity's global research capabilities; (iii) launching new funds with innovative structures, strategies and pricing and making other enhancements to meet client needs; (iv) launching new share classes of existing funds; (v) eliminating purchase minimums and broadening eligibility requirements for certain funds and share classes; (vi) reducing management fees and total expenses for certain target date funds and index funds; (vii) lowering expense caps for certain existing funds and classes, and converting certain voluntary expense caps to contractual caps, to reduce expenses borne by shareholders; (viii) rationalizing product lines and gaining increased efficiencies from fund mergers, liquidations, and share class consolidations; (ix) continuing to develop, acquire and implement systems and technology to improve services to the funds and shareholders, strengthen information security, and increase efficiency; and (x) continuing to implement enhancements to further strengthen Fidelity's product line to increase investors' probability of success in achieving their investment goals, including retirement income goals.
Investment Performance (for Fidelity Connecticut Municipal Income Fund). The Board considered whether the fund has operated in accordance with its investment objective, as well as its record of compliance with its investment restrictions and its performance history. The Board noted that there were portfolio management changes for the fund in September 2018 and December 2018.
The Board took into account discussions that occur at Board meetings throughout the year with representatives of the Investment Advisers about fund investment performance. In this regard the Board noted that as part of regularly scheduled fund reviews and other reports to the Board on fund performance, the Board considers annualized return information for the fund for different time periods, measured against an appropriate securities market index (benchmark index) and a peer group of funds with similar objectives (peer group), if any. In its evaluation of fund investment performance at meetings throughout the year, the Board gave particular attention to information indicating underperformance of certain Fidelity funds for specific time periods and discussed with the Investment Advisers the reasons for such underperformance.
In addition to reviewing absolute and relative fund performance, the Independent Trustees periodically consider the appropriateness of fund performance metrics in evaluating the results achieved. In general, the Independent Trustees believe that fund performance should be evaluated based on gross performance (before fees and expenses but after transaction costs) compared to appropriate benchmark indices, over appropriate time periods that may include full market cycles, and on net performance (after fees and expenses) compared to peer groups, as applicable, over the same periods, taking into account relevant factors including the following: general market conditions; expectations for interest rate levels and credit conditions; issuer-specific information including credit quality; the potential for incremental return versus the fund's benchmark index weighed against the risks involved in obtaining that incremental return, including the risk of diminished or negative total returns; and fund cash flows and other factors. Depending on the circumstances, the Independent Trustees may be satisfied with a fund's performance notwithstanding that it lags its benchmark index or peer group for certain periods.
The Independent Trustees recognize that shareholders evaluate performance on a net basis over their own holding periods, for which one-, three-, and five-year periods are often used as a proxy. For this reason, the performance information reviewed by the Board also included net cumulative calendar year total return information for the fund and an appropriate benchmark index and peer group for the most recent one-, three-, and five-year periods.
Investment Performance (for Fidelity Connecticut Municipal Money Market Fund). The Board considered whether the fund has operated in accordance with its investment objective, as well as its record of compliance with its investment restrictions and its performance history.
The Board took into account discussions that occur at Board meetings throughout the year with representatives of the Investment Advisers about fund investment performance. In this regard the Board noted that as part of regularly scheduled fund reviews and other reports to the Board on fund performance, the Board considers annualized return information for the fund for different time periods, measured against a peer group.
In addition to reviewing absolute and relative fund performance, the Independent Trustees periodically consider the appropriateness of fund performance metrics in evaluating the results achieved. In general, the Independent Trustees believe that fund performance should be evaluated based on gross performance (before fees and expenses but after transaction costs) compared to the gross performance of appropriate peer groups, over appropriate time periods that may include full market cycles, taking into account relevant factors including the following: general market conditions; expectations for interest rate levels and credit conditions; issuer-specific information including credit quality; the fund's market value NAV over time and its resilience under various stressed conditions; and fund cash flows and other factors.
The Board recognizes that in interest rate environments where many competitors waive fees to maintain a minimum yield, relative money market fund performance on a net basis (after fees and expenses) may not be particularly meaningful due to miniscule performance differences among competitor funds. Depending on the circumstances, the Independent Trustees may be satisfied with a fund's performance notwithstanding that it lags its peer group for certain periods.
The Independent Trustees recognize that shareholders evaluate performance on a net basis over their own holding periods, for which one-, three-, and five-year periods are often used as a proxy. For this reason, the performance information reviewed by the Board also included net cumulative calendar year total return information for the fund and an appropriate peer group for the most recent one-, three-, and five-year periods.
Based on its review, the Board concluded that the nature, extent, and quality of services provided to each fund under the Advisory Contracts should continue to benefit the shareholders of each fund.
Competitiveness of Management Fee and Total Expense Ratio. The Board considered each fund's management fee and total expense ratio compared to "mapped groups" of competitive funds and classes created for the purpose of facilitating the Trustees' competitive analysis of management fees and total expenses. Fidelity creates "mapped groups" by combining similar Lipper investment objective categories that have comparable investment mandates. Combining Lipper investment objective categories aids the Board's management fee and total expense ratio comparisons by broadening the competitive group used for comparison.
Management Fee. The Board considered two proprietary management fee comparisons for the 12-month periods shown in basis points (BP) in the charts below. The group of Lipper funds used by the Board for management fee comparisons is referred to below as the “Total Mapped Group” and is broader than the Lipper peer group used by the Board for performance comparisons. The Total Mapped Group comparison focuses on a fund’s standing in terms of gross management fees before expense reimbursements or caps relative to the total universe of funds with comparable investment mandates, regardless of whether their management fee structures also are comparable. Funds with comparable investment mandates offer exposure to similar types of securities. Funds with comparable management fee structures have similar management fee contractual arrangements (
e.g., flat rate charged for advisory services, all-inclusive fee rate,
etc.). “TMG %” represents the percentage of funds in the Total Mapped Group that had management fees that were lower than a fund’s. For example, a hypothetical TMG % of 20% would mean that 80% of the funds in the Total Mapped Group had higher
, and 20% had lower, management fees than a fund. The funds’ actual TMG %s and the number of funds in the Total Mapped Group are in the charts below. The “Asset-Size Peer Group” (ASPG) comparison focuses on a fund’s standing relative to a subset of non-Fidelity funds within the Total Mapped Group that are similar in size and management fee structure. For example, if a fund is in the first quartile of the ASPG, the fund’s management fee ranks in the least expensive or lowest 25% of funds in the ASPG. The ASPG represents at least 15% of the funds in the Total Mapped Group with comparable asset size and management fee structures, subject to a minimum of 50 funds (or all funds in the Total Mapped Group if fewer than 50). Additional information, such as the ASPG quartile in which a fund’s management fee rate ranked, is also included in the charts and was considered by the Board.
Fidelity Connecticut Municipal Income Fund
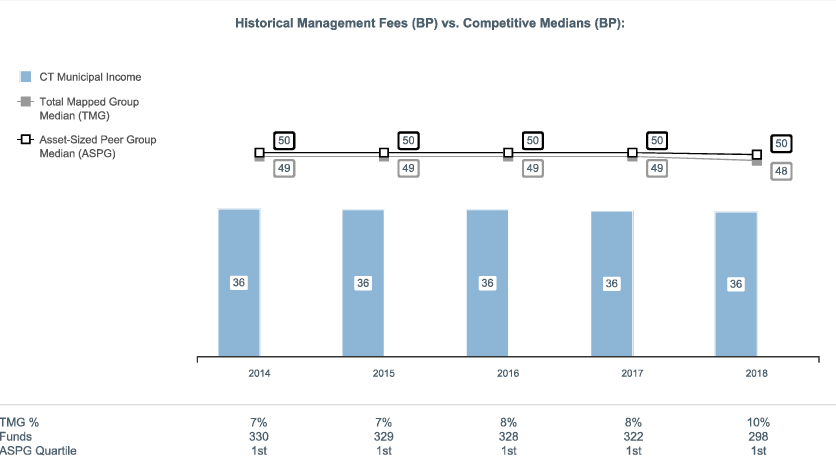
The Board noted that the fund's management fee rate ranked below the median of its Total Mapped Group and below the median of its ASPG for 2018.
Fidelity Connecticut Municipal Money Market Fund
The Board noted that because there is a relatively small number of state-specific funds in the Lipper objective, Fidelity combines Lipper's separate categories for state-specific funds with all state and national municipal money market funds to create a single mapped group. The Board considered that Fidelity is the only firm that offers a Connecticut money market fund.

The Board noted that the fund's management fee rate ranked above the median of its Total Mapped Group and above the median of its ASPG for 2018. The Board also noted that the management fee rate was four BP above the Total Mapped Group median and seven BP above the ASPG median.
The Board noted that it and the boards of other Fidelity funds formed an ad hoc Committee on Group Fee, which meets periodically, to conduct an in-depth review of the "group fee" component of the management fee of funds with such management fee structures. The Committee's focus included the mechanics of the group fee, the competitive landscape of group fee structures, Fidelity funds with no group fee component and investment products not included in group fee assets. The Board also considered that, for funds subject to the group fee, FMR agreed to voluntarily waive fees over a specified period of time in amounts designed to account for assets converted from certain funds to certain collective investment trusts.
Based on its review, the Board concluded that each fund's management fee is fair and reasonable in light of the services that the fund receives and the other factors considered.
Total Expense Ratio. In its review of each fund's total expense ratio, the Board considered the fund's management fee rate as well as other fund expenses, such as transfer agent fees, pricing and bookkeeping fees, and custodial, legal, and audit fees. The Board also noted that Fidelity may agree to waive fees or reimburse expenses from time to time, and the extent to which, if any, it has done so for each fund. As part of its review, the Board also considered the current and historical total expense ratios of each fund compared to competitive fund median expenses. Each fund is compared to those funds and classes in the Total Mapped Group (used by the Board for management fee comparisons) that have a similar sales load structure.
The Board noted that Fidelity Connecticut Municipal Income Fund's total expense ratio ranked below the competitive median for 2018 and Fidelity Connecticut Municipal Money Market Fund's total expense ratio ranked above the competitive median for 2018. The Board considered that, in general, various factors can affect total expense ratios. The Board considered that the competitive data for Fidelity Connecticut Municipal Money Market Fund reflects periods for which many competitor funds waived fees or reimbursed expenses in order to maintain a minimum yield. The Board also considered that, as interest rates rise, many competitors have eliminated such waivers, but the externally sourced competitive data for 2018 had not yet caught up to the fiscal periods during which competitors have stopped waiving fees to maintain minimum yields. The Board noted that, excluding fee waivers and reimbursements, the fund's total expense ratio ranked below the median.
Fees Charged to Other Fidelity Clients. The Board also considered Fidelity fee structures and other information with respect to clients of Fidelity, such as other funds advised or subadvised by Fidelity, pension plan clients, and other institutional clients with similar mandates. The Board noted that a joint ad hoc committee created by it and the boards of other Fidelity funds periodically reviews and compares Fidelity's institutional investment advisory business with its business of providing services to the Fidelity funds and also noted the most recent findings of the committee. The Board noted that the committee's review included a consideration of the differences in services provided, fees charged, and costs incurred, as well as competition in the markets serving the different categories of clients.
Based on its review of total expense ratios and fees charged to other Fidelity clients, the Board concluded that each fund's total expense ratio was reasonable in light of the services that the fund and its shareholders receive and the other factors considered.
Costs of the Services and Profitability. The Board considered the revenues earned and the expenses incurred by Fidelity in conducting the business of developing, marketing, distributing, managing, administering and servicing each fund and servicing each fund's shareholders. The Board also considered the level of Fidelity's profits in respect of all the Fidelity funds.
On an annual basis, Fidelity presents to the Board information about the profitability of its relationships with each fund. Fidelity calculates profitability information for each fund, as well as aggregate profitability information for groups of Fidelity funds and all Fidelity funds, using a series of detailed revenue and cost allocation methodologies which originate with the books and records of Fidelity on which Fidelity's audited financial statements are based. The Audit Committee of the Board reviews any significant changes from the prior year's methodologies and the full Board approves such changes.
PricewaterhouseCoopers LLP (PwC), auditor to Fidelity and certain Fidelity funds, has been engaged annually by the Board as part of the Board's assessment of Fidelity's profitability analysis. PwC's engagement includes the review and assessment of the methodologies used by Fidelity in determining the revenues and expenses attributable to Fidelity's mutual fund business, and completion of agreed-upon procedures in respect of the mathematical accuracy of the fund profitability information and its conformity to established allocation methodologies. After considering PwC's reports issued under the engagement and information provided by Fidelity, the Board concluded that while other allocation methods may also be reasonable, Fidelity's profitability methodologies are reasonable in all material respects.
The Board also reviewed Fidelity's non-fund businesses and potential indirect benefits such businesses may have received as a result of their association with Fidelity's mutual fund business (i.e., fall-out benefits) as well as cases where Fidelity's affiliates may benefit from the funds' business. The Board noted that changes to fall-out benefits year-over-year reflect business developments at Fidelity's various businesses. The Board considered that a joint ad hoc committee created by it and the boards of other Fidelity funds had recently been established, and meets periodically, to evaluate potential fall-out benefits. The Board noted that the committee was expected to, among other things: (i) discuss the legal framework surrounding potential fall-out benefits; (ii) review the Board's responsibilities and approach to potential fall-out benefits; and (iii) review practices employed by competitor funds regarding the review of potential fall-out benefits. The Board noted that it would consider the committee's findings in connection with future consideration of contract renewals.
The Board considered the costs of the services provided by and the profits realized by Fidelity in connection with the operation of each fund and was satisfied that the profitability was not excessive.
Economies of Scale. The Board considered whether there have been economies of scale in respect of the management of the Fidelity funds, whether the Fidelity funds (including each fund) have appropriately benefited from any such economies of scale, and whether there is potential for realization of any further economies of scale. The Board considered the extent to which each fund will benefit from economies of scale as assets grow through increased services to the fund, through waivers or reimbursements, or through fee or expense ratio reductions. The Board also noted that a committee (the Economies of Scale Committee) created by it and the boards of other Fidelity funds periodically analyzes whether Fidelity attains economies of scale in respect of the management and servicing of the Fidelity funds, whether the Fidelity funds have appropriately benefited from such economies of scale, and whether there is potential for realization of any further economies of scale.
The Board recognized that each fund's management contract incorporates a "group fee" structure, which provides for lower group fee rates as total "group assets" increase, and for higher group fee rates as total "group assets" decrease ("group assets" as defined in the management contract). FMR calculates the group fee rates based on a tiered asset "breakpoint" schedule that varies based on asset class. The Board considered that the group fee is designed to deliver the benefits of economies of scale to fund shareholders when total Fidelity fund assets increase, even if assets of any particular fund are unchanged or have declined, because some portion of Fidelity's costs are attributable to services provided to all Fidelity funds, and all funds benefit if those costs can be allocated among more assets. The Board concluded that, given the group fee structure, fund shareholders will benefit from lower management fees as "group assets" increase at the fund complex level, regardless of whether Fidelity achieves any such economies of scale.
The Board concluded, taking into account the analysis of the Economies of Scale Committee, that economies of scale, if any, are being appropriately shared between fund shareholders and Fidelity.
Additional Information Requested by the Board. In order to develop fully the factual basis for consideration of the Fidelity funds' advisory contracts, the Board requested and received additional information on certain topics, including: (i) Fidelity's fund profitability methodology, profitability trends for certain funds, the allocation of various costs to different funds, and the impact of certain factors on fund profitability results; (ii) portfolio manager changes that have occurred during the past year and the amount of the investment that each portfolio manager has made in the Fidelity fund(s) that he or she manages; (iii) Fidelity's compensation structure for portfolio managers, research analysts, and other key personnel, including its effects on fund profitability, the rationale for the compensation structure, and the extent to which current market conditions have affected retention and recruitment; (iv) the arrangements with and compensation paid to certain fund sub-advisers on behalf of the Fidelity funds and the treatment of such compensation within Fidelity's fund profitability methodology; (v) the practices of certain sub-advisers regarding their receipt of research from broker-dealers that execute the funds' portfolio transactions; (vi) the terms of Fidelity's voluntary expense limitation agreements; (vii) the methodology with respect to competitive fund data and peer group classifications; (viii) Fidelity's transfer agent fee, expense, and service structures for different funds and classes relative to competitive trends, and the impact of the increased use of omnibus accounts; (ix) new developments in the retail and institutional marketplaces and the competitive positioning of the funds relative to other investment products and services; (x) the impact on fund profitability of recent changes in total net assets for Fidelity's money market funds, anticipated changes to the competitive landscape for money market funds, and the level of investor comfort with gates, fees, and floating NAVs; (xi) the funds' share class structures and distribution channels; and (xii) explanations regarding the relative total expense ratios of certain funds and classes, total expense competitive trends and methodologies for total expense competitive comparisons, and actions that might be taken by Fidelity to reduce total expense ratios for certain classes. In addition, the Board considered its discussions with Fidelity throughout the year regarding enhanced information security initiatives and the funds' fair valuation policies.
Based on its evaluation of all of the conclusions noted above, and after considering all factors it believed relevant, the Board concluded that the advisory fee arrangements are fair and reasonable, and that each fund's Advisory Contracts should be renewed and each fund's Amended and Restated Contracts should be approved.

CTF-ANN-0120
1.539232.122
Fidelity® New Jersey Municipal Income Fund
Fidelity® New Jersey Municipal Money Market Fund
Annual Report
November 30, 2019
See the inside front cover for important information about access to your fund’s shareholder reports.
Beginning on January 1, 2021, as permitted by regulations adopted by the Securities and Exchange Commission, paper copies of a fund’s shareholder reports will no longer be sent by mail, unless you specifically request paper copies of the reports from the fund or from your financial intermediary, such as a financial advisor, broker-dealer or bank. Instead, the reports will be made available on a website, and you will be notified by mail each time a report is posted and provided with a website link to access the report.
If you already elected to receive shareholder reports electronically, you will not be affected by this change and you need not take any action. You may elect to receive shareholder reports and other communications from a fund electronically, by contacting your financial intermediary. For Fidelity customers, visit Fidelity's web site or call Fidelity using the contact information listed below.
You may elect to receive all future reports in paper free of charge. If you wish to continue receiving paper copies of your shareholder reports, you may contact your financial intermediary or, if you are a Fidelity customer, visit Fidelity’s website, or call Fidelity at the applicable toll-free number listed below. Your election to receive reports in paper will apply to all funds held with the fund complex/your financial intermediary.
| Account Type | Website | Phone Number |
| Brokerage, Mutual Fund, or Annuity Contracts: | fidelity.com/mailpreferences | 1-800-343-3548 |
| Employer Provided Retirement Accounts: | netbenefits.fidelity.com/preferences (choose 'no' under Required Disclosures to continue to print) | 1-800-343-0860 |
| Advisor Sold Accounts Serviced Through Your Financial Intermediary: | Contact Your Financial Intermediary | Your Financial Intermediary's phone number |
| Advisor Sold Accounts Serviced by Fidelity: | institutional.fidelity.com | 1-877-208-0098 |
Contents
To view a fund's proxy voting guidelines and proxy voting record for the 12-month period ended June 30, visit http://www.fidelity.com/proxyvotingresults or visit the Securities and Exchange Commission's (SEC) web site at http://www.sec.gov.
You may also call 1-800-544-8544 to request a free copy of the proxy voting guidelines.
Standard & Poor's, S&P and S&P 500 are registered service marks of The McGraw-Hill Companies, Inc. and have been licensed for use by Fidelity Distributors Corporation.
Other third-party marks appearing herein are the property of their respective owners.
All other marks appearing herein are registered or unregistered trademarks or service marks of FMR LLC or an affiliated company. © 2020 FMR LLC. All rights reserved.
This report and the financial statements contained herein are submitted for the general information of the shareholders of the Fund. This report is not authorized for distribution to prospective investors in the Fund unless preceded or accompanied by an effective prospectus.
A fund files its complete schedule of portfolio holdings with the SEC for the first and third quarters of each fiscal year on Form N-PORT. Forms N-PORT are available on the SEC’s web site at http://www.sec.gov. A fund's Forms N-PORT may be reviewed and copied at the SEC’s Public Reference Room in Washington, DC. Information regarding the operation of the SEC's Public Reference Room may be obtained by calling 1-800-SEC-0330.
For a complete list of a fund's portfolio holdings, view the most recent holdings listing, semiannual report, or annual report on Fidelity's web site at http://www.fidelity.com, http://www.institutional.fidelity.com, or http://www.401k.com, as applicable.
NOT FDIC INSURED •MAY LOSE VALUE •NO BANK GUARANTEE
Neither the Fund nor Fidelity Distributors Corporation is a bank.
Fidelity® New Jersey Municipal Income Fund
Performance: The Bottom Line
Average annual total return reflects the change in the value of an investment, assuming reinvestment of distributions from dividend income and capital gains (the profits earned upon the sale of securities that have grown in value, if any) and assuming a constant rate of performance each year. The hypothetical investment and the average annual total returns do not reflect the deduction of taxes that a shareholder would pay on fund distributions or the redemption of fund shares. During periods of reimbursement by Fidelity, a fund’s total return will be greater than it would be had the reimbursement not occurred. How a fund did yesterday is no guarantee of how it will do tomorrow.
Average Annual Total Returns
| For the periods ended November 30, 2019 | Past 1 year | Past 5 years | Past 10 years |
| Fidelity® New Jersey Municipal Income Fund | 9.66% | 3.91% | 4.29% |
$10,000 Over 10 Years
Let's say hypothetically that $10,000 was invested in Fidelity® New Jersey Municipal Income Fund on November 30, 2009.
The chart shows how the value of your investment would have changed, and also shows how the Bloomberg Barclays Municipal Bond Index performed over the same period.
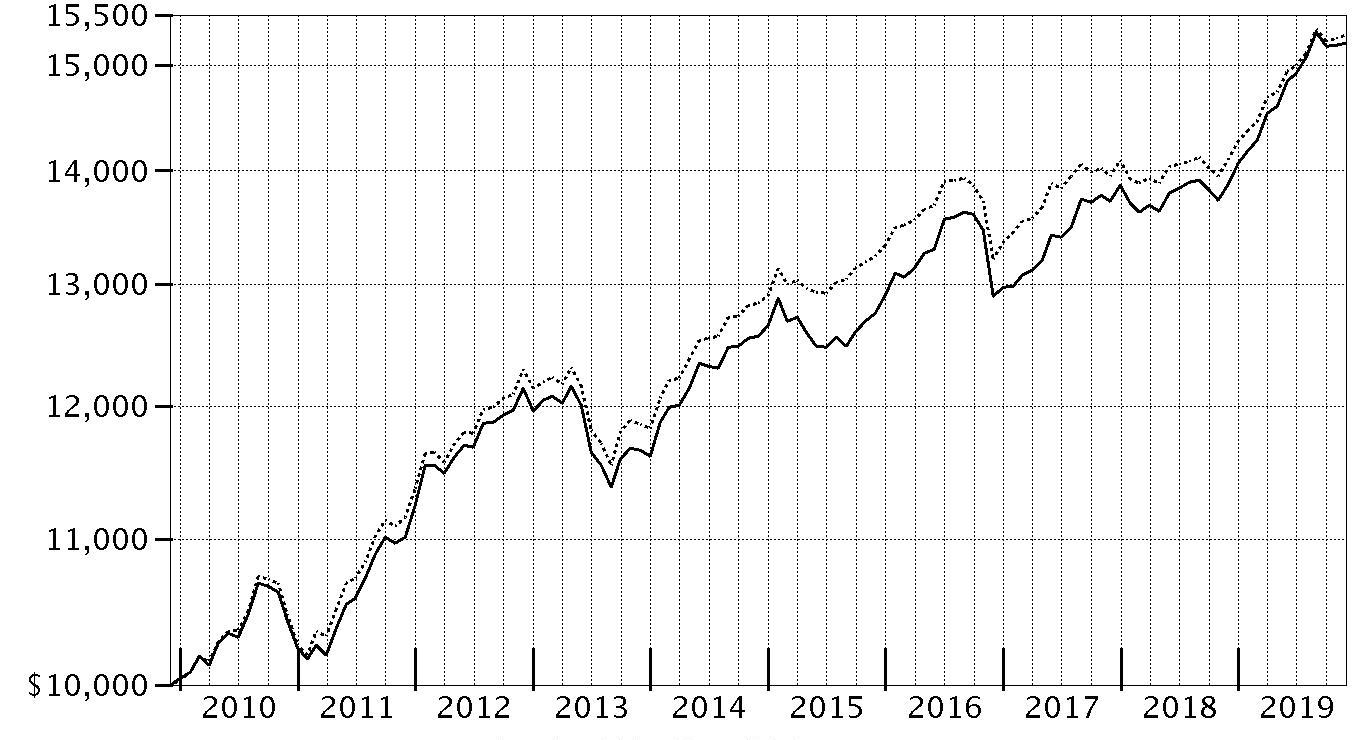
| Period Ending Values |
| $15,216 | Fidelity® New Jersey Municipal Income Fund |
| $15,300 | Bloomberg Barclays Municipal Bond Index |
Fidelity® New Jersey Municipal Income Fund
Management's Discussion of Fund Performance
Market Recap: Tax-exempt municipal bonds posted a healthy gain for the 12 months ending November 30, 2019, supported by strong supply/demand dynamics for much of the period. The Bloomberg Barclays Municipal Bond Index rose 8.49%. Gross municipal bond issuance remained below the long-term historical average, due to the elimination of tax-exempt advance refundings under the new tax law, historically a significant source of supply. The cap on the federal deduction for state and local taxes made tax-exempt debt attractive, particularly in high-tax states. The muni market rose strongly from early 2019 into mid-August amid growing evidence of a global economic slowdown and heightened international trade tension that led to a series of rate cuts by the U.S. Federal Reserve. Reversing a roughly three-year cycle of rate hikes, the Fed cut policy interest rates by 25 basis points in July. The Fed then followed with rate cuts of 25 basis points each in September and October, citing trade policy and the global economy as potential downside risks. The muni market experienced a negative return in September following the Fed’s shift on rates, as well as a less supportive technical environment. For the period, general obligation bonds gained 8.27%, while bonds tied to specific revenue streams or projects rose 8.92%.
Comments from Co-Portfolio Managers Kevin Ramundo, Cormac Cullen and Elizah McLaughlin: For the fiscal year, the fund gained 9.66%, slightly outpacing, net of fees, the 9.48% advance of the Bloomberg Barclays New Jersey Enhanced Modified Municipal Bond Index. In managing the fund the past 12 months, we continued to focus on longer-term objectives and sought to generate attractive tax-exempt income and competitive risk-adjusted return over time. Favorable security selection contributed to the fund's return versus the state benchmark. Picks among New Jersey-appropriated zero-coupon bonds added particular value, as these holdings generated some of the best total returns in both the state and in the national municipal market. Duration (interest-rate sensitivity) and yield-curve positioning also helped the fund's relative result; maintaining a slightly longer duration versus the state benchmark aided the relative return because muni yields declined for the period. Also, overweighting bonds with durations in the 10-year range contributed, as these securities outperformed. Elsewhere, differences in the way fund holdings and index components were priced helped the fund's relative result. There weren't any notable disappointments.
The views expressed above reflect those of the portfolio manager(s) only through the end of the period as stated on the cover of this report and do not necessarily represent the views of Fidelity or any other person in the Fidelity organization. Any such views are subject to change at any time based upon market or other conditions and Fidelity disclaims any responsibility to update such views. These views may not be relied on as investment advice and, because investment decisions for a Fidelity fund are based on numerous factors, may not be relied on as an indication of trading intent on behalf of any Fidelity fund.
Note to shareholders: Mark Sommer retired from Fidelity on December 31, 2018, after more than 25 years with the firm.
Fidelity® New Jersey Municipal Income Fund
Investment Summary (Unaudited)
Top Five Sectors as of November 30, 2019
| | % of fund's net assets |
| General Obligations | 29.8 |
| Health Care | 21.7 |
| Transportation | 21.3 |
| Education | 14.9 |
| Escrowed/Pre-Refunded | 3.3 |
Quality Diversification (% of fund's net assets)
| As of November 30, 2019 |
| | AAA | 4.5% |
| | AA,A | 56.2% |
| | BBB | 33.8% |
| | Not Rated | 3.2% |
| | Short-Term Investments and Net Other Assets | 2.3% |

We have used ratings from Moody's Investors Service, Inc. Where Moody's® ratings are not available, we have used S&P® ratings. All ratings are as of the date indicated and do not reflect subsequent changes.
Fidelity® New Jersey Municipal Income Fund
Schedule of Investments November 30, 2019
Showing Percentage of Net Assets
| Municipal Bonds - 97.7% | | | |
| | | Principal Amount | Value |
| Delaware, New Jersey - 1.8% | | | |
| Delaware River & Bay Auth. Rev.: | | | |
| Series 2014 A, 5% 1/1/44 | | $3,000,000 | $3,340,980 |
| Series 2014 B, 5% 1/1/23 | | 700,000 | 779,541 |
| Series 2019, 5% 1/1/32 | | 5,000,000 | 6,291,200 |
|
| TOTAL DELAWARE, NEW JERSEY | | | 10,411,721 |
|
| Guam - 0.5% | | | |
| Guam Int'l. Arpt. Auth. Rev. Series 2013 C, 6.375% 10/1/43 (a) | | 1,000,000 | 1,153,130 |
| Guam Pwr. Auth. Rev. Series 2012 A, 5% 10/1/22 (FSA Insured) | | 1,500,000 | 1,645,635 |
|
| TOTAL GUAM | | | 2,798,765 |
|
| New Jersey - 84.2% | | | |
| Bayonne Gen. Oblig. Series 2016: | | | |
| 5% 7/1/35 (Build America Mutual Assurance Insured) | | 1,000,000 | 1,170,410 |
| 5% 7/1/39 (Build America Mutual Assurance Insured) | | 1,000,000 | 1,160,080 |
| Camden County Impt. Auth. Health Care Redev. Rev. Series 2014 A: | | | |
| 5% 2/15/25 | | 1,020,000 | 1,155,068 |
| 5% 2/15/26 | | 1,000,000 | 1,130,460 |
| 5% 2/15/27 | | 1,000,000 | 1,127,550 |
| 5% 2/15/28 | | 1,000,000 | 1,124,750 |
| 5% 2/15/29 | | 1,000,000 | 1,121,810 |
| 5% 2/15/32 | | 1,000,000 | 1,114,430 |
| Camden County Impt. Auth. Rev. (County Cap. Prog.) Series 2016, 5% 1/15/32 | | 3,000,000 | 3,568,470 |
| Cape May County Indl. Poll. Cont. Fing. Auth. Rev. (Atlantic City Elec. Co. Proj.) Series 1991 A, 6.8% 3/1/21 (Nat'l. Pub. Fin. Guarantee Corp. Insured) | | 1,350,000 | 1,438,020 |
| Cumberland County Impt. Auth.: | | | |
| (County Correctional Facility Proj.) Series 2018, 5% 10/1/58 | | 5,000,000 | 5,907,300 |
| (Technical High School Proj.) Series 2014: | | | |
| 5% 9/1/23 (FSA Insured) | | 600,000 | 681,372 |
| 5% 9/1/24 (FSA Insured) | | 1,640,000 | 1,917,127 |
| 5% 9/1/25 (FSA Insured) | | 1,375,000 | 1,599,098 |
| 5% 9/1/39 (FSA Insured) | | 4,000,000 | 4,578,800 |
| Essex County Util. Auth. Solid Waste Rev. Series 2009, 5% 4/1/20 (Assured Guaranty Corp. Insured) | | 1,000,000 | 1,002,367 |
| Garden State Preservation Trust Open Space & Farmland Preservation Series 2012 A, 5% 11/1/22 | | 6,600,000 | 7,247,196 |
| Gloucester County Impt. Auth. Rev. (Rowan Univ. Proj.): | | | |
| Series 2017 A: | | | |
| 5% 11/1/28 (FSA Insured) | | 2,500,000 | 3,037,000 |
| 5% 11/1/29 (FSA Insured) | | 750,000 | 907,313 |
| 5% 11/1/30 (FSA Insured) | | 605,000 | 728,765 |
| Series 2019: | | | |
| 4% 7/1/48 | | 1,000,000 | 1,124,420 |
| 5% 7/1/44 | | 1,000,000 | 1,238,010 |
| Hudson Co. Impt. Auth. Swsr Series 2019: | | | |
| 4% 1/1/35 | | 1,000,000 | 1,140,870 |
| 4% 1/1/37 | | 395,000 | 448,056 |
| 4% 1/1/38 | | 1,000,000 | 1,129,830 |
| 4% 1/1/39 | | 835,000 | 941,053 |
| Jersey City Gen. Oblig. Series 2017 A: | | | |
| 5% 11/1/24 | | 1,000,000 | 1,165,730 |
| 5% 11/1/28 | | 1,050,000 | 1,300,793 |
| 5% 11/1/29 | | 1,035,000 | 1,277,076 |
| 5% 11/1/30 | | 800,000 | 982,368 |
| 5% 11/1/31 | | 500,000 | 610,720 |
| Monroe Township Board of Ed. Series 2012: | | | |
| 5% 8/1/26 | | 3,220,000 | 3,529,861 |
| 5% 8/1/28 | | 4,000,000 | 4,373,880 |
| New Brunswick Parking Auth. Rev. Series 2012: | | | |
| 5% 9/1/23 | | 1,450,000 | 1,588,823 |
| 5% 9/1/26 | | 600,000 | 654,552 |
| 5% 9/1/27 | | 440,000 | 479,692 |
| New Jersey Econ. Dev. Auth. Lease Rev. (Health Dept. and Taxation Division Office Proj.) Series 2018 A, 5% 6/15/31 | | 2,555,000 | 2,982,809 |
| New Jersey Econ. Dev. Auth. Motor Vehicle Rev. Series 2017 B, 3.125% 7/1/29 | | 2,175,000 | 2,207,930 |
| New Jersey Econ. Dev. Auth. Rev.: | | | |
| (Black Horse EHT Urban Renewal LLC Proj.) Series 2019 A, 5% 10/1/39 (b) | | 1,000,000 | 1,001,470 |
| (Goethals Bridge Replacement Proj.) Series 2013: | | | |
| 5.125% 1/1/34 (a) | | 1,500,000 | 1,682,640 |
| 5.375% 1/1/43 (a) | | 2,000,000 | 2,235,560 |
| (Provident Montclair Proj.) Series 2017: | | | |
| 5% 6/1/30 (FSA Insured) | | 1,500,000 | 1,798,515 |
| 5% 6/1/31 (FSA Insured) | | 1,500,000 | 1,792,320 |
| 5% 6/1/37 (FSA Insured) | | 4,000,000 | 4,712,320 |
| New Jersey Gen. Oblig. Series 2013 NN, 5% 3/1/21 (Pre-Refunded to 3/1/21 @ 100) | | 3,480,000 | 3,631,310 |
| Series 2005 N1, 5.5% 9/1/24 (AMBAC Insured) | | 5,000,000 | 5,829,100 |
| Series 2012 II, 5% 3/1/26 (Pre-Refunded to 3/1/26 @ 100) | | 5,000,000 | 5,358,750 |
| Series 2012, 5% 6/15/20 | | 5,000,000 | 5,091,509 |
| Series 2013 NN: | | | |
| 5% 3/1/26 | | 4,130,000 | 4,550,641 |
| 5% 3/1/27 | | 6,570,000 | 7,224,503 |
| Series 2013: | | | |
| 5% 3/1/23 | | 4,920,000 | 5,434,878 |
| 5% 3/1/25 | | 1,295,000 | 1,428,903 |
| Series 2015 WW, 5.25% 6/15/40 | | 2,000,000 | 2,261,700 |
| Series 2015 XX: | | | |
| 4.25% 6/15/26 | | 4,220,000 | 4,646,262 |
| 5.25% 6/15/27 | | 3,000,000 | 3,472,260 |
| Series 2016 BBB, 5.5% 6/15/30 | | 2,165,000 | 2,578,796 |
| New Jersey Econ. Dev. Auth. Wtr. Facilities Rev.: | | | |
| (American Wtr. Co., Inc. Proj.) Series 2009 A, 5.7% 10/1/39 (a) | | 5,000,000 | 5,008,500 |
| (Middlesex Wtr. Co. Proj.) Series 2019, 5% 8/1/59 (a) | | 1,000,000 | 1,191,020 |
| New Jersey Edl. Facilities Auth. Rev. (New Jersey Institute of Technology Proj.) Series 2010 H, 5% 7/1/31 | | 2,000,000 | 2,038,220 |
| New Jersey Edl. Facility: | | | |
| (College of New Jersey Proj.) Series 2016 F 5% 7/1/29 | | 670,000 | 800,610 |
| (Stevens Institute of Techonolgy Proj.) Series 2017 A: | | | |
| 5% 7/1/23 | | 485,000 | 545,121 |
| 5% 7/1/24 | | 690,000 | 797,764 |
| 5% 7/1/25 | | 600,000 | 712,224 |
| 5% 7/1/26 | | 945,000 | 1,148,222 |
| 5% 7/1/29 | | 665,000 | 814,066 |
| Series 2015 B, 5% 7/1/31 | | 3,000,000 | 3,477,600 |
| Series 2016 A: | | | |
| 5% 7/1/27 | | 2,875,000 | 3,416,909 |
| 5% 7/1/32 | | 600,000 | 701,058 |
| Series 2016 B, 5% 9/1/20 | | 4,535,000 | 4,653,333 |
| Series 2016 E: | | | |
| 5% 7/1/32 (Build America Mutual Assurance Insured) | | 3,335,000 | 3,948,206 |
| 5% 7/1/33 (Build America Mutual Assurance Insured) | | 1,000,000 | 1,181,560 |
| 5% 7/1/34 (Build America Mutual Assurance Insured) | | 1,000,000 | 1,179,510 |
| New Jersey Gen. Oblig. 5% 6/1/25 | | 3,340,000 | 3,919,824 |
| New Jersey Health Care Facilities Fing. Auth. Rev.: | | | |
| (Inspira Health Proj.) Series 2017 A, 5% 7/1/42 | | 5,325,000 | 6,294,789 |
| (St Joseph Hosp. & Med. Ctr., Proj.) Series 2016, 5% 7/1/25 | | 700,000 | 813,820 |
| (Trinitas Hosp. Obligated Grp Proj.) Series 2016 A, 5% 7/1/22 | | 910,000 | 988,852 |
| Bonds: | | | |
| Series 2019 B2, 5%, tender 7/1/25 (c) | | 2,000,000 | 2,377,220 |
| Series 2019 B3, 5%, tender 7/1/26 (c) | | 5,000,000 | 6,085,050 |
| Series 2011: | | | |
| 5% 7/1/23 | | 2,500,000 | 2,739,275 |
| 5% 7/1/24 | | 2,000,000 | 2,188,740 |
| 5% 7/1/25 | | 2,265,000 | 2,475,736 |
| Series 2013 A: | | | |
| 5% 7/1/28 | | 1,080,000 | 1,213,477 |
| 5% 7/1/32 | | 1,600,000 | 1,782,912 |
| 5.25% 7/1/28 | | 3,250,000 | 3,673,800 |
| Series 2013: | | | |
| 5% 7/1/24 | | 1,250,000 | 1,430,938 |
| 5% 7/1/26 | | 1,335,000 | 1,504,465 |
| 5.25% 7/1/31 (Pre-Refunded to 7/1/23 @ 100) | | 3,290,000 | 3,760,207 |
| 5.25% 7/1/31 (Pre-Refunded to 7/1/23 @ 100) | | 710,000 | 810,131 |
| 5.5% 7/1/43 (Pre-Refunded to 7/1/23 @ 100) | | 2,465,000 | 2,838,842 |
| 5.5% 7/1/43 (Pre-Refunded to 7/1/23 @ 100) | | 535,000 | 615,122 |
| Series 2014 A: | | | |
| 4% 7/1/45 | | 1,300,000 | 1,360,580 |
| 5% 7/1/30 | | 700,000 | 789,432 |
| 5% 7/1/31 | | 455,000 | 510,992 |
| 5% 7/1/32 | | 1,000,000 | 1,120,710 |
| 5% 7/1/44 | | 3,635,000 | 4,153,060 |
| 5% 7/1/45 | | 2,225,000 | 2,442,427 |
| Series 2016 A: | | | |
| 5% 7/1/22 | | 2,000,000 | 2,172,780 |
| 5% 7/1/25 | | 1,220,000 | 1,459,742 |
| 5% 7/1/26 | | 1,565,000 | 1,858,469 |
| 5% 7/1/27 | | 100,000 | 122,235 |
| 5% 7/1/27 | | 1,685,000 | 1,995,748 |
| 5% 7/1/28 | | 2,000,000 | 2,435,400 |
| 5% 7/1/28 | | 2,000,000 | 2,355,820 |
| 5% 7/1/29 | | 3,660,000 | 4,439,141 |
| 5% 7/1/29 | | 1,550,000 | 1,821,715 |
| 5% 7/1/30 | | 1,200,000 | 1,449,540 |
| 5% 7/1/30 | | 2,000,000 | 2,337,080 |
| 5% 7/1/31 | | 5,100,000 | 6,069,102 |
| 5% 7/1/31 | | 10,195,000 | 12,229,922 |
| 5% 7/1/33 | | 1,000,000 | 1,184,260 |
| 5% 7/1/39 | | 11,000,000 | 12,973,730 |
| 5% 7/1/43 | | 2,500,000 | 2,937,175 |
| Series 2016: | | | |
| 5% 7/1/23 | | 1,240,000 | 1,376,735 |
| 5% 7/1/24 | | 1,000,000 | 1,136,690 |
| 5% 7/1/26 | | 800,000 | 946,224 |
| 5% 7/1/29 | | 1,050,000 | 1,280,948 |
| 5% 7/1/30 | | 605,000 | 734,428 |
| 5% 7/1/31 | | 400,000 | 482,876 |
| 5% 7/1/35 | | 950,000 | 1,093,669 |
| 5% 7/1/36 | | 565,000 | 649,100 |
| 5% 7/1/41 | | 3,000,000 | 3,404,910 |
| Series 2017 A: | | | |
| 5% 7/1/25 | | 110,000 | 131,289 |
| 5% 7/1/52 | | 4,265,000 | 5,020,886 |
| New Jersey Higher Ed. Student Assistance Auth. Student Ln. Rev.: | | | |
| Series 2012 1A, 5% 12/1/21 (a) | | 5,000,000 | 5,349,950 |
| Series 2013: | | | |
| 4% 12/1/20 (a) | | 2,500,000 | 2,564,719 |
| 5% 12/1/21 (a) | | 3,600,000 | 3,851,964 |
| 5% 12/1/22 (a) | | 2,250,000 | 2,480,198 |
| Series 2014 1A, 5% 12/1/21 (a) | | 1,800,000 | 1,925,982 |
| Series 2016 1A, 5% 12/1/25 (a) | | 1,400,000 | 1,657,964 |
| Series 2017 1A: | | | |
| 5% 12/1/25 (a) | | 3,000,000 | 3,552,780 |
| 5% 12/1/27 (a) | | 2,500,000 | 2,987,075 |
| Series 2018 B, 5% 12/1/28 (a) | | 950,000 | 1,161,755 |
| Series 2019 A: | | | |
| 5% 12/1/26 | | 2,525,000 | 3,091,560 |
| 5% 12/1/27 | | 2,000,000 | 2,492,900 |
| 5% 12/1/28 | | 700,000 | 880,173 |
| New Jersey Hsg. & Mtg. Fin. Agcy. Bonds Series 2019 C, 1.58%, tender 6/1/20 (c) | | 1,700,000 | 1,701,418 |
| New Jersey Hsg. & Mtg. Fin. Agcy. Rev. Series 2019 D: | | | |
| 4% 4/1/24 (a) | | 2,320,000 | 2,515,970 |
| 4% 10/1/24 (a) | | 2,370,000 | 2,585,243 |
| New Jersey Inst of Technology Series 2012 A: | | | |
| 5% 7/1/32 | | 870,000 | 946,082 |
| 5% 7/1/32 (Pre-Refunded to 7/1/22 @ 100) | | 380,000 | 417,153 |
| 5% 7/1/42 | | 3,470,000 | 3,755,095 |
| New Jersey Tobacco Settlement Fing. Corp.: | | | |
| Series 2018 A: | | | |
| 5% 6/1/21 | | 100,000 | 105,041 |
| 5% 6/1/23 | | 800,000 | 889,240 |
| 5% 6/1/24 | | 1,000,000 | 1,140,100 |
| 5% 6/1/25 | | 3,000,000 | 3,499,350 |
| 5% 6/1/26 | | 3,000,000 | 3,571,740 |
| 5% 6/1/27 | | 1,000,000 | 1,212,130 |
| 5% 6/1/28 | | 2,000,000 | 2,461,320 |
| Series 2018 B, 3.2% 6/1/27 | | 3,855,000 | 3,934,413 |
| New Jersey Tpk. Auth. Tpk. Rev.: | | | |
| Series 2012 B, 5% 1/1/24 | | 2,650,000 | 2,952,842 |
| Series 2013 A, 5% 1/1/38 (Pre-Refunded to 7/1/22 @ 100) | | 5,000,000 | 5,495,550 |
| Series 2014 A, 5% 1/1/32 | | 5,000,000 | 5,735,400 |
| Series 2017 B: | | | |
| 5% 1/1/33 | | 5,000,000 | 6,133,450 |
| 5% 1/1/34 | | 2,500,000 | 3,060,825 |
| Series 2019 A, 5% 1/1/48 | | 2,000,000 | 2,419,820 |
| New Jersey Trans. Trust Fund Auth.: | | | |
| Series 2001 A, 6% 6/15/35 | | 2,825,000 | 2,994,274 |
| Series 2005 B, 5.25% 12/15/22 (AMBAC Insured) | | 1,200,000 | 1,332,384 |
| Series 2006 C: | | | |
| 0% 12/15/26 (AMBAC Insured) | | 10,000,000 | 8,467,400 |
| 0% 12/15/34 | | 4,000,000 | 2,640,480 |
| Series 2008 A, 0% 12/15/36 | | 25,000,000 | 14,470,245 |
| Series 2009 A, 0% 12/15/38 | | 13,900,000 | 7,384,792 |
| Series 2010 A: | | | |
| 0% 12/15/27 | | 3,000,000 | 2,429,340 |
| 0% 12/15/30 | | 14,750,000 | 10,698,618 |
| Series 2010 A3, 0% 12/15/34 | | 10,775,000 | 6,783,401 |
| Series 2011 A, 5.25% 6/15/25 | | 6,000,000 | 6,334,080 |
| Series 2011 B: | | | |
| 5.25% 6/15/25 | | 3,185,000 | 3,362,341 |
| 5.25% 6/15/26 | | 2,000,000 | 2,109,640 |
| Series 2016 A: | | | |
| 5% 6/15/20 | | 2,365,000 | 2,410,324 |
| 5% 6/15/29 | | 750,000 | 877,305 |
| 5% 6/15/30 | | 5,000,000 | 5,821,950 |
| Series 2018 A, 5% 6/15/31 | | 3,000,000 | 3,482,790 |
| New Jersey Transit Corp. Ctfs. of Prtn. Series 2014 A, 5% 9/15/21 | | 5,100,000 | 5,426,808 |
| Newark Port Auth. Hsg. Auth. Rev. Series 2007, 5.25% 1/1/25 (Nat'l. Pub. Fin. Guarantee Corp. Insured) | | 200,000 | 231,306 |
| North Hudson Swr. Auth. Wtr. & Swr. Rev. Series 2001 A, 0% 8/1/24 (Escrowed to Maturity) | | 2,000,000 | 1,861,120 |
| Rutgers State Univ. Rev.: | | | |
| Series 2010 I, 5% 5/1/29 | | 1,110,000 | 1,127,693 |
| Series Q: | | | |
| 5% 5/1/24 (d) | | 1,360,000 | 1,561,606 |
| 5% 5/1/25 (d) | | 750,000 | 884,003 |
| 5% 5/1/26 (d) | | 700,000 | 844,130 |
| 5% 5/1/27 (d) | | 750,000 | 922,275 |
| 5% 5/1/28 (d) | | 700,000 | 875,084 |
| 5% 5/1/29 (d) | | 500,000 | 634,735 |
| South Jersey Port Corp. Rev. (New Jersey Gen. Oblig. Proj.) Series 2017 B: | | | |
| 5% 1/1/29 (a) | | 730,000 | 870,102 |
| 5% 1/1/31 (a) | | 1,950,000 | 2,302,443 |
| 5% 1/1/33 (a) | | 750,000 | 882,000 |
| 5% 1/1/35 (a) | | 2,000,000 | 2,345,500 |
| South Jersey Trans. Auth. Trans. Sys. Rev. Series 2019 A: | | | |
| 5% 11/1/28 (FSA Insured) | | 200,000 | 251,848 |
| 5% 11/1/29 (FSA Insured) | | 1,750,000 | 2,233,805 |
| 5% 11/1/30 (FSA Insured) | | 1,740,000 | 2,208,147 |
| 5% 11/1/31 (FSA Insured) | | 1,500,000 | 1,895,970 |
| 5% 11/1/32 (FSA Insured) | | 1,230,000 | 1,548,041 |
| 5% 11/1/33 (FSA Insured) | | 750,000 | 941,715 |
|
| TOTAL NEW JERSEY | | | 493,206,131 |
|
| New York And New Jersey - 7.1% | | | |
| Port Auth. of New York & New Jersey: | | | |
| Series 163, 5% 7/15/35 | | 3,255,000 | 3,329,312 |
| Series 2016, 5% 11/15/32 (a) | | 5,000,000 | 5,983,550 |
| Series 2018, 5% 9/15/34 (a) | | 5,000,000 | 6,057,350 |
| Series 209, 5% 7/15/35 | | 8,970,000 | 11,167,022 |
| Series 213, 5% 9/1/39 | | 5,390,000 | 6,769,732 |
| Series 214, 5% 9/1/36 (a) | | 6,785,000 | 8,399,287 |
|
| TOTAL NEW YORK AND NEW JERSEY | | | 41,706,253 |
|
| Pennsylvania, New Jersey - 4.1% | | | |
| Delaware River Joint Toll Bridge Commission Pennsylvania-New Jersey Bridge Rev.: | | | |
| Series 2012 A: | | | |
| 5% 7/1/24 (Pre-Refunded to 7/1/22 @ 100) | | 1,200,000 | 1,315,716 |
| 5% 7/1/25 (Pre-Refunded to 7/1/22 @ 100) | | 1,100,000 | 1,206,073 |
| 5% 7/1/26 (Pre-Refunded to 7/1/22 @ 100) | | 500,000 | 548,215 |
| Series 2015: | | | |
| 3% 7/1/27 (Build America Mutual Assurance Insured) | | 1,000,000 | 1,068,660 |
| 5% 7/1/26 | | 650,000 | 775,034 |
| 5% 7/1/29 (Pre-Refunded to 7/1/25 @ 100) | | 300,000 | 359,355 |
| 5% 7/1/30 (Pre-Refunded to 7/1/25 @ 100) | | 350,000 | 419,248 |
| Series 2019 A, 5% 7/1/44 | | 700,000 | 863,212 |
| Series 2019 B: | | | |
| 5% 7/1/31 | | 800,000 | 1,025,768 |
| 5% 7/1/32 | | 1,000,000 | 1,275,070 |
| Delaware River Port Auth. Pennsylvania & New Jersey Rev.: | | | |
| (Port District Proj.) Series 2012, 5% 1/1/24 | | 3,000,000 | 3,303,300 |
| Series 2013, 5% 1/1/31 | | 5,000,000 | 5,695,300 |
| Series 2018 A: | | | |
| 5% 1/1/37 | | 1,200,000 | 1,496,544 |
| 5% 1/1/38 | | 1,450,000 | 1,801,335 |
| 5% 1/1/39 | | 1,190,000 | 1,473,625 |
| 5% 1/1/40 | | 1,250,000 | 1,543,038 |
|
| TOTAL PENNSYLVANIA, NEW JERSEY | | | 24,169,493 |
|
| TOTAL MUNICIPAL BONDS | | | |
| (Cost $529,695,366) | | | 572,292,363 |
|
| Municipal Notes - 1.9% | | | |
| New Jersey - 1.9% | | | |
| New Jersey Econ. Dev. Auth. Poll. Cont. Rev. (Exxon Mobil Corp. Proj.) Series 1989, 0.4% 12/2/19, VRDN (c) | | 1,400,000 | $1,400,000 |
| New Jersey Health Care Facilities Fing. Auth. Rev. (Virtua Health Proj.) Series 2009 B, 0.45% 12/2/19, LOC JPMorgan Chase Bank, VRDN (c) | | 1,700,000 | 1,700,000 |
| Rutgers State Univ. Rev. Series 2009 G, 1.11% 12/2/19 (Liquidity Facility TD Banknorth, NA), VRDN (c) | | 7,750,000 | 7,750,000 |
| TOTAL MUNICIPAL NOTES | | | |
| (Cost $10,850,000) | | | 10,850,000 |
| TOTAL INVESTMENT IN SECURITIES - 99.6% | | | |
| (Cost $540,545,366) | | | 583,142,363 |
| NET OTHER ASSETS (LIABILITIES) - 0.4% | | | 2,521,725 |
| NET ASSETS - 100% | | | $585,664,088 |
Security Type Abbreviations
VRDN – VARIABLE RATE DEMAND NOTE (A debt instrument that is payable upon demand, either daily, weekly or monthly)
Legend
(a) Private activity obligations whose interest is subject to the federal alternative minimum tax for individuals.
(b) Security exempt from registration under Rule 144A of the Securities Act of 1933. These securities may be resold in transactions exempt from registration, normally to qualified institutional buyers. At the end of the period, the value of these securities amounted to $1,001,470 or 0.2% of net assets.
(c) Coupon rates for floating and adjustable rate securities reflect the rates in effect at period end.
(d) Security or a portion of the security purchased on a delayed delivery or when-issued basis.
Investment Valuation
All investments are categorized as Level 2 under the Fair Value Hierarchy. The inputs or methodology used for valuing securities may not be an indication of the risk associated with investing in those securities. For more information on valuation inputs please refer to the Investment Valuation section in the accompanying Notes to Financial Statements.
Other Information
The distribution of municipal securities by revenue source, as a percentage of total Net Assets, is as follows (Unaudited):
| General Obligations | 29.8% |
| Health Care | 21.7% |
| Transportation | 21.3% |
| Education | 14.9% |
| Others* (Individually Less Than 5%) | 12.3% |
| | 100.0% |
* Includes net other assets
See accompanying notes which are an integral part of the financial statements.
Fidelity® New Jersey Municipal Income Fund
Financial Statements
Statement of Assets and Liabilities
| | | November 30, 2019 |
| Assets | | |
Investment in securities, at value — See accompanying schedule:
Unaffiliated issuers (cost $540,545,366) | | $583,142,363 |
| Cash | | 708,857 |
| Receivable for fund shares sold | | 690,754 |
| Interest receivable | | 7,953,680 |
| Prepaid expenses | | 846 |
| Other receivables | | 1,453 |
| Total assets | | 592,497,953 |
| Liabilities | | |
| Payable for investments purchased on a delayed delivery basis | $5,724,192 | |
| Payable for fund shares redeemed | 439,172 | |
| Distributions payable | 405,794 | |
| Accrued management fee | 170,284 | |
| Other affiliated payables | 47,674 | |
| Other payables and accrued expenses | 46,749 | |
| Total liabilities | | 6,833,865 |
| Net Assets | | $585,664,088 |
| Net Assets consist of: | | |
| Paid in capital | | $540,016,102 |
| Total accumulated earnings (loss) | | 45,647,986 |
| Net Assets | | $585,664,088 |
| Net Asset Value, offering price and redemption price per share ($585,664,088 ÷ 47,501,561 shares) | | $12.33 |
See accompanying notes which are an integral part of the financial statements.
Statement of Operations
| | | Year ended November 30, 2019 |
| Investment Income | | |
| Interest | | $17,556,963 |
| Expenses | | |
| Management fee | $1,926,906 | |
| Transfer agent fees | 403,463 | |
| Accounting fees and expenses | 136,464 | |
| Custodian fees and expenses | 3,987 | |
| Independent trustees' fees and expenses | 2,205 | |
| Registration fees | 33,663 | |
| Audit | 54,279 | |
| Legal | 798 | |
| Miscellaneous | 3,431 | |
| Total expenses before reductions | 2,565,196 | |
| Expense reductions | (5,548) | |
| Total expenses after reductions | | 2,559,648 |
| Net investment income (loss) | | 14,997,315 |
| Realized and Unrealized Gain (Loss) | | |
| Net realized gain (loss) on: | | |
| Investment securities: | | |
| Unaffiliated issuers | | 3,292,855 |
| Total net realized gain (loss) | | 3,292,855 |
| Change in net unrealized appreciation (depreciation) on investment securities | | 30,714,587 |
| Net gain (loss) | | 34,007,442 |
| Net increase (decrease) in net assets resulting from operations | | $49,004,757 |
See accompanying notes which are an integral part of the financial statements.
Statement of Changes in Net Assets
| | Year ended November 30, 2019 | Year ended November 30, 2018 |
| Increase (Decrease) in Net Assets | | |
| Operations | �� | |
| Net investment income (loss) | $14,997,315 | $15,085,538 |
| Net realized gain (loss) | 3,292,855 | 184,281 |
| Change in net unrealized appreciation (depreciation) | 30,714,587 | (9,589,588) |
| Net increase (decrease) in net assets resulting from operations | 49,004,757 | 5,680,231 |
| Distributions to shareholders | (15,123,867) | (17,903,013) |
| Share transactions | | |
| Proceeds from sales of shares | 104,846,312 | 74,463,398 |
| Reinvestment of distributions | 10,083,932 | 12,286,939 |
| Cost of shares redeemed | (73,791,683) | (86,285,147) |
| Net increase (decrease) in net assets resulting from share transactions | 41,138,561 | 465,190 |
| Total increase (decrease) in net assets | 75,019,451 | (11,757,592) |
| Net Assets | | |
| Beginning of period | 510,644,637 | 522,402,229 |
| End of period | $585,664,088 | $510,644,637 |
| Other Information | | |
| Shares | | |
| Sold | 8,644,852 | 6,402,875 |
| Issued in reinvestment of distributions | 831,866 | 1,052,925 |
| Redeemed | (6,141,680) | (7,416,049) |
| Net increase (decrease) | 3,335,038 | 39,751 |
See accompanying notes which are an integral part of the financial statements.
Financial Highlights
Fidelity New Jersey Municipal Income Fund
| | | | | | |
| Years ended November 30, | 2019 | 2018 | 2017 | 2016 | 2015 |
| Selected Per–Share Data | | | | | |
| Net asset value, beginning of period | $11.56 | $11.84 | $11.55 | $11.79 | $12.00 |
| Income from Investment Operations | | | | | |
| Net investment income (loss)A | .333 | .343 | .350 | .360 | .373 |
| Net realized and unrealized gain (loss) | .773 | (.216) | .379 | (.219) | (.189) |
| Total from investment operations | 1.106 | .127 | .729 | .141 | .184 |
| Distributions from net investment income | (.333) | (.343) | (.349) | (.364) | (.372) |
| Distributions from net realized gain | (.003) | (.064) | (.090) | (.017) | (.022) |
| Total distributions | (.336) | (.407) | (.439) | (.381) | (.394) |
| Redemption fees added to paid in capitalA | – | – | –B | –B | –B |
| Net asset value, end of period | $12.33 | $11.56 | $11.84 | $11.55 | $11.79 |
| Total ReturnC | 9.66% | 1.10% | 6.44% | 1.08% | 1.56% |
| Ratios to Average Net AssetsD | | | | | |
| Expenses before reductions | .47% | .47% | .47% | .47% | .48% |
| Expenses net of fee waivers, if any | .47% | .47% | .47% | .47% | .48% |
| Expenses net of all reductions | .47% | .47% | .47% | .47% | .48% |
| Net investment income (loss) | 2.75% | 2.95% | 2.99% | 2.98% | 3.15% |
| Supplemental Data | | | | | |
| Net assets, end of period (000 omitted) | $585,664 | $510,645 | $522,402 | $531,738 | $545,659 |
| Portfolio turnover rate | 12% | 18% | 17% | 15% | 7% |
A Calculated based on average shares outstanding during the period.
B Amount represents less than $.0005 per share.
C Total returns would have been lower if certain expenses had not been reduced during the applicable periods shown.
D Expense ratios reflect operating expenses of the Fund. Expenses before reductions do not reflect amounts reimbursed by the investment adviser or reductions from expense offset arrangements and do not represent the amount paid by the Fund during periods when reimbursements or reductions occur. Expenses net of fee waivers reflect expenses after reimbursement by the investment adviser but prior to reductions from expense offset arrangements. Expenses net of all reductions represent the net expenses paid by the Fund.
See accompanying notes which are an integral part of the financial statements.
Fidelity® New Jersey Municipal Money Market Fund
Investment Summary/Performance (Unaudited)
Effective Maturity Diversification
| Days | % of fund's investments 11/30/19 |
| 1 - 7 | 66.0 |
| 8 - 30 | 6.9 |
| 31 - 60 | 2.7 |
| 61 - 90 | 3.0 |
| 91 - 180 | 9.3 |
| > 180 | 12.1 |
Effective maturity is determined in accordance with the requirements of Rule 2a-7 under the Investment Company Act of 1940.
Asset Allocation (% of fund's net assets)
| As of November 30, 2019 |
| | Variable Rate Demand Notes (VRDNs) | 30.0% |
| | Tender Option Bond | 34.7% |
| | Other Municipal Security | 29.4% |
| | Investment Companies | 6.8% |
| | Net Other Assets (Liabilities)* | (0.9)% |

* Net Other Assets (Liabilities) are not included in the pie chart
Current 7-Day Yields
| | 11/29/19 |
| Fidelity® New Jersey Municipal Money Market Fund | 0.70% |
Yield refers to the income paid by the Fund over a given period. Yield for money market funds is usually for seven-day periods, as it is here, though it is expressed as an annual percentage rate. Past performance is no guarantee of future results. Yield will vary and it's possible to lose money investing in the Fund.
Fidelity® New Jersey Municipal Money Market Fund
Schedule of Investments November 30, 2019
Showing Percentage of Net Assets
| Variable Rate Demand Note - 30.0% | | | |
| | | Principal Amount | Value |
| Alabama - 0.5% | | | |
| Decatur Indl. Dev. Board Exempt Facilities Rev. (Nucor Steel Decatur LLC Proj.) Series 2003 A, 1.25% 12/6/19, VRDN (a)(b) | | $2,600,000 | $2,600,000 |
| Arkansas - 0.3% | | | |
| Blytheville Indl. Dev. Rev. (Nucor Corp. Proj.) Series 2002, 1.25% 12/6/19, VRDN (a)(b) | | 1,800,000 | 1,800,000 |
| Delaware - 0.1% | | | |
| Delaware Econ. Dev. Auth. Rev. (Delmarva Pwr. & Lt. Co. Proj.) Series 1999 B, 1.23% 12/6/19, VRDN (a)(b) | | 500,000 | 500,000 |
| Indiana - 0.2% | | | |
| Indiana Dev. Fin. Auth. Envir. Rev. (PSI Energy Proj.) Series 2003 A, 1.22% 12/6/19, VRDN (a)(b) | | 1,200,000 | 1,200,000 |
| Kansas - 0.5% | | | |
| Burlington Envir. Impt. Rev. (Kansas City Pwr. and Lt. Co. Proj.): | | | |
| Series 2007 A, 1.3% 12/6/19, VRDN (b) | | 800,000 | 800,000 |
| Series 2007 B, 1.3% 12/6/19, VRDN (b) | | 300,000 | 300,000 |
| St. Mary's Kansas Poll. Cont. Rev. (Kansas Gas and Elec. Co. Proj.) Series 1994, 1.28% 12/6/19, VRDN (b) | | 1,600,000 | 1,600,000 |
| Wamego Kansas Poll. Cont. Rfdg. Rev. (Kansas Gas & Elec. Co. Proj.) Series 1994, 1.28% 12/6/19, VRDN (b) | | 200,000 | 200,000 |
| | | | 2,900,000 |
| Louisiana - 0.1% | | | |
| Saint James Parish Gen. Oblig. (Nucor Steel Louisiana LLC Proj.): | | | |
| Series 2010 A1, 1.2% 12/6/19, VRDN (b) | | 200,000 | 200,000 |
| Series 2010 B1, 1.22% 12/6/19, VRDN (b) | | 400,000 | 400,000 |
| | | | 600,000 |
| Nebraska - 0.3% | | | |
| Stanton County Indl. Dev. Rev.: | | | |
| (Nucor Corp. Proj.) Series 1996, 1.25% 12/6/19, VRDN (a)(b) | | 1,500,000 | 1,500,000 |
| Series 1998, 1.25% 12/6/19, VRDN (a)(b) | | 100,000 | 100,000 |
| | | | 1,600,000 |
| New Jersey - 22.5% | | | |
| New Jersey Econ. Dev. Auth. Rev.: | | | |
| (Bayshore Health Ctr. Proj.) Series 1998 A, 1.14% 12/6/19, LOC JPMorgan Chase Bank, VRDN (b) | | 7,320,000 | 7,320,000 |
| (Cooper Health Sys. Proj.) Series 2008 A, 1.12% 12/6/19, LOC TD Banknorth, NA, VRDN (b) | | 15,800,000 | 15,800,000 |
| New Jersey Health Care Facilities Fing. Auth. Rev.: | | | |
| (AHS Hosp. Corp. Proj.): | | | |
| Series 2008 B, 1% 12/6/19, LOC Bank of America NA, VRDN (b) | | 19,180,000 | 19,180,000 |
| Series 2008 C, 1% 12/6/19, LOC JPMorgan Chase Bank, VRDN (b) | | 7,300,000 | 7,300,000 |
| (Meridian Health Sys. Proj.) Series 2003 A, 1% 12/6/19, LOC JPMorgan Chase Bank, VRDN (b) | | 23,750,000 | 23,750,000 |
| (Meridian Nursing and Rehab. at Red Bank, Inc. Proj.) Series 2004 A3, 1.12% 12/6/19, LOC Wells Fargo Bank NA, VRDN (b) | | 4,275,000 | 4,275,000 |
| (Virtua Health Proj.): | | | |
| Series 2009 D, 0.7% 12/6/19, LOC TD Banknorth, NA, VRDN (b) | | 16,970,000 | 16,970,000 |
| Series 2009 E, 0.7% 12/6/19, LOC TD Banknorth, NA, VRDN (b) | | 2,130,000 | 2,130,000 |
| New Jersey Hsg. & Mtg. Fin. Agcy. Multi-family Rev. Series 2013 5, 1.16% 12/6/19, LOC Citibank NA, VRDN (a)(b) | | 27,715,000 | 27,715,000 |
| FHLMC Essex County Impt. Auth. Multi-family Hsg. Rev. (Fern Sr. Hsg. Proj.) Series 2010, 1.1% 12/6/19, LOC Freddie Mac, VRDN (b) | | 4,000,000 | 4,000,000 |
| | | | 128,440,000 |
| New York And New Jersey - 5.0% | | | |
| Port Auth. of New York & New Jersey: | | | |
| Series 1991 3, 1.18% 12/30/19, VRDN (a)(b)(c) | | 9,800,000 | 9,800,000 |
| Series 1995 3, 1.18% 12/30/19, VRDN (a)(b)(c) | | 8,400,000 | 8,400,000 |
| Series 1995 4, 1.18% 12/30/19, VRDN (a)(b)(c) | | 10,500,000 | 10,500,000 |
| | | | 28,700,000 |
| North Carolina - 0.2% | | | |
| Hertford County Indl. Facilities Poll. Cont. Fing. Auth. (Nucor Corp. Proj.) Series 2000 A, 1.25% 12/6/19, VRDN (a)(b) | | 1,000,000 | 1,000,000 |
| South Carolina - 0.0% | | | |
| Berkeley County Indl. Dev. Rev. (Nucor Corp. Proj.) Series 1995, 1.25% 12/6/19, VRDN (a)(b) | | 100,000 | 100,000 |
| Tennessee - 0.0% | | | |
| Memphis-Shelby County Indl. Dev. Board Facilities Rev. Series 2007, 1.25% 12/6/19, VRDN (a)(b) | | 50,000 | 50,000 |
| West Virginia - 0.3% | | | |
| West Virginia Econ. Dev. Auth. Solid Waste Disp. Facilities Rev. (Appalachian Pwr. Co.- Mountaineer Proj.) Series 2008 A, 1.21% 12/6/19, VRDN (a)(b) | | 1,900,000 | 1,900,000 |
| TOTAL VARIABLE RATE DEMAND NOTE | | | |
| (Cost $171,390,000) | | | 171,390,000 |
|
| Tender Option Bond - 34.7% | | | |
| California - 0.6% | | | |
| Dignity Health Participating VRDN Series DBE 80 11, 1.32% 12/6/19 (Liquidity Facility Deutsche Bank AG New York Branch) (b)(d)(e) | | 3,200,000 | 3,200,000 |
| Florida - 0.3% | | | |
| Jacksonville Elec. Auth. Elec. Sys. Rev. Participating VRDN Series 2019, 1.4% 1/10/20 (Liquidity Facility Wells Fargo Bank NA) (b)(d)(e) | | 1,500,000 | 1,500,000 |
| Illinois - 0.0% | | | |
| Illinois Gen. Oblig. Participating VRDN Series XM 07 85, 1.22% 12/6/19 (Liquidity Facility Bank of America NA) (b)(d)(e) | | 100,000 | 100,000 |
| New Jersey - 27.2% | | | |
| Essex County Impt. Auth. Proj. Rev. Participating VRDN Series Clipper 09 49, 1.14% 12/6/19 (Liquidity Facility State Street Bank & Trust Co., Boston) (b)(d)(e) | | 13,230,000 | 13,230,000 |
| Hudson County Impt. Auth. Participating VRDN: | | | |
| Series 16 ZF0450, 1.14% 12/6/19 (Liquidity Facility Toronto-Dominion Bank) (b)(d)(e) | | 4,275,000 | 4,275,000 |
| Series Floaters XG 02 22, 1.1% 12/6/19 (Liquidity Facility Bank of America NA) (b)(d)(e) | | 2,460,000 | 2,460,000 |
| New Jersey Econ. Dev. Auth. Lease Rev. Participating VRDN Series Floaters XF 25 25, 1.13% 12/6/19 (Liquidity Facility Barclays Bank PLC) (b)(d)(e) | | 4,000,000 | 4,000,000 |
| New Jersey Econ. Dev. Auth. Natural Gas Facilities Rev. Participating VRDN Series ZF 08 12, 1.14% 12/6/19 (Liquidity Facility Bank of America NA) (a)(b)(d)(e) | | 13,550,000 | 13,550,000 |
| New Jersey Econ. Dev. Auth. Rev. Participating VRDN: | | | |
| Series Floaters 011, 1.25% 1/10/20 (Liquidity Facility Barclays Bank PLC) (b)(d)(e) | | 6,370,000 | 6,370,000 |
| Series Floaters 012, 1.25% 1/10/20 (Liquidity Facility Barclays Bank PLC) (b)(d)(e) | | 6,270,000 | 6,270,000 |
| Series Floaters XF 10 48, 1.13% 12/6/19 (Liquidity Facility Barclays Bank PLC) (b)(d)(e) | | 12,385,000 | 12,385,000 |
| Series Floaters XF 23 93, 1.13% 12/6/19 (Liquidity Facility Barclays Bank PLC) (b)(d)(e) | | 6,000,000 | 6,000,000 |
| Series Floaters XL 00 52, 1.13% 12/6/19 (Liquidity Facility Barclays Bank PLC) (b)(d)(e) | | 3,000,000 | 3,000,000 |
| Series Floaters XX 10 91, 1.13% 12/6/19 (Liquidity Facility Barclays Bank PLC) (b)(d)(e) | | 4,600,000 | 4,600,000 |
| New Jersey Edl. Facilities Auth. Rev. Participating VRDN: | | | |
| Series 15 XF0099, 1.13% 12/6/19 (Liquidity Facility JPMorgan Chase Bank) (b)(d)(e) | | 4,335,000 | 4,335,000 |
| Series 15 XF0149, 1.07% 12/6/19 (Liquidity Facility Bank of America NA) (b)(d)(e) | | 2,670,000 | 2,670,000 |
| New Jersey Higher Ed. Student Assistance Auth. Student Ln. Rev. Participating VRDN: | | | |
| Series Floaters XG 01 78, 1.14% 12/6/19 (Liquidity Facility Bank of America NA) (a)(b)(d)(e) | | 9,500,000 | 9,500,000 |
| Series XL 01 15, 1.17% 12/6/19 (Liquidity Facility Barclays Bank PLC) (a)(b)(d)(e) | | 2,250,000 | 2,250,000 |
| New Jersey Hsg. & Mtg. Fin. Agcy. Rev. Participating VRDN: | | | |
| Series Floaters XF 27 97, 1.1% 12/6/19 (Liquidity Facility Morgan Stanley Bank, West Valley City Utah) (b)(d)(e) | | 3,475,000 | 3,475,000 |
| Series Floaters XG 02 28, 1.11% 12/6/19 (Liquidity Facility Royal Bank of Canada) (b)(d)(e) | | 2,030,000 | 2,030,000 |
| New Jersey Trans. Trust Fund Auth. Participating VRDN: | | | |
| Series Floaters XF 23 70, 1.13% 12/6/19 (Liquidity Facility Barclays Bank PLC) (b)(d)(e) | | 10,315,000 | 10,315,000 |
| Series Floaters XG 02 05, 1.13% 12/6/19 (Liquidity Facility Barclays Bank PLC) (b)(d)(e) | | 3,000,000 | 3,000,000 |
| Series Floaters XG 02 24, 1.13% 12/6/19 (Liquidity Facility Bank of America NA) (b)(d)(e) | | 7,100,000 | 7,100,000 |
| Series Floaters XX 10 93, 1.13% 12/6/19 (Liquidity Facility Barclays Bank PLC) (b)(d)(e) | | 5,400,000 | 5,400,000 |
| Series XG 02 58, 1.14% 12/6/19 (Liquidity Facility Barclays Bank PLC) (b)(d)(e) | | 5,060,000 | 5,060,000 |
| Union County Impt. Auth. Participating VRDN Series XF 10 19, 1.13% 12/6/19 (Liquidity Facility Barclays Bank PLC) (b)(d)(e) | | 600,000 | 600,000 |
| Union County Impt. Auth. Rev. Participating VRDN: | | | |
| Series Floaters XG 02 21, 1.1% 12/6/19 (Liquidity Facility Bank of America NA) (b)(d)(e) | | 800,000 | 800,000 |
| Series XG 00 57, 1.2% 12/6/19 (Liquidity Facility Deutsche Bank AG New York Branch) (b)(d)(e) | | 5,960,000 | 5,960,000 |
| Union County Util. Auth. Solid Waste Facilities Lease Rev. Participating VRDN: | | | |
| Series Floaters ZF 24 78, 1.1% 12/6/19 (Liquidity Facility Citibank NA) (b)(d)(e) | | 1,900,000 | 1,900,000 |
| Series ZF 24 79, 1.1% 12/6/19 (Liquidity Facility Citibank NA) (b)(d)(e) | | 1,300,000 | 1,300,000 |
| Union County Utils. Resources Auth. Participating VRDN Series 16 ZM0165, 1.17% 12/6/19 (Liquidity Facility Royal Bank of Canada) (a)(b)(d)(e) | | 13,140,000 | 13,140,000 |
| | | | 154,975,000 |
| New York And New Jersey - 6.4% | | | |
| Port Auth. of New York & New Jersey Participating VRDN: | | | |
| Series 15 ZF0203, 1.18% 12/6/19 (Liquidity Facility JPMorgan Chase Bank) (a)(b)(d)(e) | | 1,675,000 | 1,675,000 |
| Series 16 XF0407, 1.18% 12/6/19 (Liquidity Facility JPMorgan Chase Bank) (a)(b)(d)(e) | | 6,170,000 | 6,170,000 |
| Series 16 XF2211, 1.13% 12/6/19 (Liquidity Facility Morgan Stanley Bank, West Valley City Utah) (b)(d)(e) | | 1,000,000 | 1,000,000 |
| Series 16 ZF0367, 1.18% 12/6/19 (Liquidity Facility JPMorgan Chase Bank) (a)(b)(d)(e) | | 7,155,000 | 7,155,000 |
| Series 16 ZM0160, 1.14% 12/6/19 (Liquidity Facility Royal Bank of Canada) (a)(b)(d)(e) | | 3,470,000 | 3,470,000 |
| Series DB 8033, 1.25% 12/6/19 (Liquidity Facility Deutsche Bank AG New York Branch) (b)(d)(e) | | 1,300,000 | 1,300,000 |
| Series Floaters XF 06 83, 1.17% 12/6/19 (Liquidity Facility Toronto-Dominion Bank) (a)(b)(d)(e) | | 600,000 | 600,000 |
| Series Floaters XF 06 97, 1.13% 12/6/19 (Liquidity Facility Bank of America NA) (b)(d)(e) | | 1,000,000 | 1,000,000 |
| Series Floaters XF 24 88, 1.15% 12/6/19 (Liquidity Facility Citibank NA) (a)(b)(d)(e) | | 800,000 | 800,000 |
| Series Floaters XM 06 16, 1.15% 12/6/19 (Liquidity Facility Citibank NA) (a)(b)(d)(e) | | 4,800,000 | 4,800,000 |
| Series Floaters YX 10 34, 1.18% 12/6/19 (Liquidity Facility Barclays Bank PLC) (a)(b)(d)(e) | | 780,000 | 780,000 |
| Series Floaters ZF 02 69, 1.17% 12/6/19 (Liquidity Facility Toronto-Dominion Bank) (a)(b)(d)(e) | | 100,000 | 100,000 |
| Series MS 3321, 1.13% 12/6/19 (Liquidity Facility Cr. Suisse AG) (a)(b)(d)(e) | | 3,305,000 | 3,305,000 |
| Series ROC 14086, 1.15% 12/6/19 (Liquidity Facility Citibank NA) (a)(b)(d)(e) | | 2,160,000 | 2,160,000 |
| Series XF 08 08, 1.18% 12/6/19 (Liquidity Facility JPMorgan Chase Bank) (a)(b)(d)(e) | | 600,000 | 600,000 |
| Series XL 01 10, 1.14% 12/6/19 (Liquidity Facility Royal Bank of Canada) (a)(b)(d)(e) | | 1,600,000 | 1,600,000 |
| | | | 36,515,000 |
| Pennsylvania - 0.0% | | | |
| Pennsylvania Tpk. Commission Tpk. Rev. Participating VRDN Series DBE 8032, 1.35% 12/6/19 (Liquidity Facility Deutsche Bank AG New York Branch) (b)(d)(e) | | 200,000 | 200,000 |
| Texas - 0.1% | | | |
| Brazos County Health Facilities Dev. Corp. Participating VRDN Series BAML 50 21, 1.23% 12/6/19 (Liquidity Facility Bank of America NA) (b)(d)(e) | | 300,000 | 300,000 |
| Utah - 0.1% | | | |
| Salt Lake City Arpt. Rev. Participating VRDN Series DBE 8034, 1.35% 12/6/19 (Liquidity Facility Deutsche Bank AG New York Branch) (a)(b)(d)(e) | | 800,000 | 800,000 |
| Washington - 0.0% | | | |
| Port of Seattle Rev. Participating VRDN Series XF 28 28, 1.2% 12/6/19 (Liquidity Facility Cr. Suisse AG) (a)(b)(d)(e) | | 200,000 | 200,000 |
| TOTAL TENDER OPTION BOND | | | |
| (Cost $197,790,000) | | | 197,790,000 |
|
| Other Municipal Security - 29.4% | | | |
| Guam - 0.3% | | | |
| Guam Gov't. Ltd. Oblig. Rev. Bonds Series 2009 A, 5.625% 12/1/19 (Pre-Refunded to 12/1/19 @ 100) | | 1,565,000 | 1,565,000 |
| Florida - 0.9% | | | |
| Florida Dev. Fin. Corp. Surface T Bonds (Virgin Trains U.S.A. Passenger Rail Proj.) Series 2019 B, 1.9%, tender 3/17/20 (a)(b) | | 5,400,000 | 5,400,034 |
| Michigan - 0.0% | | | |
| Kent Hosp. Fin. Auth. Hosp. Facilities Rev. Bonds (Spectrum Health Sys. Proj.) Series 2015 A, SIFMA Municipal Swap Index + 0.250% 1.35%, tender 6/26/20 (b)(f) | | 100,000 | 100,000 |
| New Hampshire - 0.4% | | | |
| New Hampshire Bus. Fin. Auth. Poll. Cont. Rev. Bonds Series A1, 1.25% tender 12/4/19, CP mode (a) | | 2,000,000 | 2,000,000 |
| New Jersey - 26.5% | | | |
| Avalon Borough Gen. Oblig. BAN Series 2019, 3% 2/14/20 | | 6,865,000 | 6,879,244 |
| Beachwood BAN Series 2019, 3% 3/5/20 | | 5,635,000 | 5,651,367 |
| Bergen County Gen. Oblig. BAN Series 2018 B, 3.25% 12/12/19 | | 3,700,000 | 3,701,411 |
| Bloomfield Township Gen. Oblig. BAN Series 2019, 2.75% 4/7/20 | | 11,730,000 | 11,775,578 |
| Borough of Maywood BAN Series 2019, 2.25% 11/6/20 | | 1,810,000 | 1,825,142 |
| Borough of Roseland BAN Series 2019, 3% 5/1/20 | | 3,940,597 | 3,960,212 |
| Burlington County Bridge Commission Lease Rev. BAN (Governmental Leasing Prog.): | | | |
| Series 2019 B, 2.75% 4/17/20 | | 2,225,000 | 2,233,882 |
| Series 2019 C1, 3% 11/20/20 | | 3,000,000 | 3,050,274 |
| Closter Gen. Oblig. BAN Series 2019, 2.25% 6/5/20 | | 3,000,000 | 3,009,191 |
| Cranford Township Gen. Oblig. BAN Series 2019: | | | |
| 2.25% 6/26/20 | | 2,000,000 | 2,008,171 |
| 2.25% 10/23/20 | | 3,600,000 | 3,630,478 |
| Denville Township BAN Series 2019, 2.25% 10/9/20 | | 3,195,500 | 3,218,947 |
| East Hanover Township BAN Series 2019, 2.25% 8/14/20 | | 5,339,763 | 5,372,661 |
| Elizabeth Gen. Oblig. BAN Series 2019, 2.75% 4/3/20 | | 1,800,000 | 1,806,476 |
| Evesham Township BAN Series 2019 A, 2.75% 5/7/20 | | 4,400,000 | 4,418,843 |
| Fairfield Township BAN: | | | |
| Series 2018, 3.5% 12/3/19 | | 4,297,631 | 4,297,909 |
| Series 2019: | | | |
| 2% 9/30/20 | | 4,600,000 | 4,627,876 |
| 2.25% 2/14/20 | | 4,800,000 | 4,806,881 |
| Fairview Gen. Oblig. BAN Series 2019, 2% 8/28/20 | | 2,904,000 | 2,918,853 |
| Fort Lee Gen. Oblig. BAN Series 2019 A, 2.25% 11/6/20 | | 1,000,000 | 1,009,193 |
| Harrison Township BAN Series 2019 A, 2.75% 5/27/20 | | 1,700,000 | 1,708,614 |
| Hasbrouck Heights Board of Ed. BAN Series 2019, 2.25% 7/10/20 | | 3,525,000 | 3,539,512 |
| Hoboken Gen. Oblig. BAN Series 2019 A, 3% 3/5/20 | | 3,215,000 | 3,223,594 |
| Hopatcong Borough Gen. Oblig. BAN Series 2019, 2.5% 7/24/20 | | 3,024,940 | 3,044,348 |
| Hudson County Gen. Oblig. BAN: | | | |
| Series 2018, 4% 12/10/19 | | 7,250,000 | 7,254,278 |
| Series 2019, 2% 12/8/20 (g) | | 1,900,000 | 1,915,922 |
| Hudson County Impt. Auth. Rev. BAN Series 2019 C, 2.5% 9/18/20 (Hudson County Gen. Oblig. Guaranteed) | | 1,500,000 | 1,512,743 |
| Jackson Township Gen. Oblig. BAN Series 2019 A, 3.25% 2/13/20 | | 4,000,000 | 4,009,610 |
| Medford Township Gen. Oblig. BAN Series 2019 A, 2.25% 10/9/20 | | 4,900,000 | 4,934,677 |
| Montgomery Township Gen. Oblig. BAN Series 2019, 2% 8/28/20 | | 4,000,000 | 4,021,027 |
| New Jersey Econ. Dev. Auth. Rev. Bonds: | | | |
| Series 2011 EE, 5% 9/1/20 (Escrowed to Maturity) | | 105,000 | 107,855 |
| Series II, 5% 3/1/20 (Escrowed to Maturity) | | 350,000 | 353,396 |
| New Jersey Health Care Facilities Fing. Auth. Rev. Bonds Series 2019, 3% 7/1/20 (g) | | 1,405,000 | 1,419,570 |
| New Jersey Higher Ed. Student Assistance Auth. Student Ln. Rev. Bonds Series 2015 1A, 5% 12/1/19 (a) | | 1,750,000 | 1,750,000 |
| Newark City Hsg. Auth. City-Secured Police Facility Rev. Bonds Series 2009, 5.75% 12/1/19 (Pre-Refunded to 12/1/19 @ 100) | | 475,000 | 475,000 |
| Oradell BAN Series 2019, 2.75% 4/3/20 | | 1,600,000 | 1,605,757 |
| Passaic County Impt. Auth. Cnt BAN Series 2019, 3% 8/25/20 (Passaic County Gen. Oblig. Guaranteed) | | 6,175,000 | 6,253,801 |
| Point Pleasant Beach Gen. Oblig. BAN Series 2019, 2.75% 4/16/20 | | 3,400,000 | 3,411,996 |
| Raritan BAN Series 2019, 2.25% 7/9/20 | | 2,300,000 | 2,309,985 |
| Robbinsville Township Gen. Oblig. BAN Series 2019 A, 2.25% 7/22/20 | | 4,500,000 | 4,525,532 |
| Stafford Township Gen. Oblig. BAN Series A, 2.75% 4/29/20 | | 1,515,000 | 1,520,794 |
| Summit Gen. Oblig. BAN Series 2019, 2% 10/23/20 | | 1,800,000 | 1,811,901 |
| Tewksbury Township Gen. Oblig. BAN Series 2019, 2.75% 5/22/20 | | 3,252,000 | 3,268,477 |
| Upper Saddle River Gen. Oblig. BAN Series 2019, 2.5% 2/14/20 | | 700,000 | 701,344 |
| Verona Township Gen. Oblig. BAN Series 2019, 3% 3/6/20 | | 3,400,000 | 3,408,826 |
| Watchung Gen. Oblig. BAN Series 2019, 2.25% 10/30/20 | | 2,800,000 | 2,823,508 |
| | | | 151,114,656 |
| New York And New Jersey - 1.3% | | | |
| Port Auth. of New York & New Jersey: | | | |
| Bonds Series 202, 5% 10/15/20 (a) | | 760,000 | 783,797 |
| Series A, 1.33% 12/5/19, CP (a) | | 5,000,000 | 5,000,000 |
| Series B: | | | |
| 1.3% 2/5/20, CP | | 600,000 | 600,000 |
| 1.35% 1/8/20, CP | | 1,200,000 | 1,200,000 |
| | | | 7,583,797 |
| TOTAL OTHER MUNICIPAL SECURITY | | | |
| (Cost $167,763,487) | | | 167,763,487 |
| | | Shares | Value |
|
| Investment Company - 6.8% | | | |
| Fidelity Municipal Cash Central Fund 1.20% (h)(i) | | | |
| (Cost $38,892,073) | | 38,889,681 | 38,892,073 |
| TOTAL INVESTMENT IN SECURITIES - 100.9% | | | |
| (Cost $575,835,560) | | | 575,835,560 |
| NET OTHER ASSETS (LIABILITIES) - (0.9)% | | | (5,035,484) |
| NET ASSETS - 100% | | | $570,800,076 |
Security Type Abbreviations
BAN – BOND ANTICIPATION NOTE
CP – COMMERCIAL PAPER
VRDN – VARIABLE RATE DEMAND NOTE (A debt instrument that is payable upon demand, either daily, weekly or monthly)
The date shown for securities represents the date when principal payments must be paid, taking into account any call options exercised by the issuer and any permissible maturity shortening features other than interest rate resets.
Legend
(a) Private activity obligations whose interest is subject to the federal alternative minimum tax for individuals.
(b) Coupon rates for floating and adjustable rate securities reflect the rates in effect at period end.
(c) Restricted securities - Investment in securities not registered under the Securities Act of 1933 (excluding 144A issues). At the end of the period, the value of restricted securities (excluding 144A issues) amounted to $28,700,000 or 5.0% of net assets.
(d) Provides evidence of ownership in one or more underlying municipal bonds.
(e) Coupon rates are determined by re-marketing agents based on current market conditions.
(f) Coupon is indexed to a floating interest rate which may be multiplied by a specified factor and/or subject to caps or floors.
(g) Security or a portion of the security purchased on a delayed delivery or when-issued basis.
(h) Information in this report regarding holdings by state and security types does not reflect the holdings of the Fidelity Municipal Cash Central Fund.
(i) Affiliated fund that is available only to investment companies and other accounts managed by Fidelity Investments. The rate quoted is the annualized seven-day yield of the fund at period end. A complete unaudited listing of the fund's holdings as of its most recent quarter end is available upon request. In addition, each Fidelity Central Fund's financial statements, which are not covered by the Fund's Report of Independent Registered Public Accounting Firm, are available on the SEC's website or upon request.
Additional information on each restricted holding is as follows:
| Security | Acquisition Date | Cost |
| Port Auth. of New York & New Jersey Series 1991 3, 1.18% 12/30/19, VRDN | 12/3/03 | $9,800,000 |
| Port Auth. of New York & New Jersey Series 1995 3, 1.18% 12/30/19, VRDN | 9/15/95 | $8,400,000 |
| Port Auth. of New York & New Jersey Series 1995 4, 1.18% 12/30/19, VRDN | 8/9/02 | $10,500,000 |
Affiliated Central Funds
Information regarding fiscal year to date income earned by the Fund from investments in Fidelity Central Funds is as follows:
| Fund | Income earned |
| Fidelity Municipal Cash Central Fund | $725,693 |
| Total | $725,693 |
Amounts in the income column in the above table exclude any capital gain distributions from underlying funds, which are presented in the corresponding line-item in the Statement of Operations, if applicable.
Investment Valuation
All investments are categorized as Level 2 under the Fair Value Hierarchy. The inputs or methodology used for valuing securities may not be an indication of the risk associated with investing in those securities. For more information on valuation inputs please refer to the Investment Valuation section in the accompanying Notes to Financial Statements.
See accompanying notes which are an integral part of the financial statements.
Fidelity® New Jersey Municipal Money Market Fund
Financial Statements
Statement of Assets and Liabilities
| | | November 30, 2019 |
| Assets | | |
Investment in securities, at value — See accompanying schedule:
Unaffiliated issuers (cost $536,943,487) | $536,943,487 | |
| Fidelity Central Funds (cost $38,892,073) | 38,892,073 | |
| Total Investment in Securities (cost $575,835,560) | | $575,835,560 |
| Receivable for fund shares sold | | 502,608 |
| Interest receivable | | 3,339,169 |
| Distributions receivable from Fidelity Central Funds | | 44,990 |
| Prepaid expenses | | 968 |
| Other receivables | | 97 |
| Total assets | | 579,723,392 |
| Liabilities | | |
| Payable to custodian bank | $212,869 | |
| Payable for investments purchased | | |
| Regular delivery | 4,627,876 | |
| Delayed delivery | 3,335,492 | |
| Payable for fund shares redeemed | 458,775 | |
| Distributions payable | 12,809 | |
| Accrued management fee | 169,632 | |
| Other affiliated payables | 68,596 | |
| Other payables and accrued expenses | 37,267 | |
| Total liabilities | | 8,923,316 |
| Net Assets | | $570,800,076 |
| Net Assets consist of: | | |
| Paid in capital | | $570,963,402 |
| Total accumulated earnings (loss) | | (163,326) |
| Net Assets | | $570,800,076 |
| Net Asset Value, offering price and redemption price per share ($570,800,076 ÷ 570,115,457 shares) | | $1.00 |
See accompanying notes which are an integral part of the financial statements.
Statement of Operations
| | | Year ended November 30, 2019 |
| Investment Income | | |
| Interest | | $9,550,293 |
| Income from Fidelity Central Funds | | 725,295 |
| Total income | | 10,275,588 |
| Expenses | | |
| Management fee | $2,269,475 | |
| Transfer agent fees | 822,553 | |
| Accounting fees and expenses | 89,015 | |
| Custodian fees and expenses | 5,191 | |
| Independent trustees' fees and expenses | 2,743 | |
| Registration fees | 30,433 | |
| Audit | 39,398 | |
| Legal | 1,386 | |
| Miscellaneous | 3,122 | |
| Total expenses before reductions | 3,263,316 | |
| Expense reductions | (3,593) | |
| Total expenses after reductions | | 3,259,723 |
| Net investment income (loss) | | 7,015,865 |
| Realized and Unrealized Gain (Loss) | | |
| Net realized gain (loss) on: | | |
| Investment securities: | | |
| Unaffiliated issuers | 87,158 | |
| Capital gain distributions from Fidelity Central Funds | 398 | |
| Total net realized gain (loss) | | 87,556 |
| Net increase in net assets resulting from operations | | $7,103,421 |
See accompanying notes which are an integral part of the financial statements.
Statement of Changes in Net Assets
| | Year ended November 30, 2019 | Year ended November 30, 2018 |
| Increase (Decrease) in Net Assets | | |
| Operations | | |
| Net investment income (loss) | $7,015,865 | $7,574,633 |
| Net realized gain (loss) | 87,556 | (86,259) |
| Net increase in net assets resulting from operations | 7,103,421 | 7,488,374 |
| Distributions to shareholders | (7,255,552) | (8,324,005) |
| Share transactions | | |
| Proceeds from sales of shares | 75,168,944 | 85,953,456 |
| Reinvestment of distributions | 6,981,963 | 8,029,631 |
| Cost of shares redeemed | (227,261,625) | (360,662,368) |
| Net increase (decrease) in net assets and shares resulting from share transactions | (145,110,718) | (266,679,281) |
| Total increase (decrease) in net assets | (145,262,849) | (267,514,912) |
| Net Assets | | |
| Beginning of period | 716,062,925 | 983,577,837 |
| End of period | $570,800,076 | $716,062,925 |
| Other Information | | |
| Shares | | |
| Sold | 75,168,944 | 85,953,456 |
| Issued in reinvestment of distributions | 6,981,963 | 8,029,631 |
| Redeemed | (227,261,625) | (360,662,368) |
| Net increase (decrease) | (145,110,718) | (266,679,281) |
See accompanying notes which are an integral part of the financial statements.
Financial Highlights
Fidelity New Jersey Municipal Money Market Fund
| | | | | | |
| Years ended November 30, | 2019 | 2018 | 2017 | 2016 | 2015 |
| Selected Per–Share Data | | | | | |
| Net asset value, beginning of period | $1.00 | $1.00 | $1.00 | $1.00 | $1.00 |
| Income from Investment Operations | | | | | |
| Net investment income (loss) | .011 | .009 | .004 | .001 | –A |
| Net realized and unrealized gain (loss) | –A | .001 | –A | –A | –A |
| Total from investment operations | .011 | .010 | .004 | .001 | –A |
| Distributions from net investment income | (.011) | (.009) | (.004) | (.001) | –A |
| Distributions from net realized gain | –A | (.001) | – | – | – |
| Total distributions | (.011) | (.010) | (.004) | (.001) | –A |
| Net asset value, end of period | $1.00 | $1.00 | $1.00 | $1.00 | $1.00 |
| Total ReturnB | 1.13% | 1.02% | .37% | .07% | .01% |
| Ratios to Average Net AssetsC,D | | | | | |
| Expenses before reductions | .51% | .51% | .50% | .50% | .51% |
| Expenses net of fee waivers, if any | .51% | .51% | .50% | .32% | .08% |
| Expenses net of all reductions | .51% | .51% | .50% | .32% | .08% |
| Net investment income (loss) | 1.09% | .91% | .36% | .05% | .01% |
| Supplemental Data | | | | | |
| Net assets, end of period (000 omitted) | $570,800 | $716,063 | $983,578 | $1,487,175 | $2,338,651 |
A Amount represents less than $.0005 per share.
B Total returns would have been lower if certain expenses had not been reduced during the applicable periods shown.
C Fees and expenses of any underlying Fidelity Central Funds are not included in the Fund's expense ratio. The Fund indirectly bears its proportionate share of the expenses of any underlying Fidelity Central Funds.
D Expense ratios reflect operating expenses of the Fund. Expenses before reductions do not reflect amounts reimbursed or waived or reductions from expense offset arrangements and do not represent the amount paid by the Fund during periods when reimbursements, waivers or reductions occur. Expenses net of fee waivers reflect expenses after reimbursement and waivers but prior to reductions from expense offset arrangements. Expenses net of all reductions represent the net expenses paid by the Fund.
See accompanying notes which are an integral part of the financial statements.
Notes to Financial Statements
For the period ended November 30, 2019
1. Organization.
Fidelity New Jersey Municipal Income Fund (the Income Fund) is a fund of Fidelity Court Street Trust. Fidelity New Jersey Municipal Money Market Fund (the Money Market Fund) is a fund of Fidelity Court Street Trust II. Each Trust is registered under the Investment Company Act of 1940, as amended (the 1940 Act), as an open-end management investment company. Fidelity Court Street Trust and Fidelity Court Street Trust II (the Trusts) are organized as a Massachusetts business trust and a Delaware statutory trust, respectively. The Income Fund is a non-diversified fund. Each Fund is authorized to issue an unlimited number of shares. Shares of the Money Market Fund are only available for purchase by retail shareholders. Share transactions on the Statement of Changes in Net Assets may contain exchanges between affiliated funds. Each Fund may be affected by economic and political developments in the state of New Jersey.
2. Investments in Fidelity Central Funds.
The Funds may invest in Fidelity Central Funds, which are open-end investment companies generally available only to other investment companies and accounts managed by the investment adviser and its affiliates. The Funds' Schedules of Investments list each of the Fidelity Central Funds held as of period end, if any, as an investment of each Fund, but do not include the underlying holdings of each Fidelity Central Fund. As an Investing Fund, each Fund indirectly bears its proportionate share of the expenses of the underlying Fidelity Central Funds.
The Money Market Central Funds seek preservation of capital and current income and are managed by Fidelity Investments Money Management, Inc. (FIMM), an affiliate of the investment adviser. Annualized expenses of the Money Market Central Funds as of their most recent shareholder report date ranged from less than .005% to .01%.
A complete unaudited list of holdings for each Fidelity Central Fund is available upon request or at the Securities and Exchange Commission (the SEC) website at www.sec.gov. In addition, the financial statements of the Fidelity Central Funds, which are not covered by the Funds' Report of Independent Registered Public Accounting Firm, are available on the SEC website or upon request.
3. Significant Accounting Policies.
Each Fund is an investment company and applies the accounting and reporting guidance of the Financial Accounting Standards Board (FASB) Accounting Standards Codification Topic 946 Financial Services – Investments Companies. The financial statements have been prepared in conformity with accounting principles generally accepted in the United States of America (GAAP), which require management to make certain estimates and assumptions at the date of the financial statements. Actual results could differ from those estimates. Subsequent events, if any, through the date that the financial statements were issued have been evaluated in the preparation of the financial statements. The following summarizes the significant accounting policies of the Funds:
Investment Valuation. Investments are valued as of 4:00 p.m. Eastern time on the last calendar day of the period. The Board of Trustees (the Board) has delegated the day to day responsibility for the valuation of the Income Fund's investments to the Fair Value Committee (the Committee) established by the Income Fund's investment adviser. In accordance with valuation policies and procedures approved by the Board, the Income Fund attempts to obtain prices from one or more third party pricing vendors or brokers to value its investments. When current market prices, quotations or currency exchange rates are not readily available or reliable, investments will be fair valued in good faith by the Committee, in accordance with procedures adopted by the Board. Factors used in determining fair value vary by investment type and may include market or investment specific events, changes in interest rates and credit quality. The frequency with which these procedures are used cannot be predicted and they may be utilized to a significant extent. The Committee oversees the Income Fund's valuation policies and procedures and reports to the Board on the Committee's activities and fair value determinations. The Board monitors the appropriateness of the procedures used in valuing the Income Fund's investments and ratifies the fair value determinations of the Committee.
Each Fund categorizes the inputs to valuation techniques used to value its investments into a disclosure hierarchy consisting of three levels as shown below:
- Level 1 – quoted prices in active markets for identical investments
- Level 2 – other significant observable inputs (including quoted prices for similar investments, interest rates, prepayment speeds, etc.)
- Level 3 – unobservable inputs (including the Fund's own assumptions based on the best information available)
Valuation techniques used to value each Fund's investments by major category are as follows:
For the Income Fund, debt securities, including restricted securities, are valued based on evaluated prices received from third party pricing vendors or from brokers who make markets in such securities. Municipal securities are valued by pricing vendors who utilize matrix pricing which considers yield or price of bonds of comparable quality, coupon, maturity and type or by broker-supplied prices. When independent prices are unavailable or unreliable, debt securities may be valued utilizing pricing methodologies which consider similar factors that would be used by third party pricing vendors. Debt securities are generally categorized as Level 2 in the hierarchy but may be Level 3 depending on the circumstances.
For the Money Market Fund, as permitted by compliance with certain conditions under Rule 2a-7 of the 1940 Act, securities are valued at amortized cost, which approximates fair value. The amortized cost of an instrument is determined by valuing it at its original cost and thereafter amortizing any discount or premium from its face value at a constant rate until maturity. Securities held by a money market fund are generally high quality and liquid; however, they are reflected as Level 2 because the inputs used to determine fair value are not quoted prices in an active market.
For the Income Fund, changes in valuation techniques may result in transfers in or out of an assigned level within the disclosure hierarchy.
Investment Transactions and Income. For financial reporting purposes, the Funds' investment holdings and NAV include trades executed through the end of the last business day of the period. The NAV per share for processing shareholder transactions is calculated as of the close of business of the New York Stock Exchange (NYSE), normally 4:00 p.m. Eastern time and includes trades executed through the end of the prior business day for the Income Fund and trades executed through the end of the current business day for the Money Market Fund. Gains and losses on securities sold are determined on the basis of identified cost. Income and capital gain distributions from Fidelity Central Funds, if any, are recorded on the ex-dividend date. Interest income is accrued as earned and includes coupon interest and amortization of premium and accretion of discount on debt securities as applicable. Debt obligations may be placed on non-accrual status and related interest income may be reduced by ceasing current accruals and writing off interest receivables when the collection of all or a portion of interest has become doubtful based on consistently applied procedures. A debt obligation is removed from non-accrual status when the issuer resumes interest payments or when collectability of interest is reasonably assured.
Expenses. Expenses directly attributable to a fund are charged to that fund. Expenses attributable to more than one fund are allocated among the respective funds on the basis of relative net assets or other appropriate methods. Expense estimates are accrued in the period to which they relate and adjustments are made when actual amounts are known.
Income Tax Information and Distributions to Shareholders. Each year, each Fund intends to qualify as a regulated investment company under Subchapter M of the Internal Revenue Code, including distributing substantially all of its taxable income and realized gains. As a result, no provision for U.S. Federal income taxes is required. As of November 30, 2019, each Fund did not have any unrecognized tax benefits in the financial statements; nor is each Fund aware of any tax positions for which it is reasonably possible that the total amounts of unrecognized tax benefits will significantly change in the next twelve months. Each Fund files a U.S. federal tax return, in addition to state and local tax returns as required. Each Fund's federal income tax returns are subject to examination by the Internal Revenue Service (IRS) for a period of three fiscal years after they are filed. State and local tax returns may be subject to examination for an additional fiscal year depending on the jurisdiction.
Distributions are declared and recorded daily and paid monthly from net investment income. Distributions from realized gains, if any, are declared and recorded on the ex-dividend date. Income and capital gain distributions are determined in accordance with income tax regulations, which may differ from GAAP. In addition, the Income Fund claimed a portion of the payment made to redeeming shareholders as a distribution for income tax purposes.
Capital accounts within the financial statements are adjusted for permanent book-tax differences. These adjustments have no impact on net assets or the results of operations. Capital accounts are not adjusted for temporary book-tax differences which will reverse in a subsequent period.
Book-tax differences are primarily due to the short-term gain distributions from the Fidelity Central Funds, market discount and capital loss carryforwards.
The Funds purchase municipal securities whose interest, in the opinion of the issuer, is free from federal income tax. There is no assurance that the Internal Revenue Service (IRS) will agree with this opinion. In the event the IRS determines that the issuer does not comply with relevant tax requirements, interest payments from a security could become federally taxable, possibly retroactively to the date the security was issued.
As of period end, the cost and unrealized appreciation (depreciation) in securities, and derivatives if applicable, for federal income tax purposes were as follows for each Fund:
| | Tax cost | Gross unrealized appreciation | Gross unrealized depreciation | Net unrealized appreciation (depreciation) |
| Fidelity New Jersey Municipal Income Fund | $540,552,790 | $42,977,066 | $(387,493) | $42,589,573 |
| Fidelity New Jersey Municipal Money Market Fund | 575,835,560 | – | – | – |
The tax-based components of distributable earnings as of period end were as follows for each Fund:
| | Undistributed ordinary income | Undistributed long-term capital gain | Capital loss carryforward | Net unrealized appreciation (depreciation) on securities and other investments |
| Fidelity New Jersey Municipal Income Fund | $414,615 | $2,654,150 | $– | $42,589,573 |
| Fidelity New Jersey Municipal Money Market Fund | – | – | (163,326) | – |
Capital loss carryforwards are only available to offset future capital gains of the Funds to the extent provided by regulations and may be limited. Under the Regulated Investment Company Modernization Act of 2010 (the Act), the Funds are permitted to carry forward capital losses incurred in taxable years beginning after December 22, 2010 for an unlimited period and such capital losses are required to be used prior to any losses that expire. The capital loss carryforward information presented below, including any applicable limitation, is estimated as of fiscal period end and is subject to adjustment.
| | No expiration | | | |
| | Short-term | Long-term | Total no expiration | Total capital loss carryfoward |
| Fidelity New Jersey Municipal Money Market Fund | (163,326) | – | (163,326) | (163,326) |
The tax character of distributions paid was as follows:
| November 30, 2019 | | | | |
| | Tax-Exempt Income | Ordinary Income | Long-term Capital Gains | Total |
| Fidelity New Jersey Municipal Income Fund | $14,993,730 | $86,758 | $43,379 | $15,123,867 |
| Fidelity New Jersey Municipal Money Market Fund | 7,015,567 | 239,985 | – | 7,255,552 |
| November 30, 2018 | | | | |
| | Tax-Exempt Income | Ordinary Income | Long-term Capital Gains | Total |
| Fidelity New Jersey Municipal Income Fund | $15,083,260 | $220,293 | $2,599,460 | $17,903,013 |
| Fidelity New Jersey Municipal Money Market Fund | 7,574,800 | 725,294 | 23,911 | 8,324,005 |
Delayed Delivery Transactions and When-Issued Securities. During the period, certain Funds transacted in securities on a delayed delivery or when-issued basis. Payment and delivery may take place after the customary settlement period for that security. The price of the underlying securities and the date when the securities will be delivered and paid for are fixed at the time the transaction is negotiated. The securities purchased on a delayed delivery or when-issued basis are identified as such in each applicable Fund's Schedule of Investments. Certain Funds may receive compensation for interest forgone in the purchase of a delayed delivery or when-issued security. With respect to purchase commitments, each applicable Fund identifies securities as segregated in its records with a value at least equal to the amount of the commitment. Losses may arise due to changes in the value of the underlying securities or if the counterparty does not perform under the contract's terms, or if the issuer does not issue the securities due to political, economic, or other factors.
Restricted Securities. The Funds may invest in securities that are subject to legal or contractual restrictions on resale. These securities generally may be resold in transactions exempt from registration or to the public if the securities are registered. Disposal of these securities may involve time-consuming negotiations and expense, and prompt sale at an acceptable price may be difficult. Information regarding restricted securities is included at the end of each applicable Fund's Schedule of Investments.
4. Purchases and Sales of Investments.
Purchases and sales of securities, other than short-term securities, for the Income Fund aggregated $98,574,171 and $63,155,090, respectively.
5. Fees and Other Transactions with Affiliates.
Management Fee. Fidelity Management & Research Company (the investment adviser) and its affiliates provide the Funds with investment management related services for which the Funds pay a monthly management fee. The management fee is the sum of an individual fund fee rate and an annualized group fee rate. The individual fund fee rate is applied to each Fund's average net assets. The group fee rate is based upon the average net assets of all the mutual funds advised by the investment adviser, including any mutual funds previously advised by the investment adviser that are currently advised by Fidelity SelectCo, LLC, an affiliate of the investment adviser. The group fee rate decreases as assets under management increase and increases as assets under management decrease. For the reporting period, each Fund's annual management fee rate expressed as a percentage of each Fund's average net assets was as follows:
| | Individual Rate | Group Rate | Total |
| Fidelity New Jersey Municipal Income Fund | .25% | .10% | .35% |
| Fidelity New Jersey Municipal Money Market Fund | .25% | .10% | .35% |
Transfer Agent Fees. Fidelity Investments Institutional Operations Company, Inc. (FIIOC), an affiliate of the investment adviser, is the transfer, dividend disbursing and shareholder servicing agent for the Funds. FIIOC receives account fees and asset-based fees that vary according to account size and type of account. FIIOC pays for typesetting, printing and mailing of shareholder reports, except proxy statements. For the period, the transfer agent fees were equivalent to the following annual rates expressed as a percentage of average net assets:
| Fidelity New Jersey Municipal Income Fund | .07% |
| Fidelity New Jersey Municipal Money Market Fund | .13% |
Accounting Fees. Fidelity Service Company, Inc. (FSC), an affiliate of the investment adviser, maintains each Fund's accounting records. The fee is based on the level of average net assets for each month. For the period, the fees were equivalent to the following annual rates:
| | % of Average Net Assets |
| Fidelity New Jersey Municipal Income Fund | .03 |
| Fidelity New Jersey Municipal Money Market Fund | .01 |
Interfund Trades. The Funds may purchase from or sell securities to other Fidelity Funds under procedures adopted by the Board. The procedures have been designed to ensure these interfund trades are executed in accordance with Rule 17a-7 of the 1940 Act. For the Income Fund, interfund trades are included within the respective purchases and sales amounts shown in the Purchases and Sales of Investments note.
6. Committed Line of Credit.
The Income Fund participates with other funds managed by the investment adviser or an affiliate in a $4.25 billion credit facility (the "line of credit") to be utilized for temporary or emergency purposes to fund shareholder redemptions or for other short-term liquidity purposes. The participating funds have agreed to pay commitment fees on their pro-rata portion of the line of credit, which are reflected in Miscellaneous expenses on the Statement of Operations, and are as follows:
| Fidelity New Jersey Municipal Income Fund | $1,408 |
During the period, the Income Fund did not borrow on this line of credit.
7. Expense Reductions.
Through arrangements with each applicable Fund's custodian, credits realized as a result of certain uninvested cash balances were used to reduce each applicable Fund's expenses. All of the applicable expense reductions are noted in the table below.
| | Custodian credits |
| Fidelity New Jersey Municipal Income Fund | $3,008 |
| Fidelity New Jersey Municipal Money Market Fund | 22 |
In addition, during the period the investment adviser reimbursed and/or waived a portion of operating expenses as follows:
| | Amount |
| Fidelity New Jersey Municipal Income Fund | $2,540 |
| Fidelity New Jersey Municipal Money Market Fund | 3,571 |
8. Other.
The Funds' organizational documents provide former and current trustees and officers with a limited indemnification against liabilities arising in connection with the performance of their duties to the Funds. In the normal course of business, the Funds may also enter into contracts that provide general indemnifications. The Funds' maximum exposure under these arrangements is unknown as this would be dependent on future claims that may be made against the Funds. The risk of material loss from such claims is considered remote.
Effective January 1, 2020, following any required regulatory notices and approvals:
Investment advisers Fidelity Investments Money Management, Inc., FMR Co., Inc., and Fidelity SelectCo, LLC, merged with and into Fidelity Management & Research Company. In connection with the merger transactions, the resulting, merged investment adviser was then redomiciled from Massachusetts to Delaware, changed its corporate structure from a corporation to a limited liability company, and changed its name to "Fidelity Management & Research Company LLC".
Fidelity Investments Institutional Operations Company, Inc. (FIIOC) converted from a Massachusetts corporation to a Massachusetts LLC, and changed its name to "Fidelity Investments Institutional Operations Company LLC".
Report of Independent Registered Public Accounting Firm
To the Board of Trustees of Fidelity Court Street Trust and Fidelity Court Street Trust II and Shareholders of Fidelity New Jersey Municipal Income Fund and Fidelity New Jersey Municipal Money Market Fund:
Opinions on the Financial Statements
We have audited the accompanying statements of assets and liabilities, including the schedules of investments, of Fidelity New Jersey Municipal Income Fund (one of the funds constituting Fidelity Court Street Trust) and Fidelity New Jersey Municipal Money Market Fund (one of the funds constituting Fidelity Court Street Trust II) hereafter collectively referred to as the “Funds”) as of November 30, 2019, the related statements of operations for the year ended November 30, 2019, the statements of changes in net assets for each of the two years in the period ended November 30, 2019, including the related notes, and the financial highlights for each of the five years in the period ended November 30, 2019 (collectively referred to as the “financial statements”). In our opinion, the financial statements present fairly, in all material respects, the financial position of each of the Funds as of November 30, 2019, the results of each of their operations for the year then ended, the changes in each of their net assets for each of the two years in the period ended November 30, 2019 and each of the financial highlights for each of the five years in the period ended November 30, 2019 in conformity with accounting principles generally accepted in the United States of America.
Basis for Opinions
These financial statements are the responsibility of the Funds' management. Our responsibility is to express an opinion on the Funds' financial statements based on our audits. We are a public accounting firm registered with the Public Company Accounting Oversight Board (United States) (PCAOB) and are required to be independent with respect to the Funds in accordance with the U.S. federal securities laws and the applicable rules and regulations of the Securities and Exchange Commission and the PCAOB.
We conducted our audits of these financial statements in accordance with the standards of the PCAOB. Those standards require that we plan and perform the audit to obtain reasonable assurance about whether the financial statements are free of material misstatement, whether due to error or fraud.
Our audits included performing procedures to assess the risks of material misstatement of the financial statements, whether due to error or fraud, and performing procedures that respond to those risks. Such procedures included examining, on a test basis, evidence regarding the amounts and disclosures in the financial statements. Our audits also included evaluating the accounting principles used and significant estimates made by management, as well as evaluating the overall presentation of the financial statements. Our procedures included confirmation of securities owned as of November 30, 2019 by correspondence with the custodian and brokers; when replies were not received from brokers, we performed other auditing procedures. We believe that our audits provide a reasonable basis for our opinions.
PricewaterhouseCoopers LLP
Boston, Massachusetts
January 10, 2020
We have served as the auditor of one or more investment companies in the Fidelity group of funds since 1932.
Trustees and Officers
The Trustees, Members of the Advisory Board (if any), and officers of the trusts and funds, as applicable, are listed below. The Board of Trustees governs each fund and is responsible for protecting the interests of shareholders. The Trustees are experienced executives who meet periodically throughout the year to oversee each fund's activities, review contractual arrangements with companies that provide services to each fund, oversee management of the risks associated with such activities and contractual arrangements, and review each fund's performance. Each of the Trustees oversees 277 funds.
The Trustees hold office without limit in time except that (a) any Trustee may resign; (b) any Trustee may be removed by written instrument, signed by at least two-thirds of the number of Trustees prior to such removal; (c) any Trustee who requests to be retired or who has become incapacitated by illness or injury may be retired by written instrument signed by a majority of the other Trustees; and (d) any Trustee may be removed at any special meeting of shareholders by a two-thirds vote of the outstanding voting securities of the trust. Each Trustee who is not an interested person (as defined in the 1940 Act) of the trust and the funds is referred to herein as an Independent Trustee. Each Independent Trustee shall retire not later than the last day of the calendar year in which his or her 75th birthday occurs. The Independent Trustees may waive this mandatory retirement age policy with respect to individual Trustees. Officers and Advisory Board Members hold office without limit in time, except that any officer or Advisory Board Member may resign or may be removed by a vote of a majority of the Trustees at any regular meeting or any special meeting of the Trustees. Except as indicated, each individual has held the office shown or other offices in the same company for the past five years.
The fund’s Statement of Additional Information (SAI) includes more information about the Trustees. To request a free copy, call Fidelity at 1-800-544-8544.
Experience, Skills, Attributes, and Qualifications of the Trustees. The Governance and Nominating Committee has adopted a statement of policy that describes the experience, qualifications, attributes, and skills that are necessary and desirable for potential Independent Trustee candidates (Statement of Policy). The Board believes that each Trustee satisfied at the time he or she was initially elected or appointed a Trustee, and continues to satisfy, the standards contemplated by the Statement of Policy. The Governance and Nominating Committee also engages professional search firms to help identify potential Independent Trustee candidates who have the experience, qualifications, attributes, and skills consistent with the Statement of Policy. From time to time, additional criteria based on the composition and skills of the current Independent Trustees, as well as experience or skills that may be appropriate in light of future changes to board composition, business conditions, and regulatory or other developments, have also been considered by the professional search firms and the Governance and Nominating Committee. In addition, the Board takes into account the Trustees' commitment and participation in Board and committee meetings, as well as their leadership of standing and ad hoc committees throughout their tenure.
In determining that a particular Trustee was and continues to be qualified to serve as a Trustee, the Board has considered a variety of criteria, none of which, in isolation, was controlling. The Board believes that, collectively, the Trustees have balanced and diverse experience, qualifications, attributes, and skills, which allow the Board to operate effectively in governing each fund and protecting the interests of shareholders. Information about the specific experience, skills, attributes, and qualifications of each Trustee, which in each case led to the Board's conclusion that the Trustee should serve (or continue to serve) as a trustee of the funds, is provided below.
Board Structure and Oversight Function. Abigail P. Johnson is an interested person and currently serves as Chairman. The Trustees have determined that an interested Chairman is appropriate and benefits shareholders because an interested Chairman has a personal and professional stake in the quality and continuity of services provided to the funds. Independent Trustees exercise their informed business judgment to appoint an individual of their choosing to serve as Chairman, regardless of whether the Trustee happens to be independent or a member of management. The Independent Trustees have determined that they can act independently and effectively without having an Independent Trustee serve as Chairman and that a key structural component for assuring that they are in a position to do so is for the Independent Trustees to constitute a substantial majority for the Board. The Independent Trustees also regularly meet in executive session. Arthur E. Johnson serves as Chairman of the Independent Trustees and as such (i) acts as a liaison between the Independent Trustees and management with respect to matters important to the Independent Trustees and (ii) with management prepares agendas for Board meetings.
Fidelity® funds are overseen by different Boards of Trustees. The funds' Board oversees Fidelity's investment-grade bond, money market, asset allocation and certain equity funds, and other Boards oversee Fidelity's high income and other equity funds. The asset allocation funds may invest in Fidelity® funds that are overseen by such other Boards. The use of separate Boards, each with its own committee structure, allows the Trustees of each group of Fidelity® funds to focus on the unique issues of the funds they oversee, including common research, investment, and operational issues. On occasion, the separate Boards establish joint committees to address issues of overlapping consequences for the Fidelity® funds overseen by each Board.
The Trustees operate using a system of committees to facilitate the timely and efficient consideration of all matters of importance to the Trustees, each fund, and fund shareholders and to facilitate compliance with legal and regulatory requirements and oversight of the funds' activities and associated risks. The Board, acting through its committees, has charged FMR and its affiliates with (i) identifying events or circumstances the occurrence of which could have demonstrably adverse effects on the funds' business and/or reputation; (ii) implementing processes and controls to lessen the possibility that such events or circumstances occur or to mitigate the effects of such events or circumstances if they do occur; and (iii) creating and maintaining a system designed to evaluate continuously business and market conditions in order to facilitate the identification and implementation processes described in (i) and (ii) above. Because the day-to-day operations and activities of the funds are carried out by or through FMR, its affiliates, and other service providers, the funds' exposure to risks is mitigated but not eliminated by the processes overseen by the Trustees. While each of the Board's committees has responsibility for overseeing different aspects of the funds' activities, oversight is exercised primarily through the Operations and Audit Committees. In addition, an ad hoc Board committee of Independent Trustees has worked with FMR to enhance the Board's oversight of investment and financial risks, legal and regulatory risks, technology risks, and operational risks, including the development of additional risk reporting to the Board. The Operations Committee also worked and continues to work with FMR to enhance the stress tests required under SEC regulations for money market funds. Appropriate personnel, including but not limited to the funds' Chief Compliance Officer (CCO), FMR's internal auditor, the independent accountants, the funds' Treasurer and portfolio management personnel, make periodic reports to the Board's committees, as appropriate, including an annual review of Fidelity's risk management program for the Fidelity® funds. The responsibilities of each standing committee, including their oversight responsibilities, are described further under "Standing Committees of the Trustees."
Interested Trustees*:
Correspondence intended for a Trustee who is an interested person may be sent to Fidelity Investments, 245 Summer Street, Boston, Massachusetts 02210.
Name, Year of Birth; Principal Occupations and Other Relevant Experience+
Abigail P. Johnson (1961)
Year of Election or Appointment: 2009
Trustee
Chairman of the Board of Trustees
Ms. Johnson also serves as Trustee of other Fidelity® funds. Ms. Johnson serves as Chairman (2016-present), Chief Executive Officer (2014-present), and Director (2007-present) of FMR LLC (diversified financial services company), President of Fidelity Financial Services (2012-present) and President of Personal, Workplace and Institutional Services (2005-present). Ms. Johnson is Chairman and Director of Fidelity Management & Research Company LLC (investment adviser firm, 2011-present). Previously, Ms. Johnson served as Chairman and Director of FMR Co., Inc. (investment adviser firm, 2011-2019), Vice Chairman (2007-2016) and President (2013-2016) of FMR LLC, President and a Director of Fidelity Management & Research Company (2001-2005), a Trustee of other investment companies advised by Fidelity Management & Research Company, Fidelity Investments Money Management, Inc. (investment adviser firm), and FMR Co., Inc. (2001-2005), Senior Vice President of the Fidelity® funds (2001-2005), and managed a number of Fidelity® funds. Ms. Abigail P. Johnson and Mr. Arthur E. Johnson are not related.
Jennifer Toolin McAuliffe (1959)
Year of Election or Appointment: 2016
Trustee
Ms. McAuliffe also serves as Trustee of other Fidelity® funds. Ms. McAuliffe previously served as a Member of the Advisory Board of certain Fidelity® funds (2016) and as Co-Head of Fixed Income of Fidelity Investments Limited (now known as FIL Limited (FIL)) (diversified financial services company). Earlier roles at FIL included Director of Research for FIL’s credit and quantitative teams in London, Hong Kong and Tokyo. Ms. McAuliffe also was the Director of Research for taxable and municipal bonds at Fidelity Investments Money Management, Inc. Ms. McAuliffe is also a director or trustee of several not-for-profit entities.
* Determined to be an “Interested Trustee” by virtue of, among other things, his or her affiliation with the trusts or various entities under common control with FMR.
+ The information includes the Trustee's principal occupation during the last five years and other information relating to the experience, attributes, and skills relevant to the Trustee's qualifications to serve as a Trustee, which led to the conclusion that the Trustee should serve as a Trustee for each fund.
Independent Trustees:
Correspondence intended for an Independent Trustee may be sent to Fidelity Investments, P.O. Box 55235, Boston, Massachusetts 02205-5235.
Name, Year of Birth; Principal Occupations and Other Relevant Experience+
Elizabeth S. Acton (1951)
Year of Election or Appointment: 2015 or 2016
Trustee
Ms. Acton also serves as Trustee of other Fidelity® funds. Prior to her retirement in April 2012, Ms. Acton was Executive Vice President, Finance (2011-2012), Executive Vice President, Chief Financial Officer (2002-2011), and Treasurer (2004-2005) of Comerica Incorporated (financial services). Prior to joining Comerica, Ms. Acton held a variety of positions at Ford Motor Company (1983-2002), including Vice President and Treasurer (2000-2002) and Executive Vice President and Chief Financial Officer of Ford Motor Credit Company (1998-2000). Ms. Acton currently serves as a member of the Board of Directors and Audit and Finance Committees of Beazer Homes USA, Inc. (homebuilding, 2012-present). Previously, Ms. Acton served as a Member of the Advisory Board of certain Fidelity® funds (2013-2016).
Ann E. Dunwoody (1953)
Year of Election or Appointment: 2018
Trustee
General Dunwoody also serves as Trustee of other Fidelity® funds. General Dunwoody (United States Army, Retired) was the first woman in U.S. military history to achieve the rank of four-star general and prior to her retirement in 2012 held a variety of positions within the U.S. Army, including Commanding General, U.S. Army Material Command (2008-2012). She is the President of First to Four LLC (leadership and mentoring services, 2012-present). She also serves as a member of the Board of Directors and Nominating and Corporate Governance Committee of L3 Technologies, Inc. (communication, electronic, sensor, and aerospace systems, 2013-present), Board of Directors and Nomination and Corporate Governance Committees of Kforce Inc. (professional staffing services, 2016-present) and Board of Directors of Automattic Inc. (software engineering, 2018-present). Previously, General Dunwoody served as a Member of the Advisory Board of certain Fidelity® funds (2018), a member of the Board of Directors and Audit and Sustainability and Corporate Responsibility Committees of Republic Services, Inc. (waste collection, disposal and recycling, 2013-2016). Ms. Dunwoody also serves on several boards for non-profit organizations, including as a member of the Board of Directors, Chair of the Nomination and Governance Committee and member of the Audit Committee of Logistics Management Institute (consulting non-profit, 2012-present), a member of the Board of Directors of the Army Historical Foundation (2015-present), a member of the Council of Trustees for the Association of the United States Army (advocacy non-profit, 2013-present) and a member of the Board of Trustees of Florida Institute of Technology (2015-present) and ThanksUSA (military family education non-profit, 2014-present).
John Engler (1948)
Year of Election or Appointment: 2015 or 2016
Trustee
Mr. Engler also serves as Trustee of other Fidelity® funds. He serves on the board of directors for Universal Forest Products (manufacturer and distributor of wood and wood-alternative products, 2003-present) and K12 Inc. (technology-based education company, 2012-present). Previously, Mr. Engler served as interim president of Michigan State University (2018-2019), a Member of the Advisory Board of certain Fidelity® funds (2014-2016), president of the Business Roundtable (2011-2017), a trustee of The Munder Funds (2003-2014), president and CEO of the National Association of Manufacturers (2004-2011), member of the Board of Trustees of the Annie E. Casey Foundation (2004-2015), and as governor of Michigan (1991-2003). He is a past chairman of the National Governors Association.
Robert F. Gartland (1951)
Year of Election or Appointment: 2010
Trustee
Mr. Gartland also serves as Trustee of other Fidelity® funds. Mr. Gartland is Chairman and an investor in Gartland & Mellina Group Corp. (consulting, 2009-present). Previously, Mr. Gartland served as a partner and investor of Vietnam Partners LLC (investments and consulting, 2008-2011). Prior to his retirement, Mr. Gartland held a variety of positions at Morgan Stanley (financial services, 1979-2007), including Managing Director (1987-2007), and Chase Manhattan Bank (1975-1978).
Arthur E. Johnson (1947)
Year of Election or Appointment: 2008
Trustee
Chairman of the Independent Trustees
Mr. Johnson also serves as Trustee of other Fidelity® funds. Mr. Johnson serves as a member of the Board of Directors of Eaton Corporation plc (diversified power management, 2009-present) and Booz Allen Hamilton (management consulting, 2011-present). Prior to his retirement, Mr. Johnson served as Senior Vice President of Corporate Strategic Development of Lockheed Martin Corporation (defense contractor, 1999-2009). Mr. Johnson previously served as Vice Chairman (2015-2018) of the Independent Trustees of certain Fidelity® funds and on the Board of Directors of IKON Office Solutions, Inc. (1999-2008), AGL Resources, Inc. (holding company, 2002-2016), and Delta Airlines (2005-2007). Mr. Arthur E. Johnson is not related to Ms. Abigail P. Johnson.
Michael E. Kenneally (1954)
Year of Election or Appointment: 2009
Trustee
Vice Chairman of the Independent Trustees
Mr. Kenneally also serves as Trustee of other Fidelity® funds. Prior to his retirement, Mr. Kenneally served as Chairman and Global Chief Executive Officer of Credit Suisse Asset Management. Before joining Credit Suisse, he was an Executive Vice President and Chief Investment Officer for Bank of America Corporation. Earlier roles at Bank of America included Director of Research, Senior Portfolio Manager and Research Analyst, and Mr. Kenneally was awarded the Chartered Financial Analyst (CFA) designation in 1991.
Marie L. Knowles (1946)
Year of Election or Appointment: 2001
Trustee
Ms. Knowles also serves as Trustee of other Fidelity® funds. Prior to Ms. Knowles' retirement in June 2000, she served as Executive Vice President and Chief Financial Officer of Atlantic Richfield Company (ARCO) (diversified energy, 1996-2000). From 1993 to 1996, she was a Senior Vice President of ARCO and President of ARCO Transportation Company (pipeline and tanker operations). Ms. Knowles currently serves as a Director and Chairman of the Audit Committee of McKesson Corporation (healthcare service, since 2002). Ms. Knowles is a member of the Board of the Santa Catalina Island Company (real estate, 2009-present). Ms. Knowles is a Member of the Investment Company Institute Board of Governors and a Member of the Governing Council of the Independent Directors Council (2014-present). She also serves as a member of the Advisory Board for the School of Engineering of the University of Southern California. Previously, Ms. Knowles served as a Director of Phelps Dodge Corporation (copper mining and manufacturing, 1994-2007), URS Corporation (engineering and construction, 2000-2003) and America West (airline, 1999-2002). Ms. Knowles previously served as Chairman (2015-2018) and Vice Chairman (2012-2015) of the Independent Trustees of certain Fidelity® funds.
Mark A. Murray (1954)
Year of Election or Appointment: 2016
Trustee
Mr. Murray also serves as Trustee of other Fidelity® funds. Mr. Murray is Vice Chairman (2013-present) of Meijer, Inc. (regional retail chain). Previously, Mr. Murray served as a Member of the Advisory Board of certain Fidelity® funds (2016) and as Co-Chief Executive Officer (2013-2016) and President (2006-2013) of Meijer, Inc. Mr. Murray serves as a member of the Board of Directors and Nuclear Review and Public Policy and Responsibility Committees of DTE Energy Company (diversified energy company, 2009-present). Mr. Murray also serves as a member of the Board of Directors of Spectrum Health (not-for-profit health system, 2015-present). Mr. Murray previously served as President of Grand Valley State University (2001-2006), Treasurer for the State of Michigan (1999-2001), Vice President of Finance and Administration for Michigan State University (1998-1999), and a member of the Board of Directors and Audit Committee and Chairman of the Nominating and Corporate Governance Committee of Universal Forest Products, Inc. (manufacturer and distributor of wood and wood-alternative products, 2004-2016). Mr. Murray is also a director or trustee of many community and professional organizations.
+ The information includes the Trustee's principal occupation during the last five years and other information relating to the experience, attributes, and skills relevant to the Trustee's qualifications to serve as a Trustee, which led to the conclusion that the Trustee should serve as a Trustee for each fund.
Advisory Board Members and Officers:
Correspondence intended for an officer may be sent to Fidelity Investments, 245 Summer Street, Boston, Massachusetts 02210. Officers appear below in alphabetical order.
Name, Year of Birth; Principal Occupation
Elizabeth Paige Baumann (1968)
Year of Election or Appointment: 2017
Anti-Money Laundering (AML) Officer
Ms. Baumann also serves as AML Officer of other funds. She is Chief AML Officer (2012-present) and Senior Vice President (2014-present) of FMR LLC (diversified financial services company) and is an employee of Fidelity Investments. Previously, Ms. Baumann served as AML Officer of the funds (2012-2016), and Vice President (2007-2014) and Deputy Anti-Money Laundering Officer (2007-2012) of FMR LLC.
Craig S. Brown (1977)
Year of Election or Appointment: 2019
Assistant Treasurer
Mr. Brown also serves as Assistant Treasurer of other funds. Mr. Brown is an employee of Fidelity Investments (2013-present).
John J. Burke III (1964)
Year of Election or Appointment: 2018
Chief Financial Officer
Mr. Burke also serves as Chief Financial Officer of other funds. Mr. Burke serves as Head of Investment Operations for Fidelity Fund and Investment Operations (2018-present) and is an employee of Fidelity Investments (1998-present). Previously Mr. Burke served as head of Asset Management Investment Operations (2012-2018).
Jonathan Davis (1968)
Year of Election or Appointment: 2010
Assistant Treasurer
Mr. Davis also serves as Assistant Treasurer of other funds. Mr. Davis serves as Assistant Treasurer of FMR Capital, Inc. (2017-present) and is an employee of Fidelity Investments. Previously, Mr. Davis served as Vice President and Associate General Counsel of FMR LLC (diversified financial services company, 2003-2010).
Laura M. Del Prato (1964)
Year of Election or Appointment: 2018
President and Treasurer
Ms. Del Prato also serves as an officer of other funds. Ms. Del Prato is an employee of Fidelity Investments (2017-present). Prior to joining Fidelity Investments, Ms. Del Prato served as a Managing Director and Treasurer of the JPMorgan Mutual Funds (2014-2017). Prior to JPMorgan, Ms. Del Prato served as a partner at Cohen Fund Audit Services (accounting firm, 2012-2013) and KPMG LLP (accounting firm, 2004-2012).
Colm A. Hogan (1973)
Year of Election or Appointment: 2016
Assistant Treasurer
Mr. Hogan also serves as an officer of other funds. Mr. Hogan serves as Assistant Treasurer of FMR Capital, Inc. (2017-present) and is an employee of Fidelity Investments (2005-present). Previously, Mr. Hogan served as Assistant Treasurer of certain Fidelity® funds (2016-2018).
Cynthia Lo Bessette (1969)
Year of Election or Appointment: 2019
Secretary and Chief Legal Officer (CLO)
Ms. Lo Bessette also serves as Secretary and CLO of other funds. Ms. Lo Bessette serves as CLO, Secretary, and Senior Vice President of Fidelity Management & Research Company LLC (investment adviser firm, 2019-present); and CLO of Fidelity Management & Research (Hong Kong) Limited, FMR Investment Management (UK) Limited, and Fidelity Management & Research (Japan) Limited (investment adviser firms, 2019-present). She is a Senior Vice President and Deputy General Counsel of FMR LLC (diversified financial services company, 2019-present), and is an employee of Fidelity Investments. Previously, Ms. Lo Bessette served as CLO, Secretary, and Senior Vice President of FMR Co., Inc. (investment adviser firm, 2019); Secretary of Fidelity SelectCo, LLC and Fidelity Investments Money Management, Inc. (investment adviser firms, 2019). Prior to joining Fidelity Investments, Ms. Lo Bessette was Executive Vice President, General Counsel (2016-2019) and Senior Vice President, Deputy General Counsel (2015-2016) of OppenheimerFunds (investment management company) and Deputy Chief Legal Officer (2013-2015) of Jennison Associates LLC (investment adviser firm).
Chris Maher (1972)
Year of Election or Appointment: 2013
Assistant Treasurer
Mr. Maher serves as Assistant Treasurer of other funds. Mr. Maher is Vice President of Valuation Oversight, serves as Assistant Treasurer of FMR Capital, Inc. (2017-present), and is an employee of Fidelity Investments. Previously, Mr. Maher served as Vice President of Asset Management Compliance (2013), Vice President of the Program Management Group of FMR (investment adviser firm, 2010-2013), and Vice President of Valuation Oversight (2008-2010).
John B. McGinty, Jr. (1962)
Year of Election or Appointment: 2016
Chief Compliance Officer
Mr. McGinty also serves as Chief Compliance Officer of other funds. Mr. McGinty is Senior Vice President of Asset Management Compliance for Fidelity Investments and is an employee of Fidelity Investments (2016-present). Mr. McGinty previously served as Vice President, Senior Attorney at Eaton Vance Management (investment management firm, 2015-2016), and prior to Eaton Vance as global CCO for all firm operations and registered investment companies at GMO LLC (investment management firm, 2009-2015). Before joining GMO LLC, Mr. McGinty served as Senior Vice President, Deputy General Counsel for Fidelity Investments (2007-2009).
Jason P. Pogorelec (1975)
Year of Election or Appointment: 2015
Assistant Secretary
Mr. Pogorelec also serves as Assistant Secretary of other funds. Mr. Pogorelec serves as Vice President, Associate General Counsel (2010-present) and is an employee of Fidelity Investments (2006-present).
Nancy D. Prior (1967)
Year of Election or Appointment: 2014
Vice President
Ms. Prior also serves as Vice President of other funds. Ms. Prior serves as President of Fixed Income (2014-present), and is an employee of Fidelity Investments (2002-present). Previously, Ms. Prior served as President (2016-2019) and Director (2014-2019) of Fidelity Investments Money Management, Inc. (FIMM) (investment adviser firm), Vice President of Global Asset Allocation Funds (2017-2019); Vice Chairman of FIAM LLC (investment adviser firm, 2014-2018), a Director of FMR Investment Management (UK) Limited (investment adviser firm, 2015-2018), President Multi-Asset Class Strategies of FMR's Global Asset Allocation Division (2017-2018), Vice President of Fidelity's Money Market Funds (2012-2014), and President, Money Market and Short Duration Bond Group of Fidelity Management & Research Company (FMR) (investment adviser firm, 2013-2014).
Stacie M. Smith (1974)
Year of Election or Appointment: 2013
Assistant Treasurer
Ms. Smith also serves as an officer of other funds. Ms. Smith serves as Assistant Treasurer of FMR Capital, Inc. (2017-present), is an employee of Fidelity Investments (2009-present), and has served in other fund officer roles. Prior to joining Fidelity Investments, Ms. Smith served as Senior Audit Manager of Ernst & Young LLP (accounting firm, 1996-2009). Previously, Ms. Smith served as Assistant Treasurer (2013-2019) and Deputy Treasurer (2013-2016) of certain Fidelity® funds.
Marc L. Spector (1972)
Year of Election or Appointment: 2016
Deputy Treasurer
Mr. Spector also serves as an officer of other funds. Mr. Spector serves as Assistant Treasurer of FMR Capital, Inc. (2017-present) and is an employee of Fidelity Investments (2016-present). Prior to joining Fidelity Investments, Mr. Spector served as Director at the Siegfried Group (accounting firm, 2013-2016), and prior to Siegfried Group as audit senior manager at Deloitte & Touche (accounting firm, 2005-2013).
Jim Wegmann (1979)
Year of Election or Appointment: 2019
Assistant Treasurer
Mr. Wegmann also serves as Assistant Treasurer of other funds. Mr. Wegmann is an employee of Fidelity Investments (2011-present).
Shareholder Expense Example
As a shareholder of a Fund, you incur two types of costs: (1) transaction costs and (2) ongoing costs, including management fees and other Fund expenses. This Example is intended to help you understand your ongoing costs (in dollars) of investing in the Funds and to compare these costs with the ongoing costs of investing in other mutual funds.
The Example is based on an investment of $1,000 invested at the beginning of the period and held for the entire period (June 1, 2019 to November 30, 2019).
Actual Expenses
The first line of the accompanying table for each fund provides information about actual account values and actual expenses. You may use the information in this line, together with the amount you invested, to estimate the expenses that you paid over the period. Simply divide your account value by $1,000.00 (for example, an $8,600 account value divided by $1,000.00 = 8.6), then multiply the result by the number in the first line for a fund under the heading entitled "Expenses Paid During Period" to estimate the expenses you paid on your account during this period. In addition, each Fund, as a shareholder in the underlying Fidelity Central Funds, will indirectly bear its pro-rata share of the fees and expenses incurred by the underlying Fidelity Central Funds. These fees and expenses are not included in the Fund's annualized expense ratio used to calculate the expense estimate in the table below.
Hypothetical Example for Comparison Purposes
The second line of the accompanying table for each fund provides information about hypothetical account values and hypothetical expenses based on a fund's actual expense ratio and an assumed rate of return of 5% per year before expenses, which is not the Fund's actual return. The hypothetical account values and expenses may not be used to estimate the actual ending account balance or expenses you paid for the period. You may use this information to compare the ongoing costs of investing in the Fund and other funds. To do so, compare this 5% hypothetical example with the 5% hypothetical examples that appear in the shareholder reports of the other funds. In addition, each Fund, as a shareholder in the underlying Fidelity Central Funds, will indirectly bear its pro-rata share of the fees and expenses incurred by the underlying Fidelity Central Funds. These fees and expenses are not included in the Fund's annualized expense ratio used to calculate the expense estimate in the table below.
Please note that the expenses shown in the table are meant to highlight your ongoing costs only and do not reflect any transaction costs. Therefore, the second line of the table is useful in comparing ongoing costs only, and will not help you determine the relative total costs of owning different funds.
| | Annualized Expense Ratio-A | Beginning
Account Value
June 1, 2019 | Ending
Account Value
November 30, 2019 | Expenses Paid
During Period-B
June 1, 2019
to November 30, 2019 |
| Fidelity New Jersey Municipal Income Fund | .46% | | | |
| Actual | | $1,000.00 | $1,024.90 | $2.34 |
| Hypothetical-C | | $1,000.00 | $1,022.76 | $2.33 |
| Fidelity New Jersey Municipal Money Market Fund | .50% | | | |
| Actual | | $1,000.00 | $1,005.30 | $2.51 |
| Hypothetical-C | | $1,000.00 | $1,022.56 | $2.54 |
A Annualized expense ratio reflects expenses net of applicable fee waivers.
B Expenses are equal to each Fund's annualized expense ratio, multiplied by the average account value over the period, multiplied by 183/ 365 (to reflect the one-half year period).
C 5% return per year before expenses
Distributions (Unaudited)
The Board of Trustees of each fund voted to pay to shareholders of record at the opening of business on record date, the following distributions per share derived from capital gains realized from sales of portfolio securities, and dividends derived from net investment income:
| | Pay Date | Record Date | Capital Gains |
| Fidelity New Jersey Municipal Income Fund | 12/30/19 | 12/27/19 | $0.066 |
|
The funds hereby designate as capital gain dividend the amounts noted below for the taxable year ended November 30, 2019, or, if subsequently determined to be different, the net capital gain of such year.
| Fidelity New Jersey Municipal Income Fund | $2,673,422 |
|
During fiscal year ended 2019, 100% of each Fund's income dividends were free from federal income tax, and 11.12% and 32.55% of Fidelity New Jersey Municipal Income Fund and Fidelity New Jersey Municipal Money Market Fund's income dividends, respectively, were subject to the federal alternative minimum tax.
The funds will notify shareholders in January 2020 of amounts for use in preparing 2019 income tax returns.
Board Approval of Investment Advisory Contracts and Management Fees
Fidelity New Jersey Municipal Income Fund / Fidelity New Jersey Municipal Money Market Fund
Each year, the Board of Trustees, including the Independent Trustees (together, the Board), votes on the renewal of the management contract with Fidelity Management & Research Company (FMR) and the sub-advisory agreements (together, the Advisory Contracts) for each fund. FMR and the sub-advisers are referred to herein as the Investment Advisers. The Board, assisted by the advice of fund counsel and Independent Trustees' counsel, requests and considers a broad range of information relevant to the renewal of the Advisory Contracts throughout the year.
The Board meets regularly and, at each of its meetings, covers an extensive agenda of topics and materials and considers factors that are relevant to its annual consideration of the renewal of each fund's Advisory Contracts, including the services and support provided to each fund and its shareholders. The Board has established four standing committees (Committees) — Operations, Audit, Fair Valuation, and Governance and Nominating — each composed of and chaired by Independent Trustees with varying backgrounds, to which the Board has assigned specific subject matter responsibilities in order to enhance effective decision-making by the Board. The Operations Committee, of which all of the Independent Trustees are members, meets regularly throughout the year and considers, among other matters, information specifically related to the annual consideration of the renewal of each fund's Advisory Contracts. The Board, acting directly and through its Committees, requests and receives information concerning the annual consideration of the renewal of each fund's Advisory Contracts. The Board also meets as needed to review matters specifically related to the Board's annual consideration of the renewal of the Advisory Contracts. Members of the Board may also meet with trustees of other Fidelity funds through joint ad hoc committees to discuss certain matters relevant to all of the Fidelity funds.
At its September 2019 meeting, the Board unanimously determined to renew each fund's Advisory Contracts. In reaching its determination, the Board considered all factors it believed relevant, including (i) the nature, extent, and quality of the services provided to each fund and its shareholders (including the investment performance of each fund); (ii) the competitiveness of each fund's management fee and total expense ratio relative to peer funds; (iii) the total costs of the services provided by and the profits realized by Fidelity from its relationships with each fund; and (iv) the extent to which, if any, economies of scale exist and are realized as each fund grows, and whether any economies of scale are appropriately shared with fund shareholders.
In considering whether to renew the Advisory Contracts for each fund, the Board reached a determination, with the assistance of fund counsel and Independent Trustees' counsel and through the exercise of its business judgment, that the renewal of the Advisory Contracts was in the best interests of each fund and its shareholders and that the compensation payable under the Advisory Contracts was fair and reasonable. The Board's decision to renew the Advisory Contracts was not based on any single factor, but rather was based on a comprehensive consideration of all the information provided to the Board at its meetings throughout the year. The Board, in reaching its determination to renew the Advisory Contracts, was aware that shareholders of each fund have a broad range of investment choices available to them, including a wide choice among funds offered by Fidelity's competitors, and that each fund's shareholders, who have the opportunity to review and weigh the disclosure provided by the fund in its prospectus and other public disclosures, have chosen to invest in that fund, which is part of the Fidelity family of funds.
At its September 2019 meeting, the Board also unanimously determined to approve amended and restated management contracts and sub-advisory agreements (Amended and Restated Contracts) in connection with an upcoming consolidation of certain of Fidelity's advisory businesses. The Board considered that, on or about January 1, 2020, Fidelity Investments Money Management, Inc. (FIMM) expects to merge with and into FMR and, after the merger, FMR expects to redomicile as a Delaware limited liability company. The Board also approved the termination of the sub-advisory agreements with FIMM upon the completion of the merger. The Board noted that references to FMR in the Amended and Restated Contracts would be updated to reflect FMR's new form of organization and domicile and considered that the definition of "group assets" for purposes of the fund's group fee would be modified to avoid double-counting assets once the reorganization is complete. The Board also noted Fidelity's assurance that neither the planned consolidation nor the Amended and Restated Contracts will change the investment processes, the level or nature of services provided, the resources and personnel allocated, trading and compliance operations, or any fees or expenses paid by the funds.
Nature, Extent, and Quality of Services Provided. The Board considered Fidelity's staffing as it relates to the funds, including the backgrounds of investment personnel of Fidelity, and also considered the funds' investment objectives, strategies, and related investment philosophies. The Independent Trustees also had discussions with senior management of Fidelity's investment operations and investment groups. The Board considered the structure of the investment personnel compensation program and whether this structure provides appropriate incentives to act in the best interests of each fund. Additionally, the Board considered the portfolio managers' investments, if any, in the funds that they manage.
Resources Dedicated to Investment Management and Support Services. The Board reviewed the general qualifications and capabilities of Fidelity's investment staff, including its size, education, experience, and resources, as well as Fidelity's approach to recruiting, managing, and compensating investment personnel. The Board noted that Fidelity has continued to increase the resources devoted to non-U.S. offices, including expansion of Fidelity's global investment organization. The Board also noted that Fidelity's analysts have extensive resources, tools and capabilities that allow them to conduct sophisticated quantitative and fundamental analysis, as well as credit analysis of issuers, counterparties and guarantors. Further, the Board considered that Fidelity's investment professionals have sufficient access to global information and data so as to provide competitive investment results over time, and that those professionals also have access to sophisticated tools that permit them to assess portfolio construction and risk and performance attribution characteristics continuously, as well as to transmit new information and research conclusions rapidly around the world. Additionally, in its deliberations, the Board considered Fidelity's trading, risk management, compliance, and technology and operations capabilities and resources, which are integral parts of the investment management process.
Shareholder and Administrative Services. The Board considered (i) the nature, extent, quality, and cost of advisory, administrative, and shareholder services performed by the Investment Advisers and their affiliates under the Advisory Contracts and under separate agreements covering transfer agency and pricing and bookkeeping services for each fund; (ii) the nature and extent of the supervision of third party service providers, principally custodians, subcustodians, and pricing vendors; and (iii) the resources devoted to, and the record of compliance with, each fund's compliance policies and procedures.
The Board noted that the growth of fund assets over time across the complex allows Fidelity to reinvest in the development of services designed to enhance the value and convenience of the Fidelity funds as investment vehicles. These services include 24-hour access to account information and market information over the Internet and through telephone representatives, investor education materials and asset allocation tools, and the expanded availability of Fidelity Investor Centers.
Investment in a Large Fund Family. The Board considered the benefits to shareholders of investing in a Fidelity fund, including the benefits of investing in a fund that is part of a large family of funds offering a variety of investment disciplines and providing a large variety of mutual fund investor services. The Board noted that Fidelity had taken, or had made recommendations that resulted in the Fidelity funds taking, a number of actions over the previous year that benefited particular funds, including: (i) continuing to dedicate additional resources to Fidelity's investment research process, which includes meetings with management of issuers of securities in which the funds invest, and to the support of the senior management team that oversees asset management; (ii) continuing efforts to enhance Fidelity's global research capabilities; (iii) launching new funds with innovative structures, strategies and pricing and making other enhancements to meet client needs; (iv) launching new share classes of existing funds; (v) eliminating purchase minimums and broadening eligibility requirements for certain funds and share classes; (vi) reducing management fees and total expenses for certain target date funds and index funds; (vii) lowering expense caps for certain existing funds and classes, and converting certain voluntary expense caps to contractual caps, to reduce expenses borne by shareholders; (viii) rationalizing product lines and gaining increased efficiencies from fund mergers, liquidations, and share class consolidations; (ix) continuing to develop, acquire and implement systems and technology to improve services to the funds and shareholders, strengthen information security, and increase efficiency; and (x) continuing to implement enhancements to further strengthen Fidelity's product line to increase investors' probability of success in achieving their investment goals, including retirement income goals.
Investment Performance (for Fidelity New Jersey Municipal Income Fund). The Board considered whether the fund has operated in accordance with its investment objective, as well as its record of compliance with its investment restrictions and its performance history. The Board noted that there were portfolio management changes for the fund in September 2018 and December 2018.
The Board took into account discussions that occur at Board meetings throughout the year with representatives of the Investment Advisers about fund investment performance. In this regard the Board noted that as part of regularly scheduled fund reviews and other reports to the Board on fund performance, the Board considers annualized return information for the fund for different time periods, measured against an appropriate securities market index (benchmark index) and a peer group of funds with similar objectives (peer group), if any. In its evaluation of fund investment performance at meetings throughout the year, the Board gave particular attention to information indicating underperformance of certain Fidelity funds for specific time periods and discussed with the Investment Advisers the reasons for such underperformance.
In addition to reviewing absolute and relative fund performance, the Independent Trustees periodically consider the appropriateness of fund performance metrics in evaluating the results achieved. In general, the Independent Trustees believe that fund performance should be evaluated based on gross performance (before fees and expenses but after transaction costs) compared to appropriate benchmark indices, over appropriate time periods that may include full market cycles, and on net performance (after fees and expenses) compared to peer groups, as applicable, over the same periods, taking into account relevant factors including the following: general market conditions; expectations for interest rate levels and credit conditions; issuer-specific information including credit quality; the potential for incremental return versus the fund's benchmark index weighed against the risks involved in obtaining that incremental return, including the risk of diminished or negative total returns; and fund cash flows and other factors. Depending on the circumstances, the Independent Trustees may be satisfied with a fund's performance notwithstanding that it lags its benchmark index or peer group for certain periods.
The Independent Trustees recognize that shareholders evaluate performance on a net basis over their own holding periods, for which one-, three-, and five-year periods are often used as a proxy. For this reason, the performance information reviewed by the Board also included net cumulative calendar year total return information for the fund and an appropriate benchmark index and peer group for the most recent one-, three-, and five-year periods.
Investment Performance (for Fidelity New Jersey Municipal Money Market Fund). The Board considered whether the fund has operated in accordance with its investment objective, as well as its record of compliance with its investment restrictions and its performance history. The Board noted that there was a portfolio management change for the fund in November 2018.
The Board took into account discussions that occur at Board meetings throughout the year with representatives of the Investment Advisers about fund investment performance. In this regard the Board noted that as part of regularly scheduled fund reviews and other reports to the Board on fund performance, the Board considers annualized return information for the fund for different time periods, measured against a peer group.
In addition to reviewing absolute and relative fund performance, the Independent Trustees periodically consider the appropriateness of fund performance metrics in evaluating the results achieved. In general, the Independent Trustees believe that fund performance should be evaluated based on gross performance (before fees and expenses but after transaction costs) compared to the gross performance of appropriate peer groups, over appropriate time periods that may include full market cycles, taking into account relevant factors including the following: general market conditions; expectations for interest rate levels and credit conditions; issuer-specific information including credit quality; the fund's market value NAV over time and its resilience under various stressed conditions; and fund cash flows and other factors.
The Board recognizes that in interest rate environments where many competitors waive fees to maintain a minimum yield, relative money market fund performance on a net basis (after fees and expenses) may not be particularly meaningful due to miniscule performance differences among competitor funds. Depending on the circumstances, the Independent Trustees may be satisfied with a fund's performance notwithstanding that it lags its peer group for certain periods.
The Independent Trustees recognize that shareholders evaluate performance on a net basis over their own holding periods, for which one-, three-, and five-year periods are often used as a proxy. For this reason, the performance information reviewed by the Board also included net cumulative calendar year total return information for the fund and an appropriate peer group for the most recent one-, three-, and five-year periods.
Based on its review, the Board concluded that the nature, extent, and quality of services provided to each fund under the Advisory Contracts should continue to benefit the shareholders of each fund.
Competitiveness of Management Fee and Total Expense Ratio. The Board considered each fund's management fee and total expense ratio compared to "mapped groups" of competitive funds and classes created for the purpose of facilitating the Trustees' competitive analysis of management fees and total expenses. Fidelity creates "mapped groups" by combining similar Lipper investment objective categories that have comparable investment mandates. Combining Lipper investment objective categories aids the Board's management fee and total expense ratio comparisons by broadening the competitive group used for comparison.
Management Fee. The Board considered two proprietary management fee comparisons for the 12-month periods shown in basis points (BP) in the charts below. The group of Lipper funds used by the Board for management fee comparisons is referred to below as the "Total Mapped Group" and is broader than the Lipper peer group used by the Board for performance comparisons. The Total Mapped Group comparison focuses on a fund's standing in terms of gross management fees before expense reimbursements or caps relative to the total universe of funds with comparable investment mandates, regardless of whether their management fee structures also are comparable. Funds with comparable investment mandates offer exposure to similar types of securities. Funds with comparable management fee structures have similar management fee contractual arrangements (
e.g., flat rate charged for advisory services, all-inclusive fee rate,
etc.). "TMG %" represents the percentage of funds in the Total Mapped Group that had management fees that were lower than a fund's. For example, a hypothetical TMG % of 20% would mean that 80% of the funds in the Total Mapped Group had higher, and 20% had lower, management fees than a fund. The funds' actual TMG %s and the number of funds in the Total Mapped Group are in the charts below. The "Asset-Size Peer Group" (ASPG) comparison focuses on a fund's standing relative to a subset of non-Fidelity funds within the Total Mapped Group that are similar in size and management fee structure. For example, if a fund is in the first quartile of the ASPG, the fund's management fee ranks in the least expensive or lowest 25% of funds in the ASPG. The ASPG represents at least 15% of the funds in the Total Mapped Group with comparable asset size and management fee structures, subject to a minimum of 50 funds (or all funds in the Total Mapped Group if fewer than 50). Additional information, such as the ASPG quartile in which a fund's management fee rate ranked, is also included in the charts and was considered by the Board.
Fidelity New Jersey Municipal Income Fund
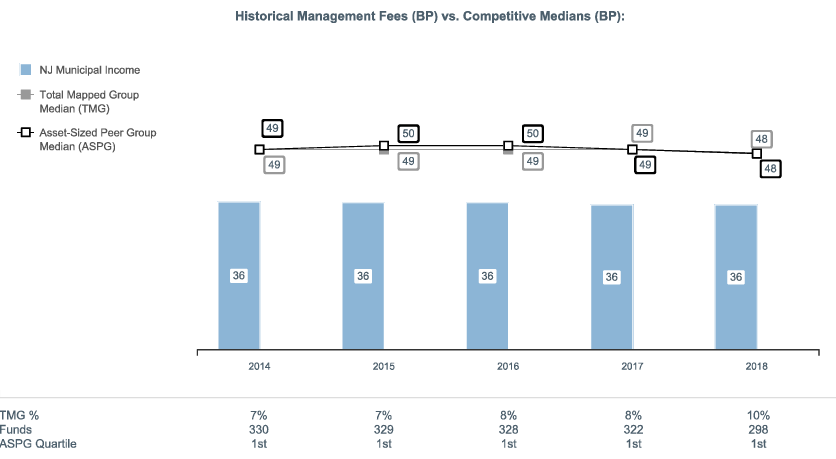
The Board noted that the fund's management fee rate ranked below the median of its Total Mapped Group and below the median of its ASPG for 2018.
Fidelity New Jersey Municipal Money Market Fund
The Board noted that because there is a relatively small number of state-specific funds in the Lipper objective, Fidelity combines Lipper's separate categories for state-specific funds with all state and national municipal money market funds to create a single mapped group.
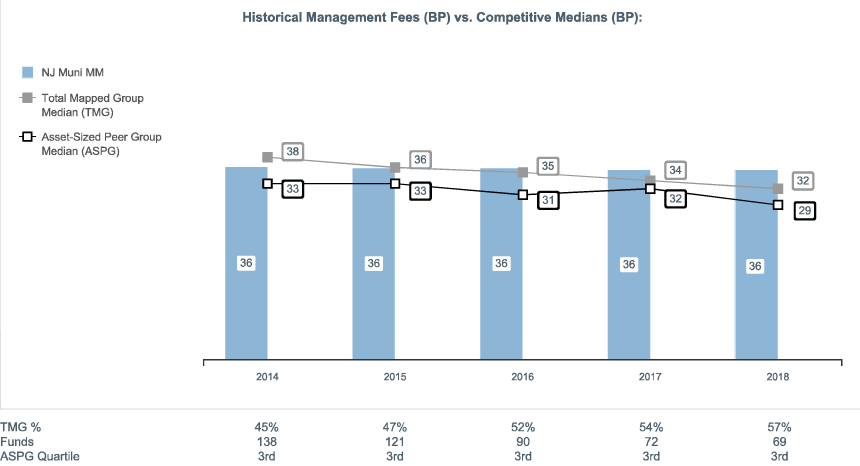
The Board noted that the fund's management fee rate ranked above the median of its Total Mapped Group and above the median of its ASPG for 2018. The Board also noted that the management fee rate was four BP above the Total Mapped Group median and seven BP above the ASPG median.
The Board noted that it and the boards of other Fidelity funds formed an ad hoc Committee on Group Fee, which meets periodically, to conduct an in-depth review of the "group fee" component of the management fee of funds with such management fee structures. The Committee's focus included the mechanics of the group fee, the competitive landscape of group fee structures, Fidelity funds with no group fee component and investment products not included in group fee assets. The Board also considered that, for funds subject to the group fee, FMR agreed to voluntarily waive fees over a specified period of time in amounts designed to account for assets converted from certain funds to certain collective investment trusts.
Based on its review, the Board concluded that each fund's management fee is fair and reasonable in light of the services that the fund receives and the other factors considered.
Total Expense Ratio. In its review of each fund's total expense ratio, the Board considered the fund's management fee rate as well as other fund expenses, such as transfer agent fees, pricing and bookkeeping fees, and custodial, legal, and audit fees. The Board also noted that Fidelity may agree to waive fees or reimburse expenses from time to time, and the extent to which, if any, it has done so for each fund. As part of its review, the Board also considered the current and historical total expense ratios of each fund compared to competitive fund median expenses. Each fund is compared to those funds and classes in the Total Mapped Group (used by the Board for management fee comparisons) that have a similar sales load structure.
The Board noted that Fidelity New Jersey Municipal Income Fund's total expense ratio ranked below the competitive median for 2018 and Fidelity New Jersey Municipal Money Market Fund's total expense ratio ranked above the competitive median for 2018. The Board considered that, in general, various factors can affect total expense ratios. The Board considered that the competitive data for Fidelity New Jersey Municipal Money Market Fund reflects periods for which many competitor funds waived fees or reimbursed expenses in order to maintain a minimum yield. The Board also considered that, as interest rates rise, many competitors have eliminated such waivers, but the externally sourced competitive data for 2018 had not yet caught up to the fiscal periods during which competitors have stopped waiving fees to maintain minimum yields. The Board noted that, excluding fee waivers and reimbursements, the fund's total expense ratio ranked above the median, but the difference in total expense ratio was 1 BP.
Fees Charged to Other Fidelity Clients. The Board also considered Fidelity fee structures and other information with respect to clients of Fidelity, such as other funds advised or subadvised by Fidelity, pension plan clients, and other institutional clients with similar mandates. The Board noted that a joint ad hoc committee created by it and the boards of other Fidelity funds periodically reviews and compares Fidelity's institutional investment advisory business with its business of providing services to the Fidelity funds and also noted the most recent findings of the committee. The Board noted that the committee's review included a consideration of the differences in services provided, fees charged, and costs incurred, as well as competition in the markets serving the different categories of clients.
Based on its review of total expense ratios and fees charged to other Fidelity clients, the Board concluded that each fund's total expense ratio was reasonable in light of the services that the fund and its shareholders receive and the other factors considered.
Costs of the Services and Profitability. The Board considered the revenues earned and the expenses incurred by Fidelity in conducting the business of developing, marketing, distributing, managing, administering and servicing each fund and servicing each fund's shareholders. The Board also considered the level of Fidelity's profits in respect of all the Fidelity funds.
On an annual basis, Fidelity presents to the Board information about the profitability of its relationships with each fund. Fidelity calculates profitability information for each fund, as well as aggregate profitability information for groups of Fidelity funds and all Fidelity funds, using a series of detailed revenue and cost allocation methodologies which originate with the books and records of Fidelity on which Fidelity's audited financial statements are based. The Audit Committee of the Board reviews any significant changes from the prior year's methodologies and the full Board approves such changes.
PricewaterhouseCoopers LLP (PwC), auditor to Fidelity and certain Fidelity funds, has been engaged annually by the Board as part of the Board's assessment of Fidelity's profitability analysis. PwC's engagement includes the review and assessment of the methodologies used by Fidelity in determining the revenues and expenses attributable to Fidelity's mutual fund business, and completion of agreed-upon procedures in respect of the mathematical accuracy of the fund profitability information and its conformity to established allocation methodologies. After considering PwC's reports issued under the engagement and information provided by Fidelity, the Board concluded that while other allocation methods may also be reasonable, Fidelity's profitability methodologies are reasonable in all material respects.
The Board also reviewed Fidelity's non-fund businesses and potential indirect benefits such businesses may have received as a result of their association with Fidelity's mutual fund business (i.e., fall-out benefits) as well as cases where Fidelity's affiliates may benefit from the fund's business. The Board noted that changes to fall-out benefits year-over-year reflect business developments at Fidelity's various businesses. The Board considered that a joint ad hoc committee created by it and the boards of other Fidelity funds had recently been established, and meets periodically, to evaluate potential fall-out benefits. The Board noted that the committee was expected to, among other things: (i) discuss the legal framework surrounding potential fall-out benefits; (ii) review the Board's responsibilities and approach to potential fall-out benefits; and (iii) review practices employed by competitor funds regarding the review of potential fall-out benefits. The Board noted that it would consider the committee's findings in connection with future consideration of contract renewals.
The Board considered the costs of the services provided by and the profits realized by Fidelity in connection with the operation of each fund and was satisfied that the profitability was not excessive.
Economies of Scale. The Board considered whether there have been economies of scale in respect of the management of the Fidelity funds, whether the Fidelity funds (including each fund) have appropriately benefited from any such economies of scale, and whether there is potential for realization of any further economies of scale. The Board considered the extent to which each fund will benefit from economies of scale as assets grow through increased services to the fund, through waivers or reimbursements, or through fee or expense ratio reductions. The Board also noted that a committee (the Economies of Scale Committee) created by it and the boards of other Fidelity funds periodically analyzes whether Fidelity attains economies of scale in respect of the management and servicing of the Fidelity funds, whether the Fidelity funds have appropriately benefited from such economies of scale, and whether there is potential for realization of any further economies of scale.
The Board recognized that each fund's management contract incorporates a "group fee" structure, which provides for lower group fee rates as total "group assets" increase, and for higher group fee rates as total "group assets" decrease ("group assets" as defined in the management contract). FMR calculates the group fee rates based on a tiered asset "breakpoint" schedule that varies based on asset class. The Board considered that the group fee is designed to deliver the benefits of economies of scale to fund shareholders when total Fidelity fund assets increase, even if assets of any particular fund are unchanged or have declined, because some portion of Fidelity's costs are attributable to services provided to all Fidelity funds, and all funds benefit if those costs can be allocated among more assets. The Board concluded that, given the group fee structure, fund shareholders will benefit from lower management fees as "group assets" increase at the fund complex level, regardless of whether Fidelity achieves any such economies of scale.
The Board concluded, taking into account the analysis of the Economies of Scale Committee, that economies of scale, if any, are being appropriately shared between fund shareholders and Fidelity.
Additional Information Requested by the Board. In order to develop fully the factual basis for consideration of the Fidelity funds' advisory contracts, the Board requested and received additional information on certain topics, including: (i) Fidelity's fund profitability methodology, profitability trends for certain funds, the allocation of various costs to different funds, and the impact of certain factors on fund profitability results; (ii) portfolio manager changes that have occurred during the past year and the amount of the investment that each portfolio manager has made in the Fidelity fund(s) that he or she manages; (iii) Fidelity's compensation structure for portfolio managers, research analysts, and other key personnel, including its effects on fund profitability, the rationale for the compensation structure, and the extent to which current market conditions have affected retention and recruitment; (iv) the arrangements with and compensation paid to certain fund sub-advisers on behalf of the Fidelity funds and the treatment of such compensation within Fidelity's fund profitability methodology; (v) the practices of certain sub-advisers regarding their receipt of research from broker-dealers that execute the funds' portfolio transactions; (vi) the terms of Fidelity's voluntary expense limitation agreements; (vii) the methodology with respect to competitive fund data and peer group classifications; (viii) Fidelity's transfer agent fee, expense, and service structures for different funds and classes relative to competitive trends, and the impact of the increased use of omnibus accounts; (ix) new developments in the retail and institutional marketplaces and the competitive positioning of the funds relative to other investment products and services; (x) the impact on fund profitability of recent changes in total net assets for Fidelity's money market funds, anticipated changes to the competitive landscape for money market funds, and the level of investor comfort with gates, fees, and floating NAVs; (xi) the funds' share class structures and distribution channels; and (xii) explanations regarding the relative total expense ratios of certain funds and classes, total expense competitive trends and methodologies for total expense competitive comparisons, and actions that might be taken by Fidelity to reduce total expense ratios for certain classes. In addition, the Board considered its discussions with Fidelity throughout the year regarding enhanced information security initiatives and the funds' fair valuation policies.
Based on its evaluation of all of the conclusions noted above, and after considering all factors it believed relevant, the Board concluded that the advisory fee arrangements are fair and reasonable, and that each fund's Advisory Contracts should be renewed and each fund's Amended and Restated Contracts should be approved.
NJN-ANN-0120
1.539150.122
Item 2.
Code of Ethics
As of the end of the period, November 30, 2019, Fidelity Court Street Trust (the trust) has adopted a code of ethics, as defined in Item 2 of Form N-CSR, that applies to its President and Treasurer and its Chief Financial Officer. A copy of the code of ethics is filed as an exhibit to this Form N-CSR.
Item 3.
Audit Committee Financial Expert
The Board of Trustees of the trust has determined that Elizabeth S. Acton is an audit committee financial expert, as defined in Item 3 of Form N-CSR. Ms. Acton is independent for purposes of Item 3 of Form N-CSR.
Item 4.
Principal Accountant Fees and Services
Fees and Services
The following table presents fees billed by PricewaterhouseCoopers LLP (“PwC”) in each of the last two fiscal years for services rendered to Fidelity Connecticut Municipal Income Fund and Fidelity New Jersey Municipal Income Fund (the “Funds”):
Services Billed by PwC
November 30, 2019 FeesA
| | | | |
| Audit Fees | Audit-Related Fees | Tax Fees | All Other Fees |
Fidelity Connecticut Municipal Income Fund | $49,000 | $3,800 | $2,200 | $2,200 |
Fidelity New Jersey Municipal Income Fund | $45,000 | $3,600 | $2,200 | $2,100 |
| | | | |
| Audit Fees | Audit-Related Fees | Tax Fees | All Other Fees |
Fidelity Connecticut Municipal Income Fund | $50,000 | $4,200 | $2,200 | $2,400 |
Fidelity New Jersey Municipal Income Fund | $46,000 | $3,900 | $2,200 | $2,200 |
AAmounts may reflect rounding.
The following table(s) present(s) fees billed by PwC that were required to be approved by the Audit Committee for services that relate directly to the operations and financial reporting of the Fund(s) and that are rendered on behalf of Fidelity Management & Research Company ("FMR") and entities controlling, controlled by, or under common control with FMR (not including any sub-adviser whose role is primarily portfolio management and is subcontracted with or overseen by another investment adviser) that provide ongoing services to the Fund(s) (“Fund Service Providers”):
Services Billed by PwC
| | |
| November 30, 2019A | November 30, 2018A |
Audit-Related Fees | $7,890,000 | $7,745,000 |
Tax Fees | $10,000 | $20,000 |
All Other Fees | $- | $- |
A Amounts may reflect rounding.
“Audit-Related Fees” represent fees billed for assurance and related services that are reasonably related to the performance of the fund audit or the review of the fund's financial statements and that are not reported under Audit Fees.
“Tax Fees” represent fees billed for tax compliance, tax advice or tax planning that relate directly to the operations and financial reporting of the fund.
“All Other Fees” represent fees billed for services provided to the fund or Fund Service Provider, a significant portion of which are assurance related, that relate directly to the operations and financial reporting of the fund, excluding those services that are reported under Audit Fees, Audit-Related Fees or Tax Fees.
Assurance services must be performed by an independent public accountant.
* * *
The aggregate non-audit fees billed by PwC for services rendered to the Fund(s), FMR (not including any sub-adviser whose role is primarily portfolio management and is subcontracted with or overseen by another investment adviser), and any Fund Service Provider for each of the last two fiscal years of the Fund(s) are as follows:
| | |
Billed By | November 30, 2019A | November 30, 2018A |
PwC | $12,555,000 | $10,955,000 |
A Amounts may reflect rounding.
The trust's Audit Committee has considered non-audit services that were not pre-approved that were provided by PwC to Fund Service Providers to be compatible with
maintaining the independence of PwC in its(their) audit of the Fund(s), taking into account representations from PwC, in accordance with Public Company Accounting Oversight Board rules, regarding its independence from the Fund(s) and its(their) related entities and FMR’s review of the appropriateness and permissibility under applicable law of such non-audit services prior to their provision to the Fund(s) Service Providers.
Audit Committee Pre-Approval Policies and Procedures
The trust’s Audit Committee must pre-approve all audit and non-audit services provided by a fund’s independent registered public accounting firm relating to the operations or financial reporting of the fund. Prior to the commencement of any audit or non-audit services to a fund, the Audit Committee reviews the services to determine whether they are appropriate and permissible under applicable law.
The Audit Committee has adopted policies and procedures to, among other purposes, provide a framework for the Committee’s consideration of non-audit services by the audit firms that audit the Fidelity funds. The policies and procedures require that any non-audit service provided by a fund audit firm to a Fidelity fund and any non-audit service provided by a fund auditor to a Fund Service Provider that relates directly to the operations and financial reporting of a Fidelity fund (“Covered Service”) are subject to approval by the Audit Committee before such service is provided.
All Covered Services must be approved in advance of provision of the service either: (i) by formal resolution of the Audit Committee, or (ii) by oral or written approval of the service by the Chair of the Audit Committee (or if the Chair is unavailable, such other member of the Audit Committee as may be designated by the Chair to act in the Chair’s absence). The approval contemplated by (ii) above is permitted where the Treasurer determines that action on such an engagement is necessary before the next meeting of the Audit Committee.
Non-audit services provided by a fund audit firm to a Fund Service Provider that do not relate directly to the operations and financial reporting of a Fidelity fund are reported to the Audit Committee periodically.
Non-Audit Services Approved Pursuant to Rule 2-01(c)(7)(i)(C) and (ii) of Regulation S-X (“De Minimis Exception”)
There were no non-audit services approved or required to be approved by the Audit Committee pursuant to the De Minimis Exception during the Fund’s(s’) last two fiscal years relating to services provided to (i) the Fund(s) or (ii) any Fund Service Provider that relate directly to the operations and financial reporting of the Fund(s).
Item 5.
Audit Committee of Listed Registrants
Not applicable.
Item 6.
Investments
(a)
Not applicable.
(b)
Not applicable.
Item 7.
Disclosure of Proxy Voting Policies and Procedures for Closed-End Management Investment Companies
Not applicable.
Item 8.
Portfolio Managers of Closed-End Management Investment Companies
Not applicable.
Item 9.
Purchase of Equity Securities by Closed-End Management Investment Company and Affiliated Purchasers
Not applicable.
Item 10.
Submission of Matters to a Vote of Security Holders
There were no material changes to the procedures by which shareholders may recommend nominees to the trust’s Board of Trustees.
Item 11.
Controls and Procedures
(a)(i) The President and Treasurer and the Chief Financial Officer have concluded that the trust’s disclosure controls and procedures (as defined in Rule 30a-3(c) under the Investment Company Act) provide reasonable assurances that material information relating to the trust is made known to them by the appropriate persons, based on their evaluation of these controls and procedures as of a date within 90 days of the filing date of this report.
(a)(ii) There was no change in the trust’s internal control over financial reporting (as defined in Rule 30a-3(d) under the Investment Company Act) that occurred during the period covered by this report that has materially affected, or is reasonably likely to materially affect, the trust’s internal control over financial reporting.
Item 12.
Disclosure of Securities Lending Activities for Closed-End Management
Investment Companies
Not applicable.
Item 13.
Exhibits
| | |
(a) | (1) | Code of Ethics pursuant to Item 2 of Form N-CSR is filed and attached hereto as EX-99.CODE ETH. |
(a) | (2) | Certification pursuant to Rule 30a-2(a) under the Investment Company Act of 1940 (17 CFR 270.30a-2(a)) is filed and attached hereto as Exhibit 99.CERT. |
(a) | (3) | Not applicable. |
(b) |
| Certification pursuant to Rule 30a-2(b) under the Investment Company Act of 1940 (17 CFR 270.30a-2(b)) is furnished and attached hereto as Exhibit 99.906CERT. |
SIGNATURES
Pursuant to the requirements of the Securities Exchange Act of 1934 and the Investment Company Act of 1940, the registrant has duly caused this report to be signed on its behalf by the undersigned, thereunto duly authorized.
Fidelity Court Street Trust
| |
By: | /s/Laura M. Del Prato |
| Laura M. Del Prato |
| President and Treasurer |
|
|
Date: | January 24, 2020 |
Pursuant to the requirements of the Securities Exchange Act of 1934 and the Investment Company Act of 1940, this report has been signed below by the following persons on behalf of the registrant and in the capacities and on the dates indicated.
| |
By: | /s/Laura M. Del Prato |
| Laura M. Del Prato |
| President and Treasurer |
|
|
Date: | January 24, 2020 |
| |
By: | /s/John J. Burke III |
| John J. Burke III |
| Chief Financial Officer |
|
|
Date: | January 24, 2020 |