UNITED STATES
SECURITIES AND EXCHANGE COMMISSION
Washington, DC 20549
FORM N-CSRS
CERTIFIED SHAREHOLDER REPORT OF REGISTERED
MANAGEMENT INVESTMENT COMPANIES
Investment Company Act file number 811-02790
Franklin California Tax Free Income Fund
(Exact name of registrant as specified in charter)
One Franklin Parkway, San Mateo, CA 94403-1906
(Address of principal executive offices) (Zip code)
Alison Baur, One Franklin Parkway, San Mateo, CA 94403-1906
(Name and address of agent for service)
Registrant’s telephone number, including area code: 650 312-2000
Date of fiscal year end: 2/28
Date of reporting period: 8/31/24
Item 1. Reports to Stockholders.
| a.) | The following is a copy of the report transmitted to shareholders pursuant to Rule 30e-1 under the Investment Company Act of 1940, as amended (the “1940 Act”) (17 CFR 270.30e-1). |
| | |
| b.) | Include a copy of each notice transmitted to stockholders in reliance on Rule 30e-3 under the Act (17 CFR 270.30e-3) that contains disclosures specified by paragraph (c)(3) of that rule. |
Not Applicable.
| | |
Franklin California Tax-Free Income Fund | |
| Class A [FTFQX] |
| Semi-Annual Shareholder Report | August 31, 2024 |
|
This semi-annual shareholder report contains important information about Franklin California Tax-Free Income Fund for the period March 1, 2024, to August 31, 2024.
You can find additional information about the Fund at https://www.franklintempleton.com/regulatory-fund-documents. You can also request this information by contacting us at (800) DIAL BEN/342-5236.
WHAT WERE THE FUND COSTS FOR THE LAST SIX MONTHS? (based on a hypothetical $10,000 investment)
| | |
Class Name | Costs of a $10,000 investment | Costs paid as a percentage of a $10,000 investment† |
| Class A | $38 | 0.75% |
KEY FUND STATISTICS (as of August 31, 2024)
| |
Total Net Assets | $13,332,749,908 |
Total Number of Portfolio Holdings* | 1,090 |
Portfolio Turnover Rate | 2.39% |
| * | Does not include derivatives, except purchased options, if any. |
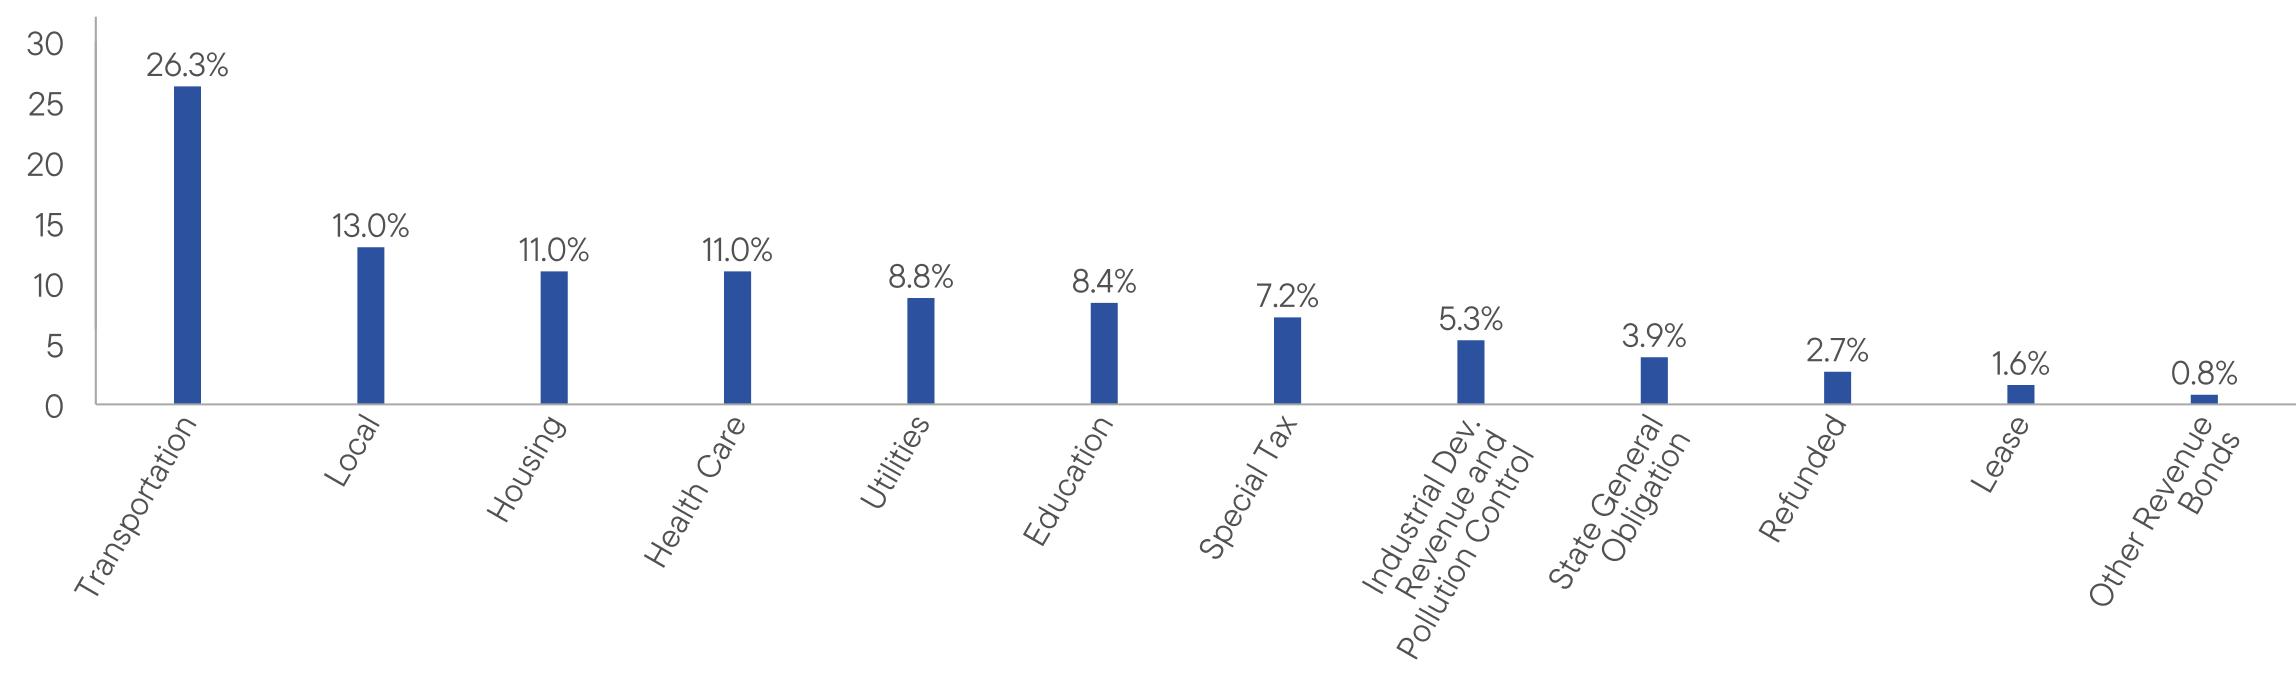
WHAT DID THE FUND INVEST IN? (as of August 31, 2024)
Portfolio Composition* (% of Total Investments)
| * | Does not include derivatives, except purchased options, if any. |
| |
| WHERE CAN I FIND ADDITIONAL INFORMATION ABOUT THE FUND? |
Additional information is available on https://www.franklintempleton.com/regulatory-fund-documents, including its: |
| • prospectus • proxy voting information • financial information • holdings • tax information |
| Franklin California Tax-Free Income Fund | PAGE 1 | 1112-STSR-1024 |
26.313.011.011.08.88.47.25.33.92.71.60.8
| | |
Franklin California Tax-Free Income Fund | |
| Class A1 [FKTFX] |
| Semi-Annual Shareholder Report | August 31, 2024 |
|
This semi-annual shareholder report contains important information about Franklin California Tax-Free Income Fund for the period March 1, 2024, to August 31, 2024.
You can find additional information about the Fund at https://www.franklintempleton.com/regulatory-fund-documents. You can also request this information by contacting us at (800) DIAL BEN/342-5236.
WHAT WERE THE FUND COSTS FOR THE LAST SIX MONTHS? (based on a hypothetical $10,000 investment)
| | |
Class Name | Costs of a $10,000 investment | Costs paid as a percentage of a $10,000 investment† |
| Class A1 | $31 | 0.60% |
KEY FUND STATISTICS (as of August 31, 2024)
| |
Total Net Assets | $13,332,749,908 |
Total Number of Portfolio Holdings* | 1,090 |
Portfolio Turnover Rate | 2.39% |
| * | Does not include derivatives, except purchased options, if any. |
WHAT DID THE FUND INVEST IN? (as of August 31, 2024)
Portfolio Composition* (% of Total Investments)
| * | Does not include derivatives, except purchased options, if any. |
| |
| WHERE CAN I FIND ADDITIONAL INFORMATION ABOUT THE FUND? |
Additional information is available on https://www.franklintempleton.com/regulatory-fund-documents, including its: |
| • prospectus • proxy voting information • financial information • holdings • tax information |
| Franklin California Tax-Free Income Fund | PAGE 1 | 112-STSR-1024 |
26.313.011.011.08.88.47.25.33.92.71.60.8
| | |
Franklin California Tax-Free Income Fund | |
| Class C [FRCTX] |
| Semi-Annual Shareholder Report | August 31, 2024 |
|
This semi-annual shareholder report contains important information about Franklin California Tax-Free Income Fund for the period March 1, 2024, to August 31, 2024.
You can find additional information about the Fund at https://www.franklintempleton.com/regulatory-fund-documents. You can also request this information by contacting us at (800) DIAL BEN/342-5236.
WHAT WERE THE FUND COSTS FOR THE LAST SIX MONTHS? (based on a hypothetical $10,000 investment)
| | |
Class Name | Costs of a $10,000 investment | Costs paid as a percentage of a $10,000 investment† |
| Class C | $59 | 1.15% |
KEY FUND STATISTICS (as of August 31, 2024)
| |
Total Net Assets | $13,332,749,908 |
Total Number of Portfolio Holdings* | 1,090 |
Portfolio Turnover Rate | 2.39% |
| * | Does not include derivatives, except purchased options, if any. |
WHAT DID THE FUND INVEST IN? (as of August 31, 2024)
Portfolio Composition* (% of Total Investments)
| * | Does not include derivatives, except purchased options, if any. |
| |
| WHERE CAN I FIND ADDITIONAL INFORMATION ABOUT THE FUND? |
Additional information is available on https://www.franklintempleton.com/regulatory-fund-documents, including its: |
| • prospectus • proxy voting information • financial information • holdings • tax information |
| Franklin California Tax-Free Income Fund | PAGE 1 | 212-STSR-1024 |
26.313.011.011.08.88.47.25.33.92.71.60.8
| | |
Franklin California Tax-Free Income Fund | |
| Class R6 [FKTQX] |
| Semi-Annual Shareholder Report | August 31, 2024 |
|
This semi-annual shareholder report contains important information about Franklin California Tax-Free Income Fund for the period March 1, 2024, to August 31, 2024.
You can find additional information about the Fund at https://www.franklintempleton.com/regulatory-fund-documents. You can also request this information by contacting us at (800) DIAL BEN/342-5236.
WHAT WERE THE FUND COSTS FOR THE LAST SIX MONTHS? (based on a hypothetical $10,000 investment)
| | |
Class Name | Costs of a $10,000 investment | Costs paid as a percentage of a $10,000 investment† |
| Class R6 | $24 | 0.47% |
KEY FUND STATISTICS (as of August 31, 2024)
| |
Total Net Assets | $13,332,749,908 |
Total Number of Portfolio Holdings* | 1,090 |
Portfolio Turnover Rate | 2.39% |
| * | Does not include derivatives, except purchased options, if any. |
WHAT DID THE FUND INVEST IN? (as of August 31, 2024)
Portfolio Composition* (% of Total Investments)
| * | Does not include derivatives, except purchased options, if any. |
| |
| WHERE CAN I FIND ADDITIONAL INFORMATION ABOUT THE FUND? |
Additional information is available on https://www.franklintempleton.com/regulatory-fund-documents, including its: |
| • prospectus • proxy voting information • financial information • holdings • tax information |
| Franklin California Tax-Free Income Fund | PAGE 1 | 8112-STSR-1024 |
26.313.011.011.08.88.47.25.33.92.71.60.8
| | |
Franklin California Tax-Free Income Fund | |
| Advisor Class [FCAVX] |
| Semi-Annual Shareholder Report | August 31, 2024 |
|
This semi-annual shareholder report contains important information about Franklin California Tax-Free Income Fund for the period March 1, 2024, to August 31, 2024.
You can find additional information about the Fund at https://www.franklintempleton.com/regulatory-fund-documents. You can also request this information by contacting us at (800) DIAL BEN/342-5236.
WHAT WERE THE FUND COSTS FOR THE LAST SIX MONTHS? (based on a hypothetical $10,000 investment)
| | |
Class Name | Costs of a $10,000 investment | Costs paid as a percentage of a $10,000 investment† |
| Advisor Class | $26 | 0.50% |
KEY FUND STATISTICS (as of August 31, 2024)
| |
Total Net Assets | $13,332,749,908 |
Total Number of Portfolio Holdings* | 1,090 |
Portfolio Turnover Rate | 2.39% |
| * | Does not include derivatives, except purchased options, if any. |
WHAT DID THE FUND INVEST IN? (as of August 31, 2024)
Portfolio Composition* (% of Total Investments)
| * | Does not include derivatives, except purchased options, if any. |
| |
| WHERE CAN I FIND ADDITIONAL INFORMATION ABOUT THE FUND? |
Additional information is available on https://www.franklintempleton.com/regulatory-fund-documents, including its: |
| • prospectus • proxy voting information • financial information • holdings • tax information |
| Franklin California Tax-Free Income Fund | PAGE 1 | 614-STSR-1024 |
26.313.011.011.08.88.47.25.33.92.71.60.8
Item 2. Code of Ethics. N/A
Item 3. Audit Committee Financial Expert. N/A
Item 4. Principal Accountant Fees and Services. N/A
Item 5. Audit Committee of Listed Registrants. N/A
Item 6. Schedule of Investments.
(a) Please see schedule of investments contained in the Financial Statements and Financial Highlights included under Item 7 of this Form N-CSR.
(b) N/A
Item 7. Financial Statements and Financial Highlights for Open-End Management Investment Companies.
Franklin
California
Tax-Free
Income
Fund
Financial
Statements
and
Other
Important
Information
Semi-Annual
|
August
31,
2024
Financial
Statements
and
Other
Important
Information—Semiannual
Financial
Highlights
and
Schedule
of
Investments
2
Financial
Statements
36
Notes
to
Financial
Statements
40
Changes
In
and
Disagreements
with
Accountants
48
Results
of
Meeting(s)
of
Shareholders
48
Remuneration
Paid
to
Directors,
Officers
and
Others
48
Board
Approval
of
Management
and
Subadvisory
Agreements
48
Franklin
California
Tax-Free
Income
Fund
Semiannual
Report
The
accompanying
notes
are
an
integral
part
of
these
financial
statements.
a
Six
Months
Ended
August
31,
2024
(unaudited)
Year
Ended
February
28,
Year
Ended
February
28,
2022
b
Year
Ended
March
31,
Year
Ended
March
31,
2019
c
2024
a
2023
2021
2020
Class
A
Per
share
operating
performance
(for
a
share
outstanding
throughout
the
period)
Net
asset
value,
beginning
of
period
..............
$6.89
$6.73
$7.44
$7.71
$7.50
$7.44
$7.27
Income
from
investment
operations
d
:
Net
investment
income
e
.
0.12
0.24
0.22
0.18
0.22
0.22
0.14
Net
realized
and
unrealized
gains
(losses)
0.04
0.16
(0.71)
(0.28)
0.20
0.08
0.15
Total
from
investment
operations
.............
0.16
0.40
(0.49)
(0.10)
0.42
0.30
0.29
Less
distributions
from:
Net
investment
income
..
(0.12)
(0.24)
(0.22)
(0.17)
(0.21)
(0.24)
(0.12)
Net
asset
value,
end
of
period
................
$6.93
$6.89
$6.73
$7.44
$7.71
$7.50
$7.44
Total
return
f
............
2.36%
6.02%
(6.62)%
(1.30)%
5.66%
3.98%
4.11%
Ratios
to
average
net
assets
g
Expenses
h
............
0.75%
0.76%
0.77%
0.75%
0.75%
0.76%
0.76%
Net
investment
income
...
3.49%
3.57%
3.27%
2.52%
2.79%
2.97%
3.38%
Supplemental
data
Net
assets,
end
of
period
(000’s)
...............
$2,737,383
$2,554,655
$2,282,254
$2,412,285
$2,074,343
$1,395,165
$524,756
Portfolio
turnover
rate
....
2.39%
14.01%
42.30%
19.33%
14.41%
15.74%
14.12%
a
For
the
year
ended
February
29.
b
For
the
period
April
1,
2021
to
February
28,
2022.
c
For
the
period
September
10,
2018
(effective
date)
to
March
31,
2019.
d
The
amount
shown
for
a
share
outstanding
throughout
the
period
may
not
correlate
with
the
Statement
of
Operations
for
the
period
due
to
the
timing
of
sales
and
repurchases
of
the
Fund’s
shares
in
relation
to
income
earned
and/or
fluctuating
fair
value
of
the
investments
of
the
Fund.
e
Based
on
average
daily
shares
outstanding.
f
Total
return
does
not
reflect
sales
commissions
or
contingent
deferred
sales
charges,
if
applicable,
and
is
not
annualized
for
periods
less
than
one
year.
g
Ratios
are
annualized
for
periods
less
than
one
year.
h
Benefit
of
expense
reduction
rounds
to
less
than
0.01%.
Franklin
California
Tax-Free
Income
Fund
Financial
Highlights
The
accompanying
notes
are
an
integral
part
of
these
financial
statements.
Semiannual
Report
a
Six
Months
Ended
August
31,
2024
(unaudited)
Year
Ended
February
28,
Year
Ended
February
28,
2022
b
Year
Ended
March
31,
2024
a
2023
2021
2020
2019
Class
A1
Per
share
operating
performance
(for
a
share
outstanding
throughout
the
period)
Net
asset
value,
beginning
of
period
..............
$6.88
$6.72
$7.43
$7.70
$7.49
$7.43
$7.31
Income
from
investment
operations
c
:
Net
investment
income
d
.
0.13
0.25
0.23
0.19
0.23
0.24
0.26
Net
realized
and
unrealized
gains
(losses)
0.04
0.16
(0.71)
(0.27)
0.20
0.07
0.12
Total
from
investment
operations
.............
0.17
0.41
(0.48)
(0.08)
0.43
0.31
0.38
Less
distributions
from:
Net
investment
income
..
(0.13)
(0.25)
(0.23)
(0.19)
(0.22)
(0.25)
(0.26)
Net
asset
value,
end
of
period
................
$6.92
$6.88
$6.72
$7.43
$7.70
$7.49
$7.43
Total
return
e
...........
2.44%
6.18%
(6.48)%
(1.17)%
5.83%
4.14%
5.34%
Ratios
to
average
net
assets
f
Expenses
g
............
0.60%
0.61%
0.62%
0.59%
0.60%
0.61%
0.60%
Net
investment
income
...
3.64%
3.73%
3.42%
2.68%
2.97%
3.12%
3.54%
Supplemental
data
Net
assets,
end
of
period
(000’s)
...............
$7,390,988
$7,640,302
$8,130,315
$10,201,944
$11,084,478
$11,448,334
$11,824,206
Portfolio
turnover
rate
....
2.39%
14.01%
42.30%
19.33%
14.41%
15.74%
14.12%
a
For
the
year
ended
February
29.
b
For
the
period
April
1,
2021
to
February
28,
2022.
c
The
amount
shown
for
a
share
outstanding
throughout
the
period
may
not
correlate
with
the
Statement
of
Operations
for
the
period
due
to
the
timing
of
sales
and
repurchases
of
the
Fund’s
shares
in
relation
to
income
earned
and/or
fluctuating
fair
value
of
the
investments
of
the
Fund.
d
Based
on
average
daily
shares
outstanding.
e
Total
return
does
not
reflect
sales
commissions
or
contingent
deferred
sales
charges,
if
applicable,
and
is
not
annualized
for
periods
less
than
one
year.
f
Ratios
are
annualized
for
periods
less
than
one
year.
g
Benefit
of
expense
reduction
rounds
to
less
than
0.01%.
Franklin
California
Tax-Free
Income
Fund
Financial
Highlights
Semiannual
Report
The
accompanying
notes
are
an
integral
part
of
these
financial
statements.
a
Six
Months
Ended
August
31,
2024
(unaudited)
Year
Ended
February
28,
Year
Ended
February
28,
2022
b
Year
Ended
March
31,
2024
a
2023
2021
2020
2019
Class
C
Per
share
operating
performance
(for
a
share
outstanding
throughout
the
period)
Net
asset
value,
beginning
of
period
..............
$6.87
$6.71
$7.41
$7.69
$7.47
$7.41
$7.30
Income
from
investment
operations
c
:
Net
investment
income
d
.
0.11
0.21
0.20
0.15
0.19
0.20
0.22
Net
realized
and
unrealized
gains
(losses)
0.04
0.16
(0.71)
(0.28)
0.21
0.07
0.11
Total
from
investment
operations
.............
0.15
0.37
(0.51)
(0.13)
0.40
0.27
0.33
Less
distributions
from:
Net
investment
income
..
(0.11)
(0.21)
(0.19)
(0.15)
(0.18)
(0.21)
(0.22)
Net
asset
value,
end
of
period
................
$6.91
$6.87
$6.71
$7.41
$7.69
$7.47
$7.41
Total
return
e
...........
2.16%
5.61%
(6.88)%
(1.80)%
5.40%
3.57%
4.63%
Ratios
to
average
net
assets
f
Expenses
g
............
1.15%
1.16%
1.17%
1.15%
1.16%
1.16%
1.16%
Net
investment
income
...
3.09%
3.19%
2.86%
2.13%
2.42%
2.57%
2.98%
Supplemental
data
Net
assets,
end
of
period
(000’s)
...............
$354,568
$395,396
$502,065
$723,593
$1,018,197
$1,118,612
$1,124,954
Portfolio
turnover
rate
....
2.39%
14.01%
42.30%
19.33%
14.41%
15.74%
14.12%
a
For
the
year
ended
February
29.
b
For
the
period
April
1,
2021
to
February
28,
2022.
c
The
amount
shown
for
a
share
outstanding
throughout
the
period
may
not
correlate
with
the
Statement
of
Operations
for
the
period
due
to
the
timing
of
sales
and
repurchases
of
the
Fund’s
shares
in
relation
to
income
earned
and/or
fluctuating
fair
value
of
the
investments
of
the
Fund.
d
Based
on
average
daily
shares
outstanding.
e
Total
return
does
not
reflect
sales
commissions
or
contingent
deferred
sales
charges,
if
applicable,
and
is
not
annualized
for
periods
less
than
one
year.
f
Ratios
are
annualized
for
periods
less
than
one
year.
g
Benefit
of
expense
reduction
rounds
to
less
than
0.01%.
Franklin
California
Tax-Free
Income
Fund
Financial
Highlights
The
accompanying
notes
are
an
integral
part
of
these
financial
statements.
Semiannual
Report
a
Six
Months
Ended
August
31,
2024
(unaudited)
Year
Ended
February
28,
Year
Ended
February
28,
2022
b
Year
Ended
March
31,
2024
a
2023
2021
2020
2019
Class
R6
Per
share
operating
performance
(for
a
share
outstanding
throughout
the
period)
Net
asset
value,
beginning
of
period
..............
$6.87
$6.71
$7.42
$7.69
$7.48
$7.42
$7.30
Income
from
investment
operations
c
:
Net
investment
income
d
.
0.13
0.26
0.24
0.20
0.24
0.25
0.27
Net
realized
and
unrealized
gains
(losses)
0.04
0.15
(0.71)
(0.28)
0.20
0.07
0.12
Total
from
investment
operations
.............
0.17
0.41
(0.47)
(0.08)
0.44
0.32
0.39
Less
distributions
from:
Net
investment
income
..
(0.13)
(0.25)
(0.24)
(0.19)
(0.23)
(0.26)
(0.27)
Net
asset
value,
end
of
period
................
$6.91
$6.87
$6.71
$7.42
$7.69
$7.48
$7.42
Total
return
e
...........
2.51%
6.33%
(6.37)%
(1.05)%
5.97%
4.28%
5.45%
Ratios
to
average
net
assets
f
Expenses
before
waiver
and
payments
by
affiliates
....
0.47%
0.48%
0.49%
0.47%
0.47%
0.47%
0.47%
Expenses
net
of
waiver
and
payments
by
affiliates
g
....
0.47%
0.48%
0.49%
0.47%
h
0.47%
h
0.46%
0.46%
Net
investment
income
...
3.78%
3.87%
3.55%
2.81%
3.08%
3.27%
3.68%
Supplemental
data
Net
assets,
end
of
period
(000’s)
...............
$351,141
$316,077
$271,190
$345,058
$281,038
$186,078
$103,760
Portfolio
turnover
rate
....
2.39%
14.01%
42.30%
19.33%
14.41%
15.74%
14.12%
a
For
the
year
ended
February
29.
b
For
the
period
April
1,
2021
to
February
28,
2022.
c
The
amount
shown
for
a
share
outstanding
throughout
the
period
may
not
correlate
with
the
Statement
of
Operations
for
the
period
due
to
the
timing
of
sales
and
repurchases
of
the
Fund’s
shares
in
relation
to
income
earned
and/or
fluctuating
fair
value
of
the
investments
of
the
Fund.
d
Based
on
average
daily
shares
outstanding.
e
Total
return
is
not
annualized
for
periods
less
than
one
year.
f
Ratios
are
annualized
for
periods
less
than
one
year.
g
Benefit
of
expense
reduction
rounds
to
less
than
0.01%.
h
Benefit
of
waiver
and
payments
by
affiliates
rounds
to
less
than
0.01%.
Franklin
California
Tax-Free
Income
Fund
Financial
Highlights
Semiannual
Report
The
accompanying
notes
are
an
integral
part
of
these
financial
statements.
a
Six
Months
Ended
August
31,
2024
(unaudited)
Year
Ended
February
28,
Year
Ended
February
28,
2022
b
Year
Ended
March
31,
2024
a
2023
2021
2020
2019
Advisor
Class
Per
share
operating
performance
(for
a
share
outstanding
throughout
the
period)
Net
asset
value,
beginning
of
period
..............
$6.87
$6.71
$7.42
$7.69
$7.48
$7.42
$7.30
Income
from
investment
operations
c
:
Net
investment
income
d
.
0.13
0.26
0.24
0.20
0.24
0.24
0.26
Net
realized
and
unrealized
gains
(losses)
0.04
0.15
(0.72)
(0.28)
0.20
0.08
0.13
Total
from
investment
operations
.............
0.17
0.41
(0.48)
(0.08)
0.44
0.32
0.39
Less
distributions
from:
Net
investment
income
..
(0.13)
(0.25)
(0.23)
(0.19)
(0.23)
(0.26)
(0.27)
Net
asset
value,
end
of
period
................
$6.91
$6.87
$6.71
$7.42
$7.69
$7.48
$7.42
Total
return
e
...........
2.50%
6.30%
(6.40)%
(1.08)%
5.94%
4.24%
5.44%
Ratios
to
average
net
assets
f
Expenses
g
............
0.50%
0.52%
0.52%
0.50%
0.51%
0.51%
0.51%
Net
investment
income
...
3.75%
3.84%
3.53%
2.78%
3.06%
3.22%
3.63%
Supplemental
data
Net
assets,
end
of
period
(000’s)
...............
$2,498,669
$2,425,421
$2,344,189
$2,619,688
$2,498,587
$1,888,402
$1,641,388
Portfolio
turnover
rate
....
2.39%
14.01%
42.30%
19.33%
14.41%
15.74%
14.12%
a
For
the
year
ended
February
29.
b
For
the
period
April
1,
2021
to
February
28,
2022.
c
The
amount
shown
for
a
share
outstanding
throughout
the
period
may
not
correlate
with
the
Statement
of
Operations
for
the
period
due
to
the
timing
of
sales
and
repurchases
of
the
Fund’s
shares
in
relation
to
income
earned
and/or
fluctuating
fair
value
of
the
investments
of
the
Fund.
d
Based
on
average
daily
shares
outstanding.
e
Total
return
is
not
annualized
for
periods
less
than
one
year.
f
Ratios
are
annualized
for
periods
less
than
one
year.
g
Benefit
of
expense
reduction
rounds
to
less
than
0.01%.
Franklin
California
Tax-Free
Income
Fund
Schedule
of
Investments
(unaudited),
August
31,
2024
The
accompanying
notes
are
an
integral
part
of
these
financial
statements.
Semiannual
Report
a
a
Shares
a
Value
a
Common
Stocks
0.0%
Independent
Power
and
Renewable
Electricity
Producers
0.0%
a,b
AES
Guayama
Holdings
BV
...........................................
79,045
$
—
b
Total
Common
Stocks
(Cost
$
–
)
...............................................
—
Principal
Amount
a
a
a
a
c
Senior
Floating
Rate
Interests
0.1%
Real
Estate
Management
&
Development
0.0%
†
a
,d
TBG
Hillcrest
Senior
II
LP
,
First
Lien,
Delayed
Draw
CME
Term
Loan,
B
,
6.89
%
,
(
1-month
SOFR
+
1.55
%
),
1/01/38
.....................................
$
1,946,875
1,946,881
Residential
REITs
0.1%
a
,d
Centennial
Gardens
LP
,
First
Lien,
CME
Term
Loan,
B
,
7.331
%
,
(
12-month
SOFR
+
1.55
%
),
1/01/38
......
10,405,952
10,406,414
First
Lien,
Delayed
Draw
CME
Term
Loan
,
7.352
%
,
(
3-month
SOFR
+
2.001
%
),
1/08/25
.........................................................
1,495,232
1,495,309
11,901,723
a
a
a
a
a
Total
Senior
Floating
Rate
Interests
(Cost
$
13,848,059
)
..........................
13,848,604
Municipal
Bonds
96.6%
California
93.5%
ABAG
Finance
Authority
for
Nonprofit
Corp.
,
Eskaton
Properties,
Inc.
Obligated
Group
,
Revenue
,
2013
,
Refunding
,
5
%
,
11/15/35
................................
10,000,000
10,001,731
Alameda
Corridor
Transportation
Authority
,
Revenue
,
2022
C
,
Refunding
,
AGMC
Insured
,
5
%
,
10/01/52
..................
28,000,000
30,186,708
Revenue,
Sub.
Lien
,
2004
A
,
Refunding
,
AMBAC
Insured
,
Zero
Cpn.,
10/01/29
....
20,000,000
16,958,768
Revenue,
Sub.
Lien
,
2004
A
,
Refunding
,
AMBAC
Insured
,
Zero
Cpn.,
10/01/30
....
41,665,000
34,020,768
Alameda
Unified
School
District
,
GO
,
2015
A
,
5
%
,
8/01/39
.....................
18,000,000
18,293,000
Alhambra
City
Elementary
School
District
,
Alhambra
Unified
School
District
,
GO
,
2004
B
,
NATL
Insured
,
Zero
Cpn.,
9/01/27
...................................
3,035,000
2,773,415
Align
Capital
Trust
,
Revenue
,
2023-1
,
5.5
%
,
3/01/35
.........................
13,000,000
13,112,450
Alisal
Union
School
District
,
GO
,
2009
B
,
AGMC
Insured
,
Zero
Cpn.,
8/01/32
...........................
3,355,000
2,642,568
GO
,
2009
B
,
AGMC
Insured
,
Zero
Cpn.,
8/01/33
...........................
3,610,000
2,742,754
GO
,
2009
B
,
AGMC
Insured
,
Zero
Cpn.,
2/01/34
...........................
3,345,000
2,492,796
Alta
Loma
School
District
,
GO
,
2019
B
,
5
%
,
8/01/44
.........................
7,375,000
7,709,158
Alvord
Unified
School
District
,
GO
,
2011
B
,
AGMC
Insured
,
Zero
Cpn.,
8/01/36
...........................
15,000,000
9,296,053
GO
,
2011
B
,
AGMC
Insured
,
Zero
Cpn.,
8/01/46
...........................
42,500,000
50,145,338
Anaheim
Housing
&
Public
Improvements
Authority
,
City
of
Anaheim
Electric
System
,
Revenue
,
2022
A
,
Refunding
,
5
%
,
10/01/52
.....
8,040,000
8,316,387
City
of
Anaheim
Water
System
,
Revenue
,
2022
A
,
5
%
,
10/01/52
...............
8,345,000
8,644,145
Anaheim
Public
Financing
Authority
,
City
of
Anaheim
,
Revenue
,
1997
C
,
AGMC
Insured
,
Zero
Cpn.,
9/01/24
.........
26,855,000
26,855,000
City
of
Anaheim
,
Revenue
,
1997
C
,
AGMC
Insured
,
Zero
Cpn.,
9/01/26
.........
29,430,000
27,876,744
City
of
Anaheim
,
Revenue
,
1997
C
,
AGMC
Insured
,
Zero
Cpn.,
9/01/27
.........
22,860,000
21,063,078
City
of
Anaheim
,
Revenue
,
1997
C
,
AGMC
Insured
,
Zero
Cpn.,
9/01/28
.........
14,425,000
12,924,604
City
of
Anaheim
,
Revenue
,
1997
C
,
AGMC
Insured
,
Zero
Cpn.,
9/01/29
.........
24,810,000
21,606,210
City
of
Anaheim
,
Revenue
,
1997
C
,
AGMC
Insured
,
Zero
Cpn.,
9/01/32
.........
13,665,000
10,730,686
City
of
Anaheim
,
Revenue
,
1997
C
,
AGMC
Insured
,
Zero
Cpn.,
9/01/33
.........
37,070,000
28,078,449
City
of
Anaheim
,
Revenue
,
1997
C
,
AGMC
Insured
,
Zero
Cpn.,
9/01/34
.........
24,970,000
18,180,472
City
of
Anaheim
,
Revenue
,
1997
C
,
AGMC
Insured
,
ETM,
Zero
Cpn.,
3/01/37
.....
15,080,000
10,134,006
Anaheim
Union
High
School
District
,
GO
,
2002
A
,
AGMC
Insured
,
Zero
Cpn.,
8/01/26
8,570,000
8,144,789
Bay
Area
Toll
Authority
,
Revenue
,
2017
S-7
,
Refunding
,
4
%
,
4/01/42
.............................
119,305,000
119,746,166
Revenue
,
2017
S-7
,
Refunding
,
4
%
,
4/01/47
.............................
23,330,000
23,169,697
Franklin
California
Tax-Free
Income
Fund
Schedule
of
Investments
(unaudited)
Semiannual
Report
The
accompanying
notes
are
an
integral
part
of
these
financial
statements.
a
a
Principal
Amount
a
Value
a
a
a
a
a
Municipal
Bonds
(continued)
California
(continued)
Bay
Area
Toll
Authority,
(continued)
Revenue
,
2017
S-7
,
Refunding
,
4
%
,
4/01/49
.............................
$
13,625,000
$
13,403,707
e
Revenue
,
2021
A
,
Refunding
,
Mandatory
Put
,
2
%
,
4/01/28
...................
12,000,000
11,392,495
Beaumont
Public
Improvement
Authority
,
City
of
Beaumont
Wastewater
,
Revenue
,
2018
A
,
AGMC
Insured
,
5
%
,
9/01/49
...................................
10,000,000
10,338,628
Beaumont
Unified
School
District
,
GO
,
2011
C
,
AGMC
Insured
,
Zero
Cpn.,
8/01/40
..
11,000,000
5,840,080
Burbank-Glendale-Pasadena
Airport
Authority
Brick
Campaign
,
Revenue,
Senior
Lien
,
2024
B
,
5.25
%
,
7/01/49
............................
8,500,000
9,188,822
Revenue,
Senior
Lien
,
2024
B
,
5.25
%
,
7/01/54
............................
6,750,000
7,240,665
Cabrillo
Unified
School
District
,
GO
,
2018
A
,
5
%
,
8/01/45
.....................
4,245,000
4,359,517
California
Affordable
Housing
Agency
,
Butte
County
Housing
Authority
,
Revenue
,
2020
A
,
4
%
,
10/01/40
..............
1,580,000
1,577,899
Butte
County
Housing
Authority
,
Revenue
,
2020
A
,
4
%
,
10/01/45
..............
1,930,000
1,844,700
Butte
County
Housing
Authority
,
Revenue
,
2020
A
,
4
%
,
10/01/50
..............
1,855,000
1,781,323
e
California
Community
Choice
Financing
Authority
,
Revenue
,
2022
A-1
,
Mandatory
Put
,
4
%
,
8/01/28
..........................
100,000,000
101,269,530
Revenue
,
2023
C
,
Mandatory
Put
,
5.25
%
,
10/01/31
........................
122,575,000
131,572,532
Revenue
,
2023
E-1
,
Mandatory
Put
,
5
%
,
3/01/31
..........................
38,855,000
41,755,149
Revenue
,
2023
G-1
,
Mandatory
Put
,
5.25
%
,
4/01/30
.......................
23,500,000
25,348,613
Revenue
,
2024
B
,
Mandatory
Put
,
5
%
,
12/01/32
...........................
51,000,000
55,042,184
California
Community
College
Financing
Authority
,
Revenue
,
2001
A
,
NATL
Insured
,
5.125
%
,
4/01/31
.........................
880,000
881,214
NCCD-Orange
Coast
Properties
LLC
,
Revenue
,
2018
,
5.25
%
,
5/01/53
..........
8,150,000
8,339,888
f
California
Community
Housing
Agency
,
Aster
Apartments
,
Revenue,
Senior
Lien
,
144A,
2021
A-1
,
4
%
,
2/01/56
..........
5,235,000
4,667,834
Brio
Apartments
&
Next
on
Lex
Apartments
,
Revenue,
Senior
Lien
,
144A,
2021
A-1
,
4
%
,
2/01/56
....................................................
35,015,000
29,988,212
Exchange
at
Bayfront
Apartments
,
Revenue,
Senior
Lien
,
144A,
201
A-1
T
,
4.25
%
,
2/01/38
........................................................
7,095,000
6,283,078
Exchange
at
Bayfront
Apartments
,
Revenue,
Senior
Lien
,
144A,
2021
A-1
,
3
%
,
2/01/57
........................................................
59,855,000
38,780,258
Fountains
at
Emerald
Park
,
Revenue,
Junior
Lien
,
144A,
2021
A-2
,
4
%
,
8/01/46
...
14,740,000
12,826,035
Fountains
at
Emerald
Park
,
Revenue,
Senior
Lien
,
144A,
2021
A-1
,
3
%
,
8/01/56
..
46,440,000
34,895,805
K
Street
Flats
,
Revenue
,
144A,
2021
A-1
,
3
%
,
2/01/57
......................
47,500,000
33,697,768
Summit
at
Sausalito
Apartments
,
Revenue
,
144A,
2021
A-1
,
3
%
,
2/01/57
........
16,260,000
11,790,419
Twin
Creek
Apartments
,
Revenue
,
144A,
2022
A-1
,
4.5
%
,
8/01/52
.............
29,275,000
24,217,413
Twin
Creek
Apartments
,
Revenue,
Senior
Lien
,
144A,
2022
A-2
,
Zero
Cpn.,
8/01/65
79,990,000
3,413,941
Verdant
at
Green
Valley
Apartments
,
Revenue
,
144A,
2019
A
,
5
%
,
8/01/49
.......
15,765,000
15,165,976
California
County
Tobacco
Securitization
Agency
,
Gold
Country
Settlement
Funding
Corp.
,
Revenue
,
2020
A
,
Refunding
,
4
%
,
6/01/40
1,120,000
1,123,510
Gold
Country
Settlement
Funding
Corp.
,
Revenue
,
2020
A
,
Refunding
,
4
%
,
6/01/49
2,000,000
1,868,554
Kern
County
Tobacco
Funding
Corp.
,
Revenue
,
2014
,
Refunding
,
5
%
,
6/01/34
....
9,905,000
9,908,221
Kern
County
Tobacco
Funding
Corp.
,
Revenue
,
2014
,
Refunding
,
5
%
,
6/01/40
....
17,650,000
17,653,179
Los
Angeles
County
Securitization
Corp.
,
Revenue
,
2020
B-1
,
Refunding
,
5
%
,
6/01/49
........................................................
330,000
337,913
Los
Angeles
County
Securitization
Corp.
,
Revenue,
Senior
Lien
,
2020
A
,
Refunding
,
4
%
,
6/01/49
....................................................
3,525,000
3,293,327
Merced
County
Tobacco
Funding
Corp.
,
Revenue,
Senior
Lien
,
2020
A
,
Refunding
,
4
%
,
6/01/36
....................................................
470,000
480,594
Merced
County
Tobacco
Funding
Corp.
,
Revenue,
Senior
Lien
,
2020
A
,
Refunding
,
4
%
,
6/01/38
....................................................
530,000
536,643
Merced
County
Tobacco
Funding
Corp.
,
Revenue,
Senior
Lien
,
2020
A
,
Refunding
,
4
%
,
6/01/40
....................................................
625,000
626,959
Merced
County
Tobacco
Funding
Corp.
,
Revenue,
Senior
Lien
,
2020
A
,
Refunding
,
4
%
,
6/01/42
....................................................
100,000
98,561
Sonoma
County
Securitization
Corp.
,
Revenue
,
2020
A
,
Refunding
,
4
%
,
6/01/35
..
350,000
359,052
Sonoma
County
Securitization
Corp.
,
Revenue
,
2020
A
,
Refunding
,
4
%
,
6/01/36
..
600,000
613,524
Franklin
California
Tax-Free
Income
Fund
Schedule
of
Investments
(unaudited)
The
accompanying
notes
are
an
integral
part
of
these
financial
statements.
Semiannual
Report
a
a
Principal
Amount
a
Value
a
a
a
a
a
Municipal
Bonds
(continued)
California
(continued)
California
County
Tobacco
Securitization
Agency,
(continued)
Sonoma
County
Securitization
Corp.
,
Revenue
,
2020
A
,
Refunding
,
4
%
,
6/01/37
..
$
530,000
$
539,480
Sonoma
County
Securitization
Corp.
,
Revenue
,
2020
A
,
Refunding
,
4
%
,
6/01/38
..
790,000
799,901
Sonoma
County
Securitization
Corp.
,
Revenue
,
2020
A
,
Refunding
,
4
%
,
6/01/39
..
620,000
625,089
Sonoma
County
Securitization
Corp.
,
Revenue
,
2020
A
,
Refunding
,
4
%
,
6/01/40
..
830,000
832,601
Sonoma
County
Securitization
Corp.
,
Revenue
,
2020
A
,
Refunding
,
4
%
,
6/01/49
..
3,520,000
3,288,655
Sonoma
County
Securitization
Corp.
,
Revenue
,
2020
B-1
,
Refunding
,
5
%
,
6/01/49
.
545,000
559,057
Stanislaus
County
Tobacco
Funding
Corp.
,
Revenue
,
2002
A
,
5.875
%
,
6/01/43
...
3,165,000
3,182,808
California
Educational
Facilities
Authority
,
Art
Center
College
of
Design
,
Revenue
,
2022
A
,
4
%
,
12/01/40
................
1,295,000
1,265,488
Art
Center
College
of
Design
,
Revenue
,
2022
A
,
4
%
,
12/01/41
................
1,345,000
1,302,272
Art
Center
College
of
Design
,
Revenue
,
2022
A
,
4
%
,
12/01/42
................
1,400,000
1,343,450
Art
Center
College
of
Design
,
Revenue
,
2022
A
,
4
%
,
12/01/46
................
3,000,000
2,806,284
Art
Center
College
of
Design
,
Revenue
,
2022
A
,
4
%
,
12/01/50
................
2,675,000
2,438,025
Art
Center
College
of
Design
,
Revenue
,
2022
A
,
3
%
,
12/01/51
................
650,000
480,918
Chapman
University
,
Revenue
,
2015
,
5
%
,
4/01/40
.........................
5,000,000
5,027,705
Chapman
University
,
Revenue
,
2015
,
5
%
,
4/01/45
.........................
5,000,000
5,020,709
Chapman
University
,
Revenue
,
2021
A
,
Refunding
,
5
%
,
4/01/27
...............
475,000
504,554
Chapman
University
,
Revenue
,
2021
A
,
Refunding
,
5
%
,
4/01/28
...............
395,000
428,194
Chapman
University
,
Revenue
,
2021
A
,
Refunding
,
5
%
,
4/01/29
...............
400,000
440,639
Chapman
University
,
Revenue
,
2021
A
,
Refunding
,
5
%
,
4/01/30
...............
425,000
475,916
Chapman
University
,
Revenue
,
2021
A
,
Refunding
,
5
%
,
4/01/31
...............
475,000
537,670
Leland
Stanford
Junior
University
(The)
,
Revenue
,
T-1
,
5
%
,
3/15/39
............
2,815,000
3,475,966
Leland
Stanford
Junior
University
(The)
,
Revenue
,
U-1
,
5.25
%
,
4/01/40
.........
5,000,000
6,366,928
Leland
Stanford
Junior
University
(The)
,
Revenue
,
U-6
,
5
%
,
5/01/45
............
7,000,000
8,699,312
Leland
Stanford
Junior
University
(The)
,
Revenue
,
V-1
,
5
%
,
5/01/49
............
20,850,000
25,897,057
Loma
Linda
University
,
Revenue
,
2017
A
,
Refunding
,
5
%
,
4/01/47
.............
11,000,000
11,226,531
Loyola
Marymount
University
,
Revenue
,
2001
A
,
NATL
Insured
,
Zero
Cpn.,
10/01/26
7,620,000
7,157,193
Loyola
Marymount
University
,
Revenue
,
2001
A
,
NATL
Insured
,
Zero
Cpn.,
10/01/27
7,365,000
6,709,018
Loyola
Marymount
University
,
Revenue
,
2001
A
,
NATL
Insured
,
Zero
Cpn.,
10/01/28
4,120,000
3,638,644
Loyola
Marymount
University
,
Revenue
,
2001
A
,
NATL
Insured
,
Zero
Cpn.,
10/01/30
5,685,000
4,692,215
Loyola
Marymount
University
,
Revenue
,
2001
A
,
NATL
Insured
,
Zero
Cpn.,
10/01/31
7,615,000
6,051,136
Loyola
Marymount
University
,
Revenue
,
2001
A
,
NATL
Insured
,
Zero
Cpn.,
10/01/32
7,615,000
5,821,639
Santa
Clara
University
,
Revenue
,
1999
,
AMBAC
Insured
,
Zero
Cpn.,
9/01/26
.....
2,075,000
1,914,248
Santa
Clara
University
,
Revenue
,
2015
,
Refunding
,
5
%
,
4/01/45
...............
15,495,000
15,626,531
St.
Mary's
College
of
California
,
Revenue
,
2023
A
,
Refunding
,
5.5
%
,
10/01/53
....
9,350,000
9,987,243
University
of
Redlands
,
Revenue
,
2022
A
,
5
%
,
10/01/44
.....................
3,835,000
3,993,512
University
of
Redlands
,
Revenue
,
2022
A
,
5
%
,
10/01/52
.....................
18,790,000
19,299,410
University
of
San
Francisco
,
Revenue
,
2018
A
,
5
%
,
10/01/48
.................
10,000,000
10,408,785
University
of
San
Francisco
,
Revenue
,
2018
A
,
5
%
,
10/01/53
.................
10,000,000
10,367,322
California
Enterprise
Development
Authority
,
Provident
Group-SDSU
Properties
LLC
,
Revenue,
First
Tier
,
2020
A
,
5
%
,
8/01/40
..
650,000
670,953
Provident
Group-SDSU
Properties
LLC
,
Revenue,
First
Tier
,
2020
A
,
5
%
,
8/01/45
..
650,000
667,678
Provident
Group-SDSU
Properties
LLC
,
Revenue,
First
Tier
,
2020
A
,
5
%
,
8/01/50
..
650,000
666,903
Provident
Group-SDSU
Properties
LLC
,
Revenue,
First
Tier
,
2020
A
,
5
%
,
8/01/55
..
3,175,000
3,232,869
Provident
Group-SDSU
Properties
LLC
,
Revenue,
First
Tier
,
2020
A
,
5
%
,
8/01/57
..
500,000
507,822
California
Health
Facilities
Financing
Authority
,
Adventist
Health
System/West
Obligated
Group
,
Revenue
,
2024
A
,
5
%
,
12/01/28
..
24,200,000
26,287,146
Casa
Milagro
LLC
,
Revenue
,
2011
A
,
California
Mortgage
Insured
,
6.25
%
,
2/01/26
.
2,730,000
2,737,747
Cedars-Sinai
Medical
Center
Obligated
Group
,
Revenue
,
2021
A
,
Refunding
,
5
%
,
8/15/41
........................................................
5,000,000
5,524,478
Children's
Hospital
Los
Angeles
Obligated
Group
,
Revenue
,
2017
A
,
Refunding
,
5
%
,
8/15/42
........................................................
14,370,000
14,789,255
Children's
Hospital
Los
Angeles
Obligated
Group
,
Revenue
,
2017
A
,
Refunding
,
5
%
,
8/15/47
........................................................
7,750,000
7,927,080
Children's
Hospital
of
Orange
County
Obligated
Group
,
Revenue
,
2021
B
,
Refunding
,
5
%
,
11/01/27
...................................................
1,000,000
1,077,757
Franklin
California
Tax-Free
Income
Fund
Schedule
of
Investments
(unaudited)
Semiannual
Report
The
accompanying
notes
are
an
integral
part
of
these
financial
statements.
a
a
Principal
Amount
a
Value
a
a
a
a
a
Municipal
Bonds
(continued)
California
(continued)
California
Health
Facilities
Financing
Authority,
(continued)
Children's
Hospital
of
Orange
County
Obligated
Group
,
Revenue
,
2021
B
,
Refunding
,
5
%
,
11/01/29
...................................................
$
1,350,000
$
1,512,211
City
of
Hope
Obligated
Group
,
Revenue
,
2019
,
5
%
,
11/15/49
.................
27,000,000
27,432,362
CommonSpirit
Health
Obligated
Group
,
Revenue
,
2020
A
,
Refunding
,
4
%
,
4/01/36
.
15,770,000
16,112,099
CommonSpirit
Health
Obligated
Group
,
Revenue
,
2020
A
,
Refunding
,
4
%
,
4/01/37
.
3,000,000
3,051,990
CommonSpirit
Health
Obligated
Group
,
Revenue
,
2020
A
,
Refunding
,
4
%
,
4/01/38
.
7,075,000
7,164,006
CommonSpirit
Health
Obligated
Group
,
Revenue
,
2020
A
,
Refunding
,
3
%
,
4/01/44
.
4,340,000
3,703,756
El
Camino
Hospital
,
Revenue
,
2017
,
4.125
%
,
2/01/47
......................
11,000,000
10,799,198
El
Camino
Hospital
,
Revenue
,
2017
,
5
%
,
2/01/47
..........................
12,500,000
12,875,189
Episcopal
Communities
&
Services
for
Seniors
Obligated
Group
,
Revenue
,
2024
B
,
5.25
%
,
11/15/48
.................................................
1,905,000
2,035,961
Episcopal
Communities
&
Services
for
Seniors
Obligated
Group
,
Revenue
,
2024
B
,
5.25
%
,
11/15/53
.................................................
1,945,000
2,065,271
Episcopal
Communities
&
Services
for
Seniors
Obligated
Group
,
Revenue
,
2024
B
,
5.25
%
,
11/15/58
.................................................
3,000,000
3,169,377
Kaiser
Foundation
Hospitals
,
Revenue
,
2017
A-2
,
4
%
,
11/01/38
...............
25,000,000
25,110,518
Kaiser
Foundation
Hospitals
,
Revenue
,
2017
A-2
,
4
%
,
11/01/44
...............
411,225,000
406,694,329
Kaiser
Foundation
Hospitals
,
Revenue
,
2017
A-2
,
5
%
,
11/01/47
...............
12,500,000
15,170,945
Lucile
Salter
Packard
Children's
Hospital
at
Stanford
Obligated
Group
,
Revenue
,
2016
B
,
5
%
,
8/15/55
..............................................
24,000,000
24,340,502
Lucile
Salter
Packard
Children's
Hospital
at
Stanford
Obligated
Group
,
Revenue
,
2017
A
,
5
%
,
11/15/56
.............................................
10,300,000
10,645,614
Marshall
Medical
Center
,
Revenue
,
2020
A
,
Refunding
,
California
Mortgage
Insured
,
4
%
,
11/01/40
...................................................
3,750,000
3,795,665
Marshall
Medical
Center
,
Revenue
,
2020
A
,
Refunding
,
California
Mortgage
Insured
,
5
%
,
11/01/50
...................................................
25,065,000
26,381,228
On
Lok
Senior
Health
Services
Obligated
Group
,
Revenue
,
2020
,
Refunding
,
5
%
,
8/01/40
........................................................
800,000
845,839
On
Lok
Senior
Health
Services
Obligated
Group
,
Revenue
,
2020
,
Refunding
,
5
%
,
8/01/50
........................................................
2,375,000
2,461,707
On
Lok
Senior
Health
Services
Obligated
Group
,
Revenue
,
2020
,
Refunding
,
5
%
,
8/01/55
........................................................
850,000
876,569
Providence
St.
Joseph
Health
Obligated
Group
,
Revenue
,
2014
A
,
5
%
,
10/01/38
..
5,110,000
5,112,225
Scripps
Health
Obligated
Group
,
Revenue
,
2024
A
,
Refunding
,
5
%
,
11/15/43
.....
2,500,000
2,816,370
Sequoia
Living,
Inc.
,
Revenue
,
2015
,
Refunding
,
California
Mortgage
Insured
,
5
%
,
7/01/34
........................................................
1,000,000
1,017,131
Sequoia
Living,
Inc.
,
Revenue
,
2015
,
Refunding
,
California
Mortgage
Insured
,
5
%
,
7/01/39
........................................................
1,450,000
1,470,080
Sequoia
Living,
Inc.
,
Revenue
,
2015
,
Refunding
,
California
Mortgage
Insured
,
5
%
,
7/01/44
........................................................
1,160,000
1,173,308
Sutter
Health
Obligated
Group
,
Revenue
,
2016
B
,
5
%
,
11/15/46
...............
42,105,000
43,207,642
Sutter
Health
Obligated
Group
,
Revenue
,
2017
A
,
Refunding
,
4
%
,
11/15/48
......
10,585,000
10,238,754
Sutter
Health
Obligated
Group
,
Revenue
,
2017
A
,
Refunding
,
5
%
,
11/15/48
......
21,690,000
22,420,647
Sutter
Health
Obligated
Group
,
Revenue
,
2018
A
,
4
%
,
11/15/42
...............
11,680,000
11,614,433
Sutter
Health
Obligated
Group
,
Revenue
,
2018
A
,
5
%
,
11/15/48
...............
24,500,000
25,325,305
California
Housing
Finance
Agency
,
Revenue
,
2019-1
,
A
,
4.25
%
,
1/15/35
...................................
46,334,048
48,467,824
Revenue
,
2019-2
,
A
,
4
%
,
3/20/33
......................................
14,054,699
14,471,603
Revenue
,
2021-1
,
A
,
3.5
%
,
11/20/35
...................................
4,740,719
4,613,607
f
Found
Middle
LP
,
Revenue
,
144A,
2024
L
,
5.2
%
,
12/01/27
...................
5,000,000
5,055,638
e,f
Shermanair
Apartments
Owner
LP
,
Revenue
,
144A,
2021
Q-1
,
Mandatory
Put
,
3
%
,
9/01/36
........................................................
22,535,000
20,244,565
f
Shermanair
Apartments
Owner
LP
,
Revenue
,
144A,
2021
Q-2
,
5
%
,
9/01/36
......
1,940,000
1,634,939
California
Infrastructure
&
Economic
Development
Bank
,
Broad
(The)
,
Revenue
,
2021
A
,
Refunding
,
5
%
,
6/01/28
.....................
500,000
548,572
California
State
Teachers'
Retirement
System
,
Revenue
,
2019
,
5
%
,
8/01/44
......
12,750,000
13,627,621
Franklin
California
Tax-Free
Income
Fund
Schedule
of
Investments
(unaudited)
The
accompanying
notes
are
an
integral
part
of
these
financial
statements.
Semiannual
Report
a
a
Principal
Amount
a
Value
a
a
a
a
a
Municipal
Bonds
(continued)
California
(continued)
California
Infrastructure
&
Economic
Development
Bank,
(continued)
California
State
Teachers'
Retirement
System
,
Revenue
,
2019
,
5
%
,
8/01/49
......
$
25,470,000
$
26,989,125
California
State
Water
Resources
Control
Board
Water
Pollution
Control
Revolving
Fund
,
Revenue
,
2018
,
5
%
,
10/01/43
..................................
10,000,000
10,495,916
Equitable
School
Revolving
Fund
LLC
Obligated
Group
,
Revenue
,
2020
B
,
4
%
,
11/01/45
.......................................................
850,000
846,290
Equitable
School
Revolving
Fund
LLC
Obligated
Group
,
Revenue
,
2020
B
,
4
%
,
11/01/50
.......................................................
860,000
835,025
Equitable
School
Revolving
Fund
LLC
Obligated
Group
,
Revenue
,
2021
B
,
4
%
,
11/01/56
.......................................................
1,000,000
950,779
Equitable
School
Revolving
Fund
LLC
Obligated
Group
,
Revenue
,
2022
B
,
5
%
,
11/01/47
.......................................................
2,300,000
2,463,980
Equitable
School
Revolving
Fund
LLC
Obligated
Group
,
Revenue
,
2022
B
,
4.125
%
,
11/01/52
.......................................................
3,100,000
3,049,633
Equitable
School
Revolving
Fund
LLC
Obligated
Group
,
Revenue
,
2022
B
,
5
%
,
11/01/57
.......................................................
5,500,000
5,807,653
Los
Angeles
County
Museum
of
Natural
History
Foundation
,
Revenue
,
2020
,
Refunding
,
3
%
,
7/01/50
............................................
18,995,000
15,068,855
e
Museum
Associates
,
Revenue
,
2021
A
,
Refunding
,
Mandatory
Put
,
1.2
%
,
6/01/28
.
15,000,000
13,432,459
University
of
California
,
Revenue
,
2017
,
5
%
,
5/15/52
.......................
31,305,000
32,700,837
California
Municipal
Finance
Authority
,
Revenue,
Senior
Lien
,
2017
A
,
Refunding
,
4
%
,
8/15/52
.....................
27,350,000
25,751,165
1717
University
Associates
LLC
,
Revenue
,
2020
A
,
4.5
%
,
6/01/52
.............
11,413,000
10,448,956
1717
University
Associates
LLC
,
Revenue
,
2020
A-T
,
5.25
%
,
6/01/52
...........
3,407,000
2,730,068
Bethany
Home
Society
of
San
Joaquin
County,
Inc.
,
Revenue
,
2023
,
California
Mortgage
Insured
,
5
%
,
11/15/52
.....................................
26,465,000
28,699,421
California
Institute
of
the
Arts
,
Revenue
,
2021
,
4
%
,
10/01/51
.................
2,355,000
2,139,719
g
Caritas
Corp.
CMFA
Mobile
Home
Park
Financing
2024
Portfolio
,
Revenue
,
2024
A
,
Refunding
,
5
%
,
8/15/49
............................................
1,235,000
1,338,212
g
Caritas
Corp.
CMFA
Mobile
Home
Park
Financing
2024
Portfolio
,
Revenue
,
2024
A
,
Refunding
,
5
%
,
8/15/54
............................................
1,800,000
1,936,602
g
Caritas
Corp.
CMFA
Mobile
Home
Park
Financing
2024
Portfolio
,
Revenue
,
2024
A
,
Refunding
,
5
%
,
8/15/59
............................................
2,600,000
2,775,403
Carmel
Valley
Manor
Obligated
Group
,
Revenue
,
2022
,
California
Mortgage
Insured
,
5
%
,
5/15/52
....................................................
17,775,000
19,188,919
f
Century
CityView
LP
,
Revenue
,
144A,
2021
A
,
4
%
,
11/01/36
..................
10,375,000
9,967,960
Channing
House
,
Revenue
,
2017
B
,
California
Mortgage
Insured
,
5
%
,
5/15/47
....
10,000,000
10,277,975
CHF-Davis
I
LLC
,
Revenue
,
2018
,
5
%
,
5/15/51
...........................
10,000,000
10,252,915
CHF-Davis
II
LLC
,
Revenue
,
2021
,
BAM
Insured
,
5
%
,
5/15/25
................
400,000
404,587
CHF-Davis
II
LLC
,
Revenue
,
2021
,
BAM
Insured
,
5
%
,
5/15/26
................
400,000
413,627
CHF-Davis
II
LLC
,
Revenue
,
2021
,
BAM
Insured
,
5
%
,
5/15/27
................
500,000
526,550
CHF-Davis
II
LLC
,
Revenue
,
2021
,
BAM
Insured
,
5
%
,
5/15/28
................
400,000
428,269
CHF-Davis
II
LLC
,
Revenue
,
2021
,
BAM
Insured
,
5
%
,
5/15/29
................
600,000
652,494
CHF-Davis
II
LLC
,
Revenue
,
2021
,
BAM
Insured
,
5
%
,
5/15/30
................
700,000
770,035
City
of
Elk
Grove
Community
Facilities
District
No.
2023-7
Improvement
Area
No.
1
,
Special
Tax
,
2024
,
5
%
,
9/01/39
......................................
580,000
627,114
City
of
Elk
Grove
Community
Facilities
District
No.
2023-7
Improvement
Area
No.
1
,
Special
Tax
,
2024
,
5
%
,
9/01/44
......................................
900,000
953,729
City
of
Elk
Grove
Community
Facilities
District
No.
2023-7
Improvement
Area
No.
1
,
Special
Tax
,
2024
,
5
%
,
9/01/49
......................................
785,000
822,484
City
of
Elk
Grove
Community
Facilities
District
No.
2023-7
Improvement
Area
No.
1
,
Special
Tax
,
2024
,
5
%
,
9/01/54
......................................
750,000
780,128
Community
Hospitals
of
Central
California
Obligated
Group
,
Revenue
,
2017
A
,
Refunding
,
5
%
,
2/01/42
............................................
15,900,000
16,143,478
Community
Hospitals
of
Central
California
Obligated
Group
,
Revenue
,
2017
A
,
Refunding
,
5
%
,
2/01/47
............................................
19,145,000
19,311,925
Community
Hospitals
of
Central
California
Obligated
Group
,
Revenue
,
2021
A
,
4
%
,
2/01/51
........................................................
7,000,000
6,368,093
Franklin
California
Tax-Free
Income
Fund
Schedule
of
Investments
(unaudited)
Semiannual
Report
The
accompanying
notes
are
an
integral
part
of
these
financial
statements.
a
a
Principal
Amount
a
Value
a
a
a
a
a
Municipal
Bonds
(continued)
California
(continued)
California
Municipal
Finance
Authority,
(continued)
Concordia
University
Irvine
,
Revenue
,
2021
,
4
%
,
1/01/37
....................
$
1,040,000
$
1,049,795
Concordia
University
Irvine
,
Revenue
,
2021
,
4
%
,
1/01/38
....................
1,000,000
1,001,560
Concordia
University
Irvine
,
Revenue
,
2021
,
4
%
,
1/01/39
....................
1,100,000
1,088,669
Concordia
University
Irvine
,
Revenue
,
2021
,
4
%
,
1/01/40
....................
1,175,000
1,154,523
Concordia
University
Irvine
,
Revenue
,
2021
,
4
%
,
1/01/41
....................
1,280,000
1,248,198
Congregational
Homes,
Inc.
Obligated
Group
,
Revenue
,
2022
A
,
4
%
,
11/15/42
....
450,000
411,213
Congregational
Homes,
Inc.
Obligated
Group
,
Revenue
,
2022
A
,
4
%
,
11/15/52
....
1,000,000
839,004
Congregational
Homes,
Inc.
Obligated
Group
,
Revenue
,
2022
A
,
4
%
,
11/15/56
....
1,100,000
903,566
Eisenhower
Medical
Center
,
Revenue
,
2017
A
,
Refunding
,
5
%
,
7/01/47
.........
9,100,000
9,168,995
f
IH
Citrus
Whittier
LLC
,
Revenue
,
144A,
2023
,
I-A
,
6.25
%
,
1/01/60
.............
29,830,000
30,832,258
f
IH
Citrus
Whittier
LLC
,
Revenue
,
144A,
2023
,
I-B
,
9
%
,
7/01/42
................
1,800,000
1,844,795
f
IH
Lakes
Concord
LLC
,
Revenue
,
144A,
2022
A-1
,
4.375
%
,
12/01/32
...........
22,510,000
22,028,342
f
IH
Parkside
Fairfield
LLC
,
Revenue
,
144A,
2023
A-1
,
6.75
%
,
9/01/53
...........
51,750,000
56,859,816
f
IH
Parkside
Fairfield
LLC
,
Revenue
,
144A,
2023
A-2
,
8
%
,
9/01/27
.............
565,000
578,312
Inland
Christian
Home,
Inc.
,
Revenue
,
2020
,
California
Mortgage
Insured
,
4
%
,
12/01/49
.......................................................
2,670,000
2,659,178
Inland
Counties
Regional
Center,
Inc.
,
Revenue
,
2015
,
Refunding
,
5
%
,
6/15/45
...
23,300,000
23,448,645
Integrity
Housing
Obligated
Group
,
Revenue
,
2022
A-1
,
4.25
%
,
12/01/37
........
81,985,000
72,641,063
LAX
Integrated
Express
Solutions
LLC
,
Revenue,
Senior
Lien
,
2018
A
,
5
%
,
12/31/37
8,500,000
8,767,475
LAX
Integrated
Express
Solutions
LLC
,
Revenue,
Senior
Lien
,
2018
A
,
5
%
,
12/31/38
5,000,000
5,143,968
LAX
Integrated
Express
Solutions
LLC
,
Revenue,
Senior
Lien
,
2018
A
,
5
%
,
12/31/43
46,895,000
47,778,694
LAX
Integrated
Express
Solutions
LLC
,
Revenue,
Senior
Lien
,
2018
A
,
5
%
,
12/31/47
55,745,000
56,480,271
LAX
Integrated
Express
Solutions
LLC
,
Revenue,
Senior
Lien
,
2018
B
,
5
%
,
6/01/48
14,325,000
14,492,007
f
NCCD-Claremont
Properties
LLC
,
Revenue
,
144A,
2023
A
,
Refunding
,
5.25
%
,
7/01/40
........................................................
7,065,000
7,390,391
f
NCCD-Claremont
Properties
LLC
,
Revenue
,
144A,
2023
A
,
Refunding
,
5.5
%
,
7/01/50
21,145,000
22,146,618
f
NCCD-Claremont
Properties
LLC
,
Revenue
,
144A,
2023
A
,
Refunding
,
6
%
,
7/01/53
12,485,000
13,370,924
f
NCCD-Claremont
Properties
LLC
,
Revenue
,
144A,
2023
B
,
Refunding
,
6.5
%
,
7/01/32
........................................................
2,470,000
2,466,595
Northbay
Healthcare
Group
Obligated
Group
,
Revenue
,
2017
A
,
5.25
%
,
11/01/41
..
5,500,000
5,517,224
Northbay
Healthcare
Group
Obligated
Group
,
Revenue
,
2017
A
,
5
%
,
11/01/47
....
8,650,000
8,658,537
Northern
California
Retired
Officers
Community
,
Revenue
,
2019
A
,
California
Mortgage
Insured
,
5
%
,
1/01/43
......................................
10,000,000
10,508,753
Northern
California
Retired
Officers
Community
,
Revenue
,
2019
A
,
California
Mortgage
Insured
,
5
%
,
1/01/49
......................................
18,990,000
19,888,941
Palomar
Health
Obligated
Group
,
COP
,
2022
A
,
Refunding
,
AGMC
Insured
,
5.25
%
,
11/01/52
.......................................................
43,040,000
46,059,385
Samuel
Merritt
University
,
Revenue
,
2022
,
5.25
%
,
6/01/53
...................
39,750,000
43,401,471
University
of
La
Verne
,
Revenue
,
2017
A
,
Refunding
,
4
%
,
6/01/47
.............
10,500,000
10,226,793
California
Pollution
Control
Financing
Authority
,
f
Poseidon
Resources
Channelside
LP
,
Revenue
,
144A,
2019
,
Refunding
,
5
%
,
7/01/39
7,250,000
7,599,703
f
Poseidon
Resources
Channelside
LP
,
Revenue
,
144A,
2019
,
Refunding
,
5
%
,
11/21/45
.......................................................
11,365,000
11,757,100
f
Poseidon
Resources
Channelside
LP
,
Revenue
,
144A,
2023
,
5
%
,
7/01/30
.......
5,200,000
5,702,511
f
Poseidon
Resources
Channelside
LP
,
Revenue
,
144A,
2023
,
5
%
,
7/01/31
.......
3,000,000
3,324,838
f
Poseidon
Resources
Channelside
LP
,
Revenue
,
144A,
2023
,
5
%
,
7/01/32
.......
5,500,000
6,160,272
f
Poseidon
Resources
Channelside
LP
,
Revenue
,
144A,
2023
,
5
%
,
7/01/33
.......
6,000,000
6,765,565
f
Poseidon
Resources
Channelside
LP
,
Revenue
,
144A,
2023
,
5
%
,
7/01/34
.......
3,250,000
3,646,178
f
Poseidon
Resources
Channelside
LP
,
Revenue
,
144A,
2023
,
5
%
,
7/01/35
.......
3,250,000
3,622,550
f
Poseidon
Resources
Channelside
LP
,
Revenue
,
144A,
2023
,
5
%
,
7/01/36
.......
2,650,000
2,941,010
f
Poseidon
Resources
Channelside
LP
,
Revenue
,
144A,
2023
,
5
%
,
7/01/37
.......
2,300,000
2,536,068
f
Poseidon
Resources
Channelside
LP
,
Revenue
,
144A,
2023
,
5
%
,
7/01/38
.......
2,000,000
2,192,609
f
Poseidon
Resources
Channelside
LP
,
Revenue
,
144A,
2023
,
5
%
,
11/21/45
......
2,200,000
2,341,939
San
Jose
Water
Co.
,
Revenue
,
2016
,
4.75
%
,
11/01/46
......................
15,000,000
15,098,579
Franklin
California
Tax-Free
Income
Fund
Schedule
of
Investments
(unaudited)
The
accompanying
notes
are
an
integral
part
of
these
financial
statements.
Semiannual
Report
a
a
Principal
Amount
a
Value
a
a
a
a
a
Municipal
Bonds
(continued)
California
(continued)
California
Public
School
District
Financing
Authority
,
Southern
Kern
Unified
School
District
,
Revenue
,
1996
B
,
AGMC
Insured
,
ETM,
5.9
%
,
9/01/26
...............
$
630,000
$
648,700
f
California
School
Finance
Authority
,
Aspire
Public
Schools
Obligated
Group
,
Revenue
,
144A,
2021
A
,
2.125
%
,
8/01/31
.
500,000
452,893
Aspire
Public
Schools
Obligated
Group
,
Revenue
,
144A,
2021
A
,
4
%
,
8/01/36
....
325,000
324,053
Aspire
Public
Schools
Obligated
Group
,
Revenue
,
144A,
2021
A
,
4
%
,
8/01/41
....
525,000
501,836
Aspire
Public
Schools
Obligated
Group
,
Revenue
,
144A,
2021
A
,
4
%
,
8/01/51
....
800,000
719,106
Aspire
Public
Schools
Obligated
Group
,
Revenue
,
144A,
2022
A
,
5
%
,
8/01/52
....
2,935,000
2,963,506
Camino
Nuevo
Charter
Academy
Obligated
Group
,
Revenue
,
144A,
2023
A
,
Refunding
,
5
%
,
6/01/43
............................................
1,000,000
1,021,915
Camino
Nuevo
Charter
Academy
Obligated
Group
,
Revenue
,
144A,
2023
A
,
Refunding
,
5.25
%
,
6/01/53
.........................................
1,550,000
1,584,859
Classical
Academy
Obligated
Group
,
Revenue
,
144A,
2022
A
,
Refunding
,
5
%
,
10/01/42
.......................................................
1,325,000
1,376,512
Classical
Academy
Obligated
Group
,
Revenue
,
144A,
2022
A
,
Refunding
,
5
%
,
10/01/52
.......................................................
2,265,000
2,314,135
Classical
Academy
Obligated
Group
,
Revenue
,
144A,
2022
A
,
Refunding
,
5
%
,
10/01/61
.......................................................
3,905,000
3,963,677
Granada
Hills
Charter
High
School
Obligated
Group
,
Revenue
,
144A,
2021
A
,
Refunding
,
4
%
,
7/01/29
............................................
250,000
254,873
Granada
Hills
Charter
High
School
Obligated
Group
,
Revenue
,
144A,
2021
A
,
Refunding
,
4
%
,
7/01/38
............................................
465,000
465,164
Granada
Hills
Charter
High
School
Obligated
Group
,
Revenue
,
144A,
2021
A
,
Refunding
,
4
%
,
7/01/48
............................................
675,000
631,095
Granada
Hills
Charter
High
School
Obligated
Group
,
Revenue
,
144A,
2024
A
,
5
%
,
7/01/54
........................................................
525,000
547,364
Green
Dot
Public
Schools
Obligated
Group
,
Revenue
,
144A,
2022
A
,
Refunding
,
5.75
%
,
8/01/52
..................................................
1,500,000
1,617,998
KIPP
SoCal
Public
Schools
Obligated
Group
,
Revenue
,
144A,
2020
A
,
4
%
,
7/01/40
800,000
790,308
STEM
Preparatory
Schools
-
Obligated
Group
,
Revenue
,
144A,
2023
A
,
5.125
%
,
6/01/53
........................................................
1,000,000
1,022,878
STEM
Preparatory
Schools
-
Obligated
Group
,
Revenue
,
144A,
2023
A
,
5.375
%
,
5/01/63
........................................................
1,000,000
1,027,901
Value
Schools
,
Revenue
,
144A,
2023
A
,
Refunding
,
5
%
,
7/01/40
..............
550,000
573,053
Value
Schools
,
Revenue
,
144A,
2023
A
,
Refunding
,
5.25
%
,
7/01/48
............
725,000
753,373
California
State
Public
Works
Board
,
State
of
California
,
Revenue
,
2014
B
,
5
%
,
10/01/39
........................
10,000,000
10,012,286
State
of
California
,
Revenue
,
2019
C
,
5
%
,
11/01/44
........................
5,000,000
5,359,335
State
of
California
,
Revenue
,
2021
D
,
4
%
,
11/01/35
........................
1,210,000
1,279,415
California
State
University
,
Revenue
,
2015
A
,
Refunding
,
5
%
,
11/01/43
..............................
11,000,000
11,190,831
Revenue
,
2016
A
,
Refunding
,
5
%
,
11/01/36
..............................
3,760,000
3,880,584
e
Revenue
,
2016
B-2
,
Refunding
,
Mandatory
Put
,
0.55
%
,
11/01/26
..............
12,000,000
11,090,999
Revenue
,
2017
A
,
Refunding
,
5
%
,
11/01/42
..............................
12,310,000
12,886,067
Revenue
,
2017
A
,
Refunding
,
5
%
,
11/01/47
..............................
53,000,000
55,205,182
Revenue
,
2018
A
,
Refunding
,
5
%
,
11/01/39
..............................
3,675,000
3,952,850
Revenue
,
2018
A
,
Refunding
,
5
%
,
11/01/43
..............................
3,330,000
3,544,908
Revenue
,
2018
A
,
Refunding
,
5
%
,
11/01/48
..............................
17,385,000
18,380,324
Revenue
,
2019
A
,
5
%
,
11/01/44
.......................................
40,010,000
42,834,990
Revenue
,
2019
A
,
5
%
,
11/01/49
.......................................
77,595,000
82,605,418
California
Statewide
Communities
Development
Authority
,
Revenue
,
2004
A
,
AGMC
Insured
,
5.25
%
,
10/01/24
........................
60,000
60,108
Special
Assessment
,
2024
A
,
5
%
,
9/02/54
...............................
1,290,000
1,340,866
Special
Tax
,
2023
A
,
5.25
%
,
9/01/51
...................................
3,305,000
3,498,420
Adventist
Health
System/West
Obligated
Group
,
Revenue
,
2015
A
,
Refunding
,
5
%
,
3/01/35
........................................................
9,250,000
9,421,781
Franklin
California
Tax-Free
Income
Fund
Schedule
of
Investments
(unaudited)
Semiannual
Report
The
accompanying
notes
are
an
integral
part
of
these
financial
statements.
a
a
Principal
Amount
a
Value
a
a
a
a
a
Municipal
Bonds
(continued)
California
(continued)
California
Statewide
Communities
Development
Authority,
(continued)
Adventist
Health
System/West
Obligated
Group
,
Revenue
,
2018
A
,
Refunding
,
5
%
,
3/01/48
........................................................
$
67,585,000
$
69,101,242
Cedars-Sinai
Medical
Center
Obligated
Group
,
Revenue
,
2018
,
5
%
,
7/01/48
.....
7,980,000
8,276,764
Community
Facilities
District
No.
2020-02
Improvement
Area
No.
2
,
Special
Tax
,
2022
,
5.25
%
,
9/01/52
.............................................
1,650,000
1,740,943
Community
Facilities
District
No.
2020-2
Improvement
Area
No.
3
,
Special
Tax
,
2024
,
5
%
,
9/01/34
....................................................
350,000
382,187
Community
Facilities
District
No.
2020-2
Improvement
Area
No.
3
,
Special
Tax
,
2024
,
5
%
,
9/01/39
....................................................
745,000
795,283
Community
Facilities
District
No.
2020-2
Improvement
Area
No.
3
,
Special
Tax
,
2024
,
5
%
,
9/01/44
....................................................
1,230,000
1,295,889
Community
Facilities
District
No.
2020-2
Improvement
Area
No.
3
,
Special
Tax
,
2024
,
5
%
,
9/01/49
....................................................
500,000
521,228
Community
Facilities
District
No.
2020-2
Improvement
Area
No.
3
,
Special
Tax
,
2024
,
5
%
,
9/01/54
....................................................
750,000
776,753
Community
Facilities
District
No.
2021-03
,
Special
Tax
,
2024
,
5
%
,
9/01/44
.......
875,000
915,192
Community
Facilities
District
No.
2021-03
,
Special
Tax
,
2024
,
5
%
,
9/01/49
.......
820,000
848,521
Community
Facilities
District
No.
2021-03
,
Special
Tax
,
2024
,
5
%
,
9/01/54
.......
850,000
877,473
Community
Facilities
District
No.
2021-1
,
Special
Tax
,
2023
,
5
%
,
9/01/43
........
1,000,000
1,068,924
Community
Facilities
District
No.
2021-1
,
Special
Tax
,
2023
,
5
%
,
9/01/53
........
1,850,000
1,935,405
Community
Facilities
District
No.
20220
,
Special
Tax
,
2023
,
5
%
,
9/01/43
.........
1,030,000
1,092,231
Community
Facilities
District
No.
20220
,
Special
Tax
,
2023
,
5
%
,
9/01/48
.........
1,120,000
1,166,512
Community
Facilities
District
No.
20220
,
Special
Tax
,
2023
,
5
%
,
9/01/53
.........
1,000,000
1,034,880
Community
Facilities
District
No.
2022-03
,
Special
Tax
,
2023
,
5
%
,
9/01/38
.......
1,715,000
1,847,346
Community
Facilities
District
No.
2022-03
,
Special
Tax
,
2023
,
5
%
,
9/01/43
.......
380,000
401,791
Community
Facilities
District
No.
2022-03
,
Special
Tax
,
2023
,
5
%
,
9/01/53
.......
1,250,000
1,293,601
Community
Facilities
District
No.
2022-10
,
Special
Tax
,
2023
,
5.5
%
,
9/01/53
......
1,770,000
1,907,389
Enloe
Medical
Center
Obligated
Group
,
Revenue
,
2022
A
,
AGMC
Insured
,
5
%
,
8/15/42
........................................................
600,000
654,933
Enloe
Medical
Center
Obligated
Group
,
Revenue
,
2022
A
,
AGMC
Insured
,
5.125
%
,
8/15/47
........................................................
880,000
953,814
Enloe
Medical
Center
Obligated
Group
,
Revenue
,
2022
A
,
AGMC
Insured
,
5.25
%
,
8/15/52
........................................................
11,215,000
12,142,408
Enloe
Medical
Center
Obligated
Group
,
Revenue
,
2022
A
,
AGMC
Insured
,
5.375
%
,
8/15/57
........................................................
17,930,000
19,514,090
Marin
General
Hospital
Obligated
Group
,
Revenue
,
2018
A
,
5
%
,
8/01/34
........
1,225,000
1,273,876
USC
Obligated
Group
,
Revenue
,
2018
,
Refunding
,
4
%
,
1/01/34
...............
3,485,000
3,576,600
Carlsbad
Unified
School
District
,
GO
,
2011
C
,
Zero
Cpn.,
8/01/35
...............
33,000,000
37,819,719
Centinela
Valley
Union
High
School
District
,
GO
,
2004
A
,
Refunding
,
NATL
Insured
,
5.5
%
,
8/01/33
....................................................
15,505,000
17,113,313
Cerritos
Community
College
District
,
GO
,
2014
A
,
4
%
,
8/01/44
.................
10,000,000
9,941,163
Chaffey
Joint
Union
High
School
District
,
GO
,
B
,
5
%
,
8/01/44
..................
27,500,000
27,681,142
Chino
Community
Facilities
District
,
City
of
Chino
Community
Facilities
District
No.
2003-3
Improvement
Area
No.
10
,
Special
Tax
,
2024
,
4
%
,
9/01/29
......................................
350,000
355,145
City
of
Chino
Community
Facilities
District
No.
2003-3
Improvement
Area
No.
10
,
Special
Tax
,
2024
,
5
%
,
9/01/34
......................................
650,000
704,114
City
of
Chino
Community
Facilities
District
No.
2003-3
Improvement
Area
No.
10
,
Special
Tax
,
2024
,
5
%
,
9/01/39
......................................
830,000
889,671
City
of
Chino
Community
Facilities
District
No.
2003-3
Improvement
Area
No.
10
,
Special
Tax
,
2024
,
5
%
,
9/01/44
......................................
795,000
828,906
City
of
Chino
Community
Facilities
District
No.
2003-3
Improvement
Area
No.
10
,
Special
Tax
,
2024
,
5
%
,
9/01/49
......................................
675,000
702,327
City
of
Chino
Community
Facilities
District
No.
2003-3
Improvement
Area
No.
10
,
Special
Tax
,
2024
,
5
%
,
9/01/54
......................................
740,000
766,319
Franklin
California
Tax-Free
Income
Fund
Schedule
of
Investments
(unaudited)
The
accompanying
notes
are
an
integral
part
of
these
financial
statements.
Semiannual
Report
a
a
Principal
Amount
a
Value
a
a
a
a
a
Municipal
Bonds
(continued)
California
(continued)
Chino
Community
Facilities
District,
(continued)
City
of
Chino
Community
Facilities
District
No.
2003-3
Improvement
Area
No.
8
,
Special
Tax
,
2021
,
4
%
,
9/01/41
......................................
$
1,710,000
$
1,666,400
City
of
Chino
Community
Facilities
District
No.
2003-3
Improvement
Area
No.
8
,
Special
Tax
,
2021
,
4
%
,
9/01/46
......................................
1,000,000
942,605
City
of
Chino
Community
Facilities
District
No.
2003-3
Improvement
Area
No.
8
,
Special
Tax
,
2021
,
4
%
,
9/01/51
......................................
1,250,000
1,148,638
City
of
Chino
Community
Facilities
District
No.
2003-3
Improvement
Area
No.
9
,
Special
Tax
,
2022
,
5
%
,
9/01/37
......................................
2,740,000
2,955,845
City
of
Chino
Community
Facilities
District
No.
2003-3
Improvement
Area
No.
9
,
Special
Tax
,
2022
,
5.25
%
,
9/01/42
...................................
2,000,000
2,145,301
City
of
Chino
Community
Facilities
District
No.
2003-3
Improvement
Area
No.
9
,
Special
Tax
,
2022
,
5.375
%
,
9/01/47
...................................
2,000,000
2,130,506
City
of
Chino
Community
Facilities
District
No.
2003-3
Improvement
Area
No.
9
,
Special
Tax
,
2022
,
5.375
%
,
9/01/52
...................................
2,695,000
2,854,850
Chino
Valley
Unified
School
District
,
GO
,
2020
B
,
3.375
%
,
8/01/50
.........................................
20,500,000
18,054,573
GO
,
2020
B
,
5
%
,
8/01/55
............................................
10,000,000
10,671,620
City
&
County
of
San
Francisco
,
GO
,
2022
R-1
,
Refunding
,
5
%
,
6/15/26
.................................
5,000,000
5,242,148
f
District
No.
2020-1
Development
,
Special
Tax
,
144A,
2023
A
,
5.75
%
,
9/01/50
.....
850,000
927,952
f
District
No.
2020-1
Office
,
Special
Tax
,
144A,
2023
B
,
5.75
%
,
9/01/53
..........
1,835,000
1,997,150
City
of
Beaumont
,
Community
Facilities
District
No.
2016-3
,
Special
Tax
,
2023
,
5
%
,
9/01/38
........
500,000
540,449
Community
Facilities
District
No.
2016-3
,
Special
Tax
,
2023
,
5
%
,
9/01/43
........
625,000
660,841
Community
Facilities
District
No.
2016-3
,
Special
Tax
,
2023
,
5
%
,
9/01/48
........
745,000
779,879
Community
Facilities
District
No.
2016-3
,
Special
Tax
,
2023
,
5
%
,
9/01/53
........
950,000
985,269
Community
Facilities
District
No.
2021-1
,
Special
Tax
,
2024
,
5
%
,
9/01/39
........
400,000
430,114
Community
Facilities
District
No.
2021-1
,
Special
Tax
,
2024
,
5
%
,
9/01/44
........
650,000
684,819
Community
Facilities
District
No.
2021-1
,
Special
Tax
,
2024
,
5
%
,
9/01/49
........
1,000,000
1,042,456
Community
Facilities
District
No.
2021-1
,
Special
Tax
,
2024
,
5
%
,
9/01/54
........
1,500,000
1,553,506
City
of
Corona
,
Community
Facilities
District
No.
2018-1
Improvement
Area
No.
1
,
Special
Tax
,
2020
,
4
%
,
9/01/45
....................................................
650,000
629,285
Community
Facilities
District
No.
2018-1
Improvement
Area
No.
1
,
Special
Tax
,
2020
,
4
%
,
9/01/50
....................................................
1,500,000
1,409,089
City
of
Dixon
,
Community
Facilities
District
No.
2019-1
Improvement
Area
No.
2
,
Special
Tax
,
2024
,
5
%
,
9/01/54
.......................................
1,000,000
1,038,823
City
of
Dublin
,
Community
Facilities
District
No.
2015-1
Improvement
Area
No.
4
,
Special
Tax
,
2022
,
5.25
%
,
9/01/42
..................................................
2,005,000
2,150,489
Community
Facilities
District
No.
2015-1
Improvement
Area
No.
4
,
Special
Tax
,
2022
,
5.5
%
,
9/01/47
...................................................
2,630,000
2,822,180
Community
Facilities
District
No.
2015-1
Improvement
Area
No.
4
,
Special
Tax
,
2022
,
5.5
%
,
9/01/51
...................................................
3,040,000
3,252,081
Community
Facilities
District
No.
2015-1
Improvement
Area
No.
5
,
Special
Tax
,
2023
,
5.125
%
,
9/01/43
.................................................
1,275,000
1,351,995
City
of
Fillmore
,
Community
Facilities
District
No.
5
Improvement
Area
B
,
Special
Tax
,
2023
,
5
%
,
9/01/38
........................................................
1,000,000
1,077,170
Community
Facilities
District
No.
5
Improvement
Area
B
,
Special
Tax
,
2023
,
5
%
,
9/01/43
........................................................
1,100,000
1,163,080
Community
Facilities
District
No.
5
Improvement
Area
B
,
Special
Tax
,
2023
,
5
%
,
9/01/48
........................................................
2,375,000
2,466,488
Community
Facilities
District
No.
5
Improvement
Area
B
,
Special
Tax
,
2023
,
5
%
,
9/01/53
........................................................
3,740,000
3,878,850
Franklin
California
Tax-Free
Income
Fund
Schedule
of
Investments
(unaudited)
Semiannual
Report
The
accompanying
notes
are
an
integral
part
of
these
financial
statements.
a
a
Principal
Amount
a
Value
a
a
a
a
a
Municipal
Bonds
(continued)
California
(continued)
City
of
Fontana
,
Community
Facilities
District
No.
85
,
Special
Tax
,
2020
,
4
%
,
9/01/45
...........
$
850,000
$
817,185
Community
Facilities
District
No.
85
,
Special
Tax
,
2020
,
4
%
,
9/01/50
...........
900,000
842,802
Community
Facilities
District
No.
88
,
Special
Tax
,
2020
,
4
%
,
9/01/45
...........
1,100,000
1,040,020
Community
Facilities
District
No.
88
,
Special
Tax
,
2020
,
4
%
,
9/01/51
...........
1,545,000
1,410,722
Community
Facilities
District
No.
89
,
Special
Tax
,
2020
,
4
%
,
9/01/40
...........
750,000
740,879
Community
Facilities
District
No.
89
,
Special
Tax
,
2020
,
4
%
,
9/01/51
...........
1,500,000
1,393,835
Community
Facilities
District
No.
90
,
Special
Tax
,
2021
,
4
%
,
9/01/41
...........
530,000
524,738
Community
Facilities
District
No.
90
,
Special
Tax
,
2021
,
4
%
,
9/01/46
...........
475,000
454,188
Community
Facilities
District
No.
90
,
Special
Tax
,
2021
,
4
%
,
9/01/51
...........
1,825,000
1,701,263
Community
Facilities
District
No.
99
,
Special
Tax
,
2023
,
5
%
,
9/01/45
...........
600,000
628,964
Community
Facilities
District
No.
99
,
Special
Tax
,
2023
,
5
%
,
9/01/53
...........
500,000
518,546
City
of
Irvine
,
Assessment
District
No.
21-1
,
1915
Act,
Special
Assessment
,
Refunding
,
4
%
,
9/02/26
........................................................
1,245,000
1,272,341
Assessment
District
No.
21-1
,
1915
Act,
Special
Assessment
,
Refunding
,
4
%
,
9/02/27
........................................................
1,500,000
1,547,091
City
of
Laguna
Beach
,
Underground
Utility
Assessment
District
No.
2014-2
,
Special
Assessment
,
4.375
%
,
9/02/39
........................................................
1,685,000
1,737,302
Underground
Utility
Assessment
District
No.
2014-2
,
Special
Assessment
,
4.625
%
,
9/02/44
........................................................
1,000,000
1,028,948
City
of
Lake
Elsinore
,
Community
Facilities
District
No.
2006-6
,
Special
Tax
,
2022
,
4.75
%
,
9/01/52
...................................................
1,000,000
1,002,717
City
of
Lincoln
,
Community
Facilities
District
No.
2006-1
Area
No.
1
,
Special
Tax
,
2021
,
Refunding
,
4
%
,
9/01/39
....................................................
290,000
290,224
Community
Facilities
District
No.
2006-1
Area
No.
1
,
Special
Tax
,
2021
,
Refunding
,
4
%
,
9/01/40
....................................................
160,000
159,542
Community
Facilities
District
No.
2006-1
Area
No.
1
,
Special
Tax
,
2021
,
Refunding
,
4
%
,
9/01/43
....................................................
320,000
312,627
Community
Facilities
District
No.
2019-1
,
Special
Tax
,
2022
,
5
%
,
9/01/42
........
2,015,000
2,107,919
Community
Facilities
District
No.
2019-1
,
Special
Tax
,
2022
,
5
%
,
9/01/47
........
3,430,000
3,567,908
Community
Facilities
District
No.
2019-1
,
Special
Tax
,
2022
,
5
%
,
9/01/52
........
2,090,000
2,163,215
City
of
Long
Beach
,
Harbor
,
Revenue
,
2017
C
,
Refunding
,
5
%
,
5/15/47
.........................
15,660,000
16,154,485
Harbor
,
Revenue
,
2019
A
,
5
%
,
5/15/44
..................................
15,045,000
16,087,185
Harbor
,
Revenue
,
2019
A
,
5
%
,
5/15/49
..................................
8,705,000
9,274,639
City
of
Los
Angeles
,
Department
of
Airports
,
Revenue
,
2015
D
,
5
%
,
5/15/33
.....................
11,420,000
11,533,790
Department
of
Airports
,
Revenue
,
2015
D
,
5
%
,
5/15/41
.....................
17,000,000
17,109,159
Department
of
Airports
,
Revenue
,
2016
B
,
5
%
,
5/15/41
......................
10,000,000
10,153,700
Department
of
Airports
,
Revenue
,
2016
B
,
5
%
,
5/15/46
......................
15,265,000
15,444,828
Department
of
Airports
,
Revenue
,
2017
A
,
5
%
,
5/15/42
......................
3,680,000
3,762,496
Department
of
Airports
,
Revenue
,
2017
A
,
5
%
,
5/15/47
......................
51,110,000
51,999,207
Department
of
Airports
,
Revenue
,
2017
B
,
5
%
,
5/15/42
......................
4,000,000
4,171,788
Department
of
Airports
,
Revenue
,
2018
A
,
5
%
,
5/15/44
......................
32,985,000
33,860,056
Department
of
Airports
,
Revenue
,
2018
A
,
5.25
%
,
5/15/48
...................
10,000,000
10,340,124
Department
of
Airports
,
Revenue
,
2018
C
,
5
%
,
5/15/37
.....................
9,550,000
9,893,288
Department
of
Airports
,
Revenue
,
2018
C
,
5
%
,
5/15/44
.....................
39,405,000
40,318,045
Department
of
Airports
,
Revenue
,
2018
E
,
Refunding
,
5
%
,
5/15/43
.............
16,995,000
18,229,566
Department
of
Airports
,
Revenue
,
2018
E
,
Refunding
,
5
%
,
5/15/48
.............
33,145,000
35,184,780
Department
of
Airports
,
Revenue
,
2019
A
,
Refunding
,
5
%
,
5/15/49
.............
10,000,000
10,276,096
Department
of
Airports
,
Revenue
,
2019
C
,
5
%
,
5/15/39
.....................
2,305,000
2,505,025
Department
of
Airports
,
Revenue
,
2019
E
,
5
%
,
5/15/44
......................
23,485,000
24,974,912
Department
of
Airports
,
Revenue
,
2019
E
,
5
%
,
5/15/49
......................
10,495,000
11,040,392
Department
of
Airports
,
Revenue
,
2020
A
,
Refunding
,
5
%
,
5/15/35
.............
10,005,000
11,128,702
Franklin
California
Tax-Free
Income
Fund
Schedule
of
Investments
(unaudited)
The
accompanying
notes
are
an
integral
part
of
these
financial
statements.
Semiannual
Report
a
a
Principal
Amount
a
Value
a
a
a
a
a
Municipal
Bonds
(continued)
California
(continued)
City
of
Los
Angeles,
(continued)
Department
of
Airports
,
Revenue
,
2020
A
,
Refunding
,
5
%
,
5/15/36
.............
$
6,000,000
$
6,651,636
Department
of
Airports
,
Revenue
,
2020
A
,
Refunding
,
5
%
,
5/15/37
.............
5,000,000
5,517,309
Department
of
Airports
,
Revenue
,
2020
A
,
Refunding
,
5
%
,
5/15/38
.............
15,925,000
17,520,373
Department
of
Airports
,
Revenue
,
2020
A
,
Refunding
,
5
%
,
5/15/40
.............
22,485,000
24,538,726
Department
of
Airports
,
Revenue
,
2021
A
,
Refunding
,
5
%
,
5/15/36
.............
3,665,000
3,969,272
Department
of
Airports
,
Revenue
,
2021
A
,
Refunding
,
5
%
,
5/15/38
.............
4,920,000
5,293,433
Department
of
Airports
,
Revenue
,
2021
A
,
Refunding
,
5
%
,
5/15/41
.............
7,005,000
7,433,218
Department
of
Airports
,
Revenue
,
2021
A
,
Refunding
,
5
%
,
5/15/46
.............
25,965,000
27,242,385
Department
of
Airports
,
Revenue
,
2021
A
,
Refunding
,
5
%
,
5/15/51
.............
26,450,000
27,605,148
Department
of
Airports
,
Revenue
,
2021
D
,
5
%
,
5/15/33
.....................
4,735,000
5,202,752
Department
of
Airports
,
Revenue
,
2021
D
,
5
%
,
5/15/34
.....................
2,500,000
2,740,990
Department
of
Airports
,
Revenue
,
2021
D
,
Pre-Refunded
,
5
%
,
5/15/34
..........
140,000
156,997
Department
of
Airports
,
Revenue
,
2022
C
,
Refunding
,
5
%
,
5/15/45
.............
8,000,000
8,465,119
Department
of
Airports
,
Revenue,
Senior
Lien
,
2015
A
,
5
%
,
5/15/40
............
3,000,000
3,020,650
Department
of
Airports
,
Revenue,
Senior
Lien
,
2020
B
,
Refunding
,
4
%
,
5/15/39
...
2,000,000
2,065,259
Department
of
Airports
,
Revenue,
Senior
Lien
,
2020
C
,
5
%
,
5/15/37
............
6,595,000
7,050,988
Department
of
Airports
,
Revenue,
Senior
Lien
,
2022
G
,
5
%
,
5/15/29
............
2,000,000
2,162,214
Department
of
Airports
,
Revenue,
Senior
Lien
,
2022
G
,
4
%
,
5/15/42
............
16,575,000
16,179,532
Department
of
Airports
,
Revenue,
Senior
Lien
,
2022
G
,
4
%
,
5/15/47
............
11,325,000
10,885,969
Department
of
Airports
,
Revenue,
Senior
Lien
,
2022
H
,
5
%
,
5/15/42
............
1,415,000
1,501,603
Department
of
Airports
,
Revenue,
Senior
Lien
,
2022
H
,
5
%
,
5/15/47
............
25,000,000
26,328,512
Department
of
Airports
,
Revenue,
Senior
Lien
,
2022
H
,
5.25
%
,
5/15/47
.........
24,000,000
25,645,608
Department
of
Airports
,
Revenue,
Senior
Lien
,
2022
I
,
5
%
,
5/15/42
.............
2,360,000
2,642,112
Department
of
Airports
,
Revenue,
Senior
Lien
,
2022
I
,
4
%
,
5/15/48
.............
2,000,000
1,989,283
Department
of
Airports
,
Revenue,
Senior
Lien
,
2022
I
,
5
%
,
5/15/48
.............
6,265,000
6,885,406
Wastewater
System
,
Revenue
,
2015
A
,
5
%
,
6/01/44
........................
9,500,000
9,602,666
Wastewater
System
,
Revenue
,
2015
C
,
Refunding
,
5
%
,
6/01/45
...............
24,190,000
24,444,648
Wastewater
System
,
Revenue
,
2018
A
,
5
%
,
6/01/43
........................
10,000,000
10,541,988
City
of
Menifee
,
Community
Facilities
District
No.
2019-1
Meadow
Run
,
Special
Tax
,
2022
,
4
%
,
9/01/37
........................................................
320,000
320,077
Community
Facilities
District
No.
2019-1
Meadow
Run
,
Special
Tax
,
2022
,
3
%
,
9/01/43
........................................................
135,000
106,130
Community
Facilities
District
No.
2019-1
Meadow
Run
,
Special
Tax
,
2022
,
4
%
,
9/01/51
........................................................
565,000
525,011
Community
Facilities
District
No.
2022-1
Quartz
Ranch
,
Special
Tax
,
2023
A
,
5
%
,
9/01/38
........................................................
500,000
540,449
Community
Facilities
District
No.
2022-1
Quartz
Ranch
,
Special
Tax
,
2023
A
,
5
%
,
9/01/43
........................................................
600,000
634,408
Community
Facilities
District
No.
2022-1
Quartz
Ranch
,
Special
Tax
,
2023
A
,
5
%
,
9/01/48
........................................................
700,000
732,772
Community
Facilities
District
No.
2022-1
Quartz
Ranch
,
Special
Tax
,
2023
A
,
5
%
,
9/01/53
........................................................
1,000,000
1,037,126
g
Community
Facilities
District
No.
2022-1
Quartz
Ranch
,
Special
Tax
,
2024
A
,
5
%
,
9/01/54
........................................................
1,000,000
1,048,265
City
of
Newport
Beach
,
Assessment
District
No.
113
,
1915
Act,
Special
Assessment
,
2021
A
,
2.25
%
,
9/02/41
.............................................
1,290,000
916,849
City
of
Ontario
,
Community
Facilities
District
No.
13
,
Special
Tax
,
2021
,
Refunding
,
4
%
,
9/01/38
...
400,000
388,247
Community
Facilities
District
No.
45
,
Special
Tax
,
2020
,
4
%
,
9/01/43
...........
410,000
402,135
Community
Facilities
District
No.
45
,
Special
Tax
,
2020
,
4
%
,
9/01/51
...........
1,565,000
1,465,916
Community
Facilities
District
No.
53
,
Special
Tax
,
2021
,
4
%
,
9/01/36
...........
525,000
524,137
Community
Facilities
District
No.
53
,
Special
Tax
,
2021
,
4
%
,
9/01/42
...........
650,000
617,763
Community
Facilities
District
No.
55
,
Special
Tax
,
2022
,
5
%
,
9/01/42
...........
750,000
791,853
Community
Facilities
District
No.
55
,
Special
Tax
,
2022
,
5
%
,
9/01/47
...........
800,000
832,165
Community
Facilities
District
No.
55
,
Special
Tax
,
2022
,
5
%
,
9/01/53
...........
845,000
873,470
Franklin
California
Tax-Free
Income
Fund
Schedule
of
Investments
(unaudited)
Semiannual
Report
The
accompanying
notes
are
an
integral
part
of
these
financial
statements.
a
a
Principal
Amount
a
Value
a
a
a
a
a
Municipal
Bonds
(continued)
California
(continued)
City
of
Ontario,
(continued)
Community
Facilities
District
No.
57
,
Special
Tax
,
2022
,
4.25
%
,
9/01/37
.........
$
415,000
$
418,192
Community
Facilities
District
No.
57
,
Special
Tax
,
2022
,
4.625
%
,
9/01/42
........
650,000
660,999
Community
Facilities
District
No.
57
,
Special
Tax
,
2022
,
4.75
%
,
9/01/47
.........
840,000
848,459
Community
Facilities
District
No.
57
,
Special
Tax
,
2022
,
4.75
%
,
9/01/52
.........
825,000
826,962
Community
Facilities
District
No.
66
,
Special
Tax
,
2024
,
5
%
,
9/01/39
...........
1,410,000
1,526,995
Community
Facilities
District
No.
66
,
Special
Tax
,
2024
,
5
%
,
9/01/44
...........
1,795,000
1,890,797
Community
Facilities
District
No.
66
,
Special
Tax
,
2024
,
5
%
,
9/01/49
...........
1,000,000
1,038,035
Community
Facilities
District
No.
66
,
Special
Tax
,
2024
,
5
%
,
9/01/54
...........
1,000,000
1,030,703
City
of
Orange
,
Community
Facilities
District
No.
06-1
,
Special
Tax
,
2015
,
Refunding
,
AGMC
Insured
,
5
%
,
10/01/40
.........................................
7,500,000
7,643,294
City
of
Pasadena
,
Electric
,
Revenue
,
2016
A
,
Refunding
,
4
%
,
6/01/46
............
22,625,000
22,541,066
City
of
Rancho
Cordova
,
Arista
Del
Sol
Community
Facilities
District
No.
2022-1
Improvement
Area
No.
1
,
Special
Tax
,
2023
,
5.125
%
,
9/01/43
...................................
525,000
556,704
Arista
Del
Sol
Community
Facilities
District
No.
2022-1
Improvement
Area
No.
1
,
Special
Tax
,
2023
,
5.375
%
,
9/01/53
...................................
1,100,000
1,164,509
Grantline
220
Community
Facilities
District
No.
2023-1
Improvement
Area
No.
1
,
Special
Tax
,
2024
,
5
%
,
9/01/44
......................................
885,000
932,408
Grantline
220
Community
Facilities
District
No.
2023-1
Improvement
Area
No.
1
,
Special
Tax
,
2024
,
5
%
,
9/01/49
......................................
550,000
573,351
Grantline
220
Community
Facilities
District
No.
2023-1
Improvement
Area
No.
1
,
Special
Tax
,
2024
,
5
%
,
9/01/53
......................................
525,000
544,491
City
of
Riverside
,
Sewer
,
Revenue
,
2015
A
,
Refunding
,
5
%
,
8/01/40
.............
25,000,000
25,384,482
City
of
Roseville
,
Electric
System
,
COP
,
2004
,
AGMC
Insured
,
5
%
,
2/01/34
....................
5,000
5,007
Ranch
at
Sierra
Vista
Community
Facilities
District
No.
1
,
Special
Tax
,
2023
,
5
%
,
9/01/38
........................................................
1,165,000
1,259,247
Ranch
at
Sierra
Vista
Community
Facilities
District
No.
1
,
Special
Tax
,
2023
,
5
%
,
9/01/43
........................................................
1,000,000
1,057,346
Ranch
at
Sierra
Vista
Community
Facilities
District
No.
1
,
Special
Tax
,
2023
,
5
%
,
9/01/48
........................................................
1,000,000
1,046,817
Ranch
at
Sierra
Vista
Community
Facilities
District
No.
1
,
Special
Tax
,
2023
,
5
%
,
9/01/53
........................................................
1,150,000
1,192,694
City
of
Sacramento
,
Transient
Occupancy
Tax
,
Revenue
,
2018
A
,
5
%
,
6/01/43
....................
13,555,000
14,115,381
Transient
Occupancy
Tax
,
Revenue
,
2018
A
,
5
%
,
6/01/48
....................
21,415,000
22,137,765
City
of
San
Diego
,
Community
Facilities
District
No.
2
,
Special
Tax
,
2021
,
Refunding
,
4
%
,
9/01/28
....
880,000
912,646
Community
Facilities
District
No.
2
,
Special
Tax
,
2021
,
Refunding
,
4
%
,
9/01/29
....
690,000
719,472
Community
Facilities
District
No.
2
,
Special
Tax
,
2021
,
Refunding
,
4
%
,
9/01/30
....
425,000
444,037
City
of
San
Francisco
,
Public
Utilities
Commission
Water
,
Revenue
,
2023
AB-A
,
5.25
%
,
11/01/48
.......
47,895,000
54,272,943
Public
Utilities
Commission
Water
,
Revenue
,
2023
AB-A
,
5.25
%
,
11/01/52
.......
40,170,000
45,221,534
City
of
Santa
Paula
,
Harvest
Community
Facilities
District
No.
1
Improvement
Area
A
,
Special
Tax
,
2022
,
4
%
,
9/01/42
....................................................
575,000
544,427
Harvest
Community
Facilities
District
No.
1
Improvement
Area
A
,
Special
Tax
,
2022
,
4
%
,
9/01/47
....................................................
1,460,000
1,331,069
Harvest
Community
Facilities
District
No.
1
Improvement
Area
A
,
Special
Tax
,
2022
,
4
%
,
9/01/52
....................................................
3,530,000
3,115,458
Harvest
Community
Facilities
District
No.
1
Improvement
Area
A
,
Special
Tax
,
2023
,
5
%
,
9/01/49
....................................................
325,000
338,798
Harvest
Community
Facilities
District
No.
1
Improvement
Area
A
,
Special
Tax
,
2023
,
5
%
,
9/01/53
....................................................
1,345,000
1,394,934
Franklin
California
Tax-Free
Income
Fund
Schedule
of
Investments
(unaudited)
The
accompanying
notes
are
an
integral
part
of
these
financial
statements.
Semiannual
Report
a
a
Principal
Amount
a
Value
a
a
a
a
a
Municipal
Bonds
(continued)
California
(continued)
City
of
Upland
,
San
Antonio
Regional
Hospital
Obligated
Group
,
COP
,
Refunding
,
5
%
,
1/01/47
.........................................................
$
14,400,000
$
14,691,591
City
of
Vernon
,
Electric
System
,
Revenue
,
2021
A
,
5
%
,
10/01/24
..........................
2,500,000
2,502,734
Electric
System
,
Revenue
,
2021
A
,
5
%
,
4/01/28
...........................
2,000,000
2,132,737
Electric
System
,
Revenue
,
2022
A
,
Refunding
,
5
%
,
8/01/34
..................
1,350,000
1,503,428
Electric
System
,
Revenue
,
2022
A
,
Refunding
,
5
%
,
8/01/39
..................
425,000
463,941
Electric
System
,
Revenue
,
2022
A
,
Refunding
,
5
%
,
8/01/40
..................
365,000
396,637
Electric
System
,
Revenue
,
2022
A
,
Refunding
,
5
%
,
8/01/41
..................
420,000
454,397
City
of
Wildomar
,
Community
Facilities
District
No.
2022-3
,
Special
Tax
,
2024
,
5
%
,
9/01/42
........
800,000
849,657
Community
Facilities
District
No.
2022-3
,
Special
Tax
,
2024
,
5
%
,
9/01/47
........
1,000,000
1,049,913
Community
Facilities
District
No.
2022-3
,
Special
Tax
,
2024
,
5
%
,
9/01/54
........
1,200,000
1,252,479
f
CMFA
Special
Finance
Agency
,
Latitude33
,
Revenue
,
144A,
2021
A-1
,
3
%
,
12/01/56
.......................
9,000,000
6,627,934
Solana
at
Grand
,
Revenue,
Senior
Lien
,
144A,
2021
A-1
,
4
%
,
8/01/56
..........
54,800,000
49,664,763
f
CMFA
Special
Finance
Agency
Enclave
,
Revenue,
Senior
Lien
,
144A,
2022
A-1
,
4
%
,
8/01/58
.........................................................
26,500,000
21,528,022
f
CMFA
Special
Finance
Agency
VII
,
Breakwater
Apartments
(The)
,
Revenue
,
144A,
2021
A-1
,
3
%
,
8/01/56
..............................................
94,250,000
66,923,739
f
CMFA
Special
Finance
Agency
VIII
,
Elan
Huntington
Beach
,
Revenue,
Senior
Lien
,
144A,
2021
A-1
,
3
%
,
8/01/56
.........................................
34,750,000
25,079,555
f
CMFA
Special
Finance
Agency
XII
,
Allure
Apartments
,
Revenue,
Senior
Lien
,
144A,
2022
A-1
,
3.25
%
,
2/01/57
............................................
27,500,000
20,860,092
Coachella
Valley
Unified
School
District
,
GO
,
2016
F
,
BAM
Insured
,
5
%
,
8/01/46
.................................
7,135,000
7,271,844
GO
,
C
,
AGMC
Insured
,
Zero
Cpn.,
8/01/36
...............................
8,000,000
5,281,610
GO
,
C
,
AGMC
Insured
,
Zero
Cpn.,
8/01/37
...............................
8,000,000
5,050,228
GO
,
C
,
AGMC
Insured
,
Zero
Cpn.,
8/01/40
...............................
7,500,000
4,048,087
GO
,
C
,
AGMC
Insured
,
Zero
Cpn.,
8/01/43
...............................
10,000,000
4,494,230
Colton
Joint
Unified
School
District
,
GO
,
2010
B
,
AGMC
Insured
,
Zero
Cpn.,
8/01/42
.
16,365,000
7,654,876
Contra
Costa
Community
College
District
,
GO
,
2020
C
,
4
%
,
8/01/32
.............
1,200,000
1,283,448
Contra
Costa
Water
District
,
Revenue
,
V
,
Refunding
,
5
%
,
10/01/49
..............
7,500,000
8,006,606
g
Corona
Community
Facilities
District
,
City
of
Corona
Community
Facilities
District
No.
2018-1
Improvement
Area
No.
2
,
Special
Tax
,
2024
,
5
%
,
9/01/49
......................................
1,600,000
1,701,456
City
of
Corona
Community
Facilities
District
No.
2018-1
Improvement
Area
No.
2
,
Special
Tax
,
2024
,
5
%
,
9/01/54
......................................
1,600,000
1,690,992
Corona-Norco
Unified
School
District
,
GO
,
1998
B
,
AGMC
Insured
,
Zero
Cpn.,
9/01/24
...........................
2,620,000
2,620,000
GO
,
1998
B
,
AGMC
Insured
,
Zero
Cpn.,
3/01/25
...........................
1,400,000
1,379,805
GO
,
1998
C
,
NATL
Insured
,
Zero
Cpn.,
9/01/25
...........................
4,655,000
4,520,063
GO
,
1998
C
,
NATL
Insured
,
Zero
Cpn.,
9/01/26
...........................
6,080,000
5,735,376
County
of
El
Dorado
,
Community
Facilities
District
No.
2014-1
,
Special
Tax
,
2023
,
5
%
,
9/01/48
.........................................................
1,000,000
1,046,817
g
County
of
Los
Angeles
,
Community
Facilities
District
No.
2021-01
Improvement
Area
No.
2
,
Special
Tax
,
2024
,
5
%
,
9/01/44
................................................
1,400,000
1,487,388
Community
Facilities
District
No.
2021-01
Improvement
Area
No.
2
,
Special
Tax
,
2024
,
5
%
,
9/01/49
................................................
1,400,000
1,474,979
Community
Facilities
District
No.
2021-01
Improvement
Area
No.
2
,
Special
Tax
,
2024
,
5
%
,
9/01/54
................................................
1,750,000
1,837,886
County
of
Orange
,
Community
Facilities
District
No.
2021-1
,
Special
Tax
,
2022
A
,
5
%
,
8/15/37
......
1,300,000
1,405,569
Community
Facilities
District
No.
2021-1
,
Special
Tax
,
2022
A
,
5
%
,
8/15/42
......
850,000
904,885
Community
Facilities
District
No.
2021-1
,
Special
Tax
,
2022
A
,
5
%
,
8/15/47
......
1,250,000
1,304,259
Community
Facilities
District
No.
2021-1
,
Special
Tax
,
2022
A
,
5
%
,
8/15/52
......
8,200,000
8,519,104
Franklin
California
Tax-Free
Income
Fund
Schedule
of
Investments
(unaudited)
Semiannual
Report
The
accompanying
notes
are
an
integral
part
of
these
financial
statements.
a
a
Principal
Amount
a
Value
a
a
a
a
a
Municipal
Bonds
(continued)
California
(continued)
County
of
Placer
,
Community
Facilities
District
No.
2017-1
Improvement
Area
No.
2
,
Special
Tax
,
2023
,
5
%
,
9/01/43
....................................................
$
900,000
$
931,956
Community
Facilities
District
No.
2017-1
Improvement
Area
No.
2
,
Special
Tax
,
2023
,
5
%
,
9/01/48
....................................................
1,360,000
1,370,244
Community
Facilities
District
No.
2017-1
Improvement
Area
No.
2
,
Special
Tax
,
2023
,
5
%
,
9/01/53
....................................................
1,000,000
1,001,066
County
of
Riverside
,
Community
Facilities
District
No.
07-2
,
Special
Tax
,
2020
,
AGMC
Insured
,
4
%
,
9/01/45
...............................................
2,730,000
2,710,585
County
of
Sacramento
,
Airport
System
,
Revenue
,
2016
B
,
Refunding
,
5
%
,
7/01/41
...................
9,000,000
9,189,843
Airport
System
,
Revenue,
Senior
Lien
,
2016
A
,
Refunding
,
5
%
,
7/01/41
.........
10,000,000
10,248,305
Community
Facilities
District
No.
2014-2
,
Special
Tax
,
2021
,
4
%
,
9/01/41
........
325,000
306,890
Community
Facilities
District
No.
2014-2
,
Special
Tax
,
2021
,
4
%
,
9/01/46
........
325,000
294,420
f
CSCDA
Community
Improvement
Authority
,
1818
Platinum
Triangle-Anaheim
,
Revenue,
Senior
Lien
,
144A,
2021
A-1
,
3.35
%
,
4/01/47
........................................................
9,800,000
8,323,988
777
Place-Pomona
,
Revenue,
Senior
Lien
,
144A,
2021
A-1
,
3.6
%
,
5/01/47
.......
10,000,000
8,525,678
777
Place-Pomona
,
Revenue,
Senior
Lien
,
144A,
2021
A-2
,
3.25
%
,
5/01/57
......
12,500,000
8,964,860
Acacia
on
Santa
Rosa
Creek
,
Revenue,
Senior
Lien
,
144A,
2021
A
,
4
%
,
10/01/56
.
13,000,000
11,678,125
Cameo/Garrison
Apartments
,
Revenue
,
144A,
2021
B
,
4
%
,
3/01/57
............
7,000,000
5,418,333
Cameo/Garrison
Apartments
,
Revenue,
Senior
Lien
,
144A,
2021
A-1
,
2.8
%
,
3/01/47
21,400,000
16,697,068
Cameo/Garrison
Apartments
,
Revenue,
Senior
Lien
,
144A,
2021
A-2
,
3
%
,
3/01/57
.
7,430,000
5,435,220
Crescent
(The)
,
Revenue,
Senior
Lien
,
144A,
2022
A-1
,
3.25
%
,
7/01/43
.........
6,530,000
5,326,734
Crescent
(The)
,
Revenue,
Senior
Lien
,
144A,
2022
A-2
,
4.3
%
,
7/01/59
..........
18,250,000
16,069,769
Dublin
,
Revenue
,
144A,
2021
B
,
4
%
,
2/01/57
.............................
16,110,000
12,553,208
Dublin
,
Revenue,
Senior
Lien
,
144A,
2021
A-1
,
2.45
%
,
2/01/47
...............
37,300,000
31,406,704
Dublin
,
Revenue,
Senior
Lien
,
144A,
2021
A-2
,
3
%
,
2/01/57
..................
45,500,000
33,296,991
Escondido
Portfolio
,
Revenue,
Senior
Lien
,
144A,
2021
A-1
,
3
%
,
6/01/48
........
10,000,000
7,282,552
Jefferson
Platinum
Triangle
Apartments
,
Revenue
,
144A,
2021
A-1
,
2.875
%
,
8/01/41
18,355,000
17,265,517
Jefferson
Platinum
Triangle
Apartments
,
Revenue
,
144A,
2021
A-2
,
3.125
%
,
8/01/56
54,465,000
42,189,139
Monterey
Station
Apartments
,
Revenue,
Senior
Lien
,
144A,
2021
A-1
,
3
%
,
7/01/43
.
8,000,000
6,486,728
Park
Crossing
Apartments
,
Revenue,
Senior
Lien
,
144A,
2021
A
,
3.25
%
,
12/01/58
.
18,750,000
13,300,856
Parrallel-Anaheim
,
Revenue
,
144A,
2021
A
,
4
%
,
8/01/56
....................
17,645,000
15,882,069
Pasadena
Portfolio
,
Revenue,
Senior
Lien
,
144A,
2021
A-1
,
2.65
%
,
12/01/46
.....
1,415,000
1,122,737
Pasadena
Portfolio
,
Revenue,
Senior
Lien
,
144A,
2021
A-2
,
3
%
,
12/01/56
.......
39,820,000
28,222,795
Renaissance
at
City
Center
,
Revenue
,
144A,
2020
A
,
5
%
,
7/01/51
.............
18,625,000
18,406,730
Theo
Apartments
,
Revenue,
Senior
Lien
,
144A,
2021
A-1
,
3.5
%
,
5/01/47
........
5,000,000
4,274,884
Towne
at
Glendale
Apartments
,
Revenue
,
144A,
2022
A
,
Zero
Cpn.,
9/01/62
.....
53,000,000
34,412,667
Vineyard
Garden
Apartments
,
Revenue,
Senior
Lien
,
144A,
2021
A
,
3.25
%
,
10/01/58
14,000,000
10,066,272
Waterscape
Apartments
,
Revenue,
Senior
Lien
,
144A,
2021
A
,
3
%
,
9/01/56
......
5,000,000
3,620,238
Westgate
Apartments
,
Revenue,
Senior
Lien
,
144A,
2021
A-1
,
3
%
,
6/01/47
......
14,500,000
10,427,907
Wood
Creek
Apartments
,
Revenue,
Senior
Lien
,
144A,
2021
A-1
,
3
%
,
12/01/49
...
30,000,000
21,585,210
Wood
Creek
Apartments
,
Revenue,
Senior
Lien
,
144A,
2021
A-2
,
4
%
,
12/01/58
...
25,000,000
19,744,013
Daly
City
Housing
Development
Finance
Agency
,
Franciscan
Park
LLC
,
Revenue
,
2007
A
,
Refunding
,
5
%
,
12/15/47
..........................................
17,870,000
17,881,246
Day
Creek
Square
Public
Facilities
,
Community
Facilities
District
No.
2018-1
,
Special
Tax
,
2020
,
4
%
,
9/01/40
........
625,000
625,513
Community
Facilities
District
No.
2018-1
,
Special
Tax
,
2020
,
4
%
,
9/01/45
........
700,000
680,541
Delano
Joint
Union
High
School
District
,
GO
,
2003
A
,
Refunding
,
NATL
Insured
,
5.15
%
,
2/01/32
.........................................................
8,520,000
9,229,244
East
Bay
Municipal
Utility
District
,
Water
System
,
Revenue
,
2015
A
,
Refunding
,
5
%
,
6/01/36
...................
7,355,000
7,453,591
Water
System
,
Revenue
,
2015
C
,
4
%
,
6/01/45
............................
9,070,000
9,054,232
Water
System
,
Revenue
,
2017
A
,
Refunding
,
5
%
,
6/01/45
...................
4,240,000
4,426,346
Water
System
,
Revenue
,
2019
A
,
5
%
,
6/01/44
............................
4,000,000
4,290,437
Franklin
California
Tax-Free
Income
Fund
Schedule
of
Investments
(unaudited)
The
accompanying
notes
are
an
integral
part
of
these
financial
statements.
Semiannual
Report
a
a
Principal
Amount
a
Value
a
a
a
a
a
Municipal
Bonds
(continued)
California
(continued)
Eastern
Municipal
Water
District
,
Revenue
,
2021
A
,
Refunding
,
4
%
,
7/01/28
...............................
$
2,480,000
$
2,630,989
Community
Facilities
District
No.
2017-77
Improvement
Area
A
,
Special
Tax
,
2024
,
5
%
,
9/01/45
....................................................
1,175,000
1,239,241
Community
Facilities
District
No.
2017-77
Improvement
Area
A
,
Special
Tax
,
2024
,
5
%
,
9/01/54
....................................................
2,485,000
2,581,475
Community
Facilities
District
No.
2017-79
,
Special
Tax
,
2021
,
4
%
,
9/01/46
.......
2,815,000
2,586,404
Community
Facilities
District
No.
2017-79
,
Special
Tax
,
2021
,
4
%
,
9/01/51
.......
3,405,000
3,036,263
Community
Facilities
District
No.
2019-83
,
Special
Tax
,
2022
,
4
%
,
9/01/51
.......
2,790,000
2,491,780
Community
Facilities
District
No.
2019-86
,
Special
Tax
,
2023
,
5
%
,
9/01/48
.......
855,000
895,029
Community
Facilities
District
No.
2019-86
,
Special
Tax
,
2023
,
5
%
,
9/01/54
.......
1,775,000
1,838,315
Eastern
Municipal
Water
District
Financing
Authority
,
Revenue
,
2015
B
,
5
%
,
7/01/46
.
30,705,000
31,052,528
Elk
Grove
Finance
Authority
,
Special
Tax
,
2015
,
Refunding
,
BAM
Insured
,
5
%
,
9/01/38
1,500,000
1,520,166
Fairfax
School
District
,
GO
,
2011
,
AGMC
Insured
,
Zero
Cpn.,
11/01/48
...........
10,380,000
3,352,915
FHLMC,
Multi-family
ML
Pass-Through
Certificates
,
Revenue
,
2019-ML06
,
ACA
,
Revenue
,
2.493
%
,
7/25/35
...........................................
1,005,116
890,996
Folsom
Cordova
Unified
School
District
School
Facilities
Improvement
Dist
No.
5
,
GO
,
C
,
4
%
,
10/01/43
...................................................
17,500,000
17,429,445
Folsom
Ranch
Financing
Authority
,
City
of
Folsom
Community
Facilities
District
No.
23
Improvement
Area
No.
2
,
Special
Tax
,
2024
,
5
%
,
9/01/39
............................................
715,000
768,828
City
of
Folsom
Community
Facilities
District
No.
23
Improvement
Area
No.
2
,
Special
Tax
,
2024
,
5
%
,
9/01/44
............................................
775,000
816,516
City
of
Folsom
Community
Facilities
District
No.
23
Improvement
Area
No.
2
,
Special
Tax
,
2024
,
5
%
,
9/01/49
............................................
425,000
443,044
City
of
Folsom
Community
Facilities
District
No.
23
Improvement
Area
No.
2
,
Special
Tax
,
2024
,
5
%
,
9/01/53
............................................
485,000
503,006
Foothill-Eastern
Transportation
Corridor
Agency
,
Revenue
,
2013
A
,
Refunding
,
AGMC
Insured
,
5.5
%
,
1/15/31
.................
35,000,000
40,348,777
Revenue
,
2013
A
,
Refunding
,
AGMC
Insured
,
5.625
%
,
1/15/32
...............
37,260,000
42,994,366
Revenue
,
2013
A
,
Refunding
,
6.85
%
,
1/15/42
.............................
98,000,000
116,821,243
Revenue
,
2013
A
,
Refunding
,
AGMC
Insured
,
Zero
Cpn.,
1/15/37
..............
41,250,000
26,648,420
Revenue
,
2013
A
,
Refunding
,
AGMC
Insured
,
Zero
Cpn.,
1/15/38
..............
77,650,000
47,947,073
Revenue
,
2013
A
,
Refunding
,
AGMC
Insured
,
Zero
Cpn.,
1/15/39
..............
56,100,000
32,965,286
Revenue
,
2013
A
,
Refunding
,
Zero
Cpn.,
1/15/42
..........................
130,000,000
62,076,222
Revenue,
Senior
Lien
,
1995
A
,
ETM,
Zero
Cpn.,
1/01/25
....................
20,660,000
20,465,263
Revenue,
Senior
Lien
,
1995
A
,
ETM,
Zero
Cpn.,
1/01/26
....................
23,475,000
22,689,137
Revenue,
Senior
Lien
,
1995
A
,
ETM,
Zero
Cpn.,
1/01/27
....................
15,000,000
14,134,260
Revenue,
Senior
Lien
,
1995
A
,
ETM,
Zero
Cpn.,
1/01/28
....................
2,000,000
1,838,372
Revenue,
Senior
Lien
,
1995
A
,
ETM,
Zero
Cpn.,
1/01/29
....................
35,310,000
31,617,633
Revenue,
Senior
Lien
,
2021
A
,
Refunding
,
4
%
,
1/15/46
.....................
17,500,000
17,032,186
Fowler
Unified
School
District
,
GO
,
2010
C
,
AGMC
Insured
,
Zero
Cpn.,
8/01/41
..........................
3,095,000
1,584,438
GO
,
2010
C
,
AGMC
Insured
,
Zero
Cpn.,
8/01/42
..........................
3,005,000
1,462,512
Fresno
Unified
School
District
,
GO
,
2020
B
,
5
%
,
8/01/46
............................................
2,635,000
2,841,594
GO
,
2020
B
,
4
%
,
8/01/48
............................................
3,205,000
3,188,464
GO
,
2020
B
,
4
%
,
8/01/52
............................................
6,585,000
6,495,088
GO
,
2020
B
,
4
%
,
8/01/55
............................................
4,000,000
3,962,671
Glendale
Community
College
District
,
GO
,
2003
C
,
NATL
Insured
,
Zero
Cpn.,
8/01/28
8,630,000
7,437,432
Glendora
Public
Finance
Authority
,
Glendora
Community
Redevelopment
Agency
,
Tax
Allocation
,
2003
A
,
NATL
Insured
,
5
%
,
9/01/24
............................
995,000
995,000
Golden
State
Tobacco
Securitization
Corp.
,
Revenue
,
2022
A-1
,
Refunding
,
5
%
,
6/01/51
.........................................................
21,350,000
22,175,869
Golden
Valley
Unified
School
District
Financing
Authority
,
Community
Facilities
District
No.
2017-1
,
Revenue
,
2021
A
,
4
%
,
9/01/46
........
250,000
227,758
Community
Facilities
District
No.
2017-1
,
Revenue
,
2021
A
,
4
%
,
9/01/51
........
500,000
439,606
Franklin
California
Tax-Free
Income
Fund
Schedule
of
Investments
(unaudited)
Semiannual
Report
The
accompanying
notes
are
an
integral
part
of
these
financial
statements.
a
a
Principal
Amount
a
Value
a
a
a
a
a
Municipal
Bonds
(continued)
California
(continued)
Golden
Valley
Unified
School
District
Financing
Authority,
(continued)
Community
Facilities
District
No.
2017-1
,
Revenue
,
2021
A
,
4
%
,
9/01/56
........
$
745,000
$
644,449
Grossmont-Cuyamaca
Community
College
District
,
GO
,
2018
B
,
4
%
,
8/01/47
......
10,000,000
9,931,783
Hacienda
La
Puente
Unified
School
District
,
GO
,
2017
A
,
4
%
,
8/01/47
............
655,000
645,716
Hartnell
Community
College
District
,
GO
,
2009
C
,
6.125
%
,
8/01/33
..............
20,000,000
24,475,446
Hawthorne
School
District
,
GO
,
2008
C
,
AGMC
Insured
,
Zero
Cpn.,
8/01/48
.......
37,665,000
12,379,649
Hemet
Unified
School
District
,
Community
Facilities
District
No.
2021-7
,
Special
Tax
,
2023
,
5
%
,
9/01/48
........
1,500,000
1,577,064
Community
Facilities
District
No.
2021-7
,
Special
Tax
,
2023
,
5
%
,
9/01/53
........
1,000,000
1,042,387
g
Community
Facilities
District
No.
2021-7
,
Special
Tax
,
2024
,
5
%
,
9/01/49
........
1,000,000
1,052,840
Community
Facilities
District
No.
2022-2
,
Special
Tax
,
2024
,
5
%
,
9/01/54
........
1,000,000
1,044,553
Huntington
Beach
City
School
District
,
GO
,
2003
A
,
NATL
Insured
,
Zero
Cpn.,
8/01/28
8,595,000
7,467,975
Imperial
Irrigation
District
,
Electric
System
,
Revenue
,
2016
B-2
,
Refunding
,
5
%
,
11/01/27
........................................................
1,000,000
1,058,851
Independent
Cities
Finance
Authority
,
Augusta
Communities
LLC
,
Revenue
,
2022
A
,
Refunding
,
5.25
%
,
5/15/56
.......
4,000,000
4,250,823
f
City
of
Compton
Sales
Tax
,
Revenue
,
144A,
2021
,
AGMC
Insured
,
4
%
,
6/01/36
...
700,000
721,691
f
City
of
Compton
Sales
Tax
,
Revenue
,
144A,
2021
,
AGMC
Insured
,
4
%
,
6/01/41
...
900,000
911,780
f
City
of
Compton
Sales
Tax
,
Revenue
,
144A,
2021
,
AGMC
Insured
,
4
%
,
6/01/46
...
925,000
926,422
f
City
of
Compton
Sales
Tax
,
Revenue
,
144A,
2021
,
AGMC
Insured
,
4
%
,
6/01/51
...
1,250,000
1,231,593
Millennium
Housing
LLC
,
Revenue
,
2021
A
,
Refunding
,
3
%
,
9/15/46
...........
1,000,000
811,776
Millennium
Housing
LLC
,
Revenue
,
2021
A
,
Refunding
,
3
%
,
9/15/56
...........
2,000,000
1,470,304
Millennium
Housing
LLC
,
Revenue
,
2022
,
Refunding
,
4
%
,
9/15/42
.............
2,000,000
1,960,478
Millennium
Housing
LLC
,
Revenue
,
2022
,
Refunding
,
4.25
%
,
9/15/50
...........
2,000,000
1,951,647
Millennium
Housing
LLC
,
Revenue
,
2022
,
Refunding
,
5
%
,
9/15/50
.............
2,000,000
2,093,260
Irvine
Unified
School
District
,
Special
Tax
,
2020
A
,
4
%
,
9/01/40
......................................
2,945,000
2,892,231
Special
Tax
,
2020
A
,
4
%
,
9/01/44
......................................
6,215,000
5,921,440
Special
Tax
,
2020
A
,
BAM
Insured
,
4
%
,
9/01/50
...........................
7,960,000
7,816,684
Community
Facilities
District
No.
01-1
,
Special
Tax
,
2015
,
Refunding
,
BAM
Insured
,
5
%
,
9/01/38
....................................................
7,000,000
7,054,045
Community
Facilities
District
No.
09-1
,
Special
Tax
,
2017
D
,
5
%
,
3/01/57
........
10,940,000
11,148,976
Jefferson
Union
High
School
District
,
GO
,
2000
A
,
Refunding
,
NATL
Insured
,
6.45
%
,
8/01/25
.....................
685,000
699,052
GO
,
2000
A
,
Refunding
,
NATL
Insured
,
6.45
%
,
8/01/29
.....................
3,075,000
3,365,761
Jurupa
Community
Services
District
,
Community
Facilities
District
No.
52
,
Special
Tax
,
2021
A
,
4
%
,
9/01/39
..........
135,000
135,033
Community
Facilities
District
No.
52
,
Special
Tax
,
2021
A
,
4
%
,
9/01/40
..........
140,000
139,272
Community
Facilities
District
No.
52
,
Special
Tax
,
2021
A
,
4
%
,
9/01/50
..........
1,000,000
924,787
Community
Facilities
District
No.
54
,
Special
Tax
,
2021
A
,
4
%
,
9/01/46
..........
900,000
843,520
Community
Facilities
District
No.
54
,
Special
Tax
,
2021
A
,
4
%
,
9/01/51
..........
875,000
798,953
La
Mirada
Redevelopment
Agency
Successor
Agency
,
Tax
Allocation
,
2010
A
,
Refunding
,
AGMC
Insured
,
5
%
,
8/15/28
.................................
1,855,000
1,858,219
Lake
Elsinore
Unified
School
District
,
Community
Facilities
District
No.
2006-3
Area
B
,
Special
Tax
,
2022
,
5
%
,
9/01/47
..
350,000
365,752
Community
Facilities
District
No.
2006-3
Area
B
,
Special
Tax
,
2022
,
5
%
,
9/01/52
..
500,000
520,243
Community
Facilities
District
No.
2017-2
,
Special
Tax
,
2024
,
5
%
,
9/01/49
........
1,250,000
1,305,901
Community
Facilities
District
No.
2017-2
,
Special
Tax
,
2024
,
5
%
,
9/01/54
........
850,000
882,230
Lakeside
Union
School
District
,
GO
,
2010
B
,
Zero
Cpn.,
8/01/45
................
11,540,000
4,705,657
Lammersville
Joint
Unified
School
District
,
GO
,
2016
A
,
4
%
,
8/01/46
.............
41,340,000
41,167,133
Lancaster
School
District
,
GO
,
2001
,
NATL
Insured
,
Zero
Cpn.,
8/01/25
.............................
5,495,000
5,338,329
GO
,
2001
,
NATL
Insured
,
Zero
Cpn.,
7/01/26
.............................
5,965,000
5,629,313
Lassen
Municipal
Utility
District
,
COP
,
2021
,
4
%
,
5/01/51
......................
3,000,000
2,727,861
Lawndale
Redevelopment
Agency
,
Tax
Allocation
,
2009
,
AGMC
Insured
,
5.5
%
,
8/01/39
........................
10,280,000
10,297,387
Franklin
California
Tax-Free
Income
Fund
Schedule
of
Investments
(unaudited)
The
accompanying
notes
are
an
integral
part
of
these
financial
statements.
Semiannual
Report
a
a
Principal
Amount
a
Value
a
a
a
a
a
Municipal
Bonds
(continued)
California
(continued)
Lawndale
Redevelopment
Agency,
(continued)
Tax
Allocation
,
2009
,
AGMC
Insured
,
5.5
%
,
8/01/44
........................
$
6,085,000
$
6,094,265
Lemon
Grove
School
District
,
GO
,
2010
B
,
AGMC
Insured
,
Zero
Cpn.,
8/01/50
.....
20,990,000
6,617,043
Lodi
Unified
School
District
,
GO
,
2017
,
4
%
,
8/01/41
..........................
15,000,000
15,075,219
Long
Beach
Bond
Finance
Authority
,
Revenue
,
2007
A
,
5.5
%
,
11/15/28
.....................................
8,000,000
8,623,330
Revenue
,
2007
A
,
5
%
,
11/15/29
.......................................
17,465,000
18,677,401
Revenue
,
2007
A
,
5.5
%
,
11/15/30
.....................................
5,000,000
5,530,251
Revenue
,
2007
A
,
5
%
,
11/15/35
.......................................
69,855,000
77,889,743
Revenue
,
2007
A
,
5.5
%
,
11/15/37
.....................................
35,000,000
41,042,946
Los
Angeles
Community
College
District
,
GO
,
2015
C
,
Refunding
,
5
%
,
8/01/25
...................................
5,890,000
6,029,550
GO
,
2016
D
,
5
%
,
8/01/25
............................................
6,620,000
6,776,846
Los
Angeles
County
Metropolitan
Transportation
Authority
,
Revenue
,
2021
A
,
5
%
,
6/01/26
........................................
4,000,000
4,179,576
Sales
Tax
,
Revenue
,
2016
A
,
Refunding
,
5
%
,
6/01/35
.......................
17,655,000
18,240,470
Sales
Tax
,
Revenue
,
2016
A
,
Refunding
,
5
%
,
6/01/37
.......................
10,970,000
11,310,148
Sales
Tax
,
Revenue
,
2016
A
,
Refunding
,
5
%
,
6/01/38
.......................
7,705,000
7,935,471
Sales
Tax
,
Revenue
,
2016
A
,
Refunding
,
5
%
,
6/01/39
.......................
5,000,000
5,146,384
Sales
Tax
,
Revenue
,
2017
A
,
5
%
,
7/01/38
...............................
10,455,000
11,018,279
Sales
Tax
,
Revenue
,
2017
A
,
5
%
,
7/01/39
...............................
7,860,000
8,262,859
Sales
Tax
,
Revenue
,
2017
A
,
5
%
,
7/01/41
...............................
12,350,000
12,932,640
Sales
Tax
,
Revenue
,
2017
A
,
5
%
,
7/01/42
...............................
26,910,000
28,133,974
Sales
Tax
,
Revenue
,
2020
A
,
Refunding
,
5
%
,
6/01/32
.......................
6,700,000
7,570,483
Sales
Tax
,
Revenue
,
2020
A
,
Refunding
,
5
%
,
6/01/35
.......................
18,960,000
21,304,328
Sales
Tax
,
Revenue
,
2020
A
,
Refunding
,
5
%
,
6/01/36
.......................
5,375,000
6,014,934
Sales
Tax
,
Revenue
,
2020
A
,
Refunding
,
5
%
,
6/01/37
.......................
10,330,000
11,521,176
Sales
Tax
,
Revenue,
Senior
Lien
,
2021
A
,
5
%
,
7/01/28
......................
3,830,000
4,223,342
Sales
Tax
,
Revenue,
Senior
Lien
,
2021
A
,
5
%
,
7/01/36
......................
2,500,000
2,862,291
Sales
Tax
,
Revenue,
Senior
Lien
,
2021
A
,
5
%
,
7/01/38
......................
3,875,000
4,401,232
Los
Angeles
County
Sanitation
Districts
Financing
Authority
,
Revenue
,
2022
A
,
5
%
,
10/01/25
.......................................
6,830,000
7,023,898
Los
Angeles
County
Sanitation
District
No.
20
,
Revenue
,
2016
A
,
Refunding
,
4
%
,
10/01/42
.......................................................
16,430,000
16,417,490
Los
Angeles
Department
of
Water
,
Water
System
,
Revenue
,
2020
C
,
Refunding
,
5
%
,
7/01/41
.........................................................
6,455,000
7,085,430
Los
Angeles
Department
of
Water
&
Power
,
Power
System
,
Revenue
,
2014
D
,
Refunding
,
5
%
,
7/01/44
...................
43,985,000
44,032,306
Power
System
,
Revenue
,
2015
A
,
Refunding
,
5
%
,
7/01/35
...................
15,105,000
15,199,649
Power
System
,
Revenue
,
2015
A
,
Refunding
,
5
%
,
7/01/36
...................
17,795,000
17,904,160
Power
System
,
Revenue
,
2016
A
,
Refunding
,
5
%
,
7/01/46
...................
15,000,000
15,278,871
Power
System
,
Revenue
,
2016
B
,
5
%
,
7/01/35
............................
11,995,000
12,315,893
Power
System
,
Revenue
,
2017
A
,
5
%
,
7/01/42
............................
22,375,000
23,203,318
Power
System
,
Revenue
,
2017
A
,
5
%
,
7/01/47
............................
5,000,000
5,159,464
Power
System
,
Revenue
,
2017
C
,
5
%
,
7/01/47
............................
99,525,000
103,348,611
Power
System
,
Revenue
,
2018
D
,
Refunding
,
5
%
,
7/01/38
...................
8,960,000
9,560,050
Power
System
,
Revenue
,
2018
D
,
Refunding
,
5
%
,
7/01/39
...................
8,215,000
8,753,968
Power
System
,
Revenue
,
2019
A
,
5
%
,
7/01/45
............................
9,535,000
10,123,778
Power
System
,
Revenue
,
2019
A
,
5.25
%
,
7/01/49
.........................
12,555,000
13,397,034
Power
System
,
Revenue
,
2019
D
,
Refunding
,
5
%
,
7/01/44
...................
17,555,000
18,814,250
Power
System
,
Revenue
,
2020
B
,
Refunding
,
5
%
,
7/01/40
...................
9,020,000
9,955,066
Power
System
,
Revenue
,
2021
B
,
Refunding
,
5
%
,
7/01/48
...................
20,800,000
22,525,506
Power
System
,
Revenue
,
2021
C
,
5
%
,
7/01/45
............................
14,455,000
15,852,508
Power
System
,
Revenue
,
2022
A
,
5
%
,
7/01/51
............................
8,500,000
9,217,913
Power
System
,
Revenue
,
2022
C
,
Refunding
,
5
%
,
7/01/40
...................
6,000,000
6,765,198
Power
System
,
Revenue
,
2022
C
,
Refunding
,
5
%
,
7/01/41
...................
5,000,000
5,593,376
Power
System
,
Revenue
,
2022
C
,
Refunding
,
5
%
,
7/01/42
...................
6,250,000
6,957,009
Franklin
California
Tax-Free
Income
Fund
Schedule
of
Investments
(unaudited)
Semiannual
Report
The
accompanying
notes
are
an
integral
part
of
these
financial
statements.
a
a
Principal
Amount
a
Value
a
a
a
a
a
Municipal
Bonds
(continued)
California
(continued)
Los
Angeles
Department
of
Water
&
Power,
(continued)
Power
System
,
Revenue
,
2022
C
,
Refunding
,
5
%
,
7/01/43
...................
$
5,000,000
$
5,546,676
Power
System
,
Revenue
,
2023
A
,
Refunding
,
5
%
,
7/01/31
...................
10,000,000
11,624,033
Water
System
,
Revenue
,
2016
A
,
Refunding
,
5
%
,
7/01/41
...................
29,820,000
30,451,805
Water
System
,
Revenue
,
2016
A
,
Refunding
,
5
%
,
7/01/46
...................
24,610,000
25,073,953
Water
System
,
Revenue
,
2017
A
,
Refunding
,
5
%
,
7/01/41
...................
34,330,000
35,624,571
Water
System
,
Revenue
,
2017
A
,
Refunding
,
5
%
,
7/01/44
...................
18,475,000
19,123,524
Water
System
,
Revenue
,
2018
A
,
5
%
,
7/01/25
............................
3,940,000
4,023,043
Water
System
,
Revenue
,
2018
A
,
5
%
,
7/01/43
............................
5,425,000
5,694,479
Water
System
,
Revenue
,
2018
B
,
Refunding
,
5
%
,
7/01/43
...................
8,380,000
8,854,917
Water
System
,
Revenue
,
2022
C
,
Refunding
,
5
%
,
7/01/41
...................
2,970,000
3,348,077
Los
Angeles
Unified
School
District
,
GO
,
2016
A
,
Refunding
,
5
%
,
7/01/26
...................................
4,000,000
4,081,302
GO
,
2017
A
,
Refunding
,
5
%
,
7/01/25
...................................
18,750,000
19,151,419
GO
,
2020
C
,
4
%
,
7/01/33
............................................
7,000,000
7,426,189
GO
,
2020
C
,
4
%
,
7/01/36
............................................
8,975,000
9,378,409
GO
,
2020
RYQ
,
4
%
,
7/01/44
.........................................
10,730,000
10,835,299
GO
,
2023
QRR
,
5.25
%
,
7/01/48
.......................................
25,000,000
28,551,098
Los
Gatos-Saratoga
Joint
High
School
District
,
GO
,
A
,
Refunding
,
4
%
,
8/01/39
.......................................
10,635,000
10,638,620
GO
,
A
,
Refunding
,
4
%
,
8/01/44
.......................................
6,090,000
6,092,073
Marin
Municipal
Water
District
,
Revenue
,
2022
,
Refunding
,
4
%
,
6/15/52
..........
27,295,000
26,979,033
Marina
Redevelopment
Agency
Successor
Agency
,
Tax
Allocation
,
2023
A
,
5
%
,
9/01/43
....................................
1,000,000
1,051,983
Tax
Allocation
,
2023
B
,
5
%
,
9/01/43
....................................
2,100,000
2,209,163
Menifee
Union
School
District
,
Special
Tax
,
2023
,
5
%
,
9/01/48
.......................................
500,000
523,408
Special
Tax
,
2023
,
5
%
,
9/01/54
.......................................
1,230,000
1,276,639
Community
Facilities
District
No.
2011-1
Improvement
Area
No.
5
,
Special
Tax
,
2021
,
4
%
,
9/01/45
....................................................
875,000
859,065
Community
Facilities
District
No.
2011-1
Improvement
Area
No.
5
,
Special
Tax
,
2021
,
4
%
,
9/01/51
....................................................
1,825,000
1,734,357
Community
Facilities
District
No.
2011-1
Improvement
Area
No.
6
,
Special
Tax
,
2021
,
4
%
,
9/01/26
....................................................
75,000
75,975
Community
Facilities
District
No.
2011-1
Improvement
Area
No.
6
,
Special
Tax
,
2021
,
4
%
,
9/01/27
....................................................
140,000
142,697
Community
Facilities
District
No.
2011-1
Improvement
Area
No.
6
,
Special
Tax
,
2021
,
4
%
,
9/01/28
....................................................
105,000
107,542
Community
Facilities
District
No.
2011-1
Improvement
Area
No.
7
,
Special
Tax
,
2022
,
5
%
,
9/01/42
....................................................
1,000,000
1,057,196
Community
Facilities
District
No.
2011-1
Improvement
Area
No.
7
,
Special
Tax
,
2022
,
5.125
%
,
9/01/47
.................................................
2,000,000
2,099,861
Community
Facilities
District
No.
2011-1
Improvement
Area
No.
7
,
Special
Tax
,
2022
,
5.25
%
,
9/01/52
..................................................
2,000,000
2,107,480
Community
Facilities
District
No.
2019-2
,
Special
Tax
,
2021
,
4
%
,
9/01/35
........
200,000
203,587
Community
Facilities
District
No.
2019-2
,
Special
Tax
,
2021
,
4
%
,
9/01/44
........
565,000
546,376
Community
Facilities
District
No.
2019-2
,
Special
Tax
,
2021
,
4
%
,
9/01/51
........
675,000
625,226
Metropolitan
Water
District
of
Southern
California
,
Revenue
,
2019
A
,
Refunding
,
5
%
,
7/01/25
...............................
10,000,000
10,203,304
Revenue
,
2020
A
,
5
%
,
10/01/45
.......................................
15,665,000
16,852,368
Revenue
,
2022
B
,
Refunding
,
3
%
,
7/01/28
...............................
20,000,000
20,298,318
Middle
Fork
Project
Finance
Authority
,
Revenue
,
2020
,
Refunding
,
5
%
,
4/01/30
.................................
2,505,000
2,690,772
Revenue
,
2020
,
Refunding
,
5
%
,
4/01/32
.................................
4,095,000
4,366,266
Revenue
,
2020
,
Refunding
,
5
%
,
4/01/34
.................................
1,150,000
1,221,130
Revenue
,
2020
,
Refunding
,
5
%
,
4/01/35
.................................
1,200,000
1,271,416
Revenue
,
2020
,
Refunding
,
5
%
,
4/01/36
.................................
4,980,000
5,258,782
Franklin
California
Tax-Free
Income
Fund
Schedule
of
Investments
(unaudited)
The
accompanying
notes
are
an
integral
part
of
these
financial
statements.
Semiannual
Report
a
a
Principal
Amount
a
Value
a
a
a
a
a
Municipal
Bonds
(continued)
California
(continued)
Midpeninsula
Regional
Open
Space
District
,
Field
Employees
Corp.
,
GO
,
2018
,
4
%
,
9/01/48
.........................................................
$
11,220,000
$
11,159,820
Modesto
High
School
District
,
GO
,
2002
A
,
NATL
Insured
,
Zero
Cpn.,
5/01/27
......
12,770,000
11,841,307
Monterey
Peninsula
Unified
School
District
,
GO
,
2016
C
,
Refunding
,
5
%
,
8/01/41
...
11,190,000
11,550,508
Moorpark
Unified
School
District
,
GO
,
2009
A
,
AGMC
Insured
,
Zero
Cpn.,
8/01/32
...
5,870,000
4,523,788
Moreno
Valley
Unified
School
District
,
GO
,
2004
A
,
AGMC
Insured
,
ETM,
Zero
Cpn.,
8/01/27
......................
6,315,000
5,832,098
GO
,
2004
A
,
AGMC
Insured
,
ETM,
Zero
Cpn.,
8/01/28
......................
6,625,000
5,954,369
GO
,
2018
B
,
AGMC
Insured
,
5
%
,
8/01/47
................................
6,075,000
6,392,722
Mount
Diablo
Unified
School
District
,
GO
,
2022
B
,
Refunding
,
4
%
,
8/01/25
........
3,100,000
3,138,660
Mount
San
Antonio
Community
College
District
,
GO
,
2013
A
,
Zero
Cpn.,
8/01/43
....
55,000,000
54,944,439
M-S-R
Energy
Authority
,
Revenue
,
2009
B
,
6.5
%
,
11/01/39
....................
25,000,000
32,434,635
Murrieta
Valley
Unified
School
District
,
Community
Facilities
District
No.
2018-1
,
Special
Tax
,
2021
,
4
%
,
9/01/24
........
60,000
60,000
Community
Facilities
District
No.
2018-1
,
Special
Tax
,
2021
,
4
%
,
9/01/44
........
500,000
462,035
Community
Facilities
District
No.
2018-1
,
Special
Tax
,
2021
,
4
%
,
9/01/51
........
1,000,000
882,790
Newport
Mesa
Unified
School
District
,
GO
,
2011
,
6.3
%
,
8/01/42
................
20,000,000
23,813,648
Norman
Y
Mineta
San
Jose
International
Airport
SJC
,
Revenue
,
2017
A
,
Refunding
,
5
%
,
3/01/36
...............................
4,590,000
4,710,328
Revenue
,
2017
A
,
Refunding
,
5
%
,
3/01/37
...............................
4,475,000
4,585,931
Revenue
,
2017
A
,
Refunding
,
5
%
,
3/01/41
...............................
12,685,000
12,907,424
Revenue
,
2017
B
,
Refunding
,
5
%
,
3/01/47
...............................
10,000,000
10,302,707
Revenue
,
2021
A
,
Refunding
,
5
%
,
3/01/32
...............................
1,800,000
1,967,555
Revenue
,
2021
B
,
Refunding
,
5
%
,
3/01/29
...............................
500,000
555,996
Revenue
,
2021
B
,
Refunding
,
5
%
,
3/01/30
...............................
600,000
679,285
Northern
California
Sanitation
Agencies
Financing
Authority
,
Sacramento
Area
Sewer
District
,
Revenue
,
2014
A
,
Refunding
,
5
%
,
12/01/44
.....
25,000,000
25,022,570
Sacramento
Area
Sewer
District
,
Revenue
,
2020
A
,
Refunding
,
5
%
,
12/01/27
.....
2,960,000
3,217,239
Oceanside
Unified
School
District
,
GO
,
2010
B
,
AGMC
Insured
,
Zero
Cpn.,
8/01/38
...........................
10,590,000
6,311,213
GO
,
2010
B
,
AGMC
Insured
,
Zero
Cpn.,
8/01/39
...........................
7,860,000
4,441,339
GO
,
2015
,
Refunding
,
5
%
,
8/01/48
.....................................
12,000,000
12,149,821
GO
,
2022
,
Refunding
,
5
%
,
8/01/39
.....................................
1,005,000
1,131,079
GO
,
G
,
5
%
,
8/01/40
................................................
1,020,000
1,143,202
GO
,
G
,
5
%
,
8/01/43
................................................
1,000,000
1,107,409
Orange
County
Community
Facilities
District
,
Community
Facilities
District
No.
2023-1
,
Special
Tax
,
2023
A
,
5.5
%
,
8/15/48
.....
1,550,000
1,678,384
Community
Facilities
District
No.
2023-1
,
Special
Tax
,
2023
A
,
5.5
%
,
8/15/53
.....
1,200,000
1,293,487
Community
Facilities
District
No.
2023-1
,
Special
Tax
,
2023
A
,
5.75
%
,
8/15/53
....
1,085,000
1,180,148
Orange
County
Water
District
,
COP
,
2003
B
,
NATL
Insured
,
ETM,
5
%
,
8/15/28
...........................
11,750,000
12,411,988
COP
,
2003
B
,
NATL
Insured
,
ETM,
5
%
,
8/15/34
...........................
3,305,000
3,718,801
COP
,
2003
B
,
Pre-Refunded
,
NATL
Insured
,
5
%
,
8/15/34
....................
4,140,000
4,836,005
Palomar
Community
College
District
,
GO
,
2010
B
,
Zero
Cpn.,
8/01/39
............
69,410,000
82,137,906
Palomar
Health
,
Obligated
Group
,
GO
,
2009
A
,
AGMC
Insured
,
7
%
,
8/01/38
..................
36,000,000
41,193,270
Obligated
Group
,
GO
,
2010
A
,
6.75
%
,
8/01/40
............................
60,000,000
68,625,900
Palomar
Health
Obligated
Group
,
Revenue
,
2017
,
Refunding
,
AGMC
Insured
,
5
%
,
11/01/47
.......................................................
35,000,000
35,967,047
Panoche
Financing
Authority
,
Panoche
Water
District
,
Revenue
,
2021
A
,
4
%
,
9/01/43
.....................
1,120,000
1,056,256
Panoche
Water
District
,
Revenue
,
2021
A
,
4
%
,
9/01/51
.....................
6,070,000
5,358,535
Panoche
Water
District
,
Revenue
,
2021
B
,
1.408
%
,
9/01/24
..................
125,000
125,000
Panoche
Water
District
,
Revenue
,
2021
B
,
1.553
%
,
9/01/25
..................
130,000
125,389
Panoche
Water
District
,
Revenue
,
2021
B
,
2.006
%
,
9/01/27
..................
395,000
364,074
Panoche
Water
District
,
Revenue
,
2021
B
,
2.456
%
,
9/01/29
..................
415,000
370,121
Franklin
California
Tax-Free
Income
Fund
Schedule
of
Investments
(unaudited)
Semiannual
Report
The
accompanying
notes
are
an
integral
part
of
these
financial
statements.
a
a
Principal
Amount
a
Value
a
a
a
a
a
Municipal
Bonds
(continued)
California
(continued)
Panoche
Financing
Authority,
(continued)
Panoche
Water
District
,
Revenue
,
2021
B
,
2.756
%
,
9/01/31
..................
$
435,000
$
374,184
Panoche
Water
District
,
Revenue
,
2021
B
,
3.106
%
,
9/01/35
..................
880,000
723,336
Panoche
Water
District
,
Revenue
,
2021
B
,
3.571
%
,
9/01/40
..................
1,155,000
913,840
Patterson
Joint
Unified
School
District
,
GO
,
2001
A
,
NATL
Insured
,
Zero
Cpn.,
8/01/25
...........................
2,170,000
2,108,319
GO
,
2001
A
,
NATL
Insured
,
Zero
Cpn.,
8/01/26
...........................
2,265,000
2,133,646
Perris
Joint
Powers
Authority
,
Community
Facilities
District
No.
2007-2
,
Special
Tax
,
2021
,
4
%
,
9/01/43
........
1,445,000
1,371,657
Community
Facilities
District
No.
2007-2
,
Special
Tax
,
2021
,
4
%
,
9/01/48
........
1,250,000
1,147,665
Community
Facilities
District
No.
2018-1
Improvement
Area
No.
1
,
Special
Tax
,
2020
,
4
%
,
9/01/50
....................................................
1,125,000
1,026,315
Perris
Union
High
School
District
,
COP
,
2019
,
Refunding
,
BAM
Insured
,
5
%
,
10/01/48
........................
10,000,000
10,598,150
GO
,
2019
A
,
AGMC
Insured
,
4
%
,
9/01/43
................................
5,540,000
5,590,714
Pittsburg
Unified
School
District
,
GO
,
2016
,
Refunding
,
4
%
,
8/01/44
.............
11,000,000
10,861,155
Placentia-Yorba
Linda
Unified
School
District
,
GO
,
2008
D
,
Zero
Cpn.,
8/01/43
.......................................
27,955,000
13,314,597
GO
,
2008
D
,
Zero
Cpn.,
8/01/46
.......................................
89,200,000
35,117,344
GO
,
2008
D
,
Zero
Cpn.,
8/01/49
.......................................
85,000,000
29,014,674
Port
of
Los
Angeles
,
Revenue
,
2014
B
,
Refunding
,
5
%
,
8/01/44
.................
10,300,000
10,318,782
Port
of
Oakland
,
Revenue
,
2021
H
,
Refunding
,
5
%
,
11/01/29
...................
2,000,000
2,170,622
Poway
Redevelopment
Agency
Successor
Agency
,
Tax
Allocation
,
2015
A
,
Refunding
,
5
%
,
12/15/31
..........................
10,180,000
11,558,990
Tax
Allocation
,
2015
A
,
Refunding
,
5
%
,
12/15/32
..........................
11,215,000
12,888,038
Tax
Allocation
,
2015
A
,
Refunding
,
5
%
,
6/15/33
...........................
5,835,000
6,837,428
Poway
Unified
School
District
,
Community
Facilities
District
No.
16
Area
A
,
Special
Tax
,
2020
,
AGMC
Insured
,
4
%
,
9/01/50
........................................................
7,500,000
7,502,609
Facilities
Improvement
District
No.
2007-1
,
GO
,
B
,
Zero
Cpn.,
8/01/46
..........
45,000,000
17,049,852
Rancho
Mirage
Community
Facilities
District
,
City
of
Rancho
Mirage
Community
Facilities
District
No.
4C
,
Special
Tax
,
2022
,
5
%
,
9/01/42
........................................................
300,000
311,123
City
of
Rancho
Mirage
Community
Facilities
District
No.
4C
,
Special
Tax
,
2022
,
5
%
,
9/01/47
........................................................
500,000
515,443
City
of
Rancho
Mirage
Community
Facilities
District
No.
4C
,
Special
Tax
,
2022
,
5
%
,
9/01/53
........................................................
1,000,000
1,026,350
Regents
of
the
University
of
California
,
Medical
Center
,
Revenue
,
2016
L
,
Refunding
,
5
%
,
5/15/47
...................
39,575,000
40,428,039
Medical
Center
,
Revenue
,
2022
P
,
5
%
,
5/15/47
...........................
116,410,000
127,326,872
Medical
Center
,
Revenue
,
2022
P
,
4
%
,
5/15/53
...........................
84,305,000
83,962,620
Regents
of
the
University
of
California
Medical
Center
,
Medical
Center
,
Revenue
,
2016
L
,
Refunding
,
5
%
,
5/15/41
...........................................
10,000,000
10,281,317
Rialto
Unified
School
District
,
GO
,
2011
A
,
AGMC
Insured
,
Zero
Cpn.,
8/01/41
......
27,000,000
32,759,319
Rio
Hondo
Community
College
District
,
GO
,
2010
C
,
Zero
Cpn.,
8/01/35
..........
10,000,000
6,956,310
River
Islands
Public
Financing
Authority
,
Community
Facilities
District
No
2003-1
Improvement
Area
No.
1
,
Special
Tax
,
2022
A-1
,
Refunding
,
AGMC
Insured
,
5
%
,
9/01/42
............................
4,000,000
4,353,918
Community
Facilities
District
No
2003-1
Improvement
Area
No.
1
,
Special
Tax
,
2022
A-1
,
Refunding
,
AGMC
Insured
,
4.25
%
,
9/01/47
.........................
6,000,000
6,082,047
Community
Facilities
District
No
2003-1
Improvement
Area
No.
1
,
Special
Tax
,
2022
A-1
,
Refunding
,
AGMC
Insured
,
5.25
%
,
9/01/52
.........................
11,000,000
11,959,080
Franklin
California
Tax-Free
Income
Fund
Schedule
of
Investments
(unaudited)
The
accompanying
notes
are
an
integral
part
of
these
financial
statements.
Semiannual
Report
a
a
Principal
Amount
a
Value
a
a
a
a
a
Municipal
Bonds
(continued)
California
(continued)
Riverside
County
Transportation
Commission
,
Sales
Tax
,
Revenue
,
2017
B
,
Refunding
,
5
%
,
6/01/31
......................................................
$
3,685,000
$
3,960,017
Riverside
Unified
School
District
,
Community
Facilities
District
No.
19
Improvement
Area
No.
1
,
Special
Tax
,
2024
,
5
%
,
9/01/39
........................................................
375,000
403,232
Community
Facilities
District
No.
19
Improvement
Area
No.
1
,
Special
Tax
,
2024
,
5
%
,
9/01/44
........................................................
700,000
737,498
Community
Facilities
District
No.
19
Improvement
Area
No.
1
,
Special
Tax
,
2024
,
5
%
,
9/01/49
........................................................
1,050,000
1,094,579
Community
Facilities
District
No.
19
Improvement
Area
No.
1
,
Special
Tax
,
2024
,
5
%
,
9/01/54
........................................................
1,270,000
1,315,301
Community
Facilities
District
No.
19
Improvement
Area
No.
2
,
Special
Tax
,
2024
,
5
%
,
9/01/44
........................................................
480,000
505,713
Community
Facilities
District
No.
19
Improvement
Area
No.
2
,
Special
Tax
,
2024
,
5
%
,
9/01/49
........................................................
730,000
760,993
Community
Facilities
District
No.
19
Improvement
Area
No.
2
,
Special
Tax
,
2024
,
5
%
,
9/01/54
........................................................
775,000
802,645
Community
Facilities
District
No.
37
,
Special
Tax
,
2023
A
,
5
%
,
9/01/47
..........
1,150,000
1,196,237
Community
Facilities
District
No.
37
,
Special
Tax
,
2023
A
,
5
%
,
9/01/52
..........
2,135,000
2,209,791
f
RMA
Capital
Series
Trust
,
Revenue
,
144A,
2022-1
,
A
,
5.67
%
,
8/01/58
............
15,491,000
15,529,728
RNR
School
Financing
Authority
,
Community
Facilities
District
No.
92-1
,
Special
Tax
,
2015
A
,
Refunding
,
BAM
Insured
,
5
%
,
9/01/36
............................
11,145,000
11,341,184
Rocklin
Unified
School
District
,
GO
,
2003
,
NATL
Insured
,
Zero
Cpn.,
8/01/25
.............................
8,160,000
7,928,057
GO
,
2003
,
NATL
Insured
,
Zero
Cpn.,
8/01/26
.............................
8,695,000
8,198,461
GO
,
2003
,
NATL
Insured
,
Zero
Cpn.,
8/01/27
.............................
9,080,000
8,299,489
GO
,
2003
,
NATL
Insured
,
Zero
Cpn.,
8/01/28
.............................
16,615,000
14,716,110
Rohnert
Park
Community
Development
Commission
Successor
Agency
,
Tax
Allocation
,
2007
R
,
NATL
Insured
,
ETM,
5
%
,
8/01/37
...............................
1,380,000
1,441,356
Romoland
School
District
,
g
Special
Tax
,
2024
,
5
%
,
9/01/54
.......................................
1,000,000
1,049,322
Community
Facilities
District
No.
2016-1
,
Special
Tax
,
2023
,
5
%
,
9/01/43
........
750,000
802,859
Community
Facilities
District
No.
2016-1
,
Special
Tax
,
2023
,
5
%
,
9/01/48
........
1,000,000
1,055,193
Community
Facilities
District
No.
2016-1
,
Special
Tax
,
2023
,
5
%
,
9/01/53
........
1,500,000
1,566,978
Community
Facilities
District
No.
2016-2
,
Special
Tax
,
2022
,
4.5
%
,
9/01/42
.......
360,000
367,714
Community
Facilities
District
No.
2016-2
,
Special
Tax
,
2022
,
4.625
%
,
9/01/47
.....
750,000
762,381
Community
Facilities
District
No.
2016-2
,
Special
Tax
,
2022
,
4.75
%
,
9/01/52
......
1,000,000
1,017,038
Community
Facilities
District
No.
2017-1
Improvement
Area
No.
1
,
Special
Tax
,
2022
,
5
%
,
9/01/42
....................................................
750,000
797,619
Community
Facilities
District
No.
2017-1
Improvement
Area
No.
1
,
Special
Tax
,
2022
,
5.125
%
,
9/01/47
.................................................
1,200,000
1,267,374
Community
Facilities
District
No.
2017-1
Improvement
Area
No.
1
,
Special
Tax
,
2022
,
5.25
%
,
9/01/53
..................................................
2,500,000
2,625,818
Community
Facilities
District
No.
2017-1
Improvement
Area
No.
2
,
Special
Tax
,
2023
,
5
%
,
9/01/46
....................................................
370,000
390,554
Community
Facilities
District
No.
2017-1
Improvement
Area
No.
2
,
Special
Tax
,
2023
,
5
%
,
9/01/54
....................................................
1,600,000
1,665,477
Community
Facilities
District
No.
2020-1
,
Special
Tax
,
2024
,
5
%
,
9/01/54
........
1,000,000
1,049,495
Community
Facilities
District
No.
91-1
,
Special
Tax
,
2022
,
3.75
%
,
9/01/42
........
1,695,000
1,563,202
Community
Facilities
District
No.
91-1
,
Special
Tax
,
2022
,
4
%
,
9/01/46
..........
5,085,000
4,827,514
Roseville
Natural
Gas
Financing
Authority
,
Revenue
,
2007
,
5
%
,
2/15/26
..........
5,000,000
5,100,549
Sacramento
Area
Flood
Control
Agency
,
Consolidated
Capital
Assessment
District
No.
2
,
Special
Assessment
,
2016
A
,
Refunding
,
5
%
,
10/01/41
...........................................
13,740,000
14,222,696
Consolidated
Capital
Assessment
District
No.
2
,
Special
Assessment
,
2016
A
,
Refunding
,
5
%
,
10/01/43
...........................................
20,000,000
20,647,204
Franklin
California
Tax-Free
Income
Fund
Schedule
of
Investments
(unaudited)
Semiannual
Report
The
accompanying
notes
are
an
integral
part
of
these
financial
statements.
a
a
Principal
Amount
a
Value
a
a
a
a
a
Municipal
Bonds
(continued)
California
(continued)
Sacramento
City
Unified
School
District
,
GO
,
2017
E
,
4
%
,
5/01/47
...............
$
20,000,000
$
19,440,432
Sacramento
County
Water
Financing
Authority
,
Sacramento
County
Water
Agency
,
Revenue
,
2019
,
Refunding
,
5
%
,
6/01/27
.....
2,000,000
2,140,724
Sacramento
County
Water
Agency
,
Revenue
,
2022
A
,
4
%
,
11/01/25
............
27,060,000
27,459,468
Sacramento
Municipal
Utility
District
,
Revenue
,
2021
I
,
Refunding
,
5
%
,
8/15/25
................................
3,500,000
3,585,484
Revenue
,
2022
J
,
Refunding
,
5
%
,
8/15/26
...............................
2,615,000
2,746,624
Sacramento
Transportation
Authority
,
Sales
Tax
,
Revenue
,
2023
,
Refunding
,
5
%
,
10/01/37
........................................................
2,500,000
2,955,223
San
Bernardino
Community
College
District
,
GO
,
2009
B
,
Zero
Cpn.,
8/01/48
......
66,390,000
24,222,923
San
Diego
Community
College
District
,
GO
,
2009
B
,
Pre-Refunded
,
6
%
,
8/01/33
....
26,880,000
29,727,256
San
Diego
County
Regional
Airport
Authority
,
Revenue
,
2017
A
,
Refunding
,
5
%
,
7/01/47
...............................
5,000,000
5,170,301
Revenue
,
2019
A
,
Refunding
,
5
%
,
7/01/44
...............................
4,000,000
4,275,890
Revenue
,
2019
A
,
Refunding
,
5
%
,
7/01/49
...............................
5,000,000
5,295,442
Revenue
,
2019
B
,
Refunding
,
4
%
,
7/01/44
...............................
5,000,000
4,803,400
Revenue
,
2021
A
,
5
%
,
7/01/56
........................................
10,000,000
10,719,518
Revenue
,
2021
B
,
5
%
,
7/01/33
........................................
4,000,000
4,363,245
Revenue
,
2021
B
,
4
%
,
7/01/36
........................................
3,610,000
3,578,270
Special
Facilities
,
Revenue
,
2014
A
,
5
%
,
7/01/44
..........................
5,645,000
5,648,620
San
Diego
County
Regional
Transportation
Commission
,
Revenue
,
2016
A
,
5
%
,
4/01/48
.........................................................
25,000,000
25,599,535
San
Diego
County
Water
Authority
,
Revenue,
Sub.
Lien
,
2021
S-1
,
Refunding
,
5
%
,
5/01/28
......................................................
2,335,000
2,547,653
San
Diego
Unified
School
District
,
GO
,
2010
C
,
Zero
Cpn.,
7/01/48
.......................................
29,840,000
29,062,256
GO
,
2012
E
,
Zero
Cpn.,
7/01/47
.......................................
74,270,000
62,526,413
GO
,
2019
L
,
4
%
,
7/01/49
............................................
30,000
29,906
GO
,
2023
ZR-4B
,
Refunding
,
5
%
,
7/01/40
...............................
62,225,000
72,154,554
GO
,
2023
ZR-4B
,
Refunding
,
5
%
,
7/01/45
...............................
31,605,000
35,636,205
GO
,
R-2
,
Refunding
,
Zero
Cpn.,
7/01/40
.................................
79,760,000
82,385,277
San
Francisco
Bay
Area
Rapid
Transit
District
,
GO
,
2017
A-1
,
5
%
,
8/01/47
..........................................
11,480,000
11,905,866
GO
,
2020
C-1
,
4
%
,
8/01/33
..........................................
1,560,000
1,645,757
GO
,
2022
D-1
,
5
%
,
8/01/39
..........................................
1,500,000
1,717,353
GO
,
2022
D-1
,
3
%
,
8/01/41
..........................................
23,605,000
21,530,656
GO
,
2022
D-1
,
3
%
,
8/01/42
..........................................
20,000,000
17,925,348
San
Francisco
City
&
County
Airport
Comm-San
Francisco
International
Airport
,
Revenue
,
2016
B
,
5
%
,
5/01/41
........................................
65,645,000
66,579,155
Revenue
,
2016
B
,
5
%
,
5/01/46
........................................
28,825,000
29,157,194
Revenue
,
2016
C
,
5
%
,
5/01/46
........................................
67,880,000
69,208,439
Revenue
,
2019
A
,
Refunding
,
5
%
,
5/01/44
...............................
30,720,000
31,727,496
Revenue
,
2019
A
,
Refunding
,
5
%
,
5/01/49
...............................
8,000,000
8,209,082
Revenue,
Second
Series
,
2017
A
,
5
%
,
5/01/42
............................
48,155,000
49,159,094
Revenue,
Second
Series
,
2017
A
,
5
%
,
5/01/47
............................
28,625,000
28,951,271
Revenue,
Second
Series
,
2017
B
,
5
%
,
5/01/47
............................
200,000
207,046
Revenue,
Second
Series
,
2018
D
,
5
%
,
5/01/43
...........................
106,295,000
109,085,658
Revenue,
Second
Series
,
2018
D
,
5
%
,
5/01/48
...........................
33,675,000
34,195,720
Revenue,
Second
Series
,
2018
D
,
Pre-Refunded
,
5
%
,
5/01/48
................
25,000
26,517
Revenue,
Second
Series
,
2018
D
,
5.25
%
,
5/01/48
.........................
40,145,000
41,456,120
Revenue,
Second
Series
,
2018
E
,
5
%
,
5/01/48
............................
52,245,000
54,666,498
Revenue,
Second
Series
,
2019
B
,
5
%
,
5/01/49
............................
10,700,000
11,316,913
Revenue,
Second
Series
,
2019
E
,
5
%
,
5/01/45
............................
33,570,000
34,636,139
Revenue,
Second
Series
,
2019
E
,
5
%
,
5/01/50
............................
5,000,000
5,126,296
Revenue,
Second
Series
,
2021
A
,
Refunding
,
5
%
,
5/01/31
...................
1,405,000
1,542,717
Revenue,
Second
Series
,
2021
A
,
Refunding
,
5
%
,
5/01/34
...................
5,000,000
5,450,367
Franklin
California
Tax-Free
Income
Fund
Schedule
of
Investments
(unaudited)
The
accompanying
notes
are
an
integral
part
of
these
financial
statements.
Semiannual
Report
a
a
Principal
Amount
a
Value
a
a
a
a
a
Municipal
Bonds
(continued)
California
(continued)
San
Francisco
City
&
County
Redevelopment
Agency
Successor
Agency
,
Tax
Allocation,
Third
Lien
,
2017
B
,
AGMC
Insured
,
5
%
,
8/01/46
..................
$
10,000,000
$
10,394,924
San
Francisco
Unified
School
District
,
GO
,
2022
C
,
5
%
,
6/15/35
................
6,640,000
7,446,440
San
Gabriel
Unified
School
District
,
GO
,
2002
A
,
AGMC
Insured
,
Zero
Cpn.,
8/01/26
...........................
3,530,000
3,339,085
GO
,
2002
A
,
AGMC
Insured
,
Zero
Cpn.,
2/01/27
...........................
1,850,000
1,724,548
San
Jacinto
Unified
School
District
,
Community
Facilities
District
No.
2003-1
,
Special
Tax
,
2022
,
4
%
,
9/01/50
........
875,000
780,812
Community
Facilities
District
No.
2022-1
Improvement
Area
No.
1
,
Special
Tax
,
2023
,
5.25
%
,
9/01/54
..................................................
1,000,000
1,053,985
San
Joaquin
Hills
Transportation
Corridor
Agency
,
Revenue
,
1997
A
,
Refunding
,
5.9
%
,
1/15/38
..............................
106,465,000
139,783,041
Revenue
,
1997
A
,
Refunding
,
5.95
%
,
1/15/40
.............................
142,645,000
189,254,197
Revenue
,
1997
A
,
Refunding
,
6
%
,
1/15/43
...............................
161,250,000
217,715,831
Revenue
,
1997
A
,
Refunding
,
6
%
,
1/15/45
...............................
143,336,000
194,939,268
Revenue
,
1997
A
,
Refunding
,
6
%
,
1/15/46
...............................
143,336,000
195,602,240
Revenue
,
1997
A
,
Refunding
,
NATL
Insured
,
Zero
Cpn.,
1/15/26
...............
13,155,000
12,618,753
Revenue,
Senior
Lien
,
1993
,
ETM,
Zero
Cpn.,
1/01/25
......................
5,700,000
5,648,106
Revenue,
Senior
Lien
,
1993
,
ETM,
Zero
Cpn.,
1/01/28
......................
33,545,000
30,935,595
Revenue,
Senior
Lien
,
1993
,
ETM,
Zero
Cpn.,
1/01/29
......................
37,050,000
33,317,776
Revenue,
Senior
Lien
,
2021
A
,
Refunding
,
AGMC
Insured
,
4
%
,
1/15/44
.........
130,746,000
133,536,067
Revenue,
Senior
Lien
,
2021
A
,
Refunding
,
AGMC
Insured
,
4
%
,
1/15/50
.........
191,775,000
193,311,252
San
Jose
Unified
School
District
,
COP
,
2002
,
AGMC
Insured
,
ETM,
Zero
Cpn.,
1/01/27
.......................
7,105,000
6,671,896
COP
,
2002
,
AGMC
Insured
,
ETM,
Zero
Cpn.,
1/01/29
.......................
7,105,000
6,307,920
San
Juan
Unified
School
District
,
GO
,
2003
B
,
NATL
Insured
,
Zero
Cpn.,
8/01/26
...........................
9,175,000
8,579,731
GO
,
2003
B
,
NATL
Insured
,
Zero
Cpn.,
8/01/27
...........................
18,605,000
17,137,944
GO
,
2003
B
,
NATL
Insured
,
Zero
Cpn.,
8/01/28
...........................
19,470,000
17,425,177
San
Luis
Obispo
County
Financing
Authority
,
Revenue
,
2015
A
,
Refunding
,
BAM
Insured
,
5
%
,
9/01/37
...............................................
10,000,000
10,176,176
San
Marino
Unified
School
District
,
GO
,
2000
A
,
NATL
Insured
,
Zero
Cpn.,
7/01/25
..
6,080,000
5,944,075
San
Mateo
Foster
City
Public
Financing
Authority
,
Estero
Municipal
Improvement
District
,
Revenue
,
2021
A
,
ETM,
5
%
,
8/01/25
.............................
10,545,000
10,784,250
San
Rafael
City
High
School
District
,
GO
,
2018
B
,
4
%
,
8/01/47
.................
17,060,000
17,019,481
Sanger
Unified
School
District
,
GO
,
A
,
BAM
Insured
,
4
%
,
8/01/41
...............
10,000,000
10,050,146
Santa
Cruz
County
Redevelopment
Successor
Agency
,
Tax
Allocation
,
2015
A
,
Refunding
,
AGMC
Insured
,
5
%
,
9/01/35
.................................
20,000,000
20,391,664
School
Facilities
Financing
Authority
,
Twin
Rivers
Unified
School
District
,
Revenue
,
A
,
AGMC
Insured
,
Zero
Cpn.,
8/01/42
....................................
49,000,000
22,902,967
Semitropic
Improvement
District
of
the
Semitropic
Water
Storage
District
,
Revenue,
Second
Lien
,
2015
A
,
Refunding
,
AGMC
Insured
,
5
%
,
12/01/45
...............
10,000,000
10,178,965
Southern
California
Public
Power
Authority
,
Revenue
,
2007
A
,
5.25
%
,
11/01/27
.....................................
9,855,000
10,327,680
Revenue
,
2007
A
,
5
%
,
11/01/33
.......................................
17,500,000
18,617,053
Los
Angeles
Department
of
Water
&
Power
Power
System
,
Revenue
,
2023-1
A
,
5.25
%
,
7/01/53
..................................................
28,975,000
32,646,619
Southern
Mono
Health
Care
District
,
GO
,
A
,
NATL
Insured
,
Zero
Cpn.,
8/01/28
................................
2,340,000
2,067,784
GO
,
A
,
NATL
Insured
,
Zero
Cpn.,
8/01/29
................................
2,440,000
2,087,156
GO
,
A
,
NATL
Insured
,
Zero
Cpn.,
8/01/30
................................
2,550,000
2,102,914
GO
,
A
,
NATL
Insured
,
Zero
Cpn.,
8/01/31
................................
2,660,000
2,109,977
State
of
California
,
GO
,
5.625
%
,
9/01/24
...............................................
90,000
90,000
GO
,
Refunding
,
4
%
,
10/01/24
.........................................
5,685,000
5,690,195
GO
,
Refunding
,
4
%
,
11/01/24
.........................................
11,655,000
11,678,054
GO
,
5
%
,
11/01/24
.................................................
5,000,000
5,017,836
Franklin
California
Tax-Free
Income
Fund
Schedule
of
Investments
(unaudited)
Semiannual
Report
The
accompanying
notes
are
an
integral
part
of
these
financial
statements.
a
a
Principal
Amount
a
Value
a
a
a
a
a
Municipal
Bonds
(continued)
California
(continued)
State
of
California,
(continued)
GO
,
4
%
,
12/01/24
.................................................
$
3,500,000
$
3,510,940
GO
,
5
%
,
3/01/25
..................................................
10,000,000
10,120,270
GO
,
AMBAC
Insured
,
5.9
%
,
3/01/25
....................................
35,000
35,512
GO
,
Refunding
,
5
%
,
4/01/25
.........................................
25,625,000
25,989,257
GO
,
Refunding
,
5
%
,
11/01/25
.........................................
39,975,000
41,100,640
GO
,
Refunding
,
5
%
,
12/01/25
.........................................
2,375,000
2,446,744
GO
,
5
%
,
4/01/27
..................................................
4,000,000
4,248,873
GO
,
Refunding
,
5
%
,
4/01/28
.........................................
2,930,000
3,180,408
GO
,
Refunding
,
5
%
,
8/01/28
.........................................
12,020,000
12,848,802
GO
,
Refunding
,
5
%
,
9/01/30
.........................................
5,000,000
5,658,098
GO
,
Refunding
,
5
%
,
11/01/30
.........................................
5,320,000
6,034,595
GO
,
5.75
%
,
10/01/31
...............................................
28,805,000
31,553,026
GO
,
Refunding
,
5
%
,
10/01/32
.........................................
4,125,000
4,543,836
GO
,
5
%
,
4/01/33
..................................................
5,000,000
5,448,201
GO
,
Refunding
,
5
%
,
3/01/35
.........................................
56,185,000
62,105,298
GO
,
Refunding
,
5
%
,
9/01/35
.........................................
9,000,000
9,328,860
GO
,
Refunding
,
4
%
,
3/01/37
.........................................
10,000,000
10,381,421
GO
,
Refunding
,
5
%
,
8/01/37
.........................................
2,900,000
3,104,423
GO
,
5
%
,
10/01/39
.................................................
15,000,000
15,387,278
GO
,
5
%
,
10/01/39
.................................................
13,340,000
13,363,482
GO
,
5
%
,
10/01/44
.................................................
1,660,000
1,661,500
GO
,
5
%
,
3/01/45
..................................................
17,500,000
17,665,602
GO
,
5
%
,
8/01/45
..................................................
10,085,000
10,257,933
GO
,
5
%
,
9/01/45
..................................................
5,000,000
5,154,898
GO
,
5
%
,
8/01/46
..................................................
57,200,000
58,856,180
GO
,
5
%
,
9/01/46
..................................................
8,930,000
9,199,725
GO
,
5
%
,
10/01/47
.................................................
11,000,000
11,261,383
GO
,
5
%
,
10/01/48
.................................................
5,000,000
5,264,109
GO
,
1996
,
FGIC
Insured
,
5.375
%
,
6/01/26
...............................
535,000
538,234
GO
,
1997
,
NATL,
FGIC
Insured
,
5.625
%
,
10/01/26
.........................
5,005,000
5,017,446
GO
,
2004
,
5.2
%
,
4/01/26
............................................
20,000
20,031
GO
,
2017
,
5
%
,
11/01/27
.............................................
2,380,000
2,561,299
GO
,
2017
,
5
%
,
11/01/47
.............................................
23,370,000
24,339,649
GO
,
2022
,
Refunding
,
5
%
,
4/01/35
.....................................
12,985,000
13,992,559
GO
,
2022
,
Refunding
,
5
%
,
4/01/35
.....................................
38,600,000
44,035,540
Stockton
Community
Facilities
District
,
City
of
Stockton
Community
Facilities
District
No.
2018-2
Improvement
Area
No.
3
,
Special
Tax
,
2024
,
5
%
,
9/01/39
......................................
370,000
394,102
City
of
Stockton
Community
Facilities
District
No.
2018-2
Improvement
Area
No.
3
,
Special
Tax
,
2024
,
5
%
,
9/01/44
......................................
380,000
397,767
City
of
Stockton
Community
Facilities
District
No.
2018-2
Improvement
Area
No.
3
,
Special
Tax
,
2024
,
5
%
,
9/01/49
......................................
525,000
549,268
City
of
Stockton
Community
Facilities
District
No.
2018-2
Improvement
Area
No.
3
,
Special
Tax
,
2024
,
5
%
,
9/01/54
......................................
650,000
675,235
Sulphur
Springs
Union
School
District
,
COP
,
2010
,
AGMC
Insured
,
ETM,
6.5
%
,
12/01/37
..........................
275,000
277,230
COP
,
2010
,
AGMC
Insured
,
6.5
%
,
12/01/37
..............................
1,695,000
1,773,725
COP
,
2010
,
Pre-Refunded
,
AGMC
Insured
,
6.5
%
,
12/01/37
..................
9,695,000
10,156,274
Temecula
Public
Financing
Authority
,
Community
Facilities
District
No.
20-01
,
Special
Tax
,
2024
,
5
%
,
9/01/39
.........
330,000
354,844
Community
Facilities
District
No.
20-01
,
Special
Tax
,
2024
,
5
%
,
9/01/44
.........
925,000
974,551
Community
Facilities
District
No.
20-01
,
Special
Tax
,
2024
,
5
%
,
9/01/49
.........
975,000
1,016,395
Community
Facilities
District
No.
20-01
,
Special
Tax
,
2024
,
5
%
,
9/01/54
.........
900,000
932,103
Temescal
Valley
Water
District
,
Community
Facilities
District
No.
4
Terramor
Improvement
Area
No.
2
,
Special
Tax
,
2021
,
4
%
,
9/01/36
................................................
930,000
934,659
Franklin
California
Tax-Free
Income
Fund
Schedule
of
Investments
(unaudited)
The
accompanying
notes
are
an
integral
part
of
these
financial
statements.
Semiannual
Report
a
a
Principal
Amount
a
Value
a
a
a
a
a
Municipal
Bonds
(continued)
California
(continued)
Temescal
Valley
Water
District,
(continued)
Community
Facilities
District
No.
4
Terramor
Improvement
Area
No.
2
,
Special
Tax
,
2021
,
4
%
,
9/01/41
................................................
$
785,000
$
778,156
Community
Facilities
District
No.
4
Terramor
Improvement
Area
No.
2
,
Special
Tax
,
2021
,
4
%
,
9/01/46
................................................
1,040,000
988,752
Community
Facilities
District
No.
4
Terramor
Improvement
Area
No.
2
,
Special
Tax
,
2021
,
4
%
,
9/01/51
................................................
930,000
862,798
Three
Rivers
Levee
Improvement
Authority
,
Special
Tax
,
2021
A
,
Refunding
,
3
%
,
9/01/24
.............................
245,000
245,000
Special
Tax
,
2021
A
,
Refunding
,
4
%
,
9/01/25
.............................
280,000
281,218
Special
Tax
,
2021
A
,
Refunding
,
4
%
,
9/01/36
.............................
2,025,000
1,991,377
Special
Tax
,
2021
A
,
Refunding
,
4
%
,
9/01/41
.............................
1,895,000
1,817,760
Special
Tax
,
2021
A
,
Refunding
,
4
%
,
9/01/46
.............................
2,700,000
2,439,072
Special
Tax
,
2021
A
,
Refunding
,
4
%
,
9/01/51
.............................
5,065,000
4,467,164
Tobacco
Securitization
Authority
of
Northern
California
,
Sacramento
County
Tobacco
Securitization
Corp.
,
Revenue,
Senior
Lien
,
2021
A
,
1
,
Refunding
,
5
%
,
6/01/29
............................................
1,500,000
1,619,321
Sacramento
County
Tobacco
Securitization
Corp.
,
Revenue,
Senior
Lien
,
2021
A
,
1
,
Refunding
,
4
%
,
6/01/49
............................................
8,000,000
7,543,071
Tobacco
Securitization
Authority
of
Southern
California
,
San
Diego
County
Tobacco
Asset
Securitization
Corp.
,
Revenue
,
2019
B-1
,
2
,
Refunding
,
5
%
,
6/01/48
.......
12,465,000
12,641,919
Town
of
Tiburon
,
Assessment
District
No.
2017-1
,
1915
Act,
Special
Assessment
,
2021
A
,
2.375
%
,
9/02/41
........................................................
550,000
395,596
Assessment
District
No.
2017-1
,
1915
Act,
Special
Assessment
,
2021
A
,
2.5
%
,
9/02/51
........................................................
1,250,000
800,236
Tracy
Community
Facilities
District
,
City
of
Tracy
Community
Facilities
District
No.
2016-01
Improvement
Area
No.
2
,
Special
Tax
,
2023
,
5.75
%
,
9/01/48
...................................
1,750,000
1,890,961
City
of
Tracy
Community
Facilities
District
No.
2016-01
Improvement
Area
No.
2
,
Special
Tax
,
2023
,
5.875
%
,
9/01/53
...................................
2,900,000
3,143,026
City
of
Tracy
Community
Facilities
District
No.
2016-02
Improvement
Area
No.
2
,
Special
Tax
,
2021
,
3
%
,
9/01/24
......................................
100,000
100,000
City
of
Tracy
Community
Facilities
District
No.
2016-02
Improvement
Area
No.
2
,
Special
Tax
,
2021
,
4
%
,
9/01/25
......................................
115,000
115,489
City
of
Tracy
Community
Facilities
District
No.
2016-02
Improvement
Area
No.
2
,
Special
Tax
,
2021
,
4
%
,
9/01/28
......................................
120,000
121,783
City
of
Tracy
Community
Facilities
District
No.
2016-02
Improvement
Area
No.
2
,
Special
Tax
,
2021
,
4
%
,
9/01/30
......................................
110,000
111,739
City
of
Tracy
Community
Facilities
District
No.
2016-02
Improvement
Area
No.
2
,
Special
Tax
,
2021
,
4
%
,
9/01/36
......................................
430,000
430,588
City
of
Tracy
Community
Facilities
District
No.
2016-02
Improvement
Area
No.
2
,
Special
Tax
,
2021
,
4
%
,
9/01/41
......................................
665,000
638,668
City
of
Tracy
Community
Facilities
District
No.
2016-02
Improvement
Area
No.
2
,
Special
Tax
,
2021
,
4
%
,
9/01/46
......................................
885,000
814,284
City
of
Tracy
Community
Facilities
District
No.
2016-02
Improvement
Area
No.
2
,
Special
Tax
,
2021
,
4
%
,
9/01/51
......................................
2,210,000
1,973,775
Transbay
Joint
Powers
Authority
,
Transbay
Redevelopment
Project
Tax
Increment
Re-Development
Project
,
Tax
Allocation,
Senior
Lien
,
2020
A
,
5
%
,
10/01/45
...........................
11,030,000
11,392,053
Transbay
Redevelopment
Project
Tax
Increment
Re-Development
Project
,
Tax
Allocation,
Senior
Lien
,
2020
A
,
5
%
,
10/01/49
...........................
8,790,000
9,011,895
Truckee-Donner
Public
Utility
District
,
Water
System
,
Revenue
,
2022
A
,
5
%
,
11/15/47
3,230,000
3,535,054
Turlock
Irrigation
District
,
Revenue
,
2019
,
Refunding
,
5
%
,
1/01/44
...............
9,060,000
9,791,054
Union
Elementary
School
District
,
GO
,
1999
A
,
NATL
Insured
,
Zero
Cpn.,
9/01/24
...........................
2,000,000
2,000,000
GO
,
2001
B
,
NATL
Insured
,
Zero
Cpn.,
9/01/25
...........................
5,500,000
5,353,675
Franklin
California
Tax-Free
Income
Fund
Schedule
of
Investments
(unaudited)
Semiannual
Report
The
accompanying
notes
are
an
integral
part
of
these
financial
statements.
a
a
Principal
Amount
a
Value
a
a
a
a
a
Municipal
Bonds
(continued)
California
(continued)
Union
Elementary
School
District,
(continued)
GO
,
2001
B
,
NATL
Insured
,
Zero
Cpn.,
9/01/26
...........................
$
5,850,000
$
5,546,703
University
of
California
,
Revenue
,
2015
I
,
Refunding
,
5
%
,
5/15/40
................................
22,990,000
23,264,829
Revenue
,
2015
I
,
Refunding
,
5
%
,
5/15/50
................................
25,420,000
25,658,641
Revenue
,
2016
K
,
4
%
,
5/15/46
........................................
19,850,000
19,665,401
Revenue
,
2017
AV
,
5.25
%
,
5/15/47
.....................................
6,775,000
7,060,161
Revenue
,
2017
M
,
5
%
,
5/15/42
.......................................
15,410,000
16,007,116
Revenue
,
2017
M
,
5
%
,
5/15/47
.......................................
27,200,000
28,121,835
Revenue
,
2018
AZ
,
Refunding
,
5
%
,
5/15/43
..............................
28,000,000
29,596,890
Revenue
,
2018
AZ
,
Refunding
,
5
%
,
5/15/48
..............................
47,230,000
49,574,152
Revenue
,
2018
AZ
,
Refunding
,
5.25
%
,
5/15/58
............................
9,110,000
9,602,270
Revenue
,
2018
O
,
Refunding
,
5
%
,
5/15/39
...............................
14,400,000
15,325,314
Revenue
,
2018
O
,
Refunding
,
5
%
,
5/15/48
...............................
11,445,000
12,000,897
Revenue
,
2018
O
,
Refunding
,
5
%
,
5/15/58
...............................
5,805,000
6,064,825
Revenue
,
2021
Q
,
Refunding
,
4
%
,
5/15/37
...............................
1,500,000
1,577,335
Revenue
,
2022
BK
,
5
%
,
5/15/52
.......................................
48,195,000
52,512,467
Revenue
,
2023
BN
,
Refunding
,
5
%
,
5/15/43
..............................
9,000,000
10,172,513
Revenue
,
2024
BS
,
Refunding
,
5
%
,
5/15/37
..............................
81,135,000
95,563,659
Revenue
,
2024
BS
,
Refunding
,
5
%
,
5/15/38
..............................
11,000,000
12,920,974
Upland
Community
Facilities
District
,
City
of
Upland
Community
Facilities
District
No.
2016-1
Improvement
Area
No.
2
,
Special
Tax
,
2021
A
,
4
%
,
9/01/40
....................................
260,000
250,916
City
of
Upland
Community
Facilities
District
No.
2016-1
Improvement
Area
No.
2
,
Special
Tax
,
2021
A
,
4
%
,
9/01/45
....................................
165,000
151,839
City
of
Upland
Community
Facilities
District
No.
2016-1
Improvement
Area
No.
2
,
Special
Tax
,
2021
A
,
4
%
,
9/01/51
....................................
260,000
230,724
Upland
Unified
School
District
,
GO
,
2011
C
,
Zero
Cpn.,
8/01/45
.................
62,900,000
24,850,532
Val
Verde
Unified
School
District
,
GO
,
2010
B
,
AGMC
Insured
,
6.125
%
,
8/01/34
............................
1,000,000
1,205,135
GO
,
2020
A
,
BAM
Insured
,
4
%
,
8/01/46
.................................
1,450,000
1,429,391
Community
Facilities
District
No.
2018-1
,
Special
Tax
,
2022
,
4
%
,
9/01/52
........
7,000,000
6,187,831
Community
Facilities
District
No.
2018-2
Improvement
Area
No.
1
,
Special
Tax
,
2023
,
5
%
,
9/01/43
....................................................
1,230,000
1,293,938
Community
Facilities
District
No.
2018-2
Improvement
Area
No.
1
,
Special
Tax
,
2023
,
5
%
,
9/01/48
....................................................
1,755,000
1,829,525
Community
Facilities
District
No.
2018-2
Improvement
Area
No.
1
,
Special
Tax
,
2023
,
5
%
,
9/01/53
....................................................
2,445,000
2,527,377
Vallejo
Public
Financing
Authority
,
City
of
Vallejo
Hiddenbrooke
Improvement
District
No.
1
,
Revenue
,
2004
A
,
5.8
%
,
9/01/31
.................................
3,075,000
3,110,925
Vista
Redevelopment
Agency
Successor
Agency
,
Tax
Allocation
,
2015
B-1
,
Refunding
,
AGMC
Insured
,
5
%
,
9/01/37
..........................................
3,020,000
3,083,038
Vista
Unified
School
District
,
GO
,
2002
A
,
AGMC
Insured
,
Zero
Cpn.,
8/01/26
...........................
7,150,000
6,745,498
GO
,
2002
A
,
AGMC
Insured
,
Zero
Cpn.,
2/01/27
...........................
4,795,000
4,450,774
Washington
Township
Health
Care
District
,
GO
,
2015
B
,
5
%
,
8/01/45
............................................
15,000,000
15,097,787
Revenue
,
2023
A
,
5.75
%
,
7/01/48
.....................................
1,300,000
1,429,645
Revenue
,
2023
A
,
5.75
%
,
7/01/53
.....................................
1,000,000
1,086,099
West
Patterson
Financing
Authority
,
Community
Facilities
District
No.
2018-1
,
Special
Tax
,
2024
,
5
%
,
9/01/39
........
300,000
322,586
Community
Facilities
District
No.
2018-1
,
Special
Tax
,
2024
,
4.375
%
,
9/01/44
.....
830,000
831,145
Community
Facilities
District
No.
2018-1
,
Special
Tax
,
2024
,
4.625
%
,
9/01/49
.....
780,000
785,267
Community
Facilities
District
No.
2018-1
,
Special
Tax
,
2024
,
5
%
,
9/01/54
........
2,440,000
2,527,036
West
Sacramento
Area
Flood
Control
Agency
,
Special
Assessment
,
2015
,
AGMC
Insured
,
5
%
,
9/01/40
.....................
3,000,000
3,056,436
Special
Assessment
,
2015
,
AGMC
Insured
,
5
%
,
9/01/45
.....................
7,500,000
7,614,094
Franklin
California
Tax-Free
Income
Fund
Schedule
of
Investments
(unaudited)
The
accompanying
notes
are
an
integral
part
of
these
financial
statements.
Semiannual
Report
a
a
Principal
Amount
a
Value
a
a
a
a
a
Municipal
Bonds
(continued)
California
(continued)
West
Sacramento
Financing
Authority
,
Special
Tax
,
A
,
AGMC
Insured
,
5
%
,
9/01/34
..
$
4,940,000
$
5,580,294
Westside
Union
School
District
,
Community
Facilities
District
No.
2016-1
Improvement
Area
B
,
Special
Tax
,
2023
,
5
%
,
9/01/43
....................................................
1,175,000
1,198,506
Community
Facilities
District
No.
2016-1
Improvement
Area
B
,
Special
Tax
,
2023
,
5.25
%
,
9/01/52
..................................................
1,890,000
1,921,577
William
S
Hart
Union
High
School
District
,
Community
Facilities
District
No.
2021-1
Improvement
Area
A
,
Special
Tax
,
2024
,
5
%
,
9/01/44
....................................................
385,000
407,469
Community
Facilities
District
No.
2021-1
Improvement
Area
A
,
Special
Tax
,
2024
,
5
%
,
9/01/49
....................................................
750,000
784,669
Community
Facilities
District
No.
2021-1
Improvement
Area
A
,
Special
Tax
,
2024
,
5
%
,
9/01/54
....................................................
885,000
919,358
12,467,448,030
Florida
0.7%
f
Capital
Trust
Authority
,
Gulf
Coast
Portfolio
Obligated
Group
,
Revenue
,
144A,
2024
,
Refunding
,
Zero
Cpn.,
3/01/29
........................................
109,900,000
87,211,903
Oregon
0.0%
†
f
State
of
Oregon
Housing
&
Community
Services
Department
,
Union
at
Pacific
Highway
LP
,
Revenue
,
144A,
2022
II-2
,
6.75
%
,
12/01/25
...........................
2,525,000
2,529,683
Wisconsin
0.2%
f
Public
Finance
Authority
,
Revenue
,
144A,
2022
,
B-1
,
4
%
,
12/28/44
..............
30,400,000
25,594,034
U.S.
Territories
2.2%
Guam
0.2%
Antonio
B
Won
Pat
International
Airport
Authority
,
Revenue
,
2021
A
,
Refunding
,
2.499
%
,
10/01/25
...........................
2,660,000
2,587,437
Revenue
,
2021
A
,
Refunding
,
2.899
%
,
10/01/27
...........................
2,150,000
2,037,403
Revenue
,
2021
A
,
Refunding
,
3.099
%
,
10/01/28
...........................
3,140,000
2,948,456
Revenue
,
2021
A
,
Refunding
,
3.189
%
,
10/01/29
...........................
3,560,000
3,298,530
Revenue
,
2021
A
,
Refunding
,
3.339
%
,
10/01/30
...........................
2,400,000
2,195,650
Revenue
,
2021
A
,
Refunding
,
3.489
%
,
10/01/31
...........................
2,155,000
1,954,382
Revenue
,
2021
A
,
Refunding
,
3.839
%
,
10/01/36
...........................
9,650,000
8,450,811
Revenue
,
2021
A
,
Refunding
,
4.46
%
,
10/01/43
............................
2,400,000
2,048,034
25,520,703
Puerto
Rico
2.0%
Children's
Trust
Fund
,
Revenue
,
2002
,
5.5
%
,
5/15/39
........................................
4,600,000
4,623,780
Revenue
,
2002
,
5.625
%
,
5/15/43
......................................
16,000,000
16,185,792
h
Puerto
Rico
Electric
Power
Authority
,
Revenue
,
2013
A
,
5
%
,
7/01/29
........................................
20,000,000
8,450,000
Revenue
,
2013
A
,
7
%
,
7/01/33
........................................
50,000,000
21,125,000
Revenue
,
WW
,
5
%
,
7/01/28
..........................................
12,030,000
5,082,675
Puerto
Rico
Industrial
Tourist
Educational
Medical
&
Environmental
Control
Facilities
Financing
Authority
,
Revenue
,
2000
B
,
6.625
%
,
1/01/27
....................................
471,227
466,961
Revenue
,
2000
B
,
6.625
%
,
1/01/28
....................................
3,593,968
3,560,284
Puerto
Rico
Sales
Tax
Financing
Corp.
,
Sales
Tax
,
Revenue
,
A-1
,
4.75
%
,
7/01/53
................................
29,500,000
29,278,735
Sales
Tax
,
Revenue
,
A-1
,
5
%
,
7/01/58
..................................
184,264,000
185,078,908
273,852,135
Total
U.S.
Territories
....................................................................
299,372,838
Total
Municipal
Bonds
(Cost
$
12,208,278,051
)
..................................
12,882,156,488
Franklin
California
Tax-Free
Income
Fund
Schedule
of
Investments
(unaudited)
Semiannual
Report
The
accompanying
notes
are
an
integral
part
of
these
financial
statements.
a
a
Shares
a
Value
a
a
a
a
a
Escrows
and
Litigation
Trusts
0.0%
†
a
,b
Puerto
Rico
Electric
Power
Authority,
Escrow
Account
........................
4,167,132
$
3,333,706
Total
Escrows
and
Litigation
Trusts
(Cost
$
–
)
...................................
3,333,706
Total
Long
Term
Investments
(Cost
$
12,222,126,110
)
............................
12,899,338,798
a
a
a
a
a
Short
Term
Investments
2.3%
Principal
Amount
Municipal
Bonds
2.3%
California
2.3%
i
Anaheim
Housing
&
Public
Improvements
Authority
,
City
of
Anaheim
Water
System
,
Revenue,
Second
Lien
,
2024
A
,
LOC
Bank
of
America
NA
,
Daily
VRDN
and
Put
,
3.45
%
,
10/01/54
...................................................
$
26,100,000
26,100,000
i
Bay
Area
Toll
Authority
,
Revenue
,
2024
D
,
Refunding
,
LOC
TD
Bank
NA
,
Daily
VRDN
and
Put
,
3.65
%
,
4/01/59
.............................................
15,000,000
15,000,000
i
California
Health
Facilities
Financing
Authority
,
Adventist
Health
System/West
Obligated
Group
,
Revenue
,
2009
B
,
LOC
US
Bank
NA
,
Daily
VRDN
and
Put
,
3.15
%
,
9/01/38
.........................................................
12,100,000
12,100,000
i
California
Statewide
Communities
Development
Authority
,
Rady
Children's
Hospital
Obligated
Group
,
Revenue
,
2008
A
,
Refunding
,
LOC
US
Bank
NA
,
Daily
VRDN
and
Put
,
3.15
%
,
8/15/47
................................................
20,205,000
20,205,000
i
Eastern
Municipal
Water
District
,
Revenue
,
2018
A
,
Refunding
,
SPA
Bank
of
America
NA
,
Daily
VRDN
and
Put
,
3.75
%
,
7/01/46
................................
2,600,000
2,600,000
i
Irvine
Ranch
Water
District
,
Water
Service
Corp.
,
Special
Assessment
,
2009
A
,
LOC
US
Bank
NA
,
Daily
VRDN
and
Put
,
3.15
%
,
10/01/41
..........................................
9,155,000
9,155,000
Water
Service
Corp.
,
Special
Assessment
,
2009
B
,
LOC
Bank
of
America
NA
,
Daily
VRDN
and
Put
,
3.4
%
,
10/01/41
......................................
8,200,000
8,200,000
i
Los
Angeles
Department
of
Water
&
Power
,
Power
System
,
Revenue
,
2002
A-6
,
Refunding
,
SPA
Bank
of
America
NA
,
Daily
VRDN
and
Put
,
3.57
%
,
7/01/35
......................................
5,755,000
5,755,000
Power
System
,
Revenue
,
2023
F-2
,
Refunding
,
SPA
JPMorgan
Chase
Bank
NA
,
Daily
VRDN
and
Put
,
3.75
%
,
7/01/47
.................................
16,400,000
16,400,000
Water
System
,
Revenue
,
2019
A-2
,
Refunding
,
SPA
Barclays
Bank
plc
,
Daily
VRDN
and
Put
,
3.65
%
,
7/01/45
...........................................
5,110,000
5,110,000
i
State
of
California
,
GO
,
2005
B-5
,
LOC
US
Bank
NA
,
Daily
VRDN
and
Put
,
3.7
%
,
5/01/40
.........................................................
6,100,000
6,100,000
i
University
of
California
,
Revenue
,
2013
AL-1
,
Daily
VRDN
and
Put
,
3.45
%
,
5/15/48
..................
12,145,000
12,145,000
Revenue
,
2013
AL-3
,
Refunding
,
Daily
VRDN
and
Put
,
3.65
%
,
5/15/48
..........
52,900,000
52,900,000
Revenue
,
2013
AL-4
,
Refunding
,
Daily
VRDN
and
Put
,
3.8
%
,
5/15/48
...........
13,515,000
13,515,000
Revenue
,
2023
BP-1
,
Refunding
,
Daily
VRDN
and
Put
,
3.45
%
,
5/15/48
.........
98,300,000
98,300,000
303,585,000
Total
Municipal
Bonds
(Cost
$
303,585,000
)
.....................................
303,585,000
Total
Short
Term
Investments
(Cost
$
303,585,000
)
...............................
303,585,000
a
Total
Investments
(Cost
$
12,525,711,110
)
99.0
%
.................................
$13,202,923,798
Other
Assets,
less
Liabilities
1.0
%
.............................................
129,826,110
Net
Assets
100.0%
...........................................................
$13,332,749,908
Franklin
California
Tax-Free
Income
Fund
Schedule
of
Investments
(unaudited)
The
accompanying
notes
are
an
integral
part
of
these
financial
statements.
Semiannual
Report
See
Abbreviations
on
page
47
.
†
Rounds
to
less
than
0.1%
of
net
assets.
a
Fair
valued
using
significant
unobservable
inputs.
See
Note
10
regarding
fair
value
measurements.
b
Non-income
producing.
c
See
Note
1(c)
regarding
senior
floating
rate
interests.
d
The
coupon
rate
shown
represents
the
rate
inclusive
of
any
caps
or
floors,
if
applicable,
in
effect
at
period
end.
e
The
maturity
date
shown
represents
the
mandatory
put
date.
f
Security
was
purchased
pursuant
to
Rule
144A
or
Regulation
S
under
the
Securities
Act
of
1933.
144A
securities
may
be
sold
in
transactions
exempt
from
registration
only
to
qualified
institutional
buyers
or
in
a
public
offering
registered
under
the
Securities
Act
of
1933.
Regulation
S
securities
cannot
be
sold
in
the
United
States
without
either
an
effective
registration
statement
filed
pursuant
to
the
Securities
Act
of
1933,
or
pursuant
to
an
exemption
from
registration.
At
August
31,
2024,
the
aggregate
value
of
these
securities
was
$1,237,897,767,
representing
9.3%
of
net
assets.
g
Security
purchased
on
a
when-issued
basis.
See
Note
1(b).
h
Defaulted
security
or
security
for
which
income
has
been
deemed
uncollectible.
See
Note
7.
i
Variable
rate
demand
notes
(VRDNs)
are
obligations
which
contain
a
floating
or
variable
interest
rate
adjustment
formula
and
an
unconditional
right
of
demand
to
receive
payment
of
the
principal
balance
plus
accrued
interest
at
specified
dates.
Unless
otherwise
noted,
the
coupon
rate
is
determined
based
on
factors
including
supply
and
demand,
underlying
credit,
tax
treatment,
and
current
short
term
rates.
The
coupon
rate
shown
represents
the
rate
at
period
end.
Franklin
California
Tax-Free
Income
Fund
Financial
Statements
Statement
of
Assets
and
Liabilities
August
31,
2024
(unaudited)
Semiannual
Report
The
accompanying
notes
are
an
integral
part
of
these
financial
statements.
Franklin
California
Tax-
Free
Income
Fund
Assets:
Investments
in
securities:
Cost
-
Unaffiliated
issuers
...................................................................
$12,525,711,110
Value
-
Unaffiliated
issuers
..................................................................
$13,202,923,798
Cash
....................................................................................
34,662,893
Receivables:
Capital
shares
sold
........................................................................
11,607,163
Interest
.................................................................................
129,047,782
Unrealized
appreciation
on
unfunded
commitments
(Note
1
b
)
..........................................
2,211,045
Total
assets
..........................................................................
13,380,452,681
Liabilities:
Payables:
Investment
securities
purchased
..............................................................
17,323,632
Capital
shares
redeemed
...................................................................
19,340,110
Management
fees
.........................................................................
4,920,873
Distribution
fees
..........................................................................
1,387,528
Transfer
agent
fees
........................................................................
1,451,769
Trustees'
fees
and
expenses
.................................................................
21,928
Distributions
to
shareholders
.................................................................
2,812,669
Accrued
expenses
and
other
liabilities
...........................................................
444,264
Total
liabilities
.........................................................................
47,702,773
Net
assets,
at
value
.................................................................
$13,332,749,908
Net
assets
consist
of:
Paid-in
capital
.............................................................................
$13,662,520,421
Total
distributable
earnings
(losses)
.............................................................
(329,770,513)
Net
assets,
at
value
.................................................................
$13,332,749,908
Franklin
California
Tax-Free
Income
Fund
Financial
Statements
Statement
of
Assets
and
Liabilities
(continued)
August
31,
2024
(unaudited)
The
accompanying
notes
are
an
integral
part
of
these
financial
statements.
Semiannual
Report
Franklin
California
Tax-
Free
Income
Fund
Class
A:
Net
assets,
at
value
.......................................................................
$2,737,383,482
Shares
outstanding
........................................................................
395,009,970
Net
asset
value
per
share
a
,b
..................................................................
$6.93
Maximum
offering
price
per
share
(net
asset
value
per
share
÷
96
.25
%
)
b
................................
$7.20
Class
A1:
Net
assets,
at
value
.......................................................................
$7,390,987,913
Shares
outstanding
........................................................................
1,068,053,006
Net
asset
value
per
share
a
,b
..................................................................
$6.92
Maximum
offering
price
per
share
(net
asset
value
per
share
÷
96
.25
%
)
b
................................
$7.19
Class
C:
Net
assets,
at
value
.......................................................................
$354,568,291
Shares
outstanding
........................................................................
51,338,248
Net
asset
value
and
maximum
offering
price
per
share
a
,b
............................................
$6.91
Class
R6:
Net
assets,
at
value
.......................................................................
$351,141,436
Shares
outstanding
........................................................................
50,809,905
Net
asset
value
and
maximum
offering
price
per
share
b
.............................................
$6.91
Advisor
Class:
Net
assets,
at
value
.......................................................................
$2,498,668,786
Shares
outstanding
........................................................................
361,694,868
Net
asset
value
and
maximum
offering
price
per
share
b
.............................................
$6.91
a
Redemption
price
is
equal
to
net
asset
value
less
contingent
deferred
sales
charges,
if
applicable.
b
Net
asset
value
per
share
may
not
recalculate
due
to
rounding.
Franklin
California
Tax-Free
Income
Fund
Financial
Statements
Statement
of
Operations
for
the
six
months
ended
August
31,
2024
(unaudited)
Semiannual
Report
The
accompanying
notes
are
an
integral
part
of
these
financial
statements.
Franklin
California
Tax-
Free
Income
Fund
Investment
income:
Interest:
Unaffiliated
issuers
........................................................................
$282,446,392
Expenses:
Management
fees
(Note
3
a
)
...................................................................
29,279,489
Distribution
fees:
(Note
3c
)
Class
A
................................................................................
3,289,334
Class
A1
...............................................................................
3,682,588
Class
C
................................................................................
1,213,060
Transfer
agent
fees:
(Note
3e
)
Class
A
................................................................................
661,609
Class
A1
...............................................................................
1,888,500
Class
C
................................................................................
93,743
Class
R6
...............................................................................
29,314
Advisor
Class
............................................................................
619,725
Custodian
fees
(Note
4
)
......................................................................
40,162
Reports
to
shareholders
fees
..................................................................
92,702
Registration
and
filing
fees
....................................................................
93,363
Professional
fees
...........................................................................
304,875
Trustees'
fees
and
expenses
..................................................................
79,376
Other
....................................................................................
235,602
Total
expenses
.........................................................................
41,603,442
Expense
reductions
(Note
4
)
...............................................................
(66,991)
Net
expenses
.........................................................................
41,536,451
Net
investment
income
................................................................
240,909,941
Realized
and
unrealized
gains
(losses):
Net
realized
gain
(loss)
from:
Investments:
Unaffiliated
issuers
......................................................................
(1,246,983)
Net
change
in
unrealized
appreciation
(depreciation)
on:
Investments:
Unaffiliated
issuers
......................................................................
67,091,164
Net
realized
and
unrealized
gain
(loss)
............................................................
65,844,181
Net
increase
(decrease)
in
net
assets
resulting
from
operations
..........................................
$306,754,122
Franklin
California
Tax-Free
Income
Fund
Financial
Statements
Statements
of
Changes
in
Net
Assets
The
accompanying
notes
are
an
integral
part
of
these
financial
statements.
Semiannual
Report
Franklin
California
Tax-Free
Income
Fund
Six
Months
Ended
August
31,
2024
(unaudited)
Year
Ended
February
29,
2024
Increase
(decrease)
in
net
assets:
Operations:
Net
investment
income
.................................................
$240,909,941
$494,113,334
Net
realized
gain
(loss)
.................................................
(1,246,983)
(39,061,986)
Net
change
in
unrealized
appreciation
(depreciation)
...........................
67,091,164
326,711,254
Net
increase
(decrease)
in
net
assets
resulting
from
operations
................
306,754,122
781,762,602
Distributions
to
shareholders:
Class
A
.............................................................
(45,257,732)
(83,548,096)
Class
A1
............................................................
(135,107,585)
(285,346,342)
Class
C
.............................................................
(5,691,374)
(13,822,482)
Class
R6
............................................................
(6,223,730)
(11,671,555)
Advisor
Class
........................................................
(45,623,093)
(89,100,897)
Total
distributions
to
shareholders
..........................................
(237,903,514)
(483,489,372)
Capital
share
transactions:
(Note
2
)
Class
A
.............................................................
168,156,922
216,871,116
Class
A1
............................................................
(286,916,061)
(672,391,005)
Class
C
.............................................................
(42,517,730)
(114,824,389)
Class
R6
............................................................
33,069,903
39,846,437
Advisor
Class
........................................................
60,256,276
34,061,620
Total
capital
share
transactions
............................................
(67,950,690)
(496,436,221)
Net
increase
(decrease)
in
net
assets
...................................
899,918
(198,162,991)
Net
assets:
Beginning
of
period
.....................................................
13,331,849,990
13,530,012,981
End
of
period
..........................................................
$13,332,749,908
$13,331,849,990
Franklin
California
Tax-Free
Income
Fund
Notes
to
Financial
Statements
(unaudited)
1.
Organization
and
Significant
Accounting
Policies
Franklin
California
Tax-Free
Income
Fund (Fund)
is
registered
under
the
Investment
Company
Act
of
1940
(1940
Act)
as
an
open-end
management
investment
company.
The Fund
follows
the
accounting
and
reporting
guidance
in
Financial
Accounting
Standards
Board
(FASB)
Accounting
Standards
Codification
Topic
946,
Financial
Services
–
Investment
Companies
(ASC
946)
and
applies
the
specialized
accounting
and
reporting
guidance
in
U.S.
Generally
Accepted
Accounting
Principles
(U.S.
GAAP),
including,
but
not
limited
to,
ASC
946.
The
Fund
offers five
classes
of
shares:
Class
A,
Class
A1,
Class
C,
Class
R6
and
Advisor
Class.
Class
C
shares
automatically
convert
to
Class
A
shares
on
a
monthly
basis,
after
they
have
been
held
for
8
years.
Each
class
of
shares
may
differ
by
its
initial
sales
load,
contingent
deferred
sales
charges,
voting
rights
on
matters
affecting
a
single
class,
its
exchange
privilege
and
fees
due
to
differing
arrangements
for
distribution
and
transfer
agent
fees.
The
following
summarizes
the Fund's
significant
accounting
policies.
a.
Financial
Instrument
Valuation
The
Fund's
investments
in
financial
instruments
are
carried
at
fair
value
daily.
Fair
value
is
the
price
that
would
be
received
to
sell
an
asset
or
paid
to
transfer
a
liability
in
an
orderly
transaction
between
market
participants
on
the
measurement
date.
The
Fund
calculates
the
net
asset
value
(NAV)
per
share
each business
day as
of
4
p.m.
Eastern
time
or
the
regularly
scheduled
close
of
the
New
York
Stock
Exchange
(NYSE),
whichever
is
earlier.
Under
compliance
policies
and
procedures
approved
by
the Fund's
Board
of
Trustees
(the
Board),
the
Board
has
designated
the
Fund’s
investment
manager
as
the
valuation
designee
and
has
responsibility
for
oversight
of
valuation.
The
investment
manager
is
assisted
by
the
Fund’s
administrator
in
performing
this
responsibility,
including
leading
the
cross-
functional
Valuation
Committee
(VC).
The
Fund
may
utilize
independent
pricing
services,
quotations
from
securities
and
financial
instrument
dealers,
and
other
market
sources
to
determine
fair
value.
Equity
securities
listed
on
an
exchange
or
on
the
NASDAQ
National
Market
System
are
valued
at
the
last
quoted
sale
price
or
the
official
closing
price of
the
day,
respectively.
Over-the-counter
(OTC)
securities
are
valued
within
the
range
of
the
most
recent
quoted
bid
and
ask
prices.
Securities
that
trade
in
multiple
markets
or
on
multiple
exchanges
are
valued
according
to
the
broadest
and
most
representative
market.
Certain
equity
securities
are
valued
based
upon
fundamental
characteristics
or
relationships
to
similar
securities.
Debt
securities
generally
trade
in
the OTC
market
rather
than
on
a
securities
exchange.
The
Fund's
pricing
services
use
multiple
valuation
techniques
to
determine
fair
value.
In
instances
where
sufficient
market
activity
exists,
the
pricing
services
may
utilize
a
market-based
approach
through
which
quotes
from
market
makers
are
used
to
determine
fair
value.
In
instances
where
sufficient
market
activity
may
not
exist
or
is
limited,
the
pricing
services
also
utilize
proprietary
valuation
models
which
may
consider
market
characteristics
such
as
benchmark
yield
curves,
credit
spreads,
estimated
default
rates,
anticipated
market
interest
rate
volatility,
coupon
rates,
anticipated
timing
of
principal
repayments,
underlying
collateral,
and
other
unique
security
features
in
order
to
estimate
the
relevant
cash
flows,
which
are
then
discounted
to
calculate
the
fair
value.
The
Fund
has
procedures
to
determine
the
fair
value
of
financial
instruments
for
which
market
prices
are
not
reliable
or
readily
available.
Under
these
procedures,
the Fund
primarily
employs
a
market-based
approach
which
may
use
related
or
comparable
assets
or
liabilities,
recent
transactions,
market
multiples,
and
other
relevant
information
for
the
investment
to
determine
the
fair
value
of
the
investment.
An
income-based
valuation
approach
may
also
be
used
in
which
the
anticipated
future
cash
flows
of
the
investment
are
discounted
to
calculate
fair
value.
Discounts
may
also
be
applied
due
to
the
nature
or
duration
of
any
restrictions
on
the
disposition
of
the
investments.
Due
to
the
inherent
uncertainty
of
valuations
of
such
investments,
the
fair
values
may
differ
significantly
from
the
values
that
would
have
been
used
had
an
active
market
existed.
b.
Securities
Purchased
on
a
When-Issued,
Forward
Commitment or
Delayed
Delivery
Basis
The
Fund
may purchase
securities
on
a when-issued,
forward
commitment or
delayed
delivery basis,
with
payment
and
delivery
scheduled
for
a
future
date.
These
transactions
are
subject
to
market
fluctuations
and
are
subject
to
the
risk
that
the
value
at
delivery
may
be
more
or
less
than
the
trade
date
purchase
price.
Although
the
Fund
will
generally
purchase
these
securities
with
the
intention
of
holding
the
securities, it
may
sell
the
securities
before
the
settlement
date.
These
types
of
securities
may
be
considered
unfunded
Franklin
California
Tax-Free
Income
Fund
Notes
to
Financial
Statements
(unaudited)
and
the
Fund
may
be
obligated
to
perform
on
such
agreements
at
a
future
date.
Unfunded
commitments
are
marked
to
market
daily
and
any
unrealized
appreciation
or
depreciation
is
included
in
the
Statement
of
Assets
and
Liabilities
and
the
Statement
of
Operations.
At
August
31,
2024,
unfunded
commitments
were
as
follows:
c.
Senior
Floating
Rate
Interests
The
Fund
invests
in
senior
secured
corporate
loans
that
pay
interest
at
rates
which
are
periodically
reset
by
reference
to
a
base
lending
rate
plus
a
spread.
These
base
lending
rates
are
generally
the
prime
rate
offered
by
a
designated
U.S.
bank
or
the
Secured
Overnight
Financing
Rate
(SOFR).
Senior
secured
corporate
loans
often
require
prepayment
of
principal
from
excess
cash
flows
or
at
the
discretion
of
the
borrower.
As
a
result,
actual
maturity
may
be
substantially
less
than
the
stated
maturity.
Senior
secured
corporate
loans
in
which
the Fund
invests
are
generally
readily
marketable,
but
may
be
subject
to
certain
restrictions
on
resale.
d.
Income
Taxes
It
is the Fund's
policy
to
qualify
as
a
regulated
investment
company
under
the
Internal
Revenue
Code. The Fund
intends
to
distribute
to
shareholders
substantially
all
of
its income
and
net
realized
gains
to
relieve
it
from
federal
income
and excise
taxes.
As
a
result,
no
provision
for
U.S.
federal
income
taxes
is
required.
The Fund
may
recognize
an
income
tax
liability
related
to
its
uncertain
tax
positions
under
U.S.
GAAP
when
the
uncertain
tax
position
has
a
less
than
50%
probability
that
it
will
be
sustained
upon
examination
by
the
tax
authorities
based
on
its
technical
merits.
As
of
August
31,
2024, the Fund
has
determined
that
no
tax
liability
is
required
in
its
financial
statements
related
to
uncertain
tax
positions
for
any
open
tax
years
(or
expected
to
be
taken
in
future
tax
years).
Open
tax
years
are
those
that
remain
subject
to
examination
and
are
based
on
the
statute
of
limitations
in
each
jurisdiction
in
which
the Fund
invests.
e.
Security
Transactions,
Investment
Income,
Expenses
and
Distributions
Security
transactions
are
accounted
for
on
trade
date.
Realized
gains
and
losses
on
security
transactions
are
determined
on
a
specific
identification
basis.
Interest
income
(including
interest
income
from
payment-in-kind
securities,
if
any)
and
estimated
expenses
are
accrued
daily.
Amortization
of
premium
and
accretion
of
discount
on
debt
securities
are
included
in
interest
income.
Paydown
gains
and
losses
are
recorded
as
an
adjustment
to
interest
income. The
Fund
may
receive
other
income
from
investments
in
senior
secured
corporate
loans
or
unfunded
commitments,
including
amendment
fees,
consent
fees
or
commitment
fees.
These
fees
are
recorded
as
income
when
received
by
the
Fund.
Dividends from
net
investment
income
are
normally
declared
daily;
these
dividends
may
be
reinvested
or
paid
monthly
to
shareholders.
Distributions
from realized
capital
gains
and
other
distributions,
if
any,
are
recorded
on
the
ex-dividend
date.
Distributable
earnings
are
determined
according
to
income
tax
regulations
(tax
basis)
and
may
differ
from
earnings
recorded
in
accordance
with
U.S.
GAAP.
These
differences
may
be
permanent
or
temporary.
Permanent
differences
are
reclassified
among
capital
accounts
to
reflect
their
tax
character.
These
reclassifications
have
no
impact
on
net
assets
or
the
results
of
operations.
Temporary
differences
are
not
reclassified,
as
they
may
reverse
in
subsequent
periods.
Realized
and
unrealized
gains
and
losses
and
net
investment
income,
excluding
class
specific
expenses,
are
allocated
daily
to
each
class
of
shares
based
upon
the
relative
proportion
of
net
assets
of
each
class.
Differences
in
per
share
distributions
by
class
are
generally
due
to
differences
in
class
specific
expenses.
f.
Insurance
The
scheduled
payments
of
interest
and
principal
for
each
insured
municipal
security
in
the
Fund are
insured
by
either
a
new
issue
insurance
policy
or
a
secondary
insurance
policy.
Some
municipal
securities
in
the
Fund
are
secured
by
collateral
guaranteed
by
an
agency
of
the
U.S.
government.
Depending
on
the
type
of
coverage,
premiums
for
insurance
are
either
added
to
the
cost
basis
of
the
security
or
paid
by
a
third
party.
Borrower
Unfunded
Commitment
Franklin
California
Tax-Free
Income
Fund
Puerto
Rico
Electric
Power
Authority,
Restructured
Power
Revenue
,
B-1,
6%,
7/01/41
$
9,260,673
B-2,
7.125%,
7/01/59
44,974,968
$54,235,641
1.
Organization
and
Significant
Accounting
Policies
(continued)
b.
Securities
Purchased
on
a
When-Issued,
Forward
Commitment or
Delayed
Delivery
Basis
(continued)
Franklin
California
Tax-Free
Income
Fund
Notes
to
Financial
Statements
(unaudited)
Insurance
companies
typically
insure
municipal
bonds
that
tend
to
be
of
very
high
quality,
with
the
majority
of
underlying
municipal
bonds
rated
A
or
better.
However,
an
event
involving
an
insurer
could
have
an
adverse
effect
on
the
value
of
the
securities
insured
by
that
insurance
company.
There
can
be
no
assurance
the
insurer
will
be
able
to
fulfill
its
obligations
under
the
terms
of
the
policy.
g.
Accounting
Estimates
The
preparation
of
financial
statements
in
accordance
with
U.S.
GAAP
requires
management
to
make
estimates
and
assumptions
that
affect
the
reported
amounts
of
assets
and
liabilities
at
the
date
of
the
financial
statements
and
the
amounts
of
income
and
expenses
during
the
reporting
period.
Actual
results
could
differ
from
those
estimates.
h.
Guarantees
and
Indemnifications
Under
the Fund's
organizational
documents,
its
officers
and trustees
are
indemnified
by
the
Fund against
certain
liabilities
arising
out
of
the
performance
of
their
duties
to
the
Fund.
Additionally,
in
the
normal
course
of
business,
the
Fund
enters
into
contracts
with
service
providers
that
contain
general
indemnification
clauses.
The Fund's
maximum
exposure
under
these
arrangements
is
unknown
as
this
would
involve
future
claims
that
may
be
made
against
the Fund
that
have
not
yet
occurred.
Currently,
the Fund
expects
the
risk
of
loss
to
be
remote.
2.
Shares
of
Beneficial
Interest
At
August
31,
2024,
there
were
an
unlimited
number
of
shares
authorized
(without
par
value).
Transactions
in
the
Fund's
shares
were
as
follows:
Six
Months
Ended
August
31,
2024
Year
Ended
February
28,
2024
Shares
Amount
Shares
Amount
Class
A
Shares:
Shares
sold
a
...................................
52,795,414
$362,814,729
111,103,872
$748,252,476
Shares
issued
in
reinvestment
of
distributions
..........
6,073,989
41,593,296
11,221,408
75,610,343
Shares
redeemed
...............................
(34,442,521)
(236,251,103)
(90,905,475)
(606,991,703)
Net
increase
(decrease)
..........................
24,426,882
$168,156,922
31,419,805
$216,871,116
Class
A1
Shares:
Shares
sold
...................................
10,678,526
$73,256,312
23,779,613
$160,563,352
Shares
issued
in
reinvestment
of
distributions
..........
16,707,915
114,229,304
35,372,737
238,039,282
Shares
redeemed
...............................
(69,231,576)
(474,401,677)
(159,208,778)
(1,070,993,639)
Net
increase
(decrease)
..........................
(41,845,135)
$(286,916,061)
(100,056,428)
$(672,391,005)
Class
C
Shares:
Shares
sold
...................................
3,276,121
$22,429,983
7,648,428
$51,557,340
Shares
issued
in
reinvestment
of
distributions
..........
810,305
5,531,024
1,977,851
13,279,250
Shares
redeemed
a
..............................
(10,300,062)
(70,478,737)
(26,943,298)
(179,660,979)
Net
increase
(decrease)
..........................
(6,213,636)
$(42,517,730)
(17,317,019)
$(114,824,389)
Class
R6
Shares:
Shares
sold
...................................
9,009,074
$61,623,486
35,192,599
$235,878,559
Shares
issued
in
reinvestment
of
distributions
..........
895,329
6,113,307
1,592,058
10,703,079
Shares
redeemed
...............................
(5,071,356)
(34,666,890)
(31,217,481)
(206,735,201)
Net
increase
(decrease)
..........................
4,833,047
$33,069,903
5,567,176
$39,846,437
1.
Organization
and
Significant
Accounting
Policies
(continued)
f.
Insurance
(continued)
Franklin
California
Tax-Free
Income
Fund
Notes
to
Financial
Statements
(unaudited)
3.
Transactions
with
Affiliates
Franklin
Resources,
Inc.
is
the
holding
company
for
various
subsidiaries
that
together
are
referred
to
as
Franklin
Templeton.
Certain
officers
and trustees
of
the Fund are
also
officers
and/or
directors
of
the
following
subsidiaries:
a.
Management
Fees
The
Fund
pays
an
investment
management
fee,
calculated
daily
and
paid
monthly,
to
Advisers
based
on
the
month-end
net
assets
of
the
Fund
as
follows:
For
the
period
ended
August
31,
2024,
the
annualized
gross
effective
investment
management
fee
rate
was 0.440%
of
the
Fund’s
average daily
net
assets.
b.
Administrative
Fees
Under
an
agreement
with
Advisers,
FT
Services
provides
administrative
services
to
the
Fund.
The
fee
is
paid
by
Advisers
based
on
the
Fund's
average
daily
net
assets,
and
is
not
an
additional
expense
of
the
Fund.
Six
Months
Ended
August
31,
2024
Year
Ended
February
28,
2024
Shares
Amount
Shares
Amount
Advisor
Class
Shares:
Shares
sold
...................................
43,411,618
$297,205,617
162,323,709
$1,079,685,423
Shares
issued
in
reinvestment
of
distributions
..........
6,116,600
41,759,557
12,033,563
80,813,259
Shares
redeemed
...............................
(40,776,093)
(278,708,898)
(170,882,475)
(1,126,437,062)
Net
increase
(decrease)
..........................
8,752,125
$60,256,276
3,474,797
$34,061,620
a
May
include
a
portion
of
Class
C
shares
that
were
automatically
converted
to
Class
A.
Subsidiary
Affiliation
Franklin
Advisers,
Inc.
(Advisers)
Investment
manager
Franklin
Templeton
Services,
LLC
(FT
Services)
Administrative
manager
Franklin
Distributors,
LLC
(Distributors)
Principal
underwriter
Franklin
Templeton
Investor
Services,
LLC
(Investor
Services)
Transfer
agent
Annualized
Fee
Rate
Net
Assets
0.625%
Up
to
and
including
$100
million
0.500%
Over
$100
million,
up
to
and
including
$250
million
0.450%
Over
$250
million,
up
to
and
including
$7.5
billion
0.440%
Over
$7.5
billion,
up
to
and
including
$10
billion
0.430%
Over
$10
billion,
up
to
and
including
$12.5
billion
0.420%
Over
$12.5
billion,
up
to
and
including
$15
billion
0.400%
Over
$15
billion,
up
to
and
including
$17.5
billion
0.380%
Over
$17.5
billion,
up
to
and
including
$20
billion
0.360%
In
excess
of
$20
billion
2.
Shares
of
Beneficial
Interest
(continued)
Franklin
California
Tax-Free
Income
Fund
Notes
to
Financial
Statements
(unaudited)
c.
Distribution
Fees
The
Board
has
adopted
distribution
plans
for
each
share
class,
with
the
exception
of
Class
R6
and
Advisor
Class
shares,
pursuant
to
Rule
12b-1
under
the
1940
Act.
Under
the
Fund's
Class
A
and
A1
reimbursement
distribution
plans,
the
Fund
reimburses
Distributors
for
costs
incurred
in
connection
with
the
servicing,
sale
and
distribution
of the
Fund's
shares
up
to
the
maximum
annual
plan
rate
for
each
class.
Under
the
Class
A
and
A1
reimbursement
distribution
plans,
costs
exceeding
the
maximum
for
the
current
plan
year
cannot
be
reimbursed
in
subsequent
periods.
In
addition,
under
the
Fund's
Class
C
compensation
distribution
plan,
the
Fund
pays
Distributors
for
costs
incurred
in
connection
with
the
servicing,
sale
and
distribution
of
the
Fund's
shares
up
to
the
maximum
annual
plan
rate.
The
plan
year,
for
purposes
of
monitoring
compliance
with
the
maximum
annual
plan
rates,
is
February
1
through
January
31.
The
maximum
annual
plan
rates,
based
on
the
average
daily
net
assets,
for
each
class,
are
as
follows:
d.
Sales
Charges/Underwriting
Agreements
Front-end
sales
charges
and
contingent
deferred
sales
charges
(CDSC)
do
not
represent
expenses
of
the
Fund.
These
charges
are
deducted
from
the
proceeds
of
sales
of
fund
shares
prior
to
investment
or
from
redemption
proceeds
prior
to
remittance,
as
applicable.
Distributors
has
advised
the
Fund
of
the
following
commission
transactions
related
to
the
sales
and
redemptions
of
the
Fund's
shares
for
the
period:
e.
Transfer
Agent
Fees
Each
class
of
shares pays
transfer
agent
fees,
calculated
monthly
and
paid
monthly, to
Investor
Services
for
its
performance
of
shareholder
servicing
obligations. The
fees
are based
on
a
fixed
margin
earned
by
Investor
Services
and
are allocated
to
the Fund
based
upon
relative
assets
and
relative
transactions. In
addition,
each
class reimburses
Investor
Services
for
out
of
pocket
expenses
incurred
and,
except
for
Class
R6, reimburses
shareholder
servicing
fees
paid
to
third
parties.
These
fees
paid
to
third
parties
are
accrued
and
allocated
daily
based
upon
their
relative
proportion
of
such
classes'
aggregate
net
assets.
Class
R6
pays
Investor
Services
transfer
agent
fees
allocated
specifically
to
that
class
based
upon
its
relative
assets
and
relative
transactions.
For
the
period
ended
August
31,
2024,
the Fund
paid
transfer
agent
fees
as
noted
in
the
Statement of
Operations,
of
which
$1,086,118
was
retained
by
Investor
Services.
f.
Waiver
and
Expense
Reimbursements
Advisers has contractually
agreed
in
advance
to
waive
or
limit
its fees
and
to
assume
as
its
own
expense
certain
expenses
otherwise
payable
by the
Fund
so
that
the
operating expenses
(excluding
distribution
fees,
acquired
fund
fees
and
expenses
and
certain
non-routine
expenses
or
costs,
including
those
relating
to
litigation,
indemnification,
reorganizations,
and
liquidations)
for
each
class
of
the
Fund
do
not
exceed
0.65%
based
on
the
average
net
assets
of
each
class
until
June
30,
2025.
Total
expenses
waived
or
paid
are
not
subject
to
recapture
subsequent
to
the
Fund's
fiscal
year
end.
Transfer
agent
fees
on
Class
R6
shares
of
the
Fund have
been
capped
so
that
transfer
agent
fees
for
that
class
do
not
exceed
0.03%
based
on
the
average
net
assets
of
the
class
until
June
30,
2025.
Class
A
....................................................................................
0.25%
Class
A1
...................................................................................
0.10%
Class
C
....................................................................................
0.65%
Sales
charges
retained
net
of
commissions
paid
to
unaffiliated
brokers/dealers
..............................
$29,038
CDSC
retained
..............................................................................
$139,691
3.
Transactions
with
Affiliates
(continued)
Franklin
California
Tax-Free
Income
Fund
Notes
to
Financial
Statements
(unaudited)
g.
Interfund
Transactions
The
Fund
engaged
in
purchases
and
sales
of
investments
with
funds
or
other
accounts
that
have
common
investment
managers
(or
affiliated
investment
managers),
directors,
trustees
or
officers.
During
the
period
ended
August
31,
2024,
these
purchase
and
sale
transactions
aggregated
$93,875,000
and
$47,450,000,
respectively.
4.
Expense
Offset
Arrangement
The Fund has
entered
into
an
arrangement
with
its
custodian
whereby
credits
realized
as
a
result
of
uninvested
cash
balances
are
used
to
reduce
a
portion
of
the
Fund's
custodian
expenses.
During
the
period
ended
August
31,
2024,
the
custodian
fees
were
reduced
as
noted
in
the
Statement
of
Operations.
5.
Income
Taxes
For
tax
purposes,
capital
losses
may
be
carried
over
to
offset
future
capital
gains.
At
February
29,
2024,
the
capital
loss
carryforwards
were
as
follows:
At
August
31,
2024,
the
cost
of
investments
and
net
unrealized
appreciation
(depreciation) for
income
tax
purposes
were
as
follows:
Differences
between
income
and/or
capital
gains
as
determined
on
a
book
basis
and
a
tax
basis
are
primarily
due
to
differing
treatments
of
wash
sales
and
bond
discounts
and
premiums.
6.
Investment
Transactions
Purchases
and
sales
of
investments (excluding
short
term
securities) for
the
period
ended
August
31,
2024,
aggregated
$309,443,518 and
$508,012,456,
respectively.
7.
Defaulted
Securities
The
Fund held
defaulted
securities
and/or
other
securities
for
which
the
income
has
been
deemed
uncollectible.
At
August
31,
2024,
the
aggregate
value
of
these
securities was
$34,657,675, representing 0.3%
of
the
Fund's
net
assets.
The
Fund
discontinues
accruing
income
on
securities
for
which
income
has
been
deemed
uncollectible
and
provides
an
estimate
for
losses
on
interest
receivable.
The
securities
have
been
identified
in
the
accompanying Schedule
of
Investments.
Capital
loss
carryforwards
not
subject
to
expiration:
Short
term
................................................................................
$610,267,387
Long
term
................................................................................
419,192,863
Total
capital
loss
carryforwards
...............................................................
$1,029,460,250
Cost
of
investments
..........................................................................
$12,526,349,159
Unrealized
appreciation
........................................................................
$1,008,903,933
Unrealized
depreciation
........................................................................
(332,329,294)
Net
unrealized
appreciation
(depreciation)
..........................................................
$676,574,639
3.
Transactions
with
Affiliates
(continued)
Franklin
California
Tax-Free
Income
Fund
Notes
to
Financial
Statements
(unaudited)
8.
Concentration
of
Risk
The
Fund
invests
a
large
percentage
of
its total
assets
in
obligations
of
issuers
within California
and
U.S.
territories.
Such
concentration
may
subject
the
Fund
to
risks
associated
with
industrial
or
regional
matters,
and
economic,
political
or
legal
developments
occurring
within California
and
U.S.
territories. Investments
in
these
securities
are
sensitive
to
interest
rate
changes
and
credit
risk
of
the
issuer
and
may
subject
the
Fund
to
increased
market
volatility.
The
market
for
these
investments
may
be
limited,
which
may
make
them
difficult
to
buy
or
sell.
9.
Credit
Facility
The
Fund,
together
with
other
U.S.
registered
and
foreign
investment
funds
(collectively,
Borrowers),
managed
by
Franklin
Templeton,
are
borrowers
in
a
joint
syndicated
senior
unsecured
credit
facility
totaling
$2.675
billion
(Global
Credit
Facility)
which
matures
on
January
31,
2025.
This
Global
Credit
Facility
provides
a
source
of
funds
to
the
Borrowers
for
temporary
and
emergency
purposes,
including
the
ability
to
meet
future
unanticipated
or
unusually
large
redemption
requests.
Under
the
terms
of
the
Global
Credit
Facility,
the
Fund
shall,
in
addition
to
interest
charged
on
any
borrowings
made
by
the
Fund
and
other
costs
incurred
by
the
Fund,
pay
its
share
of
fees
and
expenses
incurred
in
connection
with
the
implementation
and
maintenance
of
the
Global
Credit
Facility,
based
upon
its
relative
share
of
the
aggregate
net
assets
of
all
of
the
Borrowers,
including
an
annual
commitment
fee
of
0.15%
based
upon
the
unused
portion
of
the
Global
Credit
Facility.
These
fees
are
reflected
in
other
expenses
in
the
Statement
of
Operations.
During
the
period
ended
August
31,
2024,
the Fund
did
not
use
the
Global
Credit
Facility.
10.
Fair
Value
Measurements
The
Fund
follows
a
fair
value
hierarchy
that
distinguishes
between
market
data
obtained
from
independent
sources
(observable
inputs)
and
the Fund's
own
market
assumptions
(unobservable
inputs).
These
inputs
are
used
in
determining
the
value
of
the
Fund's financial
instruments
and
are
summarized
in
the
following
fair
value
hierarchy:
Level
1
–
quoted
prices
in
active
markets
for
identical
financial
instruments
Level
2
–
other
significant
observable
inputs
(including
quoted
prices
for
similar
financial
instruments,
interest
rates,
prepayment
speed,
credit
risk,
etc.)
Level
3
–
significant
unobservable
inputs
(including
the
Fund's
own
assumptions
in
determining
the
fair
value
of
financial
instruments)
The
input
levels
are
not
necessarily
an
indication
of
the
risk
or
liquidity
associated
with
financial
instruments
at
that
level.
A
summary
of
inputs
used
as
of August
31,
2024,
in
valuing
the
Fund's
assets
carried
at
fair
value,
is
as
follows:
Level
1
Level
2
Level
3
Total
Franklin
California
Tax-Free
Income
Fund
Assets:
Investments
in
Securities:
Common
Stocks
.........................
$
—
$
—
$
—
a
$
—
Senior
Floating
Rate
Interests
...............
—
—
13,848,604
13,848,604
Municipal
Bonds
.........................
—
12,882,156,488
—
12,882,156,488
Escrows
and
Litigation
Trusts
...............
—
—
3,333,706
3,333,706
Short
Term
Investments
...................
—
303,585,000
—
303,585,000
Total
Investments
in
Securities
...........
$—
$13,185,741,488
$17,182,310
$13,202,923,798
Other
Financial
Instruments:
Unfunded
Commitments
..................
$—
$—
$2,211,045
$2,211,045
Total
Other
Financial
Instruments
.........
$—
$—
$2,211,045
$2,211,045
Franklin
California
Tax-Free
Income
Fund
Notes
to
Financial
Statements
(unaudited)
A
reconciliation
in
which
Level
3
inputs
are
used
in
determining
fair
value
is
presented
when
there
are
significant
Level
3
assets
and/or
liabilities
at
the
beginning
and/or
end
of
the period.
11.
Subsequent
Events
The
Fund
has
evaluated
subsequent
events
through
the
issuance
of
the financial
statements
and
determined
that
no
events
have
occurred
that
require
disclosure.
Abbreviations
a
Includes
financial
instruments
determined
to
have
no
value.
Selected
Portfolio
1915
Act
Improvement
Bond
Act
of
1915
ABAG
Association
of
Bay
Area
Governments
AGMC
Assured
Guaranty
Municipal
Corp.
AMBAC
American
Municipal
Bond
Assurance
Corp.
BAM
Build
America
Mutual
Assurance
Co.
CME
Chicago
Mercantile
Exchange
COP
Certificate
of
Participation
ETM
Escrowed
to
Maturity
FGIC
Financial
Guaranty
Insurance
Co.
FHLMC
Federal
Home
Loan
Mortgage
Corp.
GO
General
Obligation
LOC
Letter
of
Credit
NATL
National
Reinsurance
Corp.
REIT
Real
Estate
Investment
Trust
SOFR
Secured
Overnight
Financing
Rate
SPA
Standby
Purchase
Agreement
10.
Fair
Value
Measurements
(continued)
Franklin
California
Tax-Free
Income
Fund
FRANKLIN
CALIFORNIA
TAX-FREE
INCOME
FUND
(Fund)
At
an
in-person
meeting
held
on
April
16,
2024
(Meeting),
the
Board
of
Trustees
(Board)
of
the
Fund,
including
a
majority
of
the
trustees
who
are
not
“interested
persons”
as
defined
in
the
Investment
Company
Act
of
1940
(Independent
Trustees),
reviewed
and
approved
the
continuance
of
the
investment
management
agreement
between
Franklin
Advisers,
Inc.
(Manager)
and
the
Fund
(Management
Agreement)
for
an
additional
one-year
period.
The
Independent
Trustees
received
advice
from
and
met
separately
with
Independent
Trustee
counsel
in
considering
whether
to
approve
the
continuation
of
the
Management
Agreement.
In
considering
the
continuation
of
the
Management
Agreement,
the
Board
reviewed
and
considered
information
provided
by
the
Manager
at
the
Meeting
and
throughout
the
year
at
meetings
of
the
Board
and
its
committees.
The
Board
also
reviewed
and
considered
information
provided
in
response
to
a
detailed
set
of
requests
for
information
submitted
to
the
Manager
by
Independent
Trustee
counsel
on
behalf
of
the
Independent
Trustees
in
connection
with
the
annual
contract
renewal
process.
In
addition,
prior
to
the
Meeting,
the
Independent
Trustees
held
a
virtual
contract
renewal
meeting
at
which
the
Independent
Trustees
first
conferred
amongst
themselves
and
Independent
Trustee
counsel
about
contract
renewal
matters,
and
then
met
with
management
to
request
additional
information
that
the
Independent
Trustees
reviewed
and
considered
prior
to
and
at
the
Meeting.
The
Board
reviewed
and
considered
all
of
the
factors
it
deemed
relevant
in
approving
the
continuance
of
the
Management
Agreement,
including,
but
not
limited
to:
(i)
the
nature,
extent
and
quality
of
the
services
provided
by
the
Manager;
(ii)
the
investment
performance
of
the
Fund;
(iii)
the
costs
of
the
services
provided
and
profits
realized
by
the
Manager
and
its
affiliates
from
the
relationship
with
the
Fund;
(iv)
the
extent
to
which
economies
of
scale
are
realized
as
the
Fund
grows;
and
(v)
whether
fee
levels
reflect
these
economies
of
scale
for
the
benefit
of
Fund
investors.
In
approving
the
continuance
of
the
Management
Agreement,
the
Board,
including
a
majority
of
the
Independent
Trustees,
determined,
through
the
exercise
of
its
business
judgment,
that
the
terms
of
the
Management
Agreement
are
fair
and
reasonable
and
that
the
continuance
of
the
Management
Agreement
is
in
the
best
interests
of
the
Fund
and
its
shareholders.
While
attention
was
given
to
all
information
furnished,
the
following
discusses
some
primary
factors
relevant
to
the
Board’s
determination.
Changes
In
and
Disagreements
with
Accountants
For
the
period
covered
by
this
report
Not
applicable.
Results
of
Meeting(s)
of
Shareholders
For
the
period
covered
by
this
report
Not
applicable.
Remuneration
Paid
to
Directors,
Officers
and
Others
For
the
period
covered
by
this
report
Refer
to
the
financial
statements
included
herein.
Board
Approval
of
Management
and
Subadvisory
Agreements
For
the
period
covered
by
this
report
Franklin
California
Tax-Free
Income
Fund
Nature,
Extent
and
Quality
of
Services
The
Board
reviewed
and
considered
information
regarding
the
nature,
extent
and
quality
of
investment
management
services
provided
by
the
Manager
and
its
affiliates
to
the
Fund
and
its
shareholders.
This
information
included,
among
other
things,
the
qualifications,
background
and
experience
of
the
senior
management
and
investment
personnel
of
the
Manager,
as
well
as
information
on
succession
planning
where
appropriate;
the
structure
of
investment
personnel
compensation;
oversight
of
third-
party
service
providers;
investment
performance
reports
and
related
financial
information
for
the
Fund;
reports
on
expenses
and
shareholder
services;
legal
and
compliance
matters;
risk
controls;
pricing
and
other
services
provided
by
the
Manager
and
its
affiliates;
and
management
fees
charged
by
the
Manager
and
its
affiliates
to
US
funds
and
other
accounts,
including
management’s
explanation
of
differences
among
accounts
where
relevant.
The
Board
also
reviewed
and
considered
an
annual
report
on
payments
made
by
Franklin
Templeton
(FT)
or
the
Fund
to
financial
intermediaries,
as
well
as
a
memorandum
relating
to
third-party
servicing
arrangements.
The
Board
acknowledged
the
ongoing
integration
of
the
Putnam
family
of
funds
into
the
FT
family
of
funds
and
management’s
continued
development
of
strategies
to
address
areas
of
heightened
concern
in
the
mutual
fund
industry,
including
various
regulatory
initiatives
and
continuing
geopolitical
concerns.
The
Board
also
reviewed
and
considered
the
benefits
provided
to
Fund
shareholders
of
investing
in
a
fund
that
is
part
of
the
FT
family
of
funds.
The
Board
noted
the
financial
position
of
Franklin
Resources,
Inc.
(FRI),
the
Manager’s
parent,
and
its
commitment
to
the
mutual
fund
business
as
evidenced
by
its
continued
reassessment
of
the
fund
offerings
in
response
to
FT
acquisitions
and
the
market
environment,
as
well
as
project
initiatives
and
capital
investments
relating
to
the
services
provided
to
the
Fund
by
the
FT
organization.
The
Board
specifically
noted
FT’s
commitment
to
technological
innovation
and
advancement,
including
its
initiative
to
create
a
new
enterprise-wide
artificial
intelligence
platform.
Following
consideration
of
such
information,
the
Board
was
satisfied
with
the
nature,
extent
and
quality
of
services
provided
by
the
Manager
and
its
affiliates
to
the
Fund
and
its
shareholders.
Fund
Performance
The
Board
reviewed
and
considered
the
performance
results
of
the
Fund
over
various
time
periods
ended
December
31,
2023.
The
Board
considered
the
performance
returns
for
the
Fund
in
comparison
to
the
performance
returns
of
mutual
funds
deemed
comparable
to
the
Fund
included
in
a
universe
(Performance
Universe)
selected
by
Broadridge
Financial
Solutions,
Inc.
(Broadridge),
an
independent
provider
of
investment
company
data.
The
Board
received
a
description
of
the
methodology
used
by
Broadridge
to
select
the
mutual
funds
included
in
a
Performance
Universe.
The
Board
also
reviewed
and
considered
Fund
performance
reports
provided
and
discussions
that
occurred
with
portfolio
managers
at
Board
meetings
throughout
the
year.
A
summary
of
the
Fund’s
performance
results
is
below.
The
Performance
Universe
for
the
Fund
included
the
Fund
and
all
retail
and
institutional
California
municipal
debt
funds.
The
Board
noted
that
the
Fund’s
annualized
income
return
and
annualized
total
return
for
the
one-,
three-,
five-
and
10-year
periods
were
above
the
medians
of
its
Performance
Universe.
The
Board
further
noted
management’s
view
regarding
the
income-related
attributes
of
the
Fund
(e.g.,
a
fund’s
investment
objective)
as
set
forth
in
the
Fund’s
registration
statement
and
that
the
evaluation
of
the
Fund’s
performance
relative
to
its
peers
on
an
income
return
basis
was
appropriate
given
these
attributes.
The
Board
concluded
that
the
Fund’s
performance
was
satisfactory.
Comparative
Fees
and
Expenses
The
Board
reviewed
and
considered
information
regarding
the
Fund’s
actual
total
expense
ratio
and
its
various
components,
including,
as
applicable,
management
fees;
transfer
agent
expenses;
underlying
fund
expenses;
Rule
12b-1
and
non-Rule
12b-1
service
fees;
and
other
non-management
fees.
The
Board
also
noted
the
quarterly
and
annual
reports
it
receives
on
all
marketing
support
payments
made
by
FT
to
financial
intermediaries.
The
Board
considered
the
actual
total
expense
ratio
and,
separately,
the
contractual
management
fee
rate,
without
the
effect
of
fee
waivers,
if
any
(Management
Rate)
of
the
Fund
in
comparison
to
the
median
expense
ratio
and
median
Management
Rate,
respectively,
of
other
mutual
funds
deemed
comparable
to
and
with
a
similar
expense
structure
to
the
Fund
selected
by
Broadridge
(Expense
Group).
Broadridge
fee
and
expense
data
is
based
upon
information
taken
from
each
fund’s
most
recent
annual
or
semi-annual
report,
which
reflects
historical
asset
levels
that
may
be
quite
different
from
those
currently
existing,
particularly
in
a
period
of
market
volatility.
Franklin
California
Tax-Free
Income
Fund
While
recognizing
such
inherent
limitation
and
the
fact
that
expense
ratios
and
Management
Rates
generally
increase
as
assets
decline
and
decrease
as
assets
grow,
the
Board
believed
the
independent
analysis
conducted
by
Broadridge
to
be
an
appropriate
measure
of
comparative
fees
and
expenses.
The
Broadridge
Management
Rate
includes
administrative
charges,
and
the
actual
total
expense
ratio,
for
comparative
consistency,
was
shown
for
Class
A1
shares
for
the
Fund
and
for
Class
A
or
Class
M
shares
for
each
other
fund
in
the
Expense
Group.
The
Board
received
a
description
of
the
methodology
used
by
Broadridge
to
select
the
mutual
funds
included
in
the
Expense
Group.
The
Expense
Group
for
the
Fund
included
the
Fund
and
10
other
California
municipal
debt
funds.
The
Board
noted
that
the
Management
Rate
for
the
Fund
was
slightly
above
the
median
of
its
Expense
Group,
but
its
actual
total
expense
ratio
was
below
the
median
and
in
the
first
quintile
(least
expensive)
of
its
Expense
Group.
The
Board
also
noted
that
the
Fund’s
actual
total
expense
ratio
reflected
an
expense
cap
on
operating
expenses.
The
Board
concluded
that
the
Management
Rate
charged
to
the
Fund
is
reasonable.
Profitability
The
Board
reviewed
and
considered
information
regarding
the
profits
realized
by
the
Manager
and
its
affiliates
in
connection
with
the
operation
of
the
Fund.
In
this
respect,
the
Board
considered
the
Fund
profitability
analysis
provided
by
the
Manager
that
addresses
the
overall
profitability
of
FT’s
US
fund
business,
as
well
as
its
profits
in
providing
investment
management
and
other
services
to
each
of
the
individual
funds
during
the
12-month
period
ended
September
30,
2023,
being
the
most
recent
fiscal
year-end
for
FRI.
The
Board
noted
that
although
management
continually
makes
refinements
to
its
methodologies
used
in
calculating
profitability
in
response
to
organizational
and
product-related
changes,
the
overall
methodology
has
remained
consistent
with
that
used
in
the
Fund’s
profitability
report
presentations
from
prior
years.
The
Board
also
noted
that
an
independent
registered
public
accounting
firm
has
been
engaged
by
the
Manager
to
periodically
review
and
assess
the
allocation
methodologies
to
be
used
solely
by
the
Fund’s
Board
with
respect
to
the
profitability
analysis.
The
Board
noted
management’s
belief
that
costs
incurred
in
establishing
the
infrastructure
necessary
for
the
type
of
mutual
fund
operations
conducted
by
the
Manager
and
its
affiliates
may
not
be
fully
reflected
in
the
expenses
allocated
to
the
Fund
in
determining
its
profitability,
as
well
as
the
fact
that
the
level
of
profits,
to
a
certain
extent,
reflected
operational
cost
savings
and
efficiencies
initiated
by
management.
As
part
of
this
evaluation,
the
Board
considered
management’s
outsourcing
of
certain
operations,
which
effort
has
required
considerable
up-front
expenditures
by
the
Manager
but,
over
the
long
run
is
expected
to
result
in
greater
efficiencies.
The
Board
also
noted
management’s
expenditures
in
improving
shareholder
services
provided
to
the
Fund,
as
well
as
the
need
to
implement
systems
and
meet
additional
regulatory
and
compliance
requirements
resulting
from
recent
US
Securities
and
Exchange
Commission
and
other
regulatory
requirements.
The
Board
also
considered
the
extent
to
which
the
Manager
and
its
affiliates
might
derive
ancillary
benefits
from
fund
operations,
including
revenues
generated
from
transfer
agent
services,
potential
benefits
resulting
from
personnel
and
systems
enhancements
necessitated
by
fund
growth,
as
well
as
increased
leverage
with
service
providers
and
counterparties.
Based
upon
its
consideration
of
all
these
factors,
the
Board
concluded
that
the
level
of
profits
realized
by
the
Manager
and
its
affiliates
from
providing
services
to
the
Fund
was
not
excessive
in
view
of
the
nature,
extent
and
quality
of
services
provided
to
the
Fund.
Economies
of
Scale
The
Board
reviewed
and
considered
the
extent
to
which
the
Manager
may
realize
economies
of
scale,
if
any,
as
the
Fund
grows
larger
and
whether
the
Fund’s
management
fee
structure
reflects
any
economies
of
scale
for
the
benefit
of
shareholders.
With
respect
to
possible
economies
of
scale,
the
Board
noted
the
existence
of
management
fee
breakpoints,
which
operate
generally
to
share
any
economies
of
scale
with
the
Fund’s
shareholders
by
reducing
the
Fund’s
effective
management
fees
as
the
Fund
grows
in
size.
The
Board
considered
the
Manager’s
view
that
any
analyses
of
potential
economies
of
scale
in
managing
a
particular
fund
are
inherently
limited
in
light
of
the
joint
and
common
costs
and
investments
Franklin
California
Tax-Free
Income
Fund
the
Manager
incurs
across
the
FT
family
of
funds
as
a
whole.
The
Board
noted
that
the
Fund
had
experienced
a
significant
decrease
in
assets
and
would
not
be
expected
to
demonstrate
additional
economies
of
scale
in
the
near
term,
but
concluded
that,
to
the
extent
economies
of
scale
may
be
realized
by
the
Manager
and
its
affiliates,
the
Fund’s
management
fee
structure
provided
a
sharing
of
benefits
with
the
Fund
and
its
shareholders
as
the
Fund
grows.
Conclusion
Based
on
its
review,
consideration
and
evaluation
of
all
factors
it
believed
relevant,
including
the
above-described
factors
and
conclusions,
the
Board
unanimously
approved
the
continuation
of
the
Management
Agreement
for
an
additional
one-year
period.
©
2024
Franklin
Templeton.
All
rights
reserved.
Item 8. Changes in and Disagreements with Accountants for Open-End Management Investment Companies.
The information is disclosed as part of the Financial Statements included in Item 7 of this Form N-CSR.
Item 9. Proxy Disclosures for Open-End Management Investment Companies.
The information is disclosed as part of the Financial Statements included in Item 7 of this Form N-CSR.
Item 10. Remuneration Paid to Directors, Officers, and Others of Open-End Management Investment Companies.
The information is disclosed as part of the Financial Statements included in Item 7 of this Form N-CSR.
Item 11. Statement Regarding Basis for Approval of Investment Advisory Contract.
The information is disclosed as part of the Financial Statements included in Item 7 of this Form N-CSR.
Item 12. Disclosure of Proxy Voting Policies and Procedures for Closed-End Management Investment Companies. N/A
Item 13. Portfolio Managers of Closed-End Management Investment Companies. N/A
Item 14. Purchases of Equity Securities by Closed-End Management Investment Company and Affiliated Purchasers. N/A
Item 15. Submission of Matters to a Vote of Security Holders.
There have been no changes to the procedures by which shareholders may recommend nominees to the Registrant’s Board of Trustees that would require disclosure herein.
Item 16. Controls and Procedures.
(a) Evaluation of Disclosure Controls and Procedures. The Registrant maintains disclosure controls and procedures that are designed to provide reasonable assurance that information required to be disclosed in the Registrant’s filings under the Securities Exchange Act of 1934, as amended, and the Investment Company Act of 1940 is recorded, processed, summarized and reported within the periods specified in the rules and forms of the Securities and Exchange Commission. Such information is accumulated and communicated to the Registrant’s management, including its principal executive officer and principal financial officer, as appropriate, to allow timely decisions regarding required disclosure. The Registrant’s management, including the principal executive officer and the principal financial officer, recognizes that any set of controls and procedures, no matter how well designed and operated, can provide only reasonable assurance of achieving the desired control objectives.
Within 90 days prior to the filing date of this Shareholder Report on Form N-CSRS, the Registrant had carried out an evaluation, under the supervision and with the participation of the Registrant’s management, including the Registrant’s principal executive officer and the Registrant’s principal financial officer, of the effectiveness of the design and operation of the Registrant’s disclosure controls and procedures. Based on such evaluation, the Registrant’s principal executive officer and principal financial officer concluded that the Registrant’s disclosure controls and procedures are effective.
(b) Changes in Internal Controls. There have been no changes in the Registrant’s internal control over financial reporting that occurred during the period covered by this report that has materially affected or is reasonably likely to materially affect the internal control over financial reporting.
Item 17. Disclosure of Securities Lending Activities for Closed-End Management Investment Company N/A
Item 18. Recovery of Erroneously Awarded Compensation.
(a) N/A
(b) N/A
Item 19. Exhibits.
(a) (1) N/A
(a) (2) Certifications pursuant to Section 302 of the Sarbanes-Oxley Act of 2002 of Christopher Kings, Chief Executive Officer - Finance and Administration, and Jeffrey White, Chief Financial Officer, Chief Accounting Officer and Treasurer
(b) Certifications pursuant to Section 906 of the Sarbanes-Oxley Act of 2002 of Christopher Kings, Chief Executive Officer - Finance and Administration, and Jeffrey White, Chief Financial Officer, Chief Accounting Officer and Treasurer
SIGNATURES
Pursuant to the requirements of the Securities Exchange Act of 1934 and the Investment Company Act of 1940, the registrant has duly caused this report to be signed on its behalf by the undersigned, thereunto duly authorized.
FRANKLIN CALIFORNIA TAX-FREE INCOME FUND
| By | /s/ CHRISTOPHER KINGS | |
| | Christopher Kings | |
| | Chief Executive Officer - Finance and Administration | |
| | | |
| Date | October 31, 2024 | |
Pursuant to the requirements of the Securities Exchange Act of 1934 and the Investment Company Act of 1940, this report has been signed below by the following persons on behalf of the registrant and in the capacities and on the dates indicated.
| By | /s/ CHRISTOPHER KINGS | |
| | Christopher Kings | |
| | Chief Executive Officer - Finance and Administration | |
| | | |
| Date | October 31, 2024 | |
| By | /s/ JEFFREY WHITE | |
| | Jeffrey White | |
| | Chief Financial Officer, Chief Accounting Officer and Treasurer | |
| | | |
| Date | October 31, 2024 | |