                                  UNITED STATES
                       SECURITIES AND EXCHANGE COMMISSION
                             WASHINGTON, D. C. 20549

                                   FORM N-CSR

Investment Company Act file number 811-2786

                           SCUDDER HIGH INCOME SERIES
                         ------------------------------
               (Exact Name of Registrant as Specified in Charter)

                  222 South Riverside Plaza, Chicago, IL 60606
                 ----------------------------------------------
               (Address of Principal Executive Offices) (Zip Code)

        Registrant's Telephone Number, including Area Code: (212) 454-7190
                                                            --------------

                                  Paul Schubert
                                 345 Park Avenue
                               New York, NY 10154
                     ---------------------------------------
                     (Name and Address of Agent for Service)

Date of fiscal year end:        09/30

Date of reporting period:       09/30/05


ITEM 1.  REPORT TO STOCKHOLDERS
| ||
| ||
| Annual Report to Shareholders | |
| September 30, 2005 | |
Contents |
|
Click Here Performance Summary Click Here Information About Your Fund's Expenses Click Here Portfolio Management Review Click Here Portfolio Summary Click Here Investment Portfolio Click Here Financial Statements Click Here Financial Highlights Click Here Notes to Financial Statements Click Here Report of Independent Registered Public Accounting Firm Click Here Tax Information Click Here Investment Management Agreement Approval Click Here Trustees and Officers Click Here Account Management Resources |
This report must be preceded or accompanied by a prospectus. To obtain a prospectus for any of our funds, refer to the Account Management Resources information provided in the back of this booklet. We advise you to consider the fund's objectives, risks, charges and expenses carefully before investing. The prospectus contains this and other important information about the fund. Please read the prospectus carefully before you invest.
Investments in mutual funds involve risk. Some funds have more risk than others. The fund may invest in lower-quality and nonrated securities which present greater risk of loss of principal and interest than higher-quality securities. Additionally, investing in foreign securities presents certain unique risks not associated with domestic investments, such as currency fluctuation, political and economic changes and market risks. All of these factors may result in greater share price volatility. Bond investments are subject to interest rate risk such that when interest rates rise, the prices of the bonds, and thus the value of the bond fund, can decline and the investor can lose principal value. Please read the fund's prospectus for specific details regarding the fund's risk profile.
Scudder Investments is part of Deutsche Asset Management, which is the marketing name in the US for the asset management activities of Deutsche Bank AG, Deutsche Investment Management Americas Inc., Deutsche Asset Management Inc., Deutsche Asset Management Investment Services Ltd., Deutsche Bank Trust Company Americas and Scudder Trust Company.
Fund shares are not FDIC-insured and are not deposits or other obligations of, or guaranteed by, any bank. Fund shares involve investment risk, including possible loss of principal.
|
All performance shown is historical, assumes reinvestment of all dividend and capital gain distributions, and does not guarantee future results. Investment return and principal value fluctuate with changing market conditions so that, when redeemed, shares may be worth more or less than their original cost. Current performance may be lower or higher than the performance quoted. Please visit scudder.com for the Fund's most recent month-end performance.
The maximum sales charge for Class A shares is 4.5%. For Class B shares, the maximum contingent deferred sales charge (CDSC) is 4% within the first year after purchase, declining to 0% after six years. Class C shares have no adjustment for front-end sales charges but redemptions within one year of purchase may be subject to a CDSC of 1%. Unadjusted returns do not reflect sales charges and would have been lower if they had. Institutional Class shares are not subject to sales charges.
To discourage short-term trading, shareholders redeeming shares held less than 60 days will have a lower total return due to the effect of the 2% short-term redemption fee.
Returns and rankings during all periods shown reflect a fee waiver and/or expense reimbursement. Without this waiver/reimbursement, returns would have been lower.
Performance figures do not reflect the deduction of taxes that a shareholder would pay on fund distributions or the redemption of fund shares. Returns and rankings may differ by share class.
Average Annual Total Returns (Unadjusted for Sales Charge) as of 9/30/05 | ||||
Scudder High Income Fund | 1-Year | 3-Year | 5-Year | 10-Year |
Class A | 8.12% | 14.91% | 6.84% | 6.13% |
Class B | 7.45% | 13.96% | 5.99% | 5.25% |
Class C | 7.49% | 14.06% | 5.97% | 5.26% |
CS First Boston High Yield Index+ | 6.31% | 15.55% | 8.57% | 7.38% |
Scudder High Income Fund | 1-Year | 3-Year | Life of Class* |
Institutional Class | 8.49% | 15.19% | 15.01% |
CS First Boston High Yield Index+ | 6.31% | 15.55% | 14.64% |
Sources: Lipper Inc. and Deutsche Asset Management, Inc.
* Institutional Class shares commenced operations on August 19, 2002. Index returns begin August 31, 2002.
|
|
Net Asset Value and Distribution Information | ||||
| Class A | Class B | Class C | Institutional Class |
Net Asset Value: 9/30/05 | $ 5.42 | $ 5.42 | $ 5.43 | $ 5.42 |
9/30/04 | $ 5.43 | $ 5.43 | $ 5.44 | $ 5.43 |
Distribution Information: Twelve Months: Income Dividends as of 9/30/05 | $ .45 | $ .41 | $ .41 | $ .47 |
September Income Dividend | $ .0375 | $ .0340 | $ .0340 | $ .0393 |
SEC 30-day Yield as of 9/30/05* | 7.09% | 6.54% | 6.67% | 8.81% |
Current Annualized Distribution Rate (Based on Net Asset Value) as of 9/30/05* | 8.30% | 7.53% | 7.51% | 8.70% |
* The SEC yield is net investment income per share earned over the month ended September 30, 2005, divided by the maximum offering price per share on the last day of the period. The SEC yield is computed in accordance with a standardized method prescribed by the Securities and Exchange Commission. The SEC yield would have been 8.58% for the Institutional Class had certain expenses not been reduced. In addition, the current annualized distribution rate would have been 8.47% for the Institutional Class had certain expenses not been reduced. Current annualized distribution rate is the latest monthly dividend as an annualized percentage of net asset value on September 30, 2005. Distribution rate simply measures the level of dividends and is not a complete measure of performance. Yields and distribution rates are historical and will fluctuate.
Class A Lipper Rankings — High Current Yield Funds Category as of 9/30/05 | ||||
Period | Rank |
| Number of Funds Tracked | Percentile Ranking |
1-Year | 54 | of | 424 | 13 |
3-Year | 120 | of | 362 | 33 |
5-Year | 114 | of | 297 | 39 |
10-Year | 38 | of | 99 | 38 |
Source: Lipper Inc. Rankings are historical and do not guarantee future results. Rankings are based on total return unadjusted for sales charges with distributions reinvested. If sales charges had been included, rankings might have been less favorable. Rankings are for Class A shares; other share classes may vary.
|
|
Growth of an Assumed $10,000 Investment (Adjusted for Maximum Sales Charge) |
[] Scudder High Income Fund — Class A [] CS First Boston High Yield Index+ |
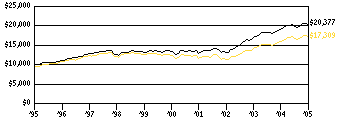 |
Yearly periods ended September 30 |
The Fund's growth of an assumed $10,000 investment is adjusted for the maximum sales charge of 4.50%. This results in a net initial investment of $9,550.
Comparative Results (Adjusted for Maximum Sales Charge) as of 9/30/05 | |||||
Scudder High Income Fund | 1-Year | 3-Year | 5-Year | 10-Year | |
Class A | Growth of $10,000 | $10,325 | $14,489 | $13,296 | $17,309 |
Average annual total return | 3.25% | 13.16% | 5.86% | 5.64% | |
Class B | Growth of $10,000 | $10,445 | $14,599 | $13,288 | $16,684 |
Average annual total return | 4.45% | 13.44% | 5.85% | 5.25% | |
Class C | Growth of $10,000 | $10,749 | $14,837 | $13,364 | $16,701 |
Average annual total return | 7.49% | 14.06% | 5.97% | 5.26% | |
CS First Boston High Yield Index+ | Growth of $10,000 | $10,631 | $15,426 | $15,048 | $20,377 |
Average annual total return | 6.31% | 15.55% | 8.57% | 7.38% | |
The growth of $10,000 is cumulative.
+ CS First Boston High Yield Index is an unmanaged trader-priced portfolio constructed to mirror the global high-yield debt market. Index returns assume reinvestment of dividends and, unlike Fund returns, do not reflect any fees or expenses. It is not possible to invest directly into an index.
|
|
Comparative Results as of 9/30/05 | ||||
Scudder High Income Fund | 1-Year | 3-Year | Life of Class* | |
Institutional Class | Growth of $1,000,000 | $1,084,900 | $1,528,500 | $1,546,000 |
Average annual total return | 8.49% | 15.19% | 15.01% | |
CS First Boston High Yield Index+ | Growth of $1,000,000 | $1,063,100 | $1,542,600 | $1,523,600 |
Average annual total return | 6.31% | 15.55% | 14.64% | |
The growth of $1,000,000 is cumulative.
The minimum investment for Institutional Class is $1,000,000.
* Institutional Class shares commenced operations on August 19, 2002. Index returns begin August 31, 2002.
+ CS First Boston High Yield Index is an unmanaged trader-priced portfolio constructed to mirror the global high-yield debt market. Index returns assume reinvestment of dividends and, unlike Fund returns, do not reflect any fees or expenses. It is not possible to invest directly into an index.
|
As an investor of the Fund, you incur two types of costs: ongoing expenses and transaction costs. Ongoing expenses include management fees, distribution and service (12b-1) fees and other Fund expenses. Examples of transaction costs include sales charges (loads), redemption fees and account maintenance fees, which are not shown in this section. The following tables are intended to help you understand your ongoing expenses (in dollars) of investing in the Fund and to help you compare these expenses with the ongoing expenses of investing in other mutual funds. In the most recent six-month period, all classes limited these expenses; had they not done so, expenses would have been higher. The tables are based on an investment of $1,000 made at the beginning of the six-month period ended September 30, 2005.
The tables illustrate your Fund's expenses in two ways:
Actual Fund Return. This helps you estimate the actual dollar amount of ongoing expenses (but not transaction costs) paid on a $1,000 investment in the Fund using the Fund's actual return during the period. To estimate the expenses you paid over the period, simply divide your account value by $1,000 (for example, an $8,600 account value divided by $1,000 = 8.6), then multiply the result by the number in the "Expenses Paid per $1,000" line under the share class you hold.
Hypothetical 5% Fund Return. This helps you to compare your Fund's ongoing expenses (but not transaction costs) with those of other mutual funds using the Fund's actual expense ratio and a hypothetical rate of return of 5% per year before expenses. Examples using a 5% hypothetical fund return may be found in the shareholder reports of other mutual funds. The hypothetical account values and expenses may not be used to estimate the actual ending account balance or expenses you paid for the period.
Please note that the expenses shown in these tables are meant to highlight your ongoing expenses only and do not reflect any transaction costs. The "Expenses Paid per $1,000" line of the tables is useful in comparing ongoing expenses only and will not help you determine the relative total expense of owning different funds. If these transaction costs had been included, your costs would have been higher.
* Expenses are equal to the Fund's annualized expense ratio for each share class, multiplied by the average account value over the period, multiplied by the number of days in the most recent six-month period, then divided by 365.
Annualized Expense Ratios | Class A | Class B | Class C | Institutional Class |
Scudder High Income Fund | .99% | 1.89% | 1.79% | .59% |
For more information, please refer to the Fund's prospectus.
|
Scudder High Income Fund: A Team Approach to Investing
Deutsche Investment Management Americas Inc. ("DeIM" or the "Advisor"), which is part of Deutsche Asset Management, is the investment advisor for Scudder High Income Fund. DeIM and its predecessors have more than 80 years of experience managing mutual funds and DeIM provides a full range of investment advisory services to institutional and retail clients. DeIM is also responsible for selecting brokers and dealers and for negotiating brokerage commissions and dealer charges.
Deutsche Asset Management is a global asset management organization that offers a wide range of investing expertise and resources. This well-resourced global investment platform brings together a wide variety of experience and investment insight across industries, regions, asset classes and investing styles.
DeIM is an indirect, wholly owned subsidiary of Deutsche Bank AG. Deutsche Bank AG is a major global banking institution that is engaged in a wide range of financial services, including investment management, mutual funds, retail, private and commercial banking, investment banking and insurance.
Portfolio Manager
Andrew P. Cestone
Managing Director of Deutsche Asset Management and Lead Manager of the fund.
Joined Deutsche Asset Management in March 1998 and the fund in 2002.
Manager of High Yield.
Previous experience includes five years as investment analyst at Phoenix Investment Partners and as credit officer in the asset-based lending group at Fleet Financial Group.
BA, University of Vermont.
In the following interview, Lead Manager Andrew Cestone discusses Scudder High Income Fund's strategy and the market environment during the 12-month period ended September 30, 2005.
Q: How did the high-yield bond market perform during the period?
A: High-yield bonds provided a positive absolute return for the past 12 months, gaining 6.31% as measured by the CS First Boston High Yield Index. High-yield bonds strongly outperformed the 2.80% return of the bond market as a whole, as measured by the Lehman Brothers Aggregate Bond Index.1
1 The CS First Boston High Yield Index is an unmanaged, trader-priced portfolio constructed to mirror the global high-yield debt market. The Lehman Brothers Aggregate Bond Index represents US domestic taxable investment-grade bonds that include securities from the following sectors: US Treasuries, agencies, corporate bonds, mortgage-backed bonds and asset-backed securities. The index includes more than 5,500 publicly issued securities with a minimum one year to final maturity and $150 million par amount outstanding. The average maturity and duration of the index is in the intermediate range. Index returns assume reinvestment of dividends and, unlike fund returns, do not reflect any fees or expenses. It is not possible to invest directly into an index.
Despite concerns about rising interest rates, higher commodity prices, geopolitical risks and the impact of natural disasters such as Hurricanes Katrina and Rita during the period, the solid fundamental underpinnings of the market remained in place. Heightened uncertainties over weaker economic data and the possible downgrades of General Motors Corp. (GM) and Ford Motor Corp. also contributed to inter-period market volatility. However, after it was announced that GM and Ford were indeed downgraded to noninvestment grade by Moody's and Standard & Poor's (ending the speculation), and revised economic numbers eased concerns about an economic slowdown, a large majority of these heightened uncertainties dissipated. The removal of these uncertainties served as a catalyst for the market to return to its focus on fundamentals, thus resulting in spread tightening — i.e., outperformance versus Treasuries. At the close of the period, the high-yield spread stood at 377 basis points (3.77 percentage points), versus 430 basis points 12 months ago.2 Helped by strength in the US economy and low interest rates, high-yield companies generally maintained sound financial positions through actions such as cutting costs, reducing debt and refinancing their existing debt at lower interest rates. Probably the best indication of solid fundamentals in the high-yield market was the continuation of low defaults. At the end of September 2005, Moody's 12-month rolling default rate stood at 2.3%, compared with 2.4% at the end of September 2004.3 In addition to low defaults, recovery rates remained strong.4 Finally, the ratio of rating upgrades to downgrades remained intact — an indication of the market's solid fundamentals.5
2 The long-term historical spread-to-worst average is based on the average monthly spread-to-worst of the CS First Boston High Yield Index from January 31, 1986, to September 30, 2005. The yield spread is the difference between the yield of a given fixed-income asset class and the yield on Treasuries. A large spread indicates that investors require yields substantially above those of Treasuries in order to invest in high-yield bonds. This is generally indicative of a higher-risk environment. A smaller spread generally indicates a more positive environment, since investors are less concerned about risk and therefore willing to accept lower yields.
3 Source: Moody's Investors Service.
4 The recovery rate is the amount investors recover when a bond defaults.
5 Bond ratings are the alphabetic designations indicating the credit quality of a particular bond, as measured by the major agencies. Treasuries, which are backed by the government and therefore free of default risk, are ranked AAA. The riskiest bonds are generally rated CCC and below.
Q: How did the fund perform?
A: The fund's Class A shares returned 8.12%, outperforming both the 6.31% return of the benchmark and the 5.80% median return of the Lipper peer group. (Returns are unadjusted for sales charges.) If sales charges had been included, returns would have been lower. The fund ranked in the 13th percentile of the 424 funds in its Lipper peer group for the 12-month period ended September 30, 2005. The fund also outperformed the average return of the peer group for the three- and five-year periods ended September 30, 2005, ranking in the 33rd and 39th percentiles, respectively.6 (Past performance is no guarantee of future results. Please see pages 3 through 6 for complete performance information.)
6 Lipper's High Current Yield Funds category represents funds that aim at a high (relative) current yield from fixed-income securities, have no quality or maturity restrictions and tend to invest in lower-grade debt issues. The fund ranked 54, 120, and 114, for the one-, three- and five-year periods, respectively, as of September 30, 2005. There were 424, 362 and 297 funds, respectively, in Lipper's High Current Yield Funds category. Performance includes the reinvestment of dividends and capital gains and is no guarantee of future results. Source: Lipper Inc., as of September 30, 2005. It is not possible to invest in a Lipper category.
Q: What elements of your individual security selection helped performance?
A: Individual securities that helped relative performance included overweight positions in Qwest Communications Corp., ARCO Chemical Company, Oxford Automotive Inc., Dobson Communications Corp., Grupo Transportacion Ferroviaria Mexicana (TFM) SA, Charter Communications Holdings LLC and Dynegy Holdings Inc. An overweight in emerging markets bonds, such as OAO Gazprom, also helped results. Our underweight in Collins and Aikman Products benefited performance as well.
One of the fund's larger positions over the past year was in the bonds of Qwest, a US telecommunications company that we correctly anticipated would receive an upgrade to its credit rating. The bond prices of the chemical company ARCO — also one of the fund's larger positions — increased from undervalued levels earlier in the year following favorable indications of improved demand and pricing in the chemicals sector. ARCO bond prices are also supported by the company's sound financial margins and continued debt reduction. The ARCO bonds owned by the fund were upgraded in April 2005. Our position in Oxford Automotive, an auto parts supplier that is in bankruptcy, helped returns as the bonds increased in value due to favorable restructuring terms. We exited the majority of our position during the last quarter of the fiscal year, because in our opinion the bonds had reached their intrinsic value. An overweight position in Dobson Communications benefited returns after the company reported better-than-expected and improved results, as we had anticipated. TFM, the Mexican railroad company, added to return on the news that Kansas City Southern, a US railroad company, purchased additional equity of the company. As a result of the purchase, TFM is now wholly owned by Kansas City Southern, as we believed it ultimately would be. The company also has benefited from strong demand for transportation services. The bonds of Charter Communications, a US cable company, gained in price during the period as a result of an exchange offer. This exchange offer was viewed as a positive by investors as it allowed the company to extend maturities and marginally reduce debt leverage. Our position in Dynegy Holdings bonds increased on news that the company was selling its midstream natural gas business and intended to use part of the proceeds to pay down debt. The company's announcement that it intends to participate in overall industry consolidation was also a plus. The Russian oil and gas company Gazprom helped fund returns as the company's bond prices edged higher on continued strength in commodity prices. In the first half of the year, we sold the fund's entire position in Collins and Aikman Products, an auto parts manufacturer. Our decision to exit this position, well ahead of the company's announcement that it was filing for bankruptcy protection, was a positive contributor to return.
Q: What were some individual holdings that hurt performance?
A: The fund's overweight positions in Tembec Industries, Inc., Associated Materials, Inc. and TriMas Corp., coupled with an underweight in AT&T Corp., detracted from relative performance. In addition, the fund did not own Mirant, a defaulted utility company whose bonds performed well, and this dampened returns relative to the benchmark.
Tembec, a forest products paper company, detracted during the period. Tembec's bonds traded lower as cost pressures caused earnings to fall short of prior guidance. Additionally, the company's bonds traded further down in price as seasonal working capital investment reduced the company's liquidity and contributed to negative press speculation about the potential for a future bankruptcy. On the whole, we believe this sell-off created an opportunity, and we added to the fund's position in Tembec. Although the building materials company Associated Materials instituted product price increases, this move was not enough to offset the negative impact of higher raw material costs. Higher costs hurt the company's profit margins, and the bonds traded down in price. Trimas is a manufacturer of trailer and towing products. The company's bond prices decreased as the company took guidance down as a result of weakness in the trailer accessory market, due, in part, to higher oil prices.
The bonds of AT&T, a telecommunications company and one of the largest issuers in the benchmark, rallied after it was announced in early 2005 that SBC Communications intended to purchase AT&T. Since the fund did not hold as high of a weighting in AT&T as the benchmark, relative performance was hurt. The underweight in AT&T was the result of our finding better risk-adjusted relative value in the bonds of MCI, Inc., another telecommunications company owned in the portfolio. Our decision to overweight MCI benefited fund performance for the period, as MCI's bonds increased in price on an offer from Verizon to acquire the company.
Q: Outside of individual security selection, what factors helped and hurt performance?
A: During the year, we decreased higher-quality securities (where we are typically underweight) in an effort to become more defensive. Middle-tier (split BB/B/split B) securities were the best-performing credit quality segment for the period, followed by lower-quality securities (CCC/split CCC/default) and upper-tier securities (split BBB/BB). The fund's overweight position in middle- and lower-tier securities and corresponding underweight in upper-tier securities helped relative returns versus the benchmark.
In addition, the fund had a shorter duration (interest rate sensitivity) than its benchmark during the year as a result of our finding better value in shorter-duration securities. Having a shorter duration than the benchmark helped to mitigate the effect of the market volatility that occurred during the period.
Q: What is your view on the current state of the high-yield market?
A: We believe the robust economy continues to translate into sound fundamentals for the high-yield market. The low-default environment will not last forever, which means good security selection is paramount at this point in the cycle. Given that, we will look for opportunities to further decrease the fund's allocation to middle-tier securities in favor of higher-quality securities. We continue to seek bonds with improving fundamentals that we believe will benefit from positive credit events or that are trading at what we believe are undervalued levels. We remain focused on adding value by doing fundamental research rather than making broad predictions about sector performance or interest rates.
The views expressed in this report reflect those of the portfolio manager only through the end of the period of the report as stated on the cover. The manager's views are subject to change at any time based on market and other conditions and should not be construed as a recommendation.
|
Asset Allocation (Excludes Securities Lending Collateral) | 9/30/05 | 9/30/04 |
| ||
Corporate Bonds | 80% | 74% |
Foreign Bonds — US$ Denominated | 15% | 19% |
Foreign Bonds — Non US$ Denominated | 2% | 3% |
Loan Participation | 1% | — |
Cash Equivalents, net | 1% | 2% |
Stocks | 1% | 1% |
Convertible Bonds | — | 1% |
| 100% | 100% |
Corporate and Foreign Bond Diversification (Excludes Cash Equivalents and Securities Lending Collateral) | 9/30/05 | 9/30/04 |
| ||
Consumer Discretionary | 24% | 25% |
Industrials | 15% | 17% |
Materials | 14% | 14% |
Financials | 13% | 10% |
Telecommunication Services | 11% | 12% |
Energy | 9% | 9% |
Utilities | 6% | 6% |
Information Technology | 3% | 1% |
Consumer Staples | 2% | 3% |
Health Care | 2% | 3% |
Sovereign Bonds | 1% | — |
| 100% | 100% |
Asset allocation and corporate and foreign bond diversification are subject to change.
|
|
Quality | 9/30/05 | 9/30/04 |
| ||
Cash Equivalents | 1% | 4% |
BBB | 3% | 2% |
BB | 24% | 26% |
B | 56% | 51% |
CCC | 12% | 16% |
CC | 1% | 1% |
D | 3% | — |
| 100% | 100% |
Effective Maturity | 9/30/05 | 9/30/04 |
| ||
Less than 1 year | 7% | 9% |
1 < 5 years | 45% | 59% |
5 < 7 years | 21% | 22% |
7 years or greater | 27% | 10% |
| 100% | 100% |
Quality and effective maturity are subject to change.
The quality ratings represents the lower of Moody's Investors Service, Inc. ("Moody's") or Standard & Poor's Corporation ("S&P") credit ratings. The ratings of Moody's and S&P represent their opinions as to the quality of the securities they rate. Ratings are relative and subjective and are not absolute standards of quality. The Fund's credit quality does not remove market risk.
For complete details about the Fund's investment portfolio, see page 18. A quarterly Fact Sheet is available upon request. Information concerning portfolio holdings of the Fund as of month end will be posted to scudder.com on the 15th of the following month. Please see the Account Management Resources section for contact information.
Following the Fund's fiscal first and third quarter-end, a complete portfolio holdings listing is filed with the SEC on Form N-Q. The form will be available on the SEC's Web site at www.sec.gov, and it also may be reviewed and copied at the SEC's Public Reference Room in Washington, D.C. Information on the operation of the SEC's Public Reference Room may be obtained by calling (800) SEC-0330.
|
| Principal Amount ($)(a) | Value ($) |
|
| |
Corporate Bonds 79.2% | ||
Consumer Discretionary 19.5% | ||
155 East Tropicana LLC, 8.75%, 4/1/2012 (b) | 5,390,000 | 5,228,300 |
Adesa, Inc., 7.625%, 6/15/2012 | 1,827,000 | 1,827,000 |
AMC Entertainment, Inc., 8.0%, 3/1/2014 (b) | 10,690,000 | 9,407,200 |
Amscan Holdings, Inc., 8.75%, 5/1/2014 | 2,200,000 | 1,925,000 |
AutoNation, Inc., 9.0%, 8/1/2008 | 4,315,000 | 4,660,200 |
Aztar Corp., 7.875%, 6/15/2014 (b) | 12,290,000 | 12,843,050 |
Cablevision Systems New York Group, Series B, 7.89%**, 4/1/2009 (b) | 3,420,000 | 3,505,500 |
Caesars Entertainment, Inc.: |
|
|
8.875%, 9/15/2008 | 3,265,000 | 3,571,094 |
9.375%, 2/15/2007 | 3,295,000 | 3,476,225 |
Charter Communications Holdings LLC: |
|
|
Step-Up Coupon, 0% to 5/15/2006, 11.75% to 5/15/2011 | 295,000 | 210,925 |
9.625%, 11/15/2009 (b) | 12,900,000 | 10,965,000 |
144A 10.25%, 9/15/2010 (b) | 19,050,000 | 19,526,250 |
CCH I LLC, 144A, 11.0%, 10/1/2015 | 1,150,000 | 1,121,250 |
Cooper-Standard Automotive, Inc., 8.375%, 12/15/2014 (b) | 8,854,000 | 7,437,360 |
CSC Holdings, Inc.: |
|
|
7.25%, 7/15/2008 | 2,995,000 | 3,006,231 |
7.875%, 12/15/2007 | 10,050,000 | 10,326,375 |
Dex Media East LLC/Financial, 12.125%, 11/15/2012 (b) | 27,800,000 | 32,526,000 |
Dura Operating Corp., Series B, 8.625%, 4/15/2012 (b) | 6,147,000 | 5,470,830 |
EchoStar DBS Corp., 6.625%, 10/1/2014 (b) | 3,045,000 | 3,014,550 |
Foot Locker, Inc., 8.5%, 1/15/2022 | 5,183,000 | 5,636,513 |
Ford Motor Co., 7.45%, 7/16/2031 (b) | 3,350,000 | 2,613,000 |
General Motors Corp., 8.25%, 7/15/2023 (b) | 2,938,000 | 2,284,295 |
Goodyear Tire & Rubber Co.: |
|
|
144A, 9.0%, 7/1/2015 | 305,000 | 300,425 |
12.5%, 3/1/2011 | 305,000 | 341,600 |
GSC Holdings Corp., 144A, 8.0%, 10/1/2012 (b) | 3,185,000 | 3,169,075 |
Interep National Radio Sales, Inc., Series B, 10.0%, 7/1/2008 (b) | 3,720,000 | 2,980,650 |
ITT Corp., 7.375%, 11/15/2015 (b) | 3,155,000 | 3,423,175 |
Jacobs Entertainment, Inc., 11.875%, 2/1/2009 | 19,208,000 | 20,504,540 |
Levi Strauss & Co.: |
|
|
8.254%**, 4/1/2012 | 4,585,000 | 4,573,538 |
12.25%, 12/15/2012 | 2,280,000 | 2,519,400 |
Liberty Media Corp.: |
|
|
5.7%, 5/15/2013 (b) | 290,000 | 263,905 |
7.875%, 7/15/2009 (b) | 270,000 | 284,115 |
8.5%, 7/15/2029 (b) | 715,000 | 692,298 |
Mandalay Resort Group, Series B, 10.25%, 8/1/2007 | 2,155,000 | 2,316,625 |
Mediacom Broadband LLC, 144A, 8.5%, 10/15/2015 | 2,200,000 | 2,123,000 |
Mediacom LLC, 9.5%, 1/15/2013 (b) | 1,820,000 | 1,806,350 |
MGM MIRAGE: |
|
|
8.375%, 2/1/2011 (b) | 12,695,000 | 13,647,125 |
9.75%, 6/1/2007 | 5,335,000 | 5,681,775 |
MTR Gaming Group, Inc., Series B, 9.75%, 4/1/2010 | 2,815,000 | 3,040,200 |
NCL Corp., 144A, 11.625%, 7/15/2014 | 5,510,000 | 5,813,050 |
Norcraft Holdings/Capital, Step-Up Coupon, 0% to 9/1/2008, 9.75% to 9/1/2012 | 11,095,000 | 7,766,500 |
Paxson Communications Corp.: |
|
|
Step-Up Coupon, 0% to 1/15/2006, 12.25% to 1/15/2009 (b) | 3,050,000 | 2,958,500 |
10.75%, 7/15/2008 (b) | 2,675,000 | 2,628,188 |
Petro Stopping Centers, 9.0%, 2/15/2012 (b) | 9,765,000 | 9,618,525 |
Pinnacle Entertainment, Inc., 8.75%, 10/1/2013 (b) | 9,950,000 | 10,248,500 |
Premier Entertainment Biloxi LLC/Finance, 10.75%, 2/1/2012 | 8,345,000 | 7,520,931 |
PRIMEDIA, Inc.: |
|
|
8.875%, 5/15/2011 (b) | 9,495,000 | 9,946,012 |
9.165%**, 5/15/2010 (b) | 10,760,000 | 11,351,800 |
Renaissance Media Group LLC, 10.0%, 4/15/2008 | 5,805,000 | 5,746,950 |
Resorts International Hotel & Casino, Inc., 11.5%, 3/15/2009 (b) | 11,142,000 | 12,479,040 |
Schuler Homes, Inc., 10.5%, 7/15/2011 (b) | 8,625,000 | 9,315,000 |
Simmons Bedding Co., 144A, Step-Up Coupon, 0% to 12/15/2009, 10.0% to 2/15/2014 | 14,285,000 | 7,571,050 |
Sinclair Broadcast Group, Inc.: |
|
|
8.0%, 3/15/2012 | 8,975,000 | 9,188,156 |
8.75%, 12/15/2011 | 16,030,000 | 16,831,500 |
Sirius Satellite Radio, Inc., 144A, 9.625%, 8/1/2013 (b) | 12,015,000 | 11,534,400 |
Toys "R" Us, Inc., 7.375%, 10/15/2018 | 6,290,000 | 5,032,000 |
Trump Entertainment Resorts, Inc., 8.5%, 6/1/2015 | 20,245,000 | 19,536,425 |
TRW Automotive, Inc.: |
|
|
11.0%, 2/15/2013 (b) | 14,043,000 | 15,833,482 |
11.75%, 2/15/2013, EUR | 2,285,000 | 3,199,353 |
United Auto Group, Inc., 9.625%, 3/15/2012 | 9,250,000 | 9,620,000 |
Wheeling Island Gaming, Inc., 10.125%, 12/15/2009 | 2,803,000 | 2,943,150 |
Williams Scotsman, Inc., 144A, 8.5%, 10/1/2015 | 5,510,000 | 5,578,875 |
Wynn Las Vegas LLC, 6.625%, 12/1/2014 (b) | 470,000 | 449,438 |
XM Satellite Radio, Inc.: |
|
|
Step-Up Coupon, 0% to 12/31/2005, 14.0% to 12/31/2009 | 14,232,899 | 14,944,544 |
12.0%, 6/15/2010 | 1,729,000 | 1,971,060 |
Young Broadcasting, Inc.: |
|
|
8.75%, 1/15/2014 (b) | 11,495,000 | 10,201,812 |
10.0%, 3/1/2011 (b) | 2,385,000 | 2,253,825 |
450,332,010 | ||
Consumer Staples 2.0% | ||
Agrilink Foods, Inc., 11.875%, 11/1/2008 (b) | 3,575,000 | 3,655,437 |
Alliance One International, Inc.: |
|
|
144A, 11.0%, 5/15/2012 | 6,250,000 | 5,921,875 |
144A, 12.75%, 11/15/2012 | 3,115,000 | 2,850,225 |
Del Laboratories, Inc., 8.0%, 2/1/2012 (b) | 4,225,000 | 3,475,063 |
GNC Corp., 8.5%, 12/1/2010 (b) | 1,010,000 | 861,025 |
North Atlantic Trading Co., 9.25%, 3/1/2012 | 17,165,000 | 12,873,750 |
Swift & Co.: |
|
|
10.125%, 10/1/2009 | 6,035,000 | 6,495,169 |
12.5%, 1/1/2010 | 2,421,000 | 2,638,890 |
Viskase Co., Inc., 11.5%, 6/15/2011 | 6,785,000 | 7,327,800 |
46,099,234 | ||
Energy 6.6% | ||
Belden & Blake Corp., 8.75%, 7/15/2012 | 10,660,000 | 11,139,700 |
Calpine Generating Co., 12.39%**, 4/1/2011 (b) | 7,169,000 | 6,810,550 |
Chesapeake Energy Corp.: |
|
|
144A, 6.5%, 8/15/2017 | 4,205,000 | 4,278,588 |
6.875%, 1/15/2016 | 1,925,000 | 1,973,125 |
CITGO Petroleum Corp., 6.0%, 10/15/2011 | 9,048,000 | 9,048,000 |
Dynegy Holdings, Inc.: |
|
|
6.875%, 4/1/2011 (b) | 2,400,000 | 2,346,000 |
7.125%, 5/15/2018 (b) | 3,235,000 | 2,992,375 |
7.625%, 10/15/2026 | 2,431,000 | 2,248,675 |
8.75%, 2/15/2012 (b) | 1,125,000 | 1,220,625 |
144A, 9.875%, 7/15/2010 | 15,500,000 | 16,895,000 |
El Paso Production Holding Corp., 7.75%, 6/1/2013 | 5,960,000 | 6,228,200 |
Newpark Resources, Inc., Series B, 8.625%, 12/15/2007 | 10,425,000 | 10,372,875 |
NGC Corp. Capital Trust I, Series B, 8.316%, 6/1/2027 (b) | 10,440,000 | 9,369,900 |
NRG Energy, Inc., 8.0%, 12/15/2013 | 12,253,000 | 13,049,445 |
Pogo Producing Co., 144A, 6.875%, 10/1/2017 (b) | 2,665,000 | 2,701,644 |
Sonat, Inc., 7.0%, 2/1/2018 | 2,455,000 | 2,332,250 |
Southern Natural Gas, 8.875%, 3/15/2010 (b) | 8,665,000 | 9,366,076 |
Stone Energy Corp.: |
|
|
6.75%, 12/15/2014 (b) | 4,090,000 | 4,018,425 |
8.25%, 12/15/2011 (b) | 11,150,000 | 11,707,500 |
Williams Companies, Inc.: |
|
|
8.125%, 3/15/2012 (b) | 18,231,000 | 19,917,367 |
8.75%, 3/15/2032 | 4,207,000 | 4,964,260 |
152,980,580 | ||
Financials 11.7% | ||
Affinia Group, Inc., 144A, 9.0%, 11/30/2014 | 9,945,000 | 7,757,100 |
Alamosa Delaware, Inc.: |
|
|
8.5%, 1/31/2012 | 1,120,000 | 1,195,600 |
11.0%, 7/31/2010 | 3,138,000 | 3,538,095 |
12.0%, 7/31/2009 (b) | 4,130,000 | 4,573,975 |
Alliance Mortgage Cycle Loan, 12.25%, 6/4/2010 | 3,470,833 | 3,470,833 |
AmeriCredit Corp., 9.25%, 5/1/2009 (b) | 19,242,000 | 20,300,310 |
Ashton Woods USA LLC, 144A, 9.5%, 10/1/2015 | 3,080,000 | 2,972,200 |
Atlantic Mutual Insurance Co., 144A, 8.15%, 2/15/2028 | 3,525,000 | 2,263,381 |
E*TRADE Financial Corp.: |
|
|
144A, 7.375%, 9/15/2013 | 6,855,000 | 6,923,550 |
8.0%, 6/15/2011 | 5,533,000 | 5,712,822 |
Eaton Vance Corp., CDO II, Series C-X, 13.68%, 7/15/2012* | 1,697,739 | 0 |
FINOVA Group, Inc., 7.5%, 11/15/2009 | 12,072,699 | 4,708,353 |
Ford Motor Credit Co.: |
|
|
7.25%, 10/25/2011 (b) | 33,860,000 | 32,139,370 |
7.375%, 10/28/2009 | 16,230,000 | 15,677,320 |
General Motors Acceptance Corp.: |
|
|
4.67%**, 3/20/2007 (b) | 9,485,000 | 9,285,948 |
5.125%, 5/9/2008 (b) | 1,290,000 | 1,200,852 |
6.125%, 8/28/2007 (b) | 3,690,000 | 3,632,425 |
6.75%, 12/1/2014 (b) | 7,635,000 | 6,641,259 |
6.875%, 9/15/2011 | 6,195,000 | 5,635,053 |
7.75%, 1/19/2010 (b) | 1,155,000 | 1,119,548 |
8.0%, 11/1/2031 (b) | 59,284,000 | 51,764,951 |
H&E Equipment/Finance, 11.125%, 6/15/2012 | 8,585,000 | 9,615,200 |
Poster Financial Group, Inc., 8.75%, 12/1/2011 (b) | 8,330,000 | 8,569,487 |
PXRE Capital Trust I, 8.85%, 2/1/2027 | 6,124,000 | 6,001,520 |
Qwest Capital Funding, Inc., 6.5%, 11/15/2018 | 302,000 | 250,660 |
R.H. Donnelly Finance Corp., 10.875%, 12/15/2012 | 6,682,000 | 7,500,545 |
Radnor Holdings Corp., 11.0%, 3/15/2010 (b) | 12,026,000 | 7,816,900 |
Rafaella Apparel Group, Inc., 144A, 11.25%, 6/15/2011 | 1,960,000 | 1,911,000 |
RC Royalty Subordinated LLC, 7.0%, 1/1/2018 | 1,270,000 | 1,117,600 |
TIG Capital Holdings Trust, 144A, 8.597%, 1/15/2027 | 8,109,000 | 6,811,560 |
Triad Acquisition, 144A, 11.125%, 5/1/2013 | 4,595,000 | 4,744,338 |
UGS Corp., 10.0%, 6/1/2012 | 8,785,000 | 9,619,575 |
Universal City Development, 11.75%, 4/1/2010 | 12,525,000 | 14,153,250 |
268,624,580 | ||
Health Care 1.9% | ||
Cinacalcet Royalty Subordinated LLC, 8.0%, 3/30/2017 | 1,015,000 | 1,086,050 |
Eszopiclone Royalty Subordinated LLC, 144A,12.0%, 3/15/2014 | 3,935,000 | 3,935,000 |
HEALTHSOUTH Corp., 10.75%, 10/1/2008 (b) | 14,808,000 | 14,474,820 |
InSight Health Services Corp.: |
|
|
144A, 9.174%**, 11/1/2011 | 2,620,000 | 2,554,500 |
Series B, 9.875%, 11/1/2011 (b) | 3,025,000 | 2,442,688 |
Tenet Healthcare Corp., 144A, 9.25%, 2/1/2015 | 18,380,000 | 18,563,800 |
43,056,858 | ||
Industrials 11.3% | ||
Aavid Thermal Technologies, Inc., 12.75%, 2/1/2007 | 14,123,000 | 14,793,842 |
Allied Security Escrow Corp., 11.375%, 7/15/2011 | 8,210,000 | 8,148,425 |
Allied Waste North America, Inc.: |
|
|
Series B, 5.75%, 2/15/2011 (b) | 11,686,000 | 10,897,195 |
Series B, 9.25%, 9/1/2012 | 10,781,000 | 11,670,432 |
American Color Graphics, 10.0%, 6/15/2010 (b) | 5,765,000 | 4,280,513 |
Avondale Mills, Inc., 144A, 10.504%**, 7/1/2012 | 4,139,000 | 4,035,526 |
Bear Creek Corp., 144A, 8.87%**, 3/1/2012 | 2,185,000 | 2,250,550 |
Beazer Homes USA, Inc.: |
|
|
8.375%, 4/15/2012 | 6,206,000 | 6,547,330 |
8.625%, 5/15/2011 | 5,500,000 | 5,788,750 |
Browning-Ferris Industries: |
|
|
7.4%, 9/15/2035 | 9,273,000 | 8,137,057 |
9.25%, 5/1/2021 | 3,665,000 | 3,738,300 |
Case New Holland, Inc., 9.25%, 8/1/2011 | 3,210,000 | 3,394,575 |
Cenveo Corp., 7.875%, 12/1/2013 (b) | 7,090,000 | 6,841,850 |
Collins & Aikman Floor Cover, Series B, 9.75%, 2/15/2010 | 10,240,000 | 9,881,600 |
Columbus McKinnon Corp., 10.0%, 8/1/2010 | 4,445,000 | 4,856,163 |
Compression Polymers Corp.: |
|
|
144A, 10.46%**, 7/1/2012 | 2,500,000 | 2,337,500 |
144A, 10.5%, 7/1/2013 (b) | 5,565,000 | 5,161,537 |
Congoleum Corp., 8.625%, 8/1/2008 | 5,085,000 | 5,154,919 |
Cornell Companies, Inc., 10.75%, 7/1/2012 | 5,140,000 | 5,294,200 |
Dana Corp., 7.0%, 3/1/2029 (b) | 9,015,000 | 6,865,085 |
ISP Chemco, Inc., Series B, 10.25%, 7/1/2011 | 14,281,000 | 15,405,629 |
K. Hovnanian Enterprises, Inc.: |
|
|
144A, 6.25%, 1/15/2016 | 4,970,000 | 4,627,801 |
8.875%, 4/1/2012 (b) | 9,385,000 | 9,901,175 |
Kansas City Southern: |
|
|
7.5%, 6/15/2009 | 1,838,000 | 1,925,305 |
9.5%, 10/1/2008 | 15,680,000 | 17,189,200 |
Kinetek, Inc., Series D, 10.75%, 11/15/2006 | 12,282,000 | 11,667,900 |
Metaldyne Corp., 144A, 11.0%, 11/1/2013 (b) | 5,065,000 | 4,406,550 |
Millennium America, Inc., 9.25%, 6/15/2008 (b) | 13,995,000 | 15,044,625 |
Rainbow National Services LLC, 144A, 10.375%, 9/1/2014 | 7,125,000 | 8,051,250 |
Ship Finance International Ltd., 8.5%, 12/15/2013 | 6,595,000 | 6,421,881 |
Technical Olympic USA, Inc.: |
|
|
7.5%, 3/15/2011 (b) | 3,125,000 | 2,929,688 |
10.375%, 7/1/2012 | 12,060,000 | 12,693,150 |
The Brickman Group Ltd., Series B, 11.75%, 12/15/2009 | 4,890,000 | 5,476,800 |
United Rentals North America, Inc., 7.0%, 2/15/2014 (b) | 10,025,000 | 9,298,187 |
Xerox Capital Trust I, 8.0%, 2/1/2027 (b) | 5,180,000 | 5,374,250 |
260,488,740 | ||
Information Technology 3.0% | ||
Activant Solutions, Inc.: |
|
|
144A, 9.504%**, 4/1/2010 | 835,000 | 851,700 |
10.5%, 6/15/2011 | 7,553,000 | 7,892,885 |
Eschelon Operating Co., 8.375%, 3/15/2010 | 5,247,000 | 4,879,710 |
L-3 Communications Corp., 144A, 6.375%, 10/15/2015 | 3,170,000 | 3,193,775 |
Lucent Technologies, Inc., 6.45%, 3/15/2029 (b) | 15,400,000 | 13,475,000 |
Sanmina-SCI Corp.: |
|
|
6.75%, 3/1/2013 (b) | 14,015,000 | 13,314,250 |
10.375%, 1/15/2010 | 12,294,000 | 13,554,135 |
SunGard Data Systems, Inc., 144A, 10.25%, 8/15/2015 (b) | 8,925,000 | 9,036,563 |
Viasystems, Inc., 10.5%, 1/15/2011 | 2,350,000 | 2,308,875 |
68,506,893 | ||
Materials 10.7% | ||
ARCO Chemical Co., 9.8%, 2/1/2020 | 23,321,000 | 26,323,579 |
Associated Materials, Inc., Step-Up Coupon, 0% to 3/1/2009, 11.25% to 3/1/2014 (b) | 13,470,000 | 6,735,000 |
Caraustar Industries, Inc., 9.875%, 4/1/2011 (b) | 15,157,000 | 15,005,430 |
Constar International, Inc.: |
|
|
144A, 7.165%**, 2/15/2012 | 3,575,000 | 3,315,813 |
11.0%, 12/1/2012 (b) | 2,575,000 | 1,622,250 |
Dayton Superior Corp.: |
|
|
10.75%, 9/15/2008 (b) | 5,490,000 | 5,544,900 |
13.0%, 6/15/2009 (b) | 8,630,000 | 6,904,000 |
Edgen Acquisition Corp., 9.875%, 2/1/2011 | 2,825,000 | 2,839,125 |
GEO Specialty Chemicals, Inc., 144A, 12.004%**, 12/31/2009 | 9,990,000 | 9,353,138 |
Georgia-Pacific Corp.: |
|
|
8.0%, 1/15/2024 (b) | 13,455,000 | 14,834,137 |
9.375%, 2/1/2013 | 10,345,000 | 11,534,675 |
Hercules, Inc., 6.75%, 10/15/2029 | 5,800,000 | 5,684,000 |
Huntsman Advanced Materials LLC, 11.0%, 7/15/2010 | 8,915,000 | 9,984,800 |
Huntsman International LLC, 10.125%, 7/1/2009, EUR | 4,363,000 | 5,427,197 |
Huntsman LLC, 11.625%, 10/15/2010 (b) | 11,835,000 | 13,521,487 |
IMC Global, Inc.: |
|
|
7.375%, 8/1/2018 | 2,410,000 | 2,473,263 |
10.875%, 8/1/2013 (b) | 10,734,000 | 12,666,120 |
Intermet Corp., 9.75%, 6/15/2009* (b) | 1,025,000 | 343,375 |
International Steel Group, Inc., 6.5%, 4/15/2014 (b) | 4,300,000 | 4,257,000 |
MMI Products, Inc., Series B, 11.25%, 4/15/2007 | 8,136,000 | 7,769,880 |
Neenah Foundry Co.: |
|
|
144A, 11.0%, 9/30/2010 | 13,570,000 | 14,994,850 |
144A, 13.0%, 9/30/2013 | 6,449,827 | 6,514,325 |
Newpage Corp., 9.943%**, 5/1/2012 (b) | 6,160,000 | 5,821,200 |
Omnova Solutions, Inc., 11.25%, 6/1/2010 | 13,185,000 | 14,107,950 |
Oregon Steel Mills, Inc., 10.0%, 7/15/2009 | 3,610,000 | 3,889,775 |
Oxford Automotive, Inc., 144A, 12.0%, 10/15/2010* | 11,410,330 | 1,026,930 |
Pliant Corp., 144A, 11.625%, 6/15/2009 (PIK) | 7 | 7 |
Portola Packaging, Inc., 8.25%, 2/1/2012 (b) | 6,850,000 | 4,795,000 |
Rockwood Specialties Group, Inc., 10.625%, 5/15/2011 | 1,130,000 | 1,231,700 |
TriMas Corp., 9.875%, 6/15/2012 | 16,073,000 | 13,179,860 |
UAP Holding Corp., Step-Up Coupon, 0% to 1/15/2008, 10.75% to 7/15/2012 (b) | 5,800,000 | 4,930,000 |
United States Steel Corp., 9.75%, 5/15/2010 | 9,910,000 | 10,876,225 |
247,506,991 | ||
Telecommunication Services 7.1% | ||
AirGate PCS, Inc., 7.349%**, 10/15/2011 | 3,425,000 | 3,527,750 |
American Cellular Corp., Series B, 10.0%, 8/1/2011 (b) | 3,343,000 | 3,643,870 |
AT&T Corp.: |
|
|
9.05%, 11/15/2011 | 8,118,000 | 9,142,897 |
9.75%, 11/15/2031 | 8,865,000 | 11,225,306 |
Cincinnati Bell, Inc.: |
|
|
7.25%, 7/15/2013 (b) | 7,050,000 | 7,490,625 |
8.375%, 1/15/2014 (b) | 11,315,000 | 11,145,275 |
Dobson Communications Corp., 8.875%, 10/1/2013 | 575,000 | 575,000 |
Insight Midwest LP, 9.75%, 10/1/2009 (b) | 3,530,000 | 3,609,425 |
LCI International, Inc., 7.25%, 6/15/2007 | 8,360,000 | 8,151,000 |
Level 3 Financing, Inc., 10.75%, 10/15/2011 (b) | 1,425,000 | 1,191,656 |
MCI, Inc., 8.735%, 5/1/2014 | 14,595,000 | 16,273,425 |
Nextel Communications, Inc., Series D, 7.375%, 8/1/2015 (b) | 29,225,000 | 31,287,291 |
Nextel Partners, Inc., 8.125%, 7/1/2011 | 5,540,000 | 5,983,200 |
Qwest Corp.: |
|
|
144A, 7.12%**, 6/15/2013 | 2,265,000 | 2,355,600 |
7.25%, 9/15/2025 | 7,275,000 | 6,783,938 |
Qwest Services Corp.: |
|
|
13.5%, 12/15/2010 | 18,370,000 | 21,033,650 |
14.0%, 12/15/2014 | 2,155,000 | 2,612,938 |
Rural Cellular Corp., 9.875%, 2/1/2010 | 285,000 | 299,250 |
SBA Telecom, Inc., Step-Up Coupon, 0% to 12/15/2007, 9.75% to 12/15/2011 (b) | 2,492,000 | 2,261,490 |
Securus Technologies, Inc., 11.0%, 9/1/2011 | 4,781,000 | 4,255,090 |
Triton PCS, Inc., 8.5%, 6/1/2013 | 860,000 | 819,150 |
Ubiquitel Operating Co., 9.875%, 3/1/2011 (b) | 2,315,000 | 2,569,650 |
US Unwired, Inc., Series B, 10.0%, 6/15/2012 | 6,181,000 | 7,108,150 |
163,345,626 | ||
Utilities 5.4% | ||
AES Corp., 144A, 8.75%, 5/15/2013 | 15,925,000 | 17,437,875 |
Allegheny Energy Supply Co. LLC, 144A, 8.25%, 4/15/2012 (b) | 19,375,000 | 21,796,875 |
Calpine Corp., 144A, 8.5%, 7/15/2010 | 1,425,000 | 1,018,875 |
CMS Energy Corp.: |
|
|
8.5%, 4/15/2011 (b) | 8,935,000 | 9,940,187 |
9.875%, 10/15/2007 | 13,450,000 | 14,626,875 |
DPL, Inc., 6.875%, 9/1/2011 | 3,053,000 | 3,289,608 |
Mission Energy Holding Co., 13.5%, 7/15/2008 | 23,764,000 | 27,982,110 |
Northwestern Corp., 5.875%, 11/1/2014 | 2,135,000 | 2,156,856 |
PSE&G Energy Holdings LLC: |
|
|
8.5%, 6/15/2011 (b) | 7,555,000 | 8,140,513 |
10.0%, 10/1/2009 | 15,573,000 | 17,286,030 |
123,675,804 | ||
Total Corporate Bonds (Cost $1,863,641,589) | 1,824,617,316 | |
| ||
Foreign Bonds — US$ Denominated 14.5% | ||
Consumer Discretionary 2.3% | ||
Iesy Repository GMBH, 144A, 10.375%, 2/15/2015 | 1,660,000 | 1,755,450 |
Jafra Cosmetics International, Inc., 10.75%, 5/15/2011 | 11,584,000 | 12,858,240 |
Kabel Deutschland GmbH, 144A, 10.625%, 7/1/2014 | 8,380,000 | 9,259,900 |
Shaw Communications, Inc., 8.25%, 4/11/2010 | 14,540,000 | 15,794,075 |
Telenet Group Holding NV, 144A, Step-Up Coupon, 0% to 12/15/2008, 11.5% to 6/15/2014 | 10,245,000 | 8,375,288 |
Vitro SA de CV, Series A, 144A, 12.75%, 11/1/2013 (b) | 5,605,000 | 5,212,650 |
53,255,603 | ||
Consumer Staples 0.1% | ||
Burns Philp Capital Property Ltd., 10.75%, 2/15/2011 | 3,082,000 | 3,451,840 |
Energy 2.3% | ||
Luscar Coal Ltd., 9.75%, 10/15/2011 | 9,945,000 | 10,740,600 |
OAO Gazprom, 144A, 9.625%, 3/1/2013 | 6,325,000 | 7,850,906 |
Petroleum Geo-Services ASA, 10.0%, 11/5/2010 | 25,759,187 | 28,850,290 |
Secunda International Ltd., 11.599%**, 9/1/2012 | 4,380,000 | 4,620,900 |
52,062,696 | ||
Financials 1.1% | ||
Conproca SA de CV, 12.0%, 6/16/2010 | 4,725,000 | 5,776,312 |
Doral Financial Corp., 4.45%**, 7/20/2007 | 5,050,000 | 4,740,314 |
Eircom Funding, 8.25%, 8/15/2013 (b) | 7,741,000 | 8,398,985 |
New ASAT (Finance) Ltd., 9.25%, 2/1/2011 | 5,000,000 | 3,475,000 |
Telecom Personal Bank SA, 1.89%, 10/15/2011 | 4,250,000 | 4,271,250 |
26,661,861 | ||
Health Care 0.2% | ||
Biovail Corp., 7.875%, 4/1/2010 (b) | 5,200,000 | 5,395,000 |
Industrials 2.5% | ||
CP Ships Ltd., 10.375%, 7/15/2012 | 9,480,000 | 10,759,800 |
Grupo Transportacion Ferroviaria Mexicana SA de CV: |
|
|
144A, 9.375%, 5/1/2012 | 5,540,000 | 5,983,200 |
10.25%, 6/15/2007 | 15,865,000 | 16,975,550 |
12.5%, 6/15/2012 | 5,819,000 | 6,750,040 |
J. Ray McDermott SA, 144A, 11.5%, 12/15/2013 | 5,915,000 | 6,772,675 |
LeGrand SA, 8.5%, 2/15/2025 | 4,660,000 | 5,592,000 |
Stena AB, 9.625%, 12/1/2012 | 4,285,000 | 4,649,225 |
Supercanal Holding SA, 11.5%, 5/15/2005* | 441,000 | 66,150 |
57,548,640 | ||
Materials 2.9% | ||
Cascades, Inc., 7.25%, 2/15/2013 | 10,485,000 | 10,196,663 |
Crown Euro Holdings SA, 10.875%, 3/1/2013 (b) | 920,000 | 1,067,200 |
ISPAT Inland ULC, 9.75%, 4/1/2014 | 9,018,000 | 10,460,880 |
Rhodia SA, 8.875%, 6/1/2011 (b) | 17,270,000 | 16,320,150 |
Sino-Forest Corp., 144A, 9.125%, 8/17/2011 | 220,000 | 237,600 |
Tembec Industries, Inc.: |
|
|
8.5%, 2/1/2011 (b) | 28,165,000 | 18,377,662 |
8.625%, 6/30/2009 (b) | 15,590,000 | 10,601,200 |
67,261,355 | ||
Sovereign Bonds 0.5% | ||
Federative Republic of Brazil, 8.875%, 10/14/2019 (b) | 2,558,000 | 2,777,988 |
Republic of Argentina, 8.28%, 12/31/2033 (PIK) (b) | 7,323,065 | 7,553,741 |
Republic of Turkey, 7.25%, 3/15/2015 (b) | 10,000 | 10,525 |
Republic of Venezuela, 10.75%, 9/19/2013 | 155,000 | 193,363 |
10,535,617 | ||
Telecommunication Services 2.6% | ||
Cell C Property Ltd., 144A, 11.0%, 7/1/2015 | 6,925,000 | 6,803,812 |
Embratel, Series B, 11.0%, 12/15/2008 | 4,482,000 | 5,120,685 |
Global Crossing UK Finance, 10.75%, 12/15/2014 (b) | 6,150,000 | 5,427,375 |
Grupo Iusacell SA de CV, Series B, 10.0%, 7/15/2004* | 1,590,000 | 1,351,500 |
Intelsat Bermuda Ltd., 144A, 8.695%**, 1/15/2012 | 3,745,000 | 3,810,538 |
Millicom International Cellular SA, 10.0%, 12/1/2013 | 7,961,000 | 8,219,732 |
Mobifon Holdings BV, 12.5%, 7/31/2010 (b) | 11,175,000 | 13,130,625 |
Nortel Networks Ltd., 6.125%, 2/15/2006 (b) | 15,225,000 | 15,225,000 |
59,089,267 | ||
Total Foreign Bonds — US$ Denominated (Cost $343,348,175) | 335,261,879 | |
| ||
Foreign Bonds — Non US$ Denominated 1.4% | ||
Consumer Discretionary 0.4% | ||
IESY Repository GMBH, 144A, 8.75%, 2/15/2015 EUR | 4,715,000 | 5,695,053 |
Victoria Acquisition III BV, 144A, 7.875%, 10/1/2014 EUR | 4,193,000 | 4,661,403 |
10,356,456 | ||
Industrials 0.2% | ||
Grohe Holdings GmbH, 144A, 8.625%, 10/1/2014 EUR | 4,023,000 | 4,291,098 |
Sovereign Bonds 0.8% | ||
Mexican Bonds, Series MI-10, 8.0%, 12/19/2013 MXN | 63,419,000 | 5,703,996 |
Republic of Argentina, 7.82%, 12/31/2033 (PIK) EUR | 10,511,374 | 13,068,930 |
18,772,926 | ||
Total Foreign Bonds — Non US$ Denominated (Cost $32,480,987) | 33,420,480 | |
| ||
Asset Backed 0.1% | ||
Golden Tree High Yield Opportunities LP, "D1", Series 1, 13.054%, 10/31/2007 (Cost $2,500,000) | 2,500,000 | 2,583,500 |
| ||
Convertible Bonds 0.2% | ||
Consumer Discretionary 0.2% | ||
HIH Capital Ltd.: |
|
|
144A, Series DOM, 7.5%, 9/25/2006 | 3,855,000 | 3,816,450 |
144A, Series EURO, 7.5%, 9/25/2006 | 655,000 | 648,450 |
Total Convertible Bonds (Cost $4,374,053) | 4,464,900 | |
|
| Value ($) |
|
| |
Preferred Stocks 0.3% | ||
Paxson Communications Corp. 14.25% (PIK) (Cost $9,496,806) | 989 | 6,727,672 |
| Principal Amount ($)(a) | Value ($) |
|
| |
Loan Participation 0.7% | ||
Intermet Corp., LIBOR plus .425%, 8.38%**, 3/31/2009 (Cost $15,785,294) | 16,500,000 | 16,280,005 |
| ||
|
| Value ($) |
|
| |
Warrants 0.0% | ||
Dayton Superior Corp. 144A* | 560 | 6 |
DeCrane Aircraft Holdings, Inc. 144A* | 16,090 | 0 |
Destia Communications, Inc. 144A* | 19,865 | 0 |
TravelCenters of America, Inc.* | 1,993 | 249 |
UIH Australia Pacific, Inc.* | 14,150 | 0 |
Total Warrants (Cost $8,386) | 255 | |
| Units | Value ($) |
|
| |
Other Investments 0.4% | ||
Hercules, Inc. (Bond Unit), 6.5%, 3/30/2005 | 10,240,000 | 7,884,800 |
SpinCycle, Inc. (Common Stock Unit)* | 187,460 | 206,206 |
SpinCycle, Inc. "F" (Common Stock Unit)* | 1,228 | 1,351 |
Total Other Investments (Cost $8,711,817) | 8,092,357 | |
| ||
|
| Value ($) |
|
| |
Common Stocks 0.2% | ||
Catalina Restaurant Group, Inc.* | 45,157 | 22,579 |
GEO Specialty Chemicals, Inc.* | 136,705 | 1,093,640 |
GEO Specialty Chemicals, Inc., 144A* | 12,448 | 99,584 |
IMPSAT Fiber Networks, Inc.* | 280,597 | 1,880,000 |
Oxford Automotive, Inc.* | 5,295,591 | 2,118,236 |
Total Common Stocks (Cost $19,641,852) | 5,214,039 | |
| ||
Securities Lending Collateral 16.4% | ||
Scudder Daily Assets Fund Institutional, 3.84% (d) (e) (Cost $377,367,010) | 377,367,010 | 377,367,010 |
| ||
Cash Equivalents 0.5% | ||
Scudder Cash Management QP Trust, 3.74% (c) (Cost $10,958,508) | 10,958,508 | 10,958,508 |
| % of Net Assets | Value ($) |
|
| |
Total Investment Portfolio (Cost $2,688,314,477)+ | 113.9 | 2,624,987,921 |
Other Assets and Liabilities, Net | (13.9) | (320,564,998) |
Net Assets | 100.0 | 2,304,422,923 |
* Non-income producing security. In case of a bond, generally denotes that the issuer has defaulted on the payment of principal or interest or has filed for bankruptcy. The following table represents bonds that are in default.
Security | Coupon | Maturity Date | Principal | Acquisition Cost ($) | Value ($) | |
Eaton Vance Corp. CDO II, Series C-X | 13.68% | 7/15/2012 | USD | 1,697,739 | 1,697,739 | 0 |
Grupo Iusacell SA de CV | 10.0% | 7/15/2004 | USD | 1,590,000 | 960,713 | 1,351,500 |
Intermet Corp. | 9.75% | 6/15/2009 | USD | 1,025,000 | 420,250 | 343,375 |
Oxford Automotive, Inc. | 12.0% | 10/15/2010 | USD | 11,410,330 | 1,174,878 | 1,026,930 |
Supercanal Holding SA | 11.5% | 5/15/2005 | USD | 441,000 | 44,100 | 66,150 |
| $4,297,680 | $2,787,955 | ||||
+ The cost for federal income tax purposes was $2,701,419,013. At September 30, 2005, net unrealized depreciation for all securities based on tax cost was 76,431,092. This consisted of aggregate gross unrealized appreciation for all securities in which there was an excess of value over tax cost of 27,102,594 and aggregate gross unrealized depreciation for all securities in which there was an excess of tax cost over value of $103,533,686
** Floating rate notes are securities whose yields vary with a designated market index or market rate, such as the coupon-equivalent of the US Treasury bill rate. These securities are shown at their current rate as of September 30, 2005.
(a) Principal amount is stated in US dollars unless otherwise noted.
(b) All or a portion of these securities were on loan (see Notes to Financial Statements). The value of all securities loaned at September 30, 2005 amounted to $370,276,452 which is 16.1% of net assets.
(c) Scudder Cash Management QP Trust is managed by Deutsche Investment Management Americas Inc. The rate shown is the annualized seven-day yield at period end.
(d) Scudder Daily Assets Fund Institutional, an affiliated fund, is also managed by Deutsche Investment Management, Inc. The rate shown is the annualized seven-day yield at period end.
(e) Represents collateral held in connection with securities lending.
144A: Security exempt from registration under Rule 144A of the Securities Act of 1933. These securities may be resold in transactions exempt from registration, normally to qualified institutional buyers.
CDO: Collateralized Debt Obligation
LIBOR: London InterBank Offer Rate
PIK: Denotes that all or a portion of interest or dividend is paid in kind.
PRIME: Interest rate charged by banks to their most creditworthy customers.
Currency Abbreviations | |
EUR | Euro |
MXN | Mexican Peso |
USD | United States Dollar |
The accompanying notes are an integral part of the financial statements.
|
Statement of Assets and Liabilities as of September 30, 2005 | |
Assets | |
Investments in Securities, at value: Investments in securities, at value (cost $2,299,988,959) — including $370,276,452 of securities loaned | $ 2,236,662,403 |
Investment in Scudder Cash Management QP Trust (cost $10,958,508) | 10,958,508 |
Investment in Scudder Daily Assets Fund Institutional (cost $377,367,010)* | 377,367,010 |
Total investments in securities, at value (cost $2,688,314,477) | 2,624,987,921 |
Receivable for investments sold | 25,846,661 |
Interest receivable | 54,027,846 |
Receivable for Fund shares sold | 1,756,154 |
Net receivable on closed forward foreign currency exchange contracts | 148,574 |
Unrealized appreciation on forward foreign currency exchange contracts | 1,825,038 |
Other assets | 44,757 |
Total assets | 2,708,636,951 |
Liabilities | |
Due to custodian bank | 5,971,391 |
Payable upon return of securities loaned | 377,367,010 |
Payable for investments purchased | 14,023,653 |
Payable for Fund shares redeemed | 3,514,390 |
Unrealized depreciation on forward foreign currency exchange contracts | 364,205 |
Accrued management fee | 1,021,488 |
Other accrued expenses and payables | 1,951,891 |
Total liabilities | 404,214,028 |
Net assets, at value | $ 2,304,422,923 |
Net Assets | |
Net assets consist of: Undistributed net investment income | 6,807,035 |
Net unrealized appreciation (depreciation) on: Investments | (63,326,556) |
Foreign currency related transactions | 1,735,158 |
Accumulated net realized gain (loss) | (1,503,302,660) |
Paid-in capital | 3,862,509,946 |
Net assets, at value | $ 2,304,422,923 |
* Represents cash collateral on securities loaned.
The accompanying notes are an integral part of the financial statements.
|
|
Statement of Assets and Liabilities as of September 30, 2005 (continued) | |
Net Asset Value | |
Class A Net Asset Value and redemption price(a) per share ($1,926,176,959 ÷ 355,252,139 outstanding shares of beneficial interest, $.01 par value, unlimited number of shares authorized) | $ 5.42 |
Maximum offering price per share (100 ÷ 95.5 of $5.42) | $ 5.68 |
Class B Net Asset Value, offering and redemption price(a) (subject to contingent deferred sales charge) per share ($212,491,004 ÷ 39,230,845 outstanding shares of beneficial interest, $.01 par value, unlimited number of shares authorized) | $ 5.42 |
Class C Net Asset Value, offering and redemption price(a) (subject to contingent deferred sales charge) per share ($152,631,940 ÷ 28,129,431 outstanding shares of beneficial interest, $.01 par value, unlimited number of shares authorized) | $ 5.43 |
Institutional Class Net Asset Value, offering and redemption price(a) per share ($13,123,020 ÷ 2,419,234 outstanding shares of beneficial interest, $.01 par value, unlimited number of shares authorized) | $ 5.42 |
a Redemption price per share for shares held less than 60 days is equal to net asset value less a 2% redemption fee.
The accompanying notes are an integral part of the financial statements.
|
|
Statement of Operations for the year ended September 30, 2005 | |
Investment Income | |
Income: Interest | $ 212,983,195 |
Interest — Scudder Cash Management QP Trust | 911,776 |
Securities lending income, including income from Scudder Daily Assets Fund Institutional, net of borrower rebates | 1,715,399 |
Dividends | 1,781,718 |
Total Income | 217,392,088 |
Expenses: Management fee | 13,149,375 |
Services to shareholders | 4,070,908 |
Distribution service fees | 8,820,738 |
Custodian and accounting fees | 103,733 |
Auditing | 77,376 |
Legal | 66,258 |
Trustees' fees and expenses | 71,832 |
Reports to shareholders | 246,222 |
Registration fees | 94,548 |
Interest expense | 17,799 |
Other | 259,037 |
Total expenses, before expense reductions | 26,977,826 |
Expense reductions | (264,809) |
Total expenses, after expense reductions | 26,713,017 |
Net investment income | 190,679,071 |
Realized and Unrealized Gain (Loss) on Investment Transactions | |
Net realized gain (loss) from: Investments | 21,995,543 |
Foreign currency related transactions | (2,904,846) |
| 19,090,697 |
Net unrealized appreciation (depreciation) during the period on: Investments | (21,032,543) |
Foreign currency related transactions | 2,354,763 |
| (18,677,780) |
Net gain (loss) on investment transactions | 412,917 |
Net increase (decrease) in net assets resulting from operations | $ 191,091,988 |
The accompanying notes are an integral part of the financial statements.
|
|
Statement of Changes in Net Assets | ||
Increase (Decrease) in Net Assets | Years Ended September 30, | |
2005 | 2004 | |
Operations: Net investment income | $ 190,679,071 | $ 199,582,457 |
Net realized gain (loss) on investment transactions | 19,090,697 | 38,710,784 |
Net unrealized appreciation (depreciation) during the period on investment transactions | (18,677,780) | 65,044,921 |
Net increase (decrease) in net assets resulting from operations | 191,091,988 | 303,338,162 |
Distributions to shareholders from: Net investment income: Class A | (161,574,962) | (164,679,269) |
Class B | (19,581,659) | (30,394,836) |
Class C | (11,820,788) | (12,906,907) |
Class I | — | (21,737) |
Institutional Class | (1,020,761) | (572,241) |
Fund share transactions: Proceeds from shares sold | 452,963,356 | 523,445,284 |
Net assets acquired in tax-free exchange | — | 319,028 |
Reinvestment of distributions | 114,761,251 | 122,233,160 |
Cost of shares redeemed | (708,240,636) | (790,061,582) |
Redemption fees | 46,694 | — |
Net increase (decrease) in net assets from Fund share transactions | (140,469,335) | (144,064,110) |
Increase (decrease) in net assets | (143,375,517) | (49,300,938) |
Net assets at beginning of period | 2,447,798,440 | 2,497,099,378 |
Net assets at end of period (including undistributed net investment income of $6,807,035 and $715,513, respectively) | $ 2,304,422,923 | $ 2,447,798,440 |
The accompanying notes are an integral part of the financial statements.
|
Class A | |||||
Years Ended September 30, | 2005 | 2004 | 2003 | 2002a | 2001 |
Selected Per Share Data | |||||
Net asset value, beginning of period | $ 5.43 | $ 5.23 | $ 4.62 | $ 5.18 | $ 6.34 |
Income (loss) from investment operations: Net investment incomeb | .44 | .44 | .44 | .53 | .64 |
Net realized and unrealized gain (loss) on investment transactions | .00*** | .22 | .61 | (.53) | (1.09) |
Total from investment operations | .44 | .66 | 1.05 | — | (.45) |
Less distributions from: Net investment income | (.45) | (.46) | (.44) | (.55) | (.68) |
Return of capital | — | — | — | (.01) | (.03) |
Total distributions | (.45) | (.46) | (.44) | (.56) | (.71) |
Redemption fees | .00*** | — | — | — | — |
Net asset value, end of period | $ 5.42 | $ 5.43 | $ 5.23 | $ 4.62 | $ 5.18 |
Total Return (%)c | 8.12e | 13.24 | 23.92 | (.60) | (7.68) |
Ratios to Average Net Assets and Supplemental Data | |||||
Net assets, end of period ($ millions) | 1,926 | 1,950 | 1,868 | 1,603 | 1,831 |
Ratio of expenses before expense reductions (%) | .96 | .94 | .97 | .96 | 1.11d |
Ratio of expenses after expense reductions (%) | .96 | .94 | .97 | .96 | 1.09d |
Ratio of net investment income (%) | 8.00 | 8.13 | 8.92 | 10.39 | 10.94 |
Portfolio turnover rate (%) | 113 | 162 | 149 | 154 | 69 |
a As required, effective October 1, 2001, the Fund adopted the provisions of the AICPA Audit and Accounting Guide for Investment Companies and began amortizing premium on debt securities. The effect of this change for the year ended September 30, 2002 was to decrease net investment income per share by $.04, increase net realized and unrealized gain (loss) per share by $.04, and decrease the ratio of net investment income to average net assets from 11.14% to 10.39%. Per share data and ratios for periods prior to October 1, 2001 have not been restated to reflect this change in presentation. b Based on average shares outstanding during the period. c Total return does not reflect the effect of any sales charges. d The ratios of operating expenses excluding costs incurred in connection with a fund complex reorganization before and after expense reductions were 1.09% and 1.09%, respectively. e Total return would have been lower had certain expenses not been reduced. *** Amount is less than $.005. | |||||
| |||||
Class B | |||||
Years Ended September 30, | 2005 | 2004 | 2003 | 2002a | 2001 |
Selected Per Share Data | |||||
Net asset value, beginning of period | $ 5.43 | $ 5.23 | $ 4.62 | $ 5.17 | $ 6.33 |
Income (loss) from investment operations: Net investment incomeb | .39 | .39 | .40 | .48 | .59 |
Net realized and unrealized gain (loss) on investment transactions | .01 | .22 | .61 | (.52) | (1.09) |
Total from investment operations | .40 | .61 | 1.01 | (.04) | (.50) |
Less distributions from: Net investment income | (.41) | (.41) | (.40) | (.50) | (.63) |
Return of capital | — | — | — | (.01) | (.03) |
Total distributions | (.41) | (.41) | (.40) | (.51) | (.66) |
Redemption fees | .00*** | — | — | — | — |
Net asset value, end of period | $ 5.42 | $ 5.43 | $ 5.23 | $ 4.62 | $ 5.17 |
Total Return (%)c | 7.45e | 12.09 | 22.88 | (1.23) | (8.50) |
Ratios to Average Net Assets and Supplemental Data | |||||
Net assets, end of period ($ millions) | 212 | 332 | 462 | 514 | 659 |
Ratio of expenses before expense reductions (%) | 1.81 | 1.75 | 1.82 | 1.79 | 1.94d |
Ratio of expenses after expense reductions (%) | 1.80 | 1.75 | 1.82 | 1.79 | 1.91d |
Ratio of net investment income (%) | 7.15 | 7.32 | 8.07 | 9.56 | 10.12 |
Portfolio turnover rate (%) | 113 | 162 | 149 | 154 | 69 |
a As required, effective October 1, 2001, the Fund adopted the provisions of the AICPA Audit and Accounting Guide for Investment Companies and began amortizing premium on debt securities. The effect of this change for the year ended September 30, 2002 was to decrease net investment income per share by $.04, increase net realized and unrealized gain (loss) per share by $.04, and decrease the ratio of net investment income to average net assets from 10.31% to 9.56%. Per share data and ratios for periods prior to October 1, 2001 have not been restated to reflect this change in presentation. b Based on average shares outstanding during the period. c Total return does not reflect the effect of any sales charges. d The ratios of operating expenses excluding costs incurred in connection with a fund complex reorganization before and after expense reductions were 1.91% and 1.91%, respectively. e Total return would have been lower had certain expenses not been reduced. *** Amount is less than $.005. | |||||
| |||||
Class C | |||||
Years Ended September 30, | 2005 | 2004 | 2003 | 2002a | 2001 |
Selected Per Share Data | |||||
Net asset value, beginning of period | $ 5.44 | $ 5.24 | $ 4.63 | $ 5.19 | $ 6.35 |
Income (loss) from investment operations: Net investment incomeb | .39 | .40 | .40 | .48 | .59 |
Net realized and unrealized gain (loss) on investment transactions | .01 | .22 | .61 | (.53) | (1.09) |
Total from investment operations | .40 | .62 | 1.01 | (.05) | (.50) |
Less distributions from: Net investment income | (.41) | (.42) | (.40) | (.50) | (.63) |
Return of capital | — | — | — | (.01) | (.03) |
Total distributions | (.41) | (.42) | (.40) | (.51) | (.66) |
Redemption fees | .00*** | — | — | — | — |
Net asset value, end of period | $ 5.43 | $ 5.44 | $ 5.24 | $ 4.63 | $ 5.19 |
Total Return (%)c | 7.49e | 12.12 | 23.11 | (1.61) | (8.46) |
Ratios to Average Net Assets and Supplemental Data | |||||
Net assets, end of period ($ millions) | 153 | 156 | 165 | 127 | 119 |
Ratio of expenses before expense reductions (%) | 1.75 | 1.71 | 1.82 | 1.79 | 1.98d |
Ratio of expenses after expense reductions (%) | 1.74 | 1.71 | 1.82 | 1.79 | 1.95d |
Ratio of net investment income (%) | 7.21 | 7.36 | 8.07 | 9.56 | 10.09 |
Portfolio turnover rate (%) | 113 | 162 | 149 | 154 | 69 |
a As required, effective October 1, 2001, the Fund adopted the provisions of the AICPA Audit and Accounting Guide for Investment Companies and began amortizing premium on debt securities. The effect of this change for the year ended September 30, 2002 was to decrease net investment income per share by $.04, increase net realized and unrealized gain (loss) per share by $.04, and decrease the ratio of net investment income to average net assets from 10.31% to 9.56%. Per share data and ratios for periods prior to October 1, 2001 have not been restated to reflect this change in presentation. b Based on average shares outstanding during the period. c Total return does not reflect the effect of sales charges. d The ratios of operating expenses excluding costs incurred in connection with a fund complex reorganization before and after expense reductions were 1.95% and 1.95%, respectively. e Total return would have been lower had certain expenses not been reduced. *** Amount is less than $.005. | |||||
| ||||
Institutional Class | ||||
Years Ended September 30, | 2005 | 2004 | 2003 | 2002a |
Selected Per Share Data | ||||
Net asset value, beginning of period | $ 5.43 | $ 5.23 | $ 4.63 | $ 4.65 |
Income (loss) from investment operations: Net investment incomeb | .46 | .45 | .44 | .08 |
Net realized and unrealized gain (loss) on investment transactions | .00*** | .22 | .62 | (.02) |
Total from investment operations | .46 | .67 | 1.06 | .06 |
Less distributions from: Net investment income | (.47) | (.47) | (.46) | (.08) |
Redemption fees | .00*** | — | — | — |
Net asset value, end of period | $ 5.42 | $ 5.43 | $ 5.23 | $ 4.63 |
Total Return (%) | 8.49c | 13.32 | 24.33 | 1.14** |
Ratios to Average Net Assets and Supplemental Data | ||||
Net assets, end of period ($ millions) | 13 | 10 | 1 | .001 |
Ratio of expenses before expense reductions (%) | .66 | .65 | .83 | .82* |
Ratio of expenses after expense reductions (%) | .59 | .65 | .83 | .82* |
Ratio of net investment income (%) | 8.36 | 8.42 | 9.06 | 14.14* |
Portfolio turnover rate (%) | 113 | 162 | 149 | 154 |
a For the period from August 19, 2002 (commencement of sales of Institutional Class shares) to September 30, 2002. b Based on average shares outstanding during the period. c Total return would have been lower had certain expenses not been reduced. * Annualized ** Not annualized *** Amount is less than $.005. | ||||
|
A. Significant Accounting Policies
Scudder High Income Fund (the "Fund"), is a diversified series of the Scudder High Income Series (the "Trust") which is registered under the Investment Company Act of 1940, as amended (the "1940 Act"), as an open-end management investment company organized as a Massachusetts business trust.
The Fund offers multiple classes of shares which provide investors with different purchase options. Class A shares are offered to investors subject to an initial sales charge. Class B shares are offered without an initial sales charge but are subject to higher ongoing expenses than Class A shares and a contingent deferred sales charge payable upon certain redemptions. Class B shares automatically convert to Class A shares six years after issuance. Class C shares are offered to investors without an initial sales charge and are subject to higher ongoing expenses than Class A shares and a contingent deferred sales charge payable upon certain redemptions within one year of purchase. Class C shares do not convert into another class. Institutional Class shares are offered to a limited group of investors, are not subject to initial or contingent deferred sales charges and have lower ongoing expenses than other classes.
Investment income, realized and unrealized gains and losses, and certain fund-level expenses and expense reductions, if any, are borne pro rata on the basis of relative net assets by the holders of all classes of shares, except that each class bears certain expenses unique to that class such as distribution service fees, services to shareholders and certain other class-specific expenses. Differences in class-level expenses may result in payment of different per share dividends by class. All shares of the Fund have equal rights with respect to voting subject to class-specific arrangements.
The Fund's financial statements are prepared in accordance with accounting principles generally accepted in the United States of America which require the use of management estimates. Actual results could differ from those estimates. The policies described below are followed consistently by the Fund in the preparation of its financial statements.
Security Valuation. Investments are stated at value determined as of the close of regular trading on the New York Stock Exchange on each day the exchange is open for trading. Equity securities are valued at the most recent sale price or official closing price reported on the exchange (US or foreign) or over-the-counter market on which the security is traded most extensively. Securities for which no sales are reported are valued at the calculated mean between the most recent bid and asked quotations on the relevant market or, if a mean cannot be determined, at the most recent bid quotation.
Debt securities are valued by independent pricing services approved by the Trustees of the Fund. If the pricing services are unable to provide valuations, the securities are valued at the most recent bid quotation or evaluated price, as applicable, obtained from a broker-dealer. Such services may use various pricing techniques which take into account appropriate factors such as yield, quality, coupon rate, maturity, type of issue, trading characteristics and other data, as well as broker quotes.
Money market instruments purchased with an original or remaining maturity of sixty days or less, maturing at par, are valued at amortized cost. Investments in open-end investment companies and Scudder Cash Management QP Trust are valued at their net asset value each business day.
Securities and other assets for which market quotations are not readily available or for which the above valuation procedures are deemed not to reflect fair value are valued in a manner that is intended to reflect their fair value as determined in accordance with procedures approved by the Trustees.
Securities Lending. The Fund may lend securities to financial institutions. The Fund retains beneficial ownership of the securities it has loaned and continues to receive interest and dividends paid by the securities and to participate in any changes in their market value. The Fund requires the borrowers of the securities to maintain collateral with the Fund consisting of liquid, unencumbered assets having a value at least equal to the value of the securities loaned. The Fund may invest the cash collateral into a joint trading account in an affiliated money market fund pursuant to Exemptive Orders issued by the SEC. The Fund receives compensation for lending its securities either in the form of fees or by earning interest on invested cash collateral net of fees paid to the lending agent Either the Fund or the borrower may terminate the loan. The Fund is subject to all investment risks associated with the value of any cash collateral received, including, but not limited to, interest rate, credit and liquidity risk associated with such investments.
Foreign Currency Translations. The books and records of the Fund are maintained in US dollars. Investment securities and other assets and liabilities denominated in a foreign currency are translated into US dollars at the prevailing exchange rates at period end. Purchases and sales of investment securities, income and expenses are translated into US dollars at the prevailing exchange rates on the respective dates of the transactions.
Net realized and unrealized gains and losses on foreign currency transactions represent net gains and losses between trade and settlement dates on securities transactions, the disposition of forward foreign currency exchange contracts and foreign currencies, and the difference between the amount of net investment income accrued and the US dollar amount actually received. That portion of both realized and unrealized gains and losses on investments that results from fluctuations in foreign currency exchange rates is not separately disclosed but is included with net realized and unrealized gains and losses on investment securities.
Forward Foreign Currency Exchange Contracts. A forward foreign currency exchange contract ("forward currency contract") is a commitment to purchase or sell a foreign currency at the settlement date at a negotiated rate. The Fund may enter into forward currency contracts in order to hedge its exposure to changes in foreign currency exchange rates on its foreign currency denominated portfolio holdings and to facilitate transactions in foreign currency denominated securities. The Fund may also engage in forward currency contracts for non-hedging purposes.
Forward currency contracts are valued at the prevailing forward exchange rate of the underlying currencies and unrealized gain (loss) is recorded daily. Sales and purchases of forward currency contracts having the same settlement date and broker are offset and any gain (loss) is realized on the date of offset; otherwise, gain (loss) is realized on settlement date. Realized and unrealized gains and losses which represent the difference between the value of a forward currency contract to buy and a forward currency contract to sell are included in net realized and unrealized gain (loss) from foreign currency related transactions.
Certain risks may arise upon entering into forward currency contracts from the potential inability of counterparties to meet the terms of their contracts. Additionally, when utilizing forward currency contracts to hedge, the Fund gives up the opportunity to profit from favorable exchange rate movements during the term of the contract.
Loan Participations/Assignments. The Fund may invest in US dollar-denominated fixed and floating rate loans ("Loans") arranged through private negotiations between a foreign sovereign entity and one or more financial institutions ("Lenders"). The Fund invests in such Loans in the form of participations in Loans ("Participations") or assignments of all or a portion of Loans from third parties ("Assignments"). Participations typically result in the Fund having a contractual relationship only with the Lender, not with the sovereign borrower. The Fund has the right to receive payments of principal, interest and any fees to which it is entitled from the Lender selling the Participation and only upon receipt by the Lender of the payments from the borrower. In connection with purchasing Participations, the Fund generally has no right to enforce compliance by the borrower with the terms of the loan agreement relating to the Loan, nor any rights of set-off against the borrower, and the Fund will not benefit directly from any collateral supporting the Loan in which it has purchased the Participation. As a result, the Fund assumes the credit risk of both the borrower and the Lender that is selling the Participation.
When-Issued/Delayed Delivery Securities. The Fund may purchase securities with delivery or payment to occur at a later date beyond the normal settlement period. At the time the Fund enters into a commitment to purchase a security, the transaction is recorded and the value of the security is reflected in the net asset value. The price of such security and the date when the security will be delivered and paid for are fixed at the time the transaction is negotiated. The value of the security may vary with market fluctuations. No interest accrues to the Fund until payment takes place. At the time the Fund enters into this type of transaction it is required to segregate cash or other liquid assets at least equal to the amount of the commitment.
Certain risks may arise upon entering into when-issued or delayed delivery securities from the potential inability of counterparties to meet the terms of their contracts or if the issuer does not issue the securities due to political, economic, or other factors. Additionally, losses may arise due to changes in the value of the underlying securities.
Federal Income Taxes. The Fund's policy is to comply with the requirements of the Internal Revenue Code, as amended, which are applicable to regulated investment companies, and to distribute all of its taxable income to its shareholders. Accordingly, the Fund paid no federal income taxes and no federal income tax provision was required.
At September 30, 2005, the Fund had a net tax basis capital loss carryforward of approximately $1,450,736,000 which may be applied against any realized net taxable capital gains of each succeeding year until fully utilized or until September 30, 2007 ($39,695,000), September 30, 2008 ($126,550,000), September 30, 2009 ($173,248,000), September 30, 2010 ($283,200,000), September 30, 2011 ($620,426,000), September 30, 2012 ($194,011,000), and September 30, 2013 (13,606,000) the respective expiration dates, whichever occurs first. In addition, from November 1, 2004 through September 30, 2005, the Fund incurred approximately $39,462,000 of net realized capital losses. As permitted by tax regulations, the Fund intends to elect to defer these losses and treat them as arising in the fiscal year ended September 30, 2006.
Distribution of Income and Gains. Net investment income of the Fund is declared and distributed to shareholders monthly. Net realized gains from investment transactions, in excess of available capital loss carryforwards, would be taxable to the Fund if not distributed, and, therefore, will be distributed to shareholders at least annually.
The timing and characterization of certain income and capital gain distributions are determined annually in accordance with federal tax regulations which may differ from accounting principles generally accepted in the United States of America. These differences primarily relate to premium amortization on debt securities. As a result, net investment income (loss) and net realized gain (loss) on investment transactions for a reporting period may differ significantly from distributions during such period. Accordingly, the Fund may periodically make reclassifications among certain of its capital accounts without impacting the net asset value of the Fund.
At September 30, 2005, the Fund's components of distributable earnings (accumulated losses) on a tax-basis are as follows:
Undistributed ordinary income | $ 8,437,292 |
Capital loss carryforwards | $ (1,450,736,000) |
Net unrealized appreciation (depreciation) on investments | $ (76,431,092) |
In addition, the tax character of distributions paid to shareholders by the Fund is summarized as follows:
| Years Ended September 30, | |
| 2005 | 2004 |
Distributions from ordinary income* | $ 193,998,170 | $ 208,574,990 |
* For tax purposes short-term capital gain distributions are considered ordinary income distributions.
Redemption Fees. Effective February 1, 2005, the Fund imposes a redemption fee of 2% of the total redemption amount on the Fund shares redeemed or exchanged within 60 days of buying them, either by purchase or exchange. This fee is assessed and retained by the Fund for the benefit of the remaining shareholders. The redemption fee is accounted for as an addition to paid-in-capital.
Expenses. Expenses of the Trust arising in connection with a specific fund are allocated to that fund. Other Trust expenses which cannot be directly attributed to a Fund are apportioned among the Funds in the Trust.
Contingencies. In the normal course of business, the Fund may enter into contracts with service providers that contain general indemnification clauses. The Fund's maximum exposure under these arrangements is unknown as this would involve future claims that may be made against the Fund that have not yet been made. However, based on experience, the Fund expects the risk of loss to be remote.
Other. Investment transactions are accounted for on a trade date plus one basis for daily net asset value calculations. However, for financial reporting purposes, investment security transactions are reported on trade date. Interest income is recorded on the accrual basis. Dividend income is recorded on the ex-dividend date. Realized gains and losses from investment transactions are recorded on an identified cost basis. All premiums and discounts are amortized/accreted for financial reporting purposes, with the exception of securities bought in default.
B. Purchases and Sales of Securities
During the year ended September 30, 2005, purchases and sales of investment securities (excluding short-term investments) aggregated $2,898,241,708 and $3,040,163,346, respectively.
C. Related Parties
Management Agreement. Under the Management Agreement with Deutsche Investment Management Americas Inc. ("DeIM" or the "Advisor"), an indirect, wholly owned subsidiary of Deutsche Bank AG, the Advisor directs the investments of the Fund in accordance with its investment objectives, policies and restrictions. The Advisor determines the securities, instruments and other contracts relating to investments to be purchased, sold or entered into by the Fund. In addition to portfolio management services, the Advisor provides certain administrative services in accordance with the Management Agreement. The management fee payable under the Management Agreement is equal to an annual rate of 0.58% of the first $250,000,000 of the Fund's average daily net assets, 0.55% of the next $750,000,000 of such net assets, 0.53% of the next $1,500,000,000 of such net assets, 0.51% of the next $2,500,000,000 of such net assets, 0.48% of the next $2,500,000,000 of such net assets, 0.46% of the next $2,500,000,000 of such net assets, 0.44% of the next $2,500,000,000 of such net assets and 0.42% of such net assets in excess of $12,500,000,000, computed and accrued daily and payable monthly. Accordingly, for the year ended September 30, 2005, the fee pursuant to the Management Agreement was equivalent to an annualized effective rate of 0.54% of the Fund's average daily net assets.
Effective October 1, 2003 through January 31, 2006, the Advisor has contractually agreed to waive all or a portion of its management fee and reimburse or pay certain operating expenses of the Fund to the extent necessary to maintain the operating expenses of each class at 0.90%, 0.90%, 0.90% and 0.59% of average daily net assets for Class A, B, C and Institutional Class shares, respectively (excluding certain expenses such as Rule 12b-1 distribution and/or service fees, trustee and trustee counsel fees, extraordinary expenses, taxes, brokerage and interest and organizational and offering expenses). Under these agreements, the Advisor waived $153,005, $17,127, $12,336 and $1,143 of expenses for Class A, B, C and Institutional Class shares, respectively.
Service Provider Fees. Scudder Investments Service Company ("SISC"), an affiliate of the Advisor, is the transfer, dividend-paying agent and shareholder service agent for Class A, B, C and Institutional shares of the Fund. Pursuant to a sub-transfer agency agreement between SISC and DST Systems, Inc. ("DST"), SISC has delegated certain transfer agent and dividend paying agent functions to DST. SISC compensates DST out of the shareholder servicing fee it receives from the Fund. For the year ended September 30, 2005, the amount charged to the Fund by SISC were as follows:
Service Provider Fees | Total Aggregated | Waived | Unpaid at September 30, 2005 |
Class A | $ 2,412,502 | $ — | $ 671,607 |
Class B | 530,461 | — | 164,061 |
Class C | 218,780 | — | 61,152 |
Institutional Class | 6,541 | 6,541 | — |
| $ 3,168,284 | $ 6,541 | $ 896,820 |
Distribution Service Agreement. Under the Distribution Service Agreement, in accordance with Rule 12b-1 under the 1940 Act, Scudder Distributors, Inc. ("SDI"), a subsidiary of the Advisor, receives a fee ("Distribution Fee") of 0.75% of average daily net assets of Class B and C shares. Pursuant to the agreement, SDI enters into related selling group agreements with various firms at various rates for sales of Class B and C shares. For the year ended September 30, 2005, the Distribution Fee was as follows:
Distribution Fee | Total Aggregated | Unpaid at September 30, 2005 |
Class B | $ 2,031,129 | $ 135,007 |
Class C | 1,204,966 | 98,801 |
| $ 3,236,095 | $ 233,808 |
In addition, SDI provides information and administrative services ("Service Fee") to Class A, B and C shareholders at an annual rate of up to 0.25% of average daily net assets for each such class. SDI in turn has various agreements with financial services firms that provide these services and pay these fees based upon the assets of shareholder accounts the firms service. For the year ended September 30, 2005, the Service Fee was as follows:
Service Fee | Total Aggregated | Unpaid at September 30, 2005 | Annual Effective Rate |
Class A | $ 4,525,815 | $ 400,645 | .23% |
Class B | 664,030 | 87,436 | .25% |
Class C | 394,798 | 42,690 | .25% |
| $ 5,584,643 | $ 530,771 |
|
Underwriting Agreement and Contingent Deferred Sales Charge. SDI is the principal underwriter for the Fund. Underwriting commissions paid in connection with the distribution of Class A shares for the year ended September 30, 2005, aggregated $348,581.
In addition, SDI receives any contingent deferred sales charge ("CDSC") from Class B share redemptions occurring within six years of purchase and Class C share redemptions occurring within one year of purchase. There is no such charge upon redemption of any share appreciation or reinvested dividends. The CDSC is based on declining rates ranging from 4% to 1% for Class B and 1% for Class C, of the value of the shares redeemed. For the year ended September 30, 2005, the CDSC for Class B and C shares aggregated $582,144 and $20,706, respectively. A deferred sales charge of up to .85% is assessed on certain redemptions of Class A shares. For the year ended September 30, 2005, SDI received $12,057.
Typesetting and Filing Service Fees. Under an agreement with DeIM the Advisor is compensated for providing typesetting and regulatory filing services to the Fund. For the year ended September 30, 2005, the amount charged to the Fund by DeIM included in reports to shareholders aggregated $23,440, of which $6,720 is unpaid at September 30, 2005.
Trustees' Fees and Expenses. The Fund pays each Trustee not affiliated with the Advisor retainer fees plus specified amounts for attended board and committee meetings.
Scudder Cash Management QP Trust. Pursuant to an Exemptive Order issued by the SEC, the Fund may invest in the Scudder Cash Management QP Trust (the "QP Trust") and other affiliated funds managed by the Advisor. The QP Trust seeks to provide as high a level of current income as is consistent with the preservation of capital and the maintenance of liquidity. The QP Trust does not pay the Advisor a management fee for the affiliated funds' investments in the QP Trust.
D. Investing in High Yield Securities
Investing in high yield securities may involve greater risks and considerations not typically associated with investing in US Government bonds and other high quality fixed-income securities. These securities are non-investment grade securities, often referred to as "junk bonds." Economic downturns may disrupt the high yield market and impair the ability of issuers to repay principal and interest. Also, an increase in interest rates would likely have an adverse impact on the value of such obligations. Moreover, high yield securities may be less liquid due to the extent that there is no established retail secondary market and because of a decline in the value of such securities.
E. Expense Reductions
For the year ended September 30, 2005, the Advisor agreed to reimburse the Fund $24,449, which represents a portion of the fee savings expected to be realized by the Advisor related to the outsourcing by the Advisor of certain administrative services to an affiliated service provider.
In addition, the Fund has entered into an arrangement with its custodian whereby credits realized as a result of uninvested cash balances are used to reduce a portion of the Fund's custodian expenses. During the year ended September 30, 2005, the Fund's custodian fees were reduced by $50,208 for custody credits earned.
F. Forward Foreign Currency Exchange Contracts
The Fund had the following open forward foreign currency exchange contracts at September 30, 2005:
Contracts to Deliver | In Exchange For | Settlement Date | Net Unrealized Appreciation | ||
USD | 1,896,725 | MXN | 20,696,877 | 11/10/2005 | $ 14,853 |
USD | 1,407,542 | MXN | 15,409,486 | 11/10/2005 | 15,689 |
EUR | 1,425,306 | USD | 1,729,837 | 11/16/2005 | 12,808 |
EUR | 29,547,692 | USD | 37,424,959 | 11/18/2005 | 1,754,951 |
EUR | 810,980 | USD | 992,899 | 11/18/2005 | 15,826 |
EUR | 464,411 | USD | 572,138 | 1/12/2006 | 10,911 |
Total unrealized appreciation | $ 1,825,038 | ||||
Contracts to Deliver | In Exchange For | Settlement Date | Net Unrealized Depreciation | ||
MXN | 99,332,287 | USD | 8,810,193 | 11/10/2005 | $ (364,205) |
Currency Abbreviations | |
EUR | Euro |
MXN | Mexico Peso |
USD | United States Dollar |
G. Line of Credit
The Fund and several other affiliated funds (the "Participants") share in a $1.1 billion revolving credit facility administered by J.P. Morgan Chase Bank for temporary or emergency purposes, including the meeting of redemption requests that otherwise might require the untimely disposition of securities. The Participants are charged an annual commitment fee which is allocated, based upon net assets, among each of the Participants. Interest is calculated at the Federal Funds Rate plus 0.5 percent. The Fund may borrow up to a maximum of 33 percent of its net assets under the agreement.
H. Share Transactions
The following table summarizes share and dollar activity in the Fund:
| Year Ended | Year Ended | ||
| Shares | Dollars | Shares | Dollars |
Shares sold | ||||
Class A | 65,159,801 | $ 359,873,770 | 79,009,775 | $ 424,259,682 |
Class B | 5,380,467 | 29,659,812 | 8,779,256 | 47,108,253 |
Class C | 7,980,932 | 44,029,436 | 8,035,867 | 43,236,507 |
Class I* | — | — | 64,219 | 343,465 |
Institutional Class | 3,500,299 | 19,400,338 | 1,581,002 | 8,497,377 |
|
| $ 452,963,356 |
| $ 523,445,284 |
Shares issued in tax-free exchange | ||||
Institutional Class | — | $ — | 59,631 | $ 319,028 |
Shares issued to shareholders in reinvestment of distributions | ||||
Class A | 17,700,999 | $ 97,118,260 | 18,416,283 | $ 98,812,152 |
Class B | 1,812,045 | 9,947,349 | 2,841,255 | 15,228,701 |
Class C | 1,235,601 | 6,788,503 | 1,417,537 | 7,614,634 |
Class I* | — | — | 4,072 | 21,737 |
Institutional Class | 164,734 | 907,139 | 103,605 | 555,936 |
|
| $ 114,761,251 |
| $ 122,233,160 |
Shares redeemed | ||||
Class A | (86,456,146) | $ (476,673,367) | (95,656,338) | $ (513,769,559) |
Class B | (29,108,615) | (160,616,561) | (38,923,029) | (209,168,259) |
Class C | (9,798,150) | (53,832,066) | (12,271,429) | (65,928,919) |
Class I* | — | — | (106,006) | (563,469) |
Institutional Class | (3,056,304) | (17,118,642) | (117,265) | (631,376) |
|
| $ (708,240,636) |
| $ (790,061,582) |
Redemption fees | — | $ 46,694 | — | $ — |
Net increase (decrease) | ||||
Class A | (3,595,346) | $ (19,650,882) | 1,769,720 | $ 9,302,275 |
Class B | (21,916,103) | (121,004,325) | (27,302,518) | (146,831,305) |
Class C | (581,617) | (3,002,963) | (2,818,025) | (15,077,778) |
Class I* | — | — | (37,715) | (198,267) |
Institutional Class | 608,729 | 3,188,835 | 1,626,973 | 8,740,965 |
|
| $ (140,469,335) |
| $ (144,064,110) |
* On August 13, 2004, Class I shares of the Fund consolidated with Institutional Class shares.
I. Regulatory Matters and Litigation
Since at least July 2003, federal, state and industry regulators have been conducting ongoing inquiries and investigations ("inquiries") into the mutual fund industry, and have requested information from numerous mutual fund companies, including Scudder Investments. The funds' advisors have been cooperating in connection with these inquiries and are in discussions with these regulators concerning proposed settlements. Publicity about mutual fund practices arising from these industry-wide inquiries serves as the general basis of a number of private lawsuits against the Scudder funds. These lawsuits, which previously have been reported in the press, involve purported class action and derivative lawsuits, making various allegations and naming as defendants various persons, including certain Scudder funds, the funds' investment advisors and their affiliates, and certain individuals, including in some cases fund Trustees/Directors, officers, and other parties. Each Scudder fund's investment advisor has agreed to indemnify the applicable Scudder funds in connection with these lawsuits, or other lawsuits or regulatory actions that may be filed making allegations similar to these lawsuits regarding market timing, revenue sharing, fund valuation or other subjects arising from or related to the pending inquiries. It is not possible to determine with certainty what the outcome of these inquiries will be or what the effect, if any, would be on the funds or their advisors. Based on currently available information, however, the funds' investment advisors believe the likelihood that the pending lawsuits and any regulatory settlements will have a material adverse financial impact on a Scudder fund is remote and such actions are not likely to materially affect their ability to perform under their investment management agreements with the Scudder funds.
|
To the Shareholders and Board of Trustees of Scudder High Income Fund:
We have audited the accompanying statement of assets and liabilities of Scudder High Income Fund (the Fund), including the schedule of investments, as of September 30, 2005, and the related statement of operations for the year then ended, the statements of changes in net assets for each of the two years in the period then ended, and the financial highlights for each of the five years in the period then ended. These financial statements and financial highlights are the responsibility of the Fund's management. Our responsibility is to express an opinion on these financial statements and financial highlights based on our audits.
We conducted our audit in accordance with the standards of the Public Company Accounting Oversight Board (United States). Those standards require that we plan and perform the audit to obtain reasonable assurance about whether the financial statements and financial highlights are free of material misstatement. We were not engaged to perform an audit of the Fund's internal control over financial reporting. Our audit included consideration of internal control over financial reporting as a basis for designing audit procedures that are appropriate in the circumstances, but not for the purpose of expressing an opinion on the effectiveness of the Fund's internal control over financial reporting. Accordingly, we express no such opinion. An audit also includes examining, on a test basis, evidence supporting the amounts and disclosures in the financial statements and financial highlights, assessing the accounting principles used and significant estimates made by management, and evaluating the overall financial statement presentation. Our procedures included confirmation of securities owned as of September 30, 2005 by correspondence with the custodian and brokers or by other appropriate auditing procedures where replies from brokers were not received. We believe that our audits provide a reasonable basis for our opinion.
In our opinion, the financial statements and financial highlights referred to above present fairly, in all material respects, the financial position of Scudder High Income Fund at September 30, 2005, the results of its operations for the year then ended, the changes in its net assets for each of the two years in the period then ended, and the financial highlights for each of the five years in the period then ended, in conformity with U.S. generally accepted accounting principles.
Boston, Massachusetts
November 9, 2005
|
For corporate shareholders 1% of the income dividends paid during the Fund's fiscal year ended September 30, 2005, qualified for the dividends received deduction.
For federal income tax purposes, the Fund designates $1,959,900, or the maximum allowable under tax law, as qualified dividend income.
Please consult a tax advisor if you have questions about federal or state income tax laws, or on how to prepare your tax returns. If you have specific questions about your account, please call 1-800-SCUDDER.
|
The Board of Trustees, including the Independent Trustees, approved the renewal of your Fund's investment management agreement (the "Agreement") with Deutsche Investment Management Americas Inc. ("DeIM" or the "Advisor") in September 2005. As part of its review process, the Board requested and evaluated all information it deemed reasonably necessary to evaluate the Agreement. Over the course of several months, the Contract Review Committee, in coordination with the Fixed-Income Oversight Committee and the Operations Committee of the Board, reviewed comprehensive materials received from the Advisor, independent third parties and independent counsel. The Board also received extensive information throughout the year regarding performance and operating results of the Fund. After their review of the information received, the Committees presented their findings and recommendations to the Independent Trustees as a group. The Independent Trustees then reviewed the Committees' findings and recommendations and presented their recommendations to the full Board.
In connection with the contract review process, the various Committees and the Board considered the factors discussed below, among others. The Board also considered that the Advisor and its predecessors have managed the Fund since its inception, and the Board believes that a long-term relationship with a capable, conscientious advisor is in the best interests of the Fund. The Board considered, generally, that shareholders invested in the Fund, or approved the investment management agreement for the Fund, knowing that the Advisor managed the Fund and knowing the investment management fee schedule. In connection with recent and ongoing efforts by Deutsche Bank to restructure its US mutual fund business, which resulted in turnover of senior management and other personnel of the Advisor, the Board considered Deutsche Bank's commitment that it will devote to the Advisor and its affiliates all attention and resources that are necessary to provide the Fund with top-quality investment management and shareholder, administrative and product distribution services.
Nature, Quality and Extent of Services. The Board considered the nature, extent and quality of services provided under the Agreement, including portfolio management services and administrative services. The Board considered the experience and skills of senior management and investment personnel, the resources made available to such personnel, the ability of the Advisor to attract and retain high-quality personnel, and the organizational depth and stability of the Advisor. The Board reviewed the Fund's performance over short-term and long-term periods and compared those returns to various agreed-upon performance measures, including market indices and peer groups. The Board considered whether investment results were consistent with the Fund's investment objective and policies. The Board also noted that it has put a process into place of identifying "Focus Funds" (e.g., funds performing poorly relative to their peer group), and receives more frequent reporting and information from the Advisor regarding such funds, along with the Advisor's remedial plans to address underperformance. The Board believes this process is an effective manner of addressing poorly performing funds at this time.
On the basis of this evaluation and the ongoing review of investment results by the Fixed-Income Oversight Committee, the Board concluded that the nature, quality and extent of services provided by the Advisor historically have been and continue to be satisfactory, and that the Fund's performance over time was satisfactory.
Fees and Expenses. The Board considered the Fund's management fee rate, operating expenses and total expense ratios, and compared management fees to a peer group and total expenses to a broader peer universe based on information and data supplied by Lipper Inc. ("Lipper"). For purposes of this comparison, the Board relied on historical data compiled by Lipper for the peer funds and the Advisor's estimate of current expenses for the Fund (including the effect of the Fund's then-current expense cap). The information provided to the Board showed that the Fund's management fee rate was at the median of the peer group, and that the Fund's total expense ratio was below the median of the peer universe for Class A, B, C and Institutional shares. The Board also considered the Fund's management fee rate as compared to fees charged by the Advisor and certain of its affiliates for comparable mutual funds and for similarly managed institutional accounts. With respect to institutional accounts, the Board noted that (i) both the mix of services provided and the level of responsibility required under the Agreement were significantly greater as compared to the Advisor's obligations for similarly managed institutional accounts; and (ii) the management fees of institutional accounts are less relevant to the Board's consideration because they reflect significantly different competitive forces than those in the mutual fund marketplace. With respect to other comparable Scudder Funds, the Board considered differences in fund and fee structures among the various legacy organizations. The Board took into account the Advisor's commitment to cap total expenses through January 31, 2006.
On the basis of the information provided, the Board concluded that management fees were reasonable and appropriate in light of the nature, quality and extent of services provided by the Advisor.
Profitability. The Board reviewed detailed information regarding revenues received by the Advisor under the Agreement. The Board considered the estimated costs and pre-tax profits realized by the Advisor from advising the Scudder Funds, as well as estimates of the pre-tax profits attributable to managing the Fund in particular. The Board also received information regarding the estimated enterprise-wide profitability of the Scudder organization with respect to all fund services in totality and by fund. The Board reviewed DeIM's methodology in allocating its costs to the management of the Fund. Although the Board noted the inherently subjective nature of any allocation methodology, the Board received an attestation report from an accounting firm affirming that the allocation methods were consistently applied and were based upon practices commonly used in the investment management industry. Based on the information provided, the Board concluded that the pre-tax profits realized by DeIM in connection with the management of the Fund were not unreasonable.
Economies of Scale. The Board considered whether there are economies of scale with respect to the management of the Fund and whether the Fund benefits from any economies of scale. The Board considered whether the management fee schedule under the Agreement is reasonable in relation to the asset size of the Fund. The Board noted that the management fee schedule included seven breakpoints, designed to share economies of scale with the shareholders. The Board concluded that the management fee schedule, together with the expense cap, reflects an appropriate level of sharing of any economies of scale.
Other Benefits to DeIM and Its Affiliates. The Board also considered the character and amount of other incidental benefits received by DeIM and its affiliates, including fees received by the Advisor for administrative services provided to the Fund and fees received by an affiliate of the Advisor for distribution services. The Board also considered benefits to DeIM related to brokerage and soft-dollar allocations, which pertain primarily to funds investing in equity securities. The Board considered that, during the past year, the Advisor agreed to cease allocating brokerage to acquire research services from third-party service providers. The Board concluded that management fees were reasonable in light of these fallout benefits.
Regulatory Matters. The Board also considered information regarding ongoing inquiries of the Advisor regarding market timing, late trading and other matters by federal and state regulators and private lawsuits on related topics. Among other matters, the Board considered the Advisor's commitment to indemnify the Scudder Funds against regulatory actions or lawsuits arising from such inquiries. The Board also considered management's representation that such actions will not materially impact the Advisor's ability to perform under the Agreement or materially impact the Fund.
Based on all of the information considered and the conclusions reached, the Board (including a majority of the Independent Trustees) determined that the terms of the Agreement continue to be fair and reasonable and that the continuation of the Agreement is in the best interests of the Fund. No single factor was determinative in the Board's analysis.
|
The following table presents certain information regarding the Trustees and Officers of the fund as of September 30, 2005. Each individual's year of birth is set forth in parentheses after his or her name. Unless otherwise noted, (i) each individual has engaged in the principal occupation(s) noted in the table for at least the most recent five years, although not necessarily in the same capacity, and (ii) the address of each individual is c/o Deutsche Asset Management, 222 South Riverside Plaza, Chicago, Illinois 60606. Each Trustee's term of office extends until the next shareholders' meeting called for the purpose of electing Trustees and until the election and qualification of a successor, or until such Trustee sooner dies, retires, resigns or is removed as provided in the governing documents of the fund.
Independent Trustees | ||
Name, Year of Birth, Position(s) Held with the Fund and Length of Time Served1 | Principal Occupation(s) During Past 5 Years and | Number of Funds in Fund Complex Overseen |
Shirley D. Peterson (1941) Chairperson, 2004-present Trustee, 1995-present | Retired; formerly, President, Hood College (1995-2000); prior thereto, Partner, Steptoe & Johnson (law firm); Commissioner, Internal Revenue Service; Assistant Attorney General (Tax), US Department of Justice. Directorships: Federal Mogul Corp. (supplier of automotive components and subsystems); AK Steel (steel production); Goodyear Tire & Rubber Co. (April 2004-present) ; Champion Enterprises, Inc. (manufactured home building); Wolverine World Wide, Inc. (designer, manufacturer and marketer of footwear) (April 2005-present); Trustee, Bryn Mawr College. Former Directorship: Bethlehem Steel Corp. | 71 |
John W. Ballantine (1946) Trustee, 1999-present | Retired; formerly, Executive Vice President and Chief Risk Management Officer, First Chicago NBD Corporation/The First National Bank of Chicago (1996-1998); Executive Vice President and Head of International Banking (1995-1996). Directorships: First Oak Brook Bancshares, Inc.; Oak Brook Bank; American Healthways, Inc. (provider of disease and care management services); Portland General Electric (utility company) | 71 |
Lewis A. Burnham (1933) Trustee, 1977-present | Retired; formerly, Director of Management Consulting, McNulty & Company (1990-1998); prior thereto, Executive Vice President, Anchor Glass Container Corporation | 66 |
Donald L. Dunaway (1937) Trustee, 1980-present | Retired; formerly, Executive Vice President, A.O. Smith Corporation (diversified manufacturer) (1963-1994) | 71 |
James R. Edgar (1946) Trustee, 1999-present | Distinguished Fellow, University of Illinois, Institute of Government and Public Affairs (1999-present); formerly, Governor, State of Illinois (1991-1999). Directorships: Kemper Insurance Companies; John B. Sanfilippo & Son, Inc. (processor/packager/marketer of nuts, snacks and candy products); Horizon Group Properties, Inc.; Youbet.com (online wagering platform); Alberto-Culver Company (manufactures, distributes and markets health and beauty care products) | 71 |
Paul K. Freeman (1950) Trustee, 2002-present | President, Cook Street Holdings (consulting); Senior Visiting Research Scholar, Graduate School of International Studies, University of Denver; Consultant, World Bank/Inter-American Development Bank; formerly, Project Leader, International Institute for Applied Systems Analysis (1998-2001); Chief Executive Officer, The Eric Group, Inc. (environmental insurance) (1986-1998) | 71 |
Robert B. Hoffman (1936) Trustee, 1981-present | Retired; formerly, Chairman, Harnischfeger Industries, Inc. (machinery for the mining and paper industries) (1999-2000); prior thereto, Vice Chairman and Chief Financial Officer, Monsanto Company (agricultural, pharmaceutical and nutritional/food products) (1994-1999). Directorships: RCP Advisors, LLC (a private equity investment advisory firm) | 71 |
William McClayton (1944) Trustee, 2004-present | Managing Director of Finance and Administration, DiamondCluster International, Inc. (global management consulting firm) (2001-present); formerly, Partner, Arthur Andersen LLP (1986-2001). Formerly: Trustee, Ravinia Festival; Board of Managers, YMCA of Metropolitan Chicago | 71 |
Robert H. Wadsworth (1940) Trustee, 2004-present | President, Robert H. Wadsworth Associates, Inc. (consulting firm) (1983-present). Director, The Germany Fund, Inc. (since 1986), The New Germany Fund, Inc. (since 1992), The Central Europe and Russia Fund, Inc. (since 1990). Formerly, Trustee of New York Board Scudder Funds; President and Trustee, Trust for Investment Managers (registered investment company) (1999-2002). President, Investment Company Administration, L.L.C. (1992*-2001); President, Treasurer and Director, First Fund Distributors, Inc. (June 1990-January 2002); Vice President, Professionally Managed Portfolios (May 1991-January 2002) and Advisors Series Trust (October 1996-January 2002) (registered investment companies) * Inception date of the corporation which was the predecessor to the L.L.C. | 74 |
John G. Weithers (1933) Trustee, 1993-present | Retired; formerly, Chairman of the Board and Chief Executive Officer, Chicago Stock Exchange. Directorships: Federal Life Insurance Company; Chairman of the Members of the Corporation and Trustee, DePaul University; formerly, International Federation of Stock Exchanges; Records Management Systems | 66 |
Interested Trustee and Officers2 | ||
Name, Year of Birth, Position(s) Held with the Fund and Length of Time Served1 | Principal Occupation(s) During Past 5 Years and | Number of Funds in Fund Complex Overseen |
William N. Shiebler4 (1942) Trustee, 2004-present | Vice Chairman, Deutsche Asset Management ("DeAM") and a member of the DeAM Global Executive Committee (since 2002); Vice Chairman of Putnam Investments, Inc. (1999); Director and Senior Managing Director of Putnam Investments, Inc. and President, Chief Executive Officer, and Director of Putnam Mutual Funds Inc. (1990-1999) | 120 |
Vincent J. Esposito4,7 (1956) President, 2005-present | Managing Director3, Deutsche Asset Management (since 2003); Vice President of Central European Equity Fund, Inc., The Germany Fund, Inc., The New Germany Fund, Inc. (since 2003) (registered investment companies); Vice Chairman and Director of The Brazil Fund, Inc. (2004-present); formerly, Managing Director, Putnam Investments (1991-2002) | n/a |
Philip J. Collora (1945) Vice President and Assistant Secretary, 1986-present | Director3, Deutsche Asset Management | n/a |
Paul H. Schubert4 (1963) Chief Financial Officer, 2004-present Treasurer, 2005-present | Managing Director3, Deutsche Asset Management (since July 2004); formerly, Executive Director, Head of Mutual Fund Services and Treasurer for UBS Family of Funds at UBS Global Asset Management (1994-2004) | n/a |
John Millette5 (1962) Secretary, 2001-present | Director3, Deutsche Asset Management | n/a |
Patricia DeFilippis4,7 (1963) Assistant Secretary, 2005-present | Vice President, Deutsche Asset Management (since June 2005) | n/a |
Daniel O. Hirsch6 (1954) Assistant Secretary, 2002-present | Consultant. Formerly, Managing Director, Deutsche Asset Management (2002-2005); Director, Deutsche Asset Management (1999-2002), Principal, BT Alex. Brown Incorporated (now Deutsche Bank Securities Inc.) (1998-999); Assistant General Counsel, United States Securities and Exchange Commission (1993-1998); Director, Deutsche Global Funds Ltd. (2002-2004) | n/a |
Caroline Pearson5 (1962) Assistant Secretary, 1998-present | Managing Director3, Deutsche Asset Management | n/a |
Scott M. McHugh5 (1971) Assistant Treasurer, 2005-present | Director3, Deutsche Asset Management | n/a |
Kathleen Sullivan D'Eramo5 (1957) Assistant Treasurer, 2003-present | Director3, Deutsche Asset Management | n/a |
John Robbins4,7 (1966) Anti-Money Laundering Compliance Officer, 2005-present | Managing Director3, Deutsche Asset Management (since 2005); formerly, Chief Compliance Officer and Anti-Money Laundering Compliance Officer for GE Asset Management (1999-2005) | n/a |
Philip Gallo4 (1962) Chief Compliance Officer, 2004-present | Managing Director3, Deutsche Asset Management (2003-present); formerly, Co-Head of Goldman Sachs Asset Management Legal (1994-2003) | n/a |
1 Length of time served represents the date that each Trustee was first elected to the common board of Trustees which oversees a number of investment companies, including the fund, managed by the Advisor. For the Officers of the fund, the length of time served represents the date that each Officer was first elected to serve as an Officer of any fund overseen by the aforementioned common board of Trustees.
2 As a result of their respective positions held with the Advisor, these individuals are considered "interested persons" of the Advisor within the meaning of the 1940 Act. Interested persons receive no compensation from the fund.
3 Executive title, not a board directorship
4 Address: 345 Park Avenue, New York, New York 10154
5 Address: Two International Place, Boston, Massachusetts 02110
6 Address: One South Street, Baltimore, Maryland 21202
7 Elected on September 26, 2005
The fund's Statement of Additional Information ("SAI") includes additional information about the Trustees. The SAI is available, without charge, upon request. If you would like to request a copy of the SAI, you may do so by calling the following toll-free number: 1-800-621-1048.
|
For shareholders of Classes A, B, C and Institutional
Automated Information Lines | ScudderACCESS (800) 972-3060 Personalized account information, information on other Scudder funds and services via touchtone telephone and for Classes A, B, and C only, the ability to exchange or redeem shares. |
Web Site | scudder.com View your account transactions and balances, trade shares, monitor your asset allocation, and change your address, 24 hours a day. Obtain prospectuses and applications, blank forms, interactive worksheets, news about Scudder funds, subscription to fund updates by e-mail, retirement planning information, and more. |
For More Information | (800) 621-1048 To speak with a Scudder service representative. |
Written Correspondence | Scudder Investments PO Box 219356 |
Proxy Voting | A description of the fund's policies and procedures for voting proxies for portfolio securities and information about how the fund voted proxies related to its portfolio securities during the 12-month period ended June 30 is available on our Web site — scudder.com (type "proxy voting" in the search field) — or on the SEC's Web site — www.sec.gov. To obtain a written copy of the fund's policies and procedures without charge, upon request, call us toll free at (800) 621-1048. |
Principal Underwriter | If you have questions, comments or complaints, contact: Scudder Distributors, Inc. 222 South Riverside Plaza (800) 621-1148 |
| Class A | Class B | Class C | Institutional Class |
Nasdaq Symbol | KHYAX | KHYBX | KHYCX | KHYIX |
CUSIP Number | 81115L-105 | 81115L-204 | 81115L-303 | 81115L-501 |
Fund Number | 8 | 208 | 308 | 513 |

ITEM 2.         CODE OF ETHICS.

As of the end of the period, September 30, 2005, Scudder High Income Series has
adopted a code of ethics, as defined in Item 2 of Form N-CSR, that applies to
its Principal Executive Officer and Principal Financial Officer.

There have been no amendments to, or waivers from, a provision of the code of
ethics during the period covered by this report that would require disclosure
under Item 2.

A copy of the code of ethics is filed as an exhibit to this Form N-CSR.


ITEM 3.         AUDIT COMMITTEE FINANCIAL EXPERT.

The Fund's Board of Directors/Trustees has determined that the Fund has at least
one "audit committee financial expert" serving on its audit committee: Mr.
Donald L. Dunaway. This audit committee member is "independent," meaning that he
is not an "interested person" of the Fund (as that term is defined in Section
2(a)(19) of the Investment Company Act of 1940) and he does not accept any
consulting, advisory, or other compensatory fee from the Fund (except in the
capacity as a Board or committee member).

An "audit committee financial expert" is not an "expert" for any purpose,
including for purposes of Section 11 of the Securities Act of 1933, as a result
of being designated as an "audit committee financial expert." Further, the
designation of a person as an "audit committee financial expert" does not mean
that the person has any greater duties, obligations, or liability than those
imposed on the person without the "audit committee financial expert"
designation. Similarly, the designation of a person as an "audit committee
financial expert" does not affect the duties, obligations, or liability of any
other member of the audit committee or board of directors.

ITEM 4.         PRINCIPAL ACCOUNTANT FEES AND SERVICES.


                            SCUDDER HIGH INCOME FUND
                      FORM N-CSR DISCLOSURE RE: AUDIT FEES

The following table shows the amount of fees that Ernst & Young, LLP
("E&Y"), the Fund's auditor, billed to the Fund during the Fund's last two
fiscal years. For engagements with E&Y entered into on or after May 6, 2003,
the Audit Committee approved in advance all audit services and non-audit
services that E&Y provided to the Fund.

The Audit Committee has delegated certain pre-approval responsibilities to its
Chairman (or, in his absence, any other member of the Audit Committee).

               Services that the Fund's Auditor Billed to the Fund

- ------------- ----------- ------------------- ------------------- --------------
 Fiscal Year   Audit Fees                                           All Other
    Ended        Billed      Audit-Related     Tax Fees Billed to  Fees Billed
September 30,    to Fund  Fees Billed to Fund         Fund         to Fund
- ------------- ----------- ------------------- ------------------- --------------
2005            $65,063            $0                $8,872               $0
- ------------- ----------- ------------------- ------------------- --------------
2004            $55,303            $0                $9,759               $0
- ------------- ----------- ------------------- ------------------- --------------

The above "Tax Fees" were billed for professional services rendered for tax
compliance and tax return preparation.

           Services that the Fund's Auditor Billed to the Adviser and
                        Affiliated Fund Service Providers

The following table shows the amount of fees billed by E&Y to Deutsche
Investment Management Americas, Inc. ("DeIM" or the "Adviser"), and any entity
controlling, controlled by or under common control with DeIM ("Control
Affiliate") that provides ongoing services to the Fund ("Affiliated Fund Service
Provider"), for engagements directly related to the Fund's operations and
financial reporting, during the Fund's last two fiscal years.

- --------------- --------------------- ---------------------- -------------------
                    Audit-Related                                    All
                   Fees Billed to       Tax Fees Billed to   Other Fees Billed
 Fiscal Year        Adviser and            Adviser and         to Adviser and
    Ended         Affiliated Fund        Affiliated Fund      Affiliated Fund
September 30,    Service Providers      Service Providers    Service Providers
- --------------- --------------------- ---------------------- -------------------
2005                  $406,000               $70,570                 $0
- --------------- --------------------- ---------------------- -------------------
2004                  $281,500                 $0                    $0
- --------------- --------------------- ---------------------- -------------------

The "Audit-Related Fees" were billed for services in connection with the
assessment of internal controls and additional related procedures.


                                       1


                               Non-Audit Services

The following table shows the amount of fees that E&Y billed during the
Fund's last two fiscal years for non-audit services. For engagements entered
into on or after May 6, 2003, the Audit Committee pre-approved all non-audit
services that E&Y provided to the Adviser and any Affiliated Fund Service
Provider that related directly to the Fund's operations and financial reporting.
The Audit Committee requested and received information from E&Y about any
non-audit services that E&Y rendered during the Fund's last fiscal year to
the Adviser and any Affiliated Fund Service Provider. The Committee considered
this information in evaluating E&Y's independence.

- ------------- ---------- ---------------- --------------- ----------------------
                             Total
                         Non-Audit Fees
                           billed to
                          Adviser and
                          Affiliated          Total
                         Fund Service       Non-Audit
                           Providers       Fees billed
                          (engagements      to Adviser
                             related            and
                Total    directly to the    Affiliated
              Non-Audit    operations       Fund Service
                 Fees     and financial       Providers
               Billed      reporting         (all other
Fiscal Year   to Fund     of the Fund)      engagements)    Total of (A), (B)
  Ended
September 30,    (A)          (B)                (C)             and (C)
- ------------- ---------- ---------------- --------------- ----------------------
2005            $8,872     $70,570            $24,643           $104,085
- ------------- ---------- ---------------- --------------- ----------------------
2004            $9,759        $0             $441,601           $451,360
- ------------- ---------- ---------------- --------------- ----------------------


All other engagement fees were billed for services in connection with risk
management and process improvement initiatives for DeIM and other related
entities that provide support for the operations of the fund.

                                       ***

E&Y recently advised the Fund's Audit Committee that various E&Y member
firms provided certain non-audit services to Deutsche Bank entities and
affiliates (collectively, the "DB entities") between 2004 and 2005 that raise
issues under the SEC auditor independence rules. The DB entities are within the
"Investment Company Complex" (as defined by SEC rules) and therefore covered by
the SEC auditor independence rules applicable to the Fund.

E&Y advised the Audit Committee that in connection with providing monthly
payroll services to employees of certain DB entities from May 2003 to February
2005, a member firm in Chile ("E&Y Chile") received funds from the DB
entities that went into an E&Y trust account and were used to pay the net
salaries and social security taxes of executives of the DB entities. E&Y has
advised the Audit Committee that handling those funds was in violation of Rule
2-01 of Regulation S-X.

                                       2


E&Y also advised the Audit Committee that in connection with providing
certain services in assisting a DB entity with various regulatory reporting
requirements, a member firm in France ("E&Y France") entered into an
engagement with the DB entity that resulted in E&Y France staff functioning
under the direct responsibility and direction of a DB entity supervisor. E&Y
advised the Audit Committee that, although the services provided were "permitted
services" under Rule 2-01 of Regulation S-X, the structure of the engagement was
in violation of Rule 2-01 of Regulation S-X. (Rule 2-01(c)(4)(vi) provides that
an accountant's independence is impaired if the accountant acts as an employee
of an audit client.)

The Audit Committee was informed that E&Y Chile received approximately
$11,724 and E&Y France received approximately $100,000 for the services they
provided to the DB entities. E&Y advised the Audit Committee that it
conducted an internal review of the situation and, in view of the fact that
similar expatriate tax compliance services were provided to a number of E&Y
audit clients unrelated to DB or the Fund, E&Y has advised the SEC and the
PCAOB of the independence issues arising from those services. E&Y advised
the Audit Committee that E&Y believes its independence as independent
registered public accounting firm for the Fund was not impaired during the
period the services were provided. In reaching this conclusion, E&Y noted a
number of factors, including that none of the E&Y personnel who provided the
non-audit services to the DB entities were involved in the provision of audit
services to the Fund, the E&Y professionals responsible for the Fund's
audits were not aware that these non-audit services took place, and that the
fees charged were not significant to E&Y overall or to the fees charged to
the Investment Company Complex. E&Y also noted that E&Y Chile is no
longer providing these services and that the E&Y France engagement has been
restructured.


                                       3

ITEM 5.         AUDIT COMMITTEE OF LISTED REGISTRANTS

                Not Applicable

ITEM 6.         SCHEDULE OF INVESTMENTS

                Not Applicable

ITEM 7.         DISCLOSURE OF PROXY VOTING POLICIES AND PROCEDURES FOR
                CLOSED-END MANAGEMENT INVESTMENT COMPANIES.

                Not Applicable

ITEM 8.         PORTFOLIO MANAGERS OF CLOSED-END MANAGEMENT INVESTMENT COMPANIES.

                Not applicable.

ITEM 9.         PURCHASES OF EQUITY SECURITIES BY CLOSED-END MANAGEMENT
                INVESTMENT COMPANY AND AFFILIATED PURCHASERS

                Not Applicable.

ITEM 10.        SUBMISSION OF MATTERS TO A VOTE OF SECURITY HOLDERS.

The primary function of the Nominating and Governance Committee is to identify
and recommend individuals for membership on the Board and oversee the
administration of the Board Governance Procedures and Guidelines. Shareholders
may recommend candidates for Board positions by forwarding their correspondence
by U.S. mail or courier service to the Fund's Secretary for the attention of the
Chairman of the Nominating and Governance Committee, Two International Place,
Boston, MA 02110. Suggestions for candidates must include a resume of the
candidate.

ITEM 11.        CONTROLS AND PROCEDURES.

(a) The Chief Executive and Financial Officers concluded that the Registrant's
Disclosure Controls and Procedures are effective based on the evaluation of the
Disclosure Controls and Procedures as of a date within 90 days of the filing
date of this report.

(b) There have been no changes in the registrant's internal control over
financial reporting that occurred during the registrant's last half-year (the
registrant's second fiscal half-year in the case of the annual report) that has
materially affected, or is reasonably likely to materially affect, the
registrant's internal controls over financial reporting.

ITEM 12.        EXHIBITS.

(a)(1)   Code of Ethics  pursuant to Item 2 of Form N-CSR is filed and  attached
         hereto as EX-99.CODE ETH.

(a)(2)   Certification  pursuant to Rule 30a-2(a) under the  Investment  Company
         Act of 1940 (17 CFR  270.30a-2(a))  is filed  and  attached  hereto  as
         Exhibit 99.CERT.

(b)      Certification  pursuant to Rule 30a-2(b) under the  Investment  Company
         Act of 1940 (17 CFR  270.30a-2(b))  is furnished and attached hereto as
         Exhibit 99.906CERT.


Form N-CSR Item F

                                   SIGNATURES

Pursuant to the requirements of the Securities Exchange Act of 1934 and the
Investment Company Act of 1940, the registrant has duly caused this report to be
signed on its behalf by the undersigned, thereunto duly authorized.

Registrant:                         Scudder High Income Fund, a series of
                                    Scudder High Income Series


By:                                 /s/Vincent J. Esposito
                                    ---------------------------
                                    Vincent J. Esposito
                                    President

Date:                               December 2, 2005


Pursuant to the requirements of the Securities Exchange Act of 1934 and the
Investment Company Act of 1940, this report has been signed below by the
following persons on behalf of the registrant and in the capacities and on the
dates indicated.

Registrant:                         Scudder High Income Fund, a series of
                                    Scudder High Income Series


By:                                 /s/Vincent J. Esposito
                                    ---------------------------
                                    Vincent J. Esposito
                                    President

Date:                               December 2, 2005


By:                                 /s/Paul Schubert
                                    ---------------------------
                                    Paul Schubert
                                    Chief Financial Officer and Treasurer

Date:                               December 2, 2005