UNITED STATES
SECURITIES AND EXCHANGE COMMISSION
Washington, D.C. 20549
FORM N-CSR
CERTIFIED SHAREHOLDER REPORT OF REGISTERED MANAGEMENT
INVESTMENT COMPANIES |
| | Investment Company Act file number 811-02688
Name of Fund: BlackRock Municipal Bond Fund, Inc.
BlackRock High Yield Municipal Fund
BlackRock Municipal Insured Fund
BlackRock National Municipal Fund
BlackRock Short-Term Municipal Fund
Fund Address: 100 Bellevue Parkway, Wilmington, DE 19809
Name and address of agent for service: Donald C. Burke, Chief Executive Officer, BlackRock
Municipal Bond Fund, Inc., 800 Scudders Mill Road, Plainsboro, NJ, 08536. Mailing
address: P.O. Box 9011, Princeton, NJ, 08543-9011
Registrant’s telephone number, including area code: (800) 441-7762
Date of fiscal year end: 06/30/2008
Date of reporting period: 07/01/2007 – 06/30/2008
Item 1 – Report to Stockholders |

EQUITIES FIXED INCOME REAL ESTATE LIQUIDITY ALTERNATIVES BLACKROCK SOLUTIONS
BlackRock Municipal Bond
Fund, Inc.
ANNUAL REPORT | JUNE 30, 2008
BlackRock Short-Term Municipal Fund
BlackRock Municipal Insured Fund
BlackRock National Municipal Fund
BlackRock High Yield Municipal Fund |
NOT FDIC INSURED
MAY LOSE VALUE
NO BANK GUARANTEE |
| Table of Contents | | |
| |
|
| |
| | | Page |
| |
|
| |
| A Letter to Shareholders | | 3 |
| Annual Report: | | |
| Fund Summaries | | 4 |
| About Fund Performance | | 12 |
| Disclosure of Expenses | | 14 |
| Financial Statements: | | |
| Schedules of Investments | | 18 |
| Statements of Assets and Liabilities | | 39 |
| Statements of Operations | | 41 |
| Statements of Changes in Net Assets | | 42 |
| Financial Highlights | | 46 |
| Notes to Financial Statements | | 60 |
| Report of Independent Registered Public Accounting Firm | | 71 |
| Important Tax Information (Unaudited) | | 71 |
| Disclosure of Investment Advisory Agreement and Subadvisory Agreement | | 72 |
| Officers and Directors | | 76 |
| Additional Information | | 80 |
| Mutual Fund Family | | 82 |
2 BLACKROCK MUNICIPAL BOND FUND, INC.
Dear Shareholder
Throughout the past year, investors were overwhelmed by lingering credit and financial market troubles, surging oil
prices and more recently, renewed inflation concerns. Healthy nonfinancial corporate profits and robust exporting
activity remained among the few bright spots, helping the economy to grow at a modest, but still positive, pace.
The Federal Reserve Board (the “Fed”) has been aggressive in its attempts to stoke economic growth and ease
financial market instability. In addition to slashing the target federal funds rate 325 basis points (3.25%) between
September 2007 and April 2008, the central bank introduced the new Term Securities Lending Facility, granted broker-
dealers access to the discount window and used its own balance sheet to help negotiate the sale of Bear Stearns.
As widely anticipated, the end of the period saw a pause in Fed action, as the central bank held the target rate steady
at 2.0% amid rising inflationary pressures.
As the Fed’s bold response to the financial crisis helped ease credit turmoil and investor anxiety, U.S. equity markets
sank sharply over the last six months, notwithstanding a brief rally in the spring. International markets were not immune
to the tumult, with most regions also registering declines.
Treasury securities also traded in a volatile fashion, but generally rallied (yields fell as prices correspondingly rose), with
investors continuing to seek safety as part of a broader flight to quality. The yield on 10-year Treasury issues, which fell
to 3.34% in March 2008, climbed up to the 4.20% range in mid-June as investors temporarily shifted out of Treasury
issues in favor of riskier assets (such as stocks and other high-quality fixed income sectors), then reversed course and
declined to 3.99% by period-end when credit fears re-emerged.
Tax-exempt issues eked out gains for the reporting period, but underperformed their taxable counterparts, as the group
continued to be pressured by problems among municipal bond insurers and the breakdown in the market for auction
rate securities.
The major benchmark indexes generated results that largely reflected heightened investor risk aversion:
Total Returns as of June 30, 2008 6-month 12-month
| U.S. equities (S&P 500 Index) | | (11.91)% | | (13.12)% |
| |
| |
|
| Small cap U.S. equities (Russell 2000 Index) | | (9.37)% | | (16.19)% |
| |
| |
|
| International equities (MSCI Europe, Australasia, Far East Index) | | (10.96)% | | (10.61)% |
| |
| |
|
| Fixed income (Lehman Brothers U.S. Aggregate Index) | | 1.13% | | 7.12% |
| |
| |
|
| Tax-exempt fixed income (Lehman Brothers Municipal Bond Index) | | 0.02% | | 3.23% |
| |
| |
|
| High yield bonds (Lehman Brothers U.S. Corporate High Yield 2% Issuer Capped Index) | | (1.08)% | | (1.74)% |
| |
| |
|
| | Past performance is no guarantee of future results. Index performance shown for illustrative purposes only. You cannot invest directly
in an index.
As you navigate today’s volatile markets, we encourage you to review your investment goals with your financial profes-
sional and to make portfolio changes, as needed. For more up-to-date commentary on the economy and financial
markets, we invite you to visit www.blackrock.com/funds. As always, we thank you for entrusting BlackRock with your
investment assets, and we look forward to continuing to serve you in the months and years ahead. |

THIS PAGE NOT PART OF YOUR FUND REPORT
3
Fund Summary as of June 30, 2008 BlackRock Short-Term Municipal Fund
Portfolio Management Commentary
How did the Fund perform?
•The Fund outperformed both the broad-market Lehman Brothers
Municipal Bond Index and its Lipper Short Municipal Debt Funds cate-
gory average for the 12-month period. Fund returns trailed that of the
Lehman Brothers 3-Year General Obligation Bond Index.
What factors influenced performance?
•U.S.Treasury yields generally declined (while prices correspondingly
rose) during the period in response to weaker U.S. economic growth and
declining equity valuations. The Federal Reserve Board (Fed) cut short-
term interest rates from 5.25% to 2.0% between September 2007 and
April 2008. The municipal market underperformed U.S. Treasury issues,
as credit downgrades of the monoline insurers and the failure of auction
rate securities disrupted normal market function. Liquidity diminished as
broker-dealers reduced activity to protect their fragile balance sheets.
The municipal market experienced its own “flight-to-quality,” with natural
AAA-rated and AA-rated municipal bonds generally performing much
better than lower-rated and insured issues.
•The Fund’s conservative investment strategy and overweight in the front
part of the yield curve were the main factors behind its relative outper-
formance. The Federal Reserve Board’s aggressive easing of monetary
policy in light of the liquidity and credit crisis had the greatest positive
impact on the front end of the yield curve, an area that the Fund was
overweight. The flight to quality that ensued in the fixed income markets
benefited this segment of the curve as well, further enhancing Fund
returns. Also contributing positively was the outperformance of higher-
quality issues versus insured securities and lower-rated spread product.
The Fund’s average credit quality was maintained in the AA category
as purchases were generally focused on prerefunded bonds and high-
quality general obligation bonds, both of which outperformed the
broader market for most of the annual period.
•The unprecedented downgrades of AAA monoline insurance companies
created significant turmoil in lower-rated issues, as well as monoline-
backed securities with lower underlying ratings. Although the Fund has
some exposure to securities backed by monoline insurance, it is minimal
and the underlying issues remain strong. Nevertheless, even a relatively
small allocation in this area modestly detracted from performance
during the year.
Describe recent portfolio activity.
•Cash reserves were drawn down to a minimum in the belief that cash
would underperform issues with a maturity of one to two years during a
period of Fed easing. Additionally, we continued to swap out of insured
bonds and lower-quality issues in favor of prerefunded bonds and
general obligation bonds.
Describe Fund positioning at period-end.
•At period-end, the Fund is positioned for a neutral Fed policy throughout
the remainder of 2008, which should benefit performance as the curve
may continue to steepen due to inflationary concerns. This would nega-
tively impact longer-dated issues, while shorter-term securities should
continue to hold their value. The portfolio’s average credit quality of
AA also bodes well given the continued uncertainty in the economy
and the impact on lower-quality issues.
The views expressed reflect the opinions of BlackRock as of the date of this report and are subject to change based on changes in market, economic or other conditions.
These views are not intended to be a forecast of future events and are no guarantee of future results.
| | Fund Profile as of June 30, 2008 |
| | | Percent of |
| | | Long Term |
| | | Investments |
| |
|
| Other Revenue Bonds | | 39% |
| General Obligation & Tax Revenue Bonds | | 33 |
| Prerefunded Bonds | | 28 |
4 BLACKROCK MUNICIPAL BOND FUND, INC. JUNE 30, 2008
BlackRock Short-Term Municipal Fund
Total Return Based on a $10,000 Investment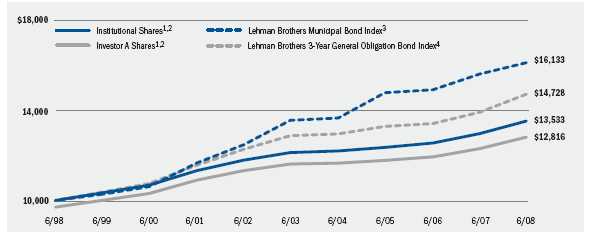
1 Assuming maximum sales charge, if any, transaction costs and other operating expenses, including advisory fees.
2 The Fund invests primarily in investment grade municipal bonds (bonds rated Baa or better) with a maximum maturity not
to exceed four years or in municipal notes.
3 This unmanaged Index consists of revenue bonds, prerefunded bonds, general obligation bonds and insured bonds, all of which mature
within 30 years.
4 This unmanaged Index consists of state and local government obligation bonds that mature in three – four years, rated Baa or better.
Performance Summary for the Year Ended June 30, 2008
| | | | | | | | | | | Average Annual Total Returns1 | | | | |
| | | | | | | 1 Year | | | | 5 Years | | | | 10 Years |
| | | Standardized | | 6-Month | | w/o sales | | w/sales | | w/o sales | | w/sales | | w/o sales | | w/sales |
| | | 30-Day Yields | | Total Returns | | charge | | charge | | charge | | charge | | charge | | charge |
| BlackRock | | 2.42% | | 1.60% | | 4.26% | | — | | 2.22% | | — | | 3.08% | | — |
| Institutional | | 2.41 | | 1.62 | | 4.31 | | — | | 2.21 | | — | | 3.07 | | — |
| Investor A | | 2.09 | | 1.49 | | 4.15 | | 1.03% | | 1.98 | | 1.36% | | 2.82 | | 2.51% |
| Investor A1 | | 2.29 | | 1.57 | | 4.20 | | 3.16 | | 2.11 | | 1.91 | | 2.97 | | 2.87 |
| Investor B | | 2.06 | | 1.44 | | 3.94 | | 2.94 | | 1.85 | | 1.85 | | 2.70 | | 2.70 |
| Investor C | | 1.41 | | 1.11 | | 3.27 | | 2.27 | | 1.20 | | 1.20 | | 2.05 | | 2.05 |
| Lehman Brothers 3-Year | | | | | | | | | | | | | | | | |
| General Obligation | | | | | | | | | | | | | | | | |
| Bond Index | | — | | 1.95 | | 5.75 | | — | | 2.71 | | — | | 3.95 | | — |
| Lehman Brothers Municipal | | | | | | | | | | | | | | | | |
| Bond Index | | — | | 0.02 | | 3.23 | | — | | 3.52 | | — | | 4.90 | | — |
| |
| |
| |
| |
| |
| |
| |
| |
|
| | 1 Assuming maximum sales charges. See “About Fund Performance” on pages 12–13 for a detailed description of share classes, including any related sales charges and fees.
Past performance is not indicative of future results. |
BLACKROCK MUNICIPAL BOND FUND, INC. JUNE 30, 2008 5
Fund Summary as of June 30, 2008 BlackRock Municipal Insured Fund
Portfolio Management Commentary
How did the Fund perform?
•The Fund underperformed the broad-market Lehman Brothers Municipal
Bond Index for the 12-month period. The Fund’s Institutional shares out-
performed the Lipper Insured Municipal Debt Funds category average,
while Investor A, Investor B, Investor C and Investor C1 shares trailed the
Lipper peers.
What factors influenced performance?
•U.S.Treasury yields generally declined (while prices correspondingly
rose) during the period in response to weaker U.S. economic growth and
declining equity valuations. The Federal Reserve Board cut short-term
interest rates from 5.25% to 2.0% between September 2007 and April
2008. The municipal market underperformed U.S. Treasury issues, as
credit downgrades of the monoline insurers and the failure of auction
rate securities disrupted normal market function. Liquidity diminished as
broker-dealers reduced activity to protect their fragile balance sheets.
The municipal market experienced its own “flight-to-quality,” with natural
AAA-rated and AA-rated municipal bonds generally performing much
better than lower-rated and insured issues.
•Fund performance was negatively impacted by three factors. First, the
Fund was positioned with a more constructive view of the market during
a period in which yields generally rose. The Fund’s overweight in the
longer part of the yield curve further hampered results, as the curve
steepened and short yields declined while long yields rose. Exposure to
insured bonds with weaker underlying ratings, namely those rated A- or
below, also proved detrimental amid the tumult in the municipal market
and among insured bonds, in particular.
•On the positive side, our efforts to upgrade credit quality by purchasing
favored insurers (such as Financial Security Assurance Inc.) aided per-
formance, as the spread between higher- and lower-rated securities
widened. Our efforts to increase coupons and dampen duration exten-
sion also benefited Fund results.
Describe recent portfolio activity.
•The municipal market endured significant stress and volatility throughout
the annual period in light of the transformation in the monoline insur-
ance industry. Three of the four largest bond insurers were downgraded
from AAA status, and have since largely stopped writing new business.
This had far-reaching implications, as insured bonds accounted for
nearly 50% of all municipal issuance as recently as last year. In
response, working with our Municipal Research Group, we combed
through the Fund’s holdings to identify sale candidates based on our
underlying issuer rating and insurer profile. We focused on upgrading
credit quality and increasing overall portfolio liquidity. Additionally, we
worked to increase average coupon and dampen duration extension.
Describe Fund positioning at period-end.
•The Fund was positioned with a modestly constructive view of the
market at period-end, with an overweight to the longer end of the yield
curve. The municipal yield curve steepened significantly over the prior
one-year period and we believe currently offers attractive value. Going
forward, we will look to add premium-coupon bonds from high-quality
insurers and issuers, and will focus primarily on the 25-year area of
the curve.
| | The views expressed reflect the opinions of BlackRock as of the date of this report and are subject to change based on changes in market, economic or other conditions.
These views are not intended to be a forecast of future events and are no guarantee of future results. |
Fund Profile as of June 30, 2008
| | | Percent of |
| | | Long Term |
| | | Investments |
| |
|
| Other Revenue Bonds | | 70% |
| General Obligation & Tax Revenue Bonds | | 21 |
| Prerefunded Bonds | | 9 |
6 BLACKROCK MUNICIPAL BOND FUND, INC. JUNE 30, 2008
BlackRock Municipal Insured Fund
Total Return Based on a $10,000 Investment
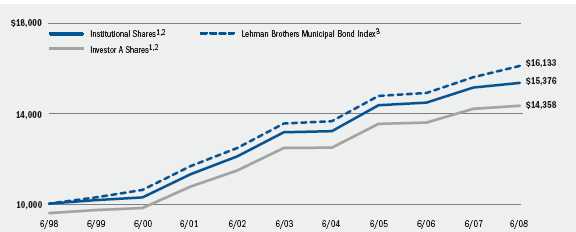
1 Assuming maximum sales charge, if any, transaction costs and other operating expenses, including advisory fees.
2 The Fund invests primarily in long-term, investment grade municipal bonds (bonds rated Baa or better) covered by portfolio
insurance guaranteeing the timely payment of principal at maturity and interest.
3 This unmanaged Index consists of revenue bonds, prerefunded bonds, general obligation bonds and insured bonds, all of which mature
within 30 years.
Performance Summary for the Year Ended June 30, 2008
| | | | | | | | | | | Average Annual Total Returns1 | | | | |
| | | | | | | 1 Year | | | | 5 Years | | | | 10 Years |
| | | Standardized | | 6-Month | | w/o sales | | w/sales | | w/o sales | | w/sales | | w/o sales | | w/sales |
| | | 30-Day Yields | | Total Returns | | charge | | charge | | charge | | charge | | charge | | charge |
| Institutional | | 4.20% | | (0.93)% | | 1.37% | | — | | 3.13% | | — | | 4.40% | | — |
| Investor A | | 3.77 | | (1.19) | | 0.96 | | (3.33)% | | 2.85 | | 1.96% | | 4.13 | | 3.68% |
| Investor B | | 3.45 | | (1.44) | | 0.45 | | (3.41) | | 2.33 | | 1.99 | | 3.61 | | 3.61 |
| Investor C | | 3.19 | | (1.55) | | 0.22 | | (0.74) | | 2.11 | | 2.11 | | 3.36 | | 3.36 |
| Investor C1 | | 3.39 | | (1.46) | | 0.41 | | (0.55) | | 2.28 | | 2.28 | | 3.56 | | 3.56 |
| Lehman Brothers Municipal | | | | | | | | | | | | | | | | |
| Bond Index | | — | | 0.02 | | 3.23 | | — | | 3.52 | | — | | 4.90 | | — |
| |
| |
| |
| |
| |
| |
| |
| |
|
| | 1 Assuming maximum sales charges. See “About Fund Performance” on pages 12–13 for a detailed description of share classes, including any related sales charges and fees.
Past performance is not indicative of future results. |
BLACKROCK MUNICIPAL BOND FUND, INC. JUNE 30, 2008 7
Fund Summary as of June 30, 2008 BlackRock National Municipal Fund
Portfolio Management Commentary
How did the Fund perform?
•The Fund underperformed the broad-market Lehman Brothers Municipal
Bond Index and the Lipper General Municipal Debt Funds category
average for the 12-month period.
What factors influenced performance?
•U.S.Treasury yields generally declined (while prices correspondingly
rose) during the period in response to weaker U.S. economic growth and
declining equity valuations. The Federal Reserve Board cut short-term
interest rates from 5.25% to 2.0% between September 2007 and April
2008. The municipal market underperformed U.S. Treasury issues, as
credit downgrades of the monoline insurers and the failure of auction
rate securities disrupted normal market function. Liquidity diminished
as broker-dealers reduced activity to protect their fragile balance sheets.
The municipal market experienced its own “flight-to-quality,” with natural
AAA-rated and AA-rated municipal bonds generally performing much
better than lower-rated and insured issues.
•In general, any Fund exposure to alternative minimum tax (AMT) bonds,
airline- and tobacco-backed securities and high yield credits detracted
from performance over the one-year period, as these issues suffered
amid substantial credit spread widening. Similarly, any Fund exposure
to insured (monoline-backed) securities proved detrimental, as the entire
sector underperformed following the credit rating downgrades of the
major insurers. In addition, the Fund’s high cash reserve position hin-
dered performance during periods that witnessed improving bond prices,
as it placed us in a less aggressive stance versus other funds in the
Lipper peer group.
•On the positive side, we continued to focus our efforts on delivering a
steady, high level of income for shareholders, within a higher average
credit profile. This was advantageous as it resulted in an above-average
accrual rate and current yield for the Fund. Likewise, the Fund’s credit
quality of AA was additive in a market of declining credit fundamentals
and widening credit spreads. Lastly, the Fund’s high cash reserve posi-
tion was invested in higher-yielding cash equivalents due to dislocation
in the money market fund arena, which also enhanced results.
Describe recent portfolio activity.
•During the annual period, we permitted the Fund’s cash reserves to
accumulate to a historically high percentage as higher-yielding cash
equivalents became available given the abovementioned dislocation
in the money market sector. We also deleveraged some of the Fund’s
inverse floating-rate positions.
Describe Fund positioning at period-end.
•The Fund ended the period with a continued low duration posture
relative to its Lipper peers. The Fund maintains a high current income,
despite its relatively high cash reserve, and a high average credit quality
of AA-. We have ample cash and short-term securities (9% of total
assets) to invest should better yielding securities become available,
either from a growing new-issue calendar or a deteriorating secondary
market. Market illiquidity favors the fund that has cash to spend as
swaps and raising reserves remains difficult in the current environment.
| | The views expressed reflect the opinions of BlackRock as of the date of this report and are subject to change based on changes in market, economic or other conditions.
These views are not intended to be a forecast of future events and are no guarantee of future results. |
Fund Profile as of June 30, 2008
| | | Percent of |
| | | Long Term |
| | | Investments |
| |
|
| Other Revenue Bonds | | 72% |
| General Obligation & Tax Revenue Bonds | | 16 |
| Prerefunded Bonds | | 12 |
8 BLACKROCK MUNICIPAL BOND FUND, INC. JUNE 30, 2008
BlackRock National Municipal Fund
Total Return Based on a $10,000 Investment
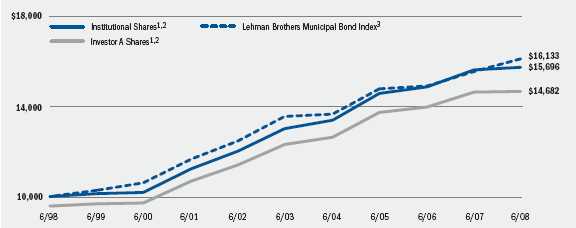
1 Assuming maximum sales charge, if any, transaction costs and other operating expenses, including advisory fees.
2 The Fund invests primarily in long-term municipal bonds rated in any rating category or unrated.
3 This unmanaged Index consists of revenue bonds, prerefunded bonds, general obligation bonds and insured bonds, all of which mature
within 30 years.
Performance Summary for the Year Ended June 30, 2008
| | | | | | | | | | | Average Annual Total Returns1 | | | | |
| | | | | | | 1 Year | | | | 5 Years | | | | 10 Years |
| | | Standardized | | 6-Month | | w/o sales | | w/sales | | w/o sales | | w/sales | | w/o sales | | w/sales |
| | | 30-Day Yields | | Total Returns | | charge | | charge | | charge | | charge | | charge | | charge |
| Institutional | | 4.26% | | (0.62)% | | 0.35% | | — | | 3.80% | | — | | 4.61% | | — |
| Investor A | | 3.86 | | (0.73) | | 0.22 | | (4.04)% | | 3.57 | | 2.68% | | 4.37 | | 3.92% |
| Investor B | | 3.50 | | (0.99) | | (0.30) | | (4.14) | | 3.04 | | 2.71 | | 3.84 | | 3.84 |
| Investor C | | 3.22 | | (1.12) | | (0.57) | | (1.53) | | 2.77 | | 2.77 | | 3.57 | | 3.57 |
| Investor C1 | | 3.46 | | (1.01) | | (0.44) | | (1.39) | | 2.98 | | 2.98 | | 3.78 | | 3.78 |
| Lehman Brothers Municipal | | | | | | | | | | | | | | | | |
| Bond Index | | — | | 0.02 | | 3.23 | | — | | 3.52 | | — | | 4.90 | | — |
| |
| |
| |
| |
| |
| |
| |
| |
|
| | 1 Assuming maximum sales charges. See “About Fund Performance” on pages 12–13 for a detailed description of share classes, including any related sales charges and fees.
Past performance is not indicative of future results. |
BLACKROCK MUNICIPAL BOND FUND, INC. JUNE 30, 2008 9
Fund Summary as of June 30, 2008 BlackRock High Yield Municipal Fund
Portfolio Management Commentary
How did the Fund perform?
•The Fund’s total return lagged both the broad-market and performance
benchmarks and its comparable Lipper category average for the 12-
month period.
What factors influenced performance?
•U.S.Treasury yields generally declined (while prices correspondingly
rose) during the period in response to weaker U.S. economic growth and
declining equity valuations. The Federal Reserve Board cut short-term
interest rates from 5.25% to 2.0% between September 2007 and April
2008. The municipal market underperformed U.S. Treasury issues, as
credit downgrades of the monoline insurers and the failure of auction
rate securities disrupted normal market function. Liquidity diminished as
broker-dealers reduced activity to protect their fragile balance sheets.
The municipal market experienced its own “flight-to-quality,” with natural
AAA-rated and AA-rated municipal bonds generally performing much
better than lower-rated and insured issues.
•As stated in our last report to shareholders, the Fund’s exposure at the
lower end of the credit spectrum has suffered disproportionately due to
a prevalence of discounted securities exhibiting relatively high duration
profiles. The Fund’s yield curve exposure also proved detrimental. The
municipal yield curve steepened significantly over the one-year period,
which primarily benefited the short end. In contrast, high yield municipal
issuance is heavily weighted at the long end of the maturity spectrum
and, as a consequence, the Fund’s investments tend to be concentrated
in this segment of the curve.
•On the positive side, performance was aided by an up-in-quality bias
that has been maintained since the Fund’s inception. However, the bene-
ficial impact has been muted somewhat by the extent to which portfolio
investments have been adversely affected by deteriorating credit metrics
within the monoline insurance industry. Some modest additional benefit
can be attributed to an underweight exposure to the airline sector, which
has been subject to particularly acute stress amidst weak economic
growth and rising energy prices.
Describe recent portfolio activity.
•Throughout the year, we continued to pursue opportunities to boost the
Fund’s distribution yield. While some progress was achieved, a dearth of
fairly priced securities in the municipal high yield arena continued to
thwart efforts to reduce cash balances. At times, we sought alternative
methods that included the purchase of higher-yielding short-term vari-
able rate and auction rate instruments, as well as the use of a leveraged
form of income enhancement known as tender option bond trusts. On a
sector basis, recent investments were made in utilities, education and oil
services, while exposures to long-term care and tobacco were either
reduced or eliminated.
Describe Fund positioning at period-end.
•At period-end, the Fund was positioned somewhat lower than bench-
mark duration, largely as a result of a high cash balance. While our pref-
erence is to remain more fully invested, we are satisfied conserving cash
for the investment opportunities that likely lie ahead.
| | The views expressed reflect the opinions of BlackRock as of the date of this report and are subject to change based on changes in market, economic or other conditions.
These views are not intended to be a forecast of future events and are no guarantee of future results. |
Fund Profile as of June 30, 2008
| | | Percent of |
| | | Long Term |
| | | Investments |
| |
|
| |
| Other Revenue Bonds | | 91% |
| General Obligation & Tax Revenue Bonds | | 9 |
10 BLACKROCK MUNICIPAL BOND FUND, INC. JUNE 30, 2008
BlackRock High Yield Municipal Fund
Total Return Based on a $10,000 Investment
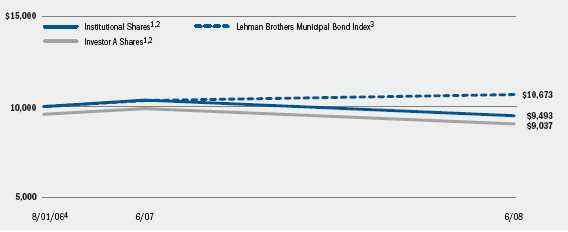
1 Assuming maximum sales charge, if any, transaction costs and other operating expenses, including advisory fees.
2 The Fund invests primarily in municipal bonds rated in any rating category or in unrated municipal bonds.
3 This unmanaged Index consists of revenue bonds, prerefunded bonds, general obligation bonds and insured bonds, all of which mature
within 30 years.
4 Commencement of Operations.
Performance Summary for the Year Ended June 30, 2008
| | | | | | | | | Average Annual Total Returns1 | | |
| | | | | | | 1 Year | | | | Since Inception2 |
| | | Standardized | | 6-Month | | w/o sales | | w/sales | | w/o sales | | w/sales |
| | | 30-Day Yields | | Total Returns | | charge | | charge | | charge | | charge |
| Institutional | | 5.08% | | (2.63)% | | (8.38)% | | — | | (2.68)% | | — |
| Investor A | | 4.64 | | (2.75) | | (8.62) | | (12.51)% | | (2.98) | | (5.16)% |
| Investor C | | 4.05 | | (3.12) | | (9.40) | | (10.27) | | (3.62) | | (3.62) |
| Lehman Brothers Municipal Bond Index | | — | | 0.02 | | 3.23 | | — | | 3.47 | | — |
| |
| |
| |
| |
| |
| |
|
| | 1 Assuming maximum sales charges. See “About Fund Performance” on pages 12–13 for a detailed description of share classes, including any related sales charges and fees.
2 The Portfolio commenced operations on 8/01/06.
Past performance is not indicative of future results. |
BLACKROCK MUNICIPAL BOND FUND, INC. JUNE 30, 2008 11
About Fund Performance
For BlackRock Short-Term Municipal Fund
•BlackRock Shares are not subject to any sales charge. BlackRock
Shares bear no ongoing distribution or service fees and are available
only to eligible investors. Prior to October 2, 2006, BlackRock Share
performance results are those of the Institutional Shares (which have
no distribution or service fees).
•Institutional Sharesare not subject to any sales charge. Institutional
Shares bear no ongoing distribution or service fees and are available
only to eligible investors.
•Investor A Sharesincur a maximum initial sales charge (front-end load)
of 3% and a service fee of 0.25% per year (but no distribution fee).
Prior to October 2, 2006, Investor A Share performance results are those
of the Institutional Shares (which have no distribution or service fees)
restated to reflect Investor A Share fees.
•Investor A1 Sharesincur a maximum initial sales charge (front-end load)
of 1% and a service fee of 0.10% per year (but no distribution fee).
•Investor B Sharesare subject to a maximum contingent deferred sales
charge of 1% declining to 0% after three years. In addition, Investor B
Shares are subject to a distribution fee of 0.20% per year and a service
fee of 0.15% per year. These shares automatically convert to Investor A1
Shares after approximately 10 years. (There is no initial sales charge for
automatic share conversions.)
•Investor C Sharesare subject to a distribution fee of 0.75% per year
and a service fee of 0.25% per year. In addition, Investor C shares are
subject to a 1% contingent deferred sales charge if redeemed within one
year of purchase. Prior to October 2, 2006, Investor C Share perform-
ance results are those of the Institutional Shares (which have no distri-
bution or service fees) restated to reflect Investor C Share fees.
For BlackRock Municipal Insured Fund and BlackRock National Municipal Fund
•Institutional Sharesare not subject to any sales charge. Institutional
Shares bear no ongoing distribution or service fees and are available
only to eligible investors.
•Investor A Sharesincur a maximum initial sales charge (front-end load)
of 4.25% and a service fee of 0.25% per year (but no distribution fee).
•Investor B Sharesare subject to a maximum contingent deferred sales
charge of 4% declining to 0% after six years. In addition, Investor B
Shares are subject to a distribution fee of 0.50% per year and a service
fee of 0.25% per year. These shares automatically convert to Investor A
Shares after approximately 10 years. (There is no initial sales charge for
automatic share conversions.).
•Investor C Sharesare subject to a distribution fee of 0.75% per year
and a service fee of 0.25% per year. In addition, Investor C shares are
subject to a 1% contingent deferred sales charge if redeemed within one
year of purchase. Prior to October 2, 2006, Investor C Share performance
results are those of the Institutional Shares (which have no distribution
or service fees) restated to reflect Investor C Share fees.
•Investor C1 Sharesare subject to a distribution fee of 0.55% per year
and a service fee of 0.25% per year. In addition, Investor C1 shares are
subject to a 1% contingent deferred sales charge if redeemed within one
year of purchase.
12 BLACKROCK MUNICIPAL BOND FUND, INC. JUNE 30, 2008
About Fund Performance (concluded)
For BlackRock High Yield Municipal Fund
•Institutional Sharesare not subject to any sales charge. Institutional
Shares bear no ongoing distribution or service fees and are available
only to eligible investors.
•Investor A Sharesincur a maximum initial sales charge (front-end load)
of 4.25% and a service fee of 0.25% per year (but no distribution fee).
•Investor C Sharesare subject to a distribution fee of 0.75% per year
and a service fee of 0.25% per year. In addition, Investor C shares are
subject to a 1% contingent deferred sales charge if redeemed within one
year of purchase. |
For All Funds
Performance information reflects past performance and does not guaran-
tee future results. Current performance may be lower or higher than the
performance data quoted. Refer to www.blackrock.com/funds to obtain
performance data current to the most recent month-end. Performance
results do not reflect the deduction of taxes that a shareholder would pay
on fund distributions or the redemption of fund shares. Figures shown
in each of the performance tables on pages 5, 7, 9 and 11 assume
reinvestment of all dividends and capital gain distributions, if any, at net |
asset value on the payable date. The Funds’ investment adviser reim-
bursed a portion of each Fund’s expenses. Without such reimbursement,
a Fund’s performance would have been lower. Investment return and
principal value of shares will fluctuate so that shares, when redeemed,
may be worth more or less than their original cost. Dividends paid to each
class of shares will vary because of the different levels of service, distri-
bution and transfer agency fees applicable to each class, which are
deducted from the income available to be paid to shareholders. |
BLACKROCK MUNICIPAL BOND FUND, INC. JUNE 30, 2008 13
Disclosure of Expenses
Shareholders of these Funds may incur the following charges: (a)
expenses related to transactions, including sales charges, redemption
fees and exchange fees; and (b) operating expenses including advisory
fees, distribution fees including 12b-1 fees, and other Fund expenses. The
expense examples on pages 14 – 17 (which are based on a hypothetical
investment of $1,000 invested on January 1, 2008 and held through
June 30, 2008) is intended to assist shareholders both in calculating
expenses based on an investment in a Fund and in comparing
these expenses with similar costs of investing in other mutual funds.
The tables provide information about actual account values and actual
expenses. In order to estimate the expenses a shareholder paid during
the period covered by this report, shareholders can divide their account
value by $1,000 and then multiply the result by the number correspon-
ding to their share class under the heading entitled “Expenses Paid During
the Period.” |
The tables also provide information about hypothetical account values and
hypothetical expenses based on a Fund’s actual expense ratio and an
assumed rate of return of 5% per year before expenses. In order to assist
shareholders in comparing the ongoing expenses of investing in these
Funds and other funds, compare the 5% hypothetical example with the 5%
hypothetical examples that appear in other funds’ shareholder reports.
The expenses shown in the tables are intended to highlight shareholders’
ongoing costs only and do not reflect any transactional expenses, such as
sales charges, redemption fees or exchange fees. Therefore, the hypotheti-
cal tables are useful in comparing ongoing expenses only, and will not
help shareholders determine the relative total expenses of owning differ-
ent funds. If these transactional expenses were included, shareholder
expenses would have been higher. |
BlackRock Short-Term Municipal Fund
| | | | | Actual | | | | | | Hypothetical2 | | |
| | | Beginning | | Ending | | | | Beginning | | Ending | | |
| | | Account Value | | Account Value | | Expenses Paid | | Account Value | | Account Value | | Expenses Paid |
| | | January 1, 2008 | | June 30, 2008 | | During the Period1 | | January 1, 2008 | | June 30, 2008 | | During the Period1 |
| BlackRock | | $1,000 | | $1,016.00 | | $1.94 | | $1,000 | | $1,022.80 | | $1.95 |
| Institutional | | $1,000 | | $1,016.20 | | $1.74 | | $1,000 | | $1,023.00 | | $1.75 |
| Investor A | | $1,000 | | $1,014.90 | | $2.99 | | $1,000 | | $1,021.76 | | $3.00 |
| Investor A1 | | $1,000 | | $1,015.70 | | $2.24 | | $1,000 | | $1,022.50 | | $2.25 |
| Investor B | | $1,000 | | $1,014.40 | | $3.49 | | $1,000 | | $1,021.27 | | $3.50 |
| Investor C | | $1,000 | | $1,011.10 | | $6.71 | | $1,000 | | $1,018.05 | | $6.74 |
| |
| |
| |
| |
| |
| |
|
| | 1 For each class of the Fund, expenses are equal to the annualized expense ratio for the class (0.39% for BlackRock, 0.35% for Institutional, 0.60% for Investor A, 0.45% for
Investor A1, 0.70% for Investor B and 1.35% for Investor C), multiplied by the average account value over the period, multiplied by 181/366 to reflect the one-half year
period shown.
2 Hypothetical 5% annual return before expenses is calculated by pro-rating the number of days in the most recent fiscal half year divided by 366. |
14 BLACKROCK MUNICIPAL BOND FUND, INC. JUNE 30, 2008
Disclosure of Expenses (continued)
BlackRock Municipal Insured Fund (Including Interest Expense and Fees)
| | | | | Actual | | | | | | Hypothetical2 | | |
| | | Beginning | | Ending | | | | Beginning | | Ending | | |
| | | Account Value | | Account Value | | Expenses Paid | | Account Value | | Account Value | | Expenses Paid |
| | | January 1, 2008 | | June 30, 2008 | | During the Period1 | | January 1, 2008 | | June 30, 2008 | | During the Period1 |
| Institutional | | $1,000 | | $990.70 | | $3.45 | | $1,000 | | $1,021.27 | | $3.50 |
| Investor A | | $1,000 | | $988.10 | | $4.77 | | $1,000 | | $1,019.13 | | $4.84 |
| Investor B | | $1,000 | | $985.60 | | $7.07 | | $1,000 | | $1,017.61 | | $7.18 |
| Investor C | | $1,000 | | $984.50 | | $8.69 | | $1,000 | | $1,015.97 | | $8.82 |
| Investor C1 | | $1,000 | | $985.40 | | $7.36 | | $1,000 | | $1,017.31 | | $7.48 |
| |
| |
| |
| |
| |
| |
|
| | 1 For each class of the Fund, expenses are equal to the annualized expense ratio for the class (0.70% for Institutional, 0.97% for Investor A, 1.44% for Investor B, 1.77% for
Investor C and 1.50% for Investor C1), multiplied by the average account value over the period, multiplied by 181/366 (to reflect the one-half year period shown).
2 Hypothetical 5% annual return before expenses is calculated by pro-rating the number of days in the most recent fiscal half year divided by 366. |
BlackRock Municipal Insured Fund (Excluding Interest Expense and Fees)
| | | | | Actual | | | | | | Hypothetical2 | | |
| | | Beginning | | Ending | | | | Beginning | | Ending | | |
| | | Account Value | | Account Value | | Expenses Paid | | Account Value | | Account Value | | Expenses Paid |
| | | January 1, 2008 | | June 30, 2008 | | During the Period1 | | January 1, 2008 | | June 30, 2008 | | During the Period1 |
| Institutional | | $1,000 | | $990.70 | | $2.26 | | $1,000 | | $1,022.45 | | $2.30 |
| Investor A | | $1,000 | | $988.10 | | $3.59 | | $1,000 | | $1,021.12 | | $3.65 |
| Investor B | | $1,000 | | $985.60 | | $5.99 | | $1,000 | | $1,018.69 | | $6.09 |
| Investor C | | $1,000 | | $984.50 | | $7.21 | | $1,000 | | $1,017.46 | | $7.33 |
| Investor C1 | | $1,000 | | $985.40 | | $6.23 | | $1,000 | | $1,018.45 | | $6.34 |
| |
| |
| |
| |
| |
| |
|
| | 1 For each class of the Fund, expenses are equal to the annualized expense ratio for the class (0.46% for Institutional, 0.73% for Investor A, 1.22% for Investor B, 1.47% for
Investor C and 1.27% for Investor C1), multiplied by the average account value over the period, multiplied by 181/366 to reflect the one-half year period shown.
2 Hypothetical 5% annual return before expenses is calculated by pro-rating the number of days in the most recent fiscal half year divided by 366. |
BLACKROCK MUNICIPAL BOND FUND, INC. JUNE 30, 2008 15
Disclosure of Expenses (continued)
BlackRock National Municipal Fund (Including Interest Expense and Fees)
| | | | | Actual | | | | | | Hypothetical2 | | |
| | | Beginning | | Ending | | | | Beginning | | Ending | | |
| | | Account Value | | Account Value | | Expenses Paid | | Account Value | | Account Value | | Expenses Paid |
| | | January 1, 2008 | | June 30, 2008 | | During the Period1 | | January 1, 2008 | | June 30, 2008 | | During the Period1 |
| Institutional | | $1,000 | | $993.80 | | $3.25 | | $1,000 | | $1,021.46 | | $3.30 |
| Investor A | | $1,000 | | $992.70 | | $4.48 | | $1,000 | | $1,020.23 | | $4.55 |
| Investor B | | $1,000 | | $990.10 | | $6.84 | | $1,000 | | $1,017.85 | | $6.94 |
| Investor C | | $1,000 | | $988.80 | | $8.51 | | $1,000 | | $1,016.17 | | $8.62 |
| Investor C1 | | $1,000 | | $989.90 | | $7.09 | | $1,000 | | $1,017.61 | | $7.18 |
| |
| |
| |
| |
| |
| |
|
| | 1 For each class of the Fund, expenses are equal to the annualized expense ratio for the class (0.66% for Institutional, 0.91% for Investor A, 1.39% for Investor B, 1.73% for
Investor C and 1.44% for Investor C1), multiplied by the average account value over the period, multiplied by 181/366 to reflect the one-half year period shown.
2 Hypothetical 5% annual return before expenses is calculated by pro-rating the number of days in the most recent fiscal half year divided by 366. |
BlackRock National Municipal Fund (Excluding Interest Expense and Fees)
| | | | | Actual | | | | | | Hypothetical2 | | |
| | | Beginning | | Ending | | | | Beginning | | Ending | | |
| | | Account Value | | Account Value | | Expenses Paid | | Account Value | | Account Value | | Expenses Paid |
| | | January 1, 2008 | | June 30, 2008 | | During the Period1 | | January 1, 2008 | | June 30, 2008 | | During the Period1 |
| Institutional | | $1,000 | | $993.80 | | $2.96 | | $1,000 | | $1,021.76 | | $3.00 |
| Investor A | | $1,000 | | $992.70 | | $4.09 | | $1,000 | | $1,020.62 | | $4.15 |
| Investor B | | $1,000 | | $990.10 | | $6.64 | | $1,000 | | $1,018.05 | | $6.74 |
| Investor C | | $1,000 | | $988.80 | | $7.97 | | $1,000 | | $1,016.72 | | $8.08 |
| Investor C1 | | $1,000 | | $989.90 | | $6.84 | | $1,000 | | $1,017.85 | | $6.94 |
| |
| |
| |
| |
| |
| |
|
| | 1 For each class of the Fund, expenses are equal to the annualized expense ratio for the class (0.60% for Institutional, 0.83% for Investor A, 1.35% for Investor B, 1.62% for
Investor C and 1.39% for Investor C1), multiplied by the average account value over the period, multiplied by 181/366 to reflect the one-half year period shown.
2 Hypothetical 5% annual return before expenses is calculated by pro-rating the number of days in the most recent fiscal half year divided by 366. |
16 BLACKROCK MUNICIPAL BOND FUND, INC. JUNE 30, 2008
Disclosure of Expenses (concluded)
BlackRock High Yield Municipal Fund (Including Interest Expense and Fees)
| | | | | Actual | | | | | | Hypothetical2 | | |
| | | Beginning | | Ending | | | | Beginning | | Ending | | |
| | | Account Value | | Account Value | | Expenses Paid | | Account Value | | Account Value | | Expenses Paid |
| | | January 1, 2008 | | June 30, 2008 | | During the Period1 | | January 1, 2008 | | June 30, 2008 | | During the Period1 |
| Institutional | | $1,000 | | $973.70 | | $4.15 | | $1,000 | | $1,020.52 | | $4.25 |
| Investor A | | $1,000 | | $972.50 | | $5.32 | | $1,000 | | $1,019.34 | | $5.44 |
| Investor C | | $1,000 | | $968.80 | | $9.01 | | $1,000 | | $1,015.58 | | $9.22 |
| |
| |
| |
| |
| |
| |
|
| | 1 For each class of the Fund, expenses are equal to the annualized expense ratio for the class (0.85% for Institutional, 1.09% for Investor A and 1.85% for Investor C),
multiplied by the average account value over the period, multiplied by 181/366 to reflect the one-half year period shown.
2 Hypothetical 5% annual return before expenses is calculated by pro-rating the number of days in the most recent fiscal half year divided by 366. |
BlackRock High Yield Municipal Fund (Excluding Interest Expense and Fees)
| | | | | Actual | | | | | | Hypothetical2 | | |
| | | Beginning | | Ending | | | | Beginning | | Ending | | |
| | | Account Value | | Account Value | | Expenses Paid | | Account Value | | Account Value | | Expenses Paid |
| | | January 1, 2008 | | June 30, 2008 | | During the Period1 | | January 1, 2008 | | June 30, 2008 | | During the Period1 |
| Institutional | | $1,000 | | $973.70 | | $3.90 | | $1,000 | | $1,020.77 | | $4.00 |
| Investor A | | $1,000 | | $972.50 | | $5.07 | | $1,000 | | $1,019.58 | | $5.19 |
| Investor C | | $1,000 | | $968.80 | | $8.81 | | $1,000 | | $1,015.78 | | $9.02 |
| |
| |
| |
| |
| |
| |
|
| | 1 For each class of the Fund, expenses are equal to the annualized expense ratio for the class (0.80% for Institutional, 1.04% for Investor A and 1.81% for Investor C),
multiplied by the average account value over the period, multiplied by 181/366 to reflect the one-half year period shown.
2 Hypothetical 5% annual return before expenses is calculated by pro-rating the actual days in the most recent fiscal half year divided by 366. |
BLACKROCK MUNICIPAL BOND FUND, INC. JUNE 30, 2008 17
Schedule of Investments June 30, 2008
BlackRock Short-Term Municipal Fund (Percentages shown are based on Net Assets)
| | | Par | | |
| Municipal Bonds | | (000) | | Value |
| |
| |
|
| |
| Alabama — 2.6% | | | | |
| Huntsville, Alabama, GO, Refunding, Series A, | | | | |
| 5.25%, 2/01/09 (a) | | $ 8,095 | | $ 8,258,438 |
| |
| |
|
| Arizona — 2.2% | | | | |
| Yavapai County, Arizona, IDA, Solid Waste Disposal | | | | |
| Revenue Bonds (Waste Management Inc. | | | | |
| Project), AMT, 4%, 6/01/27 | | 7,000 | | 6,852,790 |
| |
| |
|
| California — 2.3% | | | | |
| California State, Economic Recovery, GO, Series A, | | | | |
| 5%, 7/01/10 | | 2,000 | | 2,084,320 |
| San Francisco, California, City and County, GO, | | | | |
| Refunding, Series R1, 5%, 6/15/11 | | 5,000 | | 5,275,800 |
| | | | |
|
| | | | | 7,360,120 |
| |
| |
|
| Colorado — 2.3% | | | | |
| Denver, Colorado, City and County Airport, Revenue | | | | |
| Refunding Bonds, AMT, Sub-Series A1, 5%, 11/15/09 | | 7,000 | | 7,110,460 |
| |
| |
|
| Delaware — 3.3% | | | | |
| Delaware State, GO, Refunding, 5%, 3/01/11 | | 10,000 | | 10,516,900 |
| |
| |
|
| District of Columbia — 1.5% | | | | |
| Metropolitan Washington Airports Authority, D.C., Airport | | | | |
| System Revenue Refunding Bonds, AMT, Series A, | | | | |
| 5%, 10/01/10 (c) | | 4,665 | | 4,775,887 |
| |
| |
|
| Florida — 8.6% | | | | |
| Florida Hurricane Catastrophe Fund Financing | | | | |
| Corporation Revenue Bonds, Series A, 5%, 7/01/10 | | 7,000 | | 7,246,680 |
| Florida State Turnpike Authority, Turnpike Revenue | | | | |
| Refunding Bonds, Series A, 5%, 7/01/10 | | 3,000 | | 3,127,080 |
| Miami-Dade County, Florida, Educational Facilities | | | | |
| Authority Revenue Bonds (University of Miami), | | | | |
| Series A, 5.75%, 4/01/10 (c)(d) | | 2,020 | | 2,146,109 |
| Orange County, Florida, Tourist Development, Tax | | | | |
| Revenue Bonds, 5.50%, 10/01/09 (c)(d) | | 14,195 | | 14,768,336 |
| | | | |
|
| | | | | 27,288,205 |
| |
| |
|
| Georgia — 3.1% | | | | |
| Burke County, Georgia, Development Authority, PCR | | | | |
| (Georgia Power Company Vogtle Project), 5th Series, | | | | |
| 4.375%, 10/01/32 (b) | | 4,000 | | 4,037,440 |
| Catoosa County, Georgia, School District, GO, | | | | |
| 4.25%, 8/01/08 (f) | | 5,600 | | 5,611,984 |
| | | | |
|
| | | | | 9,649,424 |
| |
| |
|
| Illinois — 1.7% | | | | |
| Illinois Educational Facilities Authority, Revenue | | | | |
| Refunding Bonds (University of Chicago), | | | | |
| Series A, 5.25%, 7/01/11 (d) | | 5,000 | | 5,362,000 |
| |
| |
|
| | | Par | | |
| Municipal Bonds | | (000) | | Value |
| |
| |
|
| |
| Indiana — 1.9% | | | | |
| Indiana Bond Bank Revenue Bonds (State Revolving | | | | |
| Fund), Series B, 5.30%, 8/01/10 (d) | | $ 4,750 | | $5,043,360 |
| Indiana Health Facilities Financing Authority Revenue | | | | |
| Bonds (Ascension Health Credit Group), Series A3, | | | | |
| 5%, 11/01/27 (b) | | 1,000 | | 1,026,040 |
| | | | |
|
| | | | | 6,069,400 |
| |
| |
|
| Massachusetts — 2.6% | | | | |
| Massachusetts State Health and Educational Facilities | | | | |
| Authority, Revenue Refunding Bonds (Partners | | | | |
| Healthcare System), Series C, 5.75%, 7/01/11 (d) | | 7,600 | | 8,249,344 |
| |
| |
|
| Michigan — 3.1% | | | | |
| Detroit, Michigan, Water Supply System Revenue Bonds, | | | | |
| Second Lien, Series B, 5.50%, 7/01/11 (d)(e) | | 5,000 | | 5,397,600 |
| Michigan State Trunk Line Fund, Revenue Refunding | | | | |
| Bonds, Series B, 5%, 9/01/10 (a) | | 4,120 | | 4,310,756 |
| | | | |
|
| | | | | 9,708,356 |
| |
| |
|
| Minnesota — 2.1% | | | | |
| Minneapolis and Saint Paul, Minnesota, Metropolitan | | | | |
| Airports Commission, Airport Revenue Bonds, AMT, | | | | |
| Series B, 5.50%, 1/01/10 (e) | | 2,620 | | 2,663,335 |
| Minnesota State, GO, 5%, 8/01/11 | | 3,675 | | 3,885,210 |
| | | | |
|
| | | | | 6,548,545 |
| |
| |
|
| Missouri — 1.2% | | | | |
| Missouri State Health and Educational Facilities | | | | |
| Authority, Revenue Refunding Bonds (Ascension | | | | |
| Health), VRDN, Series C-5, 3.50%, 11/15/09 (b) | | 3,780 | | 3,777,694 |
| |
| |
|
| Nebraska — 0.7% | | | | |
| Central Plains Energy Project, Nebraska, Revenue | | | | |
| Bonds (Gas Project Number 1), VRDN, | | | | |
| 2.06%, 12/01/10 (b) | | 2,500 | | 2,356,250 |
| |
| |
|
| Nevada — 4.5% | | | | |
| Clark County, Nevada, Airport System Subordinate Lien | | | | |
| Revenue Bonds, AMT, Series B-1, 5%, 7/01/08 | | 6,500 | | 6,500,455 |
| Clark County, Nevada, EDR (Alexander Dawson School | | | | |
| of Nevada Project), 5.50%, 5/15/09 (d) | | 7,500 | | 7,817,250 |
| | | | |
|
| | | | | 14,317,705 |
| |
| |
|
| New Jersey — 3.2% | | | | |
| New Jersey Building Authority, State Building Revenue | | | | |
| Refunding Bonds, Series B, 5.25%, 12/15/10 (c) | | 4,790 | | 5,022,363 |
| New Jersey State Turnpike Authority, Turnpike Revenue | | | | |
| Refunding Bonds, Series A, 5.75%, 1/01/10 (d)(f) | | 5,000 | | 5,236,700 |
| | | | |
|
| | | | | 10,259,063 |
| |
| |
|
| Portfolio Abbreviations | | | | | | | | |
| |
| |
| |
| |
|
| |
| To simplify the listings of portfolio holdings in the | | DRIVERS | | Derivative Inverse Tax-Exempt Receipts | | M/F | | Multi-Family |
| Schedules of Investments, the names of many of the | | EDA | | Economic Development Authority | | PCR | | Pollution Control Revenue Bonds |
| securities have been abbreviated according to the list | | EDR | | Economic Development Revenue Bonds | | RIB | | Residual Interest Bonds |
| below and on the right. | | GO | | General Obligation Bonds | | SAVRS | | Select Auction Variable Rate Securities |
| | | | | HDA | | Housing Development Agency | | S/F | | Single-Family |
| AMT | | Alternative Minimum Tax (subject to) | | HFA | | Housing Finance Agency | | SIFMA | | Securities Industry and Financial |
| CABS | | Capital Appreciation Bonds | | IDA | | Industrial Development Authority | | | | Markets Association |
| CARS | | Complementary Auction Rate Securities | | IDB | | Industrial Development Board | | TRAN | | Tax Revenue Anticipation Notes |
| COP | | Certificates of Participation | | IDR | | Industrial Development Revenue Bonds | | VRDN | | Variable Rate Demand Notes |
| |
| |
| See Notes to Financial Statements. | | | | | | | | |
| | |
| |
| |
| |
|
18 BLACKROCK MUNICIPAL BOND FUND, INC.
Schedule of Investments (continued)
BlackRock Short-Term Municipal Fund (Percentages shown are based on Net Assets)
| | | | | Par | | |
| Municipal Bonds | | | | (000) | | Value |
| |
| |
| |
|
| |
| New Mexico — 1.8% | | | | | | |
| New Mexico State, Severance Tax Bonds, Series A, | | | | | | |
| 5%, 7/01/08 (f) | | $ 5,685 | | $ 5,685,512 |
| |
| |
|
| New York — 8.1% | | | | | | |
| Metropolitan Transportation Authority, New York, | | | | | | |
| Dedicated Tax Fund Revenue Bonds, Series A, | | | | | | |
| 5.875%, 4/01/10 (d)(e) | | | | 5,000 | | 5,282,100 |
| Metropolitan Transportation Authority, New York, | | | | | | |
| Transportation Revenue Bonds, VRDN, Series B, | | | | | | |
| 5%, 11/15/11 (b) | | | | 4,000 | | 4,163,120 |
| New York City, New York, GO, Refunding, Series B, | | | | | | |
| 5.25%, 8/01/11 | | | | 4,000 | | 4,220,960 |
| New York State Urban Development Corporation, | | | | | | |
| Personal Income Tax Revenue Bonds, Series C, | | | | | | |
| 5%, 3/15/10 | | | | 7,705 | | 8,017,515 |
| Tobacco Settlement Financing Corporation of New York, | | | | |
| Asset-Backed Revenue Refunding Bonds, Series B, | | | | | | |
| 4%, 6/01/09 | | | | 4,000 | | 4,055,600 |
| | | | | | |
|
| | | | | | | 25,739,295 |
| |
| |
| |
|
| North Carolina — 1.4% | | | | | | |
| Mecklenburg County, North Carolina, GO, Series B, | | | | | | |
| 4%, 2/01/10 | | | | 3,000 | | 3,067,110 |
| North Carolina, HFA, M/F Housing Revenue Bonds | | | | | | |
| (Cedar Hills Apartments LLC), VRDN, AMT, | | | | | | |
| 3.70%, 1/01/38 (b) | | | | 1,240 | | 1,238,202 |
| | | | | | |
|
| | | | | | | 4,305,312 |
| |
| |
| |
|
| Ohio — 2.7% | | | | | | |
| Ohio State Building Authority, State Facilities Revenue | | | | |
| Bonds (Administrative Building Fund Projects), | | | | | | |
| Series A, 5.375%, 10/01/08 (d) | | | | 4,400 | | 4,481,840 |
| Ohio State, Common Schools, GO, Series A, | | | | | | |
| 5%, 3/15/11 | | | | 3,875 | | 4,068,169 |
| | | | | | |
|
| | | | | | | 8,550,009 |
| |
| |
| |
|
| Pennsylvania — 5.4% | | | | | | |
| Bethlehem, Pennsylvania, Area School District, GO, | | | | | | |
| Refunding, Series A, 5%, 9/01/10 (f) | | | | 4,000 | | 4,159,560 |
| Buck County, Pennsylvania, IDA, Solid Waste Revenue | | | | | | |
| Bonds (Waste Management, Inc. Project), VRDN, AMT, | | | | |
| 3.90%, 2/01/10 (b) | | | | 2,670 | | 2,636,278 |
| Pennsylvania State, GO, Refunding, Third Series, | | | | | | |
| 5%, 7/01/09 | | | | 5,000 | | 5,160,300 |
| University of Pittsburgh, Pennsylvania, The Commonwealth | | | | |
| System of Higher Education, Revenue Refunding Bonds | | | | |
| (Pittsburgh Asset Notes-Panthers), 5%, 8/01/10 | | | | 5,000 | | 5,233,100 |
| | | | | | |
|
| | | | | | | 17,189,238 |
| |
| |
| |
|
| Rhode Island — 0.3% | | | | | | |
| Rhode Island State and Providence Plantations, GO, | | | | | | |
| Refunding (Consolidated Capital Development Loan), | | | | |
| 5%, 7/15/11 | | | | 1,000 | | 1,053,990 |
| |
| |
| |
|
| | | | | Par | | |
| Municipal Bonds | | | | (000) | | Value |
| |
| |
| |
|
| |
| South Carolina — 2.9% | | | | | | |
| Aiken County, South Carolina, Consolidated School | | | | | | |
| District, GO, Refunding, 5%, 3/01/09 | | $ 4,590 | | $4,689,695 |
| Hilton Head Island, South Carolina, Public Facility | | | | | | |
| Corporation, COP (Beach Preservation Fee Pledge)(f): | | | | |
| 5%, 8/01/08 | | | | 2,160 | | 2,165,810 |
| 5%, 8/01/09 | | | | 2,240 | | 2,311,993 |
| | | | | | |
|
| | | | | | | 9,167,498 |
| |
| |
| |
|
| Tennessee — 1.3% | | | | | | |
| Tennessee Energy Acquisition Corporation, Gas Revenue | | | | |
| Bonds, Series A, 5%, 9/01/09 | | | | 4,000 | | 4,034,360 |
| |
| |
| |
|
| Texas — 16.4% | | | | | | |
| Austin, Texas, Independent School District, GO, | | | | | | |
| Refunding, 5.25%, 8/01/09 | | | | 3,980 | | 4,121,489 |
| Harris County, Texas, Health Facilities Development | | | | | | |
| Corporation, Revenue Refunding Bonds (Saint Luke’s | | | | |
| Episcopal Hospital), Series A, 5.375%, 8/15/11 (d) | | 5,500 | | 5,844,575 |
| Harris County, Texas, Toll Road Revenue Refunding | | | | | | |
| Bonds, Series B-2, 5%, 8/15/21 (b)(e) | | | | 5,000 | | 5,097,550 |
| Matagorda County, Texas, Navigation District Number 1, | | | | |
| PCR, Refunding (AEP Texas Central Company | | | | | | |
| Project), VRDN, 5.125%, 6/01/11 (b) | | | | 5,000 | | 5,014,300 |
| Montgomery County, Texas, Unlimited Tax Adjustable | | | | | | |
| Rate Road, GO, Series B, 5%, 3/01/28 (a)(b) | | | | 2,200 | | 2,210,384 |
| North Texas Tollway Authority, Dallas North Tollway | | | | | | |
| System, Revenue Refunding Bonds, Series B, | | | | | | |
| 5%, 1/01/38 (b)(c) | | | | 2,790 | | 2,789,302 |
| North Texas Tollway Authority, System Revenue | | | | | | |
| Refunding Bonds, First Tier, VRDN, Series E-1, | | | | | | |
| 5%, 1/01/10 (b) | | | | 7,000 | | 7,104,160 |
| San Antonio, Texas, Electric and Gas Revenue Bonds, | | | | | | |
| Junior Lien, VRDN, 3.625%, 12/01/27 (b) | | | | 5,000 | | 5,066,950 |
| Tarrant County, Texas, Cultural Education Facilities | | | | | | |
| Financing Corporation, Revenue Refunding Bonds | | | | | | |
| (Texas Health Resources), Series A, 5%, 2/15/11 | | | | 4,275 | | 4,429,969 |
| Texas State, GO, TRAN, 4.50%, 8/28/08 | | | | 5,000 | | 5,020,750 |
| University of Texas, Financing System Revenue | | | | | | |
| Refunding Bonds, Series B, 5%, 8/15/10 | | | | 5,000 | | 5,228,000 |
| | | | | | |
|
| | | | | | | 51,927,429 |
| |
| |
| |
|
| Virginia — 1.6% | | | | | | |
| Virginia State Public School Authority, School | | | | | | |
| Financing Revenue Bonds, Series B, 5%, 8/01/08 (d) | | 4,885 | | 4,947,381 |
| |
| |
|
| Washington — 4.2% | | | | | | |
| Energy Northwest, Washington, Electric Revenue | | | | | | |
| Refunding Bonds (Columbia Generating Station), | | | | | | |
| Series A, 5.25%, 7/01/09 (c) | | | | 9,940 | | 10,193,768 |
| Tacoma, Washington, Electric System Revenue | | | | | | |
| Refunding Bonds, Series A, 5.625%, 1/01/11 (a)(d) | | 2,900 | | 3,114,252 |
| | | | |
|
| | | | | | | 13,308,020 |
| |
| |
| |
|
| Wisconsin — 2.3% | | | | | | |
| Wisconsin Public Power Inc., Power Supply System, | | | | | | |
| Revenue Refunding Bonds, Series | | | | | | |
| A, 5.25%, 7/01/10 (f) | | | | 7,070 | | 7,365,738 |
| |
| |
| |
|
| Total Municipal Bonds (Cost — $300,084,038) — 95.3% | | | | 301,734,363 |
| |
| |
|
| See Notes to Financial Statements. |
| BLACKROCK MUNICIPAL BOND FUND, INC. |
Schedule of Investments (concluded)
BlackRock Short-Term Municipal Fund (Percentages shown are based on Net Assets)
| Short-Term Securities | | Shares | | Value |
| |
| |
|
| Merrill Lynch Institutional Tax-Exempt Fund, | | | | |
| 1.73% (g)(h) | | 9,212,054 | | $ 9,212,054 |
| |
| |
|
| Total Short-Term Securities | | | | |
| (Cost — $9,212,054) — 2.9% | | | | 9,212,054 |
| |
| |
|
| Total Investments (Cost — $309,296,092*) — 98.2% | | | | 310,946,417 |
| Other Assets Less Liabilities — 1.8% | | | | 5,459,169 |
| | | | |
|
| Net Assets — 100.0% | | | | $ 316,405,586 |
| | |
| |
|
* The cost and unrealized appreciation (depreciation) of investments as of June
30, 2008, as computed for federal income tax purposes, were as follows:
| Aggregate cost | | $ 309,296,092 |
| | |
|
| Gross unrealized appreciation | | $ 2,487,125 |
| Gross unrealized depreciation | | (836,800) |
| | |
|
| Net unrealized appreciation | | $ 1,650,325 |
| | |
|
| (a) FSA Insured. | | |
(b) Variable rate security. Rate shown is as of report date. Maturity shown is the final
maturity date.
(c) AMBAC Insured.
(d) U.S. government securities, held in escrow, are used to pay interest on this
security as well as to retire the bond in full at the date indicated, typically at a
premium to par.
(e) FGIC Insured.
(f) MBIA Insured.
(g) Investments in companies considered to be an affiliate of the Fund, for purposes
of Section 2(a)(3) of the Investment Company Act of 1940, were as follows:
| | | Net | | Dividend |
| Affiliate | | Activity | | Income |
| |
| |
|
| Merrill Lynch Institutional Tax-Exempt Fund | | 2,608,852 | | $362,305 |
| |
| |
|
| (h) Represents the current yield as of report date. | | | | |
| | See Notes to Financial Statements. |
20 BLACKROCK MUNICIPAL BOND FUND, INC.
Schedule of Investments June 30, 2008
BlackRock Municipal Insured Fund
(Percentages shown are based on Net Assets)
| | | Par | | |
| Municipal Bonds | | (000) | | Value |
| |
| |
|
| |
| Alabama — 3.2% | | | | |
| Lauderdale County and Florence, Alabama, Health | | | | |
| Care Authority Revenue Refunding Bonds | | | | |
| (Coffee Health Group), Series A, 6%, 7/01/29 (a) | | $10,000 | | $10,548,100 |
| University of Alabama, General Revenue Bonds, | | | | |
| Series A, 5%, 7/01/34 (a) | | 7,840 | | 7,868,224 |
| University of Alabama, University Revenue Bonds | | | | |
| (Birmingham), 6%, 10/01/09 (b)(c) | | 7,000 | | 7,325,710 |
| | | | |
|
| | | | | 25,742,034 |
| |
| |
|
| Arkansas — 0.5% | | | | |
| University of Arkansas, University Revenue Bonds | | | | |
| (Various Facilities-Fayetteville Campus), | | | | |
| 5%, 12/01/27 (c) | | 4,000 | | 4,034,520 |
| |
| |
|
| California — 15.4% | | | | |
| Antelope Valley, California, Community College District, | | | | |
| GO (Election of 2004), Series B, 5.25%, 8/01/39 (a) | | 1,050 | | 1,062,054 |
| Arcadia, California, Unified School District, | | | | |
| GO (Election of 2006), Series A, | | | | |
| 4.96%, 8/01/39 (d)(n) | | 2,800 | | 490,476 |
| Cabrillo, California, Community College District, GO | | | | |
| (Election of 2004), Series B, 5.20%, 8/01/37 (a)(n) | | 4,100 | | 751,120 |
| California State Department of Veteran Affairs, Home | | | | |
| Purchase Revenue Refunding Bonds, Series A, | | | | |
| 5.35%, 12/01/27 (e) | | 2,075 | | 2,108,947 |
| Coast Community College District, California, GO, | | | | |
| Refunding (Election of 2002), Series C (d): | | | | |
| 5.19%, 8/01/13 (p) | | 6,475 | | 4,887,654 |
| 5.392%, 8/01/36 (n) | | 5,800 | | 1,243,056 |
| Corona-Norco, California, Unified School District, GO | | | | |
| (Election of 2006), Series A, 5%, 8/01/31 (d) | | 2,000 | | 2,035,000 |
| Fresno, California, Unified School District, GO | | | | |
| (Election of 2001): | | | | |
| Series D, 5%, 8/01/27 (a) | | 5,170 | | 5,209,654 |
| Series E, 5%, 8/01/30 (d) | | 1,500 | | 1,527,900 |
| Hesperia, California, Public Financing Authority Revenue | | | | |
| Bonds (Redevelopment and Housing Projects), | | | | |
| Series A, 5.50%, 9/01/27 (f) | | 10,000 | | 9,847,900 |
| Los Angeles, California, Municipal Improvement | | | | |
| Corporation, Lease Revenue Bonds, Series B1, | | | | |
| 4.75%, 8/01/37 (c) | | 13,000 | | 12,219,870 |
| Modesto, California, Schools Infrastructure Financing | | | | |
| Agency, Special Tax Bonds, 5.50%, 9/01/36 (e) | | 8,965 | | 8,996,826 |
| Mount Diablo, California, Unified School District, GO | | | | |
| (Election of 2002), 5%, 7/01/27 (c) | | 12,040 | | 11,865,781 |
| Orange County, California, Sanitation District, COP, | | | | |
| Series B, 5%, 2/01/31 (d) | | 1,380 | | 1,387,590 |
| Palm Springs, California, Financing Authority, Lease | | | | |
| Revenue Refunding Bonds (Convention Center Project), | | | | |
| Series A, 5.50%, 11/01/35 (a) | | 6,440 | | 6,603,898 |
| Ramona, California, Unified School District, Convertible | | | | |
| Capital Appreciation Refunding Bonds, COP, | | | | |
| 5.106%, 5/01/32 (c)(p) | | 10,500 | | 8,507,415 |
| Rancho Cucamonga, California, Redevelopment | | | | |
| Agency, Tax Allocation Refunding Bonds (Rancho | | | | |
| Redevelopment Project), Series A, 5%, 9/01/34 (a) | | 675 | | 656,991 |
| Rialto, California, Unified School District, GO, Series A, | | | | |
| 6.24%, 6/01/25 (c)(n) | | 11,685 | | 4,606,461 |
| Roseville, California, Joint Union High School District, | | | | |
| GO (Election of 2004), Series A, 5%, 8/01/29 (c) | | 5,000 | | 5,020,600 |
| | | Par | | |
| Municipal Bonds | | (000) | | Value |
| |
| |
|
| |
| California (concluded) | | | | |
| Sacramento, California, Unified School District, GO | | | | |
| (Election of 1999), Series B, 5%, 7/01/26 (c) | | $ 5,075 | | $5,133,667 |
| San Diego, California, Community College District, | | | | |
| GO (Election of 2002), 5%, 5/01/30 (d) | | 2,685 | | 2,728,309 |
| San Diego County, California, Water Authority, Water | | | | |
| Revenue Refunding Bonds, COP, Series A, | | | | |
| 5%, 5/01/33 (d) | | 4,500 | | 4,559,040 |
| San Jose, California, Airport Revenue Refunding | | | | |
| Bonds, AMT, Series A, 5.50%, 3/01/32 (e) | | 6,600 | | 6,504,960 |
| San Jose, California, GO (Libraries, Parks and Public | | | | |
| Safety Projects), 5%, 9/01/30 (a) | | 3,700 | | 3,729,896 |
| Tahoe Truckee, California, Unified School District, | | | | |
| GO (School Facilities Improvement District | | | | |
| Number 2), Series A, 5.25%, 8/01/29 (a) | | 2,755 | | 2,784,231 |
| Washington, California, Unified School District, | | | | |
| COP (New High School Project), | | | | |
| 5.125%, 8/01/37 (e) | | 10,000 | | 9,734,200 |
| | | | |
|
| | | | | 124,203,496 |
| |
| |
|
| Colorado — 2.6% | | | | |
| Aurora, Colorado, COP, 6%, 12/01/10 (b)(e) | | 19,250 | | 20,666,800 |
| |
| |
|
| Florida — 5.0% | | | | |
| Duval County, Florida, School Board, COP | | | | |
| (Master Lease Program), 5%, 7/01/33 (d) | | 3,800 | | 3,741,366 |
| Hillsborough County, Florida, Aviation Authority Revenue | | | | |
| Bonds, AMT, Series A, 5.375%, 10/01/33 (h) | | 5,000 | | 4,982,450 |
| Miami, Florida, Special Obligation Revenue Bonds | | | | |
| (Street and Sidewalk Improvement Program), | | | | |
| 5%, 1/01/37 (a) | | 1,350 | | 1,286,982 |
| Miami-Dade County, Florida, Aviation Revenue Refunding | | | | |
| Bonds (Miami International Airport), AMT, Series A: | | | | |
| 5.50%, 10/01/26 (h) | | 7,000 | | 7,075,880 |
| 5.50%, 10/01/27 (h) | | 5,495 | | 5,537,312 |
| 5%, 10/01/39 (a) | | 15,000 | | 13,368,900 |
| Miami-Dade County, Florida, School Board, COP, | | | | |
| Refunding, Series B, 5.25%, 5/01/31 (h) | | 2,500 | | 2,522,775 |
| West Coast Regional Water Supply Authority, Florida, | | | | |
| Capital Improvement Revenue Bonds, 10.40%, | | | | |
| 10/01/10 (b)(e) | | 1,260 | | 1,383,946 |
| | | | |
|
| | | | | 39,899,611 |
| |
| |
|
| Georgia — 4.9% | | | | |
| Atlanta, Georgia, Water and Wastewater Revenue | | | | |
| Bonds, 5%, 11/01/34 (d) | | 4,000 | | 4,014,800 |
| Georgia Municipal Electric Authority, Power Revenue | | | | |
| Refunding Bonds (e): | | | | |
| Series EE, 7%, 1/01/25 | | 20,000 | | 25,293,600 |
| Series Y, 6.40%, 1/01/11 (b) | | 90 | | 97,484 |
| Series Y, 6.40%, 1/01/13 | | 8,420 | | 9,200,366 |
| Series Y, 6.40%, 1/01/13 (i) | | 490 | | 537,412 |
| | | | |
|
| | | | | 39,143,662 |
| |
| |
|
| Illinois — 2.3% | | | | |
| Chicago, Illinois, O'Hare International Airport Revenue | | | | |
| Bonds, Third Lien, AMT, Series B-2, 6%, 1/01/27 (a) | | 17,690 | | 18,206,371 |
| |
| |
|
| Kansas — 0.7% | | | | |
| Manhattan, Kansas, Hospital Revenue Bonds | | | | |
| (Mercy Health Center), 5.50%, 8/15/20 (d) | | 5,145 | | 5,386,301 |
| |
| |
|
See Notes to Financial Statements.
| BLACKROCK MUNICIPAL BOND FUND, INC. |
Schedule of Investments (continued)
BlackRock Municipal Insured Fund
(Percentages shown are based on Net Assets)
| | | Par | | |
| Municipal Bonds | | (000) | | Value |
| |
| |
|
| |
| Louisiana — 1.0% | | | | |
| Louisiana State Citizens Property Insurance | | | | |
| Corporation, Assessment Revenue Bonds, | | | | |
| Series B, 5%, 6/01/22 (e) | | $ 2,150 | | $2,082,856 |
| New Orleans, Louisiana, GO (Public Improvements), | | | | |
| 5.25%, 12/01/29 (e) | | 4,000 | | 3,929,160 |
| Rapides Financing Authority, Louisiana, Revenue Bonds | | | | |
| (Cleco Power LLC Project), AMT, 4.70%, 11/01/36 (e) | | 2,800 | | 2,385,544 |
| | | | |
|
| | | | | 8,397,560 |
| |
| |
|
| Maryland — 3.2% | | | | |
| Baltimore, Maryland, Convention Center Hotel Revenue | | | | |
| Bonds, Senior Series A, 5.25%, 9/01/39 (f) | | 20,140 | | 20,526,889 |
| Maryland State Health and Higher Educational Facilities | | | | |
| Authority Revenue Bonds (University of Maryland | | | | |
| Medical System), Series B, 7%, 7/01/22 (c) | | 4,400 | | 5,393,916 |
| | | | |
|
| | | | | 25,920,805 |
| |
| |
|
| Massachusetts — 2.5% | | | | |
| Massachusetts State, HFA, Rental Housing Mortgage | | | | |
| Revenue Bonds, AMT, Series C, 5.60%, 1/01/45 (d) | | 4,000 | | 4,062,920 |
| Massachusetts State, HFA, S/F Housing Revenue | | | | |
| Bonds, AMT, Series 128 (d): | | | | |
| 4.80%, 12/01/27 | | 2,845 | | 2,644,968 |
| 4.875%, 12/01/38 | | 7,000 | | 6,290,480 |
| Massachusetts State School Building Authority, | | | | |
| Dedicated Sales Tax Revenue Bond, Series A, | | | | |
| 5%, 8/15/30 (d) | | 7,000 | | 7,108,570 |
| | | | |
|
| | | | | 20,106,938 |
| |
| |
|
| Michigan — 2.7% | | | | |
| Detroit, Michigan, Sewage Disposal System Second | | | | |
| Lien Revenue Bonds, Series B, 5%, 7/01/36 (c)(a) | | 5,000 | | 4,831,900 |
| Detroit, Michigan, Sewage Disposal System, Second | | | | |
| Lien Revenue Refunding Bonds, Series E, | | | | |
| 5.75%, 7/01/31 (c)(j) | | 4,000 | | 4,338,760 |
| Detroit, Michigan, Water Supply System Revenue Bonds, | | | | |
| Senior Lien, Series A, 5%, 7/01/30 (c) | | 1,500 | | 1,436,310 |
| Michigan State Strategic Fund, Limited Obligation | | | | |
| Revenue Refunding Bonds (Detroit Edison Company | | | | |
| Pollution Control Project), AMT, Series A, | | | | |
| 5.50%, 6/01/30 (f) | | 11,845 | | 11,535,609 |
| | | | |
|
| | | | | 22,142,579 |
| |
| |
|
| Minnesota — 1.9% | | | | |
| Delano, Minnesota, Independent School District | | | | |
| Number 879, GO, Series A, 5.875%, 2/01/25 (d) | | 5,860 | | 6,261,879 |
| Sauk Rapids, Minnesota, Independent School District | | | | |
| Number 047, GO, Series A (a): | | | | |
| 5.65%, 2/01/20 | | 3,735 | | 3,970,417 |
| 5.70%, 2/01/21 | | 4,440 | | 4,725,314 |
| | | | |
|
| | | | | 14,957,610 |
| |
| |
|
| Mississippi — 1.5% | | | | |
| Harrison County, Mississippi, Wastewater Management | | | | |
| District, Revenue Refunding Bonds (Wastewater | | | | |
| Treatment Facilities), Series A, 8.50%, 2/01/13 (c)(i) | | 1,320 | | 1,600,210 |
| Mississippi Hospital Equipment and Facilities Authority | | | | |
| Revenue Bonds (Forrest County General Hospital | | | | |
| Project), 6%, 1/01/11 (b)(d) | | 10,000 | | 10,780,800 |
| | | | |
|
| | | | | 12,381,010 |
| |
| |
|
| | | Par | | |
| Municipal Bonds | | (000) | | Value |
| |
| |
|
| |
| Missouri — 2.8% | | | | |
| Kansas City, Missouri, Airport Revenue Refunding and | | | | |
| Improvement Bonds, Series A (a): | | | | |
| 5.50%, 9/01/13 | | $12,990 | | $ 13,198,879 |
| 5.50%, 9/01/14 | | 9,000 | | 9,143,820 |
| | | | |
|
| | | | | 22,342,699 |
| |
| |
|
| Nebraska — 0.6% | | | | |
| Public Power Generation Agency, Nebraska, Revenue | | | | |
| Bonds (Whelan Energy Center Unit 2), Series A, | | | | |
| 5%, 1/01/25 (e) | | 5,000 | | 5,037,900 |
| |
| |
|
| Nevada — 0.3% | | | | |
| Clark County, Nevada, IDR (Southwest Gas Corp. | | | | |
| Project), AMT (c): | | | | |
| Series A, 4.75%, 9/01/36 | | 1,265 | | 987,244 |
| Series D, 5.25%, 3/01/38 | | 2,200 | | 1,852,730 |
| | | | |
|
| | | | | 2,839,974 |
| |
| |
|
| New Jersey — 8.2% | | | | |
| Cape May County, New Jersey, Industrial Pollution Control | | | | |
| Financing Authority, Revenue Refunding Bonds | | | | |
| (Atlantic City Electric Company Project), Series A, | | | | |
| 6.80%, 3/01/21 (a) | | 6,810 | | 8,028,445 |
| Garden State Preservation Trust of New Jersey, Open Space | | |
| and Farmland Preservation Revenue Bonds, Series A (d): | | |
| 5.80%, 11/01/21 | | 3,125 | | 3,459,250 |
| 5.80%, 11/01/22 | | 8,310 | | 9,163,520 |
| 5.80%, 11/01/23 | | 4,340 | | 4,777,168 |
| New Jersey EDA, Motor Vehicle Surcharge Revenue Bonds, | | |
| Series A (a): | | | | |
| 5%, 7/01/27 | | 5,000 | | 5,010,250 |
| 5.25%, 7/01/33 | | 23,000 | | 23,390,310 |
| New Jersey State Transportation Trust Fund Authority, | | | | |
| Transportation System Revenue Bonds, Series D, | | | | |
| 5%, 6/15/19 (d) | | 11,530 | | 12,060,149 |
| | | | |
|
| | | | | 65,889,092 |
| |
| |
|
| New Mexico — 0.7% | | | | |
| New Mexico Finance Authority, Senior Lien State | | | | |
| Transportation Revenue Bonds, Series A, 5.125%, | | | | |
| 6/15/18 (a) | | 5,000 | | 5,248,450 |
| |
| |
|
| New York — 7.7% | | | | |
| New York City, New York, GO, Series C (f): | | | | |
| 5.625%, 3/15/12 (b) | | 11,495 | | 12,480,236 |
| 5.625%, 3/15/18 | | 5 | | 5,297 |
| New York City, New York, Sales Tax Asset Receivable | | | | |
| Corporation Revenue Bonds: | | | | |
| DRIVERS, Series 1133Z, 8.185%, | | | | |
| 10/15/12 (e)(g) | | 2 | | 2,692 |
| RIB, Series 2577, 7.808%, 4/15/13 (a)(g) | | 2 | | 2,683 |
| Series A, 5%, 10/15/32 (e) | | 15,650 | | 15,944,690 |
| New York State Urban Development Corporation, | | | | |
| Personal Income Tax Revenue Bonds (State | | | | |
| Facilities), Series A-1, 5.25%, 3/15/34 (c) | | 10,000 | | 10,247,700 |
| Niagara Falls, New York, GO, Public Improvement, | | | | |
| 6.90%, 3/01/24 (a) | | 5 | | 5,006 |
| Tobacco Settlement Financing Corporation of New York | | | | |
| Revenue Bonds, Series A-1, 5.25%, 6/01/22 (e) | | 22,500 | | 23,218,425 |
| | | | |
|
| | | | | 61,906,729 |
| |
| |
|
See Notes to Financial Statements.
22 BLACKROCK MUNICIPAL BOND FUND, INC.
Schedule of Investments (continued)
BlackRock Municipal Insured Fund
(Percentages shown are based on Net Assets)
| | | Par | | |
| Municipal Bonds | | (000) | | Value |
| |
| |
|
| |
| North Carolina — 0.4% | | | | |
| North Carolina HFA, Home Ownership Revenue Bonds, | | | | |
| AMT, Series 14-A, 5.35%, 1/01/22 (e) | | $ 2,880 | | $ 2,888,698 |
| |
| |
|
| North Dakota — 0.3% | | | | |
| North Dakota State, HFA, Revenue Bonds (Housing | | | | |
| Finance Program), Series C, 5.30%, 7/01/22 (e) | | 2,355 | | 2,345,038 |
| |
| |
|
| Oklahoma — 0.8% | | | | |
| Oklahoma State Industries Authority, Health System | | | | |
| Revenue Refunding Bonds (Integris Obligated Group), | | | | |
| Series A, 6.25%, 8/15/09 (a)(b) | | 6,385 | | 6,745,050 |
| |
| |
|
| Oregon — 1.7% | | | | |
| Oregon State Department of Administrative Services, | | | | |
| COP, Series A, 6.25%, 5/01/10 (b)(e) | | 8,700 | | 9,339,189 |
| Port of Portland, Oregon, Airport Revenue Refunding | | | | |
| Bonds (Portland International Airport), AMT, | | | | |
| Series 7-B, 7.10%, 1/01/12 (a)(b) | | 3,865 | | 4,322,384 |
| | | | |
|
| | | | | 13,661,573 |
| |
| |
|
| Pennsylvania — 1.3% | | | | |
| Philadelphia, Pennsylvania, Gas Works Revenue Bonds, | | | | |
| 12th Series B, 7%, 5/15/20 (a)(i) | | 5,260 | | 6,211,008 |
| Philadelphia, Pennsylvania, Redevelopment Authority | | | | |
| Revenue Bonds (Neighborhood Transformation), | | | | |
| Series A, 5.50%, 4/15/20 (c) | | 4,420 | | 4,439,978 |
| | | | |
|
| | | | | 10,650,986 |
| |
| |
|
| Rhode Island — 0.9% | | | | |
| Rhode Island State Economic Development Corporation, | | | | |
| Airport Revenue Bonds, Series B, 6%, 7/01/10 (b)(c) | | 6,815 | | 7,316,584 |
| |
| |
|
| Texas — 8.0% | | | | |
| Dallas-Fort Worth, Texas, International Airport Revenue | | | | |
| Bonds, AMT, Series A: | | | | |
| 6%, 11/01/28 (c) | | 25,950 | | 26,049,648 |
| 5.50%, 11/01/33 (a) | | 5,000 | | 4,846,850 |
| Houston, Texas, Water Conveyance System Contract, | | | | |
| COP, Series J, 6.25%, 12/15/13 (e) | | 3,500 | | 3,877,965 |
| Lewisville, Texas, Independent School District, Capital | | | | |
| Appreciation and School Building, GO, Refunding, | | | | |
| 4.67%, 8/15/24 (c)(n) | | 8,110 | | 3,316,503 |
| North Texas Tollway Authority, System Revenue | | | | |
| Refunding Bonds, First Tier: | | | | |
| 5.75%, 1/01/40 (a) | | 7,700 | | 7,892,500 |
| Series A, 6%, 1/01/25 | | 1,000 | | 1,051,730 |
| Series A, 5.625%, 1/01/33 (e) | | 2,240 | | 2,282,066 |
| Series B, 5.75%, 1/01/40 (a) | | 9,870 | | 10,116,750 |
| Texas State Department of Housing and Community | | | | |
| Affairs, S/F Mortgage Revenue Bonds, AMT, | | | | |
| Series A (a)(k): | | | | |
| 5.45%, 9/01/23 | | 2,060 | | 2,066,407 |
| 5.50%, 3/01/26 | | 2,655 | | 2,658,266 |
| | | | |
|
| | | | | 64,158,685 |
| |
| |
|
| | | | | Par | | |
| Municipal Bonds | | | | (000) | | Value |
| |
| |
| |
|
| |
| Utah — 1.6% | | | | | | |
| Utah Transit Authority, Sales Tax Revenue Bonds, | | | | | | |
| Series A, 5%, 6/15/36 (d) | | $ 4,000 | | $ 4,034,280 |
| Utah Transit Authority, Sales Tax Revenue Refunding | | | | | | |
| Bonds, Sub-Series A, 5.30%, 6/15/36 (a)(n) | | | | 11,930 | | 2,431,931 |
| Utah Water Finance Agency Revenue Bonds (Pooled | | | | | | |
| Loan Financing Program), Series A (e): | | | | | | |
| 5.75%, 10/01/15 | | | | 2,515 | | 2,636,574 |
| 6%, 10/01/20 | | | | 3,770 | | 3,962,195 |
| | | | | | |
|
| | | | | | | 13,064,980 |
| |
| |
| |
|
| Vermont — 0.2% | | | | | | |
| Vermont HFA, Revenue Refunding Bonds, AMT, | | | | | | |
| Series C, 5.50%, 11/01/38 (d) | | | | 1,300 | | 1,271,738 |
| |
| |
| |
|
| Washington — 0.9% | | | | | | |
| Chelan County, Washington, Public Utility District | | | | | | |
| Number 001, Consolidated Revenue Bonds (Chelan | | | | |
| Hydro System), AMT, Series A, 5.45%, 7/01/37 (e) | | 7,225 | | 6,911,073 |
| |
| |
|
| Wisconsin — 1.4% | | | | | | |
| Superior, Wisconsin, Limited Obligation Revenue | | | | | | |
| Refunding Bonds (Midwest Energy Resources), | | | | | | |
| Series E, 6.90%, 8/01/21 (c) | | | | 9,000 | | 10,735,830 |
| Wisconsin State, GO, AMT, Series B, 6.50%, 5/01/25 (a) | | 670 | | 671,347 |
| | | | |
|
| | | | | | | 11,407,177 |
| |
| |
| |
|
| Total Municipal Bonds (Cost — $679,595,044) — 85.2% | | | | 684,875,723 |
| |
| |
|
| |
| |
| Municipal Bonds Transferred to | | | | | | |
| Tender Option Bond Trusts (o) | | | | | | |
| |
| |
| |
|
| California — 3.5% | | | | | | |
| Tustin, California, Unified School District, Senior Lien | | | | | | |
| Special Tax Bonds (Community Facilities District | | | | | | |
| Number 97-1), Series A: | | | | | | |
| 5%, 9/01/32 (d) | | | | 7,980 | | 8,000,269 |
| 5%, 9/01/38 | | | | 9,330 | | 9,314,885 |
| Sequoia, California, Unified High School District, GO, | | | | | | |
| Refunding, Series B, 5.50%, 7/01/35 (d) | | | | 10,055 | | 10,606,645 |
| | | | | | |
|
| | | | | | | 27,921,799 |
| |
| |
| |
|
| District of Columbia — 1.2% | | | | | | |
| Metropolitan Washington D.C. Airport Authority Revenue | | | | |
| Bonds, AMT, Series B, 5%, 10/01/36 (c)(d) | | | | 10,000 | | 9,413,200 |
| |
| |
| |
|
| Florida — 3.6% | | | | | | |
| Broward County, Florida, School Board, COP, Series A, | | | | | | |
| 5.25%, 7/01/33 | | | | 10,000 | | 10,108,600 |
| Miami-Dade County, Florida, Aviation Revenue Refunding | | | | |
| Bonds (Miami International Airport), AMT, Series A, | | | | | | |
| 5%, 10/01/40 (f) | | | | 9,980 | | 9,323,516 |
| Tallahassee, Florida, Energy System Revenue Bonds, | | | | | | |
| 5%, 10/01/37 (a) | | | | 10,000 | | 9,999,200 |
| | | | | | |
|
| | | | | | | 29,431,316 |
| |
| |
| |
|
| Massachusetts — 1.9% | | | | | | |
| Massachusetts State School Building Authority, | | | | | | |
| Dedicated Sales Tax Revenue Bonds, Series A, | | | | | | |
| 5%, 8/15/30 (d) | | | | 15,000 | | 15,232,650 |
| |
| |
| |
|
| See Notes to Financial Statements. |
| BLACKROCK MUNICIPAL BOND FUND, INC. |
Schedule of Investments (concluded)
BlackRock Municipal Insured Fund
(Percentages shown are based on Net Assets)
| Municipal Bonds Transferred to | | Par | | |
| Tender Option Bond Trusts (o) | | (000) | | Value |
| |
| |
|
| |
| New Jersey — 1.7% | | | | |
| New Jersey State Turnpike Authority, Turnpike Revenue | | | | |
| Bonds, Series C, 5%, 1/01/30 (d) | | $13,500 | | $ 13,732,200 |
| |
| |
|
| New York — 6.1% | | | | |
| New York City, New York, Sales Tax Asset Receivable | | | | |
| Corporation Revenue Bonds (e): | | | | |
| Series 2577, 6.83%, 10/15/20 | | 16,905 | | 17,521,863 |
| Series A, 5.25%, 10/15/27 | | 13,925 | | 14,459,859 |
| New York State Thruway Authority, General Revenue | | | | |
| Refunding Bonds, Series G, 5%, 1/01/32 (d) | | 16,830 | | 17,148,424 |
| | | | |
|
| | | | | 49,130,146 |
| |
| |
|
| Washington — 1.3% | | | | |
| Washington State, GO, Series D, 5%, 1/01/28 (d) | | 10,000 | | 10,149,600 |
| |
| |
|
| Total Municipal Bonds Transferred to Tender Option | | | | |
| Bond Trusts (Cost — $158,805,377) — 19.3% | | | | 155,010,911 |
| |
| |
|
| |
| |
| |
| Mutual Funds | | Shares | | |
| |
| |
|
| BlackRock California Insured Municipal 2008 | | | | |
| Term Trust, Inc. (l) | | 300,000 | | 4,491,000 |
| BlackRock Insured Municipal 2008 Term Trust, Inc. (l) | | 810,000 | | 12,141,900 |
| BlackRock Insured Municipal Term Trust, Inc. (l) | | 204,800 | | 2,058,240 |
| |
| |
|
| Total Mutual Funds (Cost — $21,126,664) — 2.3% | | | | 18,691,140 |
| |
| |
|
| |
| |
| |
| Short-Term Securities | | | | |
| |
| |
|
| Merrill Lynch Institutional Tax-Exempt Fund, | | | | |
| 1.73% (l)(m) | | 8,647,608 | | 8,647,608 |
| |
| |
|
| Total Short-Term Securities | | | | |
| (Cost — $8,647,608) — 1.1% | | | | 8,647,608 |
| |
| |
|
| Total Investments (Cost — $868,174,693*) — 107.9% | | 867,225,382 |
| Other Assets Less Liabilities — 1.7% | | | | 14,021,588 |
| Liability for Trust Certificates, Including Interest | | | | |
| Expense and Fees Payable — (9.6%) | | | | (77,355,300) |
| | |
| |
|
| Net Assets — 100.0% | | $ 803,891,670 |
| | |
|
| | * The cost and unrealized appreciation (depreciation) of investments as of June
30, 2008, as computed for federal income tax purposes, were as follows: |
| Aggregate cost | | $ 791,894,675 |
| | |
|
| Gross unrealized appreciation | | $ 19,785,314 |
| Gross unrealized depreciation | | (21,209,607) |
| | |
|
| Net unrealized depreciation | | $ (1,424,293) |
| | |
|
(a) MBIA Insured.
(b) U.S. government securities, held in escrow, are used to pay interest on this
security as well as to retire the bond in full at the date indicated, typically at a
premium to par.
(c) FGIC Insured. |
(d) FSA Insured.
(e) AMBAC Insured.
(f) XL Capital Insured.
(g) Variable rate security. Rate shown is as of report date. Maturity shown is the final
maturity date.
(h) Assured Guaranty Insured.
(i) Security is collateralized by Municipal or U.S. Treasury Obligations.
(j) BHAC Insured.
(k) FNMA/GNMA Collateralized.
(l) Investments in companies considered to be an affiliate of the Fund, for purposes
of Section 2(a)(3) of the Investment Company Act of 1940, were as follows: |
| | | Purchase | | Sales | | Realized | | Dividend |
| Affiliate | | Cost | | Cost | | Gain | | Income |
| |
| |
| |
| |
|
| |
| BlackRock California | | | | | | | | |
| Insured Municipal | | | | | | | | |
| 2008 Term Trust, Inc. | | — | | — | | — | | $183,600 |
| BlackRock Insured | | | | | | | | |
| Municipal 2008 | | | | | | | | |
| Term Trust, Inc. | | — | | — | | — | | $525,764 |
| BlackRock Insured | | | | | | | | |
| Municipal Term | | | | | | | | |
| Trust, Inc. | | — | | — | | — | | $ 76,631 |
| Merrill Lynch Institutional | | | | | | | | |
| Tax-Exempt Fund | | $5,410,7591 | | — | | — | | $378,079 |
| |
| |
| |
| |
|
1 Represents net purchase cost.
(m) Represents the current yield as of report date.
(n) Represents a zero-coupon bond. Rate shown reflects the effective yield at the
time of purchase.
(o) Securities represent bonds transferred to a tender option bond trust in
exchange for which the Fund acquired residual interest certificates. These
securities serve as collateral in a financing transaction. See Note 1 of the
Notes to Financial Statements for details of municipal bonds transferred to
tender option bond trusts.
(p) Represents a step bond. Rate shown reflects the effective yield at the time
of purchase.
•Forward interest rate swaps outstanding as of June 30,2008 were as follows:
| | | Notional | | |
| | | Amount | | Unrealized |
| | | (000) | | Appreciation |
| |
| |
|
| |
| Pay a fixed rate of 3.694% and receive a | | | | |
| floating rate based on 1-week SIFMA | | | | |
| Municipal Swap Index Rate | | | | |
| Broker, JPMorgan Chase | | | | |
| Expires August 2028 | | $20,000 | | $297,360 |
| Pay a fixed rate of 3.699% and receive a | | | | |
| floating rate based on 1-week SIFMA | | | | |
| Municipal Swap Index Rate | | | | |
| Broker, JPMorgan Chase | | | | |
| Expires August 2028 | | $12,750 | | 180,068 |
| |
| |
|
| Total | | | | $477,428 |
| | | | |
|
See Notes to Financial Statements.
24 BLACKROCK MUNICIPAL BOND FUND, INC. JUNE 30, 2008
Schedule of Investments June 30, 2008
BlackRock National Municipal Fund
(Percentages shown are based on Net Assets)
| | | Par | | |
| Municipal Bonds | | (000) | | Value |
| |
| |
|
| |
| Alabama — 0.8% | | | | |
| Alabama Incentives Financing Authority, Special | | | | |
| Obligation Revenue Refunding Bonds, Series A, | | | | |
| 6%, 10/01/29 (a)(v) | | $ 3,820 | | $ 3,979,599 |
| Jefferson County, Alabama, Public Building Authority, | | | | |
| Lease Revenue Bonds, 5.125%, 4/01/21 (a) | | 3,525 | | 3,490,561 |
| Mobile, Alabama, Industrial Development Board, | | | | |
| Environmental Improvement Revenue Refunding | | | | |
| Bonds (International Paper Company Project), AMT, | | | | |
| Series A, 6.35%, 5/15/16 | | 500 | | 509,850 |
| Selma, Alabama, IDB, Environmental Improvement | | | | |
| Revenue Refunding Bonds (International Paper | | | | |
| Company Project), AMT, Series A, 6.70%, 2/01/18 | | 2,500 | | 2,568,450 |
| Tuscaloosa, Alabama, Special Care Facilities | | | | |
| Financing Authority, Residential Care Facility | | | | |
| Revenue Bonds (Capstone Village, Inc. Project), | | | | |
| Series A, 5.875%, 8/01/36 | | 3,400 | | 2,860,930 |
| | | | |
|
| | | | | 13,409,390 |
| |
| |
|
| Arizona — 3.2% | | | | |
| Arizona Health Facilities Authority Revenue | | | | |
| Bonds (Catholic Healthcare West), Series A, | | | | |
| 6.625%, 7/01/20 | | 4,000 | | 4,331,360 |
| Maricopa County and Phoenix, Arizona, IDA, | | | | |
| S/F Mortgage Revenue Bonds, AMT, Series A-2, | | | | |
| 5.80%, 7/01/40 (b)(c) | | 7,725 | | 7,631,219 |
| Maricopa County, Arizona, IDA, Education Revenue | | | | |
| Bonds (Arizona Charter Schools Project 1), | | | | |
| Series A, 6.75%, 7/01/29 | | 3,100 | | 2,752,955 |
| Maricopa County, Arizona, IDA, Health Facilities | | | | |
| Revenue Refunding Bonds (Catholic Healthcare | | | | |
| West Project), Series A, 5%, 7/01/21 | | 1,625 | | 1,588,551 |
| Peoria, Arizona, Improvement District Number 8801, | | | | |
| Special Assessment Bonds: | | | | |
| 7.30%, 1/01/09 | | 190 | | 194,644 |
| 7.30%, 1/01/11 | | 395 | | 407,992 |
| Peoria, Arizona, Improvement District Number 8802, | | | | |
| Special Assessment Bonds: | | | | |
| 7.20%, 1/01/10 | | 430 | | 443,928 |
| 7.20%, 1/01/13 | | 510 | | 526,519 |
| Phoenix, Arizona, IDA, Airport Facility, Revenue | | | | |
| Refunding Bonds (America West Airlines Inc. | | | | |
| Project), AMT, 6.30%, 4/01/23 | | 3,685 | | 2,880,528 |
| Pima County, Arizona, IDA, Revenue Bonds | | | | |
| (Tucson Electric Power Company), Series A, | | | | |
| 6.375%, 9/01/29 | | 3,785 | | 3,741,700 |
| Pinal County, Arizona, IDA, Wastewater Revenue | | | | |
| Bonds (San Manuel Facilities Project), AMT, | | | | |
| 6.25%, 6/01/26 | | 500 | | 487,880 |
| Prescott Valley, Arizona, Improvement District, Special | | | | |
| Assessment Bonds (Sewer Collection System | | | | |
| Roadway Repair), 7.90%, 1/01/12 | | 323 | | 337,086 |
| Salt River Project, Arizona, Agriculture Improvement | | | | |
| and Power District, Electric System Revenue Bonds, | | | | |
| Series A, 5%, 1/01/37 | | 20,000 | | 20,237,000 |
| Tucson, Arizona, IDA, Senior Living Facilities Revenue | | | | |
| Bonds (Christian Care Tucson Inc. Project), | | | | |
| Series A, 6.125%, 7/01/10 (d)(e) | | 3,515 | | 3,779,328 |
| University of Arizona, COP (University of | | | | |
| Arizona Parking and Student Housing), | | | | |
| 5.75%, 6/01/09 (a)(d) | | 1,000 | | 1,035,310 |
| | | Par | | |
| Municipal Bonds | | (000) | | Value |
| |
| |
|
| |
| Arizona (concluded) | | | | |
| University of Arizona, COP (University of Arizona | | | | |
| Projects), Refunding, Series A, 5.50%, 6/01/18 (a) | | $ 265 | | $277,028 |
| Vistancia Community Facilities District, Arizona, GO: | | | | |
| 6.75%, 7/15/22 | | 3,000 | | 3,096,930 |
| 5.75%, 7/15/24 | | 2,125 | | 2,098,438 |
| | | | |
|
| | | | | 55,848,396 |
| |
| |
|
| Arkansas — 0.1% | | | | |
| Arkansas State Student Loan Authority Revenue | | | | |
| Bonds, AMT, Sub-Series B, 7.25%, 6/01/09 | | 250 | | 250,762 |
| Jonesboro, Arkansas, Residential Housing and Health | | | | |
| Care Facilities Board, Hospital Revenue Refunding | | | | |
| Bonds (Saint Bernards Regional Medical Center), | | | | |
| Series B, 5.90%, 7/01/16 (a) | | 200 | | 200,528 |
| North Little Rock, Arkansas, Health Facilities Board, | | | | |
| Health Care Revenue Bonds (Baptist Health), | | | | |
| 5.50%, 7/01/16 | | 250 | | 254,643 |
| Pine Bluff, Arkansas, Environmental Improvement | | | | |
| Revenue Refunding Bonds (International Paper | | | | |
| Company Project), AMT, Series A, 6.70%, 8/01/20 | | 500 | | 509,145 |
| University of Central Arkansas, Housing System | | | | |
| Revenue Bonds, 6.50%, 1/01/10 (d)(f) | | 250 | | 269,165 |
| | | | |
|
| | | | | 1,484,243 |
| |
| |
|
| California — 15.0% | | | | |
| Agua Caliente Band of Cahuilla Indians, California, | | | | |
| Casino Revenue Bonds, 6%, 7/01/18 | | 2,500 | | 2,532,250 |
| Antelope Valley, California, Health Care District | | | | |
| Revenue Bonds, VRDN, Series A, 5.25%, 9/01/17 (k) | | 12,000 | | 11,836,200 |
| Belmont-Redwood Shores School District, California, | | | | |
| GO (Election of 2005), Series A, 5%, 8/01/32 (f) | | 10,000 | | 10,167,600 |
| California County Tobacco Securitization Agency, | | | | |
| Tobacco Revenue Refunding Bonds (Sonoma | | | | |
| County Corporation): | | | | |
| 5%, 6/01/26 | | 1,115 | | 965,958 |
| 5.125%, 6/01/38 | | 1,910 | | 1,505,061 |
| California Health Facilities Financing Authority | | | | |
| Revenue Bonds (Sutter Health), Series A, | | | | |
| 5.25%, 11/15/46 | | 7,500 | | 7,298,025 |
| California Pollution Control Financing Authority, | | | | |
| Solid Waste Disposal Revenue Bonds (Waste | | | | |
| Management Inc. Project), AMT: | | | | |
| Series A-2, 5.40%, 4/01/25 | | 6,000 | | 5,527,020 |
| Series C, 5.125%, 11/01/23 | | 6,750 | | 6,068,790 |
| California Pollution Control Financing Authority, | | | | |
| Solid Waste Disposal Revenue Refunding Bonds | | | | |
| (Republic Services Inc. Project), AMT, Series C, | | | | |
| 5.25%, 6/01/23 | | 4,150 | | 3,877,262 |
| California Rural Home Mortgage Finance Authority, | | | | |
| S/F Mortgage Revenue Refunding Bonds | | | | |
| (Mortgage-Backed Securities Program), AMT, | | | | |
| Series A-2, 7%, 9/01/29 (b)(c) | | 45 | | 45,722 |
| California State, GO, 5.25%, 4/01/29 | | 5 | | 5,054 |
| California State, GO, Refunding, 5.75%, 5/01/30 | | 115 | | 119,529 |
| California State, Various Purpose, GO: | | | | |
| 5.25%, 11/01/27 | | 10,000 | | 10,209,000 |
| 5.50%, 11/01/33 | | 14,100 | | 14,399,061 |
| California Statewide Communities Development | | | | |
| Authority, Health Facility Revenue Bonds (Memorial | | | | |
| Health Services), Series A, 6%, 10/01/23 | | 9,880 | | 10,279,745 |
See Notes to Financial Statements.
| BLACKROCK MUNICIPAL BOND FUND, INC. |
Schedule of Investments (continued)
BlackRock National Municipal Fund
(Percentages shown are based on Net Assets)
| | | Par | | |
| Municipal Bonds | | (000) | | Value |
| |
| |
|
| |
| California (continued) | | | | |
| California Statewide Communities Development | | | | |
| Authority Revenue Bonds (Catholic | | | | |
| Healthcare West): | | | | |
| Series B, 5.50%, 7/01/30 | | $ 3,000 | | $ 3,010,560 |
| Series D, 5.50%, 7/01/31 | | 2,000 | | 2,002,800 |
| Chabot-Las Positas, California, Community College | | | | |
| District, GO (Election of 2004), Series B, | | | | |
| 5%, 8/01/31 (a) | | 12,895 | | 12,772,368 |
| Chula Vista, California, Community Facilities District | | | | |
| Number 06-1, Special Tax Bonds (Eastlake Woods | | | | |
| Area), Series A: | | | | |
| 6.05%, 9/01/20 | | 1,080 | | 1,098,932 |
| 6.15%, 9/01/26 | | 2,965 | | 2,977,690 |
| Chula Vista, California, IDR, Refunding (San | | | | |
| Diego Gas & Electric Co.), AMT, Series C, | | | | |
| 5.25%, 12/01/27 | | 10,000 | | 9,475,100 |
| Contra Costa County, California, Special Tax Bonds | | | | |
| (Community Facilities District Number 2001-01): | | | | |
| 6%, 9/01/26 | | 1,585 | | 1,522,234 |
| 6.10%, 9/01/31 | | 1,200 | | 1,152,492 |
| Elk Grove, California, Poppy Ridge Community | | | | |
| Facilities District Number 3, Special Tax Bonds, | | | | |
| Series 1, 6%, 9/01/08 (d) | | 3,100 | | 3,151,398 |
| Los Angeles, California, Unified School District, GO | | | | |
| (Election of 2004), Series H, 5%, 7/01/32 (f) | | 20,000 | | 20,260,400 |
| Los Angeles County, California, Metropolitan | | | | |
| Transportation Authority, Sales Tax Revenue | | | | |
| Refunding Bonds, Proposition A, First Tier | | | | |
| Senior-Series A, 5%, 7/01/35 (a) | | 12,730 | | 12,737,383 |
| Metropolitan Water District of Southern California, | | | | |
| Waterworks Revenue Refunding Bonds, Series B, | | | | |
| 5%, 7/01/35 | | 10,000 | | 10,131,600 |
| Palomar Pomerado Health Care District, | | | | |
| California, GO (Election of 2004), Series A, | | | | |
| 5.125%, 8/01/37 (g) | | 23,200 | | 23,467,728 |
| Poway, California, Unified School District, Special Tax | | | | |
| Bonds (Community Facilities District Number 6), | | | | |
| Series A, 6.05%, 9/01/25 | | 1,100 | | 1,107,436 |
| Riverside, California, Improvement Bond Act of 1915, | | | | |
| Special Assessment (Riverwalk Assessment | | | | |
| District), 6.375%, 9/02/26 | | 2,695 | | 2,734,509 |
| Roseville, California, Special Tax Bonds: | | | | |
| (Fiddyment Ranch Community Facilities | | | | |
| Number 1), 5.125%, 9/01/26 | | 3,915 | | 3,250,664 |
| (Stoneridge Community Facilities Number 1), | | | | |
| 6%, 9/01/11 (d) | | 1,125 | | 1,247,681 |
| (Stoneridge Community Facilities Number 1), | | | | |
| 6.20%, 9/01/11 (d) | | 1,250 | | 1,393,813 |
| (Stoneridge Community Facilities Number 1), | | | | |
| 6.30%, 9/01/11 (d) | | 2,500 | | 2,795,125 |
| Sacramento, California, Special Tax (North Natomas | | | | |
| Community Facilities): | | | | |
| Series 01-03, 6%, 9/01/28 | | 2,200 | | 2,164,426 |
| Series 4-C, 6%, 9/01/28 | | 2,265 | | 2,228,375 |
| San Diego, California, Public Facilities Financing | | | | |
| Authority, Subordinated Water Revenue Refunding | | | | |
| Bonds, 5%, 8/01/32 (g) | | 10,000 | | 9,916,600 |
| San Francisco, California, City and County Airport | | | | |
| Commission, International Airport Revenue | | | | |
| Refunding Bonds, AMT, Issue 34E, Second Series, | | | | |
| 5.75%, 5/01/21 (f) | | 10,720 | | 11,312,280 |
| | | Par | | |
| Municipal Bonds | | (000) | | Value |
| |
| |
|
| |
| California (concluded) | | | | |
| San Francisco, California, City and County | | | | |
| Redevelopment Agency, Community Facilities | | | | |
| District Number 6, Special Tax Bonds (Mission Bay | | | | |
| South Public Improvements Project): | | | | |
| 6%, 8/01/21 | | $ 5,000 | | $5,010,800 |
| Series A, 6%, 8/01/25 | | 2,500 | | 2,455,350 |
| San Francisco, California, Uptown Parking | | | | |
| Corporation, Parking Revenue Bonds (Union | | | | |
| Square), 6%, 7/01/20 (g) | | 1,075 | | 1,159,441 |
| Santa Clara County, California, Financing Authority, | | | | |
| Lease Revenue Refunding Bonds, Series L, | | | | |
| 5.25%, 5/15/36 | | 11,000 | | 11,237,380 |
| Santa Margarita, California, Water District, Special | | | | |
| Tax Refunding Bonds (Community Facilities District | | | | |
| Number 99), Series 1: | | | | |
| 6.20%, 9/01/09 (d) | | 1,030 | | 1,098,886 |
| 6.25%, 9/01/09 (d) | | 2,950 | | 3,142,901 |
| 6.20%, 9/01/20 | | 2,650 | | 2,697,038 |
| Southern California HFA, S/F Mortgage Revenue | | | | |
| Bonds, AMT, Series A, 5.80%, 12/01/49 (b)(c) | | 4,445 | | 4,405,306 |
| Tustin, California, Community Facilities District | | | | |
| Number 07-1, Special Tax Bonds (Tustin Legacy), | | | | |
| 6%, 9/01/37 | | 2,000 | | 1,869,740 |
| | | | |
|
| | | | | 259,824,713 |
| |
| |
|
| Colorado — 1.9% | | | | |
| Boulder County, Colorado, Hospital Development | | | | |
| Revenue Bonds (Longmont United Hospital Project), | | | | |
| 6%, 12/01/10 (d)(e) | | 500 | | 536,195 |
| Colorado HFA, Revenue Bonds (S/F Program), | | | | |
| Series B-3, 6.55%, 10/01/16 | | 200 | | 205,990 |
| Colorado HFA, Revenue Refunding Bonds | | | | |
| (S/F Program): | | | | |
| AMT, Senior Series A-2, 7.50%, 4/01/31 | | 200 | | 207,808 |
| AMT, Senior Series B-2, 7.10%, 4/01/17 | | 80 | | 82,822 |
| AMT, Senior Series B-2, 7.25%, 10/01/31 | | 640 | | 680,480 |
| AMT, Senior Series B-3, 6.80%, 11/01/28 | | 20 | | 20,351 |
| AMT, Senior Series C-2, 7.25%, 10/01/31 (h) | | 275 | | 279,265 |
| Senior Series A-3, 7.35%, 10/01/30 | | 80 | | 82,983 |
| Senior Series C-3, 6.75%, 10/01/21 (h) | | 445 | | 470,952 |
| Senior Series C-3, 7.15%, 10/01/30 (h) | | 100 | | 101,755 |
| Colorado Health Facilities Authority, Revenue | | | | |
| Refunding Bonds: | | | | |
| (Christian Living Communities Project), Series A, | | | | |
| 5.75%, 1/01/37 | | 1,500 | | 1,308,720 |
| (Poudre Valley Health Care), Series B, | | | | |
| 5.25%, 3/01/36 (f) | | 6,315 | | 6,376,824 |
| Colorado Water Resource and Power Development | | | | |
| Authority, Small Water Resources Revenue Bonds, | | | | |
| Series A (i): | | | | |
| 5.80%, 11/01/10 (d) | | 350 | | 373,887 |
| 5.80%, 11/01/20 | | 200 | | 203,648 |
| Elk Valley, Colorado, Public Improvement Revenue | | | | |
| Bonds (Public Improvement Fee): | | | | |
| Series A, 7.35%, 9/01/31 | | 7,560 | | 7,538,832 |
| Series B, 7.45%, 9/01/31 | | 880 | | 881,804 |
| Larimer County, Colorado, Poudre School District | | | | |
| Number R-1, GO, 6%, 12/15/10 (d)(i) | | 3,685 | | 3,962,849 |
See Notes to Financial Statements.
26 BLACKROCK MUNICIPAL BOND FUND, INC.
Schedule of Investments (continued)
BlackRock National Municipal Fund
(Percentages shown are based on Net Assets)
| | | Par | | |
| Municipal Bonds | | (000) | | Value |
| |
| |
|
| |
| Colorado (concluded) | | | | |
| Plaza Metropolitan District Number 1, Colorado, | | | | |
| Tax Allocation Revenue Bonds (Public | | | | |
| Improvement Fees): | | | | |
| 8%, 12/01/25 | | $ 7,700 | | $ 8,067,444 |
| 8.125%, 12/01/25 | | 1,910 | | 1,915,214 |
| | | | |
|
| | | | | 33,297,823 |
| |
| |
|
| Connecticut — 1.7% | | | | |
| Connecticut State Development Authority, | | | | |
| Governmental Lease Revenue Bonds, | | | | |
| 6.60%, 6/15/14 (g) | | 1,000 | | 1,003,260 |
| Connecticut State Development Authority, Water | | | | |
| Facility Revenue Bonds (Bridgeport Hydraulic | | | | |
| Company), AMT, 6.15%, 4/01/35 (a) | | 1,250 | | 1,270,787 |
| Connecticut State Development Authority, Water | | | | |
| Facility Revenue Refunding Bonds (Aquarion Water | | | | |
| Company Project), AMT, 5.10%, 9/01/37 (j) | | 2,750 | | 2,327,792 |
| Connecticut State, HFA, Revenue Refunding Bonds | | | | |
| (Housing Mortgage Finance Program), Series C-1, | | | | |
| 6.30%, 11/15/17 | | 960 | | 992,448 |
| Connecticut State Health and Educational Facilities | | | | |
| Authority Revenue Bonds: | | | | |
| (Bridgeport Hospital), Series A, | | | | |
| 6.625%, 7/01/18 (g) | | 1,000 | | 1,004,680 |
| (Waterbury Hospital Issue), Series C, | | | | |
| 5.75%, 7/01/20 (e) | | 1,500 | | 1,523,520 |
| (Westover School), Series A, | | | | |
| 5.70%, 7/01/10 (d)(e) | | 1,000 | | 1,067,180 |
| Connecticut State Health and Educational Facilities | | | | |
| Authority, Revenue Refunding Bonds: | | | | |
| (Eastern Connecticut Health Network), Series A, | | | | |
| 6.50%, 7/01/10 (d)(e) | | 12,045 | | 13,040,759 |
| (Sacred Heart University), 6.625%, 7/01/26 (e) | | 640 | | 641,472 |
| (University of Hartford), Series E, | | | | |
| 5.50%, 7/01/22 (e) | | 5,710 | | 5,832,765 |
| Connecticut State Higher Education Supplemental | | | | |
| Loan Authority, Revenue Bonds (Family Education | | | | |
| Loan Program), AMT, Series A, 5.50%, 11/15/20 (g) | | 385 | | 388,657 |
| Waterbury, Connecticut, GO, 6%, 2/01/09 (d)(e) | | 860 | | 889,876 |
| | | | |
|
| | | | | 29,983,196 |
| |
| |
|
| Florida — 10.4% | | | | |
| Alachua County, Florida, IDR (North Florida | | | | |
| Retirement Village), Refunding, 5.875%, 11/15/36 | | 5,500 | | 4,846,710 |
| Anthem Park Community Development District, | | | | |
| Florida, Capital Improvement Revenue Bonds, | | | | |
| 5.80%, 5/01/36 | | 1,920 | | 1,582,790 |
| Ave Maria Stewardship Community District, Florida, | | | | |
| Capital Improvement Revenue Bonds, Series A, | | | | |
| 5.125%, 5/01/38 | | 2,000 | | 1,470,280 |
| Ave Maria Stewardship Community District, Florida, | | | | |
| Revenue Bonds, 4.80%, 11/01/12 | | 1,500 | | 1,375,635 |
| Ballantrae, Florida, Community Development District, | | | | |
| Capital Improvement Revenue Bonds, 6%, 5/01/35 | | 1,620 | | 1,577,734 |
| Beacon Tradeport Community, Florida, Development | | | | |
| District, Special Assessment Revenue Refunding | | | | |
| Bonds (Commercial Project), Series A, | | | | |
| 5.25%, 5/01/16 (e) | | 1,670 | | 1,687,418 |
| CFM Community Development District, Florida, | | | | |
| Capital Improvement Revenue Bonds, Series B, | | | | |
| 5.875%, 5/01/14 | | 2,500 | | 2,249,300 |
| | | | | Par | | |
| Municipal Bonds | | | | (000) | | Value |
| |
| |
| |
|
| |
| Florida (continued) | | | | | | |
| Duval County, Florida, School Board, COP, | | | | | | |
| 5.75%, 7/01/17 (f) | | $ 2,725 | | $2,818,222 |
| Fiddlers Creek, Florida, Community Development | | | | |
| District Number 2, Special Assessment | | | | | | |
| Revenue Bonds: | | | | | | |
| Series A, 6.375%, 5/01/35 | | | | 5,350 | | 4,904,934 |
| Series B, 5.75%, 5/01/13 | | | | 560 | | 540,058 |
| Florida Housing Finance Corporation, Homeowner | | | | |
| Mortgage Revenue Bonds, AMT, Series 1, | | | | |
| 6%, 7/01/39 (b)(c) | | | | 1,850 | | 1,861,489 |
| Halifax Hospital Medical Center, Florida, Hospital | | | | |
| Revenue Refunding and Improvement Bonds, | | | | |
| Series A, 5.25%, 6/01/26 | | | | 7,000 | | 6,641,320 |
| Highland Meadows Community Development District, | | | | |
| Florida, Special Assessment Bonds, Series A, | | | | |
| 5.50%, 5/01/36 | | | | 1,115 | | 744,731 |
| Hillsborough County, Florida, IDA, Exempt Facilities | | | | |
| Revenue Bonds (National Gypsum Company), AMT, | | | | |
| Series A, 7.125%, 4/01/30 | | | | 5,000 | | 4,799,550 |
| Hillsborough County, Florida, IDA, Hospital Revenue | | | | |
| Bonds (Tampa General Hospital Project), | | | | |
| 5.25%, 10/01/41 | | | | 16,845 | | 15,837,837 |
| Lee County, Florida, IDA, Health Care Facilities, | | | | |
| Revenue Refunding Bonds (Shell Point/Alliance | | | | |
| Obligor Group), 5%, 11/15/29 | | | | 2,000 | | 1,681,480 |
| Lexington Oaks, Florida, Community Development | | | | |
| District, Special Assessment Revenue Bonds, | | | | |
| Series A, 6.70%, 5/01/33 | | | | 1,075 | | 1,111,529 |
| Mediterra, Florida, South Community Development | | | | |
| District, Capital Improvement Revenue Bonds, | | | | |
| 6.85%, 5/01/31 | | | | 930 | | 951,204 |
| Miami-Dade County, Florida, Aviation Revenue | | | | |
| Refunding Bonds (Miami International Airport), | | | | |
| AMT, Series A (m): | | | | | | |
| 5.50%, 10/01/24 | | | | 5,185 | | 5,269,049 |
| 5.50%, 10/01/25 | | | | 7,320 | | 7,422,407 |
| Middle Village Community Development District, | | | | |
| Florida, Special Assessment Bonds, Series A, | | | | |
| 6%, 5/01/35 | | | | 2,500 | | 2,229,225 |
| Midtown Miami, Florida, Community Development | | | | |
| District, Special Assessment Revenue Bonds, | | | | |
| Series A, 6.25%, 5/01/37 | | | | 6,625 | | 5,959,453 |
| New River Community Development District, Florida, | | | | |
| Capital Improvement Revenue Bonds, Series B, | | | | |
| 5%, 5/01/13 | | | | 1,000 | | 901,540 |
| Orange County, Florida, HFA, M/F Housing | | | | | | |
| Revenue Bonds (Loma Vista Project), Series G, | | | | |
| 5.50%, 3/01/32 | | | | 3,500 | | 3,413,795 |
| Orange County, Florida, Health Facilities Authority, | | | | |
| Hospital Revenue Bonds (Orlando Regional | | | | |
| Healthcare), 5.70%, 7/01/26 | | | | 1,000 | | 895,160 |
| Panther Trace Community Development District II, | | | | |
| Florida, Special Assessment Revenue Bonds: | | | | |
| 5.125%, 11/01/13 | | | | 9,975 | | 9,136,402 |
| Series A, 5.60%, 5/01/35 | | | | 4,900 | | 3,916,276 |
| Park Place Community Development District, | | | | |
| Florida, Special Assessment Revenue Bonds: | | | | |
| 6.75%, 5/01/10 (d) | | | | 920 | | 985,210 |
| 6.375%, 5/01/34 | | | | 2,300 | | 2,224,928 |
See Notes to Financial Statements.
| BLACKROCK MUNICIPAL BOND FUND, INC. |
Schedule of Investments (continued)
BlackRock National Municipal Fund
(Percentages shown are based on Net Assets)
| | | Par | | |
| Municipal Bonds | | (000) | | Value |
| |
| |
|
| |
| Florida (concluded) | | | | |
| Saint Lucie, Florida, West Services District, | | | | |
| Utility Revenue Refunding Bonds, Senior Lien, | | | | |
| 6%, 10/01/22 (g) | | $ 2,000 | | $2,122,680 |
| Sarasota County, Florida, Health Facilities Authority, | | | | |
| Retirement Facility Revenue Refunding Bonds | | | | |
| (Village on the Isle Project): | | | | |
| 5.50%, 1/01/27 | | 780 | | 702,944 |
| 5.50%, 1/01/32 | | 1,645 | | 1,432,186 |
| Seminole County, Florida, Water and Sewer Revenue | | | | |
| Bonds, 5%, 10/01/36 | | 16,920 | | 17,043,854 |
| Somerset Community Development District, | | | | |
| Florida, Capital Improvement Revenue Bonds, | | | | |
| 5%, 5/01/15 | | 2,575 | | 2,278,180 |
| Sterling Hill Community Development District, | | | | |
| Florida, Capital Improvement Revenue Refunding | | | | |
| Bonds, Series B, 5.50%, 11/01/10 | | 185 | | 182,758 |
| Suncoast Community Development District, Florida, | | | | |
| Capital Improvement Revenue Bonds, Series A, | | | | |
| 5.875%, 5/01/34 | | 2,585 | | 2,480,437 |
| Sunshine State Governmental Finance | | | | |
| Commission, Florida, Revenue Bonds, VRDN, | | | | |
| 9%, 7/01/16 (a)(k) | | 50,000 | | 50,000,000 |
| Tern Bay Community Development District, Florida, | | | | |
| Capital Improvement Revenue Refunding Bonds, | | | | |
| Series B, 5%, 5/01/15 | | 1,190 | | 712,929 |
| Tolomato Community Development District, Florida, | | | | |
| Special Assessment Bonds, 6.45%, 5/01/23 | | 3,000 | | 2,932,560 |
| Watergrass Community Development District, Florida, | | | | |
| Special Assessment Revenue Bonds, Series B, | | | | |
| 4.875%, 11/01/10 | | 1,365 | | 1,299,971 |
| | | | |
|
| | | | | 180,224,165 |
| |
| |
|
| Georgia — 2.8% | | | | |
| Atlanta, Georgia, Airport Passenger Facility Charge | | | | |
| and Subordinate Lien General Revenue Refunding | | | | |
| Bonds, Series C, 5%, 1/01/33 (f) | | 17,000 | | 17,096,220 |
| Atlanta, Georgia, Tax Allocation Bonds (Atlantic | | | | |
| Station Project), 7.90%, 12/01/11 (d) | | 5,000 | | 5,805,750 |
| Brunswick and Glynn County, Georgia, Development | | | | |
| Authority, First Mortgage Revenue Bonds (Coastal | | | | |
| Community Retirement Corporation Project), | | | | |
| Series A (l)(q)(u): | | | | |
| 7.125%, 1/01/25 | | 2,285 | | 1,532,778 |
| 7.25%, 1/01/35 | | 4,555 | | 3,055,494 |
| College Park, Georgia, Business and IDA | | | | |
| Revenue Bonds (Civic Center Project), | | | | |
| 5.75%, 9/01/10 (a)(d) | | 5,210 | | 5,634,146 |
| Fulton County, Georgia, Development Authority | | | | |
| Revenue Bonds (Morehouse College Project), | | | | |
| 5.875%, 12/01/10 (a)(d) | | 3,450 | | 3,729,519 |
| Fulton County, Georgia, Residential Care Facilities, | | | | |
| Revenue Refunding Bonds (Canterbury Court | | | | |
| Project), Series A, 6%, 2/15/22 | | 2,250 | | 2,125,823 |
| Gainesville, Georgia, Redevelopment Authority, | | | | |
| Educational Facilities Revenue Refunding Bonds | | | | |
| (Riverside Military Academy): | | | | |
| 5.125%, 3/01/27 | | 2,460 | | 2,208,563 |
| 5.125%, 3/01/37 | | 1,800 | | 1,535,562 |
| | | Par | | |
| Municipal Bonds | | (000) | | Value |
| |
| |
|
| |
| Georgia (concluded) | | | | |
| Milledgeville-Baldwin County, Georgia, Development | | | | |
| Authority Revenue Bonds (Georgia College and | | | | |
| State University Foundation), 6%, 9/01/14 (d) | | $ 1,500 | | $ 1,707,735 |
| Rockdale County, Georgia, Development Authority | | | | |
| Revenue Bonds (Visy Paper Project), AMT, Series A, | | | | |
| 6.125%, 1/01/34 | | 5,000 | | 4,810,050 |
| | | | |
|
| | | | | 49,241,640 |
| |
| |
|
| Illinois — 5.9% | | | | |
| Bolingbrook, Illinois, Special Services Area | | | | |
| Number 1, Special Tax Bonds (Forest City Project), | | | | |
| 5.90%, 3/01/27 | | 1,000 | | 937,600 |
| Chicago, Illinois, Motor Fuel Tax Revenue Bonds, | | | | |
| Series A, 5%, 1/01/38 (m) | | 11,000 | | 11,000,000 |
| Chicago, Illinois, O’Hare International Airport, General | | | | |
| Airport Revenue Bonds, Third Lien, Series A, | | | | |
| 5.25%, 1/01/23 (i)(m) | | 3,750 | | 3,881,550 |
| Chicago, Illinois, O’Hare International Airport Revenue | | | | |
| Bonds, Third Lien, AMT, Series B-2, 6%, 1/01/29 (j) | | 26,800 | | 27,187,796 |
| Chicago, Illinois, Park District, GO, Refunding, | | | | |
| Series B, 5.75%, 1/01/15 (i) | | 350 | | 366,488 |
| Chicago, Illinois, Park District, Limited Tax, GO, | | | | |
| Series A, 5.75%, 1/01/16 (i) | | 230 | | 240,835 |
| Chicago, Illinois, S/F Mortgage Revenue Bonds, AMT, | | | | |
| Series A, 7.15%, 9/01/31 (b)(c) | | 280 | | 289,486 |
| Chicago, Illinois, Special Assessment Bonds (Lake | | | | |
| Shore East), 6.75%, 12/01/32 | | 2,000 | | 2,008,100 |
| Cicero, Illinois, GO, Refunding (Corporate Purpose), | | | | |
| 6%, 12/01/28 (g) | | 3,210 | | 3,361,961 |
| Hodgkins, Illinois, Environmental Improvement | | | | |
| Revenue Bonds (Metro Biosolids Management LLC | | | | |
| Project), AMT, 6%, 11/01/23 | | 10,000 | | 10,032,100 |
| Illinois Development Finance Authority Revenue | | | | |
| Bonds (Community Rehabilitation Providers | | | | |
| Facilities), Series A, 6.50%, 7/01/22 | | 3,140 | | 3,277,846 |
| Illinois Municipal Electric Agency, Power Supply | | | | |
| Revenue Bonds, Series A, 5%, 2/01/35 (g)(i) | | 10,000 | | 9,643,400 |
| Illinois State Finance Authority Revenue Bonds: | | | | |
| (Friendship Village of Schaumburg), Series A, | | | | |
| 5.625%, 2/15/37 | | 1,750 | | 1,402,853 |
| (Landing At Plymouth Place Project), Series A, | | | | |
| 6%, 5/15/37 | | 2,155 | | 1,906,033 |
| Illinois State Finance Authority, Revenue Refunding | | | | |
| Bonds (Sherman Health System Project), Series A, | | | | |
| 5.50%, 8/01/37 | | 3,500 | | 3,264,940 |
| Illinois State, GO, 1st Series (g): | | | | |
| 5.75%, 12/01/15 | | 8,890 | | 9,387,307 |
| 5.75%, 12/01/16 | | 3,745 | | 3,958,989 |
| 5.75%, 12/01/17 | | 4,000 | | 4,228,560 |
| Illinois State, Sales Tax Revenue Bonds, 6%, 6/15/20 | | 3,000 | | 3,144,180 |
| Illinois State, Sales Tax Revenue Refunding Bonds, | | | | |
| Series Q, 6%, 6/15/09 | | 795 | | 819,168 |
| Village of Wheeling, Illinois, Revenue Bonds (North | | | | |
| Milwaukee/Lake-Cook Tax Increment Financing | | | | |
| Redevelopment Project), 6%, 1/01/25 | | 1,585 | | 1,437,056 |
| | | | |
|
| | | | | 101,776,248 |
| |
| |
|
| Indiana — 0.4% | | | | |
| Indiana Bond Bank, Special Program Revenue Bonds | | | | |
| (Town of Westfield and West Central Conservancy | | | | |
| District Projects), Series A, 5.125%, 10/01/22 (g) | | 7,350 | | 7,540,439 |
| |
| |
|
| See Notes to Financial Statements. |
28 BLACKROCK MUNICIPAL BOND FUND, INC.
Schedule of Investments (continued)
BlackRock National Municipal Fund
(Percentages shown are based on Net Assets)
| | | Par | | |
| Municipal Bonds | | (000) | | Value |
| |
| |
|
| |
| Iowa — 0.3% | | | | |
| Iowa City, Iowa, Sewer Revenue Bonds, | | | | |
| 5.75%, 7/01/21 (g) | | $ 1,000 | | $ 1,002,010 |
| Iowa Finance Authority, Health Care Facilities, | | | | |
| Revenue Refunding Bonds (Care Initiatives Project), | | | | |
| 9.25%, 7/01/11 (d) | | 3,775 | | 4,481,680 |
| | | | |
|
| | | | | 5,483,690 |
| |
| |
|
| Kansas — 0.2% | | | | |
| Sedgwick and Shawnee Counties, Kansas, | | | | |
| S/F Revenue Bonds, AMT, Series A-1, | | | | |
| 6.95%, 6/01/29 (n) | | 1,160 | | 1,215,274 |
| Wichita, Kansas, Hospital Facilities Revenue | | | | |
| Refunding and Improvement Bonds, Series III, | | | | |
| 6.25%, 11/15/19 | | 2,500 | | 2,646,475 |
| | | | |
|
| | | | | 3,861,749 |
| |
| |
|
| Louisiana — 0.8% | | | | |
| Jefferson Parish, Louisiana, Finance Authority, | | | | |
| S/F Mortgage Revenue Bonds, Series B, | | | | |
| 5.70%, 12/01/48 (b)(c) | | 5,000 | | 5,030,100 |
| Louisiana HFA, S/F Mortgage Revenue Bonds, AMT, | | | | |
| Series D-2, 5.80%, 6/01/20 (c) | | 245 | | 247,778 |
| Louisiana Local Government Environmental Facilities | | | | |
| and Community Development Authority, Revenue | | | | |
| Bonds (Capital Projects and Equipment Acquisition | | | | |
| Program), Series A, 6.30%, 7/01/30 (a) | | 7,000 | | 7,298,410 |
| Rapides Finance Authority, Louisiana, Environmental | | | | |
| Improvement Revenue Bonds (International Paper | | | | |
| Company Project), AMT, Series A, 6.55%, 11/15/23 | | 2,000 | | 2,026,300 |
| | | | |
|
| | | | | 14,602,588 |
| |
| |
|
| Maryland — 0.4% | | | | |
| Anne Arundel County, Maryland, Special Obligation | | | | |
| Revenue Bonds (Arundel Mills Project), | | | | |
| 7.10%, 7/01/09 (d) | | 500 | | 533,685 |
| Maryland State Community Development | | | | |
| Administration, Department of Housing and | | | | |
| Community Development, Housing Revenue | | | | |
| Bonds, AMT, Series B, 6.15%, 1/01/21 | | 1,000 | | 1,011,600 |
| Maryland State Community Development | | | | |
| Administration, Department of Housing and | | | | |
| Community Development Revenue Bonds | | | | |
| (Waters Landing II Apartments), AMT, Series A, | | | | |
| 5.875%, 8/01/33 | | 1,000 | | 1,016,300 |
| Maryland State Energy Financing Administration, | | | | |
| Solid Waste Disposal Revenue Bonds, Limited | | | | |
| Obligation (Wheelabrator Water Projects), AMT, | | | | |
| 6.45%, 12/01/16 | | 1,000 | | 1,005,990 |
| Maryland State Health and Higher Educational | | | | |
| Facilities Authority Revenue Bonds (King | | | | |
| Farm Presbyterian Community), Series B, | | | | |
| 5%, 1/01/17 | | 3,200 | | 3,023,904 |
| | | | |
|
| | | | | 6,591,479 |
| |
| |
|
| Massachusetts — 1.9% | | | | |
| Massachusetts Educational Financing Authority, | | | | |
| Education Loan Revenue Refunding Bonds, | | | | |
| AMT, Issue E, 5.85%, 7/01/14 (a) | | 195 | | 195,495 |
| Massachusetts State Development Finance | | | | |
| Agency Revenue Bonds (Linden Ponds, Inc. | | | | |
| Project), Series A, 5.50%, 11/15/27 | | 3,000 | | 2,629,980 |
| | | Par | | |
| Municipal Bonds | | (000) | | Value |
| |
| |
|
| |
| Massachusetts (concluded) | | | | |
| Massachusetts State Health and Education | | | | |
| Facilities Authority Revenue Bonds, VRDN, | | | | |
| 2.744%, 6/23/2022 (k) | | $ 3,350 | | $3,350,000 |
| Massachusetts State Health and Educational | | | | |
| Facilities Authority Revenue Bonds (Medical | | | | |
| Center of Central Massachusetts), CARS, RIB, | | | | |
| Series B, 10.076%, 6/23/22 (a)(k) | | 3,350 | | 3,423,767 |
| Massachusetts State School Building Authority, | | | | |
| Dedicated Sales Tax Revenue Bonds, Series A, | | | | |
| 5%, 8/15/37 (a) | | 20,700 | | 20,819,439 |
| Massachusetts State Water Pollution Abatement | | | | |
| Trust, Water Abatement Revenue Bonds, | | | | |
| Series A, 6.375%, 2/01/15 | | 130 | | 130,441 |
| Montachusett, Massachusetts, Regional | | | | |
| Vocational Technical School District, GO, | | | | |
| 5.95%, 1/15/10 (d)(g) | | 1,600 | | 1,674,704 |
| | | | |
|
| | | | | 32,223,826 |
| |
| |
|
| Michigan — 1.9% | | | | |
| Delta County, Michigan, Economic Development | | | | |
| Corporation, Environmental Improvement | | | | |
| Revenue Refunding Bonds (Mead Westvaco- | | | | |
| Escanaba), Series A, 6.25%, 4/15/12 (d) | | 7,500 | | 8,258,700 |
| Detroit, Michigan, Water Supply System Revenue | | | | |
| Bonds, Senior Lien, Series B, 5.50%, 7/01/35 (i) | | 10,875 | | 11,377,316 |
| Dickinson County, Michigan, Economic | | | | |
| Development Corporation, Environmental | | | | |
| Improvement Revenue Refunding Bonds | | | | |
| (International Paper Company Project), Series A, | | | | |
| 5.75%, 6/01/16 | | 500 | | 501,015 |
| Eastern Michigan University, General Revenue | | | | |
| Refunding Bonds (a): | | | | |
| 6%, 6/01/10 (d) | | 585 | | 626,710 |
| 6%, 6/01/24 | | 415 | | 433,551 |
| Flint, Michigan, Hospital Building Authority, | | | | |
| Revenue Refunding Bonds (Hurley Medical | | | | |
| Center), 6%, 7/01/20 | | 3,000 | | 2,888,370 |
| Macomb County, Michigan, Hospital Finance | | | | |
| Authority, Hospital Revenue Bonds (Mount Clemens | | | | |
| General Hospital), Series B, 5.875%, 11/15/34 | | 3,325 | | 3,053,614 |
| Michigan State Hospital Finance Authority, Revenue | | | | |
| Refunding Bonds (Mercy-Mount Clemens), Series A, | | | | |
| 6%, 5/15/09 (d)(g) | | 1,500 | | 1,568,040 |
| Michigan Tobacco Settlement Financing Authority, | | | | |
| Tobacco Settlement Asset-Backed Revenue Bonds, | | | | |
| Senior Series A, 6%, 6/01/48 | | 4,010 | | 3,431,437 |
| | | | |
|
| | | | | 32,138,753 |
| |
| |
|
| Minnesota — 0.5% | | | | |
| Anoka County, Minnesota, Solid Waste Disposal | | | | |
| Revenue Bonds (Natural Rural Utilities), AMT, | | | | |
| Series A, 6.95%, 12/01/08 | | 240 | | 242,306 |
| Eden Prairie, Minnesota, M/F Housing Revenue | | | | |
| Bonds (Rolling Hills Project), Series A, | | | | |
| 6.15%, 8/20/31 (n) | | 1,000 | | 1,063,000 |
| Minneapolis and Saint Paul, Minnesota, Metropolitan | | | | |
| Airports Commission, Airport Revenue Bonds, AMT, | | | | |
| Sub-Series D (i): | | | | |
| 5.75%, 1/01/12 | | 470 | | 480,636 |
| 5.75%, 1/01/14 | | 470 | | 478,747 |
| 5.75%, 1/01/15 | | 2,060 | | 2,095,432 |
See Notes to Financial Statements.
| BLACKROCK MUNICIPAL BOND FUND, INC. |
Schedule of Investments (continued)
BlackRock National Municipal Fund
(Percentages shown are based on Net Assets)
| | | Par | | |
| Municipal Bonds | | (000) | | Value |
| |
| |
|
| |
| Minnesota (concluded) | | | | |
| Ramsey County, Minnesota, Housing and | | | | |
| Redevelopment Authority, M/F Housing Revenue | | | | |
| Bonds (Hanover Townhouses Project), AMT, | | | | |
| 6%, 7/01/31 | | $ 1,110 | | $ 1,110,599 |
| Saint Cloud, Minnesota, Health Care Revenue | | | | |
| Refunding Bonds (Saint Cloud Hospital Obligation | | | | |
| Group), Series A, 6.25%, 5/01/20 (f) | | 1,000 | | 1,057,270 |
| Waconia, Minnesota, Health Care Facilities Revenue | | | | |
| Bonds (Ridgeview Medical Center Project), | | | | |
| Series A, 6.125%, 1/01/10 (d)(e) | | 1,500 | | 1,577,895 |
| | | | |
|
| | | | | 8,105,885 |
| |
| |
|
| Mississippi — 0.3% | | | | |
| Mississippi Home Corporation, S/F Mortgage | | | | |
| Revenue Bonds, Series A-1, 5.50%, 6/01/38 (b)(c) | | 3,885 | | 3,974,744 |
| Warren County, Mississippi, Environmental | | | | |
| Improvement Revenue Refunding Bonds | | | | |
| (International Paper Company Project), AMT, | | | | |
| Series B, 6.75%, 8/01/21 | | 1,700 | | 1,733,082 |
| | | | |
|
| | | | | 5,707,826 |
| |
| |
|
| Missouri — 0.5% | | | | |
| Fenton, Missouri, Tax Increment Revenue Refunding | | | | |
| and Improvement Bonds (Gravois Bluffs | | | | |
| Redevelopment Project), 5%, 4/01/14 | | 1,000 | | 1,039,410 |
| Kansas City, Missouri, IDA, First Mortgage Health | | | | |
| Facilities Revenue Bonds (Bishop Spencer Place), | | | | |
| Series A, 6.50%, 1/01/35 | | 1,500 | | 1,436,220 |
| Missouri State Housing Development Commission, | | | | |
| S/F Mortgage Revenue Bonds (Homeownership | | | | |
| Loan Program), AMT, Series E-1, 5.60%, 3/01/37 (c) | | 6,050 | | 6,012,611 |
| | | | |
|
| | | | | 8,488,241 |
| |
| |
|
| Montana — 0.5% | | | | |
| Montana State Board of Housing, S/F Mortgage | | | | |
| Revenue Refunding Bonds, AMT, Series A-2, | | | | |
| 5.50%, 6/01/37 | | 2,815 | | 2,829,216 |
| Montana State Higher Education Student Assistance | | | | |
| Corporation, Student Loan Revenue Refunding | | | | |
| Bonds, AMT, Sub-Series B, 6.40%, 12/01/32 | | 6,000 | | 6,047,880 |
| | | | |
|
| | | | | 8,877,096 |
| |
| |
|
| Nevada — 2.6% | | | | |
| Clark County, Nevada, Airport Revenue Bonds | | | | |
| (Jet Aviation Fuel Tax), AMT, Series C, | | | | |
| 5.375%, 7/01/20 (a) | | 3,500 | | 3,475,570 |
| Clark County, Nevada, Improvement District Number | | | | |
| 142, Special Assessment Bonds, 6.375%, 8/01/23 | | 1,520 | | 1,427,523 |
| Elko, Nevada, GO (Airport Improvement), AMT, | | | | |
| Series B (g): | | | | |
| 6.10%, 10/01/14 | | 165 | | 167,096 |
| 6.30%, 10/01/19 | | 245 | | 247,641 |
| 6.75%, 10/01/24 | | 320 | | 323,523 |
| 7%, 10/01/29 | | 225 | | 227,493 |
| Henderson, Nevada, Health Care Facilities, Revenue | | | | |
| Refunding Bonds (Catholic Healthcare West), | | | | |
| Series B, 5.25%, 7/01/31 | | 20,000 | | 19,051,200 |
| Reno, Nevada, Health Revenue Refunding | | | | |
| Bonds (Catholic Healthcare West), Series A, | | | | |
| 5.25%, 7/01/31 | | 10,000 | | 9,525,600 |
| | | Par | | |
| Municipal Bonds | | (000) | | Value |
| |
| |
|
| |
| Nevada (concluded) | | | | |
| Reno, Nevada, Special Assessment District Number 4 | | | | |
| (Somerset Parkway), 6.625%, 12/01/22 | | $ 1,835 | | $ 1,839,441 |
| Sparks, Nevada, Redevelopment Agency, Tax Allocation | | | | |
| Revenue Refunding Bonds, Series A (e): | | | | |
| 6%, 1/15/15 | | 3,110 | | 3,243,264 |
| 6%, 1/15/23 | | 6,315 | | 6,400,505 |
| | | | |
|
| | | | | 45,928,856 |
| |
| |
|
| New Hampshire — 0.2% | | | | |
| New Hampshire Health and Education Facilities | | | | |
| Authority, Revenue Refunding Bonds: | | | | |
| (Elliot Hospital), Series B, 5.60%, 10/01/22 | | 1,750 | | 1,775,078 |
| (Havenwood-Heritage Heights Retirement | | | | |
| Community), Series A, 5%, 1/01/16 | | 540 | | 489,812 |
| (Havenwood-Heritage Heights Retirement | | | | |
| Community), Series A, 5.35%, 1/01/26 | | 1,035 | | 889,489 |
| | | | |
|
| | | | | 3,154,379 |
| |
| |
|
| New Jersey — 2.2% | | | | |
| Camden County, New Jersey, Pollution Control | | | | |
| Financing Authority, Solid Waste Resource Recovery, | | | | |
| Revenue Refunding Bonds, AMT, Series B, | | | | |
| 7.50%, 12/01/09 | | 195 | | 195,536 |
| New Jersey EDA, Retirement Community Revenue | | | | |
| Bonds (Cedar Crest Village Inc. Facility), Series A, | | | | |
| 7.25%, 11/15/11 (d) | | 3,300 | | 3,739,626 |
| New Jersey EDA, State Lease Revenue Bonds (State | | | | |
| Office Buildings Projects), 6%, 6/15/10 (a)(d) | | 3,680 | | 3,912,907 |
| New Jersey Health Care Facilities Financing Authority | | | | |
| Revenue Bonds (South Jersey Hospital System), | | | | |
| 6%, 7/01/12 (d) | | 3,130 | | 3,417,459 |
| New Jersey Health Care Facilities Financing Authority, | | | | |
| Revenue Refunding Bonds, Series A: | | | | |
| (AHS Hospital Corporation), 5%, 7/01/27 | | 6,175 | | 6,048,907 |
| (Capital Health System Inc.), 5.75%, 7/01/23 | | 2,250 | | 2,275,290 |
| New Jersey State Housing and Mortgage Finance | | | | |
| Agency, M/F Housing Revenue Refunding Bonds, | | | | |
| Series B, 6.25%, 11/01/26 (f) | | 640 | | 651,891 |
| New Jersey State Turnpike Authority, Turnpike Revenue | | | | |
| Refunding Bonds, Series A (g): | | | | |
| 5.75%, 1/01/10 (d) | | 7,025 | | 7,357,564 |
| 5.75%, 1/01/18 | | 2,975 | | 3,066,005 |
| Tobacco Settlement Financing Corporation of | | | | |
| New Jersey, Asset-Backed Revenue Bonds, | | | | |
| 7%, 6/01/13 (d) | | 7,000 | | 8,090,600 |
| | | | |
|
| | | | | 38,755,785 |
| |
| |
|
| New Mexico — 0.2% | | | | |
| New Mexico Mortgage Financing Authority, | | | | |
| S/F Mortgage Program Revenue Bonds, AMT, | | | | |
| Series D, 6.15%, 7/01/35 (b)(c) | | 2,640 | | 2,724,216 |
| Santa Fe County, New Mexico, Correctional System | | | | |
| Revenue Bonds, 6%, 2/01/27 (f) | | 250 | | 285,233 |
| | | | |
|
| | | | | 3,009,449 |
| |
| |
|
| New York — 3.5% | | | | |
| New York City, New York, City IDA, Civic Facility | | | | |
| Revenue Bonds (Special Needs Facilities Pooled | | | | |
| Program), Series C-1, 6%, 7/01/12 | | 2,590 | | 2,558,480 |
| New York City, New York, City IDA, Special Facility | | | | |
| Revenue Bonds (British Airways Plc Project), AMT, | | | | |
| 7.625%, 12/01/32 | | 4,050 | | 3,483,162 |
See Notes to Financial Statements.
30 BLACKROCK MUNICIPAL BOND FUND, INC.
Schedule of Investments (continued)
BlackRock National Municipal Fund
(Percentages shown are based on Net Assets)
| | | Par | | |
| Municipal Bonds | | (000) | | Value |
| |
| |
|
| |
| New York (concluded) | | | | |
| New York City, New York, City Transitional Finance | | | | |
| Authority, Building Aid Revenue Refunding Bonds, | | | | |
| Series S-1, 5%, 1/15/34 | | $10,000 | | $10,103,400 |
| New York City, New York, GO, Refunding, Series A: | | | | |
| 6%, 5/15/10 (d) | | 6,540 | | 7,008,460 |
| 6.25%, 5/15/10 (d)(j) | | 2,205 | | 2,372,955 |
| 6%, 5/15/21 (j) | | 60 | | 63,270 |
| New York City, New York, GO, Series B (g): | | | | |
| 5.875%, 8/01/10 (d) | | 6,640 | | 7,138,266 |
| 5.875%, 8/01/15 | | 1,300 | | 1,375,751 |
| New York State Dormitory Authority, Non-State | | | | |
| Supported Debt, Revenue Refunding Bonds (Mount | | | | |
| Sinai-NYU Medical Center Health System), Series A: | | | | |
| 6.50%, 7/01/10 (d) | | 590 | | 637,808 |
| 6.50%, 7/01/16 | | 2,410 | | 2,501,315 |
| New York State Dormitory Authority, Revenue | | | | |
| Refunding Bonds, Series A: | | | | |
| (Mount Sinai Health), 6.50%, 7/01/25 | | 1,680 | | 1,729,728 |
| (State University Educational Facilities), | | | | |
| 7.50%, 5/15/13 | | 3,000 | | 3,517,230 |
| New York State Environmental Facilities Corporation, | | | | |
| State Clean Water and Drinking Revenue Bonds | | | | |
| (Revolving Funds), Series B, 5.875%, 1/15/19 | | 1,360 | | 1,411,966 |
| Oneida County, New York, IDA Revenue Bonds | | | | |
| (Civic Facility-Faxton Hospital), Series C, | | | | |
| 6.625%, 1/01/15 (e) | | 2,285 | | 2,403,112 |
| Suffolk County, New York, IDA, Civic Facility Revenue | | | | |
| Bonds (Special Needs Facilities Pooled Program), | | | | |
| Series D-1, 6%, 7/01/12 | | 80 | | 78,927 |
| Triborough Bridge and Tunnel Authority, New | | | | |
| York, Subordinate Revenue Bonds, | | | | |
| 5.125%, 11/15/26 (a) | | 5,000 | | 5,104,400 |
| Westchester County, New York, IDA, Civic Facilities | | | | |
| Revenue Bonds (Special Needs Facilities Pooled | | | | |
| Program), Series E-1, 6%, 7/01/12 | | 570 | | 562,356 |
| Westchester County, New York, IDA, Continuing Care | | | | |
| Retirement, Mortgage Revenue Bonds (Kendal on | | | | |
| Hudson Project), Series A, 6.50%, 1/01/13 (d) | | 8,095 | | 9,145,326 |
| | | | |
|
| | | | | 61,195,912 |
| |
| |
|
| North Carolina — 2.6% | | | | |
| Brunswick County, North Carolina, COP, | | | | |
| 6%, 6/01/10 (d)(f) | | 920 | | 985,780 |
| North Carolina Eastern Municipal Power Agency, | | | | |
| Power System Revenue Bonds, Series D, | | | | |
| 6.75%, 1/01/26 | | 4,000 | | 4,169,760 |
| North Carolina Eastern Municipal Power Agency, | | | | |
| Power System Revenue Refunding Bonds, Series D, | | | | |
| 6.70%, 1/01/19 (o) | | 4,440 | | 4,638,424 |
| North Carolina HFA, Home Ownership Revenue | | | | |
| Bonds, AMT, Series 9-A, 5.80%, 1/01/20 | | 3,800 | | 3,900,244 |
| North Carolina Medical Care Commission, Health | | | | |
| Care Facilities, First Mortgage Revenue Bonds | | | | |
| (Presbyterian Homes Project): | | | | |
| 6.875%, 10/01/10 (d) | | 2,500 | | 2,726,125 |
| 5.50%, 10/01/31 | | 3,000 | | 2,830,860 |
| North Carolina Medical Care Commission, Health Care | | | | |
| Facilities, First Mortgage Revenue Refunding Bonds: | | | | |
| (Presbyterian Homes Project), Series B, | | | | |
| 5.20%, 10/01/21 | | 2,500 | | 2,439,025 |
| (Salemtowne Project), 5.10%, 10/01/30 | | 1,100 | | 936,771 |
| | | Par | | |
| Municipal Bonds | | (000) | | Value |
| |
| |
|
| |
| North Carolina (concluded) | | | | |
| North Carolina Medical Care Commission, Retirement | | | | |
| Facilities, First Mortgage Revenue Bonds: | | | | |
| (Forest at Duke Project), 6.375%, 9/01/12 (d) | | $ 1,625 | | $1,793,610 |
| (Givens Estates Project), Series A, | | | | |
| 6.50%, 7/01/13 (d) | | 2,500 | | 2,857,525 |
| North Carolina Medical Care Commission, Retirement | | | | |
| Facilities, First Mortgage Revenue Refunding Bonds: | | | | |
| (Forest at Duke Project), 5.125%, 9/01/32 | | 5,000 | | 4,680,850 |
| (Givens Estates Project), 5%, 7/01/33 | | 1,000 | | 917,270 |
| North Carolina Municipal Power Agency Number 1, | | | | |
| Catawba Electric Revenue Refunding Bonds, Series B: | | | | |
| 6.375%, 1/01/13 | | 500 | | 526,100 |
| 6.375%, 1/01/13 (o) | | 1,080 | | 1,136,376 |
| 6.50%, 1/01/20 | | 5,000 | | 5,208,300 |
| 6.50%, 1/01/20 (o) | | 2,500 | | 2,604,150 |
| Piedmont Triad Airport Authority, North Carolina, | | | | |
| Airport Revenue Refunding Bonds, Series A (d)(f): | | | | |
| 6%, 7/01/09 | | 1,000 | | 1,051,680 |
| 6.375%, 7/01/09 | | 1,000 | | 1,055,400 |
| | | | |
|
| | | | | 44,458,250 |
| |
| |
|
| Ohio — 2.1% | | | | |
| Buckeye Tobacco Settlement Financing Authority, | | | | |
| Ohio, Tobacco Settlement Asset-Backed Bonds, | | | | |
| Series A-2: | | | | |
| 5.875%, 6/01/30 | | 5,000 | | 4,440,250 |
| 5.75%, 6/01/34 | | 7,000 | | 5,981,780 |
| Lorain County, Ohio, Hospital Revenue Refunding | | | | |
| Bonds (Catholic Healthcare Partners), Series C-2, | | | | |
| 5%, 4/01/33 (f) | | 20,000 | | 19,802,200 |
| Ohio State, HFA, Mortgage Revenue Refunding Bonds, | | | | |
| AMT, Series C, 5.90%, 9/01/35 (c) | | 5,170 | | 5,278,777 |
| Port of Greater Cincinnati Development Authority, | | | | |
| Ohio, Special Assessment Revenue Bonds | | | | |
| (Cooperative Public Parking Infrastructure Project), | | | | |
| 6.40%, 2/15/34 | | 1,470 | | 1,457,064 |
| | | | |
|
| | | | | 36,960,071 |
| |
| |
|
| Oregon — 0.3% | | | | |
| Forest Grove, Oregon, Campus Improvement Revenue | | | | |
| Refunding Bonds (Pacific University) (d)(e): | | | | �� |
| 6%, 5/01/10 | | 250 | | 264,875 |
| 6.20%, 5/01/10 | | 250 | | 265,765 |
| Oregon State Housing and Community Services | | | | |
| Department, Mortgage Revenue Refunding Bonds | | | | |
| (S/F Mortgage Program), Series A: | | | | |
| 6.40%, 7/01/18 | | 50 | | 50,717 |
| AMT, 6.20%, 7/01/27 | | 35 | | 35,266 |
| Portland, Oregon, M/F Housing Authority Revenue | | | | |
| Bonds (Lovejoy Station Apartments Project), AMT, | | | | |
| 5.90%, 7/01/23 (g) | | 500 | | 504,875 |
| Portland, Oregon, Urban Renewal and Redevelopment | | | | |
| Revenue Refunding Bonds, Series A (a): | | | | |
| (Downtown Waterfront), 5.75%, 6/15/18 | | 1,000 | | 1,048,450 |
| (South Park Blocks), 5.75%, 6/15/18 | | 3,190 | | 3,344,556 |
| | | | |
|
| | | | | 5,514,504 |
| |
| |
|
See Notes to Financial Statements.
| BLACKROCK MUNICIPAL BOND FUND, INC. |
Schedule of Investments (continued)
BlackRock National Municipal Fund
(Percentages shown are based on Net Assets)
| | | Par | | |
| Municipal Bonds | | (000) | | Value |
| |
| |
|
| |
| Pennsylvania — 3.8% | | | | |
| Allegheny County, Pennsylvania, IDA, Environmental | | | | |
| Improvement Revenue Refunding Bonds, | | | | |
| 5.50%, 11/01/16 | | $ 3,640 | | $3,668,756 |
| Allegheny County, Pennsylvania, Sanitation Authority, | | | | |
| Sewer Revenue Bonds, 5.75%, 12/01/10 (d)(g) | | 2,220 | | 2,388,542 |
| Bucks County, Pennsylvania, IDA, Retirement | | | | |
| Community Revenue Bonds (Ann’s Choice Inc.), | | | | |
| Series A, 6.125%, 1/01/25 | | 1,760 | | 1,733,107 |
| Delaware County, Pennsylvania, IDA, Revenue | | | | |
| Refunding Bonds (Resource Recovery Facility), | | | | |
| Series A, 6.10%, 7/01/13 | | 7,750 | | 7,774,180 |
| Lancaster County, Pennsylvania, Hospital Authority | | | | |
| Revenue Bonds (Brethren Village Project) Series A: | | | | |
| 6.25%, 7/01/26 (p) | | 1,160 | | 1,128,286 |
| 6.50%, 7/01/40 | | 1,000 | | 976,340 |
| Pennsylvania State Higher Educational Facilities | | | | |
| Authority Revenue Bonds (University of | | | | |
| Pennsylvania Medical Center Health System), | | | | |
| Series A, 6%, 1/15/31 | | 4,000 | | 4,208,760 |
| Philadelphia, Pennsylvania, Authority for IDR, | | | | |
| Commercial Development, 7.75%, 12/01/17 | | 1,265 | | 1,266,037 |
| Philadelphia, Pennsylvania, Redevelopment Authority | | | | |
| Revenue Bonds (Neighborhood Transformation), | | | | |
| Series A, 5.30%, 4/15/26 (i) | | 36,210 | | 35,763,531 |
| Sayre, Pennsylvania, Health Care Facilities Authority, | | | | |
| Revenue Refunding Bonds (Guthrie Healthcare | | | | |
| System), Series A: | | | | |
| 5.875%, 12/01/11 (d) | | 3,915 | | 4,271,500 |
| 5.875%, 12/01/31 | | 1,085 | | 1,100,082 |
| Susquehanna Area Regional Airport Authority, | | | | |
| Pennsylvania, Airport System Revenue Bonds, AMT, | | | | |
| Series A, 6.50%, 1/01/38 | | 1,000 | | 978,820 |
| | | | |
|
| | | | | 65,257,941 |
| |
| |
|
| Rhode Island — 0.5% | | | | |
| Rhode Island State Economic Development | | | | |
| Corporation, Airport Revenue Bonds, Series B, | | | | |
| 6%, 7/01/10 (d)(i) | | 6,815 | | 7,316,584 |
| Rhode Island State Economic Development | | | | |
| Corporation Revenue Bonds (Providence Place | | | | |
| Mall), 6.125%, 7/01/20 (e) | | 1,000 | | 1,040,110 |
| | | | |
|
| | | | | 8,356,694 |
| |
| |
|
| South Carolina — 0.8% | | | | |
| Medical University Hospital Authority, South Carolina, | | | | |
| Hospital Facilities Revenue Refunding Bonds, | | | | |
| Series A (d): | | | | |
| 6.375%, 8/15/12 | | 5,400 | | 6,018,678 |
| 6.50%, 8/15/12 | | 2,450 | | 2,742,408 |
| South Carolina Jobs EDA, Residential Care Facilities | | | | |
| Revenue Bonds (South Carolina Episcopal — | | | | |
| Still Hopes Residence Project), Series A, | | | | |
| 6.375%, 5/15/32 | | 5,000 | | 4,792,950 |
| | | | |
|
| | | | | 13,554,036 |
| |
| |
|
| Tennessee — 1.0% | | | | |
| Chattanooga, Tennessee, IDB, Lease Rent Revenue | | | | |
| Bonds (Southside Redevelopment Corporation) (a): | | | | |
| 5.75%, 10/01/17 | | 4,485 | | 4,701,805 |
| 5.75%, 10/01/18 | | 3,740 | | 3,910,619 |
| | | Par | | |
| Municipal Bonds | | (000) | | Value |
| |
| |
|
| |
| Tennessee (concluded) | | | | |
| Johnson City, Tennessee, Health and Educational | | | | |
| Facilities Board, Retirement Facility Revenue Bonds | | | | |
| (Appalachian Christian Village Project), Series A, | | | | |
| 6.25%, 2/15/32 | | $ 1,000 | | $ 932,360 |
| Shelby County, Tennessee, Health, Educational and | | | | |
| Housing Facility Board, Hospital Revenue Refunding | | | | |
| Bonds (Methodist Healthcare), 6.50%, 9/01/12 (d) | | 7,300 | | 8,206,514 |
| | | | |
|
| | | | | 17,751,298 |
| |
| |
|
| Texas — 10.6% | | | | |
| Austin, Texas, Convention Center Revenue Bonds | | | | |
| (Convention Enterprises Inc.), First Tier, Series A (d): | | | | |
| 6.60%, 1/01/11 | | 5,300 | | 5,734,070 |
| 6.70%, 1/01/11 | | 2,300 | | 2,493,867 |
| Austin, Texas, Revenue Bonds (Town Lake Community | | | | |
| Events Center Venue), 6.20%, 11/15/09 (d)(i) | | 10,630 | | 11,197,217 |
| Bexar County, Texas, Health Facilities Development | | | | |
| Corporation, Revenue Refunding Bonds (Army | | | | |
| Retirement Residence Project) (d): | | | | |
| 6.125%, 7/01/12 | | 600 | | 666,666 |
| 6.30%, 7/01/12 | | 1,750 | | 1,955,817 |
| Brazos River Authority, Texas, PCR, Refunding | | | | |
| (TXU Energy Company Project), AMT, Series C, | | | | |
| 5.75%, 5/01/36 | | 11,450 | | 10,742,046 |
| Brazos River, Texas, Harbor Navigation District, Brazoria | | | | |
| County Environmental Revenue Refunding Bonds | | | | |
| (Dow Chemical Company Project), AMT, Series A-7, | | | | |
| 6.625%, 5/15/33 | | 3,700 | | 3,775,850 |
| Central Texas Housing Finance Corporation, | | | | |
| S/F Mortgage Revenue Bonds (GNMA Mortgage | | | | |
| Program), AMT, 8.20%, 6/28/17 (n) | | 370 | | 385,758 |
| Dallas-Fort Worth, Texas, International Airport Facility | | | | |
| Improvement Corporation, Revenue Bonds | | | | |
| (Learjet Inc.), AMT, Series A-1, 6.15%, 1/01/16 | | 3,620 | | 3,418,583 |
| Dallas-Fort Worth, Texas, International Airport Facility | | | | |
| Improvement Corporation, Revenue Refunding | | | | |
| Bonds (American Airlines, Inc.), AMT, | | | | |
| 5.50%, 11/01/30 | | 5,000 | | 2,200,050 |
| Dallas-Fort Worth, Texas, International Airport Revenue | | | | |
| Bonds, AMT, Series A, 6%, 11/01/24 (i) | | 36,500 | | 36,640,160 |
| Gregg County, Texas, Health Facilities Development | | | | |
| Corporation, Hospital Revenue Bonds (Good | | | | |
| Shepherd Medical Center Project) (d)(e): | | | | |
| 6.375%, 10/01/10 | | 3,500 | | 3,806,425 |
| 6.875%, 10/01/10 | | 1,000 | | 1,098,280 |
| Gulf Coast Waste Disposal Authority, Texas, Revenue | | | | |
| Refunding Bonds (International Paper Company), | | | | |
| AMT, Series A, 6.10%, 8/01/24 | | 5,465 | | 5,280,174 |
| HFDC of Central Texas, Inc., Retirement Facilities | | | | |
| Revenue Bonds, Series A: | | | | |
| 5.75%, 11/01/36 | | 2,255 | | 1,893,726 |
| (Village at Gleannloch Farms), 5.50%, 2/15/37 | | 1,850 | | 1,499,074 |
| Houston, Texas, Airport System, Special Facilities | | | | |
| Revenue Bonds (Continental Airlines), AMT, | | | | |
| Series E, 7%, 7/01/29 | | 6,000 | | 4,876,500 |
| Kerrville, Texas, Health Facilities Development | | | | |
| Corporation, Hospital Revenue Bonds (Sid Peterson | | | | |
| Memorial Hospital Project), 5.25%, 8/15/21 | | 4,000 | | 3,820,720 |
See Notes to Financial Statements.
32 BLACKROCK MUNICIPAL BOND FUND, INC.
Schedule of Investments (continued)
BlackRock National Municipal Fund
(Percentages shown are based on Net Assets)
| | | Par | | |
| Municipal Bonds | | (000) | | Value |
| |
| |
|
| |
| Texas (concluded) | | | | |
| Matagorda County, Texas, Port of Bay City Authority | | | | |
| Revenue Bonds (Hoechst Celanese Corp. Project), | | | | |
| AMT, 6.50%, 5/01/26 | | $ 7,350 | | $6,756,855 |
| Red River, Texas, Education Finance Revenue | | | | |
| Bonds (Saint Mark’s School-Texas Project), | | | | |
| 6%, 2/15/10 (d) | | 1,000 | | 1,053,230 |
| South Plains, Texas, Housing Finance Corporation, | | | | |
| S/F Mortgage Revenue Bonds, AMT, Series A, | | | | |
| 7.30%, 9/01/31 (c) | | 770 | | 783,105 |
| Southeast Texas Housing Finance | | | | |
| Corporation, Revenue Bonds, AMT, Series B, | | | | |
| 8.50%, 11/01/25 (b)(n) | | 120 | | 122,508 |
| Tarrant County, Texas, Cultural Education Facilities | | | | |
| Financing Corporation, Retirement Facilities | | | | |
| Revenue Refunding Bonds (Northwest Senior | | | | |
| Housing — Edgemere Project), Series A: | | | | |
| 6%, 11/15/26 | | 2,200 | | 2,133,208 |
| 6%, 11/15/36 | | 3,000 | | 2,843,610 |
| Texas State Affordable Housing Corporation, | | | | |
| S/F Mortgage Revenue Bonds, AMT (b)(c): | | | | |
| (Fire Fighter and Law Enforcement or Security | | | | |
| Officer Home Loan Program), Series C, | | | | |
| 5.45%, 12/01/39 | | 4,936 | | 4,672,828 |
| (Professional Educators Home Loan Program), | | | | |
| Series A-1, 5.50%, 12/01/39 | | 6,184 | | 5,884,660 |
| Texas State Public Finance Authority, Building | | | | |
| Revenue Bonds (d)(f): | | | | |
| (General Services Commission Project), Series A, | | | | |
| 6%, 2/01/10 | | 2,100 | | 2,211,069 |
| (State Preservation Project), Series B, | | | | |
| 6%, 8/01/09 | | 1,000 | | 1,043,650 |
| Texas State Turnpike Authority, Central Texas Turnpike | | | | |
| System Revenue Bonds, First Tier, Series A, | | | | |
| 5.75%, 8/15/38 (a) | | 45,000 | | 46,342,350 |
| Upper Trinity Regional Water District, Texas, Water | | | | |
| Revenue Bonds (Regional Treated Water Supply | | | | |
| System), Series A, 6%, 8/01/10 (d)(i) | | 4,930 | | 5,257,401 |
| Webster, Texas, GO, COP, Series A (f): | | | | |
| 6%, 3/01/10 (d) | | 1,500 | | 1,582,575 |
| 6%, 3/01/21 | | 805 | | 838,375 |
| West Central Texas Regional Housing Finance | | | | |
| Corporation, S/F Mortgage Revenue Bonds | | | | |
| (Mortgage-Backed Securities Program), AMT, | | | | |
| Series A, 5.35%, 12/01/39 (b)(c) | | 1,216 | | 1,143,396 |
| | | | |
|
| | | | | 184,153,803 |
| |
| |
|
| Utah — 0.0% | | | | |
| Utah State, HFA, S/F Mortgage Revenue Refunding | | | | |
| Bonds, AMT, Series C, Class III, 5.50%, 1/01/18 | | 640 | | 651,533 |
| |
| |
|
| Vermont — 0.5% | | | | |
| Vermont State Student Assistance Corporation, | | | | |
| Education Loan Revenue Bonds, SAVRS, VRDN, | | | | |
| AMT, Series N, 4.288%, 12/15/32 (a)(k)(w) | | 10,000 | | 9,500,000 |
| |
| |
|
| Virginia — 0.7% | | | | |
| Albemarle County, Virginia, IDA, Residential Care | | | | |
| Facilities, Mortgage Revenue Refunding Bonds | | | | |
| (Westminster-Canterbury), 5%, 1/01/24 | | 2,750 | | 2,618,825 |
| | | Par | | |
| Municipal Bonds | | (000) | | Value |
| |
| |
|
| |
| Virginia (concluded) | | | | |
| Chesterfield County, Virginia, IDA, PCR, Refunding | | | | |
| (Virginia Electric and Power Company), Series B, | | | | |
| 5.875%, 6/01/17 | | $ 2,425 | | $ 2,562,400 |
| Fairfax County, Virginia, EDA, Residential Care | | | | |
| Facilities, Mortgage Revenue Refunding Bonds | | | | |
| (Goodwin House, Inc.), 5.125%, 10/01/37 | | 3,250 | | 2,921,490 |
| Norfolk, Virginia, Redevelopment and Housing | | | | |
| Authority, First Mortgage Revenue Bonds | | | | |
| (Retirement Community), Series A: | | | | |
| 6%, 1/01/25 | | 500 | | 464,895 |
| 6.125%, 1/01/35 | | 1,100 | | 1,002,485 |
| Watkins Centre Community Development Authority, | | | | |
| Virginia, Revenue Bonds, 5.40%, 3/01/20 | | 2,500 | | 2,284,875 |
| | | | |
|
| | | | | 11,854,970 |
| |
| |
|
| Washington — 1.5% | | | | |
| Central Puget Sound Regional Transportation | | | | |
| Authority, Washington, Sales and Use Tax Revenue | | | | |
| Bonds, Series A, 5%, 11/01/34 | | 15,000 | | 15,200,100 |
| Port of Seattle, Washington, Special Facilities | | | | |
| Revenue Bonds, Series A, 6%, 3/01/10 (d)(g) | | 3,000 | | 3,193,890 |
| Seattle, Washington, Housing Authority | | | | |
| Revenue Bonds: | | | | |
| (Newholly Project), AMT, 6.25%, 12/01/35 | | 2,750 | | 2,739,083 |
| (Replacement Housing Project), | | | | |
| 6.125%, 12/01/32 | | 4,620 | | 4,536,517 |
| | | | |
|
| | | | | 25,669,590 |
| |
| |
|
| Wisconsin — 0.7% | | | | |
| Wisconsin Housing and EDA, Home Ownership | | | | |
| Revenue Bonds, AMT, Series C, 6%, 9/01/36 | | 885 | | 905,957 |
| Wisconsin State, GO, AMT, Series B, | | | | |
| 6.20%, 11/01/26 (g) | | 1,960 | | 1,990,008 |
| Wisconsin State Health and Educational Facilities | | | | |
| Authority Revenue Bonds (SynergyHealth Inc.): | | | | |
| 6%, 11/15/23 | | 5,655 | | 5,689,043 |
| 6%, 11/15/32 | | 3,700 | | 3,598,213 |
| | | | |
|
| | | | | 12,183,221 |
| |
| |
|
| Puerto Rico — 1.2% | | | | |
| Puerto Rico Commonwealth, GO, Refunding, | | | | |
| Sub-Series C-7, 6%, 7/01/27 (g)(p) | | 6,890 | | 7,200,877 |
| Puerto Rico Commonwealth Highway and | | | | |
| Transportation Authority, Transportation Revenue | | | | |
| Bonds, 5.75%, 7/01/22 | | 8,045 | | 8,191,660 |
| Puerto Rico Commonwealth Infrastructure | | | | |
| Financing Authority, Special Tax CABS, Series A, | | | | |
| 4.917%, 7/01/30 (i)(q) | | 19,200 | | 5,341,632 |
| Puerto Rico Commonwealth, Public Improvement, GO, | | | | |
| Refunding, 5.70%, 7/01/20 (g) | | 785 | | 802,333 |
| | | | |
|
| | | | | 21,536,502 |
| |
| |
|
| U.S. Virgin Islands — 0.5% | | | | |
| Virgin Islands Government Refinery Facilities, | | | | |
| Revenue Refunding Bonds (Hovensa Coker | | | | |
| Project), AMT, 6.50%, 7/01/21 | | 8,000 | | 8,146,320 |
| |
| |
|
| Total Municipal Bonds | | | | |
| (Cost — $1,490,144,828) — 85.0% | | | | 1,476,304,500 |
| |
| |
|
| See Notes to Financial Statements. |
| BLACKROCK MUNICIPAL BOND FUND, INC. |
Schedule of Investments (concluded)
BlackRock National Municipal Fund
(Percentages shown are based on Net Assets)
| Municipal Bonds Transferred to | | Par | | |
| Tender Option Bond Trusts (r) | | (000) | | Value |
| |
| |
|
| |
| Florida — 2.0% | | | | |
| Lee County, Florida, Airport Revenue Bonds, AMT, | | | | |
| Series A, 6%, 10/01/29 (f) | | $14,000 | | $ 14,334,040 |
| Port St. Lucie, Florida, Utility Revenue Bonds, | | | | |
| 5.125%, 9/01/36 (g) | | 20,115 | | 19,935,775 |
| | | | |
|
| | | | | 34,269,815 |
| |
| |
|
| Michigan — 0.8% | | | | |
| Hartland, Michigan, Consolidated School District, GO, | | |
| Refunding, 5.125%, 5/01/29 | | 13,500 | | 13,629,060 |
| |
| |
|
| New Jersey — 1.3% | | | | |
| New Jersey EDA, School Facilities Construction | | | | |
| Revenue Bonds, Series O, 5.25%, 3/01/24 | | 22,000 | | 22,863,060 |
| |
| |
|
| Puerto Rico — 0.2% | | | | |
| Puerto Rico Industrial Tourist Educational, Medical | | | | |
| and Environmental Control Facilities Revenue | | | | |
| Bonds (Hospital de la Concepcion), Series A, | | | | |
| 6.125%, 11/15/25 | | 4,000 | | 4,210,460 |
| |
| |
|
| South Carolina — 2.4% | | | | |
| South Carolina State Ports Authority, Ports Revenue | | | | |
| Bonds, AMT, 5.30%, 7/01/26 (f) | | 41,215 | | 41,276,830 |
| |
| |
|
| Texas — 2.0% | | | | |
| Houston, Texas, Airport System Revenue | | | | |
| Refunding Bonds, Sub-Lien, AMT, Series A, | | | | |
| 5.50%, 7/01/23 (f) | | 15,000 | | 15,056,250 |
| Houston, Texas, Combined Utility System, First | | | | |
| Lien Revenue Refunding Bonds, Series A, | | | | |
| 5.125%, 5/15/28 (g) | | 20,000 | | 20,187,600 |
| | | | |
|
| | | | | 35,243,850 |
| |
| |
|
| Total Municipal Bonds Transferred to Tender Option | | | | |
| Bond Trusts (Cost — $153,891,534) — 8.7% | | | | 151,493,075 |
| |
| |
|
| |
| |
| |
| Short-Term Securities | | Shares | | |
| |
| |
|
| Merrill Lynch Institutional Tax-Exempt Fund, | | | | |
| 1.73% (s)(t) | | 172,135,699 | | 172,135,699 |
| |
| |
|
| Total Short-Term Securities | | | | |
| (Cost — $172,135,699) — 9.9% | | | | 172,135,699 |
| |
| |
|
| Total Investments (Cost — $1,816,172,061*) — 103.6% | | 1,799,933,274 |
| Other Assets Less Liabilities — 0.7% | | | | 13,235,989 |
| Liability for Trust Certificates, Including Interest | | | | |
| Expense Payable — (4.3)% | | | | (75,401,184) |
| | | | |
|
| Net Assets — 100.0% | | | | $1,737,768,079 |
| | |
| |
|
| | * The cost and unrealized appreciation (depreciation) of investments as of
June 30, 2008, as computed for federal income tax purposes, were as follows: |
| Aggregate cost | | $ 1,743,203,589 |
| | |
|
| Gross unrealized appreciation | | $ 27,085,248 |
| Gross unrealized depreciation | | (45,268,063) |
| | |
|
| Net unrealized depreciation | | $ (18,182,815) |
| | |
|
(a) AMBAC Insured.
(b) FHLMC Collateralized.
(c) FNMA/GNMA Collateralized.
(d) U.S. government securities, held in escrow, are used to pay interest on this
security as well as to retire the bond in full at the date indicated, typically at a
premium to par.
(e) Radian Insured.
(f) FSA Insured.
(g) MBIA Insured.
(h) FHA Insured.
(i) FGIC Insured.
(j) XL Capital Insured.
(k) Variable rate security. Rate shown is as of report date. Maturity shown is the final
maturity date.
(l) Non-income producing security. Issuer filed for bankruptcy or is in default of
interest payments.
(m) Assured Guaranty Insured.
(n) GNMA Collateralized.
(o) ACA Insured.
(p) When-issued security.
(q) Represents a zero-coupon bond. Rate shown reflects the effective yield at the
time of purchase.
(r) Securities represent bonds transferred to a tender option bond trust in exchange
for which the Fund acquired residual interest certificates. These securities serve
as collateral in a financing transaction. See Note 1 of the Notes to Financial
Statements for details of municipal bonds transferred to tender option bond
trusts.
(s) Investments in companies considered to be an affiliate of the Fund, for purposes
of Section 2(a)(3) of the Investment Company Act of 1940, were as follows: |
| | | Net | | Dividend |
| Affiliate | | Activity | | Income |
| |
| |
|
| |
| Merrill Lynch Institutional | | | | |
| Tax-Exempt Fund | | 143,529,721 | | $1,741,297 |
| |
| |
|
(t) Represents the current yield as of report date.
(u) Security is illiquid.
(v) All, or a portion of security, pledged as collateral in connection with financial
futures contracts.
(w) Security is fair valued. |
| See Notes to Financial Statements. |
34 BLACKROCK MUNICIPAL BOND FUND, INC.
Schedule of Investments June 30, 2008
BlackRock High Yield Municipal Fund (Percentages shown are based on Net Assets)
| | | Par | | |
| Municipal Bonds | | (000) | | Value |
| |
| |
|
| |
| Alabama — 0.5% | | | | |
| Tuscaloosa, Alabama, Special Care Facilities Financing | | | | |
| Authority, Residential Care Facility Revenue | | | | |
| Bonds (Capstone Village, Inc. Project), Series A, | | | | |
| 5.875%, 8/01/36 | | $ 500 | | $ 420,725 |
| |
| |
|
| Arizona — 6.2% | | | | |
| Maricopa County, Arizona, IDA, Education Revenue | | | | |
| Bonds (Arizona Charter Schools Project 1), Series A: | | | | |
| 6.625%, 7/01/20 | | 250 | | 224,590 |
| 6.75%, 7/01/29 | | 300 | | 266,415 |
| Maricopa County, Arizona, IDA, M/F Housing Revenue | | | | |
| Bonds (Sun King Apartments Project), Series A, | | | | |
| 6.75%, 5/01/31 | | 185 | | 177,911 |
| Phoenix, Arizona, IDA, Airport Facility, Revenue | | | | |
| Refunding Bonds (America West Airlines Inc. | | | | |
| Project), AMT, 6.30%, 4/01/23 | | 1,000 | | 781,690 |
| Pima County, Arizona, IDA, Education Revenue Bonds | | | | |
| (American Charter Schools Foundation), Series A, | | | | |
| 5.625%, 7/01/38 | | 685 | | 612,500 |
| Pima County, Arizona, IDA, Education Revenue | | | | |
| Refunding Bonds (Arizona Charter Schools Project), | | | | |
| Series O, 5.25%, 7/01/31 | | 285 | | 240,090 |
| Pima County, Arizona, IDA, Revenue Bonds | | | | |
| (Tucson Electric Power Company), Series A, | | | | |
| 6.375%, 9/01/29 | | 780 | | 771,077 |
| Queen Creek Improvement District Number 001, | | | | |
| Arizona, Special Assessment Bonds, 5%, 1/01/32 | | 500 | | 454,380 |
| Salt Verde Financial Corporation, Arizona, Senior Gas | | | | |
| Revenue Bonds: | | | | |
| 5%, 12/01/32 | | 750 | | 665,865 |
| 5%, 12/01/37 | | 1,045 | | 910,435 |
| | | | |
|
| | | | | 5,104,953 |
| |
| |
|
| California — 3.4% | | | | |
| California Pollution Control Financing Authority, | | | | |
| Solid Waste Disposal Revenue Bonds (Waste | | | | |
| Management Inc. Project), AMT, Series C, | | | | |
| 5.125%, 11/01/23 | | 750 | | 674,310 |
| Lammersville, California, School District, Special Tax | | | | |
| Bonds (Community Facilities District Number | | | | |
| 2002 — Mountain House), 5.125%, 9/01/35 | | 500 | | 420,020 |
| Roseville, California, Special Tax Bonds (Fiddyment | | | | |
| Ranch Community Facilities Number 1), | | | | |
| 5.25%, 9/01/36 | | 500 | | 398,590 |
| Southern California Public Power Authority, Natural | | | | |
| Gas Project Number 1 Revenue Bonds, Series A, | | | | |
| 5%, 11/01/29 | | 480 | | 452,914 |
| Temecula, California, Public Financing Authority, | | | | |
| Community Facilities District Number 01-2, | | | | |
| Special Tax Refunding Bonds, Sub-Series B, | | | | |
| 5.10%, 9/01/36 | | 500 | | 413,925 |
| Temecula Valley, California, Unified School District, | | | | |
| Community Facilities District Number 2005-1, | | | | |
| Special Tax Bonds, 5%, 9/01/36 (a) | | 565 | | 473,216 |
| | | | |
|
| | | | | 2,832,975 |
| |
| |
|
| Colorado — 7.4% | | | | |
| Colorado HFA, Revenue Refunding Bonds (Adventist | | | | |
| Health System/Sunbelt Obligor Group), Series D, | | | | |
| 5.25%, 11/15/35 | | 1,000 | | 960,670 |
| | | Par | | |
| Municipal Bonds | | (000) | | Value |
| |
| |
|
| |
| Colorado (concluded) | | | | |
| Colorado Health Facilities Authority, Revenue | | | | |
| Refunding Bonds (Christian Living Communities | | | | |
| Project), Series A, 5.75%, 1/01/37 | | $ 450 | | $ 392,616 |
| Pitkin County, Colorado, IDR, Refunding (Aspen | | | | |
| Skiing Company Project), VRDN, AMT, Series B, | | | | |
| 5%, 4/01/14 (b) | | 4,700 | | 4,700,000 |
| | | | |
|
| | | | | 6,053,286 |
| |
| |
|
| Connecticut — 1.7% | | | | |
| Connecticut State Health and Educational Facilities | | | | |
| Authority Revenue Bonds (University of Hartford), | | | | |
| Series G, 5.25%, 7/01/36 (c) | | 1,000 | | 967,260 |
| Mashantucket Western Pequot Tribe, Connecticut, | | | | |
| Revenue Refunding Bonds, Sub-Series A, | | | | |
| 5.50%, 9/01/36 | | 500 | | 439,795 |
| | | | |
|
| | | | | 1,407,055 |
| |
| |
|
| Florida — 6.9% | | | | |
| Easton Park Community Development District, | | | | |
| Florida, Capital Improvement Revenue Bonds, | | | | |
| 5.20%, 5/01/37 | | 595 | | 435,397 |
| Highland Meadows Community Development District, | | | | |
| Florida, Special Assessment Bonds, Series A, | | | | |
| 5.50%, 5/01/36 | | 490 | | 327,281 |
| Jacksonville, Florida, Economic Development | | | | |
| Commission, IDR (Gerdau Ameristeel US, Inc.), AMT, | | | | |
| 5.30%, 5/01/37 | | 300 | | 238,989 |
| Lee County, Florida, IDA, Health Care Facilities, | | | | |
| Revenue Refunding Bonds (Shell Point/Alliance | | | | |
| Obligor Group): | | | | |
| 5%, 11/15/29 | | 500 | | 420,370 |
| 5%, 11/15/32 (a) | | 600 | | 491,874 |
| Lee County, Florida, IDA, IDR (Lee Charter | | | | |
| Foundation), Series A, 5.375%, 6/15/37 | | 570 | | 453,937 |
| New River Community Development District, Florida, | | | | |
| Capital Improvement Revenue Bonds, Series B, | | | | |
| 5%, 5/01/13 | | 500 | | 450,770 |
| Pine Ridge Plantation Community Development | | | | |
| District, Florida, Capital Improvement and Special | | | | |
| Assessment Bonds, Series B, 5%, 5/01/11 | | 985 | | 923,497 |
| Santa Rosa Bay Bridge Authority, Florida, Revenue | | | | |
| Bonds, 6.25%, 7/01/28 | | 500 | | 444,980 |
| Sarasota County, Florida, Health Facilities Authority, | | | | |
| Retirement Facility Revenue Refunding Bonds | | | | |
| (Village on the Isle Project): | | | | |
| 5.50%, 1/01/27 | | 210 | | 189,254 |
| 5.50%, 1/01/32 | | 190 | | 165,420 |
| Tolomato Community Development District, Florida, | | | | |
| Special Assessment Bonds, 6.65%, 5/01/40 | | 700 | | 674,863 |
| Watergrass Community Development District, Florida, | | | | |
| Special Assessment Revenue Bonds, Series A, | | | | |
| 5.375%, 5/01/39 | | 650 | | 489,106 |
| | | | |
|
| | | | | 5,705,738 |
| |
| |
|
| Georgia — 3.6% | | | | |
| Brunswick and Glynn County, Georgia, Development | | | | |
| Authority, First Mortgage Revenue Bonds (Coastal | | | | |
| Community Retirement Corporation Project), | | | | |
| Series A, 7.25%, 1/01/35 (a)(d)(i) | | 500 | | 335,400 |
| Clayton County, Georgia, Tax Allocation Bonds | | | | |
| (Ellenwood Project), 7.50%, 7/01/33 | | 690 | | 650,111 |
See Notes to Financial Statements.
| BLACKROCK MUNICIPAL BOND FUND, INC. |
Schedule of Investments (continued)
BlackRock High Yield Municipal Fund (Percentages shown are based on Net Assets)
| | | Par | | |
| Municipal Bonds | | (000) | | Value |
| |
| |
|
| |
| Georgia (concluded) | | | | |
| Main Street Natural Gas, Inc., Georgia, Gas Project | | | | |
| Revenue Bonds, Series A, 6.375%, 7/15/38 | | $ 655 | | $ 628,407 |
| Richmond County, Georgia, Development Authority, | | | | |
| Environmental Improvement Revenue Bonds | | | | |
| (International Paper Co. Projects), AMT, Series A, | | | | |
| 5%, 8/01/30 | | 1,000 | | 799,550 |
| Rockdale County, Georgia, Development Authority | | | | |
| Revenue Bonds (Visy Paper Project), AMT, Series A, | | | | |
| 6.125%, 1/01/34 | | 600 | | 577,206 |
| | | | |
|
| | | | | 2,990,674 |
| |
| |
|
| Illinois — 1.6% | | | | |
| Chicago, Illinois, O’Hare International Airport, Special | | | | |
| Facility Revenue Refunding Bonds (American | | | | |
| Airlines Inc. Project), 5.50%, 12/01/30 | | 1,000 | | 470,010 |
| Illinois State Finance Authority Revenue Bonds: | | | | |
| (Monarch Landing, Inc. Project), Series A, | | | | |
| 7%, 12/01/37 | | 430 | | 417,470 |
| (Three Crowns Park Plaza), Series A, | | | | |
| 5.875%, 2/15/38 | | 500 | | 435,240 |
| | | | |
|
| | | | | 1,322,720 |
| |
| |
|
| Indiana — 3.8% | | | | |
| Daviess County, Indiana, EDR (Daviess | | | | |
| Community Hospital Project), Refunding, VRDN, | | | | |
| 6%, 1/01/29 (b)(c) | | 1,565 | | 1,565,000 |
| Indiana Health and Educational Facilities Financing | | | | |
| Authority, Hospital Revenue Bonds (Community | | | | |
| Foundation of Northwest Indiana), 5.50%, 3/01/37 | | 700 | | 617,666 |
| Indiana Health Facilities Financing Authority, Hospital | | | | |
| Revenue Refunding Bonds (Methodist Hospital, Inc.): | | | | |
| 5.375%, 9/15/22 | | 185 | | 171,033 |
| 5.50%, 9/15/31 | | 525 | | 462,478 |
| Vigo County, Indiana, Hospital Authority Revenue | | | | |
| Bonds (Union Hospital, Inc.): | | | | |
| 5.70%, 9/01/37 | | 155 | | 133,963 |
| 5.75%, 9/01/42 | | 190 | | 163,383 |
| | | | |
|
| | | | | 3,113,523 |
| |
| |
|
| Iowa — 0.5% | | | | |
| Iowa Financing Authority, Health Facilities Revenue | | | | |
| Refunding Bonds (Care Initiatives Project), Series A, | | | | |
| 5%, 7/01/19 | | 500 | | 447,135 |
| |
| |
|
| Kansas — 2.9% | | | | |
| Lenexa, Kansas, Health Care Facility, Revenue | | | | |
| Refunding Bonds, 5.50%, 5/15/39 | | 1,350 | | 1,142,775 |
| Sedgwick and Shawnee Counties, Kansas, | | | | |
| S/F Mortgage Revenue Bonds (Mortgage-Backed | | | | |
| Securities Program), AMT, Series B-2, | | | | |
| 5.25%, 12/01/38 (e)(f) | | 915 | | 894,614 |
| Wyandotte County, Kansas, Kansas City Unified | | | | |
| Government Revenue Refunding Bonds (General | | | | |
| Motors Corporation Project), 6%, 6/01/25 | | 450 | | 339,485 |
| | | | |
|
| | | | | 2,376,874 |
| |
| |
|
| Louisiana — 2.3% | | | | |
| Louisiana Local Government Environmental Facilities | | | | |
| and Community Development Authority Revenue | | | | |
| Bonds (Westlake Chemical Corporation), | | | | |
| 6.75%, 11/01/32 | | 1,000 | | 996,090 |
| | | Par | | |
| Municipal Bonds | | (000) | | Value |
| |
| |
|
| |
| Louisiana (concluded) | | | | |
| Saint John Baptist Parish, Louisiana, Revenue | | | | |
| Bonds (Marathon Oil Corporation), Series A, | | | | |
| 5.125%, 6/01/37 | | $ 1,000 | | $893,800 |
| | |
| |
|
| | | | | 1,889,890 |
| |
| |
|
| Maine — 0.8% | | | | |
| Jay, Maine, Solid Waste Disposal, Revenue Refunding | | | | |
| Bonds (International Paper Company Project), AMT, | | | | |
| Series A, 4.90%, 11/01/17 | | 750 | | 684,398 |
| |
| |
|
| Maryland — 3.0% | | | | |
| Baltimore, Maryland, Convention Center Hotel | | | | |
| Revenue Bonds, Sub-Series B, 5.875%, 9/01/39 | | 540 | | 480,692 |
| Howard County, Maryland, Retirement Community | | | | |
| Revenue Refunding Bonds (Columbia Vantage | | | | |
| House Corporation), Series A, 5.25%, 4/01/33 | | 500 | | 410,835 |
| Maryland State Energy Financing Administration, | | | | |
| Limited Obligation Revenue Bonds (Cogeneration- | | | | |
| AES Warrior Run), AMT, 7.40%, 9/01/19 | | 1,000 | | 977,340 |
| Maryland State Health and Higher Educational | | | | |
| Facilities Authority Revenue Bonds: | | | | |
| (King Farm Presbyterian Community), Series A, | | | | |
| 5.30%, 1/01/37 | | 500 | | 402,820 |
| (Washington Christian Academy), 5.25%, 7/01/18 | | 250 | | 231,613 |
| | | | |
|
| | | | | 2,503,300 |
| |
| |
|
| Massachusetts — 2.3% | | | | |
| Massachusetts State Development Finance Agency | | | | |
| Revenue Bonds: | | | | |
| (Curry College), Series A, 5.25%, 3/01/26 (g) | | 390 | | 378,183 |
| (Linden Ponds, Inc. Facility), Series A, | | | | |
| 5.75%, 11/15/35 | | 1,000 | | 869,700 |
| Massachusetts State Health and Educational | | | | |
| Facilities Authority, Revenue Refunding Bonds | | | | |
| (Bay Cove Human Services Issue), Series A, | | | | |
| 5.90%, 4/01/28 | | 640 | | 602,963 |
| | | | |
|
| | | | | 1,850,846 |
| |
| |
|
| Michigan — 0.6% | | | | |
| Advanced Technology Academy, Michigan, Revenue | | | | |
| Bonds, 6%, 11/01/37 | | 275 | | 264,710 |
| Garden City, Michigan, Hospital Finance Authority, | | | | |
| Hospital Revenue Refunding Bonds (Garden City | | | | |
| Hospital Obligation), Series A, 5%, 8/15/38 | | 310 | | 223,857 |
| | | | |
|
| | | | | 488,567 |
| |
| |
|
| Mississippi — 3.2% | | | | |
| Mississippi Business Finance Corporation, Mississippi, | | | | |
| Solid Waste Disposal Revenue Refunding Bonds | | | | |
| (Mississippi Power Company Project), VRDN, AMT, | | | | |
| 5%, 5/01/28 (b) | | 2,600 | | 2,600,000 |
| |
| |
|
| Missouri — 0.7% | | | | |
| Kansas City, Missouri, Tax Increment Financing | | | | |
| Commission, Tax Allocation Revenue Bonds | | | | |
| (Kansas City MainCor Project), Series A, | | | | |
| 5.25%, 3/01/18 | | 600 | | 573,648 |
| |
| |
|
| Nevada — 1.4% | | | | |
| Clark County, Nevada, IDR: | | | | |
| (Nevada Power Company Project), VRDN, AMT, | | | | |
| Series A, 5.60%, 10/01/30 (b) | | 415 | | 354,879 |
| (Southwest Gas Corp. Project), AMT, Series A, | | | | |
| 4.75%, 9/01/36 (h) | | 1,000 | | 780,430 |
| | | | |
|
| | | | | 1,135,309 |
| |
| |
|
See Notes to Financial Statements.
36 BLACKROCK MUNICIPAL BOND FUND, INC.
Schedule of Investments (continued)
BlackRock High Yield Municipal Fund (Percentages shown are based on Net Assets)
| | | | | Par | | |
| Municipal Bonds | | | | (000) | | Value |
| |
| |
| |
|
| |
| New Hampshire — 2.0% | | | | | | |
| New Hampshire Health and Education Facilities | | | | |
| Authority, Revenue Refunding Bonds: | | | | | | |
| (Havenwood-Heritage Heights Retirement | | | | | | |
| Community), Series A, 5.40%, 1/01/30 | | $ 950 | | $ 796,528 |
| (Southern New Hampshire University), | | | | | | |
| 5%, 1/01/27 (g) | | | | 1,015 | | 872,027 |
| | | | | | |
|
| | | | | | | 1,668,555 |
| |
| |
| |
|
| New Jersey — 5.7% | | | | | | |
| Burlington County, New Jersey, Bridge Commission, | | | | |
| EDR, Refunding (The Evergreens Project), | | | | | | |
| 5.625%, 1/01/38 | | | | 750 | | 673,973 |
| New Jersey EDA, Cigarette Tax Revenue Bonds, | | | | |
| 5.50%, 6/15/24 | | | | 1,140 | | 1,101,229 |
| New Jersey EDA, Retirement Community Revenue | | | | |
| Refunding Bonds (Seabrook Village, Inc.), | | | | | | |
| 5.25%, 11/15/36 | | | | 1,000 | | 828,880 |
| New Jersey EDA, Special Facility Revenue Bonds | | | | |
| (Continental Airlines Inc. Project), AMT, | | | | | | |
| 6.625%, 9/15/12 | | | | 490 | | 453,907 |
| New Jersey Health Care Facilities Financing Authority: | | | | |
| Revenue Bonds (Pascack Valley Hospital | | | | | | |
| Association), 6.625%, 7/01/36 (a) | | | | 650 | | 420,355 |
| Revenue Refunding Bonds (South Jersey Hospital | | | | |
| System), 5%, 7/01/46 | | | | 1,000 | | 926,480 |
| Tobacco Settlement Financing Corporation of New | | | | |
| Jersey, Asset-Backed Revenue Refunding Bonds, | | | | |
| Series 1A, 5%, 6/01/41 | | | | 385 | | 290,329 |
| | | | | | |
|
| | | | | | | 4,695,153 |
| |
| |
| |
|
| New York — 3.4% | | | | | | |
| Genesee County, New York, IDA, Civic Facility Revenue | | | | |
| Refunding Bonds (United Memorial Medical Center | | | | |
| Project), 5%, 12/01/32 | | | | 500 | | 402,560 |
| New York City, New York, City IDA, Special Facility | | | | |
| Revenue Bonds (JetBlue Airways Corporation | | | | |
| Project), AMT, 5.125%, 5/15/30 | | | | 750 | | 454,560 |
| New York Liberty Development Corporation Revenue | | | | |
| Bonds (National Sports Museum Project), Series A, | | | | |
| 6.125%, 2/15/19 | | | | 1,000 | | 985,670 |
| New York State Dormitory Authority, Non-State | | | | |
| Supported Debt, Revenue Refunding Bonds | | | | |
| (New York University Hospital Center), Series A, | | | | |
| 5%, 7/01/26 | | | | 1,000 | | 909,260 |
| | | | | | |
|
| | | | | | | 2,752,050 |
| |
| |
| |
|
| North Carolina — 1.1% | | | | | | |
| North Carolina Medical Care Commission, Retirement | | | | |
| Facilities Revenue Refunding Bonds (Carolina | | | | |
| Village Project), 6%, 4/01/38 | | | | 1,000 | | 938,160 |
| |
| |
| |
|
| North Dakota — 1.1% | | | | | | |
| Ward County, North Dakota, Health Care Facility | | | | |
| Revenue Refunding Bonds (Trinity Health Obligated | | | | |
| Group), 5.125%, 7/01/29 | | | | 1,000 | | 919,210 |
| |
| |
| |
|
| Ohio — 3.4% | | | | | | |
| Buckeye Tobacco Settlement Financing Authority, | | | | |
| Ohio, Tobacco Settlement Asset-Backed Bonds, | | | | |
| Series A-2, 6.50%, 6/01/47 | | | | 760 | | 691,676 |
| Richland County, Ohio, Hospital Facilities Revenue | | | | |
| Refunding Bonds (MedCentral Health System), | | | | |
| 5.25%, 11/15/36 | | | | 875 | | 804,930 |
| | | Par | | |
| Municipal Bonds | | (000) | | Value |
| |
| |
|
| |
| Ohio (concluded) | | | | |
| Trumbull County, Ohio, Health Care Facilities | | | | |
| Revenue Bonds (Shepherd of the Valley), VRDN, | | | | |
| 3.63%, 10/01/31 (b)(c) | | $ 1,310 | | $ 1,310,000 |
| | |
| |
|
| | | | | 2,806,606 |
| |
| |
|
| Pennsylvania — 3.1% | | | | |
| Allegheny County, Pennsylvania, Hospital | | | | |
| Development Authority, Revenue Refunding Bonds | | | | |
| (West Penn Allegheny Health System), Series A, | | | | |
| 5.375%, 11/15/40 | | 735 | | 605,971 |
| Harrisburg, Pennsylvania, Authority, University Revenue | | | | |
| Bonds (Harrisburg University of Science), Series B, | | | | |
| 6%, 9/01/36 | | 500 | | 467,830 |
| Pennsylvania Economic Development Financing | | | | |
| Authority, Exempt Facilities Revenue Bonds (Reliant | | | | |
| Energy), AMT, Series B, 6.75%, 12/01/36 | | 1,000 | | 1,009,120 |
| Susquehanna Area Regional Airport Authority, | | | | |
| Pennsylvania, Airport System Revenue Bonds, AMT, | | | | |
| Series A, 6.50%, 1/01/38 | | 500 | | 489,410 |
| | | | |
|
| | | | | 2,572,331 |
| |
| |
|
| Rhode Island — 1.1% | | | | |
| Rhode Island Housing and Mortgage Finance | | | | |
| Corporation, Homeownership Opportunity Revenue | | | | |
| Bonds, AMT, Series 53-B, 5%, 10/01/46 | | 1,000 | | 886,910 |
| |
| |
|
| South Carolina — 1.8% | | | | |
| Connector 2000 Association, Inc., South Carolina, | | | | |
| Toll Road and Capital Appreciation Revenue Bonds, | | | | |
| Senior-Series B, 7.97%, 1/01/15 (i) | | 1,000 | | 527,560 |
| Myrtle Beach, South Carolina, Tax Increment Revenue | | | | |
| Bonds (Myrtle Beach Air Force Base), Series A, | | | | |
| 5.25%, 11/01/26 | | 500 | | 422,840 |
| South Carolina Jobs, EDA, Health Care Facilities, First | | | | |
| Mortgage Revenue Refunding Bonds (Lutheran | | | | |
| Homes), 5.50%, 5/01/28 | | 600 | | 516,264 |
| | | | |
|
| | | | | 1,466,664 |
| |
| |
|
| Tennessee — 1.4% | | | | |
| Tennessee Energy Acquisition Corporation, Gas | | | | |
| Revenue Bonds, Series A, 5.25%, 9/01/26 | | 1,250 | | 1,149,613 |
| |
| |
|
| Texas — 6.4% | | | | |
| Brazos River Authority, Texas, PCR, Refunding (TXU | | | | |
| Energy Company LLC Project), AMT, Series A, | | | | |
| 8.25%, 10/01/30 | | 750 | | 750,398 |
| Dallas-Fort Worth, Texas, International Airport | | | | |
| Facility Improvement Corporation, Revenue | | | | |
| Refunding Bonds (American Airlines, Inc.), AMT, | | | | |
| 5.50%, 11/01/30 | | 1,000 | | 440,010 |
| HFDC of Central Texas, Inc., Retirement Facilities | | | | |
| Revenue Bonds, Series A, 5.75%, 11/01/36 | | 655 | | 550,062 |
| Houston, Texas, Airport System, Special Facilities | | | | |
| Revenue Bonds (Continental Airlines), AMT, | | | | |
| Series E, 7.375%, 7/01/22 | | 500 | | 436,035 |
| Mission, Texas, Economic Development Corporation, | | | | |
| Solid Waste Disposal Revenue Bonds (Allied | | | | |
| Waste N.A. Inc Project), Series A, 5.20%, 4/01/18 | | 1,000 | | 895,060 |
| Tarrant County, Texas, Health Facilities Development | | | | |
| Corporation, Hospital Revenue Refunding Bonds | | | | |
| (Cumberland Rest, Inc. Project), VRDN, Series, | | | | |
| 5.40%, 8/15/32 (b)(c) | | 800 | | 800,000 |
See Notes to Financial Statements.
| BLACKROCK MUNICIPAL BOND FUND, INC. |
Schedule of Investments (continued)
BlackRock High Yield Municipal Fund (Percentages shown are based on Net Assets)
| | | Par | | |
| Municipal Bonds | | (000) | | Value |
| |
| |
|
| |
| Texas (concluded) | | | | |
| Texas State Public Financing Authority, Charter School | | | | |
| Financing Corporation, Revenue Refunding Bonds | | | | |
| (KIPP, Inc.), Series A: | | | | |
| 5%, 2/15/28 | | $ 680 | | $ 572,397 |
| 5%, 2/15/36 (g) | | 1,000 | | 804,250 |
| | | | |
|
| | | | | 5,248,212 |
| |
| |
|
| Virginia — 5.1% | | | | |
| Albemarle County, Virginia, IDA, Residential Care | | | | |
| Facilities, Mortgage Revenue Refunding Bonds | | | | |
| (Westminster-Canterbury), 5%, 1/01/31 | | 1,150 | | 1,037,864 |
| Fairfax County, Virginia, EDA, Residential Care | | | | |
| Facilities, Mortgage Revenue Refunding Bonds | | | | |
| (Goodwin House, Inc.), 5.125%, 10/01/42 | | 300 | | 263,682 |
| Fairfax County, Virginia, EDA, Retirement Revenue | | | | |
| Refunding Bonds (Greenspring Village Inc.), | | | | |
| Series A, 4.875%, 10/01/36 | | 500 | | 420,285 |
| Henrico County, Virginia, EDA, Residential Care | | | | |
| Facility, Mortgage Revenue Refunding Bonds | | | | |
| (Westminster-Canterbury Of Winchester, Inc.), | | | | |
| 5%, 10/01/27 | | 450 | | 413,919 |
| Lexington, Virginia, IDA, Residential Care Facility, | | | | |
| Mortgage Revenue Refunding Bonds (Kendal at | | | | |
| Lexington), Series A, 5.375%, 1/01/28 | | 210 | | 185,678 |
| Tobacco Settlement Financing Corporation of Virginia, | | | | |
| Revenue Refunding Bonds, Senior Series B-1, | | | | |
| 5%, 6/01/47 | | 230 | | 171,173 |
| Virginia State, HDA, Commonwealth Mortgage | | | | |
| Revenue Bonds Series H, Sub-Series H-1, | | | | |
| 5.35%, 7/01/31 (j) | | 1,000 | | 1,006,650 |
| Watkins Centre Community Development Authority, | | | | |
| Virginia, Revenue Bonds, 5.40%, 3/01/20 | | 750 | | 685,463 |
| | | | |
|
| | | | | 4,184,714 |
| |
| |
|
| Washington — 0.6% | | | | |
| Washington State Housing Financing Commission, | | | | |
| Nonprofit Revenue Bonds (Skyline at First Hill | | | | |
| Project), Series A, 5.625%, 1/01/38 | | 550 | | 474,821 |
| |
| |
|
| West Virginia — 1.2% | | | | |
| Pleasants County, West Virginia, PCR, Refunding | | | | |
| (Allegheny Energy Supply Company, LLC), Series F, | | | | |
| 5.25%, 10/15/37 | | 1,000 | | 956,730 |
| |
| |
|
| Wisconsin — 0.6% | | | | |
| Wisconsin State Health and Educational Facilities | | | | |
| Authority, Revenue Refunding Bonds (Franciscan | | | | |
| Sisters Healthcare), 5%, 9/01/26 | | 500 | | 448,150 |
| |
| |
|
| Wyoming — 1.1% | | | | |
| Wyoming Municipal Power Agency, Power Supply | | | | |
| Revenue Bonds, Series A, 5.375%, 1/01/42 | | 900 | | 872,163 |
| |
| |
|
| Total Municipal Bonds (Cost — $84,365,189) — 91.9% | | | | 75,541,658 |
| |
| |
|
| |
| |
| Municipal Bonds Transferred to | | | | |
| Tender Option Bond Trusts (m) | | | | |
| |
| |
|
| Virginia State, HDA, Commonwealth Mortgage | | | | |
| Revenue Bonds, Series H, Sub-Series H-1, | | | | |
| 5.375%, 7/01/36 (j) | | 2,100 | | 2,413,302 |
| |
| |
|
| Total Municipal Bonds Transferred to Tender Option | | | | |
| Bond Trusts (Cost — $2,454,319) — 2.9% | | | | 2,413,302 |
| |
| |
|
| Short-Term Securities | | Shares | | Value |
| |
| |
|
| |
| Merrill Lynch Institutional Tax-Exempt Fund, | | | | |
| 1.73% (k)(l) | | 5,810,710 | | $ 5,810,710 |
| |
| |
|
| Total Short-Term Securities (Cost — $5,810,710) — 7.1% | | 5,810,710 |
| |
|
| Total Investments (Cost — $92,630,218*) — 101.9% | | | | 83,765,670 |
| Liabilities in Excess of Other Assets — (0.4%) | | | | (302,027) |
| Liability for Trust Certificates, Including Interest | | | | |
| Expense Payable — (1.5%) | | | | (1,219,689) |
| | | | |
|
| Net Assets — 100.0% | | | | $ 82,243,954 |
| | |
| |
|
* The cost and unrealized appreciation (depreciation) of investments as of
June 30, 2008, as computed for federal income tax purposes, were as follows:
| Aggregate cost | | $ 91,425,604 |
| | |
|
| Gross unrealized appreciation | | $ 13,070 |
| Gross unrealized depreciation | | (8,878,004) |
| | |
|
| Net unrealized depreciation | | $ (8,864,934) |
| | |
|
(a) Security is illiquid.
(b) Variable rate security. Rate shown is as of report date. Maturity shown is the final
maturity date.
(c) Radian Insured.
(d) Non-income producing security. Issuer filed for bankruptcy or is in default of
interest payments.
(e) FHLMC Collateralized.
(f) FNMA/GNMA Collateralized.
(g) ACA Insured.
(h) FGIC Insured.
(i) Represents a zero-coupon bond. Rate shown reflects the effective yield at the
time of purchase.
(j) MBIA Insured.
(k) Represents the current yield as of report date.
(l) Investments in companies considered to be an affiliate of the Fund, for purposes
of Section 2(a)(3) of the Investment Company Act of 1940, were as follows:
| | | Net | | Dividend |
| Affiliate | | Activity | | Income |
| |
| |
|
| |
| Merrill Lynch Institutional | | | | |
| Tax-Exempt Fund | | 2,401,803 | | $69,711 |
| |
| |
|
(m) Securities represent bonds transferred to a tender option bond trust in exchange
for which the Fund acquired residual interest certificates. These securities serve
as collateral in a financing transaction. See Note 1 of the Notes to Financial
Statements for details of municipal bonds transferred to tender option bond
trusts.
• Forward interest rate swaps oustanding as of June 30,2008 were as follows:
| | | Notional | | |
| | | Amount | | Unrealized |
| | | (000) | | Appreciation |
| |
| |
|
| |
| Pay a fixed rate of 3.646% and receive | | | | |
| a floating rate based on 1-week SIFMA rate | | | | |
| Broker, JPMorgan Chase | | | | |
| Expires July 2023 | | $3,100 | | $11,349 |
| |
| |
|
See Notes to Financial Statements.
38 BLACKROCK MUNICIPAL BOND FUND, INC.
| Statements of Assets and Liabilities | | | | | | | | |
| |
| | | BlackRock | | BlackRock | | BlackRock | | BlackRock |
| | | Short-Term | | Municipal | | National | | High Yield |
| | | Municipal | | Insured | | Municipal | | Municipal |
| June 30, 2008 | | Fund | | Fund | | Fund | | Fund |
| |
| |
| |
| |
|
| |
| Assets | | | | | | | | |
| |
| |
| |
| |
|
| |
| Investments at value — unaffiliated1 | | $ 301,734,363 | | $ 839,886,634 | | $1,627,797,575 | | $ 77,954,960 |
| Investments at value — affiliated2 | | 9,212,054 | | 27,338,748 | | 172,135,699 | | 5,810,710 |
| Unrealized appreciation on swaps | | — | | 477,428 | | — | | 11,349 |
| Cash | | 209,052 | | 75,185 | | — | | 75,599 |
| Interest receivable | | 5,067,553 | | 13,317,580 | | 25,873,991 | | 1,203,191 |
| Investments sold receivable | | — | | 1,205,771 | | 2,620,443 | | — |
| Capital shares sold receivable | | 1,107,727 | | 1,113,063 | | 5,976,600 | | 25,618 |
| Dividends receivable | | — | | 35,134 | | — | | — |
| Prepaid expenses | | 43,472 | | 37,559 | | 135,316 | | 25,628 |
| Other assets | | 3,207 | | 880,255 | | 18,156 | | 42 |
| | |
| |
| |
| |
|
| Total assets | | 317,377,428 | | 884,367,357 | | 1,834,557,780 | | 85,107,097 |
| |
| |
| |
| |
|
| |
| |
| Accrued Liabilities | | | | | | | | |
| |
| |
| |
| |
|
| |
| Bank overdraft | | — | | — | | 1,443,673 | | — |
| Investments purchased payable | | — | | — | | 12,341,554 | | 1,151,812 |
| Income dividends payable | | 695,778 | | 2,424,363 | | 5,003,934 | | 310,973 |
| Capital shares redeemed payable | | 123,499 | | 190,885 | | 1,257,723 | | 85,099 |
| Interest expense and fees payable | | — | | 600,300 | | 488,684 | | 14,689 |
| Investment advisory fees payable | | 47,931 | | 238,956 | | 653,823 | | 35,231 |
| Distribution fees payable | | 19,552 | | 95,148 | | 296,752 | | 5,072 |
| Officer’s and Directors’ fees payable | | 167 | | 524 | | 1,041 | | 42 |
| Other affiliates payable | | 28,552 | | 86,513 | | 262,615 | | 3,342 |
| Other accrued expenses payable | | 56,363 | | 83,998 | | 127,402 | | 51,883 |
| | |
| |
| |
| |
|
| Total accrued liabilities | | 971,842 | | 3,720,687 | | 21,877,201 | | 1,658,143 |
| |
| |
| |
| |
|
| |
| |
| Other Liabilities | | | | | | | | |
| |
| |
| |
| |
|
| |
| Trust certificates3 | | — | | 76,755,000 | | 74,912,500 | | 1,205,000 |
| | |
| |
| |
| |
|
| Total Liabilities | | 971,842 | | 80,475,687 | | 96,789,701 | | 2,863,143 |
| |
| |
| |
| |
|
| |
| |
| Net Assets | | | | | | | | |
| |
| |
| |
| |
|
| |
| Net assets | | $ 316,405,586 | | $ 803,891,670 | | $1,737,768,079 | | $ 82,243,954 |
| |
| |
| |
| |
|
| |
| |
| Net Assets Consist of | | | | | | | | |
| |
| |
| |
| |
|
| |
| BlackRock, $0.10 par value4 | | $ 18,258 | | $ — | | $ — | | $ — |
| Institutional, $0.10 par value5 | | 1,821,735 | | 7,351,354 | | 9,822,968 | | 819,991 |
| Investor A, $0.10 par value6 | | 94,263 | | 2,279,960 | | 4,740,418 | | 75,105 |
| Investor A1, $0.10 par value7 | | 1,058,030 | | — | | — | | — |
| Investor B, $0.10 par value8 | | 106,419 | | 451,042 | | 702,190 | | — |
| Investor C, $0.10 par value9 | | 73,848 | | 184,273 | | 1,039,397 | | 52,132 |
| Investor C1, $0.10 par value10 | | — | | 575,487 | | 1,152,769 | | — |
| Paid-in capital in excess of par | | 320,486,196 | | 795,631,004 | | 1,781,091,883 | | 92,580,510 |
| Undistributed net investment income | | 486,524 | | 2,488,502 | | 588,122 | | 114,576 |
| Accumulated net realized loss | | (9,390,012) | | (4,598,069) | | (45,130,881) | | (2,545,161) |
| Net unrealized appreciation/depreciation | | 1,650,325 | | (471,883) | | (16,238,787) | | (8,853,199) |
| | |
| |
| |
| |
|
| Net assets | | $ 316,405,586 | | $ 803,891,670 | | $1,737,768,079 | | $ 82,243,954 |
| | |
| |
| |
| |
|
| See Notes to Financial Statements. |
| BLACKROCK MUNICIPAL BOND FUND, INC. |
| Statements of Assets and Liabilities (concluded) | | | | | | | | |
| |
| | | BlackRock | | BlackRock | | BlackRock | | BlackRock |
| | | Short-Term | | Municipal | | National | | High Yield |
| | | Municipal | | Insured | | Municipal | | Municipal |
| June 30, 2008 | | Fund | | Fund | | Fund | | Fund |
| |
| |
| |
| |
|
| Net Asset Value | | | | | | | | |
| |
| |
| |
| |
|
| BlackRock: | | | | | | | | |
| Net assets | | $ 1,821,656 | | — | | — | | — |
| | |
| |
| |
| |
|
| Shares outstanding | | 182,581 | | — | | — | | — |
| | |
| |
| |
| |
|
| Net asset value and redemption price per share | | $ 9.98 | | — | | — | | — |
| | |
| |
| |
| |
|
| Institutional: | | | | | | | | |
| Net assets | | $ 181,624,311 | | $ 545,130,486 | | $ 977,641,725 | | $ 71,203,185 |
| | |
| |
| |
| |
|
| Shares outstanding | | 18,217,348 | | 73,513,539 | | 98,229,676 | | 8,199,913 |
| | |
| |
| |
| |
|
| Net asset value and redemption price per share | | $ 9.97 | | $ 7.42 | | $ 9.95 | | $ 8.68 |
| | |
| |
| |
| |
|
| Investor A: | | | | | | | | |
| Net assets | | $ 9,402,902 | | $ 169,010,198 | | $ 472,018,025 | | $ 6,513,407 |
| | |
| |
| |
| |
|
| Shares outstanding | | 942,627 | | 22,799,595 | | 47,404,184 | | 751,053 |
| | |
| |
| |
| |
|
| Net asset value and redemption price per share | | $ 9.98 | | $ 7.41 | | $ 9.96 | | $ 8.67 |
| | |
| |
| |
| |
|
| Investor A1: | | | | | | | | |
| Net assets | | $ 105,580,249 | | — | | — | | — |
| | |
| |
| |
| |
|
| Shares outstanding | | 10,580,300 | | — | | — | | — |
| | |
| |
| |
| |
|
| Net asset value and redemption price per share | | $ 9.98 | | — | | — | | — |
| | |
| |
| |
| |
|
| Investor B: | | | | | | | | |
| Net assets | | $ 10,611,722 | | $ 33,421,607 | | $ 69,858,776 | | — |
| | |
| |
| |
| |
|
| Shares outstanding | | 1,064,190 | | 4,510,417 | | 7,021,901 | | — |
| | |
| |
| |
| |
|
| Net asset value and redemption price per share | | $ 9.97 | | $ 7.41 | | $ 9.95 | | — |
| | |
| |
| |
| |
|
| Investor C: | | | | | | | | |
| Net assets | | $ 7,364,746 | | $ 13,674,435 | | $ 103,504,048 | | $ 4,527,362 |
| | |
| |
| |
| |
|
| Shares outstanding | | 738,481 | | 1,842,733 | | 10,393,972 | | 521,316 |
| | |
| |
| |
| |
|
| Net asset value and redemption price per share | | $ 9.97 | | $ 7.42 | | $ 9.96 | | $ 8.68 |
| | |
| |
| |
| |
|
| Investor C1: | | | | | | | | |
| Net assets | | — | | $ 42,654,944 | | $ 114,745,505 | | — |
| | |
| |
| |
| |
|
| Shares outstanding | | — | | 5,754,865 | | 11,527,689 | | — |
| | |
| |
| |
| |
|
| Net asset value and redemption price per share | | — | | $ 7.41 | | $ 9.95 | | — |
| | |
| |
| |
| |
|
| 1 Investments at cost — unaffiliated | | $ 300,084,038 | | $ 838,400,421 | | $1,644,036,362 | | $ 86,819,508 |
| | |
| |
| |
| |
|
| 2 Investments at cost — affiliated | | $ 9,212,054 | | $ 29,774,272 | | $ 172,135,699 | | $ 5,810,710 |
| | |
| |
| |
| |
|
| 3 Represents short-term floating rate certificates issued by | | | | | | | | |
| tender option bond trusts. | | | | | | | | |
| 4 Authorized shares — BlackRock | | 150,000,000 | | — | | — | | — |
| | |
| |
| |
| |
|
| 5 Authorized shares — Institutional | | 150,000,000 | | 500,000,000 | | 375,000,000 | | 100,000,000 |
| | |
| |
| |
| |
|
| 6 Authorized shares — Investor A | | 150,000,000 | | 500,000,000 | | 375,000,000 | | 100,000,000 |
| | |
| |
| |
| |
|
| 7 Authorized shares — Investor A1 | | 150,000,000 | | — | | — | | — |
| | |
| |
| |
| |
|
| 8 Authorized shares — Investor B | | 150,000,000 | | 375,000,000 | | 375,000,000 | | — |
| | |
| |
| |
| |
|
| 9 Authorized shares — Investor C | | 150,000,000 | | 375,000,000 | | 375,000,000 | | 100,000,000 |
| | |
| |
| |
| |
|
| 10 Authorized shares — Investor C1 | | — | | 375,000,000 | | 375,000,000 | | — |
| | |
| |
| |
| |
|
| See Notes to Financial Statements. |
40 BLACKROCK MUNICIPAL BOND FUND, INC.
| Statements of Operations | | | | | | | | |
| |
| |
| | | BlackRock | | BlackRock | | BlackRock | | BlackRock |
| | | Short-Term | | Municipal | | National | | High Yield |
| | | Municipal | | Insured | | Municipal | | Municipal |
| Year Ended June 30, 2008 | | Fund | | Fund | | Fund | | Fund |
| |
| |
| |
| |
|
| |
| Investment Income | | | | | | | | |
| |
| |
| |
| |
|
| |
| Interest | | $ 9,790,599 | | $ 42,796,831 | | $ 89,493,783 | | $ 4,152,912 |
| Dividends from affiliates | | 362,305 | | 1,164,074 | | 1,741,297 | | 69,711 |
| | |
| |
| |
| |
|
| Total income | | 10,152,904 | | 43,960,905 | | 91,235,080 | | 4,222,623 |
| |
| |
| |
| |
|
| |
| |
| Expenses | | | | | | | | |
| |
| |
| |
| |
|
| |
| Investment advisory | | 929,486 | | 3,069,556 | | 7,936,461 | | 416,074 |
| Service — Investor A | | 16,049 | | 423,295 | | 993,912 | | 14,906 |
| Service — Investor A1 | | 111,408 | | — | | — | | — |
| Service and distribution — Investor B | | 43,817 | | 294,637 | | 636,968 | | — |
| Service and distribution — Investor C | | 44,916 | | 85,702 | | 687,561 | | 38,546 |
| Service and distribution — Investor C1 | | — | | 375,526 | | 1,019,066 | | — |
| Transfer agent — Institutional | | 59,315 | | 204,898 | | 650,043 | | 7,753 |
| Transfer agent — Investor A | | 5,537 | | 80,803 | | 176,496 | | 320 |
| Transfer agent — Investor A1 | | 44,674 | | — | | — | | — |
| Transfer agent — Investor B | | 6,782 | | 22,241 | | 59,900 | | — |
| Transfer agent — Investor C | | 14,619 | | 3,420 | | 62,622 | | 1,056 |
| Transfer agent — Investor C1 | | — | | 22,797 | | 72,866 | | — |
| Accounting services | | 111,515 | | 253,635 | | 465,314 | | 40,695 |
| Registration | | 61,809 | | 53,469 | | 125,811 | | 31,666 |
| Printing | | 21,092 | | 52,314 | | 111,969 | | 5,690 |
| Professional | | 48,582 | | 51,006 | | 80,515 | | 46,595 |
| Custodian | | 28,089 | | 55,593 | | 95,653 | | 11,163 |
| Officer and Directors | | 19,894 | | 33,647 | | 53,285 | | 15,086 |
| Offering | | — | | — | | — | | 10,138 |
| Miscellaneous | | 32,040 | | 61,564 | | 125,343 | | 32,391 |
| | |
| |
| |
| |
|
| Total expenses excluding interest expense and fees | | 1,599,624 | | 5,144,103 | | 13,353,785 | | 672,079 |
| Interest expense and fees1 | | — | | 3,192,212 | | 3,110,060 | | 17,638 |
| | |
| |
| |
| |
|
| Total expenses | | 1,599,624 | | 8,336,315 | | 16,463,845 | | 689,717�� |
| Less fees waived by advisor | | (413,406) | | (28,703) | | (139,140) | | (23,814) |
| | |
| |
| |
| |
|
| Total expenses after waiver | | 1,186,218 | | 8,307,612 | | 16,324,705 | | 665,903 |
| | |
| |
| |
| |
|
| Net investment income | | 8,966,686 | | 35,653,293 | | 74,910,375 | | 3,556,720 |
| |
| |
| |
| |
|
| |
| |
| Realized and Unrealized Gain (Loss) | | | | | | | | |
| |
| |
| |
| |
|
| |
| Net realized gain (loss) from: | | | | | | | | |
| Investments | | 12,000 | | 2,228,580 | | (15,403,789) | | (1,975,997) |
| Futures and swaps | | — | | (1,654,472) | | 272,338 | | (569,171) |
| | |
| |
| |
| |
|
| | | 12,000 | | 574,108 | | (15,131,451) | | (2,545,168) |
| | |
| |
| |
| |
|
| Net change in unrealized appreciation/depreciation on: | | | | | | | | |
| Investments | | 2,166,329 | | (26,758,569) | | (57,072,431) | | (7,931,274) |
| Swaps | | — | | 187,028 | | — | | 23,581 |
| | |
| |
| |
| |
|
| | | 2,166,329 | | (26,571,541) | | (57,072,431) | | (7,907,693) |
| | |
| |
| |
| |
|
| Total realized and unrealized gain (loss) | | 2,178,329 | | (25,997,433) | | (72,203,882) | | (10,452,861) |
| | |
| |
| |
| |
|
| Net Increase (Decrease) in Net Assets Resulting from Operations | | $ 11,145,015 | | $ 9,655,860 | | $ 2,706,493 | | $ (6,896,141) |
| | |
| |
| |
| |
|
| 1 Related to tender option bond trusts. | | | | | | | | |
| See Notes to Financial Statements. |
| BLACKROCK MUNICIPAL BOND FUND, INC. |
| Statements of Changes in Net Assets | | BlackRock Short-Term Municipal Fund |
| |
| | | Year Ended June 30, |
| | |
|
| Increase (Decrease) in Net Assets: | | 2008 | | 2007 |
| |
| |
|
| Operations | | | | |
| |
| |
|
| Net investment income | | $ 8,966,686 | | $ 9,759,232 |
| Net realized gain (loss) | | 12,000 | | (1,713,793) |
| Net change in unrealized appreciation/depreciation | | 2,166,329 | | 1,804,264 |
| | |
| |
|
| Net increase in net assets resulting from operations | | 11,145,015 | | 9,849,703 |
| |
| |
|
| |
| Dividends to Shareholders From | | | | |
| |
| |
|
| Net investment income: | | | | |
| BlackRock | | (71,785) | | (140,524) |
| Institutional | | (4,627,509) | | (4,626,244) |
| Investor A | | (194,842) | | (19,319) |
| Investor A1 | | (3,596,769) | | (4,174,606) |
| Investor B | | (373,728) | | (522,656) |
| Investor C | | (102,443) | | (18,188) |
| Class C1 | | — | | (257,695) |
| | |
| |
|
| Decrease in net assets resulting from dividends to shareholders | | (8,967,076) | | (9,759,232) |
| |
| |
|
| |
| Capital Share Transactions | | | | |
| |
| |
|
| Net increase (decrease) in net assets derived from capital share transactions | | 40,508,797 | | (62,634,810) |
| |
| |
|
| |
| Net Assets | | | | |
| |
| |
|
| Total increase (decrease) in net assets | | 42,686,736 | | (62,544,339) |
| Beginning of year | | 273,718,850 | | 336,263,189 |
| | |
| |
|
| End of year | | $ 316,405,586 | | $ 273,718,850 |
| | |
| |
|
| Undistributed net investment income | | $ 486,524 | | $ 484,004 |
| | |
| |
|
| 1 On August 25, 2006, Class C was converted to Class A (Investor A1). | | | | |
| See Notes to Financial Statements. |
42 BLACKROCK MUNICIPAL BOND FUND, INC.
| Statements of Changes in Net Assets | | BlackRock Municipal Insured Fund |
| |
| | | Year Ended June 30, |
| | |
|
| Increase (Decrease) in Net Assets: | | 2008 | | 2007 |
| |
| |
|
| |
| Operations | | | | |
| |
| |
|
| |
| Net investment income | | $ 35,653,293 | | $ 39,380,614 |
| Net realized gain | | 574,108 | | 1,216,879 |
| Net change in unrealized appreciation/depreciation | | (26,571,541) | | 1,716,956 |
| | |
| |
|
| Net increase in net assets resulting from operations | | 9,655,860 | | 42,314,449 |
| |
| |
|
| |
| Dividends and Distributions to Shareholders From | | | | |
| |
| |
|
| |
| Net investment income: | | | | |
| Institutional | | (25,806,603) | | (26,786,243) |
| Investor A | | (7,157,029) | | (6,958,170) |
| Investor B | | (1,463,472) | | (1,954,906) |
| Investor C | | (297,697) | | (53,001) |
| Investor C1 | | (1,726,891) | | (1,973,504) |
| Net realized gain: | | | | |
| Institutional | | (1,052,942) | | (3,420,292) |
| Investor A | | (306,404) | | (945,702) |
| Investor B | | (73,110) | | (299,416) |
| Investor C | | (15,328) | | (6,273) |
| Investor C1 | | (86,569) | | (312,142) |
| | |
| |
|
| Decrease in net assets resulting from dividends and distributions to shareholders | | (37,986,045) | | (42,709,649) |
| |
| |
|
| |
| Capital Share Transactions | | | | |
| |
| |
|
| |
| Net decrease in net assets derived from capital share transactions | | (46,231,224) | | (60,444,977) |
| |
| |
|
| |
| Net Assets | | | | |
| |
| |
|
| |
| Total decrease in net assets | | (74,561,409) | | (60,840,177) |
| Beginning of year | | 878,453,079 | | 939,293,256 |
| | |
| |
|
| End of year | | $ 803,891,670 | | $ 878,453,079 |
| | |
| |
|
| End of year undistributed net investment income | | $ 2,488,502 | | $ 2,864,565 |
| | |
| |
|
| See Notes to Financial Statements. |
| BLACKROCK MUNICIPAL BOND FUND, INC. |
| Statements of Changes in Net Assets | | BlackRock National Municipal Fund |
| |
| | | Year Ended June 30, |
| | |
|
| Increase (Decrease) in Net Assets: | | 2008 | | 2007 |
| |
| |
|
| Operations | | | | |
| |
| |
|
| Net investment income | | $ 74,910,375 | | $ 68,679,752 |
| Net realized gain (loss) | | (15,131,451) | | 8,716,953 |
| Net change in unrealized appreciation/depreciation | | (57,072,431) | | (7,313,633) |
| | |
| |
|
| Net increase in net assets resulting from operations | | 2,706,493 | | 70,083,072 |
| |
| |
|
| |
| Dividends to Shareholders From | | | | |
| |
| |
|
| Net investment income: | | | | |
| Institutional | | (46,078,948) | | (43,499,106) |
| Investor A | | (17,700,693) | | (14,096,416) |
| Investor B | | (3,342,484) | | (4,665,176) |
| Investor C | | (2,504,463) | | (572,654) |
| Investor C1 | | (4,959,335) | | (5,809,148) |
| | |
| |
|
| Decrease in net assets resulting from dividends to shareholders | | (74,585,923) | | (68,642,500) |
| |
| |
|
| |
| Capital Share Transactions | | | | |
| |
| |
|
| Net increase in net assets derived from capital share transactions | | 200,680,907 | | 159,104,907 |
| |
| |
|
| |
| Net Assets | | | | |
| |
| |
|
| Total increase in net assets | | 128,801,477 | | 160,545,479 |
| Beginning of year | | 1,608,966,602 | | 1,448,421,123 |
| | |
| |
|
| End of year | | $1,737,768,079 | | $1,608,966,602 |
| | |
| |
|
| End of year undistributed net investment income | | $ 588,122 | | $ 984,199 |
| | |
| |
|
| See Notes to Financial Statements. |
44 BLACKROCK MUNICIPAL BOND FUND, INC.
| Statement of Changes in Net Assets | | BlackRock High Yield Municipal Fund |
| |
| | | | | Period |
| | | Year Ended | | August 1, 20061 |
| | | June 30, | | to June 30, |
| Increase (Decrease) in Net Assets: | | 2008 | | 2007 |
| |
| |
|
| Operations | | | | |
| |
| |
|
| Net investment income | | $ 3,556,720 | | $ 2,089,925 |
| Net realized gain (loss) | | (2,545,168) | | 162,355 |
| Net change in unrealized appreciation/depreciation | | (7,907,693) | | (945,506) |
| | |
| |
|
| Net increase (decrease) in net assets resulting from operations | | (6,896,141) | | 1,306,774 |
| |
| |
|
| |
| Dividends and Distributions to Shareholders From | | | | |
| |
| |
|
| Net investment income: | | | | |
| Institutional | | (3,141,405) | | (1,933,439) |
| Investor A | | (269,449) | | (73,543) |
| Investor C | | (145,136) | | (82,943) |
| Net realized gain: | | | | |
| Institutional | | (135,095) | | (9,444) |
| Investor A | | (9,128) | | (407) |
| Investor C | | (7,832) | | (454) |
| | |
| |
|
| Decrease in net assets resulting from dividends and distributions to shareholders | | (3,708,045) | | (2,100,230) |
| |
| |
|
| |
| Capital Share Transactions | | | | |
| |
| |
|
| Net increase in net assets derived from capital share transactions | | 20,113,973 | | 73,526,873 |
| |
| |
|
| |
| Net Assets | | | | |
| |
| |
|
| Total increase in net assets | | 9,509,787 | | 72,733,417 |
| Beginning of period | | 72,734,167 | | 750 |
| | |
| |
|
| End of period | | $ 82,243,954 | | $ 72,734,167 |
| | |
| |
|
| End of period undistributed net investment income | | $ 114,576 | | $ 103,720 |
| | |
| |
|
| 1 Commencement of operations. | | | | |
| See Notes to Financial Statements. |
| BLACKROCK MUNICIPAL BOND FUND, INC. |
| Financial Highlights | | BlackRock Short-Term Municipal Fund |
| |
| | | BlackRock |
| | | | | Period |
| | | Year Ended, | | October 2, 20061 |
| | | June 30, | | to June 30, |
| | | 2008 | | 2007 |
| |
| |
|
| Per Share Operating Performance | | | | |
| |
| |
|
| Net asset value, beginning of period | | $ 9.89 | | $ 9.93 |
| | |
| |
|
| Net investment income2 | | 0.33 | | 0.25 |
| Net realized and unrealized gain (loss) | | 0.09 | | (0.04) |
| | |
| |
|
| Net increase from investment operations | | 0.42 | | 0.21 |
| | |
| |
|
| Dividends from net investment income | | (0.33) | | (0.25) |
| | |
| |
|
| Net asset value, end of period | | $ 9.98 | | $ 9.89 |
| |
| |
|
| |
| Total Investment Return | | | | |
| |
| |
|
| Based on net asset value | | 4.26% | | 2.09%3 |
| |
| |
|
| |
| Ratios to Average Net Assets | | | | |
| |
| |
|
| Total expenses after waiver | | 0.39% | | 0.35%4 |
| | |
| |
|
| Total expenses | | 0.42% | | 0.45%4 |
| | |
| |
|
| Net investment income | | 3.28% | | 3.34%4 |
| |
| |
|
| |
| Supplemental Data | | | | |
| |
| |
|
| Net assets, end of period (000) | | $ 1,822 | | $ 2,457 |
| | |
| |
|
| Portfolio turnover | | 33% | | 110% |
| | |
| |
|
| 1 | Commencement of operations. |
| |
| 2 | Based on average shares outstanding. |
| |
| 3 | Aggregate total investment return. |
| |
| 4 | Annualized. |
| |
| See Notes to Financial Statements. |
46 BLACKROCK MUNICIPAL BOND FUND, INC.
| Financial Highlights (continued) | | | | | | BlackRock Short-Term Municipal Fund |
| |
| | | | | | | Institutional | | | | | | |
| | | | | Year Ended June 30, | | | | |
| | | 2008 | | 2007 | | 2006 | | | | 2005 | | 2004 |
| Per Share Operating Performance | | | | | | | | | | | | |
| Net asset value, beginning of year | | $ 9.88 | | $ 9.88 | | $ 9.99 | | $ 10.05 | | $ 10.17 |
| | |
| |
| |
| |
| |
|
| Net investment income1 | | 0.33 | | 0.32 | | 0.27 | | | | 0.19 | | 0.18 |
| Net realized and unrealized gain (loss) | | 0.09 | | —2 | | (0.11) | | | | (0.06) | | (0.12) |
| | |
| |
| |
| |
| |
| |
|
| Net increase from investment operations | | 0.42 | | 0.32 | | 0.16 | | | | 0.13 | | 0.06 |
| | |
| |
| |
| |
| |
| |
|
| Dividends from net investment income | | (0.33) | | (0.32) | | (0.27) | | | | (0.19) | | (0.18) |
| | |
| |
| |
| |
| |
| |
|
| Net asset value, end of year | | $ 9.97 | | $ 9.88 | | $ 9.88 | | $ 9.99 | | $ 10.05 |
| |
| |
| |
| |
| |
|
| |
| Total Investment Return3 | | | | | | | | | | | | |
| |
| |
| |
| |
| |
| |
|
| Based on net asset value | | 4.31% | | 3.32% | | 1.57% | | | | 1.30% | | 0.59% |
| |
| |
| |
| |
| |
| |
|
| |
| Ratios to Average Net Assets | | | | | | | | | | | | |
| |
| |
| |
| |
| |
| |
|
| Total expenses after waiver | | 0.35% | | 0.38% | | 0.44% | | | | 0.43% | | 0.42% |
| | |
| |
| |
| |
| |
| |
|
| Total expenses | | 0.49% | | 0.48% | | 0.45% | | | | 0.44% | | 0.43% |
| | |
| |
| |
| |
| |
| |
|
| Net investment income | | 3.30% | | 3.27% | | 2.66% | | | | 1.88% | | 1.78% |
| |
| |
| |
| |
| |
| |
|
| |
| Supplemental Data | | | | | | | | | | | | |
| |
| |
| |
| |
| |
| |
|
| Net assets, end of year (000) | | $ 181,624 | | $ 131,061 | | $149,333 | | $ 186,877 | | $ 243,443 |
| | |
| |
| |
| |
| |
|
| Portfolio turnover | | 33% | | 110% | | 83% | | | | 87% | | 69% |
| | |
| |
| |
| |
| |
| |
|
| 1 | Based on average shares outstanding. |
| |
| 2 | Total amount is less than $0.01 per share. |
| |
| 3 | Total investment returns exclude the effects of any sales charges. |
| |
| See Notes to Financial Statements. |
| BLACKROCK MUNICIPAL BOND FUND, INC. |
| Financial Highlights (continued) | | BlackRock Short-Term Municipal Fund |
| |
| | | Investor A | | |
| | |
| |
|
| | | | | | | Period |
| | | Year Ended, | | October 2, 20061 |
| | | June 30, | | to June 30, |
| | | 2008 | | | | 2007 |
| |
| |
| |
|
| Per Share Operating Performance | | | | | | |
| |
| |
| |
|
| Net asset value, beginning of period | | $ 9.88 | | $ 9.93 |
| | |
| |
|
| Net investment income2 | | 0.30 | | | | 0.23 |
| Net realized and unrealized gain (loss) | | 0.11 | | | | (0.05) |
| | |
| |
| |
|
| Net increase from investment operations | | 0.41 | | | | 0.18 |
| | |
| |
| |
|
| Dividends from net investment income | | (0.31) | | | | (0.23) |
| | |
| |
| |
|
| Net asset value, end of period | | $ 9.98 | | $ 9.88 |
| |
| |
|
| |
| Total Investment Return3 | | | | | | |
| |
| |
| |
|
| Based on net asset value | | 4.15% | | | | 1.79%4 |
| |
| |
| |
|
| |
| Ratios to Average Net Assets | | | | | | |
| |
| |
| |
|
| Total expenses after waiver | | 0.60% | | | | 0.61%5 |
| | |
| |
| |
|
| Total expenses | | 0.79% | | | | 1.06%5 |
| | |
| |
| |
|
| Net investment income | | 3.03% | | | | 3.12%5 |
| |
| |
| |
|
| |
| Supplemental Data | | | | | | |
| |
| |
| |
|
| Net assets, end of period (000) | | $ 9,403 | | $ 1,456 |
| | |
| |
|
| Portfolio turnover | | 33% | | | | 110% |
| | |
| |
| |
|
| 1 | Commencement of operations. |
| |
| 2 | Based on average shares outstanding. |
| |
| 3 | Total investment returns exclude the effects of sales charges. |
| |
| 4 | Aggregate total investment return. |
| |
| 5 | Annualized. |
| |
| See Notes to Financial Statements. |
48 BLACKROCK MUNICIPAL BOND FUND, INC.
| Financial Highlights (continued) | | | | | | | | | | | | BlackRock Short-Term Municipal Fund |
| |
| | | | | | | Investor A1 | | | | | | | | | | | | Investor B | | | | |
| | |
| |
| |
| |
| |
| |
| |
| |
| |
| |
| |
|
| | | | | Year Ended June 30, | | | | | | | | Year Ended June 30, | | |
| | |
| |
| |
| |
| |
| |
| |
|
| | | 2008 | | 2007 | | 2006 | | 2005 | | 2004 | | 2008 | | 2007 | | 2006 | | | | 2005 | | 2004 |
| |
| |
| |
| |
| |
| |
| |
| |
| |
| |
| |
|
| Per Share Operating Performance | | | | | | | | | | | | | | | | | | | | | | | | |
| |
| |
| |
| |
| |
| |
| |
| |
| |
| |
| |
| |
|
| Net asset value, beginning of year | | $ 9.89 | | $ 9.89 | | $ 10.00 | | $ 10.06 | | $ 10.18 | | $ 9.88 | | $ 9.88 | | $ 10.00 | | $ 10.05 | | $ 10.17 |
| | |
| |
| |
| |
| |
| |
| |
| |
| |
| |
|
| Net investment income 1 | | 0.32 | | 0.32 | | 0.26 | | | | 0.18 | | 0.17 | | 0.30 | | 0.29 | | 0.23 | | | | 0.15 | | 0.14 |
| Net realized and unrealized gain (loss) | | 0.09 | | (0.01) | | (0.11) | | | | (0.06) | | (0.12) | | 0.08 | | —3 | | (0.12) | | | | (0.05) | | (0.12) |
| | |
| |
| |
| |
| |
| |
| |
| |
| |
| |
| |
| |
|
| Net increase from investment operations | | 0.41 | | 0.31 | | 0.15 | | | | 0.12 | | 0.05 | | 0.38 | | 0.29 | | 0.11 | | | | 0.10 | | 0.02 |
| | |
| |
| |
| |
| |
| |
| |
| |
| |
| |
| |
| |
|
| Dividends from net investment income | | (0.32) | | (0.31) | | (0.26) | | | | (0.18) | | (0.17) | | (0.29) | | (0.29) | | (0.23) | | | | (0.15) | | (0.14) |
| | |
| |
| |
| |
| |
| |
| |
| |
| |
| |
| |
| |
|
| Net asset value, end of year | | $ 9.98 | | $ 9.89 | | $ 9.89 | | $ 10.00 | | $ 10.06 | | $ 9.97 | | $ 9.88 | | $ 9.88 | | $ 10.00 | | $ 10.05 |
| |
| |
| |
| |
| |
| |
| |
| |
| |
| |
|
| |
| Total Investment Return2 | | | | | | | | | | | | | | | | | | | | | | | | |
| |
| |
| |
| |
| |
| |
| |
| |
| |
| |
| |
| |
|
| Based on net asset value | | 4.20% | | 3.21% | | 1.47% | | | | 1.20% | | 0.50% | | 3.94% | | 2.95% | | 1.11% | | | | 1.04% | | 0.24% |
| |
| |
| |
| |
| |
| |
| |
| |
| |
| |
| |
| |
|
| |
| Ratios to Average Net Assets | | | | | | | | | | | | | | | | | | | | | | | | |
| |
| |
| |
| |
| |
| |
| |
| |
| |
| |
| |
| |
|
| Total expenses after waiver | | 0.45% | | 0.48% | | 0.54% | | | | 0.53% | | 0.52% | | 0.70% | | 0.74% | | 0.80% | | | | 0.79% | | 0.77% |
| | |
| |
| |
| |
| |
| |
| |
| |
| |
| |
| |
| |
|
| Total expenses | | 0.59% | | 0.58% | | 0.55% | | | | 0.54% | | 0.53% | | 0.85% | | 0.85% | | 0.81% | | | | 0.80% | | 0.78% |
| | |
| |
| |
| |
| |
| |
| |
| |
| |
| |
| |
| |
|
| Net investment income | | 3.22% | | 3.18% | | 2.55% | | | | 1.76% | | 1.68% | | 2.97% | | 2.90% | | 2.28% | | | | 1.50% | | 1.43% |
| |
| |
| |
| |
| |
| |
| |
| |
| |
| |
| |
| |
|
| |
| Supplemental Data | | | | | | | | | | | | | | | | | | | | | | | | |
| |
| |
| |
| |
| |
| |
| |
| |
| |
| |
| |
| |
|
| Net assets, end of year (000) | | $105,580 | | $122,281 | | $ 99,293 | | $141,172 | | $244,741 | | $ 10,612 | | $ 14,380 | | $ 23,769 | | $ 38,565 | | $ 63,135 |
| | |
| |
| |
| |
| |
| |
| |
| |
| |
| |
|
| Portfolio turnover | | 33% | | 110% | | 83% | | | | 87% | | 69% | | 33% | | 110% | | 83% | | | | 87% | | 69% |
| | |
| |
| |
| |
| |
| |
| |
| |
| |
| |
| |
| |
|
| 1 | Based on average shares outstanding. |
| |
| 2 | Total investment returns exclude the effects of sales charges. |
| |
| 3 | Amount is less than $(0.01) per share. |
| |
| See Notes to Financial Statements. |
| BLACKROCK MUNICIPAL BOND FUND, INC. |
| Financial Highlights (continued) | | BlackRock Short-Term Municipal Fund |
| |
| | | Investor C |
| | | | | Period |
| | | Year Ended | | October 2, 20061 |
| | | June 30, | | to June 30, |
| | | 2008 | | 2007 |
| Per Share Operating Performance | | | | |
| Net asset value, beginning of period | | $ 9.88 | | $ 9.93 |
| | |
| |
|
| Net investment income2 | | 0.23 | | 0.17 |
| Net realized and unrealized gain (loss) | | 0.09 | | (0.05) |
| | |
| |
|
| Net increase from investment operations | | 0.32 | | 0.12 |
| | |
| |
|
| Dividends from net investment income | | (0.23) | | (0.17) |
| | |
| |
|
| Net asset value, end of period | | $ 9.97 | | $ 9.88 |
| |
| |
|
| |
| Total Investment Return3 | | | | |
| |
| |
|
| Based on net asset value | | 3.27% | | 1.23%4 |
| |
| |
|
| |
| Ratios to Average Net Assets | | | | |
| |
| |
|
| Total expenses after waiver | | 1.35% | | 1.36%5 |
| | |
| |
|
| Total expenses | | 1.78% | | 2.06%5 |
| | |
| |
|
| Net investment income | | 2.28% | | 2.37%5 |
| |
| |
|
| |
| Supplemental Data | | | | |
| |
| |
|
| Net assets, end of period (000) | | $ 7,365 | | $ 2,084 |
| | |
| |
|
| Portfolio turnover | | 33% | | 110% |
| | |
| |
|
| 1 | Commencement of operations. |
| |
| 2 | Based on average shares outstanding. |
| |
| 3 | Total investment returns exclude the effects of sales charges. |
| |
| 4 | Aggregate total investment return. |
| |
| 5 | Annualized. |
| |
| See Notes to Financial Statements. |
50 BLACKROCK MUNICIPAL BOND FUND, INC.
| Financial Highlights (continued) | | | | | | | | | | | | | | BlackRock Municipal Insured Fund |
| |
| | | | | | | Institutional | | | | | | | | | | | | Investor A | | | | |
| | |
| |
| |
| |
| |
| |
| |
| |
| |
| |
| |
|
| | | | | | | Year Ended June 30, | | | | | | | | Year Ended June 30, | | |
| | |
| |
| |
| |
| |
| |
| |
| |
|
| | | 2008 | | 2007 | | 2006 | | 2005 | | 2004 | | 2008 | | 2007 | | 2006 | | | | 2005 | | 2004 |
| |
| |
| |
| |
| |
| |
| |
| |
| |
| |
| |
|
| Per Share Operating Performance | | | | | | | | | | | | | | | | | | | | | | | | | | |
| |
| |
| |
| |
| |
| |
| |
| |
| |
| |
| |
| |
| |
|
| Net asset value, beginning of year | | $ 7.67 | | $ 7.69 | | $ 8.00 | | $ 7.70 | | $ 8.07 | | $ 7.67 | | $ 7.68 | | $ 8.00 | | $ 7.70 | | $ 8.07 |
| | |
| |
| |
| |
| |
| |
| |
| |
| |
| |
|
| Net investment income1 | | 0.33 | | | | 0.32 | | 0.35 | | | | 0.36 | | 0.40 | | 0.31 | | 0.33 | | 0.33 | | | | 0.34 | | 0.38 |
| Net realized and unrealized gain (loss) | | (0.23) | | | | 0.03 | | (0.28) | | | | 0.30 | | (0.37) | | (0.24) | | 0.01 | | (0.29) | | | | 0.30 | | (0.37) |
| | |
| |
| |
| |
| |
| |
| |
| |
| |
| |
| |
| |
| |
|
| Net increase from investment operations | | 0.10 | | | | 0.35 | | 0.07 | | | | 0.66 | | 0.03 | | 0.07 | | 0.34 | | 0.04 | | | | 0.64 | | 0.01 |
| | |
| |
| |
| |
| |
| |
| |
| |
| |
| |
| |
| |
| |
|
| Dividends and distributions from: | | | | | | | | | | | | | | | | | | | | | | | | | | |
| Net investment income | | (0.34) | | | | (0.33) | | (0.35) | | | | (0.36) | | (0.40) | | (0.32) | | (0.31) | | (0.33) | | | | (0.34) | | (0.38) |
| Net realized gain | | (0.01) | | | | (0.04) | | (0.03) | | | | — | | — | | (0.01) | | (0.04) | | (0.03) | | | | — | | — |
| | |
| |
| |
| |
| |
| |
| |
| |
| |
| |
| |
| |
| |
|
| Total dividends and distributions | | (0.35) | | | | (0.37) | | (0.38) | | | | (0.36) | | (0.40) | | (0.33) | | (0.35) | | (0.36) | | | | (0.34) | | (0.38) |
| | |
| |
| |
| |
| |
| |
| |
| |
| |
| |
| |
| |
| |
|
| Net asset value, end of year | | $ 7.42 | | $ 7.67 | | $ 7.69 | | $ 8.00 | | $ 7.70 | | $ 7.41 | | $ 7.67 | | $ 7.68 | | $ 8.00 | | $ 7.70 |
| |
| |
| |
| |
| |
| |
| |
| |
| |
| |
|
| |
| Total Investment Return2 | | | | | | | | | | | | | | | | | | | | | | | | | | |
| |
| |
| |
| |
| |
| |
| |
| |
| |
| |
| |
| |
| |
|
| Based on net asset value | | 1.37% | | 4.60% | | 0.82% | | | | 8.74% | | 0.35% | | 0.96% | | 4.47% | | 0.44% | | | | 8.47% | | 0.10% |
| |
| |
| |
| |
| |
| |
| |
| |
| |
| |
| |
| |
|
| |
| Ratios to Average Net Assets | | | | | | | | | | | | | | | | | | | | | | | | | | |
| |
| |
| |
| |
| |
| |
| |
| |
| |
| |
| |
| |
| |
|
| Total expenses after waiver and excluding | | | | | | | | | | | | | | | | | | | | | | | | | | |
| interest expense and fees3 | | 0.46% | | 0.47% | | 0.45% | | | | 0.46% | | 0.46% | | 0.72% | | 0.72% | | 0.70% | | | | 0.71% | | 0.71% |
| | |
| |
| |
| |
| |
| |
| |
| |
| |
| |
| |
| |
|
| Total expenses after waiver | | 0.84% | | 0.87% | | 0.74% | | | | 0.63% | | 0.66% | | 1.10% | | 1.12% | | 0.99% | | | | 0.88% | | 0.91% |
| | |
| |
| |
| |
| |
| |
| |
| |
| |
| |
| |
| |
|
| Total expenses | | 0.85% | | 0.87% | | 0.74% | | | | 0.64% | | 0.67% | | 1.11% | | 1.13% | | 0.99% | | | | 0.89% | | 0.91% |
| | |
| |
| |
| |
| |
| |
| |
| |
| |
| |
| |
| |
|
| Net investment income | | 4.38% | | 4.42% | | 4.40% | | | | 4.58% | | 5.04% | | 4.12% | | 4.17% | | 4.15% | | | | 4.33% | | 4.79% |
| |
| |
| |
| |
| |
| |
| |
| |
| |
| |
| |
| |
|
| |
| Supplemental Data | | | | | | | | | | | | | | | | | | | | | | | | | | |
| |
| |
| |
| |
| |
| |
| |
| |
| |
| |
| |
| |
| |
|
| Net assets, end of year (000) | | $545,130 | | $604,691 | | $639,687 | | $707,134 | | $733,310 | | $169,010 | | $172,236 | | $172,083 | | $182,216 | | $183,007 |
| | |
| |
| |
| |
| |
| |
| |
| |
| |
| |
|
| Portfolio turnover | | 40% | | | | 36% | | 41% | | | | 47% | | 44% | | 40% | | 36% | | 41% | | | | 47% | | 44% |
| | |
| |
| |
| |
| |
| |
| |
| |
| |
| |
| |
| |
| |
|
| 1 | Based on average shares outstanding. |
| |
| 2 | Total investment returns exclude the effects of sales charges. |
| |
| 3 | Interest expense and fees relate to tender option bond trusts. See Note 1 of the Notes to Financial Statements for details of municipal bonds transferred to tender option bond trusts. |
| |
| See Notes to Financial Statements. |
| BLACKROCK MUNICIPAL BOND FUND, INC. |
| Financial Highlights (continued) | | | | | | BlackRock Municipal Insured Fund |
| |
| | | | | | | Investor B | | | | | | |
| | |
| |
| |
| |
| |
| |
|
| | | | | Year Ended June 30, | | | | |
| | |
| |
| |
| |
|
| | | 2008 | | 2007 | | 2006 | | | | 2005 | | 2004 |
| |
| |
| |
| |
| |
| |
|
| Per Share Operating Performance | | | | | | | | | | | | |
| |
| |
| |
| |
| |
| |
|
| Net asset value, beginning of year | | $ 7.67 | | $ 7.68 | | $ 7.99 | | $ 7.69 | | $ 8.07 |
| | |
| |
| |
| |
| |
|
| Net investment income1 | | 0.27 | | 0.29 | | 0.29 | | | | 0.30 | | 0.34 |
| Net realized and unrealized gain (loss) | | (0.24) | | 0.01 | | (0.28) | | | | 0.30 | | (0.38) |
| | |
| |
| |
| |
| |
| |
|
| Net increase (decrease) from investment operations | | 0.03 | | 0.30 | | 0.01 | | | | 0.60 | | (0.04) |
| | |
| |
| |
| |
| |
| |
|
| Dividends and distributions from: | | | | | | | | | | | | |
| Net investment income | | (0.28) | | (0.27) | | (0.29) | | | | (0.30) | | (0.34) |
| Net realized gain | | (0.01) | | (0.04) | | (0.03) | | | | — | | — |
| | |
| |
| |
| |
| |
| |
|
| Total dividends and distributions | | (0.29) | | (0.31) | | (0.32) | | | | (0.30) | | (0.34) |
| | |
| |
| |
| |
| |
| |
|
| Net asset value, end of year | | $ 7.41 | | $ 7.67 | | $ 7.68 | | $ 7.99 | | $ 7.69 |
| |
| |
| |
| |
| |
|
| |
| Total Investment Return2 | | | | | | | | | | | | |
| |
| |
| |
| |
| |
| |
|
| Based on net asset value | | 0.45% | | 3.95% | | 0.05% | | | | 7.93% | | (0.53%) |
| |
| |
| |
| |
| |
| |
|
| |
| Ratios to Average Net Assets | | | | | | | | | | | | |
| |
| |
| |
| |
| |
| |
|
| Total expenses after waiver and excluding interest expense and fees3 | | 1.23% | | 1.23% | | 1.21% | | | | 1.21% | | 1.21% |
| | |
| |
| |
| |
| |
| |
|
| Total expenses after waiver | | 1.61% | | 1.63% | | 1.50% | | | | 1.39% | | 1.42% |
| | |
| |
| |
| |
| |
| |
|
| Total expenses | | 1.61% | | 1.63% | | 1.50% | | | | 1.40% | | 1.42% |
| | |
| |
| |
| |
| |
| |
|
| Net investment income | | 3.61% | | 3.67% | | 3.64% | | | | 3.83% | | 4.29% |
| |
| |
| |
| |
| |
| |
|
| |
| Supplemental Data | | | | | | | | | | | | |
| |
| |
| |
| |
| |
| |
|
| Net assets, end of year (000) | | $ 33,422 | | $ 45,533 | | $ 66,477 | | $ 91,355 | | $ 111,524 |
| | |
| |
| |
| |
| |
|
| Portfolio turnover | | 40% | | 36% | | 41% | | | | 47% | | 44% |
| | |
| |
| |
| |
| |
| |
|
| 1 | Based on average shares outstanding. |
| |
| 2 | Total investment returns exclude the effects of sales charges. |
| |
| 3 | Interest expense and fees relate to tender option bond trusts. See Note 1 of the Notes to Financial Statements for details of municipal bonds transferred to tender option bond trusts. |
| |
| See Notes to Financial Statements. |
52 BLACKROCK MUNICIPAL BOND FUND, INC.
| Financial Highlights (continued) | | | | | | | | BlackRock Municipal Insured Fund |
| |
| | | Investor C | | | | Investor C1 | | | | | | |
| | |
| |
| |
| |
| |
| |
|
| | | | | Period | | | | | | | | | | | | |
| | | | | October 2, | | | | | | | | | | | | |
| | | Year Ended | | 20061 to | | | | | | | | | | | | |
| | | June 30, | | June30, | | | | Year Ended June 30, | | | | |
| | | 2008 | | 2007 | | 2008 | | 2007 | | 2006 | | 2005 | | 2004 |
| |
| |
| |
| |
| |
| |
| |
|
| Per Share Operating Performance | | | | | | | | | | | | | | | | |
| |
| |
| |
| |
| |
| |
| |
| |
|
| Net asset value, beginning of period | | $ 7.68 | | $ 7.88 | | $ 7.67 | | $ 7.68 | | $ 8.00 | | $ 7.69 | | $ 8.07 |
| | |
| |
| |
| |
| |
| |
| |
|
| Net investment income2 | | 0.25 | | 0.17 | | 0.27 | | 0.28 | | 0.28 | | | | 0.30 | | 0.33 |
| Net realized and unrealized gain (loss) | | (0.24) | | (0.14) | | (0.24) | | 0.02 | | (0.29) | | | | 0.31 | | (0.38) |
| | |
| |
| |
| |
| |
| |
| |
| |
|
| Net increase (decrease) from investment operations | | 0.01 | | 0.03 | | 0.03 | | 0.30 | | (0.01) | | | | 0.61 | | (0.05) |
| | |
| |
| |
| |
| |
| |
| |
| |
|
| Dividends and distributions from: | | | | | | | | | | | | | | | | |
| Net investment income | | (0.26) | | (0.19) | | (0.28) | | (0.27) | | (0.28) | | | | (0.30) | | (0.33) |
| Net realized gain | | (0.01) | | (0.04) | | (0.01) | | (0.04) | | (0.03) | | | | — | | — |
| | |
| |
| |
| |
| |
| |
| |
| |
|
| Total dividends and distributions | | (0.27) | | (0.23) | | (0.29) | | (0.31) | | (0.31) | | | | (0.30) | | (0.33) |
| | |
| |
| |
| |
| |
| |
| |
| |
|
| Net asset value, end of period | | $ 7.42 | | $ 7.68 | | $ 7.41 | | $ 7.67 | | $ 7.68 | | $ 8.00 | | $ 7.69 |
| |
| |
| |
| |
| |
| |
| |
|
| |
| Total Investment Return3 | | | | | | | | | | | | | | | | |
| |
| |
| |
| |
| |
| |
| |
| |
|
| Based on net asset value | | 0.22% | | 0.34%4 | | 0.41% | | 3.90% | | (0.12%) | | | | 8.01% | | (0.58%) |
| |
| |
| |
| |
| |
| |
| |
| |
|
| |
| Ratios to Average Net Assets | | | | | | | | | | | | | | | | |
| |
| |
| |
| |
| |
| |
| |
| |
|
| Total expenses after waiver and excluding interest expense and fees5 | | 1.46% | | 1.51%6 | | 1.27% | | 1.28% | | 1.26% | | | | 1.26% | | 1.26% |
| | |
| |
| |
| |
| |
| |
| |
| |
|
| Total expenses after waiver | | 1.84% | | 1.90%6 | | 1.65% | | 1.68% | | 1.55% | | | | 1.44% | | 1.47% |
| | |
| |
| |
| |
| |
| |
| |
| |
|
| Total expenses | | 1.85% | | 1.90%6 | | 1.66% | | 1.68% | | 1.55% | | | | 1.45% | | 1.47% |
| | |
| |
| |
| |
| |
| |
| |
| |
|
| Net investment income | | 3.37% | | 3.37%6 | | 3.57% | | 3.63% | | 3.59% | | | | 3.77% | | 4.23% |
| |
| |
| |
| |
| |
| |
| |
| |
|
| |
| Supplemental Data | | | | | | | | | | | | | | | | |
| |
| |
| |
| |
| |
| |
| |
| |
|
| Net assets, end of period (000) | | $ 13,674 | | $ 4,542 | | $ 42,655 | | $ 51,452 | | $ 61,046 | | $ 64,682 | | $ 61,794 |
| | |
| |
| |
| |
| |
| |
| |
|
| Portfolio turnover | | 40% | | 36% | | 40% | | 36% | | 41% | | | | 47% | | 44% |
| | |
| |
| |
| |
| |
| |
| |
| |
|
| 1 | Commencement of operations. |
| |
| 2 | Based on average shares outstanding. |
| |
| 3 | Total investment returns exclude the effects of sales charges. |
| |
| 4 | Aggregate total investment return. |
| |
| 5 | Interest expense and fees relate to tender option bond trusts. See Note 1 of the Notes to Financial Statements for details of municipal bonds transferred to tender option bond trusts. |
| |
| 6 | Annualized. |
| |
| See Notes to Financial Statements. |
| BLACKROCK MUNICIPAL BOND FUND, INC. |
| Financial Highlights (continued) | | | | | | | | | | | | BlackRock National Municipal Fund |
| |
| | | | | Institutional | | | | | | | | | | | | Investor A | | | | |
| | |
| |
| |
| |
| |
| |
| |
| |
| |
| |
|
| | | | | Year Ended June 30, | | | | | | | | Year Ended June 30, | | |
| | |
| |
| |
| |
| |
| |
| |
|
| | | 2008 | | 2007 | | 2006 | | 2005 | | 2004 | | 2008 | | 2007 | | 2006 | | | | 2005 | | 2004 |
| |
| |
| |
| |
| |
| |
| |
| |
| |
| |
| |
|
| Per Share Operating Performance | | | | | | | | | | | | | | | | | | | | | | | | |
| |
| |
| |
| |
| |
| |
| |
| |
| |
| |
| |
| |
|
| Net asset value, beginning of year | | $ 10.39 | | $ 10.36 | | $ 10.66 | | $ 10.29 | | $ 10.54 | | $ 10.39 | | $ 10.37 | | $ 10.67 | | $ 10.29 | | $ 10.54 |
| | |
| |
| |
| |
| |
| |
| |
| |
| |
| |
|
| Net investment income1 | | 0.48 | | 0.49 | | 0.51 | | | | 0.53 | | 0.55 | | 0.45 | | 0.46 | | 0.49 | | | | 0.50 | | 0.52 |
| Net realized and unrealized gain (loss) | | (0.44) | | 0.05 | | (0.30) | | | | 0.37 | | (0.25) | | (0.43) | | 0.03 | | (0.30) | | | | 0.38 | | (0.25) |
| | |
| |
| |
| |
| |
| |
| |
| |
| |
| |
| |
| |
|
| Net increase from investment operations | | 0.04 | | 0.54 | | 0.21 | | | | 0.90 | | 0.30 | | 0.02 | | 0.49 | | 0.19 | | | | 0.88 | | 0.27 |
| | |
| |
| |
| |
| |
| |
| |
| |
| |
| |
| |
| |
|
| Dividends from net investment income | | (0.48) | | (0.51) | | (0.51) | | | | (0.53) | | (0.55) | | (0.45) | | (0.47) | | (0.49) | | | | (0.50) | | (0.52) |
| | |
| |
| |
| |
| |
| |
| |
| |
| |
| |
| |
| |
|
| Net asset value, end of year | | $ 9.95 | | $ 10.39 | | $ 10.36 | | $ 10.66 | | $ 10.29 | | $ 9.96 | | $ 10.39 | | $ 10.37 | | $ 10.67 | | $ 10.29 |
| |
| |
| |
| |
| |
| |
| |
| |
| |
| |
|
| |
| Total Investment Return2 | | | | | | | | | | | | | | | | | | | | | | | | |
| |
| |
| |
| |
| |
| |
| |
| |
| |
| |
| |
| |
|
| Based on net asset value | | 0.35% | | 5.06% | | 2.02% | | | | 8.89% | | 2.88% | | 0.22% | | 4.71% | | 1.77% | | | | 8.73% | | 2.62% |
| |
| |
| |
| |
| |
| |
| |
| |
| |
| |
| |
| |
|
| |
| Ratios to Average Net Assets | | | | | | | | | | | | | | | | | | | | | | | | |
| |
| |
| |
| |
| |
| |
| |
| |
| |
| |
| |
| |
|
| Total expenses after waiver and excluding | | | | | | | | | | | | | | | | | | | | | | | | |
| interest expense and fees3 | | 0.60% | | 0.59% | | 0.58% | | | | 0.59% | | 0.60% | | 0.82% | | 0.84% | | 0.83% | | | | 0.84% | | 0.85% |
| | |
| |
| |
| |
| |
| |
| |
| |
| |
| |
| |
| |
|
| Total expenses after waiver | | 0.78% | | 0.99% | | 0.84% | | | | 0.72% | | 0.70% | | 1.01% | | 1.24% | | 1.09% | | | | 0.97% | | 0.95% |
| | |
| |
| |
| |
| |
| |
| |
| |
| |
| |
| |
| |
|
| Total expenses | | 0.79% | | 1.00% | | 0.85% | | | | 0.72% | | 0.70% | | 1.02% | | 1.24% | | 1.10% | | | | 0.97% | | 0.95% |
| | |
| |
| |
| |
| |
| |
| |
| |
| |
| |
| |
| |
|
| Net investment income | | 4.69% | | 4.66% | | 4.87% | | | | 5.02% | | 5.23% | | 4.46% | | 4.43% | | 4.61% | | | | 4.76% | | 4.97% |
| |
| |
| |
| |
| |
| |
| |
| |
| |
| |
| |
| |
|
| |
| Supplemental Data | | | | | | | | | | | | | | | | | | | | | | | | |
| |
| |
| |
| |
| |
| |
| |
| |
| |
| |
| |
| |
|
| Net assets, end of year (000) | | $977,642 | | $976,153 | | $890,984 | | $909,125 | | $907,419 | | $472,018 | | $349,225 | | $283,814 | | $248,231 | | $207,376 |
| | |
| |
| |
| |
| |
| |
| |
| |
| |
| |
|
| Portfolio turnover | | 61% | | 46% | | 56% | | | | 33% | | 20% | | 61% | | 46% | | 56% | | | | 33% | | 20% |
| | |
| |
| |
| |
| |
| |
| |
| |
| |
| |
| |
| |
|
| 1 | Based on average shares outstanding. |
| |
| 2 | Total investment returns exclude the effects of sales charges. |
| |
| 3 | Interest expense and fees relate to tender option bond trusts. See Note 1 of the Notes to Financial Statements for details of municipal bonds transferred to tender option bond trusts. |
| |
| See Notes to Financial Statements. |
54 BLACKROCK MUNICIPAL BOND FUND, INC.
| Financial Highlights (continued) | | | | | | | | | | BlackRock National Municipal Fund |
| |
| | | | | | | | | | | Investor B | | | | | | |
| | |
| |
| |
| |
| |
| |
| |
| |
|
| | | | | | | | | Year Ended June 30, | | | | |
| | |
| |
| |
| |
| |
| |
|
| | | 2008 | | | | 2007 | | | | 2006 | | | | 2005 | | 2004 |
| |
| |
| |
| |
| |
| |
| |
| |
|
| Per Share Operating Performance | | | | | | | | | | | | | | | | |
| |
| |
| |
| |
| |
| |
| |
| |
|
| Net asset value, beginning of year | | $ 10.38 | | $ 10.36 | | $ 10.66 | | $ 10.28 | | $ 10.53 |
| | |
| |
| |
| |
| |
|
| Net investment income1 | | 0.40 | | | | 0.41 | | | | 0.43 | | | | 0.45 | | 0.47 |
| Net realized and unrealized gain (loss) | | (0.43) | | | | 0.02 | | | | (0.30) | | | | 0.38 | | (0.26) |
| | |
| |
| |
| |
| |
| |
| |
| |
|
| Net increase (decrease) from investment operations | | (0.03) | | | | 0.43 | | | | 0.13 | | | | 0.83 | | 0.21 |
| | |
| |
| |
| |
| |
| |
| |
| |
|
| Dividends from net investment income | | (0.40) | | | | (0.41) | | (0.43) | | | | (0.45) | | (0.46) |
| | |
| |
| |
| |
| |
| |
| |
|
| Net asset value, end of year | | $ 9.95 | | $ 10.38 | | $ 10.36 | | $ 10.66 | | $ 10.28 |
| |
| |
| |
| |
| |
|
| |
| Total Investment Return2 | | | | | | | | | | | | | | | | |
| |
| |
| |
| |
| |
| |
| |
| |
|
| Based on net asset value | | (0.30)% | | 4.18% | | | | 1.25% | | | | 8.18% | | 2.10% |
| |
| |
| |
| |
| |
| |
| |
|
| |
| Ratios to Average Net Assets | | | | | | | | | | | | | | | | |
| |
| |
| |
| |
| |
| |
| |
| |
|
| Total expenses after waiver and excluding interest expense and fees3 | | 1.35% | | | | 1.34% | | | | 1.34% | | | | 1.35% | | 1.35% |
| | |
| |
| |
| |
| |
| |
| |
| |
|
| Total expenses after waiver | | 1.53% | | | | 1.75% | | | | 1.60% | | | | 1.48% | | 1.45% |
| | |
| |
| |
| |
| |
| |
| |
| |
|
| Total expenses | | 1.54% | | | | 1.75% | | | | 1.61% | | | | 1.48% | | 1.46% |
| | |
| |
| |
| |
| |
| |
| |
| |
|
| Net investment income | | 3.94% | | | | 3.92% | | | | 4.11% | | | | 4.27% | | 4.47% |
| |
| |
| |
| |
| |
| |
| |
| |
|
| |
| Supplemental Data | | | | | | | | | | | | | | | | |
| |
| |
| |
| |
| |
| |
| |
| |
|
| Net assets, end of year (000) | | $ 69,859 | | $ 101,260 | | $ 134,177 | | $ 177,553 | | $ 217,814 |
| | |
| |
| |
| |
| |
|
| Portfolio turnover | | 61% | | | | 46% | | | | 56% | | | | 33% | | 20% |
| | |
| |
| |
| |
| |
| |
| |
| |
|
| 1 | Based on average shares outstanding. |
| |
| 2 | Total investment returns exclude the effects of sales charges. |
| |
| 3 | Interest expense and fees relate to tender option bond trusts. See Note 1 of the Notes to Financial Statements for details of municipal bonds transferred to tender option bond trusts. |
| |
| See Notes to Financial Statements. |
| BLACKROCK MUNICIPAL BOND FUND, INC. |
| Financial Highlights (continued) | | | | | | | | | | BlackRock National Municipal Fund |
| |
| | | Investor C | | | | Investor C1 | | | | | | |
| | |
| |
| |
| |
| |
| |
|
| | | | | Period | | | | | | | | | | | | |
| | | | | October 2, | | | | | | | | | | | | |
| | | Year Ended | | 20061 to | | | | | | | | | | | | |
| | | June 30, | | June30, | | | | Year Ended June 30, | | | | |
| | | 2008 | | | | 2007 | | 2008 | | 2007 | | 2006 | | 2005 | | 2004 |
| |
| |
| |
| |
| |
| |
| |
| |
|
| Per Share Operating Performance | | | | | | | | | | | | | | | | | | |
| |
| |
| |
| |
| |
| |
| |
| |
| |
|
| Net asset value, beginning of period | | $ 10.39 | | $ 10.57 | | $ 10.39 | | $ 10.36 | | $ 10.66 | | $ 10.29 | | $ 10.54 |
| | |
| |
| |
| |
| |
| |
| |
|
| Net investment income2 | | 0.37 | | | | 0.25 | | 0.40 | | 0.41 | | 0.43 | | | | 0.44 | | 0.46 |
| Net realized and unrealized gain (loss) | | (0.43) | | | | (0.16) | | (0.44) | | 0.04 | | (0.29) | | | | 0.37 | | (0.25) |
| | |
| |
| |
| |
| |
| |
| |
| |
| |
|
| Net increase (decrease) from investment operations | | (0.06) | | | | 0.09 | | (0.04) | | 0.45 | | 0.14 | | | | 0.81 | | 0.21 |
| | |
| |
| |
| |
| |
| |
| |
| |
| |
|
| Dividends from net investment income | | (0.37) | | | | (0.27) | | (0.40) | | (0.42) | | (0.44) | | | | (0.44) | | (0.46) |
| | |
| |
| |
| |
| |
| |
| |
| |
| |
|
| Net asset value, end of period | | $ 9.96 | | $ 10.39 | | $ 9.95 | | $ 10.39 | | $ 10.36 | | $ 10.66 | | $ 10.29 |
| |
| |
| |
| |
| |
| |
| |
|
| |
| Total Investment Return3 | | | | | | | | | | | | | | | | | | |
| |
| |
| |
| |
| |
| |
| |
| |
| |
|
| Based on net asset value | | (0.57)% | | 0.96%4 | | (0.44)% | | 4.23% | | 1.20% | | | | 8.02% | | 2.05% |
| |
| |
| |
| |
| |
| |
| |
| |
|
| |
| Ratios to Average Net Assets | | | | | | | | | | | | | | | | | | |
| |
| |
| |
| |
| |
| |
| |
| |
| |
|
| Total expenses after waiver and excluding interest expense and fees5 | | 1.62% | | | | 1.65%6 | | 1.39% | | 1.39% | | 1.39% | | | | 1.40% | | 1.40% |
| | |
| |
| |
| |
| |
| |
| |
| |
| |
|
| Total expenses after waiver | | 1.81% | | | | 2.05%6 | | 1.57% | | 1.80% | | 1.65% | | | | 1.53% | | 1.50% |
| | |
| |
| |
| |
| |
| |
| |
| |
| |
|
| Total expenses | | 1.82% | | | | 2.05%6 | | 1.58% | | 1.80% | | 1.65% | | | | 1.53% | | 1.51% |
| | |
| |
| |
| |
| |
| |
| |
| |
| |
|
| Net investment income | | 3.66% | | | | 3.59%6 | | 3.90% | | 3.88% | | 4.05% | | | | 4.20% | | 4.42% |
| |
| |
| |
| |
| |
| |
| |
| |
| |
|
| |
| Supplemental Data | | | | | | | | | | | | | | | | | | |
| |
| |
| |
| |
| |
| |
| |
| |
| |
|
| Net assets, end of period (000) | | $103,504 | | $ 41,676 | | $114,746 | | $140,653 | | $139,447 | | $107,893 | | $ 74,849 |
| | |
| |
| |
| |
| |
| |
| |
|
| Portfolio turnover | | 61% | | | | 46% | | 61% | | 46% | | 56% | | | | 33% | | 20% |
| | |
| |
| |
| |
| |
| |
| |
| |
| |
|
| 1 | Commencement of operations. |
| |
| 2 | Based on average shares outstanding. |
| |
| 3 | Total investment returns exclude the effects of sales charges. |
| |
| 4 | Aggregate total investment return. |
| |
| 5 | Interest expense and fees relate to tender option bond trusts. See Note 1 of the Notes to Financial Statements for details of municipal bonds transferred to tender option bond trusts. |
| |
| 6 | Annualized. |
| |
| See Notes to Financial Statements. |
56 BLACKROCK MUNICIPAL BOND FUND, INC.
| Financial Highlights (continued) | | BlackRock High Yield Municipal Fund |
| |
| | | Institutional |
| | |
|
| | | | | Period |
| | | Year Ended | | August 1, 20061 |
| | | June 30, | | to June 30, |
| | | 2008 | | 2007 |
| |
| |
|
| Per Share Operating Performance | | | | |
| |
| |
|
| Net asset value, beginning of period | | $ 9.96 | | $ 10.00 |
| | |
| |
|
| Net investment income2 | | 0.44 | | 0.39 |
| Net realized and unrealized loss | | (1.26) | | (0.03) |
| | |
| |
|
| Net increase (decrease) from investment operations | | (0.82) | | 0.36 |
| | |
| |
|
| Dividends and distributions from: | | | | |
| Net investment income | | (0.44) | | (0.40) |
| Net realized gain | | (0.02) | | —3 |
| | |
| |
|
| Total dividends and distributions | | (0.46) | | (0.40) |
| | |
| |
|
| Net asset value, end of period | | $ 8.68 | | $ 9.96 |
| |
| |
|
| |
| Total Investment Return | | | | |
| |
| |
|
| Based on net asset value | | (8.38)% | | 3.59%4 |
| |
| |
|
| |
| Ratios to Average Net Assets | | | | |
| |
| |
|
| Total expenses after waiver and excluding interest expense and fees5 | | 0.78% | | 0.62%6 |
| | |
| |
|
| Total expenses after waiver | | 0.81% | | 0.62%6 |
| | |
| |
|
| Total expenses | | 0.84% | | 0.96%6 |
| | |
| |
|
| Net investment income | | 4.76% | | 4.35%6 |
| |
| |
|
| |
| Supplemental Data | | | | |
| |
| |
|
| Net assets, end of period (000) | | $ 71,203 | | $ 62,464 |
| | |
| |
|
| Portfolio turnover | | 33% | | 16% |
| | |
| |
|
| 1 | Commencement of operations. |
| |
| 2 | Based on average shares outstanding. |
| |
| 3 | Amount is less than $(0.01) per share. |
| |
| 4 | Aggregate total investment return. |
| |
| 5 | Interest expense and fees relate to tender option bond trusts. See Note 1 of the Notes to Financial Statements for details of municipal bonds transferred to tender option bond trusts. |
| |
| 6 | Annualized. |
| |
| See Notes to Financial Statements. |
| BLACKROCK MUNICIPAL BOND FUND, INC. |
| Financial Highlights (continued) | | BlackRock High Yield Municipal Fund |
| |
| | | Investor A | | |
| | |
| |
|
| | | | | | | Period |
| | | Year Ended | | August 1, 20061 |
| | | June 30, | | to June 30, |
| | | 2008 | | | | 2007 |
| |
| |
| |
|
| Per Share Operating Performance | | | | | | |
| |
| |
| |
|
| Net asset value, beginning of period | | $ 9.95 | | $ 10.00 |
| | |
| |
|
| Net investment income2 | | 0.41 | | | | 0.32 |
| Net realized and unrealized gain (loss) | | (1.26) | | | | 0.01 |
| | |
| |
| |
|
| Net increase (decrease) from investment operations | | (0.85) | | | | 0.33 |
| | |
| |
| |
|
| Dividends and distributions from: | | | | | | |
| Net investment income | | (0.41) | | | | (0.38) |
| Net realized gain | | (0.02) | | | | —3 |
| | |
| |
| |
|
| Total dividends and distributions | | (0.43) | | | | (0.38) |
| | |
| |
| |
|
| Net asset value, end of period | | $ 8.67 | | $ 9.95 |
| |
| |
|
| |
| Total Investment Return4 | | | | | | |
| |
| |
| |
|
| Based on net asset value | | (8.62)% | | | | 3.26%5 |
| |
| |
| |
|
| |
| Ratios to Average Net Assets | | | | | | |
| |
| |
| |
|
| Total expenses after waiver, and excluding interest expense and fees6 | | 1.03% | | | | 0.89%7 |
| | |
| |
| |
|
| Total expenses after waiver | | 1.05% | | | | 0.89%7 |
| | |
| |
| |
|
| Total expenses | | 1.08% | | | | 1.19%7 |
| | |
| |
| |
|
| Net investment income | | 4.52% | | | | 4.16%7 |
| |
| |
| |
|
| |
| Supplemental Data | | | | | | |
| |
| |
| |
|
| Net assets, end of period (000) | | $ 6,513 | | $ 5,892 |
| | |
| |
|
| Portfolio turnover | | 33% | | | | 16% |
| | |
| |
| |
|
| 1 | Commencement of operations. |
| |
| 2 | Based on average shares outstanding. |
| |
| 3 | Amount is less than $(0.01) per share. |
| |
| 4 | Total investment returns exclude the effects of sales charges. |
| |
| 5 | Aggregate total investment return. |
| |
| 6 | Interest expense and fees relate to tender option bond trusts. See Note 1 of the Notes to Financial Statements for details of municipal bonds transferred to tender option bond trusts. |
| |
| 7 | Annualized. |
| |
| See Notes to Financial Statements. |
58 BLACKROCK MUNICIPAL BOND FUND, INC.
| Financial Highlights (concluded) | | BlackRock High Yield Municipal Fund |
| |
| | | Investor C |
| | |
|
| | | | | Period |
| | | Year Ended | | August 1, 20061 |
| | | June 30, | | to June 30, |
| | | 2008 | | 2007 |
| |
| |
|
| Per Share Operating Performance | | | | |
| |
| |
|
| Net asset value, beginning of period | | $ 9.97 | | $ 10.00 |
| | |
| |
|
| Net investment income2 | | 0.34 | | 0.30 |
| Net realized and unrealized loss | | (1.27) | | (0.02) |
| | |
| |
|
| Net increase (decrease) from investment operations | | (0.93) | | 0.28 |
| | |
| |
|
| Dividends and distributions from: | | | | |
| Net investment income | | (0.34) | | (0.31) |
| Net realized gain | | (0.02) | | —3 |
| | |
| |
|
| Total dividends and distributions | | (0.36) | | (0.31) |
| | |
| |
|
| Net asset value, end of period | | $ 8.68 | | $ 9.97 |
| |
| |
|
| |
| Total Investment Return4 | | | | |
| |
| |
|
| Based on net asset value | | (9.40)% | | 2.84%5 |
| |
| |
|
| |
| Ratios to Average Net Assets | | | | |
| |
| |
|
| Total expenses after waiver and excluding interest expense and fees6 | | 1.80% | | 1.53%7 |
| | |
| |
|
| Total expenses after waiver | | 1.82% | | 1.53%7 |
| | |
| |
|
| Total expenses | | 1.85% | | 1.84%7 |
| | |
| |
|
| Net investment income | | 3.76% | | 3.50%7 |
| |
| |
|
| |
| Supplemental Data | | | | |
| |
| |
|
| Net assets, end of period (000) | | $ 4,527 | | $ 4,378 |
| | |
| |
|
| Portfolio turnover | | 33% | | 16% |
| | |
| |
|
| 1 | Commencement of operations. |
| |
| 2 | Based on average shares outstanding. |
| |
| 3 | Amount is less than $(0.01) per share. |
| |
| 4 | Total investment returns exclude the effects of sales charges. |
| |
| 5 | Aggregate total investment return. |
| |
| 6 | Interest expense and fees relate to tender option bond trusts. See Note 1 of the Notes to Financial Statements for details of municipal bonds transferred to tender option bond trusts. |
| |
| 7 | Annualized. |
| |
| See Notes to Financial Statements. |
| BLACKROCK MUNICIPAL BOND FUND, INC. |
Notes to Financial Statements
1. Significant Accounting Policies:
BlackRock Municipal Bond Fund, Inc. (“The Bond Fund”) consisting of
BlackRock Short-Term Municipal Fund, BlackRock Municipal Insured
Fund, BlackRock National Municipal Fund and BlackRock High Yield
Municipal Fund (the “Funds” or individually as the “Fund”) is registered
under the Investment Company Act of 1940, as amended (the “1940
Act”), as a diversified, open-end management investment company.
For the BlackRock High Yield Municipal Fund, prior to the commence-
ment of operations on August 1, 2006, the Fund had no operations
other than those relating to organizational matters and the issuance of
75 shares of Common Stock of the Fund on July 10, 2006 to Fund
Asset Management, L.P. for $750. The Bond Fund’s financial statements
are prepared in conformity with accounting principles generally accepted
in the United States of America, which may require the use of manage-
ment accruals and estimates. Actual results may differ from these
estimates. The Funds offer multiple classes of shares. BlackRock and
Institutional Shares are sold only to certain eligible investors. Investor A
and Investor A1 Shares are sold with a front-end sales charge. Shares
of Investor B, Investor C and Investor C1 may be subject to a contingent
deferred sales charge. All classes of shares have identical voting, divi-
dend, liquidation and other rights and the same terms and conditions,
except that Investor A, Investor A1, Investor B, Investor C, Investor C1
Shares bear certain expenses related to the shareholding servicing of
such shares, and Investor B, Investor C, and Investor C1 Shares also
bear certain expenses related to the distribution of such shares. Each
class has exclusive voting rights with respect to matters relating to its
shareholder servicing and distribution expenditures (except that Investor
B shareholders may vote on material changes to the Investor A and
Investor A1 distribution plan, as applicable).
The following is a summary of significant accounting policies followed by
the Funds:
Valuation of Investments: Municipal investments (including commit-
ments to purchase such investments on a “when-issued” basis) are
valued on the basis of prices provided by dealers or pricing services
selected under the supervision of the Funds’ Board of Directors (the
“Board”). In determining the value of a particular investment, pricing
services may use certain information with respect to transactions in such
investments, quotations from dealers, pricing matrixes, market transac-
tions in comparable investments and various relationships between
investments. Swap agreements are valued by quoted fair values received
by a Fund’s pricing service or through brokers. Investments in open-end
investment companies are valued at net asset value each business day.
Financial futures contracts traded on exchanges are valued at their last
sale price. Short-term securities are valued at amortized cost. |
In the event that application of these methods of valuation results in
a price for an investment which is deemed not to be representative of
the market value of such investment, the investment will be valued by
a method approved by the Board as reflecting fair value (“Fair Value
Assets”). When determining the price for Fair Value Assets the investment
advisor and/or the subadvisor seeks to determine the price that the
Fund might reasonably expect to receive from the current sale of that
asset in an arm’s-length transaction. Fair value determinations shall be
based upon all available factors that the investment advisor and/or the
sub-advisor deems relevant. The pricing of all Fair Value Assets is subse-
quently reported to the Board or a committee thereof.
Derivitive Financial Instruments: The Funds may engage in various port-
folio investment strategies both to increase the return of the Fund and
to hedge, or protect, its exposure to interest rate movements and move-
ments in the securities markets. Losses may arise if the value of the con-
tract decreases due to an unfavorable change in the price of the under-
lying security or if the counterparty does not perform under contract.
•Forward interest rate swaps — The Funds may enter into forward
interest rate swaps. In a forward interest rate swap, the Funds and
the counterparty agree to make periodic net payments on a specified
notional contract amount, commencing on a specified future effective
date, unless terminated earlier. These periodic payments received or
made by the Funds are recorded in the accompanying Statements of
Operations as realized gains or losses, respectively. Gains or losses
are realized upon termination of the swap agreements. Swaps are
marked-to market daily and changes in value are recorded as unreal-
ized appreciation (depreciation). When the swap is terminated, the
Funds will record a realized gain or loss equal to the difference
between the proceeds from (or cost of) the closing transaction and
the Funds’ basis in the contract, if any. The Funds generally intend to
close each forward interest rate swap before the accrual date speci-
fied in the agreement and therefore avoid entering into the interest
rate swap underlying each forward interest rate swap.
•Futures — The Funds may purchase or sell financial futures contracts
and options on such futures contracts. Futures contracts are con-
tracts for delayed delivery of securities at a specific future date and
at a specific price or yield. Upon entering into a contract, the Funds
deposit and maintain as collateral such initial margin as required by
the exchange on which the transaction is effected. Pursuant to the
contract, the Funds agree to receive from, or pay to, the broker an
amount of cash equal to the daily fluctuation in value of the con-
tract. Such receipts or payments are known as margin variation and
are recognized by the Funds as unrealized gains or losses. When the
contract is closed, the Funds record a realized gain or loss equal to
the difference between the value of the contract at the time it was
opened and the value at the time it was closed.
60 BLACKROCK MUNICIPAL BOND FUND, INC.
Notes to Financial Statements (continued)
Forward Commitments and When-Issued Delayed Delivery Securities:
The Funds may purchase securities on a when-issued basis and may
purchase or sell securities on a forward commitment basis. Settlement
of such transactions normally occurs within a month or more after the
purchase or sale commitment is made. The Funds may purchase securi-
ties under such conditions only with the intention of actually acquiring
them, but may enter into a separate agreement to sell the securities
before the settlement date. Since the value of securities purchased may
fluctuate prior to settlement, the Funds may be required to pay more at
settlement than the security is worth. In addition, the purchaser is not
entitled to any of the interest earned prior to settlement. Upon making a
commitment to purchase a security on a when-issued basis, the Funds
will hold liquid assets worth at least the equivalent of the amount due.
Municipal Bonds Transferred to Tender Option Bond Trusts: The Funds
leverage their assets through the use of tender option bond trusts
(“TOBs”). A TOB is established by a third party sponsor forming a special
purpose entity, into which one or more funds, or an agent on behalf of
the Funds, transfers municipal securities. Other funds managed by the
investment advisor may also contribute municipal securities to a TOB
into which the Funds have contributed securities. A TOB typically issues
two classes of beneficial interests: short-term floating rate certificates,
which are sold to third party investors, and residual certificates (“TOB
Residuals”), which are generally issued to the participating funds that
made the transfer or to affiliates of the Funds. The TOB Residuals held by
a Fund include the right of the Fund (1) to cause the holders of a pro-
portional share of the floating rate certificates to tender their certificates
at par, and (2) to transfer, within seven days, a corresponding share of
the municipal securities from the TOB to the Fund. The cash received
by the TOB from the sale of the short-term floating rate certificates, less
transaction expenses, is paid to a Fund, which typically invests the cash
in additional municipal securities. Each Fund’s transfer of the municipal
securities to a TOB is accounted for as a secured borrowing, therefore
the municipal securities deposited into a TOB are presented
in the Funds’ Schedule of Investments and the proceeds from the trans-
action are reported as a liability of the Fund.
Interest income from the underlying security is recorded by the Funds on
an accrual basis. Interest expense incurred on the secured borrowing
and other expenses related to remarketing, administration and trustee
services to a TOB are reported as expenses of the Funds. The floating
rate certificates have interest rates that generally reset weekly and their
holders have the option to tender certificates to the TOB for redemption
at par at each reset date. At June 30, 2008, the aggregate value of the
underlying municipal securities transferred to TOBs, the related liablility
for trust certificates and the range of interest rates on the trust certifi-
cates were as follows: |
| | | | | Range of | | |
| | | | | Interest | | Underlying |
| | | | | Rates on | | Municipal |
| | | Liability for | | the Liability | | Bonds |
| | | Trust | | for Trust | | Transferred |
| | | Certificates | | Certificates | | to TOBs |
| |
| |
| |
|
| BlackRock Municipal | | | | 1.63% – | | |
| Insured Fund | | $76,755,000 | | 3.081% | | $155,010,911 |
| BlackRock National | | | | 1.863% – | | |
| Municipal Fund | | $74,912,500 | | 3.411% | | $151,493,075 |
| BlackRock High Yield | | | | | | |
| Municipal Fund | | $ 1,205,000 | | 2.438% | | $ 2,413,302 |
| |
| |
| |
|
Financial transactions executed through TOBs generally will underperform
the market for fixed rate municipal bonds in a rising interest rate envi-
ronment, but tend to outperform the market for fixed rate bonds when
interest rates decline or remain relatively stable. Should short-term inter-
est rates rise, the Fund’s investment in TOB Residuals likely will adversely
affect a Fund’s net investment income and dividends to shareholders.
Fluctuations in the market value of municipal securities deposited into
the TOB may adversely affect the Funds’ net asset values per share.
Zero-Coupon Bonds: The Funds may invest in zero-coupon bonds, which
are normally issued at a significant discount from face value and do not
provide for periodic interest payments. Zero-coupon bonds may experi-
ence greater volatility in market value than similar maturity debt obliga-
tions which provide for regular interest payments.
Segregation: In cases in which the 1940 Act and the interpretive posi-
tions of the Securities and Exchange Commission (“SEC”) require that
each Fund segregate assets in connection with certain investments
(e.g., futures) or certain borrowings, each Fund will, consistant with cer-
tain interpretive letters issued by the SEC, designate on its books and
records cash or other liquid debt securities having a market value at
least equal to the amount that would otherwise be required to be physi-
cally segregated.
Investment Transactions and Investment Income: Investment trans-
actions are recorded on the dates the transactions are entered into
(the trade dates). Realized gains and losses on security transactions
are determined on the identified cost basis. Dividend income is recorded
on the ex-dividend dates. Interest income is recognized on the accrual
basis. Each Fund amortizes all premiums and discounts on debt securi-
ties. Income and realized and unrealized gains and losses are allocated
daily to each class based on its relative net assets.
Dividends and Distributions: Dividends from net investment income
are declared daily and paid monthly. Distributions of capital gains are
recorded on the ex-dividend dates. |
| BLACKROCK MUNICIPAL BOND FUND, INC. |
Notes to Financial Statements (continued)
Income Taxes: It is the Funds’ policy to comply with the requirements of
the Internal Revenue Code applicable to regulated investment compa-
nies and to distribute substantially all of its taxable income to its share-
holders. Therefore, no federal income tax provision is required.
Effective December 31, 2007, the Funds implemented Financial
Accounting Standards Board (“FASB”) Interpretation No. 48, “Accounting
for Uncertainty in Income Taxes — an interpretation of FASB Statement
No. 109” (“FIN 48”). FIN 48 prescribes the minimum recognition thresh-
old a tax position must meet in connection with accounting for uncer-
tainties in income tax positions taken or expected to be taken by an
entity, including investment companies, before being measured and rec-
ognized in the financial statements. The investment advisor has evaluat-
ed the application of FIN 48 to the Fund, and has determined that the
adoption of FIN 48 does not have a material impact on the Funds’ finan-
cial statements. The Funds file U.S. federal and various state and local
tax returns. No income tax returns are currently under examination. The
statute of limitations on the Funds’ U.S. federal tax returns remains open
for the years ended June 30, 2005 through June 30, 2007. The statutes
of limitations on the Funds’ state and local tax returns may remain open
for an additional year depending upon the jurisdiction.
Recent Accounting Pronouncements: In September 2006, Statement
of Financial Accounting Standards No. 157, “Fair Value Measurements”
(“FAS 157”), was issued and is effective for fiscal years beginning after
November 15, 2007. FAS 157 defines fair value, establishes a frame-
work for measuring fair value and expands disclosures about fair value
measurements. The impact on the Funds’ financial statement disclo-
sures, if any, is currently being assessed.
In addition, in February 2007, Statement of Financial Accounting
Standards No. 159, “The Fair Value Option for Financial Assets and
Financial Liabilities” (“FAS 159”), was issued and is effective for fiscal
years beginning after November 15, 2007. FAS 159 permits entities to
choose to measure many financial instruments and certain other items
at fair value that are not currently required to be measured at fair value.
FAS 159 also establishes presentation and disclosure requirements
designed to facilitate comparisons between entities that choose different
measurement attributes for similar types of assets and liabilities. The
impact on the Funds’ financial statement disclosures, if any, is currently
being assessed.
In March 2008, Statement of Financial Accounting Standards No. 161,
“Disclosures about Derivative Instruments and Hedging Activities — an
amendment of FASB Statement No. 133” (“FAS 161”) was issued and
is effective effective for fiscal years beginning after November 15, 2008. |
FAS 161 is intended to improve financial reporting for derivative instru-
ments by requiring enhanced disclosure that enables investors to
understand how and why an entity uses derivatives, how derivatives are
accounted for, and how derivative instruments affect an entity’s results
of operations and financial position. The impact on the Funds’ financial
statement disclosures, if any, is currently being assessed.
Bank Overdaft: BlackRock National Municipal Fund recorded a bank
overdraft due to estimate of available cash.
Other: Expenses directly related to the Funds’ or their classes are
charged to that Fund or class. Other operating expenses are pro-rated
among those funds on the basis of relative net assets or other appropri-
ate methods. Other expenses of the Funds are allocated daily to each
class based on their relative net assets.
2. Investment Advisory Agreement and Other Transactions
with Affiliates:
Each Fund has entered into an Investment Advisory Agreement with
BlackRock Advisors, LLC (the “Advisor”), and indirect, wholly owned sub-
sidiary of BlackRock, Inc., to provide investment advisory and
administration services. Merrill Lynch & Co., Inc. (“Merrill Lynch”) and
The PNC Financial Services Group, Inc. (PNC”) are principal owners of
BlackRock, Inc.
The Advisor is responsible for the management of each Fund’s portfolio
and provides the necessary personnel, facilities, equipment and certain
other services necessary to the operation of the Bond Fund. For such
services, the Funds pay the Advisor a monthly fee with respect to each
Fund at the annual rates set forth below which are based upon the aver-
age daily value of the Fund’s net assets. |
| | | Rate of Advisory Fee |
| | |
|
| | | BlackRock BlackRock BlackRock |
| Aggregate of Average | | Short-Term | | Municipal | | National |
| Daily Net Assets of the | | Municipal | | Insured | | Municipal |
| Three Combined Funds1 | | Fund | | Fund | | Fund |
| |
| |
| |
|
| Not exceeding $250 million | | 0.400% | | 0.400% | | 0.500% |
| In excess of $250 million but | | | | | | |
| not exceeding $400 million | | 0.375% | | 0.375% | | 0.475% |
| In excess of $400 million but | | | | | | |
| not exceeding $550 million | | 0.350% | | 0.375% | | 0.475% |
| In excess of $550 million but | | | | | | |
| not exceeding $1.5 billion | | 0.325% | | 0.375% | | 0.475% |
| In excess of $1.5 billion | | 0.325% | | 0.350% | | 0.475% |
| |
| |
| |
|
| | 1 The portion of the assets of a Fund to which the rate of each breakpoint level
applies will be determined on a “uniform percentage” basis. The uniform percent-
age applicable to a breakpoint level is determined by dividing the amount of the
aggregate average daily net assets of the three combined Funds that falls within
that breakpoint level by the aggregate average daily net assets of the three com-
bined Funds. The amount of the fee for a Fund at each breakpoint level is deter-
mined by multiplying the average daily net assets of that Fund by the uniform
percentage applicable to that breakpoint level and multiplying the product by the
advisory fee rate. |
62 BLACKROCK MUNICIPAL BOND FUND, INC.
Notes to Financial Statements (continued)
For the BlackRock Short-Term Municipal Fund, the Advisor has voluntarily
agreed to waive fees or expenses in order to limit expenses as follows:
0.35% for Institutional Shares, 0.60% for Investor A Shares, 0.45%
for Investor A1 Shares, 0.70% for Investor B Shares and 1.35% for
Investor C Shares. For the year ended June 30, 2008, the Advisor
waived $389,720 which is included in fees waived by Advisor on the
Statements of Operations.
The BlackRock High Yield Municipal Fund’s rates are as follows: 0.55%
of the Fund’s average daily net assets not exceeding $250 million;
0.525% of average daily net assets in excess of $250 million but not
exceeding $500 million; and 0.50% of average daily net assets in
excess of $500 million. In addition, for the BlackRock High Yield
Municipal Fund, the Advisor has voluntarily agreed to waive a portion
of the investment advisory fee. The amount of the waiver is determined
monthly and can be discontinued at any time. For the year ended
June 30, 2008, the Advisor waived $18,171 which is included in fees
waived by Advisor on the Statements of Operations.
The Advisor has agreed to waive its advisory fee for each Fund by the
amount of investment advisory fee each Fund pays to the Advisor indi-
rectly through each Fund’s investment in the Merrill Lynch Institutional
Tax-Exempt Fund. This amount is shown on the Statements of Operations
as fees waived by Advisor. For the year ended June 30, 2008, the
amounts were as follows: |
| BlackRock Short-Term Municipal Fund | | $ 23,686 |
| BlackRock Municipal Insured Fund | | $ 28,703 |
| BlackRock National Municipal Fund | | $139,140 |
| BlackRock High Yield Municipal Fund | | $ 5,643 |
| |
|
The Advisor has entered into a separate sub-advisory agreement with
BlackRock Investment Management, LLC, (“BIM”), an affiliate of the
Advisor, under which the Advisor pays the for services it provides, a
monthly fee that is a percentage of the investment advisory fee paid
by the Funds to the Advisor.
For the year ended June 30, 2008, each Fund reimbursed the Advisor for
certain accounting services, which are included in accounting services in
the Statements of Operations. The reimbursements were as follows: |
| BlackRock Short-Term Municipal Fund | | $ 4,654 |
| BlackRock Municipal Insured Fund | | $ 14,292 |
| BlackRock National Municipal Fund | | $ 28,054 |
| BlackRock High Yield Municipal Fund | | $ 1,318 |
| |
|
The Funds have entered into separate Distribution Agreements and
Distribution Plans with FAM Distributors, Inc. (“FAMD”) and BlackRock
Distributors, Inc. and its affiliates (“BDI”) (collectively, the “Distributor”).
FAMD is a wholly owned subsidiary of Merrill Lynch Group, Inc., and BDI
is an affiliate of BlackRock, Inc.
Pursuant to the Distribution Plans adopted by the Bond Fund on
behalf of the Funds in accordance with Rule 12b-1 under the 1940 Act,
each Fund pays the Distributor ongoing service and distribution fees. The
fees are accrued daily and paid monthly at annual rates based upon the
average daily net assets of the shares as follows: |
| | | | | Service Fees | | |
| | |
| |
| |
|
| |
| | | BlackRock | | BlackRock | | BlackRock | | BlackRock |
| | | Short-Term | | Municipal | | National | | High Yield |
| | | Municipal | | Insured | | Municipal | | Municipal |
| | | Fund | | Fund | | Fund | | Fund |
| |
| |
| |
| |
|
| Investor A | | 0.25% | | 0.25% | | 0.25% | | 0.25% |
| Investor A1 | | 0.10% | | — | | — | | — |
| Investor B | | 0.15% | | 0.25% | | 0.25% | | — |
| Investor C | | 0.25% | | 0.25% | | 0.25% | | 0.25% |
| Investor C1 | | — | | 0.25% | | 0.25% | | — |
| |
| |
| |
| |
|
| |
| |
| | | | | Distribution Fees | | |
| | |
| |
| |
|
| |
| | | BlackRock | | BlackRock | | BlackRock | | BlackRock |
| | | Short-Term | | Municipal | | National | | High Yield |
| | | Municipal | | Insured | | Municipal | | Municipal |
| | | Fund | | Fund | | Fund | | Fund |
| |
| |
| |
| |
|
| Investor B | | 0.20% | | 0.50% | | 0.50% | | — |
| Investor C | | 0.75% | | 0.75% | | 0.75% | | 0.75% |
| Investor C1 | | — | | 0.55% | | 0.55% | | — |
| |
| |
| |
| |
|
Pursuant to sub-agreements with the Distributor, broker-dealers, includ-
ing Merrill Lynch, Pierce, Fenner & Smith Incorporated (“MLPF&S”), a
wholly owned subsidiary of Merrill Lynch and the Distributor, provide
shareholder servicing and distribution services to the Bond Fund. The
ongoing service and/or distribution fee compensates the Distributor and
each broker-dealer for providing shareholder servicing and/or distribu-
tion related services to Investor A, Investor A1, Investor B, Investor C and
Investor C1 shareholders. |
| BLACKROCK MUNICIPAL BOND FUND, INC. |
Notes to Financial Statements (continued)
For the year ended June 30, 2008, BDI earned underwriting discounts
and direct commissions and MLPF&S earned dealer concessions on
sales of the Funds’ Investor A and Investor A1 Shares as follows: |
| | | BlackRock | | BlackRock | | BlackRock | | BlackRock |
| | | Short-Term | | Municipal | | National | | High Yield |
| | | Municipal | | Insured | | Municipal | | Municipal |
| | | Fund | | Fund | | Fund | | Fund |
| |
| |
| |
| |
|
| Investor A Shares1 | | $45,824 | | $120,585 | | $644,949 | | $10,561 |
| |
| |
| |
| |
|
1 These amounts include payments to Hilliard Lyons, which was considered an
affiliate for a portion of the period.
For the year ended June 30, 2008, MLPF&S received contingent
deferred sales charges relating to Investor B, Investor C and Investor C1
Shares as follows: |
| | | BlackRock | | BlackRock | | BlackRock | | BlackRock |
| | | Short-Term | | Municipal | | National | | High Yield |
| | | Municipal | | Insured | | Municipal | | Municipal |
| | | Fund | | Fund | | Fund | | Fund |
| |
| |
| |
| |
|
| Investor B Shares | | $6,879 | | $32,198 | | $92,960 | | — |
| Investor C Shares | | $5,278 | | $ 6,376 | | $40,971 | | $1,285 |
| Investor C1 Shares | | — | | $ 642 | | $ 2,271 | | — |
| |
| |
| |
| |
|
In addition, affilates received contingent deferred sales charges relating
to transactions subject to front-end sales charge waivers as follows: |
| | | BlackRock | | BlackRock | | BlackRock | | BlackRock |
| | | Short-Term | | Municipal | | National | | High Yield |
| | | Municipal | | Insured | | Municipal | | Municipal |
| | | Fund | | Fund | | Fund | | Fund |
| |
| |
| |
| |
|
| Investor A Shares | | $458 | | $46 | | $7,872 | | — |
| |
| |
| |
| |
|
Pursuant to written agreements, certain affiliates provide the Funds with
sub-accounting, recordkeeping, sub-transfer agency and other adminis-
trative services with respect to sub-accounts they service. For these
services, these affiliates receive an annual fee per shareholder account,
which will vary depending on share class. For the year ended June 30,
2008, the Funds paid the following amounts in return for these services: |
| BlackRock Short-Term Municipal Fund | | $103,020 |
| BlackRock Municipal Insured Fund | | $184,108 |
| BlackRock National Municipal Fund | | $559,905 |
| BlackRock High Yield Municipal Fund | | $8,656 |
| |
|
PNC Global Investment Servicing (U.S.) Inc., formerly PFPC Inc., an
indirect, wholly owned subsidiary of PNC and an affiliate of the Advisor,
is the Funds’ transfer agent. Each class of the Funds bear the costs of
transfer agent fees associated with such respective classes. Transfer
agency fees borne by each class of the Funds are comprised of those
fees charged for all shareholder communications including mailing of
shareholder reports, dividend and distribution notices, and proxy materi-
als for shareholders meetings, as well as per account and per transaction
fees related to servicing and maintenance of shareholder accounts,
including the issuing, redeeming and transferring of shares of each class
of the Funds, 12b-1 fee calculation, check writing, anti-money launder-
ing services, and customer identification services.
The Advisor maintains a call center, which is responsible for providing
certain shareholder services to the Bond Fund, such as responding to
shareholder inquiries and processing transactions based upon instruc-
tions from shareholders with respect to the subscription and redemption
of fund shares. During the year ended June 30, 2008, the following
amounts have been accrued by each Fund to reimburse the Advisor for
costs incurred running the call center, which are a component of the
transfer agent fees in the accompanying Statements of Operations. |
| | | | | Call Center Fees | | |
| | |
| |
| |
|
| |
| | | BlackRock | | BlackRock | | BlackRock | | BlackRock |
| | | Short-Term | | Municipal | | National | | High Yield |
| | | Municipal | | Insured | | Municipal | | Municipal |
| | | Fund | | Fund | | Fund | | Fund |
| |
| |
| |
| |
|
| BlackRock | | $ 25 | | — | | — | | — |
| Institutional | | $ 2,372 | | $15,748 | | $47,545 | | $ 400 |
| Investor A | | $ 149 | | $ 4,700 | | $ 9,716 | | $ 89 |
| Investor A1 | | $ 876 | | — | | — | | — |
| Investor B | | $ 120 | | $ 942 | | $ 2,282 | | — |
| Investor B1 | | $ 52 | | — | | — | | — |
| Investor C | | | | $ 134 | | $ 1,078 | | $ 68 |
| Investor C1 | | — | | $ 896 | | $ 2,209 | | — |
| |
| |
| |
| |
|
Certain officers and/or directors of the Bond Fund are officers and/or
directors of BlackRock, Inc. or its affiliates.
3. Investments:
Purchases and sales of investments, excluding short-term securities, for
the year ended June 30, 2008 were as follows: |
| | | Purchases | | Sales |
| |
| |
|
| BlackRock Short-Term Municipal Fund | | $108,634,767 | | $ 78,160,101 |
| BlackRock Municipal Insured Fund | | $364,717,783 | | $439,189,738 |
| BlackRock National Municipal Fund | | $988,822,416 | | $984,823,077 |
| BlackRock High Yield Municipal Fund | | $ 31,170,418 | | $ 22,519,853 |
| |
| |
|
64 BLACKROCK MUNICIPAL BOND FUND, INC.
Notes to Financial Statements (continued)
4. Short-Term Borrowings:
The Bond Fund, on behalf of the Funds, along with certain other funds
managed by the Advisor and its affiliates is a party to a $500,000,000
credit agreement with a group of lenders. The Funds may borrow under
the credit agreement to fund shareholder redemptions and for other law-
ful purposes other than for leverage. The Funds may borrow up to the
maximum amount allowable under the Funds’ current Prospectus and
Statement of Additional Information, subject to various other legal,regu-
latory or contractual limits. On November 21, 2007 the credit agreement
was renewed for one year under substantially the same terms. The Funds
pay a commitment fee of 0.06% per annum based on the Funds’ pro
rata share of the unused portion of the credit agreement, which is
included in miscellaneous in the Statements of Operations. Amounts
borrowed under the credit agreement bear interest at a rate equal to, at
each fund's election, the federal funds rate plus 0.35% or a base rate
as defined in the credit agreement. The Funds did not borrow under the
credit agreement during the year ended June 30, 2008.
5. Income Tax Information:
Reclassifications: Accounting principles generally accepted in the
United States of America require that certain components of net assets
be adjusted to reflect permanent differences between financial and
tax reporting. These reclassifications have no effect on net assets or
net asset values per share.
BlackRock Short-Term Municipal Fund
Accounting principles generally accepted in the United States of America
require that certain components of net assets be adjusted to reflect
permanent differences between financial and tax reporting. Accordingly,
during the current year, $119,413 has been reclassified between paid-in
capital in excess of par and accumulated net realized loss, and $2,910
has been reclassified between accumulated net realized loss and un-
distributed net investment income as a result of permanent differences
attributable to the expiration of capital loss carryforwards and the
classification of settlement proceeds.
BlackRock Municipal Insured Fund
During the current year, $422,336 has been reclassified between
accumulated net realized capital losses and undistributed net invest-
ment income as a result of permanent differences attributable to
amortization methods on fixed income securities and the reclassification
of distributions. |
BlackRock National Municipal Fund
During the current year, $720,529 has been reclassified between undistrib-
uted net investment income and accumulated net realized capital losses
as a result of amortization methods on fixed income securities and the
classification of settlement proceeds.
BlackRock High Yield Municipal Fund
During the current year, $10,138 has been reclassified between paid-in
capital in excess of par and undistributed net investment income and $12
has been reclassified between undistributed net investment income and
accumulated net realized losses as a result of non-deductible expenses
and the reclassification of distributions.
BlackRock Short-Term Municipal Fund
The tax character of distributions paid during the years ended June 30,
2008 and June 30, 2007 was as follows: |
| | | 6/30/2008 | | 6/30/2007 |
| |
| |
|
| Distributions paid from: | | | | |
| Tax-exempt income | | $ 8,967,076 | | $9,759,232 |
| | |
| |
|
| Total distributions | | $ 8,967,076 | | $9,759,232 |
| | |
| |
|
As of June 30, 2008, the components of accumulated losses on a tax
basis were as follows: |
| Undistributed tax-exempt income | | $ 486,524 |
| Undistributed long-term net capital gains | | — |
| | |
|
| Total undistributed net earnings | | 486,524 |
| Capital loss carryforward | | (9,390,012)* |
| Net unrealized losses | | 1,650,325 |
| | |
|
| Total net accumulated losses | | $ (7,253,163) |
| | |
|
* On June 30, 2008, the Fund had a capital loss carryforward of $9,390,012, of
which $426,094 expires in 2009, $32,641 expires in 2011, $331,374 expires in
2012, $1,178,808 expires in 2013, $4,110,940 expires in 2014, $2,987,949
expires in 2015 and $322,206 expires in 2016. This amount will be available to
offset future realized capital gains.
BlackRock Municipal Insured Fund
The tax character of distributions paid during the years ended June 30,
2007 and June 30, 2008 was as follows: |
| | | 6/30/2008 | | 6/30/2007 |
| |
| |
|
| Distributions paid from: | | | | |
| Tax-exempt income | | $ 36,451,692 | | $37,725,824 |
| Ordinary income | | — | | 46,235 |
| Net long-term capital gain | | 1,534,353 | | 4,937,590 |
| | |
| |
|
| Total distributions | | $ 37,986,045 | | $42,709,649 |
| | |
| |
|
| BLACKROCK MUNICIPAL BOND FUND, INC. |
Notes to Financial Statements (continued)
As of June 30, 2008, the components of accumulated losses on a tax
basis were as follows: |
| Undistributed tax-exempt income | | $ 1,314,302 |
| Undistributed long-term net capital gains | | — |
| | |
|
| Total undistributed net earnings | | 1,314,302 |
| Net unrealized losses | | (3,895,752)* |
| | |
|
| Total net accumulated losses | | $ (2,581,450) |
| | |
|
* The difference between book-basis and tax-basis net unrealized losses is attributa-
ble primarily to the tax deferral of losses on wash sales, the tax deferral of losses
on straddles, the deferral of post-October capital losses for tax purposes, the
difference between book and tax treatment of residual interests on tender option
bond trusts and the differences between book and tax amortization methods for
premiums and discounts on fixed income securities.
BlackRock National Municipal Fund
The tax character of distributions paid during the years ended June 30,
2007 and June 30, 2008 was as follows: |
| | | 6/30/2008 | | 6/30/2007 |
| |
| |
|
| Distributions paid from: | | | | |
| Tax-exempt income | | $ 74,585,923 | | $ 68,642,500 |
| | |
| |
|
| Total distributions | | $ 74,585,923 | | $ 68,642,500 |
| | |
| |
|
As of June 30, 2008, the components of accumulated losses on a tax
basis were as follows: |
| Undistributed tax-exempt income | | $ 1,447,172 |
| Undistributed long-term net capital gains | | — |
| | |
|
| Total undistributed net earnings | | 1,447,172 |
| Capital loss carryforward | | (26,828,294)* |
| Net unrealized losses | | (35,400,424)** |
| | |
|
| Total net accumulated losses | | $ (60,781,546) |
| | |
|
* On June 30, 2008, the Fund had a net capital loss carryforward of $26,828,294,
of which $23,849,631 expires in 2009, $444,566 expires in 2010, $942,957
expires in 2011 and $1,591,140 expires in 2012. This amount will be available to
offset future realized capital gains.
** The difference between book-basis and tax-basis net unrealized losses is attributa-
ble primarily to the tax deferral of losses on wash sales, the tax deferral of losses
on straddles, the deferral of post-October capital losses for tax purposes, the differ-
ence between book and tax treatment of residual interests on tender option bond
trusts, book/tax differences in the accrual of income on securities in default and
the difference between book and tax amortization methods for premium and
discounts on fixed income securities. |
BlackRock High Yield Municipal Fund
The tax character of distributions paid during the years ended June 30,
2008 and June 30, 2007 was as follows: |
| | | 6/30/2008 | | 6/30/2007 |
| |
| |
|
| Distributions paid from: | | | | |
| Tax-exempt income | | $ 3,555,990 | | $ 2,089,925 |
| Net long-term capital gain | | 21,571 | | — |
| Ordinary income | | 130,484 | | $ 10,305 |
| | |
| |
|
| Total distributions | | $ 3,708,045 | | $ 2,100,230 |
| | |
| |
|
As of June 30, 2008, the components of accumulated losses on a tax
basis were as follows: |
| Undistributed tax-exempt income | | $ 151,212 |
| Undistributed long-term net capital gains | | — |
| | |
|
| Total undistributed net earnings | | 151,212 |
| Capital loss carryforward | | (258,523)* |
| Net unrealized losses | | (11,176,473)** |
| | |
|
| Total net accumulated losses | | $ (11,283,784) |
| | |
|
* On June 30, 2008, the Fund had a capital loss carryforward of $258,523, all of
which expires in 2016. This amount will be available to offset future realized
capital gains.
** The difference between book-basis and tax-basis net unrealized losses is attribu-
table primarily to the book/tax differences in the accrual of income on securities
in default, the deferral of post-October capital losses for tax purposes and the
difference between book and tax treatment of residual interests on tender option
bond trusts. |
6. Concentration Risk:
Each Fund’s investments are concentrated in certain states, which may be
affected by adverse financial, social, environmental, economic, regulatory
and political factors.
Many municipalities insure repayment of their bonds, which reduces the
risk of loss due to issuer default. The market value of these bonds may
fluctuate for other reasons, including market perception of the value
of such insurance, and there is no guarantee that the insurer will meet
its obligation. |
66 BLACKROCK MUNICIPAL BOND FUND, INC.
| Notes to Financial Statements (continued) | | | | | | | | | | |
| |
| 7. Capital Share Transactions: | | | | | | | | | | | | |
| Transactions in capital shares for each class were as follows: | | | | | | | | | | | | |
| | | Year Ended | | | | Period October 2, 2006* |
| | | June 30, 2008 | | | | to June 30, 2007 |
| |
| |
| |
|
| | | Shares | | | | Amount | | Shares | | | | Amount |
| |
| |
| |
| |
| |
| |
|
| BlackRock Short-Term Municipal Fund | | | | | | | | | | | | |
| |
| |
| |
| |
| |
| |
|
| BlackRock Shares | | | | | | | | | | | | |
| |
| |
| |
| |
| |
| |
|
| Shares sold | | — | | | | — | | 2,874 | | $ 28,519 |
| Shares issued resulting from reorganization | | — | | | | — | | 1,094,165 | | | | 10,856,031 |
| Shares issued to shareholders in reinvestment of dividends | | 7,219 | | | | 72,014 | | 13,277 | | | | 131,697 |
| | |
| |
| |
| |
| |
| |
|
| Total issued | | 7,219 | | | | 72,014 | | 1,110,316 | | | | 11,016,247 |
| Shares redeemed | | (73,092) | | | | (730,403) | | (861,862) | | | | (8,542,264) |
| | |
| |
| |
| |
| |
| |
|
| Net increase (decrease) | | (65,873) | | $ (658,389) | | 248,454 | | $ 2,473,983 |
| | |
| |
| |
| |
|
| * Commencement of operations. | | | | | | | | | | | | |
| |
| |
| |
| |
| |
| |
|
| |
| | | | | | | | | Year Ended | | |
| Institutional Shares | | | | | | | | June 30, 2007 |
| |
| |
| |
| |
|
| Shares sold | | 7,364,607 | | $ 73,727,719 | | 2,062,719 | | $ 20,427,498 |
| Shares issued resulting from reorganization | | — | | | | — | | 721,266 | | | | 7,153,239 |
| Shares issued to shareholders in reinvestment of dividends | | 230,835 | | | | 2,302,223 | | 247,581 | | | | 2,449,491 |
| | |
| |
| |
| |
| |
| |
|
| Total issued | | 7,595,442 | | | | 76,029,942 | | 3,031,566 | | | | 30,030,228 |
| Shares redeemed | | (2,643,000) | | | | (26,376,640) | | (4,877,444) | | | | (48,321,661) |
| | |
| |
| |
| |
| |
| |
|
| Net increase (decrease) | | 4,952,442 | | $ 49,653,302 | | (1,845,878) | | $ (18,291,433) |
| |
| |
| |
| |
|
| |
| | | | | | | | | Period October 2, 2006* |
| Investor A Shares | | | | | | | | to June 30, 2007 |
| |
| |
| |
| |
|
| Shares sold | | 1,168,727 | | $ 11,651,976 | | 185,469 | | $ 1,838,827 |
| Shares issued resulting from reorganization | | — | | | | — | | 2,042 | | | | 20,254 |
| Shares issued to shareholders in reinvestment of dividends | | 11,803 | | | | 117,921 | | 1,586 | | | | 15,703 |
| | |
| |
| |
| |
| |
| |
|
| Total issued | | 1,180,530 | | | | 11,769,897 | | 189,097 | | | | 1,874,784 |
| Shares redeemed | | (385,226) | | | | (3,860,050) | | (41,774) | | | | (414,043) |
| | |
| |
| |
| |
| |
| |
|
| Net increase | | 795,304 | | $ 7,909,847 | | 147,323 | | $ 1,460,741 |
| | |
| |
| |
| |
|
| * Commencement of operations. | | | | | | | | | | | | |
| |
| |
| |
| |
| |
| |
|
| |
| | | | | | | | | Year Ended | | |
| Investor A1 Shares | | | | | | | | June 30, 2007 |
| |
| |
| |
| |
|
| Shares sold and automatic conversion of shares | | 134,833 | | $ 1,345,652 | | 678,506 | | $ 6,730,670 |
| Shares issued resulting from conversion of Class C | | — | | | | — | | 6,091,469 | | | | 60,465,669 |
| Shares issued to shareholders in reinvestment of dividends | | 185,071 | | | | 1,846,524 | | 226,609 | | | | 2,247,647 |
| | |
| |
| |
| |
| |
| |
|
| Total issued | | 319,904 | | | | 3,192,176 | | 6,996,584 | | | | 69,443,986 |
| Shares redeemed | | (2,104,956) | | | | (20,951,820) | | (4,669,705) | | | | (46,309,628) |
| | |
| |
| |
| |
| |
| |
|
| Net increase (decrease) | | (1,785,052) | | $ (17,759,644) | | 2,326,879 | | $ 23,134,358 |
| | |
| |
| |
| |
|
| BLACKROCK MUNICIPAL BOND FUND, INC. |
| Notes to Financial Statements (continued) | | | | | | | | | | |
| |
| | | Year Ended | | | | Year Ended | | |
| | | June 30, 2008 | | | | June 30, 2007 |
| | |
| |
| |
|
| | | Shares | | | | Amount | | Shares | | | | Amount |
| |
| |
| |
| |
| |
| |
|
| BlackRock Short-Term Municipal Fund | | | | | | | | | | | | |
| |
| |
| |
| |
| |
| |
|
| Investor B Shares | | | | | | | | | | | | |
| |
| |
| |
| |
| |
| |
|
| Shares sold | | 66,520 | | $ 662,554 | | 37,626 | | $ 372,718 |
| Shares issued to shareholders in reinvestment of dividends | | 21,958 | | | | 218,871 | | 33,215 | | | | 329,149 |
| | |
| |
| |
| |
| |
| |
|
| Total issued | | 88,478 | | | | 881,425 | | 70,841 | | | | 701,867 |
| Shares redeemed and automatic conversion of shares | | (479,536) | | | | (4,783,875) | | (1,020,520) | | | | (10,116,602) |
| | |
| |
| |
| |
| |
| |
|
| Net decrease | | (391,058) | | $ (3,902,450) | | (949,679) | | $ (9,414,735) |
| |
| |
| |
| |
|
| |
| | | | | | | | | Period October 2, 2006* |
| Investor C Shares | | | | | | | | to June 30, 2007 |
| |
| |
| |
| |
|
| Shares sold | | 710,129 | | $ 7,088,444 | | 231,602 | | $ 2,295,349 |
| Shares issued to shareholders in reinvestment of dividends | | 7,861 | | | | 78,483 | | 1,443 | | | | 14,283 |
| | |
| |
| |
| |
| |
| |
|
| Total issued | | 717,990 | | | | 7,166,927 | | 233,045 | | | | 2,309,632 |
| Shares redeemed | | (190,416) | | | | (1,900,796) | | (22,138) | | | | (219,427) |
| | |
| |
| |
| |
| |
| |
|
| Net increase | | 527,574 | | $ 5,266,131 | | 210,907 | | $ 2,090,205 |
| | |
| |
| |
| |
|
| * Commencement of operations. | | | | | | | | | | | | |
| |
| |
| |
| |
| |
| |
|
| |
| | | | | | | | | For the Period July 1, 2006 |
| Class C Shares | | | | | | | | to August 25, 2006* |
| |
| |
| |
| |
|
| Shares sold | | | | | | | | 62,189 | | $ 613,069 |
| Shares issued to shareholders in reinvestment of dividends | | | | | | | | 18,853 | | | | 185,978 |
| | | | | | | | |
| |
| |
|
| Total issued | | | | | | | | 81,042 | | | | 799,047 |
| | | | | | | | |
| |
| |
|
| Shares redeemed | | | | | | | | (448,474) | | | | (4,421,307) |
| Shares redeemed resulting from conversion to Investor A1 | | | | | | | | (6,122,405) | | | | (60,465,669) |
| | | | | | | | |
| |
| |
|
| Total redeemed | | | | | | | | (6,570,879) | | | | (64,886,976) |
| | | | | | | | |
| |
| |
|
| Net decrease | | | | | | | | (6,489,837) | | $ (64,087,929) |
| | | | | | | | |
| |
|
| * On August 25, 2006, Class C was converted to Class A (Investor A1). | | | | | | | | | | |
| |
| |
| |
| |
| |
|
| |
| BlackRock Municipal Insured Fund | | | | | | | | | | | | |
| |
| |
| |
| |
| |
| |
|
| | | | | | | | | Year Ended | | |
| Institutional Shares | | | | | | | | June 30, 2007 | | |
| |
| |
| |
| |
| |
|
| Shares sold | | 1,777,861 | | $ 13,543,665 | | 1,615,547 | | $ 12,595,757 |
| Shares issued to shareholders in reinvestment of dividends | | | | | | | | | | | | |
| and distributions | | 1,623,461 | | | | 12,287,529 | | 1,793,351 | | | | 14,025,199 |
| | |
| |
| |
| |
| |
| |
|
| Total issued | | 3,401,322 | | | | 25,831,194 | | 3,408,898 | | | | 26,620,956 |
| Shares redeemed | | (8,693,490) | | | | (66,023,825) | | (7,836,614) | | | | (61,267,411) |
| | |
| |
| |
| |
| |
| |
|
| Net decrease | | (5,292,168) | | $ (40,192,631) | | (4,427,716) | | $ (34,646,455) |
| |
| |
| |
| |
|
| |
| Investor A Shares | | | | | | | | | | | | |
| |
| |
| |
| |
| |
| |
|
| Shares sold and automatic conversion of shares | | 2,991,401 | | $ 22,777,021 | | 2,710,670 | | $ 21,170,114 |
| Shares issued to shareholders in reinvestment of dividends | | | | | | | | | | | | |
| and distributions | | 499,420 | | | | 3,777,445 | | 511,923 | | | | 4,001,861 |
| | |
| |
| |
| |
| |
| |
|
| Total issued | | 3,490,821 | | | | 26,554,466 | | 3,222,593 | | | | 25,171,975 |
| Shares redeemed | | (3,145,331) | | | | (23,994,753) | | (3,167,212) | | | | (24,734,287) |
| | |
| |
| |
| |
| |
| |
|
| Net increase | | 345,490 | | $ 2,559,713 | | 55,381 | | $ 437,688 |
| | |
| |
| |
| |
|
68 BLACKROCK MUNICIPAL BOND FUND, INC.
| Notes to Financial Statements (continued) | | | | | | | | |
| |
| | | Year Ended | | | | Year Ended |
| | | June 30, 2008 | | | | June 30, 2007 |
| | |
| |
| |
|
| | | Shares | | | | Amount | | Shares | | Amount |
| |
| |
| |
| |
| |
|
| BlackRock Municipal Insured Fund | | | | | | | | | | |
| |
| |
| |
| |
| |
|
| Investor B Shares | | | | | | | | | | |
| |
| |
| |
| |
| |
|
| Shares sold | | 192,937 | | $ 1,476,246 | | 70,027 | | $ 547,519 |
| Shares issued to shareholders in reinvestment of dividends | | | | | | | | | | |
| and distributions | | 89,770 | | | | 679,437 | | 127,963 | | 1,000,612 |
| | |
| |
| |
| |
| |
|
| Total issued | | 282,707 | | | | 2,155,683 | | 197,990 | | 1,548,131 |
| Shares redeemed and automatic conversion of shares | | (1,710,506) | | | | (13,019,421) | | (2,915,911) | | (22,747,070) |
| | |
| |
| |
| |
| |
|
| Net decrease | | (1,427,799) | | $ (10,863,738) | | (2,717,921) | | $ (21,198,939) |
| |
| |
| |
| |
|
| |
| | | | | | | | | Period October 2, 2006* |
| Investor C Shares | | | | | | | | to June 30, 2007 |
| |
| |
| |
| |
|
| Shares sold | | 1,416,686 | | $ 10,764,923 | | 595,100 | | $ 4,659,402 |
| Shares issued to shareholders in reinvestment of dividends | | | | | | | | | | |
| and distributions | | 25,281 | | | | 190,501 | | 4,158 | | 32,362 |
| | |
| |
| |
| |
| |
|
| Total issued | | 1,441,967 | | | | 10,955,424 | | 599,258 | | 4,691,764 |
| Shares redeemed | | (190,707) | | | | (1,443,003) | | (7,785) | | (61,282) |
| | |
| |
| |
| |
| |
|
| Net increase | | 1,251,260 | | $ 9,512,421 | | 591,473 | | $ 4,630,482 |
| | |
| |
| |
| |
|
| * Commencement of operations. | | | | | | | | | | |
| |
| |
| |
| |
| |
|
| |
| Investor C1 Shares | | | | | | | | Year Ended June 30, 2007 |
| |
| |
| |
| |
|
| Shares sold | | 259 | | $ 1,870 | | 252,508 | | $ 1,971,349 |
| Shares issued to shareholders in reinvestment of dividends | | | | | | | | | | |
| and distributions | | 124,398 | | | | 941,214 | | 150,681 | | 1,178,188 |
| | |
| |
| |
| |
| |
|
| Total issued | | 124,657 | | | | 943,084 | | 403,189 | | 3,149,537 |
| Shares redeemed | | (1,078,193) | | | | (8,190,073) | | (1,641,491) | | (12,817,290) |
| | |
| |
| |
| |
| |
|
| Net decrease | | (953,536) | | $ (7,246,989) | | (1,238,302) | | $ (9,667,753) |
| |
| |
| |
| |
|
| |
| BlackRock National Municipal Fund | | | | | | | | | | |
| |
| |
| |
| |
| |
|
| Institutional Shares | | | | | | | | | | |
| |
| |
| |
| |
| |
|
| Shares sold | | 16,005,655 | | $163,209,896 | | 13,585,783 | | $ 142,980,852 |
| Shares issued to shareholders in reinvestment of dividends | | 3,009,671 | | | | 30,615,058 | | 2,842,429 | | 29,937,810 |
| | |
| |
| |
| |
| |
|
| Total issued | | 19,015,326 | | | | 193,824,954 | | 16,428,212 | | 172,918,662 |
| Shares redeemed | | (14,764,890) | | (150,139,405) | | (8,439,693) | | (88,795,553) |
| | |
| |
| |
| |
|
| Net increase | | 4,250,436 | | $ 43,685,549 | | 7,988,519 | | $ 84,123,109 |
| |
| |
| |
| |
|
| |
| Investor A Shares | | | | | | | | | | |
| |
| |
| |
| |
| |
|
| Shares sold and automatic conversion of shares | | 18,700,872 | | $190,592,280 | | 10,447,588 | | $ 109,935,783 |
| Shares issued to shareholders in reinvestment of dividends | | 919,230 | | | | 9,340,480 | | 716,831 | | 7,552,056 |
| | |
| |
| |
| |
| |
|
| Total issued | | 19,620,102 | | | | 199,932,760 | | 11,164,419 | | 117,487,839 |
| Shares redeemed | | (5,822,235) | | | | (59,464,427) | | (4,936,616) | | (51,956,483) |
| | |
| |
| |
| |
| |
|
| Net increase | | 13,797,867 | | $140,468,333 | | 6,227,803 | | $ 65,531,356 |
| |
| |
| |
| |
|
| |
| Investor B Shares | | | | | | | | | | |
| |
| |
| |
| |
| |
|
| Shares sold | | 235,464 | | $ 2,398,074 | | 638,307 | | $ 6,734,106 |
| Shares issued to shareholders in reinvestment of dividends | | 146,494 | | | | 1,491,864 | | 200,896 | | 2,114,751 |
| | |
| |
| |
| |
| |
|
| Total issued | | 381,958 | | | | 3,889,938 | | 839,203 | | 8,848,857 |
| Shares redeemed and automatic conversion of shares | | (3,112,742) | | | | (31,809,975) | | (4,041,389) | | (42,518,597) |
| | |
| |
| |
| |
| |
|
| Net decrease | | (2,730,784) | | $ (27,920,037) | | (3,202,186) | | $ (33,669,740) |
| | |
| |
| |
| |
|
| BLACKROCK MUNICIPAL BOND FUND, INC. |
| Notes to Financial Statements (concluded) | | | | | | |
| |
| | | Year Ended | | | | Period October 2, 2006* |
| | | June 30, 2008 | | to June 30, 2007 |
| | |
| |
|
| | | Shares | | Amount | | Shares | | Amount |
| |
| |
| |
| |
|
| BlackRock National Municipal Fund | | | | | | | | |
| |
| |
| |
| |
|
| Investor C Shares | | | | | | | | |
| |
| |
| |
| |
|
| Shares sold | | 7,587,682 | | $ 77,320,500 | | 4,176,661 | | $ 44,069,366 |
| Shares issued to shareholders in reinvestment of dividends | | 175,685 | | 1,781,872 | | 35,768 | | 375,990 |
| | |
| |
| |
| |
|
| Total issued | | 7,763,367 | | 79,102,372 | | 4,212,429 | | 44,445,356 |
| Shares redeemed | | (1,379,487) | | (14,088,908) | | (202,337) | | (2,132,581) |
| | |
| |
| |
| |
|
| Net increase | | 6,383,880 | | $ 65,013,464 | | 4,010,092 | | $ 42,312,775 |
| | |
| |
| |
| |
|
| * Commencement of operations. | | | | | | | | |
| |
| |
| |
| |
|
| |
| Investor C1 Shares | | | | | | Year Ended June 30, 2007 |
| |
| |
| |
|
| Shares sold | | 35,604 | | $ 365,498 | | 2,120,136 | | $ 22,245,747 |
| Shares issued to shareholders in reinvestment of dividends | | 321,359 | | 3,272,418 | | 371,250 | | 3,911,253 |
| | |
| |
| |
| |
|
| Total issued | | 356,963 | | 3,637,916 | | 2,491,386 | | 26,157,000 |
| Shares redeemed | | (2,368,864) | | (24,204,318) | | (2,408,164) | | (25,349,593) |
| | |
| |
| |
| |
|
| Net increase (decrease) | | (2,011,901) | | $ (20,566,402) | | 83,222 | | $ 807,407 |
| |
| |
| |
| |
|
| |
| BlackRock High Yield Municipal Fund | | | | | | | | |
| |
| |
| |
| |
|
| | | | | | | Period August 1, 2006* |
| Institutional Shares | | | | | | to June 30, 2007 |
| |
| |
| |
|
| Shares sold | | 5,299,302 | | $ 48,686,114 | | 6,785,278 | | $ 68,322,908 |
| Shares issued to shareholders in reinvestment of dividends | | | | | | | | |
| and distributions | | 4,317 | | 39,399 | | 2,198 | | 22,293 |
| | |
| |
| |
| |
|
| Total issued | | 5,303,619 | | 48,725,513 | | 6,787,476 | | 68,345,201 |
| Shares redeemed | | (3,372,274) | | (30,775,895) | | (518,933) | | (5,228,829) |
| | |
| |
| |
| |
|
| Net increase | | 1,931,345 | | $ 17,949,618 | | 6,268,543 | | $ 63,116,372 |
| |
| |
| |
| |
|
| |
| Investor A Shares | | | | | | | | |
| |
| |
| |
| |
|
| Shares sold | | 388,902 | | $ 3,588,193 | | 691,133 | | $ 6,961,080 |
| Shares issued to shareholders in reinvestment of dividends | | | | | | | | |
| and distributions | | 20,824 | | 190,141 | | 3,655 | | 36,897 |
| | |
| |
| |
| |
|
| Total issued | | 409,726 | | 3,778,334 | | 694,788 | | 6,997,977 |
| Shares redeemed | | (250,883) | | (2,323,475) | | (102,603) | | (1,035,823) |
| | |
| |
| |
| |
|
| Net increase | | 158,843 | | $ 1,454,859 | | 592,185 | | $ 5,962,154 |
| |
| |
| |
| |
|
| |
| Investor C Shares | | | | | | | | |
| |
| |
| |
| |
|
| Shares sold | | 249,094 | | $ 2,283,008 | | 456,486 | | $ 4,621,438 |
| Shares issued to shareholders in reinvestment of dividends | | | | | | | | |
| and distributions | | 11,628 | | 105,769 | | 5,243 | | 53,125 |
| | |
| |
| |
| |
|
| Total issued | | 260,722 | | 2,388,777 | | 461,729 | | 4,674,563 |
| Shares redeemed | | (178,727) | | (1,679,281) | | (22,433) | | (226,216) |
| | |
| |
| |
| |
|
| Net increase | | 81,995 | | $ 709,496 | | 439,296 | | $ 4,448,347 |
| | |
| |
| |
| |
|
| * Commencement of operations. | | | | | | | | |
70 BLACKROCK MUNICIPAL BOND FUND, INC.
| Report of Independent Registered Public Accounting Firm |
To the Shareholders and Board of Directors of BlackRock
Municipal Bond Fund, Inc.:
We have audited the accompanying statements of assets and liabilities,
including the schedules of investments, of BlackRock Short-Term
Municipal Bond Fund, BlackRock Municipal Insured Fund and BlackRock
National Municipal Fund, three of the portfolios constituting BlackRock
Municipal Bond Fund, Inc. (the “Bond Fund”), as of June 30, 2008, and
the related statements of operations for the year then ended, the state-
ments of changes in net assets for each of the two years in the period
then ended, and the financial highlights for each of the five years in the
period then ended. We have also audited the accompanying statement
of assets and liabilities, including the schedule of investments, of
BlackRock High Yield Municipal Fund, one of the portfolios constituting
the Bond Fund, as of June 30, 2008, and the related statements of
operations and changes in net assets and financial highlights for the
year ended June 30, 2008 and the period August 1, 2006 through
June 30, 2007. These financial statements and financial highlights are
the responsibility of the Bond Fund’s management. Our responsibility
is to express an opinion on these financial statements and financial
highlights based on our audits.
We conducted our audits in accordance with the standards of the Public
Company Accounting Oversight Board (United States). Those standards
require that we plan and perform the audit to obtain reasonable assur-
ance about whether the financial statements and financial highlights are
free of material misstatement. The Bond Fund is not required to have,
nor were we engaged to perform, an audit of its internal control over
financial reporting. Our audits included consideration of internal control
over financial reporting as a basis for designing audit procedures that
are appropriate in the circumstances, but not for the purpose of express- |
ing an opinion on the effectiveness of the Bond Fund’s internal control
over financial reporting. Accordingly, we express no such opinion. An
audit also includes examining, on a test basis, evidence supporting the
amounts and disclosures in the financial statements, assessing the
accounting principles used and significant estimates made by manage-
ment, as well as evaluating the overall financial statement presentation.
Our procedures included confirmation of securities owned as of June 30,
2008, by correspondence with the custodian and brokers; where replies
were not received from brokers, we performed other auditing procedures.
We believe that our audits provide a reasonable basis for our opinion.
In our opinion, the financial statements and financial highlights referred
to above represent fairly, in all material respects, the respective financial
positions of BlackRock Short-Term Municipal Bond Fund, BlackRock
Municipal Insured Fund, and BlackRock National Municipal Fund, each
a portfolio of BlackRock Municipal Bond Fund, Inc. as of June 30, 2008,
the results of their operations for the year then ended, the changes in
their net assets for each of the two years in the period then ended, and
the financial highlights for five years in the period then ended, and the
financial position of BlackRock High Yield Municipal Fund, one of the
portfolios constituting BlackRock Municipal Bond Fund, Inc., as of June
30, 2008, the results of its operations, the changes in its net assets and
the financial highlights for the year ended June 30, 2008 and the period
August 1, 2006 through June 30, 2007 in conformity with accounting
principles generally accepted in the United States of America. |
Deloitte & Touche LLP
Princeton, New Jersey
August 25, 2008 |
Important Tax Information (Unaudited)
All of the net investment income distributions paid monthly by
BlackRock Short-Term Municipal Fund, BlackRock Municipal Insured
Fund, BlackRock National Municipal Fund and BlackRock High Yield
Municipal Fund of BlackRock Municipal Bond Fund, Inc. during the tax-
able year ended June 30, 2008 qualify as tax-exempt interest dividends
for federal income tax purposes.
Additionally, BlackRock Municipal Insured Fund distributed long-term
capital gains of $0.013918 per share to shareholders of record on
December 19, 2007. BlackRock High Yield Municipal Fund paid |
an ordinary income distribution of $0.016919 and a long-term capital
gain distribution of $0.002797 per share to shareholders of record on
December 19, 2007. All of the ordinary income distribution was classi-
fied as a short-term capital gain dividend eligible for exemption from
U.S. withholding tax for nonresident aliens and foreign corporations. |
| BLACKROCK MUNICIPAL BOND FUND, INC. |
Disclosure of Investment Advisory Agreement and Subadvisory Agreement
The Board of Directors (the “Board,” the members of which are referred
to as “Directors”) of BlackRock High Yield Municipal Fund (“High Yield
Fund”), BlackRock Municipal Insured Fund (“Insured Fund”), BlackRock
National Municipal Fund (“National Fund”) and BlackRock Short-Term
Municipal Fund (“Short-Term Fund”) (collectively, the “Funds”) of
BlackRock Municipal Bond Fund, Inc. (the “Corporation”) met in April
and June 2008 to consider the approval of the Funds’ investment
advisory agreement (the “Advisory Agreement”) with BlackRock Advisors,
LLC (the “Adviser”), each Fund’s investment adviser. The Board also
considered the approval of each Fund’s subadvisory agreement (the
“Subadvisory Agreement”) between the Adviser and BlackRock
Investment Management, LLC (the “Subadviser”). The Adviser and the
Subadviser are referred to herein as “BlackRock.” For simplicity, the
Funds and the Corporation are referred to herein as the “Fund.” The
Advisory Agreement and the Subadvisory Agreement are referred to
herein as the “Agreements.”
Activities and Composition of the Board
The Board of the Fund consists of fifteen individuals, twelve of whom
are not “interested persons” of the Fund as defined in the Investment
Company Act of 1940, as amended (the “1940 Act”) (the “Independ-
ent Directors”). The Directors are responsible for the oversight of the
operations of the Fund and perform the various duties imposed on the
directors of investment companies by the 1940 Act. The Independent
Directors have retained independent legal counsel to assist them in con-
nection with their duties. The Chairman of the Board is an Independent
Director. The Board established four standing committees: an Audit
Committee, a Governance and Nominating Committee, a Compliance
Committee and a Performance Oversight Committee, each of which is
composed of, and chaired by Independent Directors.
The Agreements
Upon the consummation of the combination of BlackRock’s investment
management business with Merrill Lynch & Co., Inc.’s investment man-
agement business, including Merrill Lynch Investment Managers, L. ., and
certain affiliates (the “Transaction”), the Fund entered into the Advisory
Agreement with an initial two-year term and the Adviser entered into the
Subadvisory Agreement with the Subadviser with an initial two-year term.
Consistent with the 1940 Act, prior to the expiration of the Agreements’
respective initial two-year term, the Board is required to consider the
continuation of the Fund’s Agreements on an annual basis. In connec-
tion with this process, the Board assessed, among other things, the
nature, scope and quality of the services provided to the Fund by the
personnel of BlackRock and its affiliates, including investment manage-
ment, administrative services, shareholder services, oversight of fund |
accounting and custody, marketing services and assistance in meeting
legal and regulatory requirements. The Board also received and assessed
information regarding the services provided to the Fund by certain
unaffiliated service providers.
Throughout the year, the Board, acting directly and through its commit-
tees, considers at each of its meetings factors that are relevant to its
annual consideration of the renewal of the Fund’s Agreements, including
the services and support provided to the Fund and its shareholders.
Among the matters the Board considered were: (a) investment perform-
ance for one, three and five years, as applicable, against peer funds,
as well as senior management and portfolio managers’ analysis of the
reasons for underperformance, if applicable; (b) fees, including advisory,
administration, if applicable, and other fees paid to BlackRock and its
affiliates by the Fund, such as transfer agency fees and fees for market-
ing and distribution; (c) Fund operating expenses; (d) the resources
devoted to and compliance reports relating to the Fund’s investment
objectives, policies and restrictions, (e) the Fund’s compliance with its
Code of Ethics and compliance policies and procedures; (f) the nature,
cost and character of non-investment management services provided by
BlackRock and its affiliates; (g) BlackRock’s and other service providers’
internal controls; (h) BlackRock’s implementation of the proxy voting
guidelines approved by the Board; (i) execution quality; (j) valuation and
liquidity procedures; and (k) periodic overview of BlackRock’s business,
including BlackRock’s response to the increasing scale of its business.
Board Considerations in Approving the Agreements
The Approval Process: At an in-person meeting held on April 10, 2008,
the Board reviewed materials relating to its consideration of the Agree-
ments. At an in-person meeting held on June 5 – 6, 2008, the Fund’s
Board, including the Independent Directors, unanimously approved the
continuation of the Advisory Agreement between the Adviser and the
Fund for a one-year term ending June 30, 2009 and the Subadvisory
Agreement between the Adviser and the Subadviser for a one-year term
ending June 30, 2009. In considering the approval of the Agreements,
the Board received and discussed various materials provided to it in
advance of the April 10, 2008 meeting. As a result of the discussions
that occurred during the April 10, 2008 meeting, the Board requested
and BlackRock provided additional information, as detailed below,
in advance of the June 5 – 6, 2008 Board meeting. The Board consid-
ered all factors it believed relevant with respect to the Fund, including,
among other factors: (a) the nature, extent and quality of the services
provided by BlackRock; (b) the investment performance of the Fund
and BlackRock portfolio management; (c) the advisory fee and the
cost of the services and profits to be realized by BlackRock and certain
affiliates from the relationship with the Fund; (d) economies of scale;
and (e) other factors. |
72 BLACKROCK MUNICIPAL BOND FUND, INC.
| Disclosure of Investment Advisory Agreement and Subadvisory Agreement (continued) |
Prior to the April 10, 2008 meeting, the Board requested and received
materials specifically relating to the Agreements. The Board is engaged in
an ongoing process with BlackRock to continuously review the nature
and scope of the information provided to better assist its deliberations.
These materials included (a) information independently compiled and
prepared by Lipper, Inc. (“Lipper”) on Fund fees and expenses, and the
investment performance of the Fund as compared with a peer group of
funds as determined by Lipper (“Peers”); (b) information on the prof-
itability of the Agreements to BlackRock and certain affiliates, including
their other relationships with the Fund, and a discussion of fall-out bene-
fits; (c) a general analysis provided by BlackRock concerning investment
advisory fees charged to other clients, such as institutional and closed-
end funds, under similar investment mandates, as well as the perform-
ance of such other clients; (d) a report on economies of scale; (e) sales
and redemption data regarding the Fund’s shares; and (f) an internal
comparison of management fees classified by Lipper, if applicable. At
the April 10, 2008 meeting, the Board requested and subsequently
received from BlackRock (i) a comprehensive analysis of total expenses
on a fund-by-fund basis; (ii) further analysis of investment performance;
(iii) further data regarding Fund profitability, Fund size and Fund fee levels;
and (iv) additional information on sales and redemptions.
The Board also considered other matters it deemed important to the
approval process, such as payments made to BlackRock or its affiliates
relating to the distribution of Fund shares, services related to the valua-
tion and pricing of Fund portfolio holdings and direct and indirect
benefits to BlackRock and its affiliates from their relationship with the
Fund. The Board did not identify any particular information as controlling,
and each Director may have attributed different weights to the various
items considered.
A. Nature, Extent and Quality of the Services: The Board, including the
Independent Directors, reviewed the nature, extent and quality of servic-
es provided by BlackRock, including the investment advisory services
and the resulting performance of the Fund. Throughout the year, the
Board compared Fund performance — both including and excluding
the effects of the Fund’s fees and expenses — to the performance of a
comparable group of mutual funds as classified by Lipper and the per-
formance of at least one relevant index or combination of indices. The
Board met with BlackRock’s senior management personnel responsible
for investment operations, including the senior investment officers. The
Board also reviewed the materials provided by the Fund’s portfolio man-
agement team discussing Fund performance and the Fund’s investment
objectives, strategies and outlook. |
The Board considered, among other factors, the number, education and
experience of BlackRock’s investment personnel generally and the Fund’s
portfolio management team, BlackRock’s portfolio trading capabilities,
BlackRock’s use of technology, BlackRock’s commitment to compliance
and BlackRock’s approach to training and retaining portfolio managers
and other research, advisory and management personnel. The Board
also reviewed BlackRock’s compensation structure with respect to the
Fund’s portfolio management team and BlackRock’s ability to attract
and retain high-quality talent.
In addition to advisory services, the Board considered the quality of the
administrative and non-investment advisory services provided to the
Fund. BlackRock and its affiliates provide the Fund with certain adminis-
trative, transfer agency, shareholder and other services (in addition to
any such services provided to the Fund by third parties) and officers
and other personnel as are necessary for the operations of the Fund.
In addition to investment advisory services, BlackRock and its affiliates
provide the Fund with other services, including (i) preparing disclosure
documents, such as the prospectus, the statement of additional infor-
mation and shareholder reports; (ii) assisting with daily accounting and
pricing; (iii) overseeing and coordinating the activities of other service
providers; (iv) organizing Board meetings and preparing the materials
for such Board meetings; (v) providing legal and compliance support;
and (vi) performing other administrative functions necessary for the
operation of the Fund, such as tax reporting and fulfilling regulatory
filing requirements. The Board reviewed the structure and duties of
BlackRock’s fund administration, accounting, legal and compliance
departments.
B. The Investment Performance of the Fund and BlackRock: The Board,
including the Independent Directors, also reviewed and considered the
performance history of the Fund. In preparation for the April 10, 2008
meeting, the Board was provided with reports, independently prepared
by Lipper, which included a comprehensive analysis of the Fund’s per-
formance. The Board also reviewed a narrative and statistical analysis
of the Lipper data that was prepared by BlackRock, which analyzed
various factors that affect Lipper’s rankings. In connection with its review,
the Board received and reviewed information regarding the investment
performance of the Fund as compared to a representative group of
similar funds as determined by Lipper and to all funds in the Fund’s
applicable Lipper category. The Board was provided with a description
of the methodology used by Lipper to select peer funds. The Board regu-
larly reviews the performance of the Fund throughout the year. The Board
attaches more importance to performance over relatively long periods of
time, typically three to five years. |
| BLACKROCK MUNICIPAL BOND FUND, INC. |
| Disclosure of Investment Advisory Agreement and Subadvisory Agreement (continued) |
The Board considered BlackRock’s planned changes in the organization
of its fixed-income management.
Each of the National Fund and the Insured Fund ranked in the third, first
and first quartiles on a net basis against its Lipper peer universe for the
one, three and five-year periods ended December 31, 2007. The Board
noted that the Funds’ investment performance for the one-year period
was disappointing, but that longer-term performance met the Board’s
expectations. The Board typically gives greater weight to longer-term
results. The Board discussed the Fund’s management process and
resources with BlackRock’s senior management and will continue to
monitor the Fund’s performance. There was a discussion of the negative
impact on performance of investment decisions in respect of duration,
specific sectors and securities. The Short-Term Fund ranked in the sec-
ond, third and third quartiles on a net basis against its Lipper peer uni-
verse for the one, three and five-year periods ended December 31,
2007. In considering the Advisory Agreement, the Board expressed con-
cern with Short-Term Fund’s three- and five-year performance, but noted
that the three-year results were only one basis point below median and
that more recent investment results have been encouraging. There was
a discussion of the negative impact on performance of investment
decisions in respect of duration, yield curve positioning and cash posi-
tion. The BlackRock High Yield Municipal Fund had only one full year of
performance data for the period ending December 31, 2007, but was
in the fourth quartile on a net basis against its Lipper peer universe for
the period. The Board expressed disappointment with the Fund’s fourth
quartile performance. The Board discussed the processes and resources
devoted to the management of the Fund with BlackRock’s senior man-
agement and will continue to monitor the Fund’s performance. There was
a discussion of the market conditions that resulted in the Fund’s poor
performance.
C. Consideration of the Advisory Fees and the Cost of the Services
and Profits to be Realized by BlackRock and its Affiliates from the
Relationship with the Fund: The Board, including the Independent
Directors, reviewed the Fund’s contractual advisory fee rates compared
with the other funds in its Lipper category. It also compared the Fund’s
total expenses to those of other comparable funds. The Board consid-
ered the services provided and the fees charged by BlackRock to other
types of clients with similar investment mandates, including separately
managed institutional accounts.
The Board received and reviewed statements relating to BlackRock’s
financial condition and profitability with respect to the services it
provided the Fund. The Board was also provided with a profitability
analysis that detailed the revenues earned and the expenses incurred
by BlackRock and certain affiliates that provide services to the Fund.
The Board reviewed BlackRock’s profitability with respect to the |
Fund and each fund the Board currently oversees for the year ended
December 31, 2007 compared to aggregated profitability data provided
for the year ended December 31, 2005.
In addition, the Board considered the cost of the services provided to
the Fund by BlackRock, and BlackRock’s and its affiliates’ profits relating
to the management and distribution of the Fund and the other funds
advised by BlackRock and its affiliates. As part of its analysis, the Board
reviewed BlackRock’s methodology in allocating its costs to the manage-
ment of the Fund and concluded that there was a reasonable basis for
the allocation. The Board also considered whether BlackRock has the
financial resources necessary to attract and retain high quality invest-
ment management personnel to perform its obligations under the
Agreements and to continue to provide the high quality of services
that are expected by the Board.
The Board also took into account that the Funds have an advisory fee
arrangement that includes breakpoints that adjust the fee rate down-
ward as the size of each Fund increases, thereby allowing shareholders
the potential to participate in economies of scale.
The Board concluded that each Fund’s advisory fee structure was
reasonable and that it would continue to review fees in connection
with future renewals of the Agreements, including whether the implemen-
tation of additional breakpoints would be appropriate in the future due
to an increase in asset size or otherwise. The Board further noted that
BlackRock has agreed to voluntarily cap the total annual operating
expenses of one or more share classes of each of Short-Term Fund
and High Yield Fund, at certain levels. The Board observed that those
expense caps benefited shareholders by keeping total fees down even in
the absence of breakpoints.
D. Economies of Scale: The Board, including the Independent Directors,
considered the extent to which economies of scale might be realized as
the assets of the Fund increase and whether there should be changes
in the advisory fee rate or structure in order to enable the Fund to
participate in these economies of scale. The Board, including the
Independent Directors, considered whether the shareholders would
benefit from economies of scale and whether there was potential for
future realization of economies with respect to the Fund. The Board
considered that the funds in the BlackRock fund complex share common
resources and, as a result, an increase in the overall size of the complex
could permit each fund to incur lower expenses than it would otherwise
as stand-alone entities. The Board also considered the anticipated
efficiencies in the processes of BlackRock’s overall operations as it
continues to add personnel and commit capital to expand the scale
of operations. The Board found, based on its review of comparable
funds, that the Fund’s management fee is appropriate in light of the
scale of the Fund. |
74 BLACKROCK MUNICIPAL BOND FUND, INC.
| Disclosure of Investment Advisory Agreement and Subadvisory Agreement (concluded) |
E. Other Factors: The Board also took into account other ancillary or
“fall-out” benefits that BlackRock may derive from its relationship with
the Fund, both tangible and intangible, such as BlackRock’s ability to
leverage its investment professionals that manage other portfolios, an
increase in BlackRock’s profile in the investment advisory community,
and the engagement of BlackRock’s affiliates as service providers to
the Fund, including for administrative, transfer agency and distribution
services. The Board also noted that BlackRock may use third party
research obtained by soft dollars generated by certain mutual fund
transactions to assist itself in managing all or a number of its other
client accounts.
In connection with its consideration of the Agreements, the Board
also received information regarding BlackRock’s brokerage and trade
execution practices throughout the year.
Conclusion
The Board approved the continuation of the Advisory Agreement between
the Adviser and the Fund for a one-year term ending June 30, 2009 and
the Subadvisory Agreement between the Adviser and the Subadviser for
a one-year term ending June 30, 2009. Based upon their evaluation of
all these factors in their totality, the Board, including the Independent
Directors, was satisfied that the terms of the Agreements were fair and
reasonable and in the best interest of the Fund and the Fund’s share-
holders. In arriving at a decision to approve the Agreements, the Board
did not identify any single factor or group of factors as all-important or
controlling, but considered all factors together. The Independent
Directors were also assisted by the advice of independent legal counsel
in making this determination. The contractual fee arrangements for the
Fund reflect the result of several years of review by the Directors and
predecessor Directors, and discussions between the Directors (and pred-
ecessor Directors) and BlackRock. Certain aspects of the arrangements
may be the subject of more attention in some years than in others, and
the Directors’ conclusions may be based in part on their consideration of
these arrangements in prior years. |
| BLACKROCK MUNICIPAL BOND FUND, INC. |
| Officers and Directors | | | | | | | | |
| |
| | | | | | | | | Number of | | |
| | | | | | | | | BlackRock- | | |
| | | Position(s) | | Length of | | | | Advised Funds | | |
| Name, Address | | Held with | | Time Served | | | | and Portfolios | | Public |
| and Year of Birth | | Fund | | as a Director2 | | Principal Occupation(s) During Past 5 Years | | Overseen | | Directorships |
| |
| |
| |
| |
| |
|
| |
| Non-Interested Directors1 | | | | | | | | |
| |
| |
| |
| |
|
| Robert M. Hernandez | | Chairman of the | | Since | | Formerly Director, Vice Chairman and Chief Financial Officer of USX | | 37 Funds | | ACE Limited |
| 40 East 52nd Street | | Board, Director | | 2007 | | Corporation (energy and steel business) from 1991 to 2001. | | 104 Portfolios | | (insurance company); |
| New York, NY 10022 | | and Member | | | | | | | | Eastman Chemical |
| 1944 | | of the Audit | | | | | | | | Company (chemical); |
| | | Committee | | | | | | | | RTI International |
| | | | | | | | | | | Metals, Inc. (metals); |
| | | | | | | | | | | TYCO Electronics |
| | | | | | | | | | | (electronics) |
| |
| |
| |
| |
| |
|
| |
| Fred G. Weiss | | Vice Chairman | | Since | | Managing Director, FGW Associates (consulting and investment | | 37 Funds | | Watson |
| 40 East 52nd Street | | of the Board, | | 2007 | | company) since 1997; Director, Michael J. Fox Foundation for | | 104 Portfolios | | Pharmaceutical Inc. |
| New York, NY 10022 | | Chairman of the | | | | Parkinson’s Research since 2000; Formerly Director of BTG | | | | |
| 1941 | | Audit Committee | | | | International Plc (a global technology commercialization company) | | | | |
| | | and Director | | | | from 2001 to 2007. | | | | |
| |
| |
| |
| |
| |
|
| |
| James H. Bodurtha | | Director | | Since | | Director, The China Business Group, Inc. (consulting firm) since 1996 | | 37 Funds | | None |
| 40 East 52nd Street | | | | 2007 | | and formerly Executive Vice President thereof from 1996 to 2003; | | 104 Portfolios | | |
| New York, NY 10022 | | | | | | Chairman of the Board, Berkshire Holding Corporation since 1980. | | | | |
| 1944 | | | | | | | | | | |
| |
| |
| |
| |
| |
|
| Bruce R. Bond | | Director | | Since | | Formerly Trustee and Member of the Governance Committee, State | | 37 Funds | | None |
| 40 East 52nd Street | | | | 2007 | | Street Research Mutual Funds from 1997 to 2005; Formerly Board | | 104 Portfolios | | |
| New York, NY 10022 | | | | | | Member of Governance, Audit and Finance Committee, Avaya Inc. | | | | |
| 1946 | | | | | | (computer equipment) from 2003 to 2007. | | | | |
| |
| |
| |
| |
| |
|
| Donald W. Burton | | Director | | Since | | Managing General Partner, The Burton Partnership, LP (an investment | | 37 Funds | | Knology, Inc. (tele- |
| 40 East 52nd Street | | | | 2007 | | partnership) since 1979; Managing General Partner, The South Atlantic | | 104 Portfolios | | communications); |
| New York, NY 10022 | | | | | | Venture Funds since 1983; Member of the Investment Advisory Council | | | | Capital Southwest |
| 1944 | | | | | | of the Florida State Board of Administration from 2001 to 2007. | | | | (financial) |
| |
| |
| |
| |
| |
|
| Honorable | | Director | | Since | | Partner and Head of International Practice, Covington and Burling | | 37 Funds | | UPS Corporation |
| Stuart E. Eizenstat | | | | 2007 | | (law firm) since 2001; International Advisory Board Member, The Coca | | 104 Portfolios | | (delivery service) |
| 40 East 52nd Street | | | | | | Cola Company since 2002; Advisory Board Member BT Americas | | | | |
| New York, NY 10022 | | | | | | (telecommunications) since 2004; Member of the Board of Directors, | | | | |
| 1943 | | | | | | Chicago Climate Exchange (environmental) since 2006; Member of the | | | | |
| | | | | | | International Advisory Board GML (energy) since 2003. | | | | |
| |
| |
| |
| |
| |
|
| |
| Kenneth A. Froot | | Director | | Since | | Professor, Harvard University since 1992. | | 37 Funds | | None |
| 40 East 52nd Street | | | | 2007 | | | | 104 Portfolios | | |
| New York, NY 10022 | | | | | | | | | | |
| 1957 | | | | | | | | | | |
| |
| |
| |
| |
| |
|
| John F. O’Brien | | Director | | Since | | Trustee, Woods Hole Oceanographic Institute since 2003; Formerly | | 37 Funds | | Cabot Corporation |
| 40 East 52nd Street | | | | 2007 | | Director, Allmerica Financial Corporation from 1995 to 2003; Formerly | | 104 Portfolios | | (chemicals); LKQ |
| New York, NY 10022 | | | | | | Director, ABIOMED from 1989 to 2006; Formerly Director, Ameresco, | | | | Corporation (auto |
| 1943 | | | | | | Inc. (energy solutions company) from 2006 to 2007. | | | | parts manufacturing); |
| | | | | | | | | | | TJX Companies, Inc. |
| | | | | | | | | | | (retailer) |
| |
| |
| |
| |
| |
|
| |
| Roberta Cooper Ramo | | Director | | Since | | Shareholder, Modrall, Sperling, Roehl, Harris & Sisk, .A. (law firm) | | 37 Funds | | None |
| 40 East 52nd Street | | | | 2007 | | since 1993; Chairman of the Board, Cooper’s Inc., (retail) since 2000; | | 104 Portfolios | | |
| New York, NY 10022 | | | | | | Director of ECMC Group (service provider to students, schools and | | | | |
| 1942 | | | | | | lenders) since 2001; President Elect, The American Law Institute, | | | | |
| | | | | | | (non-profit), 2007; Formerly President, American Bar Association from | | | | |
| | | | | | | 1995 to 1996. | | | | |
| |
| |
| | | |
| |
|
76 BLACKROCK MUNICIPAL BOND FUND, INC.
| Officers and Directors (continued) | | | | |
| |
| | | | | | | | | Number of | | |
| | | | | | | | | BlackRock- | | |
| | | Position(s) | | Length of | | | | Advised Funds | | |
| Name, Address | | Held with | | Time Served | | | | and Portfolios | | Public |
| and Year of Birth | | Fund | | as a Director2 | | Principal Occupation(s) During Past 5 Years | | Overseen | | Directorships |
| |
| |
| |
| |
| |
|
| |
| Non-Interested Directors1 (concluded) | | | | | | | | |
| |
| |
| |
| |
|
| |
| Jean Margo Reid | | Director | | Since | | Self-employed consultant since 2001; Director and Secretary, SCB, | | 37 Funds | | None |
| 40 East 52nd Street | | | | 2004 | | Inc. (holding company) since 1998; Director and Secretary, SCB | | 104 Portfolios | | |
| New York, NY 10022 | | | | | | Partners, Inc. (holding company) since 2000; Director, Covenant | | | | |
| 1945 | | | | | | House (non-profit) from 2001 to 2004. | | | | |
| |
| |
| |
| |
| |
|
| David H. Walsh | | Director | | Since | | Director, National Museum of Wildlife Art since 2007; Director, | | 37 Funds | | None |
| 40 East 52nd Street | | | | 2007 | | Ruckleshaus Institute and Haub School of Natural Resources at the | | 104 Portfolios | | |
| New York, NY 10022 | | | | | | University of Wyoming since 2006; Director, The American Museum | | | | |
| 1941 | | | | | | of Fly Fishing since 1997; Formerly Consultant with Putnam Investments | | | | |
| | | | | | | from 1993 to 2003; Formerly Director, The National Audubon Society | | | | |
| | | | | | | from 1998 to 2005. | | | | |
| |
| |
| |
| |
| |
|
| |
| Richard R. West | | Director | | Since | | Dean Emeritus, New York University’s Leonard N. Stern School of | | 37 Funds | | Bowne & Co., Inc. |
| 40 East 52nd Street | | and Member | | 1981 | | Business Administration since 1995. | | 104 Portfolios | | (financial printers); |
| New York, NY 10022 | | of the Audit | | | | | | | | Vornado Realty Trust |
| 1938 | | Committee | | | | | | | | (real estate |
| | | | | | | | | | | company); |
| | | | | | | | | | | Alexander’s Inc. |
| | | | | | | | | | | (real estate |
| | | | | | | | | | | company) |
| | |
| |
| |
| |
| | |
1 Directors serve until their resignation, removal or death, or until December 31 of the year in which they turn 72.
2 Following the combination of Merrill Lynch Investment Managers, L. P. (“MLIM”) and BlackRock, Inc. (“BlackRock”) in September 2006, the various legacy MLIM and legacy BlackRock Fund boards were realigned and consolidated into three new Fund boards in 2007. As a result, although the chart shows certain directors as joining the Fund’s board in 2007, each director first became a member of the board of directors of other legacy MLIM or legacy BlackRock Funds as follows: James H. Bodurtha since 1995; Bruce R. Bond since 2005; Donald W. Burton since 2002; Stuart E.
Eizenstat since 2001; Kenneth A. Froot since 2005; Robert M. Hernandez since 1996; John F. O’Brien since 2004; Roberta Cooper Ramo since 2000; Jean Margo Reid since 2004; David H. Walsh since 2003; Fred G. Weiss since 1998; and Richard R. West since 1978.
| BLACKROCK MUNICIPAL BOND FUND, INC. |
| Officers and Directors (continued) | | | | |
| |
| | | | | | | | | Number of | | |
| | | | | | | | | BlackRock- | | |
| | | Position(s) | | Length of | | | | Advised Funds | | |
| Name, Address | | Held with | | Time Served | | | | and Portfolios | | Public |
| and Year of Birth | | Fund | | as a Director2 | | Principal Occupation(s) During Past 5 Years | | Overseen | | Directorships |
| |
| |
| |
| |
| |
|
| |
| Interested Directors1 | | | | | | | | | | |
| |
| |
| |
| |
| |
|
| |
| Richard S. Davis | | Director | | Since | | Managing Director, BlackRock, Inc. since 2005; Formerly Chief | | 185 Funds | | None |
| 40 East 52nd Street | | | | 2007 | | Executive Officer, State Street Research & Management Company | | 295 Portfolios | | |
| New York, NY 10022 | | | | | | from 2000 to 2005; Formerly Chairman of the Board of Trustees, | | | | |
| 1945 | | | | | | State Street Research Mutual Funds from 2000 to 2005; Formerly | | | | |
| Chairman, SSR Realty from 2000 to 2004. |
|
| |
| Laurence D. Fink | | Director | | Since | | Chairman and Chief Executive Officer of BlackRock, Inc. since its | | 37 Funds | | None |
| 40 East 52nd Street | | | | 2007 | | formation in 1998 and of BlackRock, Inc.’s predecessor entities since | | 104 Portfolios | | |
| New York, NY 10022 | | | | | | 1988 and Chairman of the Executive and Management Committees; | | | | |
| 1952 | | | | | | Formerly Managing Director, The First Boston Corporation, Member of | | | | |
| | | | | | | its Management Committee, Co-head of its Taxable Fixed Income | | | | |
| | | | | | | Division and Head of its Mortgage and Real Estate Products Group; | | | | |
| | | | | | | Chairman of the Board of several of BlackRock’s alternative investment | | | | |
| | | | | | | vehicles; Director of several of BlackRock’s offshore funds; Member of | | | | |
| | | | | | | the Board of Trustees of New York University, Chair of the Financial Affairs | | | | |
| | | | | | | Committee and a member of the Executive Committee, the Ad Hoc | | | | |
| | | | | | | Committee on Board Governance, and the Committee on Trustees; Co- | | | | |
| | | | | | | Chairman of the NYU Hospitals Center Board of Trustees, Chairman of | | | | |
| | | | | | | the Development/Trustee Stewardship Committee and Chairman of the | | | | |
| | | | | | | Finance Committee; Trustee, The Boys’ Club of New York. | | | | |
| |
| |
| |
| |
| |
|
| |
| Henry Gabbay | | Director | | Since | | Consultant, BlackRock, Inc. since 2007; Formerly Managing Director, | | 184 Funds | | None |
| 40 East 52nd Street | | | | 2007 | | BlackRock, Inc. from 1989 to 2007; Formerly Chief Administrative | | 294 Portfolios | | |
| New York, NY 10022 | | | | | | Officer, BlackRock Advisors, LLC from 1998 to 2007; Formerly President | | | | |
| 1947 | | | | | | of BlackRock Funds and BlackRock Bond Allocation Target Shares from | | | | |
| | | | | | | 2005 to 2007 and Treasurer of certain closed-end funds in the | | | | |
| BlackRock fund complex from 1989 to 2006. |
1 Messrs. Davis, Fink and Gabbay are all “interested persons,” as defined in the Investment Company Act of 1940, of the Fund based on their positions with BlackRock, Inc. and its affiliates. Directors serve until their resignation, removal or death, or until December 31 of the year in which they turn 72.
78 BLACKROCK MUNICIPAL BOND FUND, INC.
| Officers and Directors (concluded) | | | | | | |
| |
| |
| | | Position(s) | | | | | | | | | | | | |
| Name, Address | | Held with | | | | Length of | | | | | | | | |
| and Year of Birth | | Fund | | | | Time Served | | Principal Occupation(s) During Past 5 Years | | | | |
| |
| |
| |
| |
| |
| |
|
| Fund Officers1 | | | | | | | | | | | | | | |
| |
| |
| |
| |
| |
| |
| |
|
| Donald C. Burke | | Fund | | | | Since | | Managing Director of BlackRock, Inc. since 2006; Formerly Managing Director of Merrill Lynch Investment |
| 40 East 52nd Street | | President | | | | 2007 | | Managers, L.P. (“MLIM”) and Fund Asset Management, L .P.(“FAM”) in 2006; First Vice President thereof from |
| New York, NY 10022 | | and Chief | | | | | | 1997 to 2005; Treasurer thereof from 1999 to 2006 and Vice President thereof from 1990 to 1997. |
| 1960 | | Executive | | | | | | | | | | | | |
| | | Officer | | | | | | | | | | | | |
| |
| |
| |
| |
| |
| |
| |
|
| Anne F. Ackerley | | Vice | | | | Since | | Managing Director of BlackRock, Inc. since 2000; Chief Operating Officer of BlackRock’s U.S. Retail Group since |
| 40 East 52nd Street | | President | | | | 2007 | | 2006; Head of BlackRock’s Mutual Fund Group from 2000 to 2006; Merrill Lynch & Co., Inc. from 1984 to 1986 |
| New York, NY 10022 | | | | | | | | and from 1988 to 2000, most recently as First Vice President and Operating Officer of the Mergers and |
| 1962 | | | | | | | | Acquisitions Group. | | | | |
| |
| |
| |
| |
| |
| |
|
| Neal J. Andrews | | Chief | | | | Since | | Managing Director of BlackRock, Inc. since 2006; Formerly Senior Vice President and Line of Business Head of |
| 40 East 52nd Street | | Financial | | | | 2007 | | Fund Accounting and Administration at PFPC Inc. from 1992 to 2006. | | |
| New York, NY 10022 | | Officer | | | | | | | | | | | | |
| 1966 | | | | | | | | | | | | | | |
| |
| |
| |
| |
| |
| |
| |
|
| Jay M. Fife | | Treasurer | | | | Since | | Managing Director of BlackRock, Inc. since 2007 and Director in 2006; Formerly Assistant Treasurer of the |
| 40 East 52nd Street | | | | | | 2007 | | MLIM/FAM advised funds from 2005 to 2006; Director of MLIM Fund Services Group from 2001 to 2006. |
| New York, NY 10022 | | | | | | | | | | | | | | |
| 1970 | | | | | | | | | | | | | | |
| |
| |
| |
| |
| |
| |
| |
|
| Brian . Kindelan | | Chief | | | | Since | | Chief Compliance Officer of the BlackRock-advised Funds since 2007; Anti-Money Laundering Officer of the |
| 40 East 52nd Street | | Compliance | | 2007 | | BlackRock-advised Funds since 2007; Managing Director and Senior Counsel of BlackRock, Inc. since 2005; |
| New York, NY 10022 | | Officer | | | | | | Director and Senior Counsel of BlackRock Advisors, Inc. from 2001 to 2004 and Vice President and Senior |
| 1959 | | | | | | | | Counsel thereof from 1998 to 2000; Formerly Senior Counsel of The PNC Bank Corp. from 1995 to 1998. |
| |
| |
| |
| |
|
| Howard Surloff | | Secretary | | | | Since | | Managing Director of BlackRock, Inc. and General Counsel of U.S. Funds at BlackRock, Inc. since 2006; Formerly |
| 40 East 52nd Street | | | | | | 2007 | | General Counsel (U.S.) of Goldman Sachs Asset Management, LP from 1993 to 2006. | | |
| New York, NY 10022 | | | | | | | | | | | | | | |
| 1965 | | | | | | | | | | | | | | |
| | |
| |
| |
| |
| |
| |
| |
|
| | | 1 Officers of the Fund serve at the pleasure of the Board of Directors. | | | | |
| |
| |
| |
|
| | | Further information about the Fund’s Officers and Directors is available in the Fund’s Statement of Additional Information, which can be obtained |
| | | without charge by calling (800) 441-7762. | | | | | | |
| |
| |
| |
| |
|
| |
| Custodian | | | | Transfer Agent | | | | Accounting Agent | | Independent Registered Public | | Legal Counsel |
| The Bank of New York Mellon | | PNC Global Investment | | State Street Bank and | | Accounting Firm | | Willkie Farr & |
| New York, NY 10286 | | | | Servicing (U.S.) Inc. | | | | Trust Company | | Deloitte & Touche LLP | | Gallagher LLP |
| | | | | Wilmington, DE 19809 | | Princeton, NJ 08540 | | Princeton, NJ 08540 | | New York, NY 10019 |

| BLACKROCK MUNICIPAL BOND FUND, INC. |
Additional Information
Swap Agreements
BlackRock Municipal Insured Fund, BlackRock National Municipal Fund
and BlackRock High Yield Municipal Fund of BlackRock Municipal Bond
Fund, Inc. may invest in swap agreements, which are over-the-counter
contracts in which one party agrees to make periodic payments based
on the change in market value of a specified bond, basket of bonds or
index in return for periodic payments based on a fixed or variable inter-
est rate or the change in market value of a different bond, basket of |
bonds or index. Swap agreements may be used to obtain exposure to a
bond or market without owning or taking physical custody of securities.
Swap agreements involve the risk that the party with whom each Fund
has entered into a swap will default on its obligation to pay the Fund
and the risk that the Fund will not be able to meet its obligations to pay
the other party to the agreement. The Swap agreements in which the
Funds may invest includes credit default swap agreements. |
| | BlackRock Privacy Principles |
BlackRock is committed to maintaining the privacy of its current and
former fund investors and individual clients (collectively, “Clients”) and
to safeguarding their non-public personal information. The following infor-
mation is provided to help you understand what personal information
BlackRock collects, how we protect that information and why in certain
cases we share such information with select parties.
If you are located in a jurisdiction where specific laws, rules or regulations
require BlackRock to provide you with additional or different privacy-related
rights beyond what is set forth below, then BlackRock will comply with
those specific laws, rules or regulations.
BlackRock obtains or verifies personal non-public information from and
about you from different sources, including the following: (i) information
we receive from you or, if applicable, your financial intermediary, on appli-
cations, forms or other documents; (ii) information about your trans-
actions with us, our affiliates, or others; (iii) information we receive from
a consumer reporting agency; and (iv) from visits to our websites. |
BlackRock does not sell or disclose to non-affiliated third parties any non-
public personal information about its Clients, except as permitted by law
or as is necessary to respond to regulatory requests or to service Client
accounts. These non-affiliated third parties are required to protect the
confidentiality and security of this information and to use it only for its
intended purpose.
We may share information with our affiliates to service your account or to
provide you with information about other BlackRock products or services
that may be of interest to you. In addition, BlackRock restricts access
to non-public personal information about its Clients to those BlackRock
employees with a legitimate business need for the information. BlackRock
maintains physical, electronic and procedural safeguards that are designed
to protect the non-public personal information of its Clients, including proce-
dures relating to the proper storage and disposal of such information. |
80 BLACKROCK MUNICIPAL BOND FUND, INC.
Additional Information (concluded)
Availability of Additional Information
Electronic copies of most financial reports and prospectuses are available
on the Funds’ website or shareholders can sign up for e-mail notifications
of quarterly statements, annual and semi-annual reports and prospectuses
by enrolling in the Funds’ electronic delivery program.
To enroll:
Shareholders Who Hold Accounts with Investment Advisors, Banks or
Brokerages:
Please contact your financial advisor. Please note that not all investment
advisors, banks or brokerages may offer this service.
Shareholders Who Hold Accounts Directly with BlackRock:
1) Access the BlackRock website at
http://www.blackrock.com/edelivery
2) Click on the applicable link and follow the steps to sign up
3) Log into your account
The Funds will mail only one copy of shareholder documents, including
prospectuses, annual and semi-annual reports and proxy statements, to
shareholders with multiple accounts at the same address. This practice is
commonly called “householding” and it is intended to reduce expenses
and eliminate duplicate mailings of shareholder documents. Mailings of
your shareholder documents may be householded indefinitely unless you
instruct us otherwise. If you do not want the mailing of these documents
to be combined with those for other members of your household, please
contact the Fund at (800) 441-7762. |
Availability of Proxy Voting Policies and Procedures
A description of the policies and procedures that the Funds use to
determine how to vote proxies relating to portfolio securities is available
(1) without charge, upon request, by calling toll-free (800) 441-7762;
(2) at www.blackrock.com; and (3) on the SEC website at
http://www.sec.gov.
Availability of Proxy Voting Record
Information about how the Funds vote proxies relating to securities
held in the Funds’ portfolios during the most recent 12-month period
ended June 30 is available upon request and without charge (1) at
www.blackrock.com or by calling (800) 441-7762 and (2) on the SEC’s
website at http://www.sec.gov.
Availability of Quarterly Portfolio Schedule
The Funds file complete schedules of portfolio holdings with the SEC for
the first and third quarters of each fiscal year on Form N-Q. The Fund’s
Forms N-Q are available on the SEC’s website at http://www.sec.gov and
may also be reviewed and copied at the SEC’s Public Reference Room
in Washington, D.C. Information on the operation of the Public Reference
Room may be obtained by calling (800) SEC-0330. The Fund’s Forms
N-Q may also be obtained upon request and without charge by calling
(800) 441-7762. |
| | Shareholder Privileges
Account Information
Call us at (800) 441-7762 from 8:00 AM to 6:00 PM EST to get infor-
mation about your account balances, recent transactions and share
prices. You can also reach us on the Web at www.blackrock.com/funds.
Automatic Investment Plans
Investor Class shareholders who want to invest regularly can arrange to
have $50 or more automatically deducted from their checking or savings
account and invested in any of the BlackRock funds. |
Systematic Withdrawal Plans
Investor Class shareholders can establish a systematic withdrawal plan
and receive periodic payments of $50 or more from their BlackRock
funds, as long as their account is at least $10,000.
Retirement Plans
Shareholders may make investments in conjunction with Traditional,
Rollover, Roth, Coverdell, Simple IRAs, SEP IRAs and 403(b) Plans. |
BLACKROCK MUNICIPAL BOND FUND, INC. JUNE 30, 2008 81
A World-Class Mutual Fund Family
BlackRock offers a diverse lineup of open-end mutual funds crossing all investment styles and managed by experts in equity, fixed income and tax-exempt investing.
| Equity Funds | | | | |
| |
| |
|
| |
| BlackRock All-Cap Global Resources Portfolio | | BlackRock Global Opportunities Portfolio | | BlackRock Mid-Cap Growth Equity Portfolio |
| BlackRock Asset Allocation Portfolio† | | BlackRock Global Resources Portfolio | | BlackRock Mid-Cap Value Equity Portfolio |
| BlackRock Aurora Portfolio | | BlackRock Global Science & Technology | | BlackRock Mid Cap Value Opportunities Fund |
| BlackRock Balanced Capital Fund† | | Opportunities Portfolio | | BlackRock Natural Resources Trust |
| BlackRock Basic Value Fund | | BlackRock Global SmallCap Fund | | BlackRock Pacific Fund |
| BlackRock Capital Appreciation Portfolio | | BlackRock Health Sciences Opportunities Portfolio* | | BlackRock Small Cap Core Equity Portfolio |
| BlackRock Equity Dividend Fund | | BlackRock Healthcare Fund | | BlackRock Small Cap Growth Equity Portfolio |
| BlackRock EuroFund | | BlackRock Index Equity Portfolio* | | BlackRock Small Cap Growth Fund II |
| BlackRock Focus Growth Fund | | BlackRock International Fund | | BlackRock Small Cap Index Fund |
| BlackRock Focus Value Fund | | BlackRock International Index Fund | | BlackRock Small Cap Value Equity Portfolio* |
| BlackRock Fundamental Growth Fund | | BlackRock International Opportunities Portfolio | | BlackRock Small/Mid-Cap Growth Portfolio |
| BlackRock Global Allocation Fund† | | BlackRock International Value Fund | | BlackRock S&P 500 Index Fund |
| BlackRock Global Dynamic Equity Fund | | BlackRock Large Cap Core Fund | | BlackRock Technology Fund |
| BlackRock Global Emerging Markets Fund | | BlackRock Large Cap Growth Fund | | BlackRock U.S. Opportunities Portfolio |
| BlackRock Global Financial Services Fund | | BlackRock Large Cap Value Fund | | BlackRock Utilities and Telecommunications Fund |
| BlackRock Global Growth Fund | | BlackRock Latin America Fund | | BlackRock Value Opportunities Fund |
| |
| |
|
| |
| Fixed Income Funds | | | | |
| |
| |
|
| |
| BlackRock Commodity Strategies Fund | | BlackRock Income Builder Portfolio | | BlackRock Managed Income Portfolio |
| BlackRock Emerging Market Debt Portfolio | | BlackRock Inflation Protected Bond Portfolio | | BlackRock Short-Term Bond Fund |
| BlackRock Enhanced Income Portfolio | | BlackRock Intermediate Bond Portfolio II | | BlackRock Strategic Income Portfolio |
| BlackRock GNMA Portfolio | | BlackRock Intermediate Government | | BlackRock Total Return Fund |
| BlackRock Government Income Portfolio | | Bond Portfolio | | BlackRock Total Return Portfolio II |
| BlackRock High Income Fund | | BlackRock International Bond Portfolio | | BlackRock World Income Fund |
| BlackRock High Yield Bond Portfolio | | BlackRock Long Duration Bond Portfolio | | |
| BlackRock Income Portfolio | | BlackRock Low Duration Bond Portfolio | | |
| |
| |
|
| |
| Municipal Bond Funds | | | | |
| |
| |
|
| BlackRock AMT-Free Municipal Bond Portfolio | | BlackRock Intermediate Municipal Fund | | BlackRock New York Municipal Bond Fund |
| BlackRock California Insured Municipal Bond Fund | | BlackRock Kentucky Municipal Bond Portfolio | | BlackRock Ohio Municipal Bond Portfolio |
| BlackRock Delaware Municipal Bond Portfolio | | BlackRock Municipal Insured Fund | | BlackRock Pennsylvania Municipal Bond Fund |
| BlackRock Florida Municipal Bond Fund | | BlackRock National Municipal Fund | | BlackRock Short-Term Municipal Fund |
| BlackRock High Yield Municipal Fund | | BlackRock New Jersey Municipal Bond Fund | | |
| |
| |
|
| |
| Target Risk & Target Date Funds | | | | |
| |
| |
|
| |
| BlackRock Prepared Portfolios | | BlackRock Lifecycle Prepared Portfolios | | |
| Conservative Prepared Portfolio | | Prepared Portfolio 2010 | | Prepared Portfolio 2030 |
| Moderate Prepared Portfolio | | Prepared Portfolio 2015 | | Prepared Portfolio 2035 |
| Growth Prepared Portfolio | | Prepared Portfolio 2020 | | Prepared Portfolio 2040 |
| Aggressive Growth Prepared Portfolio | | Prepared Portfolio 2025 | | Prepared Portfolio 2045 |
| | | | | Prepared Portfolio 2050 |
| * See the prospectus for information on specific limitations on investments in the fund. | | |
| † Mixed asset fund. | | | | |
BlackRock mutual funds are distributed by BlackRock Distributors, Inc. and certain funds are also distributed by FAM Distributors, Inc. You should consider the investment objectives, risks, charges and expenses of the funds under consideration carefully before investing. Each fund’s prospectus contains this and other information and is available at www.blackrock.com or by calling (800) 882-0052 or from your financial advisor. The prospectus should be read carefully before investing.
82 BLACKROCK MUNICIPAL BOND FUND, INC.
This report is not authorized for use as an offer of sale or a solicitation of an offer to buy shares of the Funds unless accompanied or
preceded by the Fund’s current prospectus. Past performance results shown in this report should not be considered a representation of
future performance. Investment return and principal value of shares will fluctuate so that shares, when redeemed, may be worth more
or less than their original cost. Statements and other information herein are as dated and are subject to change. |

Item 2 – Code of Ethics – The registrant (or the “Fund”) has adopted a code of ethics, as of the end
of the period covered by this report, applicable to the registrant's principal executive officer,
principal financial officer and principal accounting officer, or persons performing similar
functions. During the period covered by this report, there have been no amendments to or
waivers granted under the code of ethics. A copy of the code of ethics is available without
charge at www.blackrock.com.
Item 3 – Audit Committee Financial Expert – The registrant's board of directors or trustees, as
applicable (the “board of directors”) has determined that (i) the registrant has the following
audit committee financial experts serving on its audit committee and (ii) each audit
committee financial expert is independent:
Ronald W. Forbes (term ended, effective November 1, 2007)
Robert M. Hernandez (term began, effective November 1, 2007)
Fred G. Weiss (term began, effective November 1, 2007)
Richard R. West
Under applicable securities laws, a person determined to be an audit committee financial
expert will not be deemed an “expert” for any purpose, including without limitation for the
purposes of Section 11 of the Securities Act of 1933, as a result of being designated or
identified as an audit committee financial expert. The designation or identification as an
audit committee financial expert does not impose on such person any duties, obligations, or
liabilities greater than the duties, obligations, and liabilities imposed on such person as a
member of the audit committee and board of directors in the absence of such designation or
identification.
Item 4 – Principal Accountant Fees and Services |
| | | (a) Audit Fees | | (b) Audit-Related Fees1 | | (c) Tax Fees2 | | (d) All Other Fees3 |
| |
| |
| |
| |
|
| | | Current | | Previous | | Current | | Previous | | Current | | Previous | | Current | | Previous |
| | | Fiscal Year | | Fiscal Year | | Fiscal Year | | Fiscal Year | | Fiscal Year | | Fiscal Year | | Fiscal Year | | Fiscal Year |
| Entity Name | | End | | End | | End | | End | | End | | End | | End | | End |
| |
| |
| |
| |
| |
| |
| |
| |
|
| |
| BlackRock High | | | | | | | | | | | | | | | | |
| Yield Municipal | | $31,200 | | $37,600 | | $0 | | $0 | | $6,100 | | $6,100 | | $1,049 | | $1,042 |
| Fund | | | | | | | | | | | | | | | | |
| |
| |
| |
| |
| |
| |
| |
| |
|
| BlackRock | | | | | | | | | | | | | | | | |
| Municipal Insured | | $33,400 | | $56,450 | | $0 | | $0 | | $6,100 | | $6,100 | | $1,049 | | $1,042 |
| Fund | | | | | | | | | | | | | | | | |
| |
| |
| |
| |
| |
| |
| |
| |
|
| BlackRock National | | | | | | | | | | | | | | | | |
| Municipal Fund | | $33,400 | | $56,450 | | $0 | | $0 | | $6,100 | | $6,100 | | $1,049 | | $1,042 |
| |
| |
| |
| |
| |
| |
| |
| |
|
| BlackRock Short- | | | | | | | | | | | | | | | | |
| Term Municipal | | $27,000 | | $27,500 | | $0 | | $0 | | $6,100 | | $6,100 | | $1,049 | | $1,042 |
| Fund | | | | | | | | | | | | | | | | |
| |
| |
| |
| |
| |
| |
| |
| |
|
1 The nature of the services include assurance and related services reasonably related to the performance of the audit of
financial statements not included in Audit Fees.
2 The nature of the services include tax compliance, tax advice and tax planning.
3 The nature of the services include a review of compliance procedures and attestation thereto.
(e)(1) Audit Committee Pre-Approval Policies and Procedures:
The registrant’s audit committee (the “Committee”) has adopted policies and
procedures with regard to the pre-approval of services. Audit, audit-related and tax
compliance services provided to the registrant on an annual basis require specific pre-
approval by the Committee. The Committee also must approve other non-audit services
provided to the registrant and those non-audit services provided to the registrant’s affiliated
service providers that relate directly to the operations and the financial reporting of the |
registrant. Certain of these non-audit services that the Committee believes are a) consistent
with the SEC’s auditor independence rules and b) routine and recurring services that will
not impair the independence of the independent accountants may be approved by the
Committee without consideration on a specific case-by-case basis (“general pre-approval”).
The term of any general pre-approval is 12 months from the date of the pre-approval, unless
the Committee provides for a different period. Tax or other non-audit services provided to
the registrant which have a direct impact on the operation or financial reporting of the
registrant will only be deemed pre-approved provided that any individual project does not
exceed $10,000 attributable to the registrant or $50,000 for all of the registrants the
Committee oversees. For this purpose, multiple projects will be aggregated to determine if
they exceed the previously mentioned cost levels.
Any proposed services exceeding the pre-approved cost levels will require specific
pre-approval by the Committee, as will any other services not subject to general pre-
approval (e.g., unanticipated but permissible services). The Committee is informed of each
service approved subject to general pre-approval at the next regularly scheduled in-person
board meeting. At this meeting, an analysis of such services is presented to the Committee
for ratification. The Committee may delegate to one or more of its members the authority to
approve the provision of and fees for any specific engagement of permitted non-audit
services, including services exceeding pre-approved cost levels.
(e)(2) None of the services described in each of Items 4(b) through (d) were approved by
the audit committee pursuant to paragraph (c)(7)(i)(C) of Rule 2-01 of Regulation S-X.
(f) Not Applicable
(g) Affiliates’ Aggregate Non-Audit Fees:
| | | Current Fiscal Year | | Previous Fiscal Year |
| Entity Name | | End | | End |
| |
| |
|
| |
| BlackRock High Yield | | | | |
| Municipal Fund | | $294,649 | | $2,968,042 |
| |
| |
|
| |
| BlackRock Municipal Insured | | $294,649 | | $2,967,000 |
| Fund | | | | |
| |
| |
|
| BlackRock National Municipal | | | | |
| Fund | | $294,649 | | $2,967,000 |
| |
| |
|
| |
| BlackRock Short-Term | | $294,649 | | $2,983,442 |
| Municipal Fund | | | | |
| |
| |
|
(h) The registrant’s audit committee has considered and determined that the provision of
non-audit services that were rendered to the registrant’s investment adviser (not including
any non-affiliated sub-adviser whose role is primarily portfolio management and is
subcontracted with or overseen by the registrant’s investment adviser), and any entity
controlling, controlled by, or under common control with the investment adviser that
provides ongoing services to the registrant that were not pre-approved pursuant to paragraph
(c)(7)(ii) of Rule 2-01 of Regulation S-X is compatible with maintaining the principal
accountant’s independence.
Regulation S-X Rule 2-01(c)(7)(ii) – $287,500, 0%
Item 5 – Audit Committee of Listed Registrants – Not Applicable
Item 6 – Investments
(a) The registrant’s Schedule of Investments is included as part of the Report to |
Stockholders filed under Item 1 of this form.
(b) Not Applicable due to no such divestments during the semi-annual period covered since
the previous Form N-CSR filing.
Item 7 – Disclosure of Proxy Voting Policies and Procedures for Closed-End Management
Investment Companies – Not Applicable
Item 8 – Portfolio Managers of Closed-End Management Investment Companies – Not Applicable
Item 9 – Purchases of Equity Securities by Closed-End Management Investment Company and
Affiliated Purchasers – Not Applicable
Item 10 – Submission of Matters to a Vote of Security Holders – The registrant’s Nominating and
Governance Committee will consider nominees to the board of directors recommended by
shareholders when a vacancy becomes available. Shareholders who wish to recommend a
nominee should send nominations that include biographical information and set forth the
qualifications of the proposed nominee to the registrant’s Secretary. There have been no
material changes to these procedures.
Item 11 – Controls and Procedures
11(a) – The registrant’s principal executive and principal financial officers or persons performing
similar functions have concluded that the registrant’s disclosure controls and procedures (as
defined in Rule 30a-3(c) under the Investment Company Act of 1940, as amended (the
“1940 Act”)) are effective as of a date within 90 days of the filing of this report based on the
evaluation of these controls and procedures required by Rule 30a-3(b) under the 1940 Act
and Rule 15d-15(b) under the Securities Exchange Act of 1934, as amended.
11(b) – There were no changes in the registrant’s internal control over financial reporting (as
defined in Rule 30a-3(d) under the 1940 Act) that occurred during the second fiscal quarter
of the period covered by this report that have materially affected, or are reasonably likely to
materially affect, the registrant’s internal control over financial reporting.
Item 12 – Exhibits attached hereto
12(a)(1) – Code of Ethics – See Item 2
12(a)(2) – Certifications – Attached hereto
12(a)(3) – Not Applicable
12(b) – Certifications – Attached hereto |
Pursuant to the requirements of the Securities Exchange Act of 1934 and the Investment
Company Act of 1940, the registrant has duly caused this report to be signed on its behalf by
the undersigned, thereunto duly authorized.
BlackRock Municipal Bond Fund, Inc.
By: /s/ Donald C. Burke
Donald C. Burke
Chief Executive Officer of
BlackRock Municipal Bond Fund, Inc.
Date: August 22, 2008
Pursuant to the requirements of the Securities Exchange Act of 1934 and the Investment
Company Act of 1940, this report has been signed below by the following persons on behalf
of the registrant and in the capacities and on the dates indicated.
By: /s/ Donald C. Burke
Donald C. Burke
Chief Executive Officer (principal executive officer) of
BlackRock Municipal Bond Fund, Inc.
Date: August 22, 2008
By: /s/ Neal J. Andrews
Neal J. Andrews
Chief Financial Officer (principal financial officer) of
BlackRock Municipal Bond Fund, Inc.
Date: August 22, 2008 |