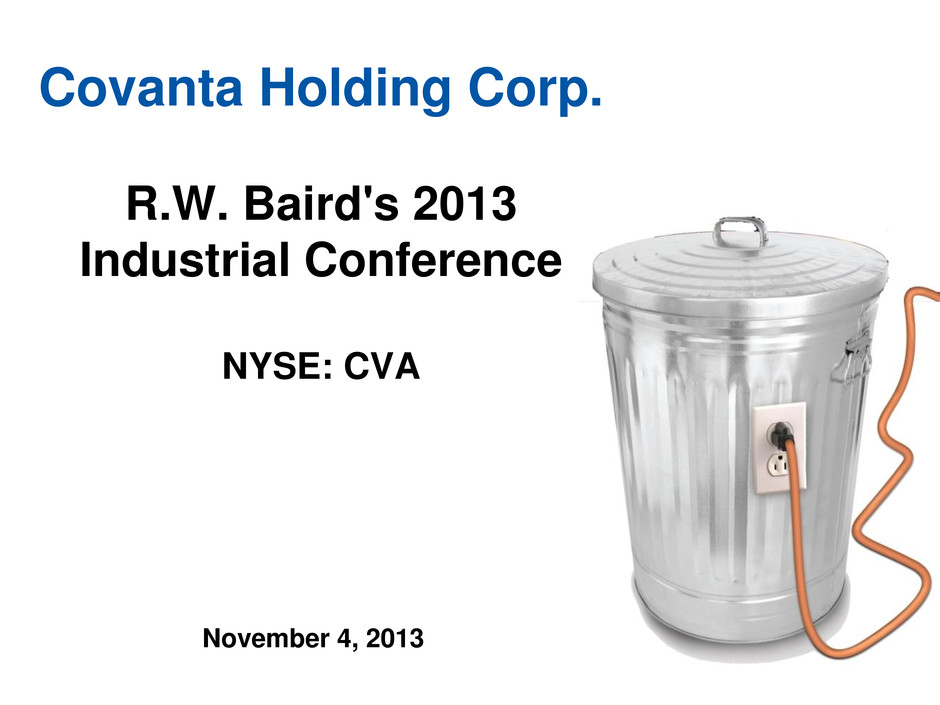
November 4, 2013 Covanta Holding Corp. R.W. Baird's 2013 Industrial Conference NYSE: CVA
Cautionary & Non-GAAP Statements 2 All information included in this earnings presentation is based on continuing operations. Forward-Looking Statements Certain statements in this presentation may constitute "forward-looking" statements as defined in Section 27A of the Securities Act of 1933 (the "Securities Act"), Section 21E of the Securities Exchange Act of 1934 (the "Exchange Act"), the Private Securities Litigation Reform Act of 1995 (the "PSLRA") or in releases made by the Securities and Exchange Commission (“SEC”), all as may be amended from time to time. Such forward- looking statements involve known and unknown risks, uncertainties and other important factors that could cause the actual results, performance or achievements of Covanta and its subsidiaries, or general industry or broader economic performance in global markets in which Covanta operates or competes, to differ materially from any future results, performance or achievements expressed or implied by such forward-looking statements. Statements that are not historical fact are forward-looking statements. Forward-looking statements can be identified by, among other things, the use of forward-looking language, such as the words "plan," "believe," "expect," "anticipate," "intend," "estimate," "project," "may," "will," "would," "could," "should," "seeks," or "scheduled to," or other similar words, or the negative of these terms or other variations of these terms or comparable language, or by discussion of strategy or intentions. These cautionary statements are being made pursuant to the Securities Act, the Exchange Act and the PSLRA with the intention of obtaining the benefits of the "safe harbor" provisions of such laws. Covanta cautions investors that any forward-looking statements made by Covanta are not guarantees or indicative of future performance. Important assumptions and other important factors that could cause actual results to differ materially from those forward-looking statements with respect to Covanta, include, but are not limited to, the risk that Covanta may not successfully grow its business as expected or close its announced or planned acquisitions or projects in development, and those factors, risks and uncertainties that are described in periodic securities filings by Covanta with the SEC. Although Covanta believes that its plans, intentions and expectations reflected in or suggested by such forward-looking statements are reasonable, actual results could differ materially from a projection or assumption in any forward-looking statements. Covanta's future financial condition and results of operations, as well as any forward-looking statements, are subject to change and to inherent risks and uncertainties. The forward-looking statements contained in this press release are made only as of the date hereof and Covanta does not have or undertake any obligation to update or revise any forward- looking statements whether as a result of new information, subsequent events or otherwise, unless otherwise required by law. Non-GAAP Financial Measures We use a number of different financial measures, both United States generally accepted accounting principles (“GAAP”) and non-GAAP, in assessing the overall performance of our business. The non-GAAP financial measures of Adjusted EBITDA, Free Cash Flow and Adjusted EPS, as described and used in this earnings presentation, are not intended as a substitute or as an alternative to net income, cash flow provided by operating activities or diluted earnings per share as indicators of our performance or liquidity or any other measures of performance or liquidity derived in accordance with GAAP. In addition, our non-GAAP financial measures may be different from non-GAAP measures used by other companies, limiting their usefulness for comparison purposes. The presentations of Adjusted EBITDA, Free Cash Flow and Adjusted EPS are intended to enhance the usefulness of our financial information by providing measures which management internally use to assess and evaluate the overall performance of its business and those of possible acquisition candidates, and highlight trends in the overall business. In each case, a reconciliation to the nearest GAAP measure is provided. For definitions of each of those non-GAAP financial measures as well as reconciliations to the most relevant GAAP financial measure, please see the October 23, 2013 Q3 Earnings Conference Call Webdeck presentation, which can be found in the Investor Information – Events section of our website at www.covantaenergy.com
Key Investment Highlights • Strong industry fundamentals – critical infrastructure – Essential service to host communities – Located in attractive markets in Northeast U.S. – close to waste generation and electricity load demand • World leader in EfW – 45 EfW facilities with ~20 million tons disposal capacity – largest operator in the world Dispose of ~5% of U.S. waste and produce ~7% of non-hydro renewable power – Strong track record of operating performance – consistently achieve boiler availability in excess of 90% – Experienced team, operating all commercially viable EfW technologies • Highly contracted revenues with credit-worthy counterparties – Customers are primarily municipalities and utilities – ~75% of revenue contracted or hedged • Substantial and consistent cash flow generation and strong balance sheet – Attractive base economics – high margins and low maintenance capex requirements – Cash flow generation supports ongoing deleveraging, as well as growth and capital return activities • Commitment to allocate capital to maximize shareholder value 3

Covanta Business Model Covanta primarily generates revenue from 3 sources – Paid every step of the way: – Paid for our fuel: Fees charged for waste disposal or operating projects – Paid for the energy: Sale of electricity or steam – Paid for recycled metals 1. Waste Disposal (62% of revenue in 2012): – We process ~20 million tons of municipal solid waste (MSW) annually – Mostly mass-burn facilities that combust the MSW as received (no pre-processing) – Either paid a per-ton tip fee for processing the waste or a fixed service fee for operating the facility 2. Energy (24% of revenue in 2012): – We produce ~10 million MWhs of base load electricity annually • Covanta’s share is ~6 million MWhs and the remainder goes to the client – Covanta share increasing over time – Energy sold to utilities at contracted rates or at prevailing market rates in regional markets • 2012 energy revenue: ~85% of contracted or hedged; ~15% exposed • Primarily PJM, NEPOOL and NYISO (Northeastern U.S.) 3. Metals (4% of revenue in 2012): – Remove/recycle metals from the waste (primarily extracted from ash post-combustion) • In 2012, we recovered ~415,000 gross tons of ferrous metal and ~17,000 gross tons of non-ferrous metal – We sell recovered metal to multiple metal processors & consolidators 4
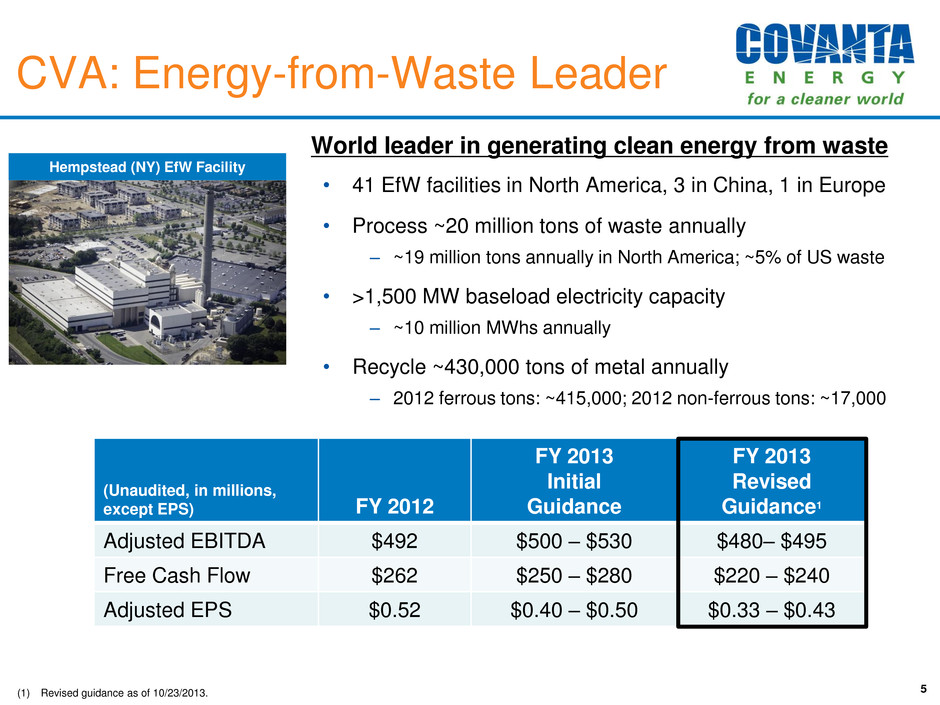
(Unaudited, in millions, except EPS) FY 2012 FY 2013 Initial Guidance FY 2013 Revised Guidance1 Adjusted EBITDA $492 $500 – $530 $480– $495 Free Cash Flow $262 $250 – $280 $220 – $240 Adjusted EPS $0.52 $0.40 – $0.50 $0.33 – $0.43 5 CVA: Energy-from-Waste Leader (1) Revised guidance as of 10/23/2013. World leader in generating clean energy from waste • 41 EfW facilities in North America, 3 in China, 1 in Europe • Process ~20 million tons of waste annually – ~19 million tons annually in North America; ~5% of US waste • >1,500 MW baseload electricity capacity – ~10 million MWhs annually • Recycle ~430,000 tons of metal annually – 2012 ferrous tons: ~415,000; 2012 non-ferrous tons: ~17,000 Hempstead (NY) EfW Facility
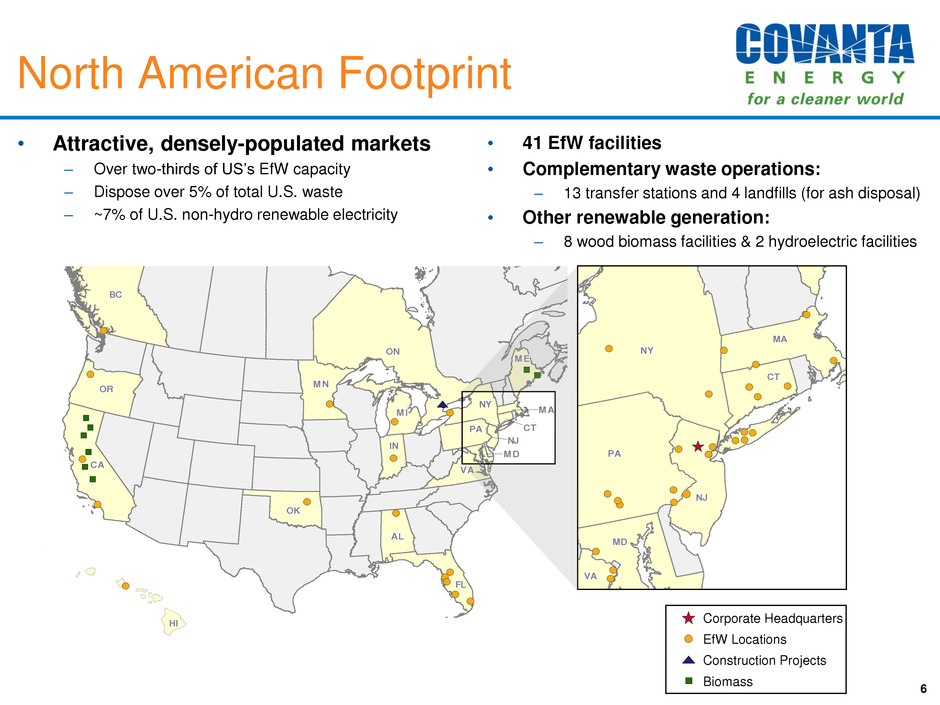
North American Footprint • Attractive, densely-populated markets – Over two-thirds of US’s EfW capacity – Dispose over 5% of total U.S. waste – ~7% of U.S. non-hydro renewable electricity • 41 EfW facilities • Complementary waste operations: – 13 transfer stations and 4 landfills (for ash disposal) • Other renewable generation: – 8 wood biomass facilities & 2 hydroelectric facilities 6 Corporate Headquarters EfW Locations HI I I I NY006V4Q_1.wor.006 4 1. or. r.. r VAV MD NYY CTT MA NJJJJ PAP MEE ON Construction Projects NY006JIW_1.wor PA MD NJJ VA NY CT MA ME MN INIIIII BC OK FL AL CA MIIIIII OR ON Biomass
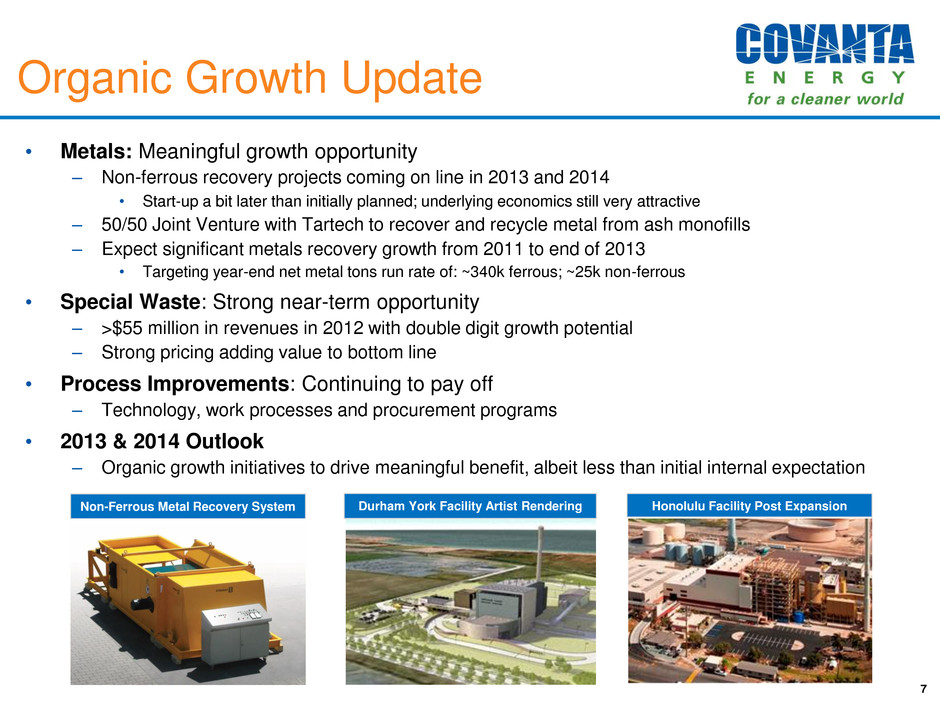
Organic Growth Update 7 • Metals: Meaningful growth opportunity – Non-ferrous recovery projects coming on line in 2013 and 2014 • Start-up a bit later than initially planned; underlying economics still very attractive – 50/50 Joint Venture with Tartech to recover and recycle metal from ash monofills – Expect significant metals recovery growth from 2011 to end of 2013 • Targeting year-end net metal tons run rate of: ~340k ferrous; ~25k non-ferrous • Special Waste: Strong near-term opportunity – >$55 million in revenues in 2012 with double digit growth potential – Strong pricing adding value to bottom line • Process Improvements: Continuing to pay off – Technology, work processes and procurement programs • 2013 & 2014 Outlook – Organic growth initiatives to drive meaningful benefit, albeit less than initial internal expectation Durham York Facility Artist Rendering Non-Ferrous Metal Recovery System Honolulu Facility Post Expansion
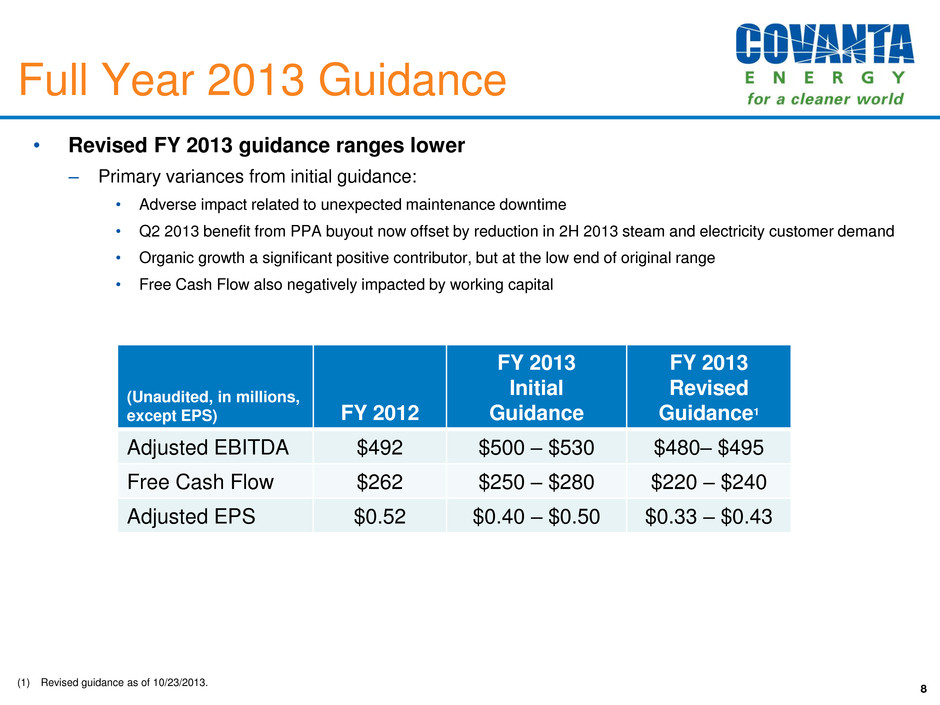
• Revised FY 2013 guidance ranges lower – Primary variances from initial guidance: • Adverse impact related to unexpected maintenance downtime • Q2 2013 benefit from PPA buyout now offset by reduction in 2H 2013 steam and electricity customer demand • Organic growth a significant positive contributor, but at the low end of original range • Free Cash Flow also negatively impacted by working capital 8 Full Year 2013 Guidance (Unaudited, in millions, except EPS) FY 2012 FY 2013 Initial Guidance FY 2013 Revised Guidance1 Adjusted EBITDA $492 $500 – $530 $480– $495 Free Cash Flow $262 $250 – $280 $220 – $240 Adjusted EPS $0.52 $0.40 – $0.50 $0.33 – $0.43 (1) Revised guidance as of 10/23/2013.

• Proactively increasing maintenance – Estimate $10 to $20 million adverse impact to 2014 Adjusted EBITDA compared to 20131 – Includes both expense and revenue related to downtime – Additional $10 million of incremental 2014 maintenance capital expenditures compared to 20132, impacts Free Cash Flow – Increased maintenance more closely reflects go-forward run-rate – Preserves reliable service for customers – Optimizes long-term revenue generation • Preliminary 2014 outlook update – Currently expect to be flat to slightly down compared to 2013 Adjusted EBITDA1 Business Update 9 (1)Based on revised FY 2013 Adjusted EBITDA guidance of $480 million to $495 million as of 10/23/2013 (2)Based on revised FY2013 Free Cash Flow guidance of $220 million to $240 million as of 10/23/2013
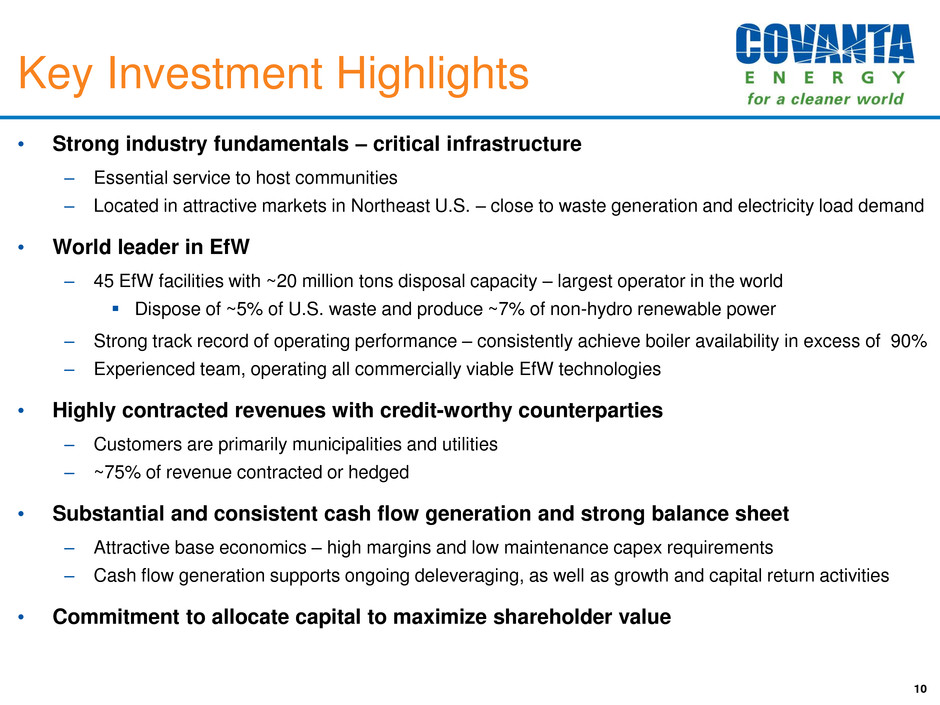
Key Investment Highlights • Strong industry fundamentals – critical infrastructure – Essential service to host communities – Located in attractive markets in Northeast U.S. – close to waste generation and electricity load demand • World leader in EfW – 45 EfW facilities with ~20 million tons disposal capacity – largest operator in the world Dispose of ~5% of U.S. waste and produce ~7% of non-hydro renewable power – Strong track record of operating performance – consistently achieve boiler availability in excess of 90% – Experienced team, operating all commercially viable EfW technologies • Highly contracted revenues with credit-worthy counterparties – Customers are primarily municipalities and utilities – ~75% of revenue contracted or hedged • Substantial and consistent cash flow generation and strong balance sheet – Attractive base economics – high margins and low maintenance capex requirements – Cash flow generation supports ongoing deleveraging, as well as growth and capital return activities • Commitment to allocate capital to maximize shareholder value 10
Covanta Holding Corp. Investor Presentation NYSE: CVA Appendix 11 November 2013
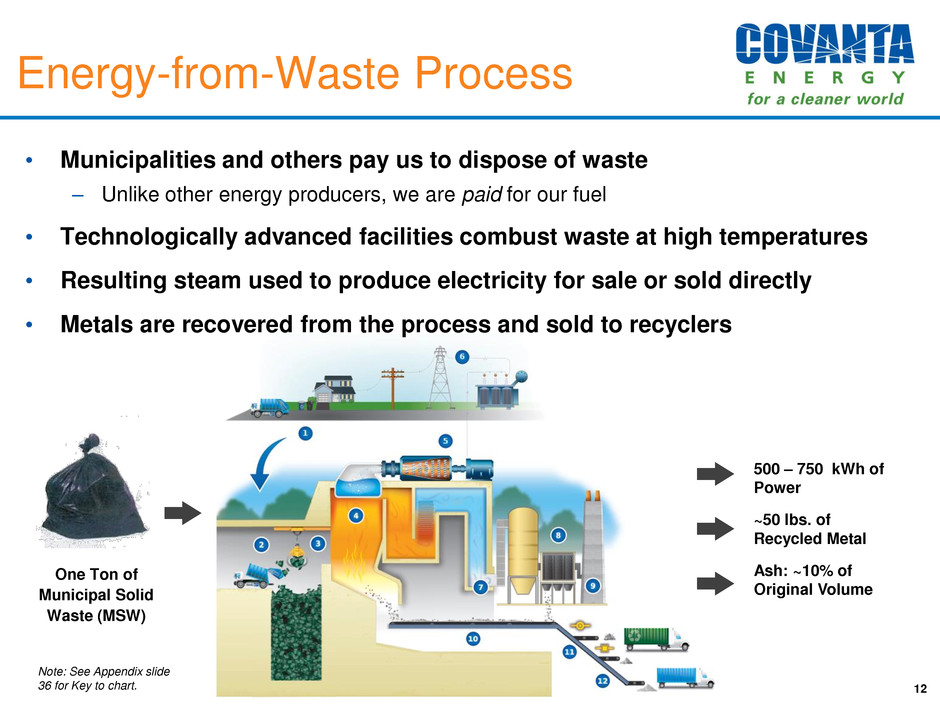
Energy-from-Waste Process 500 – 750 kWh of Power ~50 lbs. of Recycled Metal Ash: ~10% of Original Volume One Ton of Municipal Solid Waste (MSW) • Municipalities and others pay us to dispose of waste – Unlike other energy producers, we are paid for our fuel • Technologically advanced facilities combust waste at high temperatures • Resulting steam used to produce electricity for sale or sold directly • Metals are recovered from the process and sold to recyclers 12 Note: See Appendix slide 36 for Key to chart.
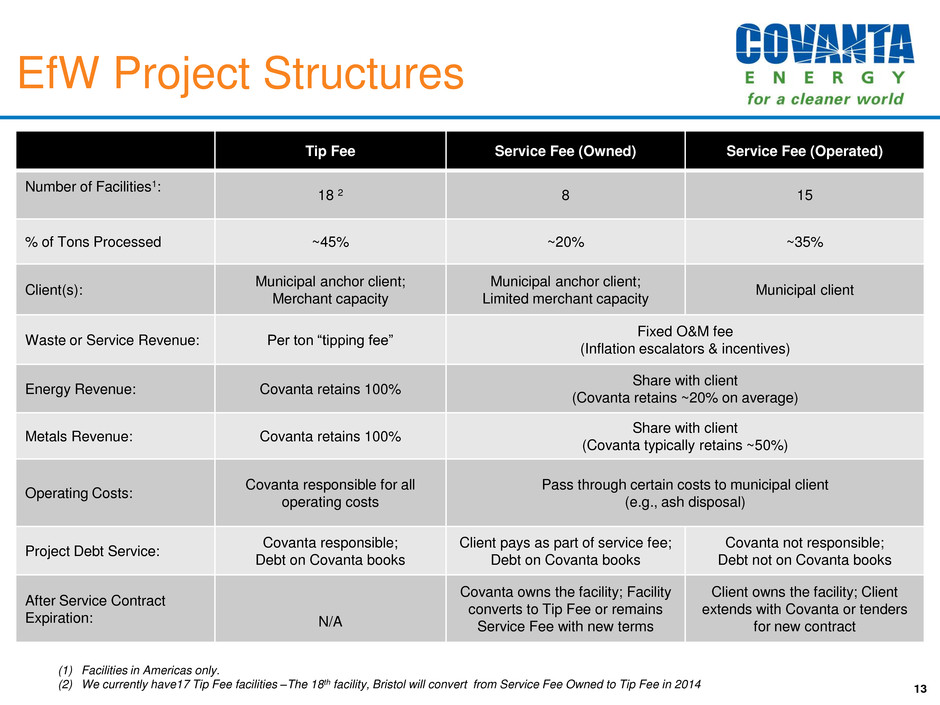
EfW Project Structures 13 Tip Fee Service Fee (Owned) Service Fee (Operated) Number of Facilities1: 18 2 8 15 % of Tons Processed ~45% ~20% ~35% Client(s): Municipal anchor client; Merchant capacity Municipal anchor client; Limited merchant capacity Municipal client Waste or Service Revenue: Per ton “tipping fee” Fixed O&M fee (Inflation escalators & incentives) Energy Revenue: Covanta retains 100% Share with client (Covanta retains ~20% on average) Metals Revenue: Covanta retains 100% Share with client (Covanta typically retains ~50%) Operating Costs: Covanta responsible for all operating costs Pass through certain costs to municipal client (e.g., ash disposal) Project Debt Service: Covanta responsible; Debt on Covanta books Client pays as part of service fee; Debt on Covanta books Covanta not responsible; Debt not on Covanta books After Service Contract Expiration: N/A Covanta owns the facility; Facility converts to Tip Fee or remains Service Fee with new terms Client owns the facility; Client extends with Covanta or tenders for new contract (1) Facilities in Americas only. (2) We currently have17 Tip Fee facilities –The 18th facility, Bristol will convert from Service Fee Owned to Tip Fee in 2014

2012: $1,008 million Highly Contracted Revenue • ~80% contracted • Contracts typically have inflation escalators • Excellent track record extending long-term contracts 14 Waste & Service Revenue 2012: $367 million Note: Figures presented for Americas operations only. Unaudited Energy Revenue • ~85% contracted or hedged • Concentration in attractive markets • Exposed output increasing over time 2013 to be similarly contracted Metal Revenue • Metals are sold at market 2012: $72 million

Business Drivers 15 Organic Development Long-Term Energy Exposure M&A and Financial Transactions Metal Recovery Special Waste Technology / Process Improvements Contract Management Dublin New Units (e.g., Durham York, Honolulu expansion, China) Delaware Valley Facility CVA Energy Share Increasing Long-Term Energy Price Outlook CLEERGASTM Renewable Energy Policy $335M tax- exempt 27 year project debt refinancing $1.6B corporate debt refinancing & capacity expansion Tartech Camden Facility NYC disposal contract

T ip F e e S er v ic e F e e O w n e d S er v ic e F e e O p e ra te d Major Municipal Waste Contract Transitions from 2008 - 2020 16 Renewed 24 out of 26 contracts representing ~8.1M tons* of waste annually & average contract extension of 11 years Note: In Q3 2013, Marion service fee contract extended for 3 years with 2 years of extension options. In Q2 2013, MacArthur service fee contract extended by 15 years to 2030 and Southeast Connecticut client exercised their option to extend service fee contract to 2017. Bristol will convert from service fee owned to tip fee in 2014. The ~7.8M tons referenced above is Guaranteed Annual Tons. Facilities acquired post 2008: Camden (2013); Dade (2010); Burnaby, Hudson Valley, Long Beach, MacArthur, Plymouth and York (2009)
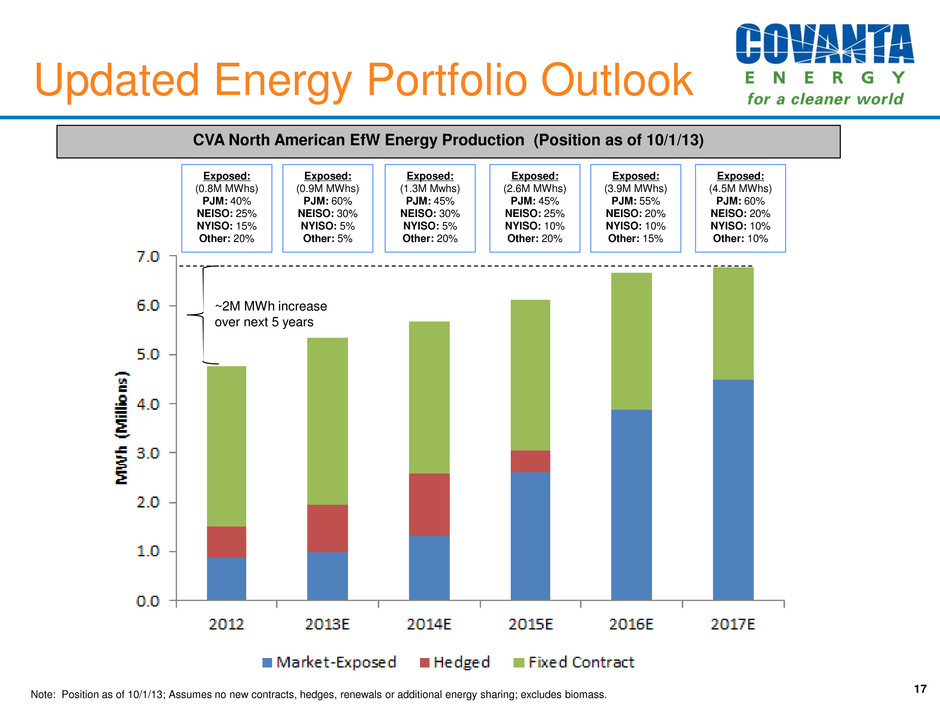
Updated Energy Portfolio Outlook 17 Note: Position as of 10/1/13; Assumes no new contracts, hedges, renewals or additional energy sharing; excludes biomass. CVA North American EfW Energy Production (Position as of 10/1/13) ~2M MWh increase over next 5 years Exposed: (0.8M MWhs) PJM: 40% NEISO: 25% NYISO: 15% Other: 20% Exposed: (0.9M MWhs) PJM: 60% NEISO: 30% NYISO: 5% Other: 5% Exposed: (1.3M Mwhs) PJM: 45% NEISO: 30% NYISO: 5% Other: 20% Exposed: (2.6M MWhs) PJM: 45% NEISO: 25% NYISO: 10% Other: 20% Exposed: (3.9M MWhs) PJM: 55% NEISO: 20% NYISO: 10% Other: 15% Exposed: (4.5M MWhs) PJM: 60% NEISO: 20% NYISO: 10% Other: 10%
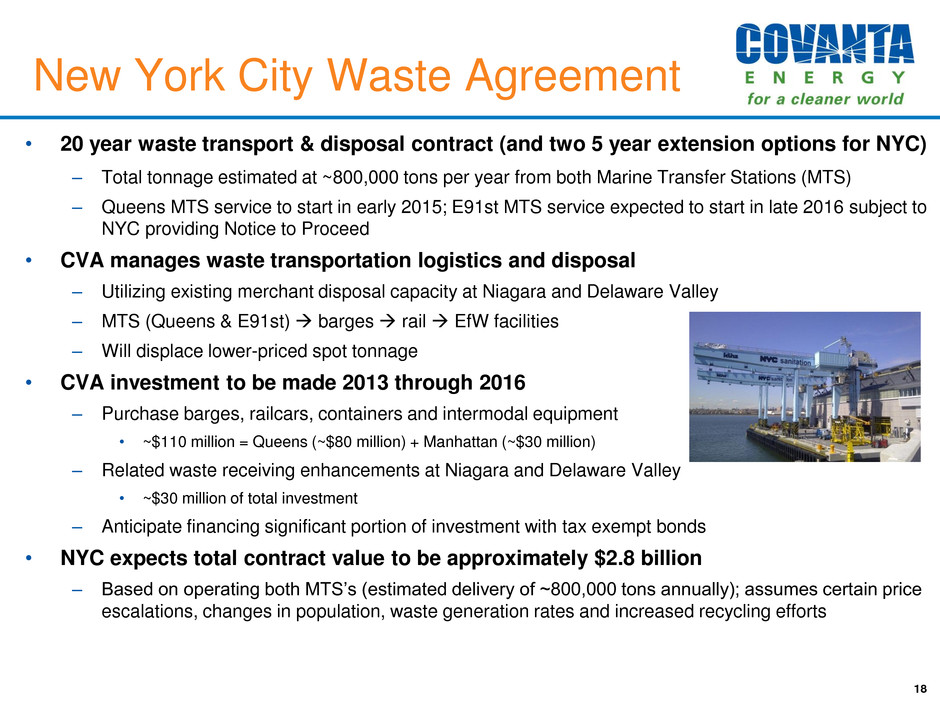
New York City Waste Agreement • 20 year waste transport & disposal contract (and two 5 year extension options for NYC) – Total tonnage estimated at ~800,000 tons per year from both Marine Transfer Stations (MTS) – Queens MTS service to start in early 2015; E91st MTS service expected to start in late 2016 subject to NYC providing Notice to Proceed • CVA manages waste transportation logistics and disposal – Utilizing existing merchant disposal capacity at Niagara and Delaware Valley – MTS (Queens & E91st) barges rail EfW facilities – Will displace lower-priced spot tonnage • CVA investment to be made 2013 through 2016 – Purchase barges, railcars, containers and intermodal equipment • ~$110 million = Queens (~$80 million) + Manhattan (~$30 million) – Related waste receiving enhancements at Niagara and Delaware Valley • ~$30 million of total investment – Anticipate financing significant portion of investment with tax exempt bonds • NYC expects total contract value to be approximately $2.8 billion – Based on operating both MTS’s (estimated delivery of ~800,000 tons annually); assumes certain price escalations, changes in population, waste generation rates and increased recycling efforts 18

Growth Investments • M&A: Purchased Camden facility for $49 million in August 2013 – In 2012, facility processed 319,000 tons of waste and generated 146,000 MWh of power – Tip fee facility with waste and energy market exposure – Modest positive impact on 2013 guidance metrics; Full year benefit in 2014 • Growth investments continue to add value – Projected growth investment requirements • 2013: $75 to $100 million “organic growth” + Camden ($49 million) + NYC (~$25 million) $150 to $175 million • 2014: Significantly less “organic growth” investment, but additional spend on Essex and NYC – Benefit of the investments is offsetting contract transitions (debt service, energy/waste market pricing, etc.) 19
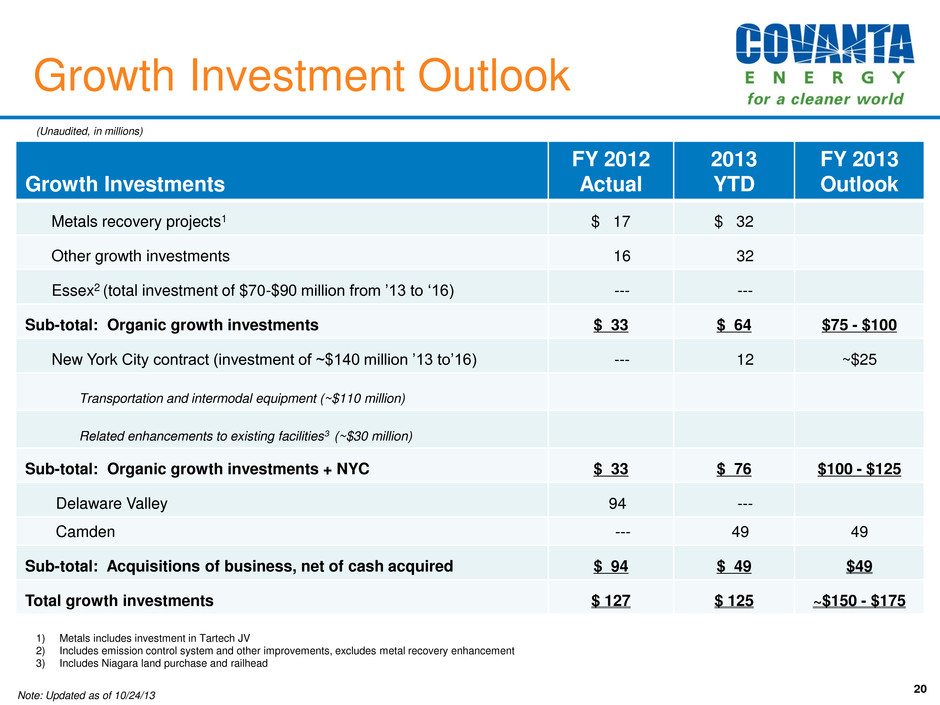
Growth Investment Outlook 20 Growth Investments FY 2012 Actual 2013 YTD FY 2013 Outlook Metals recovery projects1 $ 17 $ 32 Other growth investments 16 32 Essex2 (total investment of $70-$90 million from ’13 to ‘16) --- --- Sub-total: Organic growth investments $ 33 $ 64 $75 - $100 New York City contract (investment of ~$140 million ’13 to’16) --- 12 ~$25 Transportation and intermodal equipment (~$110 million) Related enhancements to existing facilities3 (~$30 million) Sub-total: Organic growth investments + NYC $ 33 $ 76 $100 - $125 Delaware Valley 94 --- Camden --- 49 49 Sub-total: Acquisitions of business, net of cash acquired $ 94 $ 49 $49 Total growth investments $ 127 $ 125 ~$150 - $175 (Unaudited, in millions) 1) Metals includes investment in Tartech JV 2) Includes emission control system and other improvements, excludes metal recovery enhancement 3) Includes Niagara land purchase and railhead Note: Updated as of 10/24/13
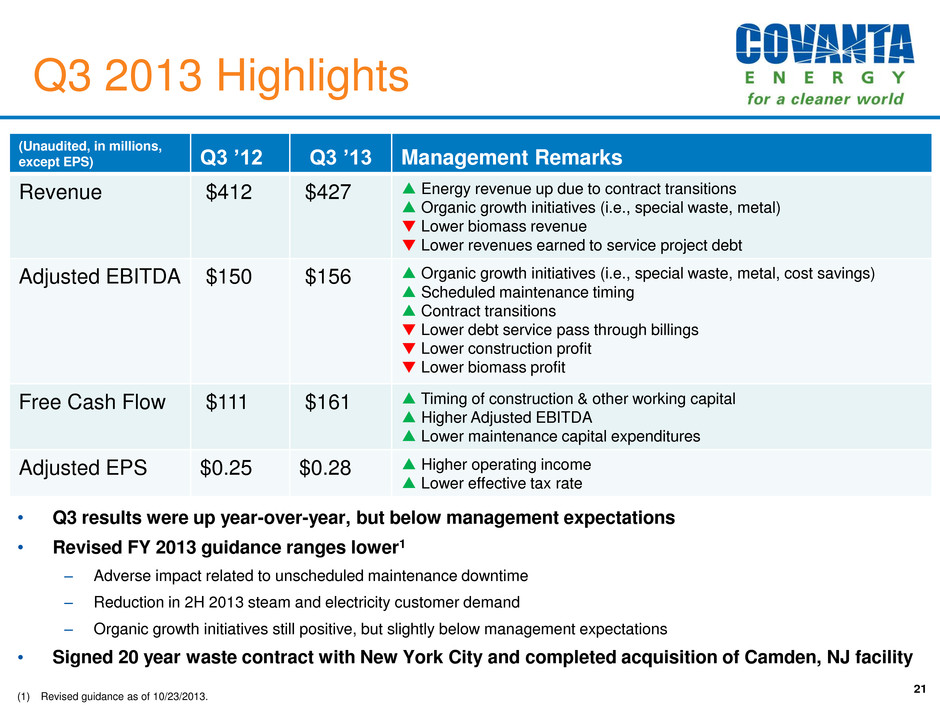
Q3 2013 Highlights 21 • Q3 results were up year-over-year, but below management expectations • Revised FY 2013 guidance ranges lower1 – Adverse impact related to unscheduled maintenance downtime – Reduction in 2H 2013 steam and electricity customer demand – Organic growth initiatives still positive, but slightly below management expectations • Signed 20 year waste contract with New York City and completed acquisition of Camden, NJ facility (Unaudited, in millions, except EPS) Q3 ’12 Q3 ’13 Management Remarks Revenue $412 $427 ▲ Energy revenue up due to contract transitions ▲ Organic growth initiatives (i.e., special waste, metal) ▼ Lower biomass revenue ▼ Lower revenues earned to service project debt Adjusted EBITDA $150 $156 ▲ Organic growth initiatives (i.e., special waste, metal, cost savings) ▲ Scheduled maintenance timing ▲ Contract transitions ▼ Lower debt service pass through billings ▼ Lower construction profit ▼ Lower biomass profit Free Cash Flow $111 $161 ▲ Timing of construction & other working capital ▲ Higher Adjusted EBITDA ▲ Lower maintenance capital expenditures Adjusted EPS $0.25 $0.28 ▲ Higher operating income ▲ Lower effective tax rate (1) Revised guidance as of 10/23/2013.
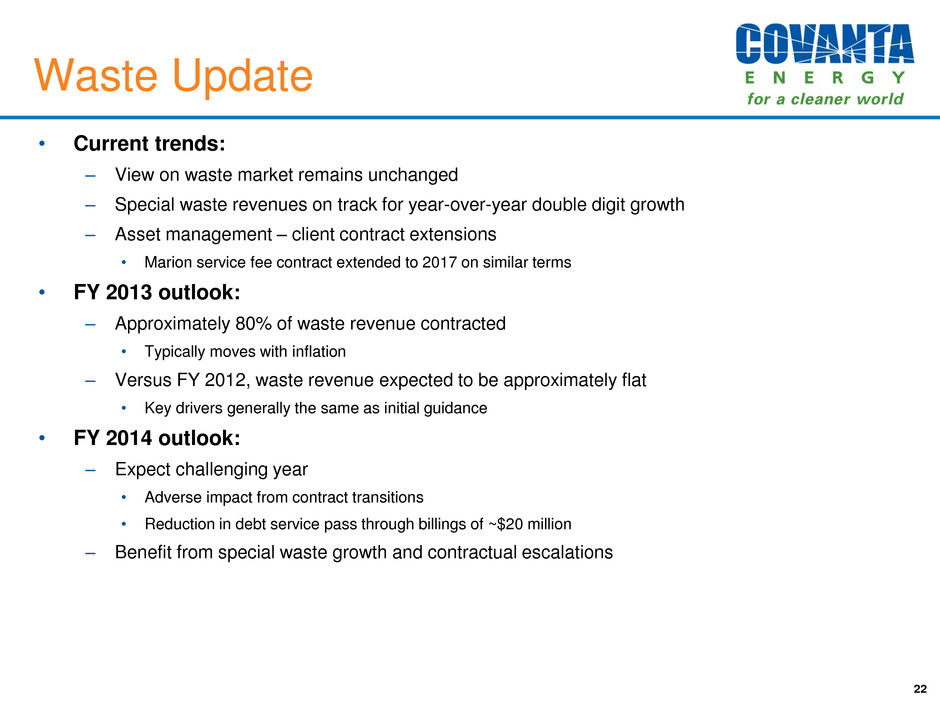
Waste Update • Current trends: – View on waste market remains unchanged – Special waste revenues on track for year-over-year double digit growth – Asset management – client contract extensions • Marion service fee contract extended to 2017 on similar terms • FY 2013 outlook: – Approximately 80% of waste revenue contracted • Typically moves with inflation – Versus FY 2012, waste revenue expected to be approximately flat • Key drivers generally the same as initial guidance • FY 2014 outlook: – Expect challenging year • Adverse impact from contract transitions • Reduction in debt service pass through billings of ~$20 million – Benefit from special waste growth and contractual escalations 22
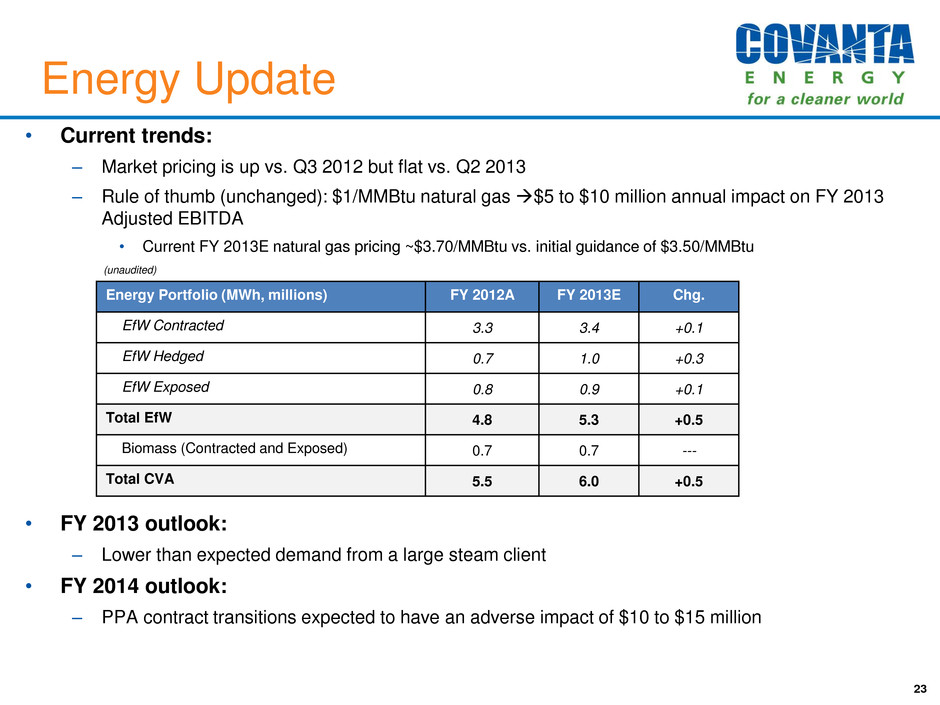
Energy Update • Current trends: – Market pricing is up vs. Q3 2012 but flat vs. Q2 2013 – Rule of thumb (unchanged): $1/MMBtu natural gas $5 to $10 million annual impact on FY 2013 Adjusted EBITDA • Current FY 2013E natural gas pricing ~$3.70/MMBtu vs. initial guidance of $3.50/MMBtu • FY 2013 outlook: – Lower than expected demand from a large steam client • FY 2014 outlook: – PPA contract transitions expected to have an adverse impact of $10 to $15 million 23 Energy Portfolio (MWh, millions) FY 2012A FY 2013E Chg. EfW Contracted 3.3 3.4 +0.1 EfW Hedged 0.7 1.0 +0.3 EfW Exposed 0.8 0.9 +0.1 Total EfW 4.8 5.3 +0.5 Biomass (Contracted and Exposed) 0.7 0.7 --- Total CVA 5.5 6.0 +0.5 (unaudited)
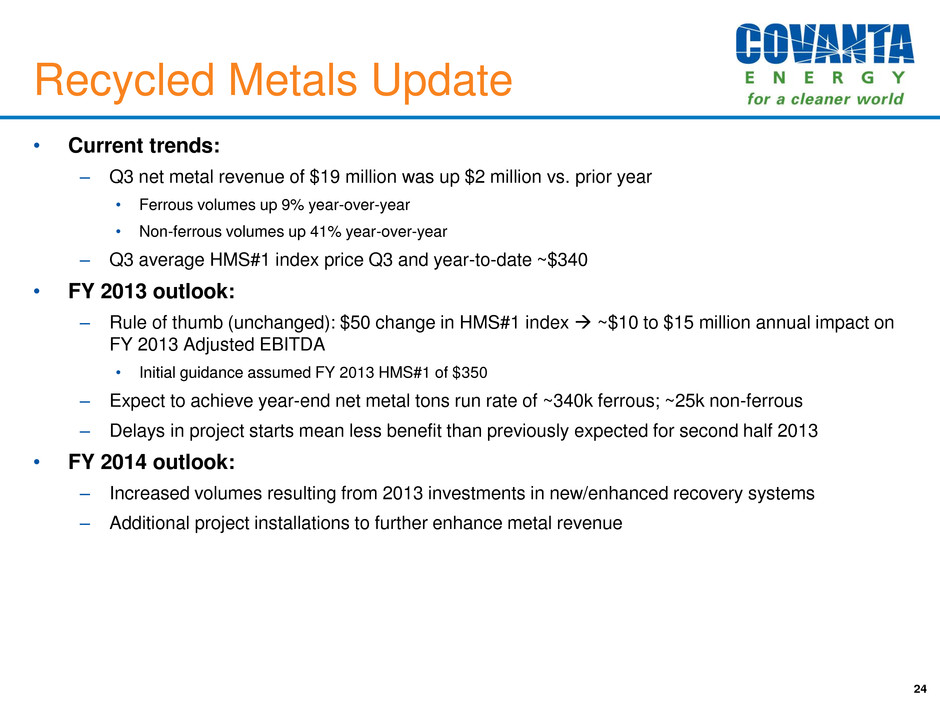
Recycled Metals Update • Current trends: – Q3 net metal revenue of $19 million was up $2 million vs. prior year • Ferrous volumes up 9% year-over-year • Non-ferrous volumes up 41% year-over-year – Q3 average HMS#1 index price Q3 and year-to-date ~$340 • FY 2013 outlook: – Rule of thumb (unchanged): $50 change in HMS#1 index ~$10 to $15 million annual impact on FY 2013 Adjusted EBITDA • Initial guidance assumed FY 2013 HMS#1 of $350 – Expect to achieve year-end net metal tons run rate of ~340k ferrous; ~25k non-ferrous – Delays in project starts mean less benefit than previously expected for second half 2013 • FY 2014 outlook: – Increased volumes resulting from 2013 investments in new/enhanced recovery systems – Additional project installations to further enhance metal revenue 24
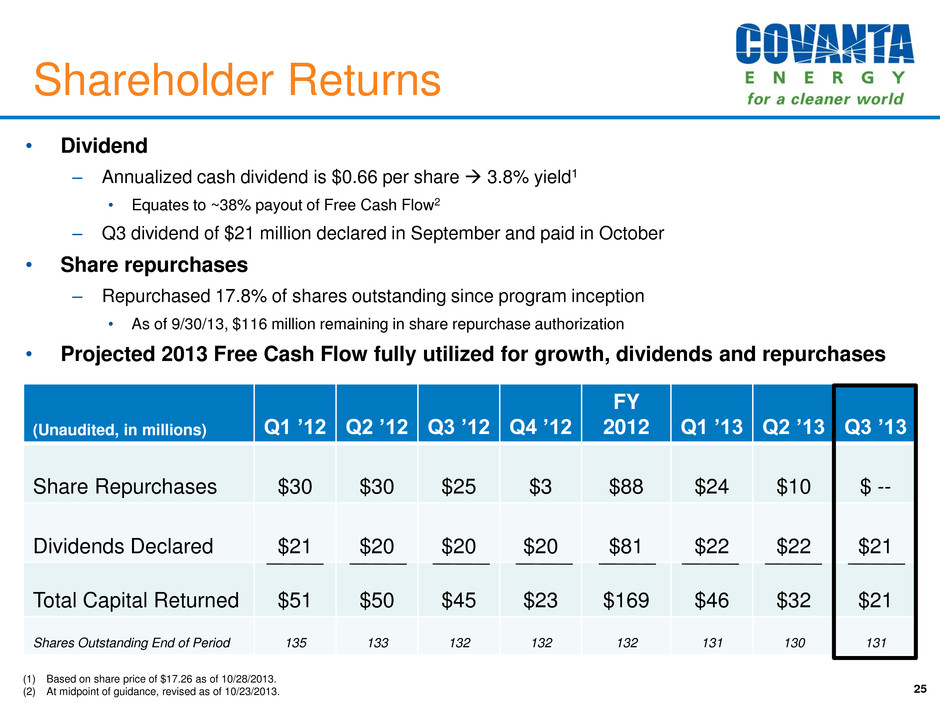
• Dividend – Annualized cash dividend is $0.66 per share 3.8% yield1 • Equates to ~38% payout of Free Cash Flow2 – Q3 dividend of $21 million declared in September and paid in October • Share repurchases – Repurchased 17.8% of shares outstanding since program inception • As of 9/30/13, $116 million remaining in share repurchase authorization • Projected 2013 Free Cash Flow fully utilized for growth, dividends and repurchases 25 (Unaudited, in millions) Q1 ’12 Q2 ’12 Q3 ’12 Q4 ’12 FY 2012 Q1 ’13 Q2 ’13 Q3 ’13 Share Repurchases $30 $30 $25 $3 $88 $24 $10 $ -- Dividends Declared $21 $20 $20 $20 $81 $22 $22 $21 Total Capital Returned $51 $50 $45 $23 $169 $46 $32 $21 Shares Outstanding End of Period 135 133 132 132 132 131 130 131 (1) Based on share price of $17.26 as of 10/28/2013. (2) At midpoint of guidance, revised as of 10/23/2013. Shareholder Returns
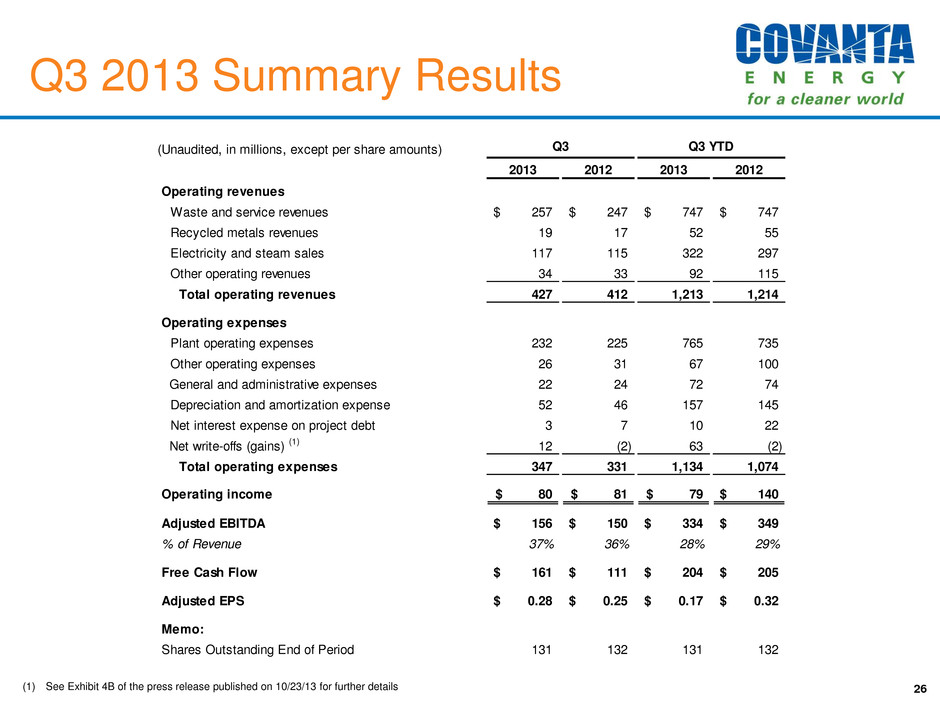
Q3 2013 Summary Results 26 (1) See Exhibit 4B of the press release published on 10/23/13 for further details (Unaudited, in millions, except per share amounts) Q3 Q3 YTD 2013 2012 2013 2012 Operating revenues Waste and service revenues 257$ 247$ 747$ 747$ Recycled metals revenues 19 17 52 55 Electricity and steam sales 117 115 322 297 Other operating revenues 34 33 92 115 Total operating revenues 427 412 1,213 1,214 Operating expenses Plant operating expenses 232 225 765 735 Other operating expenses 26 31 67 100 General and administrative expenses 22 24 72 74 Depreciation and amortization expense 52 46 157 145 Net interest expense on project debt 3 7 10 22 Net write-offs (gains) (1) 12 (2) 63 (2) Total operating expenses 347 331 1,134 1,074 Operating income 80$ 81$ 79$ 140$ Adjusted EBITDA 156$ 150$ 334$ 349$ % of Revenue 37% 36% 28% 29% Free Cash Flow 161$ 111$ 204$ 205$ Adjusted EPS 0.28$ 0.25$ 0.17$ 0.32$ Memo: Shares Outstanding End of Period 131 132 131 132
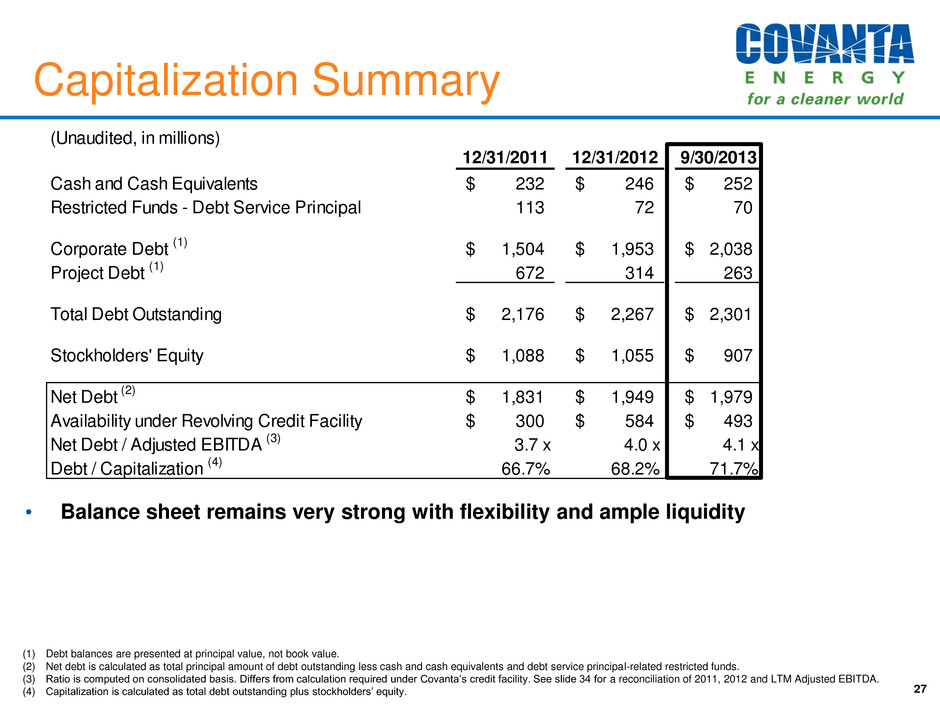
(Unaudited, in millions) 12/31/2011 12/31/2012 9/30/2013 Cash and Cash Equivalents 232$ 246$ 252$ Restricted Funds - Debt Service Principal 113 72 70 Corporate Debt (1) 1,504$ 1,953$ 2,038$ Project Debt (1) 672 314 263 Total Debt Outstanding 2,176$ 2,267$ 2,301$ Stockholders' Equity 1,088$ 1,055$ 907$ Net Debt (2) 1,831$ 1,949$ 1,979$ Availability under Revolving Credit Facility 300$ 584$ 493$ Net Debt / Adjusted EBITDA (3) 3.7 x 4.0 x 4.1 x Debt / Capitalization (4) 66.7% 68.2% 71.7% 27 (1) Debt balances are presented at principal value, not book value. (2) Net debt is calculated as total principal amount of debt outstanding less cash and cash equivalents and debt service principal-related restricted funds. (3) Ratio is computed on consolidated basis. Differs from calculation required under Covanta’s credit facility. See slide 34 for a reconciliation of 2011, 2012 and LTM Adjusted EBITDA. (4) Capitalization is calculated as total debt outstanding plus stockholders’ equity. Capitalization Summary • Balance sheet remains very strong with flexibility and ample liquidity
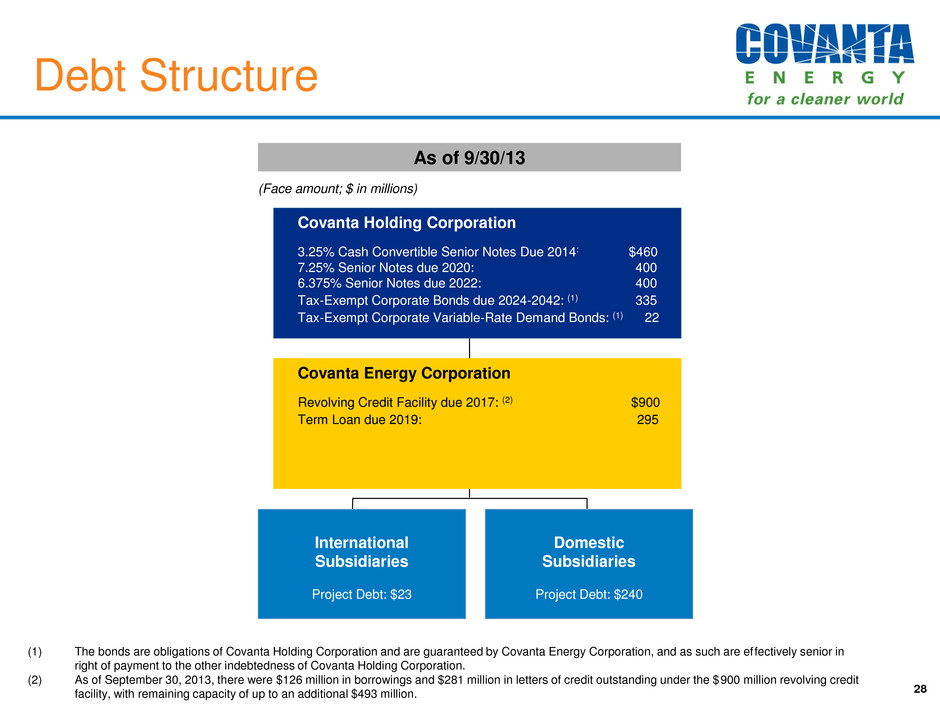
28 Debt Structure (1) The bonds are obligations of Covanta Holding Corporation and are guaranteed by Covanta Energy Corporation, and as such are effectively senior in right of payment to the other indebtedness of Covanta Holding Corporation. (2) As of September 30, 2013, there were $126 million in borrowings and $281 million in letters of credit outstanding under the $900 million revolving credit facility, with remaining capacity of up to an additional $493 million. As of 9/30/13 (Face amount; $ in millions) Covanta Energy Corporation Revolving Credit Facility due 2017: (2) $900 Term Loan due 2019: 295 Domestic Subsidiaries Project Debt: $240 International Subsidiaries Project Debt: $23 Covanta Holding Corporation 3.25% Cash Convertible Senior Notes Due 2014: $460 7.25% Senior Notes due 2020: 400 6.375% Senior Notes due 2022: 400 Tax-Exempt Corporate Bonds due 2024-2042: (1) 335 Tax-Exempt Corporate Variable-Rate Demand Bonds: (1) 22

Project Debt Repayment Schedule 29 Project Debt Repayment 2008-2012 2013 2014 2015 2016 2017 Beyond 2017 Total Principal Payments 740 82 50 37 14 15 93 Total Change in Principal-Related Restricted Funds (140) (27) (21) (6) -- -- (14) Net Cash Used for Project Debt Principal Repayment $600 $55 $29 $31 $14 $15 $79 (1) Includes pass-through lease payments for emission control system (~$4 million per year 2008-2012). (2) Related to Service Fee facilities only. Note: Americas operations only. Excludes payments related to project debt refinancing. Client Payments for Debt Service 1 2008-2012 2013 2014 2015 2016 2017 Beyond 2017 Debt Service Revenue – Principal 1 $293 $30 $19 $9 $3 $3 $2 Debt Service Revenue – Interest 86 5 3 2 1 1 -- Debt Service Billings in Excess of Revenue Recognized 94 9 2 2 5 5 -- Client Payments for Debt Service 2 $473 $44 $24 $13 $9 $9 $2 Net Change in Debt Service Billings per Period $(63) $(16) $(20) $(11) $(4) -- (unaudited, $ in millions)
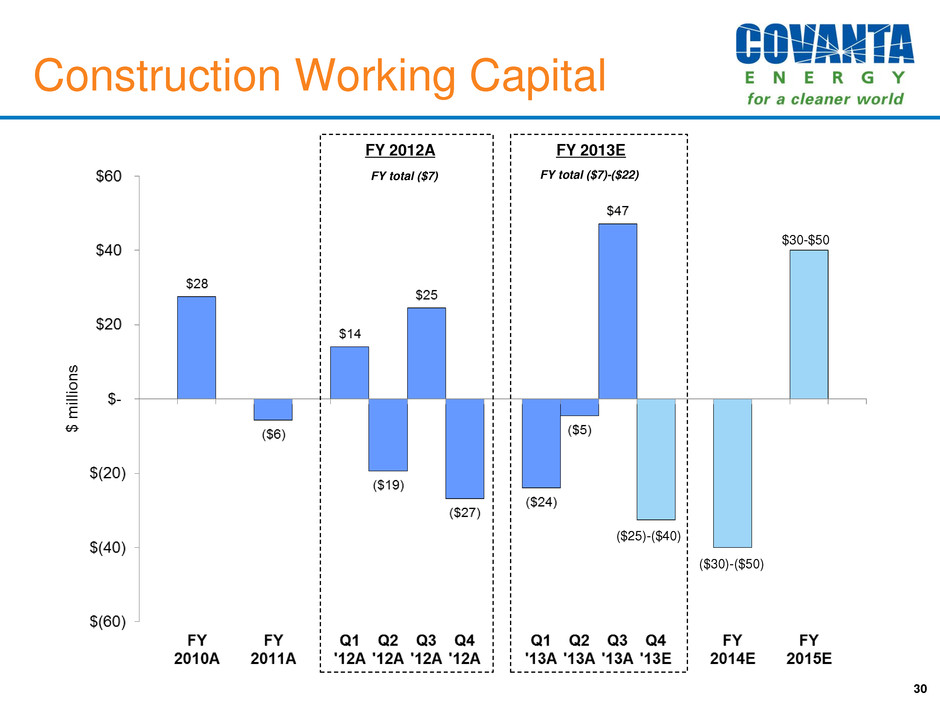
Construction Working Capital 30 FY 2012A FY 2013E ($30)-($50) $30-$50 ($25)-($40) FY total ($7) FY total ($7)-($22)
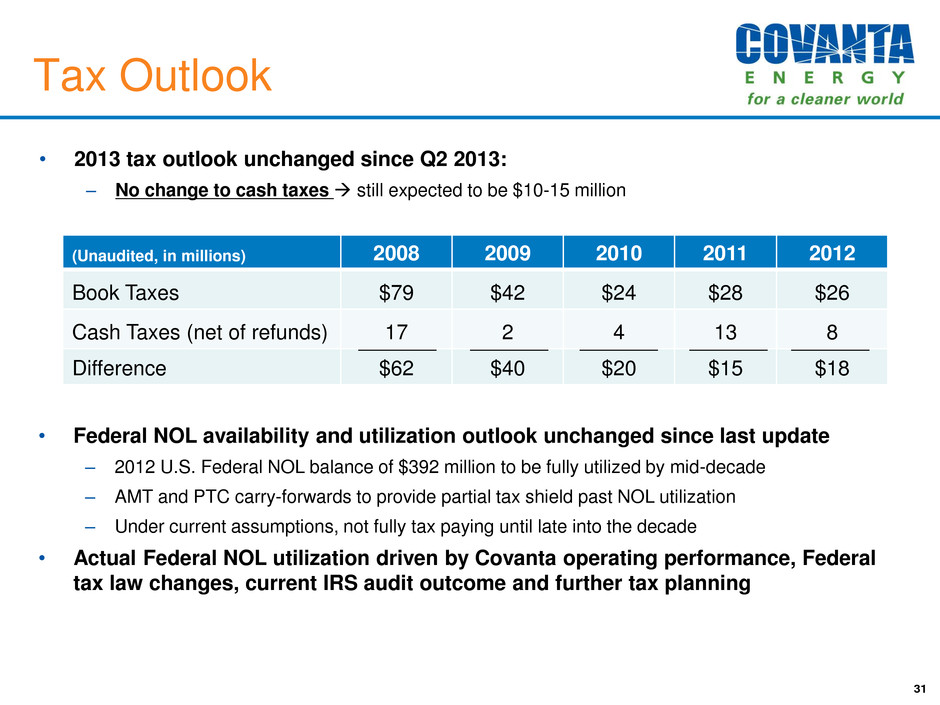
Tax Outlook • 2013 tax outlook unchanged since Q2 2013: – No change to cash taxes still expected to be $10-15 million 31 • Federal NOL availability and utilization outlook unchanged since last update – 2012 U.S. Federal NOL balance of $392 million to be fully utilized by mid-decade – AMT and PTC carry-forwards to provide partial tax shield past NOL utilization – Under current assumptions, not fully tax paying until late into the decade • Actual Federal NOL utilization driven by Covanta operating performance, Federal tax law changes, current IRS audit outcome and further tax planning (Unaudited, in millions) 2008 2009 2010 2011 2012 Book Taxes $79 $42 $24 $28 $26 Cash Taxes (net of refunds) 17 2 4 13 8 Difference $62 $40 $20 $15 $18
(1) At midpoint of guidance, revised as of 10/23/2013; based on share price of $17.26 as of 10/28/2013. 32 • Full year Free Cash Flow (FCF) significantly exceeds Net Income on a consistent basis – Free Cash Flow yield of ~10%1 • Three important factors in FCF calculation to highlight (refer to slide 33 for numerical detail): – Debt Service Billings (DSB) in excess of revenue recognized • Debt Service Revenue recorded on straight line basis (per GAAP) • DSB paid in line with actual payment schedule. Adjustments reflect cash payments received – Depreciation and amortization (D&A) is higher than maintenance capex • Acquisitions resulted in significant intangible assets/step ups to fair value of acquired fixed assets higher run-rate D&A (no corresponding maintenance capex) • Original construction costs of facilities depreciated over the useful life of the asset (up to 50 years) – Assets do not have recurring maintenance capex on an annual basis – Certain maintenance and repair costs are recorded as an expense in plant maintenance (rather than capitalized) – Tax expense is significantly higher than cash taxes • Significant tax NOL balance (~$392 million as of 12/31/2012) used to offset federal taxes • Once NOLs fully utilized, Free Cash Flow will be impacted – NOLs to be fully utilized by mid-decade; PTC and AMT carry-forwards to provide additional partial tax shield beyond NOL utilization into late decade Strong Free Cash Flow
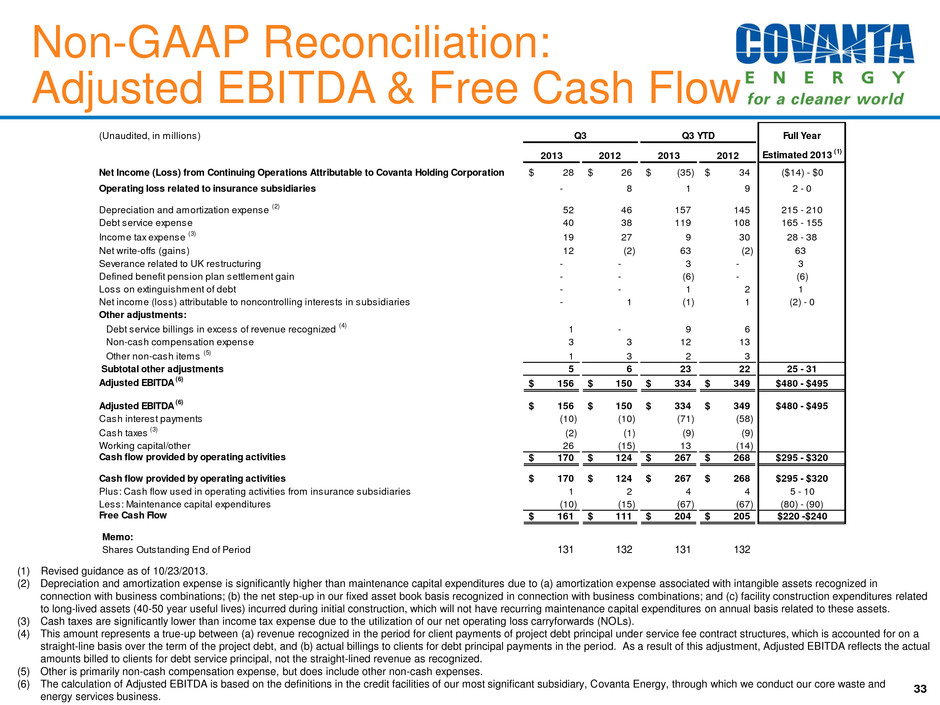
Non-GAAP Reconciliation: Adjusted EBITDA & Free Cash Flow (1) Revised guidance as of 10/23/2013. (2) Depreciation and amortization expense is significantly higher than maintenance capital expenditures due to (a) amortization expense associated with intangible assets recognized in connection with business combinations; (b) the net step-up in our fixed asset book basis recognized in connection with business combinations; and (c) facility construction expenditures related to long-lived assets (40-50 year useful lives) incurred during initial construction, which will not have recurring maintenance capital expenditures on annual basis related to these assets. (3) Cash taxes are significantly lower than income tax expense due to the utilization of our net operating loss carryforwards (NOLs). (4) This amount represents a true-up between (a) revenue recognized in the period for client payments of project debt principal under service fee contract structures, which is accounted for on a straight-line basis over the term of the project debt, and (b) actual billings to clients for debt principal payments in the period. As a result of this adjustment, Adjusted EBITDA reflects the actual amounts billed to clients for debt service principal, not the straight-lined revenue as recognized. (5) Other is primarily non-cash compensation expense, but does include other non-cash expenses. (6) The calculation of Adjusted EBITDA is based on the definitions in the credit facilities of our most significant subsidiary, Covanta Energy, through which we conduct our core waste and energy services business. 33 (Unaudited, in millions) Full Year 2013 2012 2013 2012 Estimated 2013 (1) Net Income (Loss) from Continuing Operations Attributable to Covanta Holding Corporation 28$ 26$ (35)$ 34$ ($14) - $0 Operating loss related to insurance subsidiaries - 8 1 9 2 - 0 Depreciation and amortization expense (2) 52 46 157 145 215 - 210 Debt service expense 40 38 119 108 165 - 155 Income tax expense (3) 19 27 9 30 28 - 38 Net write-offs (gains) 12 (2) 63 (2) 63 Severance related to UK restructuring - - 3 - 3 Defined benefit pension plan settlement gain - - (6) - (6) Loss on extinguishment of debt - - 1 2 1 Net income (loss) attributable to noncontrolling interests in subsidiaries - 1 (1) 1 (2) - 0 Other adjustments: Debt service billings in excess of revenue recognized (4) 1 - 9 6 Non-cash compensation expense 3 3 12 13 Other non-cash items (5) 1 3 2 3 Subtotal other adjustments 5 6 23 22 25 - 31 Adjusted EBITDA (6) 156$ 150$ 334$ 349$ $480 - $495 Adjusted EBITDA (6) 156$ 150$ 334$ 349$ $480 - $495 Cash interest payments (10) (10) (71) (58) Cash taxes (3) (2) (1) (9) (9) Working capital/other 26 (15) 13 (14) Cash flow provided by operating activities 170$ 124$ 267$ 268$ $295 - $320 Cash flow provided by operating activities 170$ 124$ 267$ 268$ $295 - $320 Plus: Cash flow used in operating activities from insurance subsidiaries 1 2 4 4 5 - 10 Less: Maintenance capital expenditures (10) (15) (67) (67) (80) - (90) Free Cash Flow 161$ 111$ 204$ 205$ $220 -$240 Memo: Shares Outstanding End of Period 131 132 131 132 Q3 Q3 YTD
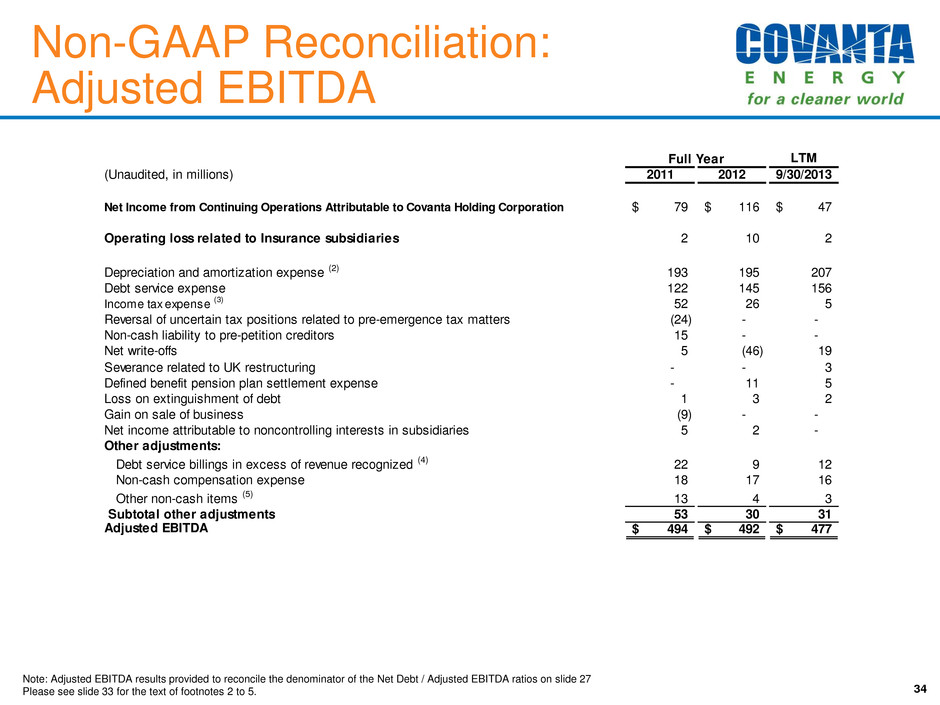
Non-GAAP Reconciliation: Adjusted EBITDA 34 Note: Adjusted EBITDA results provided to reconcile the denominator of the Net Debt / Adjusted EBITDA ratios on slide 27 Please see slide 33 for the text of footnotes 2 to 5. Full Year LTM (Unaudited, in millions) 2011 2012 9/30/2013 Net Income from Continuing Operations Attributable to Covanta Holding Corporation 79$ 116$ 47$ Operating loss related to Insurance subsidiaries 2 10 2 Depreciation and amortization expense (2) 193 195 207 Debt service expense 122 145 156 Income tax expense (3) 52 26 5 Reversal of uncertain tax positions related to pre-emergence tax matters (24) - - Non-cash liability to pre-petition creditors 15 - - Net write-offs 5 (46) 19 Severance related to UK restructuring - - 3 Defined benefit pension plan settlement expense - 11 5 Loss on extinguishment of debt 1 3 2 Gain on sale of business (9) - - Net income attributable to noncontrolling interests in subsidiaries 5 2 - Other adjustments: Debt service billings in excess of revenue recognized (4) 22 9 12 Non-cash compensation expense 18 17 16 Other non-cash items (5) 13 4 3 Subtotal other adjustments 53 30 31 Adjusted EBITDA 494$ 492$ 477$
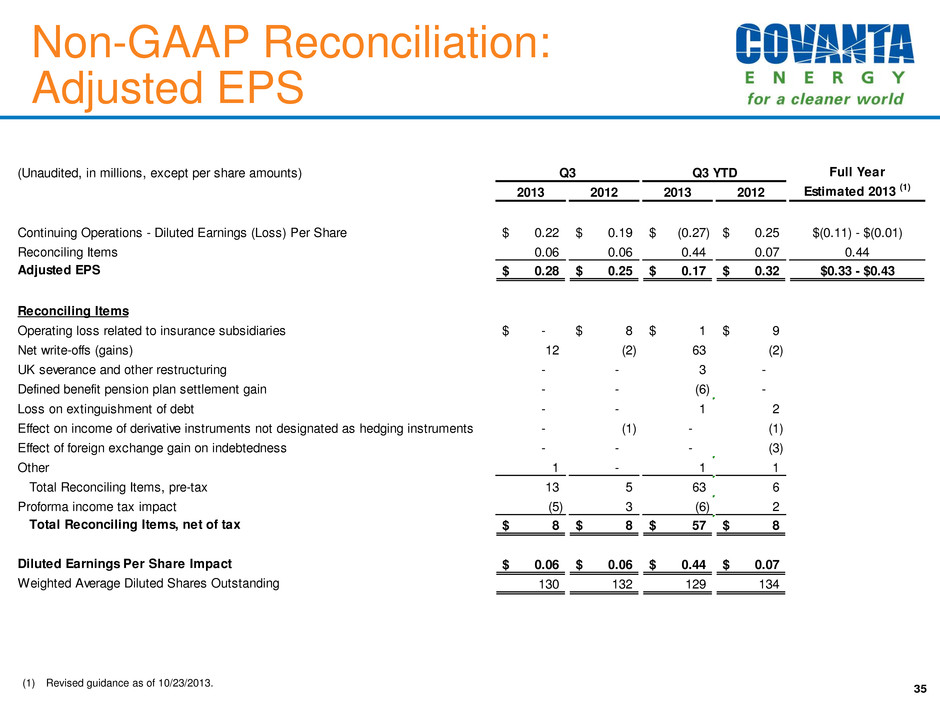
35 (1) Revised guidance as of 10/23/2013. Non-GAAP Reconciliation: Adjusted EPS (Unaudited, in millions, except per share amounts) Full Year 2013 2012 2013 2012 Estimated 2013 (1) Continuing Operations - Diluted Earnings (Loss) Per Share 0.22$ 0.19$ (0.27)$ 0.25$ $(0.11) - $(0.01) Reconciling Items 0.06 0.06 0.44 0.07 0.44 Adjusted EPS 0.28$ 0.25$ 0.17$ 0.32$ $0.33 - $0.43 Reconciling Items Operating loss related to insurance subsidiaries -$ 8$ 1$ 9$ Net write-offs (gains) 12 (2) 63 (2) UK severance and other restructuring - - 3 - Defined benefit pension plan settlement gain - - (6) - Loss on extinguishment of debt - - 1 2 Effect on income of derivative instruments not designated as hedging instruments - (1) - (1) Effect of foreign exchange gain on indebtedness - - - (3) Other 1 - 1 1 Total Reconciling Items, pre-tax 13 5 63 6 Proforma income tax impact (5) 3 (6) 2 Total Reconciling Items, net of tax 8$ 8$ 57$ 8$ Diluted Earnings Per Share Impact 0.06$ 0.06$ 0.44$ 0.07$ Weighted Average Diluted Shares Outstanding 130 132 129 134 Q3 Q3 YTD
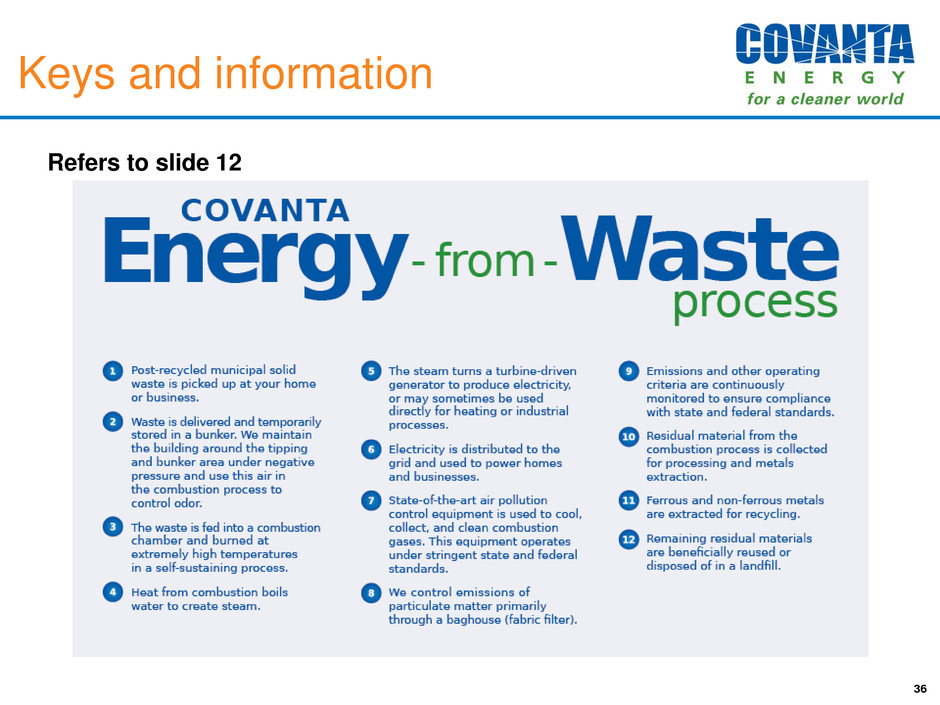
Keys and information 36 Refers to slide 12
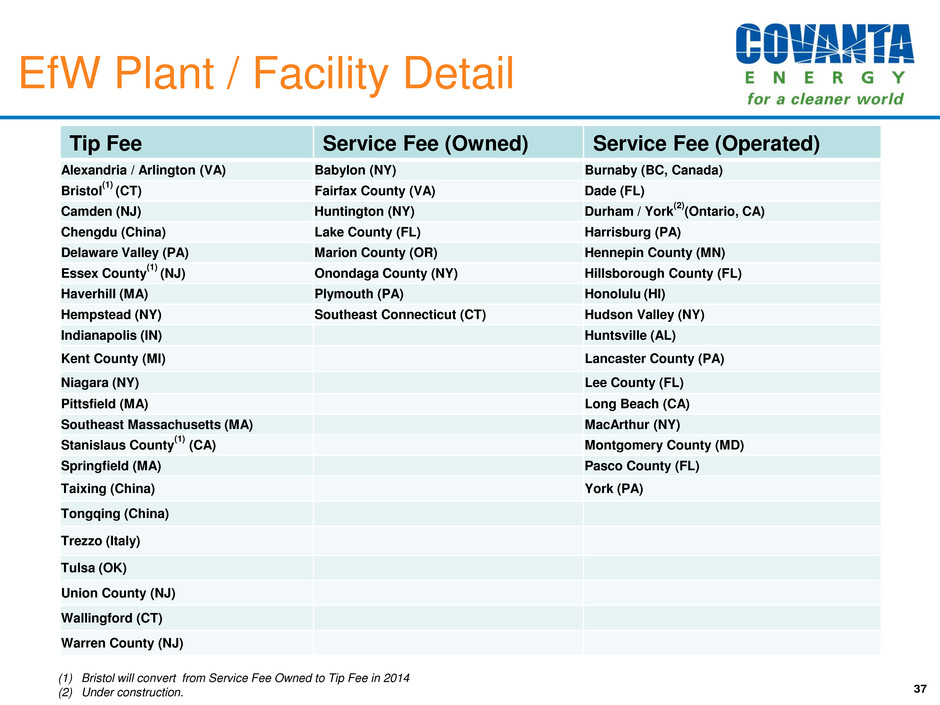
EfW Plant / Facility Detail 37 Tip Fee Service Fee (Owned) Service Fee (Operated) Alexandria / Arlington (VA) Babylon (NY) Burnaby (BC, Canada) Bristol (1) (CT) Fairfax County (VA) Dade (FL) Camden (NJ) Huntington (NY) Durham / York (2) (Ontario, CA) Chengdu (China) Lake County (FL) Harrisburg (PA) Delaware Valley (PA) Marion County (OR) Hennepin County (MN) Essex County (1) (NJ) Onondaga County (NY) Hillsborough County (FL) Haverhill (MA) Plymouth (PA) Honolulu (HI) Hempstead (NY) Southeast Connecticut (CT) Hudson Valley (NY) Indianapolis (IN) Huntsville (AL) Kent County (MI) Lancaster County (PA) Niagara (NY) Lee County (FL) Pittsfield (MA) Long Beach (CA) Southeast Massachusetts (MA) MacArthur (NY) Stanislaus County (1) (CA) Montgomery County (MD) Springfield (MA) Pasco County (FL) Taixing (China) York (PA) Tongqing (China) Trezzo (Italy) Tulsa (OK) Union County (NJ) Wallingford (CT) Warren County (NJ) (1) Bristol will convert from Service Fee Owned to Tip Fee in 2014 (2) Under construction.
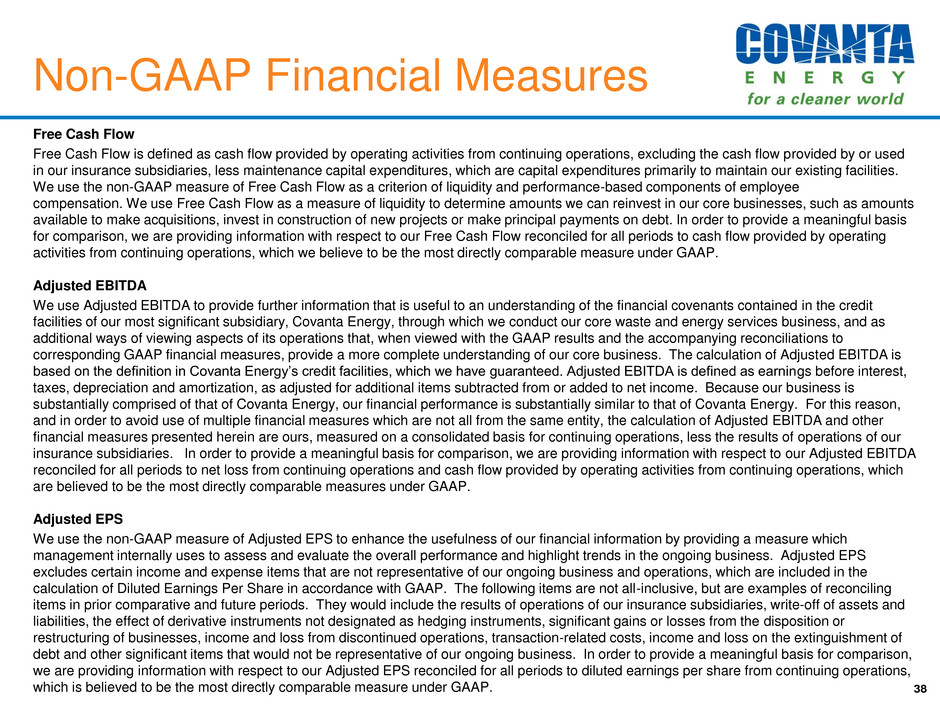
Free Cash Flow Free Cash Flow is defined as cash flow provided by operating activities from continuing operations, excluding the cash flow provided by or used in our insurance subsidiaries, less maintenance capital expenditures, which are capital expenditures primarily to maintain our existing facilities. We use the non-GAAP measure of Free Cash Flow as a criterion of liquidity and performance-based components of employee compensation. We use Free Cash Flow as a measure of liquidity to determine amounts we can reinvest in our core businesses, such as amounts available to make acquisitions, invest in construction of new projects or make principal payments on debt. In order to provide a meaningful basis for comparison, we are providing information with respect to our Free Cash Flow reconciled for all periods to cash flow provided by operating activities from continuing operations, which we believe to be the most directly comparable measure under GAAP. Adjusted EBITDA We use Adjusted EBITDA to provide further information that is useful to an understanding of the financial covenants contained in the credit facilities of our most significant subsidiary, Covanta Energy, through which we conduct our core waste and energy services business, and as additional ways of viewing aspects of its operations that, when viewed with the GAAP results and the accompanying reconciliations to corresponding GAAP financial measures, provide a more complete understanding of our core business. The calculation of Adjusted EBITDA is based on the definition in Covanta Energy’s credit facilities, which we have guaranteed. Adjusted EBITDA is defined as earnings before interest, taxes, depreciation and amortization, as adjusted for additional items subtracted from or added to net income. Because our business is substantially comprised of that of Covanta Energy, our financial performance is substantially similar to that of Covanta Energy. For this reason, and in order to avoid use of multiple financial measures which are not all from the same entity, the calculation of Adjusted EBITDA and other financial measures presented herein are ours, measured on a consolidated basis for continuing operations, less the results of operations of our insurance subsidiaries. In order to provide a meaningful basis for comparison, we are providing information with respect to our Adjusted EBITDA reconciled for all periods to net loss from continuing operations and cash flow provided by operating activities from continuing operations, which are believed to be the most directly comparable measures under GAAP. Adjusted EPS We use the non-GAAP measure of Adjusted EPS to enhance the usefulness of our financial information by providing a measure which management internally uses to assess and evaluate the overall performance and highlight trends in the ongoing business. Adjusted EPS excludes certain income and expense items that are not representative of our ongoing business and operations, which are included in the calculation of Diluted Earnings Per Share in accordance with GAAP. The following items are not all-inclusive, but are examples of reconciling items in prior comparative and future periods. They would include the results of operations of our insurance subsidiaries, write-off of assets and liabilities, the effect of derivative instruments not designated as hedging instruments, significant gains or losses from the disposition or restructuring of businesses, income and loss from discontinued operations, transaction-related costs, income and loss on the extinguishment of debt and other significant items that would not be representative of our ongoing business. In order to provide a meaningful basis for comparison, we are providing information with respect to our Adjusted EPS reconciled for all periods to diluted earnings per share from continuing operations, which is believed to be the most directly comparable measure under GAAP. Non-GAAP Financial Measures 38
Covanta Holding Corp NYSE: CVA Investor Relations: 445 South Street Morristown, NJ 07960 (862)345-5456 IR@covantaenergy.com 39


