UNITED STATES
SECURITIES AND EXCHANGE COMMISSION
Washington, D.C. 20549
FORM 8-K
CURRENT REPORT PURSUANT
TO SECTION 13 OR 15(D) OF THE SECURITIES EXCHANGE ACT OF 1934
Date of Report (Date of earliest event reported): November 17, 2005
COVANTA HOLDING CORPORATION
(Exact name of Registrant as Specified in Its Charter)
| | | | | |
| Delaware | | 1-6732 | | 95-6021257 |
| | | | | |
(State or Other Jurisdiction of
Incorporation) | | (Commission
File Number) | | (I.R.S. Employer
Identification No.) |
| | | |
40 Lane Road
Fairfield, New Jersey | |
07004 |
| | | |
| (Address of principal executive offices) | | (Zip Code) |
(973) 882-9000
(Registrant’s telephone number, including area code)
(Former name or former address, if changed since last report)
Check the appropriate box below if the Form 8-K filing is intended to simultaneously satisfy the filing obligation of the registrant under any of the following provisions (seeGeneral Instruction A.2. below):
| | |
| o | | Written communications pursuant to Rule 425 under the Securities Act (17 CFR 230.425) |
| | |
| o | | Soliciting material pursuant to Rule 14a-12 under the Exchange Act (17 CFR 240.14a-12(b)) |
| | |
| o | | Pre-commencement communications pursuant to Rule 14d-2(b) under the Exchange Act (17 CFR 240.14d-2(b)) |
| | |
| o | | Pre-commencement communications pursuant to Rule 13e-4(c) under the Exchange Act (17 CFR 240.13e-4(c)) |
Item 7.01. Regulation FD Disclosure.
On November 17, 2005, Covanta Holding Corporation (the “Company”) issued a press release containing supplemental financial information about the Company. A copy of this press release is attached as Exhibit 99.1 hereto and incorporated herein by reference. The Company will hold a conference call and webcast (the “Conference Call”) at 2:00 p.m., Eastern Standard Time, on November 17, 2005, to discuss its third quarter results and pro forma financial information for the trailing twelve months ended September 30, 2005. This Form 8-K contains additional supplemental financial information about the Company that will be discussed during the Conference Call. This Form 8-K and the press release include certain non-GAAP financial information as identified herein and in Exhibit 99.1.
The information in this Form 8-K and Exhibit 99.1 is furnished pursuant to Item 7.01 of this Form 8-K and shall not be deemed “filed” for the purposes of Section 18 of the Securities Exchange Act of 1934, or incorporated by reference in any filing under the Securities Act of 1933 or the Securities Exchange Act of 1934, except as shall be expressly set forth by specific reference in such filing.
The following are unaudited pro forma condensed consolidated financial statements for the Company:
Covanta Holding Corporation
Trailing twelve months ended September 30, 2005
Unaudited pro forma condensed consolidated statements of operations
Dollar Amounts in Thousands
| | | | | | | | | | | | | | | | | | |
| | | 9 months | | | Full year | | | 9 months | | | | TTM | |
| | | Sept 2004 | | | 2004 | | | Sept 2005 | | | | Sept 2005 | |
| | | | | |
| | | | | | | | | | | | | | | | | | |
OPERATING REVENUES | | | | | | | | | | | | | | | | | |
| Waste and service revenues | | $ | 583,722 | | | $ | 779,209 | | | $ | 581,909 | | | | $ | 777,396 | |
| Energy and steam sales | | | 300,010 | | | | 398,797 | | | | 305,201 | | | | | 403,988 | |
| Other operating revenues | | | 17,717 | | | | 22,432 | | | | 13,236 | | | | | 17,951 | |
| | | | | |
Total operating revenues | | | 901,449 | | | | 1,200,438 | | | | 900,346 | | | | | 1,199,335 | |
| | | | | |
| | | | | | | | | | | | | | | | | | |
OPERATING EXPENSES | | | | | | | | | | | | | | | | | |
| Plant operating expenses | | | 503,485 | | | | 658,099 | | | | 500,096 | | | | | 654,710 | |
| Depreciation and amortization expense | | | 129,565 | | | | 173,315 | | | | 129,679 | | | | | 173,429 | |
| Net interest expense on project debt | | | 59,082 | | | | 76,960 | | | | 52,138 | | | | | 70,016 | |
| Other operating expenses | | | 11,445 | | | | 15,699 | | | | 8,255 | | | | | 12,509 | |
| General and administrative expenses | | | 54,865 | | | | 76,037 | | | | 56,047 | | | | | 77,219 | |
| | | | | |
Total operating expenses | | | 758,442 | | | | 1,000,110 | | | | 746,215 | | | | | 987,883 | |
| | | | | |
| | | | | | | | | | | | | | | | | | |
| | | | | |
Operating income | | | 143,007 | | | | 200,328 | | | | 154,131 | | | | | 211,452 | |
| | | | | |
| | | | | | | | | | | | | | | | | | |
OTHER INCOME (EXPENSE) | | | | | | | | | | | | | | | | | |
| Investment income | | | 3,895 | | | | 4,867 | | | | 4,755 | | | | | 5,727 | |
| Interest expense | | | (92,353 | ) | | | (123,339 | ) | | | (90,859 | ) | | | | (121,845 | ) |
| Gain on derivative instrument, unexercised ACL warrants | | | — | | | | — | | | | 14,796 | | | | | 14,796 | |
| | | | | |
Total other expenses | | | (88,458 | ) | | | (118,472 | ) | | | (71,308 | ) | | | | (101,322 | ) |
| | | | | |
| | | | | | | | | | | | | | | | | | |
Income before income tax expense, minority interests and equity in net income from unconsolidated investments | | | 54,549 | | | | 81,856 | | | | 82,823 | | | | | 110,130 | |
| | | | | | | | | | | | | | | | | | |
| Income tax expense | | | (25,093 | ) | | | (37,654 | ) | | | (38,849 | ) | | | | (51,410 | ) |
| Minority interest expense | | | (6,433 | ) | | | (10,291 | ) | | | (5,895 | ) | | | | (9,753 | ) |
| Equity in net income from unconsolidated investments | | | 17,262 | | | | 21,090 | | | | 20,003 | | | | | 23,831 | |
| | | | | |
| | | | | | | | | | | | | | | | | | |
Net Income — Covanta Holding Corporation | | $ | 40,285 | | | $ | 55,001 | | | $ | 58,082 | | | | $ | 72,798 | |
| | | | | |
Covanta Holding Corporation
Pro forma 9 months ended September 30, 2005
Unaudited pro forma consolidated statement of operations
Dollar Amounts in Thousands
| | | | | | | | | | | | | | | | | | | | | |
| | | | | | | | | | | Pro | | | | | | | Pro | |
| | | Covanta | | | Ref-Fuel | | | forma | | | | | | | forma | |
| | | Jan 1-Sep 30, 2005 | | | Jan 1 - June 24, 2005 | | | adjustments | | | ADJ | | | combined | |
| |
OPERATING REVENUES | | | | | | | | | | | | | | | | | | | | |
| Waste and service revenues | | $ | 433,117 | | | $ | 148,792 | | | $ | — | | | | | | | $ | 581,909 | |
| Energy and steam sales | | | 225,541 | | | | 79,660 | | | | — | | | | | | | | 305,201 | |
| Other operating revenues | | | 13,236 | | | | — | | | | — | | | | | | | | 13,236 | |
| | | |
Total operating revenues | | | 671,894 | | | | 228,452 | | | | — | | | | | | | | 900,346 | |
| | | |
| | | | | | | | | | | | | | | | | | | | | |
OPERATING EXPENSES | | | | | | | | | | | | | | | | | | | | |
| | | | | | | | | | | | | | | | | | | | | |
| Plant operating expenses | | | 393,343 | | | | 103,617 | | | | 3,136 | | | | J | | | | 500,096 | |
| Depreciation and amortization expense | | | 78,027 | | | | 57,032 | | | | (5,380 | ) | | | J | | | | 129,679 | |
| Net interest expense on project debt | | | 36,700 | | | | 13,964 | | | | 1,474 | | | | J | | | | 52,138 | |
| Other operating expenses | | | 7,736 | | | | 519 | | | | — | | | | | | | | 8,255 | |
| General and administrative expenses | | | 46,313 | | | | 52,133 | | | | (41,675 | ) | | | M | | | | 56,047 | |
| | | | | | | | | | | | (724 | ) | | | J | | | | | |
| Restructuring charges | | | 2,655 | | | | — | | | | (2,655 | ) | | | M | | | | — | |
| Acquisition-related charges | | | 2,963 | | | | — | | | | (2,963 | ) | | | M | | | | — | |
| | | |
Total operating expenses | | | 567,737 | | | | 227,265 | | | | (48,787 | ) | | | | | | | 746,215 | |
| | | |
| | | | | | | | | | | | | | | | | | | | | |
Operating income | | | 104,157 | | | | 1,187 | | | | 48,787 | | | | | | | | 154,131 | |
| | | |
| | | | | | | | | | | | | | | | | | | | | |
| Investment income | | | 3,530 | | | | 1,225 | | | | — | | | | | | | | 4,755 | |
| Interest expense | | | (59,053 | ) | | | (26,368 | ) | | | — | | | | | | | | (90,859 | ) |
| | | | | | | | | | | | 28,944 | | | | H | | | | | |
| | | | | | | | | | | | (37,362 | ) | | | I | | | | | |
| | | | | | | | | | | | 2,980 | | | | J | | | | | |
| Gain on derivative instrument, unexercised ACL warrants | | | 14,796 | | | | — | | | | — | | | | | | | | 14,796 | |
| | | |
Total other expenses | | | (40,727 | ) | | | (25,143 | ) | | | (5,438 | ) | | | | | | | (71,308 | ) |
Income tax before income taxes, minority interests and equity in net income from unconsolidated investments | | | 63,430 | | | | (23,956 | ) | | | 43,349 | | | | | | | | 82,823 | |
| | | | | | | | | | | | | | | | | | | | | |
| Income tax benefit (expense) | | | (24,008 | ) | | | 6,033 | | | | (20,874 | ) | | | K | | | | (38,849 | ) |
| Minority interest expense | | | (5,839 | ) | | | (56 | ) | | | — | | | | | | | | (5,895 | ) |
| Equity in net income from unconsolidated investments | | | 20,003 | | | | — | | | | — | | | | | | | | 20,003 | |
| | | |
| | | | | | | | | | | | | | | | | | | | | |
NET INCOME (LOSS) | | $ | 53,586 | | | $ | (17,979 | ) | | $ | 22,475 | | | | | | | $ | 58,082 | |
| | | |
Covanta Holding Corporation
Pro forma nine months ended September 30, 2004
Unaudited pro forma consolidated statement of operations
Dollar amounts in thousands
| | | | | | | | | | | | | | | | | | | | | | | | | | | | | | | | | |
| | | Jan 1 to | | | Jan 1 to | | | Jan 1 to | | | Jan 1 to | | | Jan 1 to | | | | | | | | | | | |
| | | Sep 30, 2004 | | | Mar 10, 2004 | | | Mar 10, 2004 | | | Sep 30, 2004 | | | Apr 30, 2004 | | | | | | | | | | | |
| | | | | | | | | | | Deconsolidation | | | | | | | Ref-Fuel | | | | | | | Pro | | | Pro | |
| | | | | | | Covanta | | | of Covanta Energy | | | | | | | Ownership | | | | | | | forma | | | forma | |
| | | Covanta | | | Energy | | | Entities (A) | | | Ref-Fuel | | | Changes (G) | | | ADJ | | | adjustments | | | combined | |
| |
OPERATING REVENUES | | | | | | | | | | | | | | | | | | | | | | | | | | | | | | | | |
| | | | | | | | | | | | | | | | | | | | | | | | | | | | | | | | | |
| Waste and service revenues | | $ | 260,563 | | | $ | 89,867 | | | $ | (5,282 | ) | | $ | 122,124 | | | $ | 89,496 | | | | L | | | $ | 26,954 | | | $ | 583,722 | |
| Energy and steam sales | | | 124,153 | | | | 53,307 | | | | (535 | ) | | | 58,527 | | | | 41,566 | | | | L | | | | 22,992 | | | | 300,010 | |
| Other operating revenues | | | 17,659 | | | | 58 | | | | — | | | | 5,759 | | | | 6,475 | | | | L | | | | (12,234 | ) | | | 17,717 | |
| |
Total operating revenues | | | 402,375 | | | | 143,232 | | | | (5,817 | ) | | | 186,410 | | | | 137,537 | | | | | | | | 37,712 | | | | 901,449 | |
| |
| | | | | | | | | | | | | | | | | | | | | | | | | | | | | | | | | |
OPERATING EXPENSES | | | | | | | | | | | | | | | | | | | | | | | | | | | | | | | | |
| | | | | | | | | | | | | | | | | | | | | | | | | | | | | | | | | |
| Plant operating expense | | | 241,149 | | | | 100,774 | | | | (3,632 | ) | | | 75,138 | | | | 73,322 | | | | L | | | | 11,930 | | | | 503,485 | |
| | | | | | | | | | | | | | | | | | | | | | | | J | | | | 4,804 | | | | | |
| Depreciation and amortization expenses | | | 36,784 | | | | 13,426 | | | | (786 | ) | | | 27,994 | | | | 22,842 | | | | B | | | | (12,640 | ) | | | 129,565 | |
| | | | | | | | | | | | | | | | | | | | | | | | C | | | | 8,598 | | | | | |
| | | | | | | | | | | | | | | | | | | | | | | | D | | | | 3,375 | | | | | |
| | | | | | | | | | | | | | | | | | | | | | | | L | | | | 39,631 | | | | | |
| | | | | | | | | | | | | | | | | | | | | | | | J | | | | (9,659 | ) | | | | |
| Net interest expense on project debt | | | 23,194 | | | | 13,407 | | | | (1,045 | ) | | | — | | | | — | | | | L | | | | 21,198 | | | | 59,082 | |
| | | | | | | | | | | | | | | | | | | | | | | | E | | | | (3,419 | ) | | | | |
| | | | | | | | | | | | | | | | | | | | | | | | J | | | | 5,747 | | | | | |
| Other operating expenses | | | 12,603 | | | | (2,234 | ) | | | 116 | | | | 499 | | | | 220 | | | | L | | | | 241 | | | | 11,445 | |
| General and administrative expense | | | 32,381 | | | | 7,597 | | | | (322 | ) | | | 18,722 | | | | 15,031 | | | | L | | | | (14,072 | ) | | | 54,865 | |
| | | | | | | | | | | | | | | | | | | | | | | | M | | | | (3,712 | ) | | | | |
| | | | | | | | | | | | | | | | | | | | | | | | J | | | | (760 | ) | | | | |
| |
Total operating expenses | | | 346,111 | | | | 132,970 | | | | (5,669 | ) | | | 122,353 | | | | 111,415 | | | | | | | | 51,262 | | | | 758,442 | |
| | | | | | | | | | | | | | | | | | | | | | | | | | | | | | | | | |
| |
| | | | | | | | | | | | | | | | | | | | | | | | | | | | | | | | | |
Operating income | | | 56,264 | | | | 10,262 | | | | (148 | ) | | | 64,057 | | | | 26,122 | | | | | | | | (13,550 | ) | | | 143,007 | |
| | | | | | | | | | | | | | | | | | | | | | | | | | | | | | | | | |
| Investment income | | | 2,002 | | | | 935 | | | | — | | | | 1,607 | | | | 1,022 | | | | L | | | | (1,671 | ) | | | 3,895 | |
| Interest expense | | | (33,267 | ) | | | (6,142 | ) | | | 6 | | | | (47,394 | ) | | | (21,626 | ) | | | L | | | | 22,871 | | | | (92,353 | ) |
| | | | | | | | | | | | | | | | | | | | | | | | H | | | | 44,812 | | | | | |
| | | | | | | | | | | | | | | | | | | | | | | | I | | | | (56,043 | ) | | | | |
| | | | | | | | | | | | | | | | | | | | | | | | J | | | | 4,430 | | | | | |
| Other income, net | | | — | | | | — | | | | — | | | | — | | | | — | | | | L | | | | — | | | | — | |
| Reorganization items | | | — | | | | (58,282 | ) | | | — | | | | — | | | | — | | | | F | | | | 58,282 | | | | — | |
| Fresh-start adjustments | | | — | | | | (399,063 | ) | | | — | | | | — | | | | — | | | | F | | | | 399,063 | | | | — | |
| Gain on extinguishment of debt | | | — | | | | 510,680 | | | | — | | | | — | | | | — | | | | F | | | | (510,680 | ) | | | — | |
| |
Income (loss) before income taxes, minority interests and equity in net income from unconsolidated investments | | | 24,999 | | | | 58,390 | | | | (142 | ) | | | 18,270 | | | | 5,518 | | | | | | | | (52,486 | ) | | | 54,549 | |
| | | | | | | | | | | | | | | | | | | | | | | | | | | | | | | | | |
| Income tax benefit (expense) | | | (8,436 | ) | | | (30,240 | ) | | | — | | | | — | | | | — | | | | K | | | | 13,583 | | | | (25,093 | ) |
| Minority interest expense | | | (3,922 | ) | | | (2,511 | ) | | | — | | | | — | | | | — | | | | | | | | — | | | | (6,433 | ) |
| Equity in net income (loss) from unconsolidated investments | | | 13,196 | | | | 3,924 | | | | 142 | | | | 6,148 | | | | (6,148 | ) | | | | | | | — | | | | 17,262 | |
| | | |
| | | | | | | | | | | | | | | | | | | | | | | | | | | | | | | | | |
NET INCOME (LOSS) | | $ | 25,837 | | | $ | 29,563 | | | $ | — | | | $ | 24,418 | | | $ | (630 | ) | | | | | | $ | (38,903 | ) | | $ | 40,285 | |
| | | |
Covanta Holding Corporation
Pro forma year ended December 31, 2004
Unaudited pro forma consolidated statement of operations
Dollar Amounts in thousands
| | | | | | | | | | | | | | | | | | | | | | | | | | | | | | | | | |
| | | Jan 1 to | | | Jan 1 to | | | Jan 1 to | | | Jan 1 to | | | Jan 1 to | | | | | | | | | | | |
| | | Dec 31, 2004 | | | Mar 10, 2004 | | | Mar 10, 2004 | | | Dec 31, 2004 | | | Apr 30, 2004 | | | | | | | | | | | |
| | | | | | | | | | | Deconsolidation | | | | | | | Ref-Fuel | | | Pro | | | | | | | Pro | |
| | | | | | | Covanta | | | of Covanta Energy | | | | | | | Ownership | | | forma | | | | | | | forma | |
| | | Covanta | | | Energy | | | Entities (A) | | | Ref-Fuel | | | Changes (G) | | | adjustments | | | ADJ | | | combined | |
| |
OPERATING REVENUES | | | | | | | | | | | | | | | | | | | | | | | | | | | | | | | | |
| | | | | | | | | | | | | | | | | | | | | | | | | | | | | | | | | |
| Waste and service revenues | | $ | 373,228 | | | $ | 89,867 | | | $ | (5,282 | ) | | $ | 194,950 | | | $ | 89,496 | | | $ | (7,219 | ) | | | L | | | $ | 779,209 | |
| | | | | | | | | | | | | | | | | | | | | | | | 44,169 | | | | L | | | | | |
| Energy and steam sales | | | 181,074 | | | | 53,307 | | | | (535 | ) | | | 93,188 | | | | 41,566 | | | | 59,770 | | | | L | | | | 398,797 | |
| | | | | | | | | | | | | | | | | | | | | | | | (29,573 | ) | | | L | | | | | |
| Other operating revenues | | | 22,374 | | | | 58 | | | | — | | | | 10,506 | | | | 6,475 | | | | (16,981 | ) | | | L | | | | 22,432 | |
| | | |
Total operating revenues | | | 576,676 | | | | 143,232 | | | | (5,817 | ) | | | 298,644 | | | | 137,537 | | | | 50,166 | | | | | | | | 1,200,438 | |
| | | |
| | | | | | | | | | | | | | | | | | | | | | | | | | | | | | | | | |
OPERATING EXPENSES | | | | | | | | | | | | | | | | | | | | | | | | | | | | | | | | |
| | | | | | | | | | | | | | | | | | | | | | | | | | | | | | | | | |
| Plant operating expenses | | | 349,347 | | | | 100,774 | | | | (3,632 | ) | | | 116,089 | | | | 73,322 | | | | 15,840 | | | | L | | | | 658,099 | |
| | | | | | | | | | | | | | | | | | | | | | | | 6,359 | | | | J | | | | | |
| Depreciation and amortization expense | | | 53,131 | | | | 13,426 | | | | (786 | ) | | | 45,154 | | | | 22,842 | | | | (12,640 | ) | | | B | | | | 173,315 | |
| | | | | | | | | | | | | | | | | | | | | | | | 8,598 | | | | C | | | | | |
| | | | | | | | | | | | | | | | | | | | | | | | 3,375 | | | | D | | | | | |
| | | | | | | | | | | | | | | | | | | | | | | | 59,770 | | | | L | | | | | |
| | | | | | | | | | | | | | | | | | | | | | | | (7,219 | ) | | | L | | | | | |
| | | | | | | | | | | | | | | | | | | | | | | | (12,336 | ) | | | J | | | | | |
| Net interest expense on project debt | | | 32,586 | | | | 13,407 | | | | (1,045 | ) | | | — | | | | — | | | | (2,400 | ) | | | L | | | | 76,960 | |
| | | | | | | | | | | | | | | | | | | | | | | | 30,779 | | | | L | | | | | |
| | | | | | | | | | | | | | | | | | | | | | | | (3,419 | ) | | | E | | | | | |
| | | | | | | | | | | | | | | | | | | | | | | | 7,052 | | | | J | | | | | |
| Other operating expenses | | | 16,560 | | | | (2,234 | ) | | | 116 | | | | 1,462 | | | | 220 | | | | (425 | ) | | | L | | | | 15,699 | |
| General and administrative expenses | | | 48,182 | | | | 7,597 | | | | (322 | ) | | | 30,216 | | | | 15,031 | | | | (18,634 | ) | | | L | | | | 76,037 | |
| | | | | | | | | | | | | | | | | | | | | | | | (4,949 | ) | | | M | | | | | |
| | | | | | | | | | | | | | | | | | | | | | | | (1,084 | ) | | | J | | | | | |
| | | |
Total operating expenses | | | 499,806 | | | | 132,970 | | | | (5,669 | ) | | | 192,921 | | | | 111,415 | | | | 68,667 | | | | | | | | 1,000,110 | |
| | | | | | | | | | | | | | | | | | | | | | | | | | | | | | | | | |
| | | |
| | | | | | | | | | | | | | | | | | | | | | | | | | | | | | | | | |
Operating income | | | 76,870 | | | | 10,262 | | | | (148 | ) | | | 105,723 | | | | 26,122 | | | | (18,501 | ) | | | | | | | 200,328 | |
| | | | | | | | | | | | | | | | | | | | | | | | | | | | | | | | | |
| Investment income | | | 2,343 | | | | 935 | | | | — | | | | 2,967 | | | | 1,022 | | | | (2,400 | ) | | | L | | | | 4,867 | |
| Interest expense | | | (43,739 | ) | | | (6,142 | ) | | | 6 | | | | (69,219 | ) | | | (21,626 | ) | | | 30,779 | | | | L | | | | (123,339 | ) |
| | | | | | | | | | | | | | | | | | | | | | | | 55,400 | | | | H | | | | | |
| | | | | | | | | | | | | | | | | | | | | | | | (74,724 | ) | | | I | | | | | |
| | | | | | | | | | | | | | | | | | | | | | | | 5,926 | | | | J | | | | | |
| Reorganization items | | | — | | | | (58,282 | ) | | | — | | | | — | | | | — | | | | 58,282 | | | | F | | | | — | |
| Fresh-start adjustments | | | — | | | | (399,063 | ) | | | — | | | | — | | | | — | | | | 399,063 | | | | F | | | | — | |
| Gain on extinguishment of debt | | | — | | | | 510,680 | | | | — | | | | — | | | | — | | | | (510,680 | ) | | | F | | | | — | |
| | | |
Income (loss) before income taxes, minority interests and equity in net income from unconsolidated investments | | | 35,474 | | | | 58,390 | | | | (142 | ) | | | 39,471 | | | | 5,518 | | | | (56,855 | ) | | | | | | | 81,856 | |
| | | | | | | | | | | | | | | | | | | | | | | | | | | | | | | | | |
| Income tax benefit (expense) | | | (11,535 | ) | | | (30,240 | ) | | | — | | | | (17,818 | ) | | | — | | | | 21,939 | | | | K | | | | (37,654 | ) |
| Minority interest expense | | | (6,869 | ) | | | (2,511 | ) | | | — | | | | (12,283 | ) | | | 11,372 | | | | — | | | | | | | | (10,291 | ) |
| Equity in net income (loss) from unconsolidated investments | | | 17,024 | | | | 3,924 | | | | 142 | | | | 6,148 | | | | (6,148 | ) | | | — | | | | | | | | 21,090 | |
| | | |
| | | | | | | | | | | | | | | | | | | | | | | | | | | | | | | | | |
NET INCOME | | $ | 34,094 | | | $ | 29,563 | | | $ | — | | | $ | 15,518 | | | $ | 10,742 | | | $ | (34,916 | ) | | | | | | $ | 55,001 | |
| | | |
UNAUDITED PRO FORMA CONDENSED CONSOLIDATED FINANCIAL STATEMENTS
The results of Covanta Holding Corporation (“Covanta”) (formerly Danielson Holding Corporation) for the period ended September 30, 2005 are not representative of Covanta’s ongoing results as Covanta includes the results of Covanta Energy Corporation (“Covanta Energy”) subsequent to March 10, 2004, the date it emerged from bankruptcy and was acquired by Covanta, and includes the results of Covanta ARC Holdings Corp. (“Ref-Fuel”) (formerly American Ref-Fuel Holdings Corp.) subsequent to June 24, 2005, the date it was acquired by Covanta.
Covanta believes that an understanding of its results, trends and ongoing performance is enhanced by presenting results on a pro forma basis assuming that the acquisitions of Covanta Energy and Ref-Fuel both occurred on January 1, 2004 adjusted for events that are (i) directly attributable to the transactions, (ii) expected to have continuing impact, and (iii) factually supportable.
The following unaudited pro forma condensed consolidated financial statements for the twelve month period ended September 30, 2005, the year ended December 31, 2004, the nine months ended September 30, 2004 and the nine months ended September 30, 2005, are based on the historical financial statements of Covanta, Covanta Energy, Ref-Fuel and Covanta Ref-Fuel Holdings LLC (formerly Ref-Fuel Holdings LLC).
The unaudited pro forma condensed consolidated financial information should be read in conjunction with:
| | • | | Accompanying notes to the unaudited pro forma condensed consolidated financial statements; |
| |
| | • | | Covanta Energy’s separate historical financial statements (i) as of and for the year ended December 31, 2004 included in Covanta Energy’s Annual Report on Form 10-K, as amended and (ii) as of and for the nine months ended September 30, 2004 included in Covanta Energy’s Quarterly Report on Form 10-Q for the quarter ended September 30, 2004; |
| |
| | • | | Covanta’s separate historical financial statements (i) as of and for the year ended December 31, 2004 included in Covanta’s Annual Report on Form 10-K, as amended, and (ii) as of and for the nine months ended September 30, 2004 included in Covanta’s Quarterly Report on Form 10-Q for the quarter ended September 30, 2004 and (iii) as of and for the nine months ended September 30, 2005 included in Covanta’s Quarterly Report on Form 10-Q for the quarter ended September 30, 2005; and |
| |
| | • | | Ref-Fuel’s separate historical financial statements as of and for the year ended December 31, 2004 included in Covanta’s Current Report on Form 8-K dated April 7, 2005. |
Pro formaadjustments relating to the acquisition of Covanta Energy
| A. | | The “Deconsolidation of Covanta Entities” column of the unaudited pro forma condensed consolidated statements of operations pertains to six of Covanta Energy’s subsidiaries which had not reorganized or filed a liquidation plan under Chapter 11 of the United States Bankruptcy Code as of March 10, 2004. For the 2004 pro forma period presented, these entities were not consolidated because Covanta did not control these debtors or the ultimate outcome of their respective Chapter 11 cases. The subsidiaries related to the Tampa Bay desalination and Lake County waste-to-energy projects emerged from Chapter 11 on August 6, 2004 and December 14, 2004, respectively, when they were reconsolidated. |
| |
| B. | | To reverse Covanta Energy’s historical depreciation and amortization expense, for the period January 1, 2004 to March 10, 2004. |
| |
| C. | | To include pro forma depreciation expense based on fair values assigned to Covanta Energy’s property, plant and equipment for the period January 1, 2004 to March 10, 2004. The weighted average remaining useful life of property, plant and equipment acquired in the Covanta Energy acquisition was approximately 19 years, consisting principally of energy facilities and buildings with a weighted average remaining useful life of approximately 21 years, and machinery and |
| | | equipment with a weighted average remaining useful life of approximately 13 years. |
| |
| D. | | To include pro forma amortization expense based on fair values assigned to Covanta Energy’s acquired intangible assets for the period January 1, 2004 to March 10, 2004, primarily service agreements on publicly owned waste-to-energy projects. |
| |
| E. | | To reverse Covanta Energy’s historical amortization of bond issuance costs ($0.8 million) on outstanding project debt and include pro forma amortization of the premium on project debt ($2.6 million) based on fair values assigned to Covanta Energy’s project debt, for the period January 1, 2004 to March 10, 2004. |
| |
| F. | | To remove historical reorganization items, fresh-start adjustments and the gain on extinguishment of debt resulting from Covanta Energy’s bankruptcy proceedings. Since the pro forma condensed statement of combined operations has been prepared on the basis that Covanta Energy’s emergence from bankruptcy and the business combination with Covanta both occurred on January 1, 2004, these items have been removed, as these transactions to effect Covanta Energy’s reorganization would have been completed and these items would have been recorded prior to January 1, 2004. |
Pro forma adjustments relating to the acquisition of Ref-Fuel
| G. | | On April 30, 2004, Ref-Fuel entered into a series of transactions (“Equalization Transactions”) that changed its ownership structure. As a result of the Equalization Transactions, Ref-Fuel gained control of MSW Energy Holdings LLC, together with MSW Energy Holdings II LLC (a wholly-owned subsidiary of Ref-Fuel) on a combined basis, which owned substantially all interests in Covanta Ref-Fuel Holdings LLC. Covanta Ref-Fuel Holdings LLC is a holding company with a 100% membership interest in Covanta ARC LLC (formerly American Ref-Fuel Company LLC), which through subsidiaries, owns and operates six waste-to-energy facilities in the United States. As a result of the Equalization Transactions, Ref-Fuel had effective control of Covanta Ref-Fuel Holdings LLC, and therefore began consolidating its results of operations from May 1, 2004. |
| |
| | | The “Ref-Fuel Ownership Changes” column of the unaudited pro forma condensed consolidated statement of operations for the year-ended December 31, 2004 pertains to entities that were not consolidated by Ref-Fuel until ownership interests changed effective April 30, 2004 (the Equalization Transactions described above). Ref-Fuel reported its 50% share of earnings from its investment in Covanta Ref-Fuel Holdings LLC under the equity method from January 1, 2004 to April 30, 2004 (four month period) and consolidated such operations from May 1, 2004 to December 31, 2004 (eight month period). In addition, as a result of the Equalization Transactions, Ref-Fuel obtained a 0.01% interest and was named managing member of MSW Energy Holdings LLC and began consolidating its operations as of April 30, 2004. On August 31, 2004, in another transaction, Ref-Fuel acquired the 99.99% non-managing interests in MSW Energy Holdings LLC. As a result, Ref-Fuel owned 100% of the interests in MSW Energy Holdings LLC after that date. |
| |
| | | This column reverses the impact of accounting under the equity method for the investment in Covanta Ref-Fuel Holdings LLC for the four month period ended April 30, 2004, and reflects the results of operations as if they had been consolidated as of January 1, 2004. In addition, this column reflects the results of operations for MSW Energy Holdings LLC as if Ref-Fuel had owned a 100% interest in MSW Energy Holdings LLC as of January 1, 2004, which includes reversing the minority interest relating to MSW Energy Holdings LLC for the period of May 1, 2004 through August 31, 2004. |
| |
| H. | | Covanta Energy entered into new credit arrangements (“the Debt Financing Package”) as part of the Ref-Fuel acquisition which were assumed to have occurred as of January 1, 2004 on a pro forma basis. |
| | | To reverse historical interest expense (including letter of credit fees) associated with recourse debt and unfunded credit facilities refinanced with the Debt Financing Package, the net proceeds from a rights offering undertaken by Covanta during the second quarter of 2005 as part of the financing of the Ref-Fuel acquisition, the interest expense related to Ref-Fuel’s $40 million, 9% interest senior notes contributed by Ref-Fuel’s members as a result of the August 31, 2004 transactions, and the interest expense related to the Mecklenburg bridge loan (dollars in thousands). |
| | | | | | | | | | | | | | | | | |
| | | 9 months | | | 9 months | | | Full Year | | | TTM | |
| | | Sept. 2005 | | | Sept. 2004 | | | 2004 | | | Sept. 2005 | |
| | | |
| Covanta Energy recourse debt (January 1 to March 10, 2004) | | $ | — | | | $ | 6,142 | | | $ | 6,142 | | | $ | — | |
| Covanta recourse debt (January 1 to December 31, 2004) | | | — | | | | 9,033 | | | | 9,033 | | | | — | |
| Covanta Energy recourse debt and credit facilities | | | 28,352 | | | | 24,234 | | | | 34,706 | | | | 38,824 | |
| Ref-Fuel credit facilities | | | 592 | | | | 316 | | | | 432 | | | | 708 | |
| Ref-Fuel senior notes & Mecklenburg bridge | | | — | | | | 5,087 | | | | 5,087 | | | | — | |
| | | |
| Total | | $ | 28,944 | | | $ | 44,812 | | | $ | 55,400 | | | $ | 39,532 | |
| | | |
| I. | | To include pro forma interest expense based on the Debt Financing Package (dollars in thousands). |
| | | | | | | | | | | | | | | | | | | | | | | | | |
| | | Principal | | | Rate | | 9 months | | | 9 Months | | | Full Year | | | LTM | |
| | | | | | | | | Sept. 2005 | | | Sept. 2004 | | | 2004 | | | Sept. 2005 | |
| | | |
| Borrowings: | | | | | | | | | | | | | | | | | | | | | | | | |
| First Lien Facility | | $ | 275,000 | | | | 7.07 | % | | $ | 9,721 | | | $ | 14,582 | | | $ | 19,443 | | | $ | 14,582 | |
| Second Lien Facility | | | 100,000 | | | | 9.57 | % | | | 4,785 | | | | 7,177 | | | | 9,570 | | | | 7,178 | |
| Second Lien Facility | | | 60,000 | | | | 9.77 | % | | | 2,932 | | | | 4,398 | | | | 5,863 | | | | 4,397 | |
| Second Lien Facility | | | 240,000 | | | | 9.78 | % | | | 11,736 | | | | 17,604 | | | | 23,472 | | | | 17,604 | |
| | | |
| | | | | | | | | | | | | | | | | | | | | | | | | |
| Total Borrowings | | $ | 675,000 | | | | | | | $ | 29,174 | | | $ | 43,761 | | | $ | 58,348 | | | $ | 43,761 | |
| Available for letters of credit and revolving credit: | | | | | | | | | | | | | | | | | | | | | | | | |
| Letter of credit availability under First | | $ | 340,000 | | | | 3 | % | | $ | 5,100 | | | $ | 7,650 | | | $ | 10,200 | | | $ | 7,650 | |
| Lien Facility | | | | | | | | | | | | | | | | | | | | | | | | |
| Revolving credit facility* | | | 100,000 | | | | 0.5 | % | | | 250 | | | | 375 | | | | 500 | | | | 375 | |
| | | |
| Total unfunded | | $ | 440,000 | | | | | | | $ | 5,350 | | | $ | 8,025 | | | $ | 10,700 | | | $ | 8,025 | |
| Amortization of Debt Financing | | | | | | | | | | | 2,838 | | | | 4,257 | | | | 5,676 | | | | 4,257 | |
| Package financing costs | | | | | | | | | | | | | | | | | | | | | | | | |
| | | | | | | | | | | |
| Total | | | | | | | | | | $ | 37,362 | | | $ | 56,043 | | | $ | 74,724 | | | $ | 56,043 | |
| | | | | | | | | | | |
(*) Available for up to $75 million of letters of credit as an alternative to borrowings. This facility remains unused.
Interest rates under the Debt Financing Package are based on the three month London InterBank Offering Rate (“LIBOR”) plus a margin of 3.00% for the First Lien Facility and 5.50% for the Second Lien Facility. The rates used to determine the pro forma adjustments above were selected with regard to Covanta’s current credit ratings and the three month LIBOR rate of 4.07% used for the October through December 2005 payment period.
| J. | | To record the difference between the preliminary estimates of the fair values and the historical amounts of Ref-Fuel’s assets and debt assumed by Covanta Energy on June 24, 2005, the date Covanta acquired Ref-Fuel, and the related impacts on depreciation, amortization, and interest |
| | | expense as if the acquisition had occurred on January 1, 2004. The fair value of contract related assets (classified as intangible assets, net) were attributable to revenue arrangements for which the contractual rates were greater than the market rates. The fair value of contract-related liabilities (classified as other liabilities) were attributable to revenue arrangements for which contractual rates were less than the market rates. |
Other adjustments
| K. | | To record the estimated income tax effects associated with the pro forma adjustments to pre-tax income other than item (g) to arrive at a blended assumed effective tax rate of 46% and 47% for the combined company for the nine months ended September 30, 2004 and the nine months ended September 30, 2005, respectively. |
| |
| L. | | Represents the reclassification of certain amounts among revenue and expense categories to conform Ref-Fuel’s historical presentation to Covanta’s policies. These reclassifications consisted of the following: |
| | • | | Reclassification of the amortization of waste and energy contracts from revenue and expense to depreciation and amortization; |
| |
| | • | | Other revenues, which primarily consisted of sales of scrap metals, were reclassified from other revenues into waste and service revenues; |
| |
| | • | | Certain costs associated with operating facilities and TransRiver were reclassified from general and administrative expenses into plant operating expenses; |
| |
| | • | | Reimbursements from certain municipal clients for operating expenses were reclassified from revenues to reductions of operating expenses; |
| |
| | • | | Reductions of revenues shared with certain municipal customers for energy produced were reclassified from waste and service revenues to energy revenues; and |
| |
| | • | | Other minor miscellaneous reclassifications were also made. |
| M. | | Represents costs related to Ref-Fuel’s officers that were terminated in connection with the transaction as well as transaction related costs incurred by Ref-Fuel as follows (dollars in thousands): |
| | | | | | | | | | | | | | | | | |
| | | Nine months Sept. | | | Nine months Sept. | | | Full year | | | LTM Sept. | |
| | | 2005 | | | 2004 | | | 2004 | | | 2005 | |
| | | |
| Transaction costs | | $ | 12,150 | | | $ | — | | | $ | — | | | $ | 12,150 | |
| Executive severance | | | 25,730 | | | | — | | | | — | | | | 25,730 | |
| Executive compensation | | | 3,795 | | | | 3,712 | | | | 4,949 | | | | 5,032 | |
| | | |
| | | $ | 41,675 | | | $ | 3,712 | | | $ | 4,949 | | | $ | 42,912 | |
| | | |
| | | Additionally, Covanta’s September 30, 2005 financial statements reflect charges of $2.7 million and $3.0 million related to restructuring and integration expenses, respectively. |
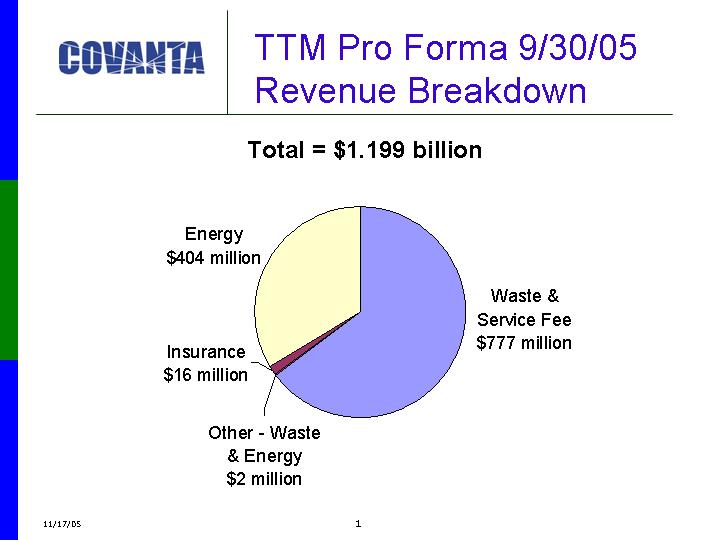
| TTM Pro Forma 9/30/05 Revenue Breakdown Total = $1.199 billion Exhibit 7 |
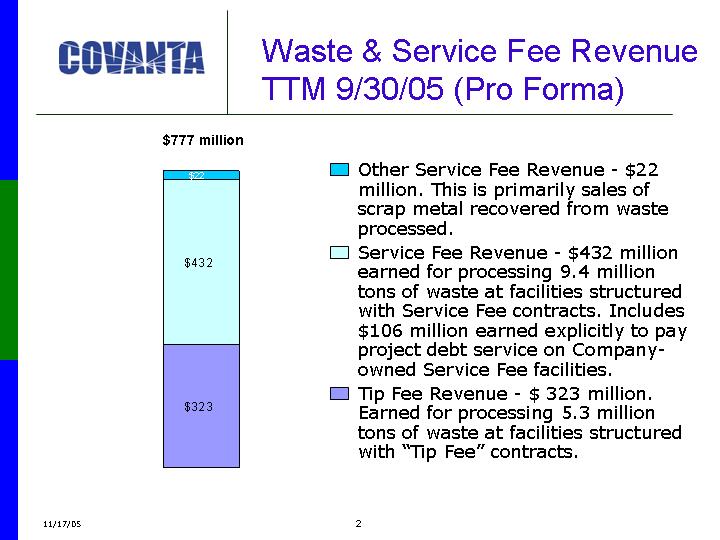
| Waste & Service Fee Revenue TTM 9/30/05 (Pro Forma) Other Service Fee Revenue - $22 million. This is primarily sales of scrap metal recovered from waste processed. Service Fee Revenue - $436 million earned for processing 9.4 million tons of waste at facilities structured with Service Fee contracts. Includes $110 million earned explicitly to pay project debt service on Company- owned Service Fee facilities. Tip Fee Revenue - $ 323 million. Earned for processing 5.3 million tons of waste at facilities structured with "Tip Fee" contracts. $781 million Exhibit 8 |
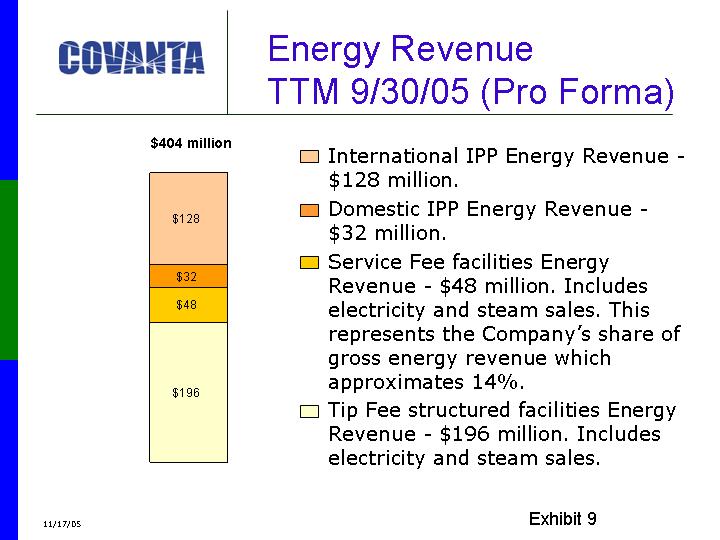
| Energy Revenue TTM 9/30/05 (Pro Forma) International IPP Energy Revenue - $128 million. Domestic IPP Energy Revenue - $32 million. Service Fee facilities Energy Revenue - $48 million. Includes electricity and steam sales. This represents the Company's share of gross energy revenue which approximates 14%. Tip Fee structured facilities Energy Revenue - $196 million. Includes electricity and steam sales. $404 million Exhibit 9 |
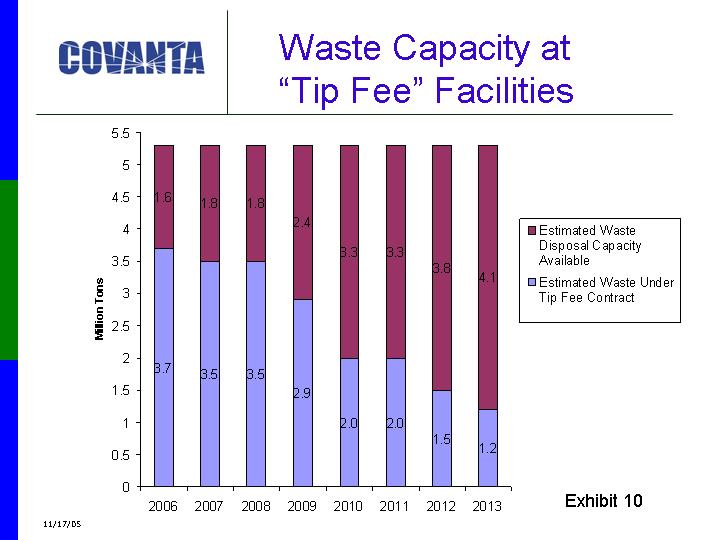
| Waste Capacity at "Tip Fee" Facilities Exhibit 10 |
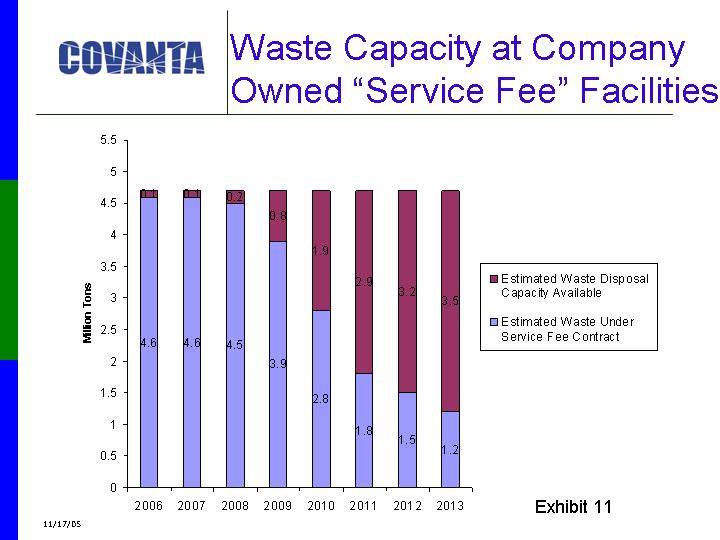
| Waste Capacity at Company Owned "Service Fee" Facilities Exhibit 11 |

| Estimated Waste Under Service Fee Contract - Operated Facilities Exhibit 12 |

| Megawatts Under Contract - "Tip Fee" Facilities Exhibit 13 |

| Megawatts Under Contract - "Service Fee" Owned & Long- term Lease Facilities Exhibit 14 |
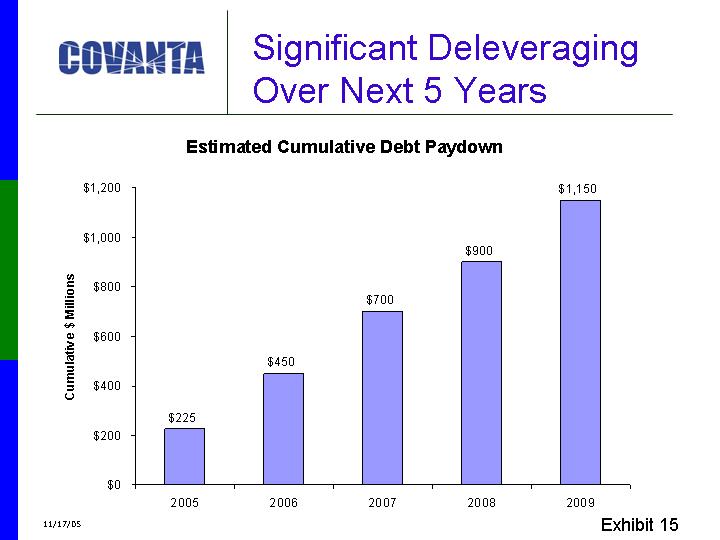
| Significant Deleveraging Over Next 5 Years Exhibit 15 |
Item 9.01. Financial Statements and Exhibits.
(a) Financial Statements of Business Acquired — Not Applicable
(b) Pro Forma Financial Information — Not Applicable
(c) Exhibits
| | | |
| Exhibit No. | | Exhibit |
| 99.1 | | Press Release, dated November 17, 2005. |
SIGNATURES
Pursuant to the requirements of the Securities Exchange Act of 1934, the Registrant has duly caused this report to be signed on its behalf by the undersigned thereunto duly authorized.
Date: November 17, 2005
COVANTA HOLDING CORPORATION
(Registrant)
| | | |
| By: | | /s/ Timothy J. Simpson |
| | | |
| Name: | | Timothy J. Simpson |
| Title: | | Senior Vice President, General Counsel and Secretary |
COVANTA HOLDING CORPORATION
EXHIBIT INDEX
| | | |
| Exhibit No. | | Exhibit |
| | | |
| 99.1 | | Press Release, dated November 17, 2005. |