| | |
| UNITED STATES |
| SECURITIES AND EXCHANGE COMMISSION |
| Washington, D.C. 20549 |
| |
| FORM N-CSR |
| |
| CERTIFIED SHAREHOLDER REPORT OF REGISTERED |
| MANAGEMENT INVESTMENT COMPANIES |
| |
| Investment Company Act file number: (811- 02796) |
| |
| Exact name of registrant as specified in charter: | Putnam High Yield Trust | |
| |
| Address of principal executive offices: One Post Office Square, Boston, Massachusetts 02109 |
| | |
| Name and address of agent for service: | Beth S. Mazor, Vice President |
| | One Post Office Square |
| | Boston, Massachusetts 02109 |
| | |
| Copy to: | John W. Gerstmayr, Esq. |
| | Ropes & Gray LLP |
| | 800 Boylston Street |
| | Boston, Massachusetts 02199-3600 |
| | |
| Registrant’s telephone number, including area code: | (617) 292-1000 | |
| | | |
| Date of fiscal year end: August 31, 2010 | | |
| |
| Date of reporting period: September 1, 2009 — August 31, 2010 |
Item 1. Report to Stockholders:
The following is a copy of the report transmitted to stockholders pursuant to Rule 30e-1 under the Investment Company Act of 1940:

Putnam
High Yield
Trust
Annual report
8 | 31 | 10
| | | |
| Message from the Trustees | 1 | | |
| | |
| About the fund | 2 | | |
| | |
| Performance snapshot | 4 | | |
| | |
| Interview with your fund’s portfolio manager | 5 | | |
| | |
| Your fund’s performance | 10 | | |
| | |
| Your fund’s expenses | 13 | | |
| | |
| Terms and definitions | 15 | | |
| | |
| Trustee approval of management contract | 16 | | |
| | |
| Other information for shareholders | 20 | | |
| | |
| Financial statements | 21 | | |
| | |
| Federal tax information | 60 | | |
| | |
| Shareholder meeting results | 61 | | |
| | |
| About the Trustees | 62 | | |
| | |
| Officers | 64 | | |
| | |
Message from the Trustees
Dear Fellow Shareholder:
More than two years have passed since the global financial crisis reached its peak in September 2008. Although conditions have improved since then, investors find themselves in uncertain territory again today. And while the economic recovery has been painfully slow, corporate America is showing signs of health. Companies have posted impressive earnings results this year and have taken advantage of low interest rates to gain more financial flexibility going forward.
We believe Putnam’s risk-focused, active-management approach is well-suited for pursuing opportunities for shareholders in today’s volatile investment environment. Compared with 2009’s bull market, times like these require a greater degree of investment analysis and security-selection skill.
In developments affecting oversight of your fund, Barbara M. Baumann has been elected to the Board of Trustees of the Putnam Funds, effective July 1, 2010. Ms. Baumann is president and owner of Cross Creek Energy Corporation of Denver, Colorado, a strategic consultant to domestic energy firms and direct investor in energy assets. We also want to thank Elizabeth T. Kennan, who has retired from the Board of Trustees, for her many years of dedicated and thoughtful leadership.
Lastly, we would like to take this opportunity to welcome new shareholders to the fund and to thank all of our investors for your continued confidence in Putnam.

About the fund
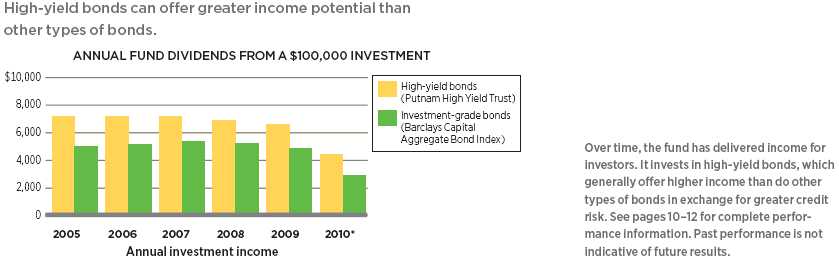
A disciplined approach to seeking high current income and capital growth
Unlike most types of fixed-income investments, high-yield bonds are more influenced by the performance of issuing companies than by interest rates. For this reason, distinguishing between opportunities and pitfalls in the high-yield bond market requires a rigorous selection process. With Putnam High Yield Trust, this process is highlighted by exhaustive research, investment diversifi cation, and timely portfolio adjustments.
Because of the risks of high-yield bond investing, in-depth credit research is essential. The fund’s research team — more than 20 professionals, including analysts who specialize in different industry sectors — visits with the management of issuing companies and analyzes each company’s profitability and capital structure. The team then considers this information in the context of the bond’s total return profile before deciding whether it is an appropriate investment for the fund.
The fund’s portfolio typically consists of bonds issued by a broad range of companies. Holdings are diversifi ed across industry sectors and among bonds with different credit ratings. While the fund invests primarily in the bonds of U.S. companies, its diversified approach allows it to include foreign bonds as w ell. Among these securities, investments in emerging-market bonds can enhance the fund’s appreciation potential. The fund also invests in convertible securities as well as bank loans. Although diversification does not ensure a profit or protect against a loss and it is possible to lose money in a diversifi ed portfolio, the fund’s diversification can help reduce the volatility that typically comes with higher-risk investments.
As the bond markets shift over time, the fund’s portfolio managers look for ways to capitalize on developments that aff ect fixed-income securities in general and high-yield bonds in particular. For example, if credit spreads widen and prices of lower-rated securities decline, the managers may look to take advantage of the improved valuation of higher-risk securities. Conversely, if the portfolio managers believe that credit risk is likely to pick up or volatility is likely to increase, they may look to reduce risk in the portfolio.
Consider these risks before investing: Lower-rated bonds may offer higher yields in return for more risk. The use of derivatives involves special risks and may result in losses. Funds that invest in bonds are subject to certain risks including interest-rate risk, credit risk, and inflation risk. As interest rates rise, the prices of bonds fall. Long-term bonds are more exposed to interest-rate risk tha n short-term bonds. Unlike bonds, bond funds have ongoing fees and expenses.
What makes a bond “high yield”?
High-yield bonds are fixed-income investments typically issued by companies that lack an established earnings track record or a solid credit history. In general, high-yield bonds offer higher interest rates than investment-grade bonds to compensate for their increased risk. Because of this added risk, these bonds are typically rated below investment grade by an independent rating agency (for example, the lowest Moody’s Investors Service rating of investment-grade bonds is Baa). The lower the rating, the greater the possibility that a bond ’s issuer will be unable to make interest payments or repay the principal.
Bond ratings
| | | |
| Moody’s | Grade | | |
| Aaa | Investment | | |
| | |
| Aa, A | Investment | | |
| | |
| Baa | Investment | | |
| | |
| Ba, B | High yield | | |
| | |
| Caa/Ca | High yield | | |
| | |
| C | High yield | | |
| | |
* Through 8/31/10.
Chart based on net asset value (NAV).
Current performance may be lower or higher than the quoted past performance, which cannot guarantee future results. Share price, principal value, and return will fluctuate, and you may have a gain or a loss when you sell your shares. Performance of class A shares assumes reinvestment of distributions and does not account for taxes. Fund returns in the bar chart do not reflect a sales charge of 4.00%; had they, returns would have been lower. See pages 5 and 10–12 for additional performance information. For a portion of the periods, the fund had expense limitations, without which returns would have been lower. A short-term trading fee of 1% may apply to redemptions or exchanges from certain funds within the time period specified in the fund’s prospectus. To obtain the most recent month-end performance, visit putnam.com.
* The fund’s benchmark, the JPMorgan Developed High Yield Index, was introduced on 12/31/94, which post-dates the inception of the fund’s class A shares.
4
Interview with your fund’s portfolio manager
Paul Scanlon
Paul, there’s been quite a bit of uncertainty in the air this year regarding the economy and the markets. How did the fund perform over the past 12 months?
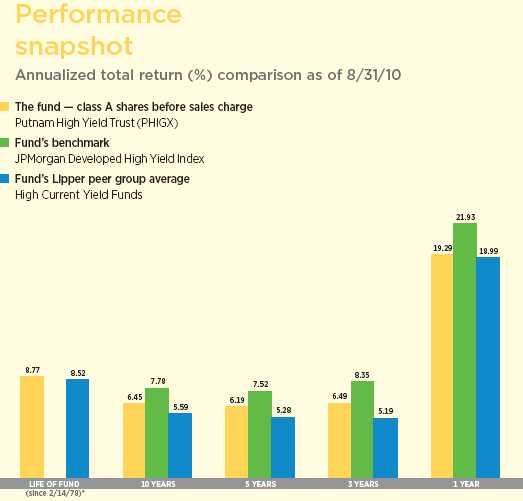
For the fiscal year ended August 31, 2010, Putnam High Yield Trust’s class A shares returned 19.29% at net asset value. The fund’s benchmark, the JPMorgan Developed High Yield Index, returned 21.93%, while the average fund in the Lipper High Current Yield Funds category returned 18.99%.
Although there has been concern about the macroeconomic picture in the United States, the past year generally has been positive for corporations and for the high-yield market. In fact, from a total return perspective, 2009 was one of the best years on record for high-yield bonds. That trend generally continued in 2010 as investors continued to migrate to the asset class, heartened by the stabilizing economy and improving corporate business fundamentals. Productivity is high across a number of industries, and corporations today are sitting on record amounts of cash. Although consumer spending and high unemployment remain areas of concern, we believe businesses in general are in significantly better financial condition now than they were 12 months ago — and this has acted as significant tail wind for the high-yield market. With interest rates at historic lows, companies also have been able to refinance their existing debt by issuing new bonds at lower prevailing rates, bolstering their balance sheets.
There were some bumps along the road, however. In early 2010, investors faced new concerns over the European debt crisis and fears that it might derail the global economic recovery. Investors were also uncertain about the inevitable withdrawal of stimulus funds around the globe, and how this process would affect economic growth. Looking back at the
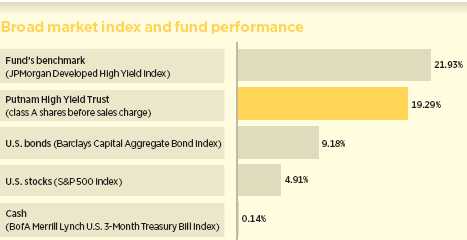
This comparison shows your fund’s performance in the context of broad market indexes for the 12 months ended 8/31/10. See pages 4 and 10–12 for additional fund performance information. Index descriptions can be found on page 15.
5
year as a whole, the first six months were very strong for the fund and the high-yield bond markets in general, while the second half of the fiscal year was positive, but the environment was somewhat more mixed.
How did you position the fund during the period, and how did that positioning affect returns?
At the beginning of the fund’s fiscal year, the portfolio had been positioned with a bias toward bonds with higher credit qualities. This positioning proved to be a bit of a drag on relative performance as lower-rated securities rallied sharply during the first half of the fund’s fiscal year. In the second half, those same lower-rated bonds gave back some of their earlier gains. For the most part, we continue to focus on letting issuer and security-specific decisions act as the main drivers of performance.
From an industry standpoint, one of the primary reasons for our underperformance of the benchmark was our decision to underweight the financials sector. After the credit crisis in 2008–2009, a large number of financial institutions were downgraded and entered the high-yield sector as a result. Part of many financial firms’ business models is to borrow money at a low rate and lend or invest it at a higher rate. Because the financial companies in which the fund could potentially invest had higher capital costs than their investment-grade counterparts — which put them at a competitive disadvantage — we were underweight in the sector. As the economy stabilized, many of these financial firms rebounded, and our underweight position detracted from relative returns. We believe there now is better visibility in the sector and have recently been increasing our exposure.
With regard to other sectors, we have been adding more cyclical exposure to the portfolio and are currently overweight to the consumer products, information technology, and metals/mining sectors. All three sectors contributed positively to returns over the past 12 months, particularly the fund’s metals and mining holdings. Commodities sold off dramatically at the beginning of the period given fears

Credit qualities are shown as a percentage of net assets as of 8/31/10. A bond rated Baa or higher (Prime-3 or higher, for short-term debt) is considered investment grade. The chart reflects Moody’s ratings; percentages may include bonds or derivatives not rated by Moody’s but rated by Standard & Poor’s or, if unrated by S&P, by Fitch, and then included in the closest equivalent Moody’s rating. Ratings will vary over time.
Credit quality includes bonds and represents only the fixed-income portion of the portfolio. Derivative instruments, including currency forwards, are only included to the extent of any unrealized gain or loss on such instruments and are shown in the not-rated category. The fund itself has not been rated by an independent rating agency.
6
of a deep and prolonged global economic slowdown. Prices have recovered steadily throughout the year, and the fund’s exposure to companies in the sector helped returns.

What specific investment opportunities are you finding within the sectors you mentioned?
Our investment process relies heavily on fundamental research and bottom-up security selection to lead us to the holdings we add to the portfolio. That said, there are a handful of themes where we’ve been finding opportunities. Some of the new issuance companies use to refinance existing debt is secured, meaning the downside risk of default, for example is often limited while the spreads offered are still attractive. We’re also looking at asset plays as an area that can add value. Over the next two years, we expect significant merger and acquisition activity, and we factor possible takeovers into our valuations of individual securities. Finally, we’re seeing a number of opportunities in “stressed” securities, especially in the bank loan market.
Which positions contributed the most to performance over the period?
The chemicals industry was a strong performer for the fund, due mostly to our overweight position in LyondellBasell, a multinational petrochemical company. Lyondell reported recent earnings results that came in well ahead of most estimates after successfully taking advantage of strong demand and unusually light supply in a number of key markets. Cash flows were particularly strong, aided by very good working capital performance. Having an underweight position in CIT, a middle-market lender and bank holding company, also helped relative performance. CIT emerged from bankruptcy in December 2009, but it’s been a slow road to recovery for the company. With

This table shows the fund’s top 10 holdings and the percentage of the fund’s net assets that each represented as of 8/31/10. Short-term holdings are excluded. Holdings will vary over time.
7
the company’s future still uncertain, we kept our exposure to a minimum. That decision proved beneficial to relative performance as the company’s bonds subsequently declined.
What were some holdings that held back performance?
Some of the biggest detractors from relative returns were bonds that we didn’t own or to which we had limited exposure. One example was Residential Capital [ResCap], the residential mortgage subsidiary of GMAC Financial Services. These bonds declined significantly as the subprime mortgage crisis unfolded in 2008 and early 2009, but went on to rebound sharply after a massive cash infusion from the federal government. The fund’s lack of exposure to U.S. Airways and UAL, the holding company for United Airlines, also detracted from relative returns. With the economy on somewhat better footing, airlines have benefited from increased travel, relatively stable fuel prices, and higher booking rate s, often through surcharges such as baggage fees. Because we believe there are some significant structural challenges facing the airline industry — particularly among the legacy carriers like United and U.S. Airways —we minimized the fund’s exposure.
What’s your outlook for the fund and the high-yield market?
Even after enjoying a strong run in the past year, high-yield spreads remain attractive based on historical averages. We also have a

This chart shows how the fund’s credit quality has changed over the past six months. Credit qualities are shown as a percentage of net assets. A bond rated Baa or higher (Prime-3 or higher, for short-term debt) is considered investment grade. The chart reflects Moody’s ratings; percentages may include bonds or derivatives not rated by Moody’s but rated by Standard & Poor’s or, if unrated by S&P, by Fitch, and then included in the closest equivalent Moody’s rating. Ratings will vary over time.
Credit quality includes cash bonds and cash, and represents only the fixed-income portion of the portfolio. Derivative instruments, including currency forwards, are only included to the extent of any unrealized gain or loss on such instruments. Rated derivatives are shown in the applicable Moody’s category. Unrated derivatives are shown in the not-rated category. If the aggregate market value of unrated cash bonds plus unrealized losses on unrated derivatives is negative, the sum will be expressed as 0.0% for the not-rated category.
8
positive outlook for business fundamentals for high-yield companies. Our view is that we will continue to see a moderate recovery and, as I mentioned earlier, we believe corporations are not necessarily dependent on accelerating growth to post strong earnings. Default rates have already decreased measurably, and we believe they will continue to remain below historic averages.
Looking ahead, we plan to continue to maintain a broadly diversified portfolio, with investments chosen for issuer-specific reasons, targeting the areas of a company’s capital structure for the best balance between risk and return. As the high-yield market returns to normal, credit research and analysis will become particularly influential in determining relative performance. I continue to believe the high-yield market and the fund are attractive means for tapping into the considerable investment opportunities within the corporate landscape today.
Thank you, Paul, for your time and insights.
The views expressed in this report are exclusively those of Putnam Management. They are not meant as investment advice.
Please note that the holdings discussed in this report may not have been held by the fund for the entire period. Portfolio composition is subject to review in accordance with the fund’s investment strategy and may vary in the future. Current and future portfolio holdings are subject to risk.

Portfolio Manager Paul Scanlon is Team Leader of U.S. High Yield at Putnam. He has an M.B.A. from The University of Chicago Booth School of Business and a B.A. from Colgate University. A CFA charterholder, Paul joined Putnam in 1999 and has been in the investment industry since 1986.
In addition to Paul, your fund’s portfolio managers are Norman Boucher and Robert Salvin.
IN THE NEWS
The Federal Reserve maintains that it still has arrows left in its policy quiver. Despite having completed a massive Treasury bond and mortgage-backed security (MBS) buying spree and keeping short-term interest rates near zero for a record 20-plus months, the Fed indicated at its August 10 meeting that it would consider taking additional action if the economic outlook weakened further. Meeting minutes reveal that possible moves could include buying longer-dated securities or reinstating a version of the mortgage-purchase program that ended in March. The Fed has been reinvesting proceeds from its maturing mortgage securities in U.S. Treasuries, but noted that “reinvesting in MBS might become desirable if conditions were to change,” according to the minutes.
9
Your fund’s performance
This section shows your fund’s performance, price, and distribution information for periods ended August 31, 2010, the end of its most recent fiscal year. In accordance with regulatory requirements for mutual funds, we also include performance as of the most recent calendar quarter-end and expense information taken from the fund’s current prospectus. Performance should always be considered in light of a fund’s investment strategy. Data represents past performance. Past performance does not guarantee future results. More recent returns may be less or more than those shown. Investment return and principal value will fluctuate, and you may have a gain or a loss when you sell your shares. Performance information does not reflect any deduction for taxes a shareholder may owe on fund distributions or on the redemption of fund shares. For the most recent month-end performance, please visit the Individual Investors section at putnam.com or call Putnam at 1-800-225-1581. Class Y shares are generally only available to corporate and institutional clients and clients in other approved programs. See the Terms and Definitions section in this report for definitions of the share classes offered by your fund.
Fund performance Total return for periods ended 8/31/10
| | | | | | | | | | |
| | Class A | Class B | Class C | Class M | Class R | Class Y |
| (inception dates) | (2/14/78) | (3/1/93) | (3/19/02) | (7/3/95) | (1/21/03) | (12/31/98) |
|
| | NAV | POP | NAV | CDSC | NAV | CDSC | NAV | POP | NAV | NAV |
|
| Annual average | | | | | | | | | | |
| (life of fund) | 8.77% | 8.63% | 7.87% | 7.87% | 7.94% | 7.94% | 8.40% | 8.29% | 8.47% | 8.85% |
|
| 10 years | 86.75 | 79.36 | 73.89 | 73.89 | 72.77 | 72.77 | 82.07 | 76.11 | 80.57 | 90.52 |
| Annual average | 6.45 | 6.02 | 5.69 | 5.69 | 5.62 | 5.62 | 6.18 | 5.82 | 6.09 | 6.66 |
|
| 5 years | 35.03 | 29.59 | 30.52 | 28.69 | 30.05 | 30.05 | 33.47 | 29.16 | 32.36 | 36.36 |
| Annual average | 6.19 | 5.32 | 5.47 | 5.17 | 5.40 | 5.40 | 5.94 | 5.25 | 5.77 | 6.40 |
|
| 3 years | 20.75 | 15.86 | 18.35 | 15.50 | 18.00 | 18.00 | 19.93 | 16.08 | 19.37 | 21.43 |
| Annual average | 6.49 | 5.03 | 5.78 | 4.92 | 5.67 | 5.67 | 6.25 | 5.10 | 6.08 | 6.69 |
|
| 1 year | 19.29 | 14.49 | 18.39 | 13.39 | 18.19 | 17.19 | 19.12 | 15.33 | 18.80 | 19.49 |
|
Current performance may be lower or higher than the quoted past performance, which cannot guarantee future results. After-sales-charge returns (public offering price, or POP) for class A and M shares reflect a maximum 4.00% and 3.25% load, respectively. Class B share returns reflect the applicable contingent deferred sales charge (CDSC), which is 5% in the first year, declining to 1% in the sixth year, and is eliminated thereafter. Class C shares reflect a 1% CDSC for the first year that is eliminated thereafter. Class R and Y shares have no initial sales charge or CDSC. Performance for class B, C, M, R, and Y shares before their inception is derived from the historical performance of class A shares, adjusted for the applicable sales charge (or CDSC) and the higher operating expenses for such shares, except for class Y shares, for which 12b-1 fees are not applicable.
For a portion of the periods, the fund had expense limitations, without which returns would have been lower.
Class B share performance does not reflect conversion to class A shares.
A short-term trading fee of 1% may apply to redemptions or exchanges from certain funds within the time period specified in the fund’s prospectus.
10
Comparative index returns For periods ended 8/31/10
| | |
| | JPMorgan Developed | Lipper High Current Yield Funds |
| | High Yield Index | category average* |
|
| Annual average (life of fund) | —† | 8.52% |
|
| 10 years | 111.55% | 75.50 |
| Annual average | 7.78 | 5.59 |
|
| 5 years | 43.72 | 30.29 |
| Annual average | 7.52 | 5.28 |
|
| 3 years | 27.20 | 17.08 |
| Annual average | 8.35 | 5.19 |
|
| 1 year | 21.93 | 18.99 |
|
Index and Lipper results should be compared to fund performance at net asset value.
* Over the 1-year, 3-year, 5-year, 10-year, and life-of-fund periods ended 8/31/10, there were 479, 411, 351, 232, and 10 funds, respectively, in this Lipper category.
† The fund’s benchmark, the JPMorgan Developed High Yield Index, was introduced on 12/31/94, which post-dates the inception of the fund’s class A shares.
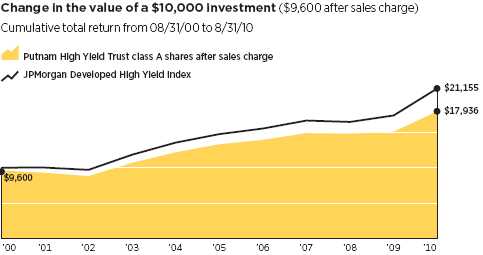
Past performance does not indicate future results. At the end of the same time period, a $10,000 investment in the fund’s class B and class C shares would have been valued at $17,389 and $17,277, respectively, and no contingent deferred sales charges would apply. A $10,000 investment in the fund’s class M shares ($9,675 after sales charge) would have been valued at $17,611 at public offering price. A $10,000 investment in the fund’s class R and class Y shares would have been valued at $18,057 and $19,052, respectively.
11
Fund price and distribution information For the 12-month period ended 8/31/10
| | | | | | | | |
| Distributions | Class A | Class B | Class C | Class M | Class R | Class Y |
|
| Number | 12 | 12 | 12 | 12 | 12 | 12 |
|
| Income | $0.540 | $0.483 | $0.486 | $0.522 | $0.526 | $0.558 |
|
| Capital gains | — | — | — | — | — | — |
|
| Total | $0.540 | $0.483 | $0.486 | $0.522 | $0.526 | $0.558 |
|
| Share value | NAV | POP | NAV | NAV | NAV | POP | NAV | NAV |
|
| 8/31/09 | $6.68 | $6.96 | $6.67 | $6.65 | $6.69 | $6.91 | $6.61 | $6.61 |
|
| 8/31/10 | 7.40 | 7.71 | 7.39 | 7.35 | 7.42 | 7.67 | 7.30 | 7.31 |
|
| Current yield (end of period) | NAV | POP | NAV | NAV | NAV | POP | NAV | NAV |
|
| Current dividend rate 1 | 7.30% | 7.00% | 6.50% | 6.53% | 7.12% | 6.88% | 7.23% | 7.72% |
|
| Current 30-day SEC yield 2,3 | N/A | 6.53 | 6.03 | 6.03 | N/A | 6.34 | 6.55 | 7.05 |
|
The classification of distributions, if any, is an estimate. Final distribution information will appear on your year-end tax forms.
1 Most recent distribution, excluding capital gains, annualized and divided by NAV or POP at end of period.
2 For a portion of the periods, the fund had expense limitations, without which returns would have been lower.
3 Based only on investment income and calculated using the maximum offering price for each share class, in accordance with SEC guidelines.
Fund performance as of most recent calendar quarter
Total return for periods ended 9/30/10
| | | | | | | | | | |
| | Class A | Class B | Class C | Class M | Class R | Class Y |
| (inception dates) | (2/14/78) | (3/1/93) | (3/19/02) | (7/3/95) | (1/21/03) | (12/31/98) |
|
| | NAV | POP | NAV | CDSC | NAV | CDSC | NAV | POP | NAV | NAV |
|
| Annual average | | | | | | | | | | |
| (life of fund) | 8.85% | 8.71% | 7.95% | 7.95% | 8.02% | 8.02% | 8.47% | 8.37% | 8.54% | 8.93% |
|
| 10 years | 94.97 | 87.09 | 81.54 | 81.54 | 80.25 | 80.25 | 89.80 | 83.65 | 88.26 | 98.73 |
| Annual average | 6.90 | 6.46 | 6.14 | 6.14 | 6.07 | 6.07 | 6.62 | 6.27 | 6.53 | 7.11 |
|
| 5 years | 40.21 | 34.66 | 35.54 | 33.63 | 34.90 | 34.90 | 38.23 | 33.72 | 37.31 | 41.48 |
| Annual average | 6.99 | 6.13 | 6.27 | 5.97 | 6.17 | 6.17 | 6.69 | 5.98 | 6.55 | 7.19 |
|
| 3 years | 21.49 | 16.66 | 19.07 | 16.21 | 18.74 | 18.74 | 20.50 | 16.56 | 19.96 | 22.04 |
| Annual average | 6.70 | 5.27 | 5.99 | 5.14 | 5.89 | 5.89 | 6.41 | 5.24 | 6.25 | 6.86 |
|
| 1 year | 16.70 | 12.06 | 15.99 | 10.99 | 15.80 | 14.80 | 16.39 | 12.54 | 16.21 | 16.89 |
|
12
Your fund’s expenses
As a mutual fund investor, you pay ongoing expenses, such as management fees, distribution fees (12b-1 fees), and other expenses. In the most recent six-month period, your fund’s expenses were limited; had expenses not been limited, they would have been higher. Using the following information, you can estimate how these expenses affect your investment and compare them with the expenses of other funds. You may also pay one-time transaction expenses, including sales charges (loads) and redemption fees, which are not shown in this section and would have resulted in higher total expenses. For more information, see your fund’s prospectus or talk to your financial representative.
Expense ratios
| | | | | | |
| | Class A | Class B | Class C | Class M | Class R | Class Y |
|
| Net expenses for the fiscal year ended 8/31/09*† | 1.08% | 1.83% | 1.83% | 1.33% | 1.33% | 0.83% |
|
| Total annual operating expenses for the fiscal year | | | | | | |
| ended 8/31/09† | 1.12% | 1.87% | 1.87% | 1.37% | 1.37% | 0.87% |
|
| Annualized expense ratio for the six-month period | | | | | | |
| ended 8/31/10‡ | 1.02% | 1.77% | 1.77% | 1.27% | 1.27% | 0.77% |
|
Fiscal-year expense information in this table is taken from the most recent prospectus, is subject to change, and may differ from that shown for the annualized expense ratio and in the financial highlights of this report. Expenses are shown as a percentage of average net assets.
* Reflects Putnam Management’s decision to contractually limit expenses through 12/30/10.
† Reflects projected expenses based on a new expense arrangement.
‡ For the fund’s most recent fiscal half year; may differ from expense ratios based on one-year data in the financial highlights.
Expenses per $1,000
The following table shows the expenses you would have paid on a $1,000 investment in Putnam High Yield Trust from March 1, 2010, to August 31, 2010. It also shows how much a $1,000 investment would be worth at the close of the period, assuming actual returns and expenses.
| | | | | | |
| | Class A | Class B | Class C | Class M | Class R | Class Y |
|
| Expenses paid per $1,000*† | $5.29 | $9.15 | $9.15 | $6.58 | $6.58 | $3.99 |
|
| Ending value (after expenses) | $1,055.70 | $1,051.80 | $1,050.80 | $1,055.90 | $1,054.00 | $1,057.70 |
|
* Expenses for each share class are calculated using the fund’s annualized expense ratio for each class, which represents the ongoing expenses as a percentage of average net assets for the six months ended 8/31/10. The expense ratio may differ for each share class.
† Expenses are calculated by multiplying the expense ratio by the average account value for the period; then multiplying the result by the number of days in the period; and then dividing that result by the number of days in the year.
13
Estimate the expenses you paid
To estimate the ongoing expenses you paid for the six months ended August 31, 2010, use the following calculation method. To find the value of your investment on March 1, 2010, call Putnam at 1-800-225-1581.

Compare expenses using the SEC’s method
The Securities and Exchange Commission (SEC) has established guidelines to help investors assess fund expenses. Per these guidelines, the following table shows your fund’s expenses based on a $1,000 investment, assuming a hypothetical 5% annualized return. You can use this information to compare the ongoing expenses (but not transaction expenses or total costs) of investing in the fund with those of other funds. All mutual fund shareholder reports will provide this information to help you make this comparison. Please note that you cannot use this information to estimate your actual ending account balance and expenses paid during the period.
| | | | | | |
| | Class A | Class B | Class C | Class M | Class R | Class Y |
|
| Expenses paid per $1,000*† | $5.19 | $9.00 | $9.00 | $6.46 | $6.46 | $3.92 |
|
| Ending value (after expenses) | $1,020.06 | $1,016.28 | $1,016.28 | $1,018.80 | $1,018.80 | $1,021.32 |
|
* Expenses for each share class are calculated using the fund’s annualized expense ratio for each class, which represents the ongoing expenses as a percentage of average net assets for the six months ended 8/31/10. The expense ratio may differ for each share class.
† Expenses are calculated by multiplying the expense ratio by the average account value for the period; then multiplying the result by the number of days in the period; and then dividing that result by the number of days in the year.
14
Terms and definitions
Important terms
Total return shows how the value of the fund’s shares changed over time, assuming you held the shares through the entire period and reinvested all distributions in the fund.
Net asset value (NAV) is the price, or value, of one share of a mutual fund, without a sales charge. NAVs fluctuate with market conditions. NAV is calculated by dividing the net assets of each class of shares by the number of outstanding shares in the class.
Public offering price (POP) is the price of a mutual fund share plus the maximum sales charge levied at the time of purchase. POP performance figures shown here assume the 4.00% maximum sales charge for class A shares and 3.25% for class M shares.
Contingent deferred sales charge (CDSC) is generally a charge applied at the time of the redemption of class B or C shares and assumes redemption at the end of the period. Your fund’s class B CDSC declines from a 5% maximum during the first year to 1% during the sixth year. After the sixth year, the CDSC no longer applies. The CDSC for class C shares is 1% for one year after purchase.
Current yield is the annual rate of return earned from dividends or interest of an investment. Current yield is expressed as a percentage of the price of a security, fund share, or principal investment.
Share classes
Class A shares are generally subject to an initial sales charge and no CDSC (except on certain redemptions of shares bought without an initial sales charge).
Class B shares are not subject to an initial sales charge. They may be subject to a CDSC.
Class C shares are not subject to an initial sales charge and are subject to a CDSC only if the shares are redeemed during the first year.
Class M shares have a lower initial sales charge and a higher 12b-1 fee than class A shares and no CDSC (except on certain redemptions of shares bought without an initial sales charge).
Class R shares are not subject to an initial sales charge or CDSC and are available only to certain defined contribution plans.
Class Y shares are not subject to an initial sales charge or CDSC, and carry no 12b-1 fee. They are generally only available to corporate and institutional clients and clients in other approved programs.
Comparative indexes
Barclays Capital Aggregate Bond Index is an unmanaged index of U.S. investment-grade fixed-income securities.
BofA (Bank of America) Merrill Lynch U.S. 3-Month Treasury Bill Index is an unmanaged index that seeks to measure the performance of U.S. Treasury bills available in the marketplace.
JPMorgan Developed High Yield Index is an unmanaged index of high-yield fixed-income securities issued in developed countries.
S&P 500 Index is an unmanaged index of common stock performance.
Indexes assume reinvestment of all distributions and do not account for fees. Securities and performance of a fund and an index will differ. You cannot invest directly in an index.
Lipper is a third-party industry-ranking entity that ranks mutual funds. Its rankings do not reflect sales charges. Lipper rankings are based on total return at net asset value relative to other funds that have similar current investment styles or objectives as determined by Lipper. Lipper may change a fund’s category assignment at its discretion. Lipper category averages reflect performance trends for funds within a category.
15
Trustee approval of management contract
General conclusions
The Board of Trustees of the Putnam funds oversees the management of each fund and, as required by law, determines annually whether to approve the continuance of your fund’s management contract with Putnam Investment Management (“Putnam Management”) and the sub-management contract with respect to your fund between Putnam Management and its affiliate, Putnam Investments Limited (“PIL”).
In this regard, the Board of Trustees, with the assistance of its Contract Committee consisting solely of Trustees who are not “interested persons” (as this term is defined in the Investment Company Act of 1940, as amended) of the Putnam funds (the “Independent Trustees”), requests and evaluates all information it deems reasonably necessary under the circumstances. Over the course of several months ending in June 2010, the Contract Committee met several times with representatives of Putnam Management and in executive session to consider the information provided by Putnam Management and other information developed with the assistance of the Board’s independent counsel and independent staff. The Contract Committee reviewed and discussed key aspects of this information with all of the Independent Trustees. At the Trustees’ June 11, 2010 meeting, the Contract Committee recommended, and the Independent Trustees approved, the continuance of your fund� 6;s management and sub-management contracts, effective July 1, 2010. (Because PIL is an affiliate of Putnam Management and Putnam Management remains fully responsible for all services provided by PIL, the Trustees have not evaluated PIL as a separate entity, and all subsequent references to Putnam Management below should be deemed to include reference to PIL as necessary or appropriate in the context.)
The Independent Trustees’ approval was based on the following conclusions:
• That the fee schedule in effect for your fund represented reasonable compensation in light of the nature and quality of the services being provided to the fund, the fees paid by competitive funds, and the costs incurred by Putnam Management in providing such services, and
• That the fee schedule represented an appropriate sharing between fund shareholders and Putnam Management of such economies of scale as may exist in the management of the fund at current asset levels.
These conclusions were based on a comprehensive consideration of all information provided to the Trustees and were not the result of any single factor. Some of the factors that figured particularly in the Trustees’ deliberations and how the Trustees considered these factors are described below, although individual Trustees may have evaluated the information presented differently, giving different weights to various factors. It is also important to recognize that the fee arrangements for your fund and the other Putnam funds are the result of many years of review and discussion between the Independent Trustees and Putnam Management, that certain aspects of the arrangements may receive greater scrutiny in some years than others, and that the Trustees’ conclusions may be based, in part, on their consideration of fee arrangements in prior years.
Consideration of implementation of strategic pricing initiative
The Trustees were mindful that new management contracts had been implemented for all but a few funds at the beginning of 2010 as part of Putnam Management’s strategic pricing initiative. These new management contracts reflected the implementation of more competitive fee levels for many funds, complex-wide breakpoints
16
for the open-end funds and performance fees for certain funds. The Trustees had approved these new management contracts on July 10, 2009 and submitted them to shareholder meetings of the affected funds in late 2009, where the contracts were in all cases approved by overwhelming majorities of the shares voted.
Because the management contracts had been implemented only recently, the Contract Committee had limited practical experience with the operation of the new fee structures. The financial data available to the Committee reflected actual operations under the prior contracts; information was also available on a pro forma basis, adjusted to reflect the fees payable under the new management contracts. In light of the limited information available regarding operations under the new management contracts, in recommending the continuation of the new management contracts in June 2010, the Contract Committee relied to a considerable extent on its review of the financial information and analysis that formed the basis of the Board’s approval of the new management contracts on July 10, 2009.
Management fee schedules and categories; total expenses
The Trustees reviewed the management fee schedules in effect for all Putnam funds, including fee levels and breakpoints. In reviewing management fees, the Trustees generally focus their attention on material changes in circumstances — for example, changes in assets under management or investment style, changes in Putnam Management’s operating costs, or changes in competitive practices in the mutual fund industry — that suggest that consideration of fee changes might be warranted. The Trustees concluded that the circumstances did not warrant changes to the management fee structure of your fund.
As in the past, the Trustees continued to focus on the competitiveness of the total expense ratio of each fund. In order to ensure that expenses of the Putnam funds continue to meet evolving competitive standards, the Trustees and Putnam Management agreed in 2009 to implement: (i) a contractual expense limitation applicable to all retail open-end funds of 37.5 basis points on investor servicing fees and expenses and (ii) a contractual expense limitation applicable to all open-end funds of 20 basis points on so-called “other expenses” (i.e., all expenses exclusive of management fees, investor servicing fees, distribution fees, taxes, brokerage commissions and extraordinary expenses). These expense limitations serve in particular to maintain competitive expense levels for funds with large numbers of small shareholder accounts and funds with relatively small net assets.
The Trustees reviewed comparative fee and expense information for competitive funds, which indicated that, in a custom peer group of competitive funds selected by Lipper Inc., your fund ranked in the 66th percentile in effective management fees (determined for your fund and the other funds in the custom peer group based on fund asset size and the applicable contractual management fee schedule) and in the 69th percentile in total expenses (less any applicable 12b-1 fees) as of December 31, 2009 (the first percentile representing the least expensive funds and the 100th percentile the most expensive funds). The Trustees also considered that your fund ranked in the 52nd percentile in effective management fees, on a pro forma basis adjusted to reflect the impact of the strategic pricing initiative discussed above, as of December 31, 2009.
Your fund currently has the benefit of breakpoints in its management fee that provide shareholders with significant economies of scale in the form of reduced fee levels as assets under management in the Putnam family of funds increase. The Contract Committee observed that the complex-wide breakpoints of the open-end funds have only been in place
17
for a short while, and the Trustees will examine the operation of this new breakpoint structure in future years in light of actual experience.
In connection with their review of the management fees and total expenses of the Putnam funds, the Trustees also reviewed the costs of the services provided and profits realized by Putnam Management and its affiliates from their contractual relationships with the funds. This information included trends in revenues, expenses and profitability of Putnam Management and its affiliates relating to the investment management, investor servicing and distribution services provided to the funds. In this regard, the Trustees also reviewed an analysis of Putnam Management’s revenues, expenses and profitability, allocated on a fund-by-fund basis, with respect to the funds’ management, distribution, and investor servicing contracts. For each fund, the analysis presented information about revenues, expenses and profitability for each of the agreements separately and for the agreements taken together on a combined basis. The Trustees concluded that, at curre nt asset levels, the fee schedules currently in place represented an appropriate sharing of economies of scale at that time.
The information examined by the Trustees as part of their annual contract review for the Putnam funds has included for many years information regarding fees charged by Putnam Management and its affiliates to institutional clients such as defined benefit pension plans, college endowments, and the like. This information included comparisons of such fees with fees charged to the funds, as well as a detailed assessment of the differences in the services provided to these two types of clients. The Trustees observed, in this regard, that the differences in fee rates between institutional clients and mutual funds are by no means uniform when examined by individual asset sectors, suggesting that differences in the pricing of investment management services to these types of clients may reflect historical competitive forces operating in separate market places. The Trustees considered the fact that fee rates across different as set classes are typically higher on average for mutual funds than for institutional clients, as well as the differences between the services that Putnam Management provides to the Putnam funds and those that it provides to institutional clients of the firm, and did not rely on these comparisons to any significant extent in concluding that the management fees paid by your fund are reasonable.
Investment performance
The quality of the investment process provided by Putnam Management represented a major factor in the Trustees’ evaluation of the quality of services provided by Putnam Management under your fund’s management contract. The Trustees were assisted in their review of the Putnam funds’ investment process and performance by the work of the Investment Oversight Coordinating Committee of the Trustees and the Investment Oversight Committees of the Trustees, which met on a regular monthly basis with the funds’ portfolio teams throughout the year. The Trustees concluded that Putnam Management generally provides a high-quality investment process — as measured by the experience and skills of the individuals assigned to the management of fund portfolios, the resources made available to such personnel, and in general the ability of Putnam Management to attract and retain high-quality personnel — but also recognized that this does not gu arantee favorable investment results for every fund in every time period. The Trustees considered the investment performance of each fund over multiple time periods and considered information comparing each fund’s performance with various benchmarks and with the performance of competitive funds.
The Committee noted the substantial improvement in the performance of most
18
Putnam funds during 2009. The Committee also noted the disappointing investment performance of a number of the funds for periods ended December 31, 2009 and considered information provided by Putnam Management regarding the factors contributing to the underperformance and actions being taken to improve performance. The Trustees recognized that, in recent years, Putnam Management has taken steps to strengthen its investment personnel and processes to address areas of underperformance, including Putnam Management’s continuing efforts to strengthen the equity research function, recent changes in portfolio managers, increased accountability of individual managers rather than teams, recent changes in Putnam Management’s approach to incentive compensation, including emphasis on top quartile performance over a rolling three-year period, and the recent arrival of a new chief investment officer. The Trustees indicated their intention to continue to mo nitor performance trends to assess the effectiveness of these efforts and to evaluate whether additional changes to address areas of underperformance are warranted.
In the case of your fund, the Trustees considered that your fund’s class A share cumulative total return performance at net asset value was in the following percentiles of its Lipper Inc. peer group (Lipper High Current Yield Funds) for the one-year, three-year and five-year periods ended December 31, 2009 (the first percentile representing the best-performing funds and the 100th percentile the worst-performing funds):
| | | |
| One-year period | 29th | | |
| | |
| Three-year period | 29th | | |
| | |
| Five-year period | 22nd | | |
| | |
Over the one-year, three-year and five-year periods ended December 31, 2009, there were 459, 391 and 341 funds, respectively, in your fund’s Lipper peer group. (When considering performance information, shareholders should be mindful that past performance is not a guarantee of future results.)
Brokerage and soft-dollar allocations; investor servicing; distribution
The Trustees considered various potential benefits that Putnam Management may receive in connection with the services it provides under the management contract with your fund. These include benefits related to brokerage and soft-dollar allocations, whereby a portion of the commissions paid by a fund for brokerage may be used to acquire research services that are expected to be useful to Putnam Management in managing the assets of the fund and of other clients. The Trustees considered a change made, at Putnam Management’s request, to the Putnam funds’ brokerage allocation policies commencing in 2010, which increased the permitted soft dollar allocation to third-party services over what had been authorized in previous years. The Trustees noted that a portion of available soft dollars continues to be allocated to the payment of fund expenses. The Trustees indicated their continued intent to monitor regulatory developments in this area with the a ssistance of their Brokerage Committee and also indicated their continued intent to monitor the potential benefits associated with fund brokerage and soft-dollar allocations and trends in industry practices to ensure that the principle of seeking best price and execution remains paramount in the portfolio trading process.
Putnam Management may also receive benefits from payments that the funds make to Putnam Management’s affiliates for investor or distribution services. In conjunction with the annual review of your fund’s management contract, the Trustees reviewed your fund’s investor servicing agreement with Putnam Investor Services, Inc. (“PSERV”) and its distributor’s contracts and distribution plans with Putnam Retail Management Limited Partnership (“PRM”), both of which are affiliates of Putnam Management. The Trustees concluded that the fees payable by the funds to PSERV and PRM, as applicable, for such services are reasonable in relation to the nature and quality of such services.
19
Other information for shareholders
Important notice regarding Putnam’s privacy policy
In order to conduct business with our shareholders, we must obtain certain personal information such as account holders’ names, addresses, Social Security numbers, and dates of birth. Using this information, we are able to maintain accurate records of accounts and transactions.
It is our policy to protect the confidentiality of our shareholder information, whether or not a shareholder currently owns shares of our funds. In particular, it is our policy not to sell information about you or your accounts to outside marketing firms. We have safeguards in place designed to prevent unauthorized access to our computer systems and procedures to protect personal information from unauthorized use.
Under certain circumstances, we must share account information with outside vendors who provide services to us, such as mailings and proxy solicitations. In these cases, the service providers enter into confidentiality agreements with us, and we provide only the information necessary to process transactions and perform other services related to your account. Finally, it is our policy to share account information with your financial representative, if you’ve listed one on your Putnam account.
Proxy voting
Putnam is committed to managing our mutual funds in the best interests of our shareholders. The Putnam funds’ proxy voting guidelines and procedures, as well as information regarding how your fund voted proxies relating to portfolio securities during the 12-month period ended June 30, 2010, are available in the Individual Investors section at putnam.com, and on the SEC’s Web site, www.sec.gov. If you have questions about finding forms on the SEC’s Web site, you may call the SEC at 1-800-SEC-0330. You may also obtain the Putnam funds’ proxy voting guidelines and procedures at no charge by calling Putnam’s Shareholder Services at 1-800-225-1581.
Fund portfolio holdings
The fund will file a complete schedule of its portfolio holdings with the SEC for the first and third quarters of each fiscal year on Form N-Q. Shareholders may obtain the fund’s Forms N-Q on the SEC’s Web site at www.sec.gov. In addition, the fund’s Forms N-Q may be reviewed and copied at the SEC’s Public Reference Room in Washington, D.C. You may call the SEC at 1-800-SEC-0330 for information about the SEC’s Web site or the operation of the Public Reference Room.
Trustee and employee fund ownership
Putnam employees and members of the Board of Trustees place their faith, confidence, and, most importantly, investment dollars in Putnam mutual funds. As of August 31, 2010, Putnam employees had approximately $298,000,000 and the Trustees had approximately $57,000,000 invested in Putnam mutual funds. These amounts include investments by the Trustees’ and employees’ immediate family members as well as investments through retirement and deferred compensation plans.
20
Financial statements
These sections of the report, as well as the accompanying Notes, preceded by the Report of Independent Registered Public Accounting Firm, constitute the fund’s financial statements.
The fund’s portfolio lists all the fund’s investments and their values as of the last day of the reporting period. Holdings are organized by asset type and industry sector, country, or state to show areas of concentration and diversification.
Statement of assets and liabilities shows how the fund’s net assets and share price are determined. All investment and non-investment assets are added together. Any unpaid expenses and other liabilities are subtracted from this total. The result is divided by the number of shares to determine the net asset value per share, which is calculated separately for each class of shares. (For funds with preferred shares, the amount subtracted from total assets includes the liquidation preference of preferred shares.)
Statement of operations shows the fund’s net investment gain or loss. This is done by first adding up all the fund’s earnings — from dividends and interest income — and subtracting its operating expenses to determine net investment income (or loss). Then, any net gain or loss the fund realized on the sales of its holdings — as well as any unrealized gains or losses over the period — is added to or subtracted from the net investment result to determine the fund’s net gain or loss for the fiscal year.
Statement of changes in net assets shows how the fund’s net assets were affected by the fund’s net investment gain or loss, by distributions to shareholders, and by changes in the number of the fund’s shares. It lists distributions and their sources (net investment income or realized capital gains) over the current reporting period and the most recent fiscal year-end. The distributions listed here may not match the sources listed in the Statement of operations because the distributions are determined on a tax basis and may be paid in a different period from the one in which they were earned.
Financial highlights provide an overview of the fund’s investment results, per-share distributions, expense ratios, net investment income ratios, and portfolio turnover in one summary table, reflecting the five most recent reporting periods. In a semiannual report, the highlights table also includes the current reporting period.
21
Report of Independent Registered Public Accounting Firm
The Board of Trustees and Shareholders
Putnam High Yield Trust:
We have audited the accompanying statement of assets and liabilities of Putnam High Yield Trust (the fund), including the fund’s portfolio, as of August 31, 2010, and the related statement of operations for the year then ended, the statements of changes in net assets for each of the two years in the period then ended and the financial highlights for each of the five years in the period then ended. These financial statements and financial highlights are the responsibility of the fund’s management. Our responsibility is to express an opinion on these financial statements and financial highlights based on our audits.
We conducted our audits in accordance with the standards of the Public Company Accounting Oversight Board (United States). Those standards require that we plan and perform our audit to obtain reasonable assurance about whether the financial statements and financial highlights are free of material misstatement. An audit includes examining, on a test basis, evidence supporting the amounts and disclosures in the financial statements. Our procedures included confirmation of securities owned as of August 31, 2010 by correspondence with the custodian and brokers or by other appropriate auditing procedures. An audit also includes assessing the accounting principles used and significant estimates made by management, as well as evaluating the overall financial statement presentation. We believe that our audits provide a reasonable basis for our opinion.
In our opinion, the financial statements and financial highlights referred to above present fairly, in all material respects, the financial position of Putnam High Yield Trust as of August 31, 2010, the results of its operations for the year then ended, the changes in its net assets for each of the two years in the period then ended, and the financial highlights for each of the five years in the period then ended, in conformity with U.S. generally accepted accounting principles.

Boston, Massachusetts
October 15, 2010
22
The fund’s portfolio 8/31/10
| | | |
| CORPORATE BONDS AND NOTES (85.0%)* | Principal amount | Value |
|
| Advertising and marketing services (0.1%) | | | |
| Lamar Media Corp. 144A sr. sub. notes 7 7/8s, 2018 | | $855,000 | $881,719 |
|
| | | | 881,719 |
| Automotive (3.0%) | | | |
| Affinia Group, Inc. 144A sr. notes 10 3/4s, 2016 | | 1,950,000 | 2,154,750 |
|
| Allison Transmission, Inc. 144A company guaranty sr. unsec. | | | |
| notes 11 1/4s, 2015 ‡‡ | | 5,663,000 | 6,116,040 |
|
| American Axle & Manufacturing, Inc. company | | | |
| guaranty sr. unsec. notes 5 1/4s, 2014 | | 5,450,000 | 4,836,875 |
|
| Dana Corp. escrow sr. notes 5.85s, 2015 (acquired 4/24/08, | | | |
| cost $3,671) (In default) F † ‡ | | 5,483,000 | 5 |
|
| Ford Motor Credit Co., LLC sr. notes 9 7/8s, 2011 | | 202,000 | 213,615 |
|
| Ford Motor Credit Co., LLC sr. unsec. notes 8 1/8s, 2020 | | 4,490,000 | 4,894,100 |
|
| Ford Motor Credit Co., LLC sr. unsec. unsub. notes 7 1/2s, 2012 | | 1,275,000 | 1,338,452 |
|
| General Motors Corp. sr. unsec. notes 8 1/4s, | | | |
| 2023 (In default) † | | 4,870,000 | 1,521,875 |
|
| General Motors Corp. sr. unsec. unsub. notes 8 3/8s, | | | |
| 2033 (In default) † | | 4,765,000 | 1,524,800 |
|
| Lear Corp. company guaranty sr. unsec. bond 7 7/8s, 2018 | | 1,520,000 | 1,573,200 |
|
| Lear Corp. company guaranty sr. unsec. notes 8 1/8s, 2020 | | 3,740,000 | 3,880,250 |
|
| Navistar International Corp. sr. notes 8 1/4s, 2021 | | 4,165,000 | 4,352,425 |
|
| TRW Automotive, Inc. company guaranty sr. unsec. | | | |
| unsub. notes Ser. REGS, 6 3/8s, 2014 | EUR | 3,040,000 | 3,840,652 |
|
| TRW Automotive, Inc. 144A company | | | |
| guaranty sr. notes 7 1/4s, 2017 | | $280,000 | 286,300 |
|
| TRW Automotive, Inc. 144A sr. notes 8 7/8s, 2017 | | 1,000,000 | 1,068,750 |
|
| Visteon Corp. sr. unsec. unsub. notes 7s, 2014 (In default) † | | 1,105,000 | 1,127,100 |
|
| Visteon Corp. 144A sr. unsec. notes 12 1/4s, 2016 (In default) † | | 666,000 | 832,500 |
|
| | | | 39,561,689 |
| Basic materials (7.9%) | | | |
| Aleris International, Inc. company guaranty sr. unsec. | | | |
| notes 9s, 2014 (In default) † ‡‡ | | 4,534,000 | 9,068 |
|
| AMH Holdings, Inc. sr. disc. unsec. notes 11 1/4s, 2014 | | 1,140,000 | 1,155,675 |
|
| Associated Materials, LLC/Associated Materials | | | |
| Finance, Inc. company guaranty sr. notes 9 7/8s, 2016 | | 3,140,000 | 3,328,400 |
|
| Builders FirstSource, Inc. 144A company | | | |
| guaranty sr. notes FRN 13s, 2016 | | 2,685,000 | 2,591,025 |
|
| Chemtura Corp. 144A company guaranty sr. unsec. | | | |
| notes 7 7/8s, 2018 | | 600,000 | 612,750 |
|
| Clondalkin Acquisition BV 144A company | | | |
| guaranty sr. notes FRN 2.53706s, 2013 (Netherlands) | | 3,107,000 | 2,710,858 |
|
| Compass Minerals International, Inc. company | | | |
| guaranty sr. unsec. notes 8s, 2019 | | 3,295,000 | 3,426,800 |
|
| Ferro Corp. sr. unsec. notes 7 7/8s, 2018 | | 990,000 | 1,009,800 |
|
| FMG Finance Pty Ltd. 144A sr. sec. notes 10 5/8s, | | | |
| 2016 (Australia) | | 5,443,000 | 6,307,076 |
|
| Freeport-McMoRan Copper & Gold, Inc. sr. unsec. | | | |
| notes 8 3/8s, 2017 | | 6,216,000 | 6,899,760 |
|
| Georgia-Pacific, LLC 144A company guaranty sr. unsec. | | | |
| notes 7s, 2015 | | 2,105,000 | 2,178,675 |
|
23
| | | |
| CORPORATE BONDS AND NOTES (85.0%)* cont. | Principal amount | Value |
|
| Basic materials cont. | | | |
| Hexion U.S. Finance Corp./Hexion Nova Scotia Finance, ULC | | | |
| company guaranty 9 3/4s, 2014 | | $1,933,000 | $1,899,173 |
|
| Hexion U.S. Finance Corp./Hexion Nova Scotia Finance, ULC | | | |
| company guaranty sr. notes 8 7/8s, 2018 | | 720,000 | 666,000 |
|
| Huntsman International, LLC company guaranty sr. unsec. | | | |
| sub. notes 7 7/8s, 2014 | | 2,120,000 | 2,135,900 |
|
| Huntsman International, LLC 144A sr. sub. notes 8 5/8s, 2020 | | 1,270,000 | 1,258,888 |
|
| Ineos Finance PLC 144A company guaranty sr. notes 9s, 2015 | | | |
| (United Kingdom) | | 1,380,000 | 1,397,250 |
|
| Ineos Group Holdings PLC company guaranty sr. notes 7 7/8s, | | | |
| 2016 (United Kingdom) | EUR | 1,215,000 | 1,166,516 |
|
| Jefferson Smurfit escrow bonds 8 1/4s, 2012 | | $1,217,000 | 31,946 |
|
| LBI Escrow Corp. 144A sr. notes 8s, 2017 | | 3,565,000 | 3,827,919 |
|
| Lyondell Chemical Co. sr. notes 11s, 2018 | | 6,831,259 | 7,420,455 |
|
| Metals USA, Inc. company guaranty sr. unsec. notes | | | |
| 11 1/8s, 2015 | | 2,128,000 | 2,250,360 |
|
| Momentive Performance Materials, Inc. company | | | |
| guaranty sr. notes 12 1/2s, 2014 | | 3,355,000 | 3,711,469 |
|
| Momentive Performance Materials, Inc. company | | | |
| guaranty sr. unsec. notes 9 3/4s, 2014 | | 2,398,000 | 2,341,048 |
|
| NewPage Corp. company guaranty sr. notes 11 3/8s, 2014 | | 2,285,000 | 1,856,563 |
|
| Novelis, Inc. company guaranty sr. unsec. notes 11 1/2s, 2015 | | 2,635,000 | 2,898,500 |
|
| Novelis, Inc. company guaranty sr. unsec. notes 7 1/4s, 2015 | | 4,589,000 | 4,600,473 |
|
| PE Paper Escrow GmbH sr. notes Ser. REGS, 11 3/4s, | | | |
| 2014 (Austria) | EUR | 875,000 | 1,255,305 |
|
| PE Paper Escrow GmbH 144A sr. notes 12s, 2014 (Austria) | | $3,425,000 | 3,865,969 |
|
| Rohm & Haas Co. sr. unsec. unsub. notes 7.85s, 2029 | | 3,977,000 | 4,574,377 |
|
| Smurfit Kappa Funding PLC sr. unsec. sub. notes 7 3/4s, | | | |
| 2015 (Ireland) | | 4,392,000 | 4,392,000 |
|
| Solutia, Inc. company guaranty sr. unsec. notes 8 3/4s, 2017 | | 1,925,000 | 2,059,750 |
|
| Solutia, Inc. company guaranty sr. unsec. notes 7 7/8s, 2020 | | 610,000 | 640,500 |
|
| Steel Dynamics, Inc. company guaranty sr. unsec. | | | |
| unsub. notes 7 3/8s, 2012 | | 250,000 | 265,625 |
|
| Steel Dynamics, Inc. company guaranty sr. unsec. | | | |
| unsub. notes 6 3/4s, 2015 | | 2,340,000 | 2,392,650 |
|
| Steel Dynamics, Inc. sr. unsec. unsub. notes 7 3/4s, 2016 | | 2,625,000 | 2,710,313 |
|
| Steel Dynamics, Inc. 144A company guaranty sr. unsec. | | | |
| notes 7 5/8s, 2020 | | 880,000 | 902,000 |
|
| Stone Container Corp. escrow bonds 8 3/8s, 2012 (In default) † | | 2,163,000 | 56,779 |
|
| Teck Resources, Limited sr. notes 10 3/4s, 2019 (Canada) | | 1,615,000 | 2,006,638 |
|
| Teck Resources, Limited sr. notes 10 1/4s, 2016 (Canada) | | 3,935,000 | 4,756,431 |
|
| Tube City IMS Corp. company guaranty sr. unsec. | | | |
| sub. notes 9 3/4s, 2015 | | 1,100,000 | 1,124,750 |
|
| Verso Paper Holdings, LLC/Verso Paper, Inc. company | | | |
| guaranty Ser. B, 11 3/8s, 2016 | | 1,355,000 | 1,084,000 |
|
| Verso Paper Holdings, LLC/Verso Paper, Inc. company | | | |
| guaranty sr. sec. notes FRN Ser. B, 4.21563s, 2014 | | 2,960,000 | 2,427,200 |
|
| Verso Paper Holdings, LLC/Verso Paper, Inc. | | | |
| sr. notes 11 1/2s, 2014 | | 1,960,000 | 2,067,800 |
|
| | | | 104,274,434 |
24
| | |
| CORPORATE BONDS AND NOTES (85.0%)* cont. | Principal amount | Value |
|
| Broadcasting (2.1%) | | |
| Belo Corp. sr. unsec. unsub. notes 8s, 2016 | $695,000 | $736,700 |
|
| Clear Channel Communications, Inc. company guaranty unsec. | | |
| unsub. notes 10 3/4s, 2016 | 2,240,000 | 1,652,000 |
|
| Clear Channel Communications, Inc. sr. unsec. | | |
| unsub. notes 5s, 2012 | 840,000 | 768,600 |
|
| Clear Channel Worldwide Holdings, Inc. company | | |
| guaranty sr. unsec. unsub. notes 9 1/4s, 2017 | 1,085,000 | 1,125,688 |
|
| Clear Channel Worldwide Holdings, Inc. company | | |
| guaranty sr. unsec. unsub. notes Ser. B, 9 1/4s, 2017 | 3,600,000 | 3,775,500 |
|
| DISH DBS Corp. company guaranty sr. unsec. notes 7 7/8s, 2019 | 3,050,000 | 3,179,625 |
|
| DISH DBS Corp. company guaranty 7 1/8s, 2016 | 1,832,000 | 1,873,220 |
|
| Gray Television, Inc. company guaranty sr. notes 10 1/2s, 2015 | 2,435,000 | 2,343,688 |
|
| Nexstar Broadcasting, Inc./Mission Broadcasting, Inc. 144A | | |
| sr. notes 8 7/8s, 2017 | 2,845,000 | 2,891,231 |
|
| Sinclair Broadcast Group, Inc. company guaranty 8s, 2012 | 480,000 | 480,000 |
|
| Sirius XM Radio, Inc. 144A sr. notes 9 3/4s, 2015 | 1,245,000 | 1,353,938 |
|
| Umbrella Acquisition, Inc. 144A company guaranty sr. unsec. | | |
| unsub. notes 9 3/4s, 2015 ‡‡ | 3,920,348 | 3,528,313 |
|
| Univision Communications, Inc. 144A sr. sec. notes 12s, 2014 | 635,000 | 688,181 |
|
| XM Satellite Radio, Inc. 144A company guaranty sr. unsec. | | |
| notes 13s, 2013 | 3,110,000 | 3,522,075 |
|
| Young Broadcasting, Inc. company | | |
| guaranty sr. sub. notes 8 3/4s, 2014 (In default) F † | 1,025,000 | — |
|
| Young Broadcasting, Inc. company guaranty sr. unsec. | | |
| sub. notes 10s, 2011 (In default) F † | 3,903,000 | — |
|
| | | 27,918,759 |
| Building materials (1.4%) | | |
| Building Materials Corp. 144A company | | |
| guaranty sr. notes 7 1/2s, 2020 | 2,135,000 | 2,129,663 |
|
| Building Materials Corp. 144A sr. notes 7s, 2020 | 1,145,000 | 1,139,275 |
|
| Building Materials Corp. 144A sr. notes 6 7/8s, 2018 | 1,025,000 | 996,813 |
|
| Goodman Global Group, Inc. sr. unsec. disc. notes zero %, 2014 | 5,815,000 | 3,692,525 |
|
| Goodman Global, Inc. company guaranty sr. unsec. | | |
| sub. notes 13 1/2s, 2016 | 1,650,000 | 1,810,875 |
|
| Owens Corning, Inc. company guaranty unsec. | | |
| unsub. notes 9s, 2019 | 5,000,000 | 5,900,000 |
|
| THL Buildco, Inc. (Nortek Holdings, Inc.) sr. notes 11s, 2013 | 2,924,199 | 3,081,375 |
|
| | | 18,750,526 |
| Cable television (2.1%) | | |
| Adelphia Communications Corp. escrow bonds zero %, 2010 | 2,906,000 | 43,590 |
|
| Adelphia Communications Corp. escrow bonds zero %, 2011 | 81,000 | 1,215 |
|
| Adelphia Communications Corp. escrow bonds zero %, 2010 | 4,000 | 60 |
|
| Adelphia Communications Corp. escrow bonds zero %, 2010 | 4,000 | 60 |
|
| Adelphia Communications Corp. escrow bonds zero %, 2011 | 2,223,000 | 33,345 |
|
| Atlantic Broadband Finance, LLC company guaranty 9 3/8s, 2014 | 1,781,000 | 1,794,358 |
|
| Cablevision Systems Corp. sr. unsec. unsub. notes 8s, 2020 | 755,000 | 805,963 |
|
| Cablevision Systems Corp. sr. unsec. unsub. notes 7 3/4s, 2018 | 1,820,000 | 1,915,550 |
|
| Cablevision Systems Corp. 144A sr. notes 8 5/8s, 2017 | 2,795,000 | 3,046,550 |
|
| CCH II, LLC sr. notes 13 1/2s, 2016 | 6,188,928 | 7,333,880 |
|
25
| | | |
| CORPORATE BONDS AND NOTES (85.0%)* cont. | Principal amount | Value |
|
| Cable television cont. | | | |
| CCO Holdings LLC/CCO Holdings Capital Corp. 144A company | | | |
| guaranty sr. notes 7 7/8s, 2018 | | $1,140,000 | $1,179,900 |
|
| Cequel Communications Holdings I LLC/Cequel | | | |
| Capital Corp. 144A sr. notes 8 5/8s, 2017 | | 4,390,000 | 4,477,800 |
|
| Charter Communications Operating LLC/Charter Communications | | | |
| Operating Capital 144A company guaranty sr. notes 8s, 2012 | | 2,350,000 | 2,473,375 |
|
| CSC Holdings LLC sr. unsec. unsub. notes 8 1/2s, 2014 | | 542,000 | 592,135 |
|
| Mediacom Broadband, LLC/Mediacom Broadband Corp. sr. unsec. | | | |
| unsub. notes 8 1/2s, 2015 | | 760,000 | 754,300 |
|
| Mediacom LLC/Mediacom Capital Corp. sr. unsec. | | | |
| notes 9 1/8s, 2019 | | 1,165,000 | 1,165,000 |
|
| NTL Cable PLC sr. notes 9 1/8s, 2016 (United Kingdom) | | 1,780,000 | 1,902,375 |
|
| Virgin Media Finance PLC company guaranty sr. notes Ser. 1, | | | |
| 9 1/2s, 2016 (United Kingdom) | | 815,000 | 912,800 |
|
| | | | 28,432,256 |
| Capital goods (4.0%) | | | |
| ACCO Brands Corp. company guaranty sr. notes 10 5/8s, 2015 | | 1,755,000 | 1,930,500 |
|
| Altra Holdings, Inc. company guaranty sr. notes 8 1/8s, 2016 | | 4,110,000 | 4,192,200 |
|
| BBC Holding Corp. sr. notes 8 7/8s, 2014 | | 4,030,000 | 3,838,575 |
|
| Berry Plastics Corp. 144A sr. notes 9 1/2s, 2018 | | 2,055,000 | 1,890,600 |
|
| Case New Holland, Inc. 144A sr. notes 7 7/8s, 2017 (Netherlands) | | 1,775,000 | 1,868,188 |
|
| Cedar Fair LP/Canada’s Wonderland Co./Magnum Management | | | |
| Corp. 144A company guaranty sr. unsec. notes 9 1/8s, 2018 | | 420,000 | 427,350 |
|
| Cleaver-Brooks, Inc. 144A sr. notes 12 1/4s, 2016 | | 2,520,000 | 2,592,450 |
|
| Crown European Holdings SA 144A sr. notes 7 1/8s, | | | |
| 2018 (France) | EUR | 610,000 | 793,161 |
|
| Kratos Defense & Security Solutions, Inc. company | | | |
| guaranty sr. notes 10s, 2017 | | $2,795,000 | 2,885,838 |
|
| Legrand SA unsec. unsub. debs. 8 1/2s, 2025 (France) | | 7,826,000 | 9,798,950 |
|
| Mueller Water Products, Inc. company guaranty sr. unsec. | | | |
| notes 7 3/8s, 2017 | | 2,885,000 | 2,430,613 |
|
| Mueller Water Products, Inc. 144A company | | | |
| guaranty sr. unsec. unsub. notes 8 3/4s, 2020 | | 400,000 | 402,000 |
|
| Reynolds Group DL Escrow, Inc./Reynolds Group Escrow, LLC | | | |
| 144A company guaranty sr. notes 7 3/4s, 2016 (Luxembourg) | | 1,330,000 | 1,339,975 |
|
| Reynolds Group Issuer, Inc. 144A sr. notes 8 1/2s, 2018 | | 3,605,000 | 3,460,800 |
|
| Ryerson Holding Corp. 144A sr. disc. notes zero %, 2015 | | 2,215,000 | 991,213 |
|
| Ryerson Tull, Inc. company guaranty sr. sec. notes 12s, 2015 | | 3,538,000 | 3,639,718 |
|
| Tenneco, Inc. company guaranty 8 5/8s, 2014 | | 2,200,000 | 2,255,000 |
|
| Tenneco, Inc. 144A sr. notes 7 3/4s, 2018 | | 1,040,000 | 1,060,800 |
|
| Thermadyne Holdings Corp. company guaranty sr. unsec. | | | |
| sub. notes 10 1/2s, 2014 | | 2,635,000 | 2,664,644 |
|
| Thermon Industries, Inc. 144A company | | | |
| guaranty sr. notes 9 1/2s, 2017 | | 2,790,000 | 2,859,750 |
|
| TransDigm, Inc. company guaranty sr. unsec. | | | |
| sub. notes 7 3/4s, 2014 | | 1,471,000 | 1,515,130 |
|
| | | | 52,837,455 |
26
| | | |
| CORPORATE BONDS AND NOTES (85.0%)* cont. | Principal amount | Value |
|
| Coal (1.8%) | | | |
| Arch Coal, Inc. company guaranty sr. unsec. notes 7 1/4s, 2020 | | $2,295,000 | $2,329,425 |
|
| Arch Western Finance, LLC company | | | |
| guaranty sr. notes 6 3/4s, 2013 | | 2,141,000 | 2,151,705 |
|
| CONSOL Energy, Inc. 144A company guaranty sr. unsec. | | | |
| notes 8 1/4s, 2020 | | 4,745,000 | 5,035,631 |
|
| CONSOL Energy, Inc. 144A company guaranty sr. unsec. | | | |
| notes 8s, 2017 | | 3,785,000 | 3,993,175 |
|
| International Coal Group, Inc. sr. notes 9 1/8s, 2018 | | 2,595,000 | 2,750,700 |
|
| Peabody Energy Corp. company guaranty 7 3/8s, 2016 | | 5,441,000 | 5,930,690 |
|
| Peabody Energy Corp. company guaranty sr. unsec. | | | |
| unsub. notes 6 1/2s, 2020 | | 1,285,000 | 1,350,856 |
|
| | | | 23,542,182 |
| Commercial and consumer services (1.9%) | | | |
| Aramark Corp. company guaranty 8 1/2s, 2015 | | 3,319,000 | 3,422,719 |
|
| Corrections Corporation of America company | | | |
| guaranty sr. notes 7 3/4s, 2017 | | 3,640,000 | 3,885,700 |
|
| Lender Processing Services, Inc. company | | | |
| guaranty sr. unsec. unsub. notes 8 1/8s, 2016 | | 1,757,000 | 1,879,990 |
|
| National Money Mart Co. 144A company guaranty sr. unsec. | | | |
| unsub. notes 10 3/8s, 2016 (Canada) | | 2,895,000 | 3,039,750 |
|
| PHH Corp. 144A sr. unsec. notes 9 1/4s, 2016 | | 1,365,000 | 1,380,356 |
|
| Reddy Ice Corp. company guaranty sr. notes 11 1/4s, 2015 | | 2,000,000 | 2,027,500 |
|
| Sabre Holdings Corp. sr. unsec. unsub. notes 8.35s, 2016 | | 4,315,000 | 4,358,150 |
|
| Travelport LLC company guaranty 11 7/8s, 2016 | | 1,759,000 | 1,860,143 |
|
| Travelport LLC company guaranty 9 7/8s, 2014 | | 1,883,000 | 1,925,368 |
|
| Travelport LLC/Travelport, Inc. 144A company | | | |
| guaranty sr. unsec. notes 9s, 2016 | | 1,235,000 | 1,222,650 |
|
| | | | 25,002,326 |
| Conglomerates (0.1%) | | | |
| SPX Corp. 144A company guaranty sr. unsec. notes 6 7/8s, 2017 | | 920,000 | 947,600 |
|
| | | | 947,600 |
| Consumer (1.1%) | | | |
| Jarden Corp. company guaranty sr. sub. notes Ser. 1, | | | |
| 7 1/2s, 2020 | EUR | 410,000 | 508,678 |
|
| Jarden Corp. company guaranty sr. unsec. notes 8s, 2016 | | $1,120,000 | 1,183,000 |
|
| Jarden Corp. company guaranty sr. unsec. sub. notes | | | |
| 7 1/2s, 2017 | | 3,876,000 | 3,948,675 |
|
| Visant Corp. company guaranty sr. unsec. sub. notes | | | |
| 7 5/8s, 2012 | | 3,982,000 | 3,977,023 |
|
| Yankee Acquisition Corp. company guaranty sr. notes Ser. B, | | | |
| 8 1/2s, 2015 | | 4,352,000 | 4,406,400 |
|
| | | | 14,023,776 |
| Consumer staples (5.7%) | | | |
| Archibald Candy Corp. company guaranty 10s, | | | |
| 2010 (In default) F † | | 774,063 | 11,954 |
|
| Avis Budget Car Rental, LLC company guaranty sr. unsec. | | | |
| unsub. notes 9 5/8s, 2018 | | 585,000 | 611,325 |
|
| Avis Budget Car Rental, LLC company guaranty sr. unsec. | | | |
| unsub. notes 7 3/4s, 2016 | | 2,987,000 | 2,889,923 |
|
| Avis Budget Car Rental, LLC company guaranty sr. unsec. | | | |
| unsub. notes 7 5/8s, 2014 | | 2,447,000 | 2,440,883 |
|
27
| | | |
| CORPORATE BONDS AND NOTES (85.0%)* cont. | Principal amount | Value |
|
| Consumer staples cont. | | | |
| Central Garden & Pet Co. sr. sub. notes 8 1/4s, 2018 | | $2,840,000 | $2,861,300 |
|
| Chiquita Brands International, Inc. sr. notes 7 1/2s, 2014 | | 1,834,000 | 1,822,538 |
|
| Chiquita Brands International, Inc. sr. unsec. | | | |
| unsub. notes 8 7/8s, 2015 | | 738,000 | 747,225 |
|
| CKE Restaurants, Inc. 144A sr. notes 11 3/8s, 2018 | | 4,925,000 | 4,801,875 |
|
| Constellation Brands, Inc. company guaranty sr. unsec. | | | |
| unsub. notes 7 1/4s, 2016 | | 3,323,000 | 3,480,843 |
|
| Dean Foods Co. company guaranty 7s, 2016 | | 1,570,000 | 1,471,875 |
|
| Dole Food Co. 144A sr. sec. notes 8s, 2016 | | 1,405,000 | 1,448,906 |
|
| Dole Food Co. sr. notes 13 7/8s, 2014 | | 1,372,000 | 1,649,830 |
|
| Elizabeth Arden, Inc. company guaranty 7 3/4s, 2014 | | 3,418,000 | 3,430,818 |
|
| Games Merger Corp. 144A sr. notes 11s, 2018 | | 3,530,000 | 3,706,500 |
|
| Great Atlantic & Pacific Tea Co. 144A sr. notes 11 3/8s, 2015 | | 877,000 | 633,633 |
|
| Hertz Corp. company guaranty 8 7/8s, 2014 | | 3,740,000 | 3,842,850 |
|
| Hertz Holdings Netherlands BV 144A sr. bond 8 1/2s, | | | |
| 2015 (Netherlands) | EUR | 2,395,000 | 3,178,375 |
|
| JBS USA LLC/JBS USA Finance, Inc. sr. notes 11 5/8s, 2014 | | $1,050,000 | 1,203,563 |
|
| Libbey Glass, Inc. 144A sr. notes 10s, 2015 | | 1,180,000 | 1,253,750 |
|
| Michael Foods, Inc. 144A sr. notes 9 3/4s, 2018 | | 1,200,000 | 1,260,000 |
|
| Pinnacle Foods Finance LLC/Pinnacle Foods Finance Corp. | | | |
| sr. notes 9 1/4s, 2015 | | 1,450,000 | 1,488,063 |
|
| Pinnacle Foods Finance LLC/Pinnacle Foods Finance Corp. | | | |
| 144A sr. unsec. notes 9 1/4s, 2015 | | 1,045,000 | 1,072,431 |
|
| Prestige Brands, Inc. 144A company guaranty sr. unsec. | | | |
| notes 8 1/4s, 2018 | | 1,650,000 | 1,670,625 |
|
| Revlon Consumer Products Corp. company | | | |
| guaranty sr. notes 9 3/4s, 2015 | | 1,720,000 | 1,786,650 |
|
| Rite Aid Corp. company guaranty sr. notes 10 1/4s, 2019 | | 880,000 | 904,200 |
|
| Rite Aid Corp. company guaranty sr. notes 7 1/2s, 2017 | | 886,000 | 800,723 |
|
| Rite Aid Corp. company guaranty sr. unsec. | | | |
| unsub. notes 9 1/2s, 2017 | | 3,472,000 | 2,751,560 |
|
| Rite Aid Corp. 144A company guaranty sr. unsub. notes 8s, 2020 | | 740,000 | 735,375 |
|
| RSC Equipment Rental, Inc. 144A sr. sec. notes 10s, 2017 | | 1,695,000 | 1,847,550 |
|
| Smithfield Foods, Inc. sr. unsec. notes 7s, 2011 | | 775,000 | 791,469 |
|
| Smithfield Foods, Inc. sr. unsec. notes Ser. B, 7 3/4s, 2013 | | 2,640,000 | 2,653,200 |
|
| Smithfield Foods, Inc. 144A sr. sec. notes 10s, 2014 | | 1,660,000 | 1,852,975 |
|
| Spectrum Brands, Inc. sr. unsec. sub. bonds 12s, 2019 ‡‡ | | 2,717,932 | 2,914,982 |
|
| Spectrum Brands, Inc. 144A sr. notes 9 1/2s, 2018 | | 1,435,000 | 1,510,338 |
|
| SUPERVALU, Inc. sr. unsec. notes 8s, 2016 | | 1,865,000 | 1,869,663 |
|
| Tyson Foods, Inc. sr. unsec. unsub. notes 10 1/2s, 2014 | | 2,508,000 | 3,025,275 |
|
| Wendy’s/Arby’s Restaurants LLC company guaranty sr. unsec. | | | |
| unsub. notes 10s, 2016 | | 4,985,000 | 5,234,250 |
|
| | | | 75,657,295 |
| Energy (oil field) (1.9%) | | | |
| Complete Production Services, Inc. company guaranty 8s, 2016 | | 2,055,000 | 2,080,688 |
|
| Expro Finance Luxemburg 144A sr. notes 8 1/2s, 2016 | | | |
| (Luxembourg) | | 3,280,000 | 3,066,800 |
|
| Helix Energy Solutions Group, Inc. 144A sr. unsec. | | | |
| notes 9 1/2s, 2016 | | 6,787,000 | 6,685,195 |
|
28
| | |
| CORPORATE BONDS AND NOTES (85.0%)* cont. | Principal amount | Value |
|
| Energy (oil field) cont. | | |
| Hercules Offshore, Inc. 144A sr. notes 10 1/2s, 2017 | $1,350,000 | $1,228,500 |
|
| Key Energy Services, Inc. company guaranty sr. unsec. | | |
| unsub. notes 8 3/8s, 2014 | 4,200,000 | 4,336,500 |
|
| Offshore Logistics, Inc. company guaranty 6 1/8s, 2013 | 3,652,000 | 3,670,260 |
|
| Pride International, Inc. sr. unsec. notes 7 3/8s, 2014 | 2,793,000 | 2,861,652 |
|
| Stallion Oilfield Holdings Ltd. 144A sr. notes 10 1/2s, 2015 | 292,000 | 296,380 |
|
| Trico Shipping AS 144A sr. notes 13 7/8s, 2014 (Norway) | 1,735,000 | 1,518,125 |
|
| | | 25,744,100 |
| Entertainment (0.6%) | | |
| Cinemark, Inc. company guaranty sr. unsec. notes 8 5/8s, 2019 | 1,125,000 | 1,178,438 |
|
| Marquee Holdings, Inc. sr. disc. notes 9.505s, 2014 | 4,678,000 | 3,835,960 |
|
| Regal Entertainment Group company guaranty sr. unsec. | | |
| notes 9 1/8s, 2018 | 800,000 | 820,000 |
|
| Universal City Development Partners, Ltd. 144A | | |
| sr. notes 8 7/8s, 2015 | 1,075,000 | 1,091,125 |
|
| Universal City Development Partners, Ltd. 144A | | |
| sr. sub. notes 10 7/8s, 2016 | 735,000 | 784,613 |
|
| | | 7,710,136 |
| Financials (7.6%) | | |
| Ally Financial Inc. 144A company guaranty sr. unsec. | | |
| unsub. notes 7 1/2s, 2020 | 920,000 | 910,800 |
|
| American General Finance Corp. sr. unsec. notes Ser. MTN, | | |
| 6.9s, 2017 | 5,670,000 | 4,394,250 |
|
| American General Finance Corp. sr. unsec. notes Ser. MTNI, | | |
| Class I, 4 7/8s, 2012 | 3,035,000 | 2,765,644 |
|
| American General Finance Corp. sr. unsec. notes, MTN | | |
| Ser. J, 5 5/8s, 2011 | 906,000 | 881,085 |
|
| American International Group, Inc. jr. sub. bonds FRB | | |
| 8.175s, 2058 | 1,308,000 | 1,121,610 |
|
| BAC Capital Trust VI bank guaranty jr. unsec. | | |
| sub. notes 5 5/8s, 2035 | 1,820,000 | 1,589,948 |
|
| BAC Capital Trust XI bank guaranty jr. unsec. | | |
| sub. notes 6 5/8s, 2036 | 1,695,000 | 1,682,774 |
|
| BankAmerica Capital II bank guaranty jr. unsec. | | |
| sub. notes 8s, 2026 | 695,000 | 708,031 |
|
| Capital One Capital IV company guaranty jr. unsec. | | |
| sub. notes FRN 6.745s, 2037 | 1,674,000 | 1,590,300 |
|
| CB Richard Ellis Services, Inc. company guaranty sr. unsec. | | |
| sub. notes 11 5/8s, 2017 | 1,525,000 | 1,730,875 |
|
| CIT Group, Inc. sr. bond 7s, 2017 | 10,316,311 | 9,700,551 |
|
| CIT Group, Inc. sr. bond 7s, 2016 | 7,533,079 | 7,156,425 |
|
| CIT Group, Inc. sr. bond 7s, 2015 | 3,192,848 | 3,069,125 |
|
| CIT Group, Inc. sr. bond 7s, 2014 | 1,225,848 | 1,193,669 |
|
| CIT Group, Inc. sr. bond 7s, 2013 | 2,591,231 | 2,568,558 |
|
| E*Trade Financial Corp. sr. unsec. notes 7 3/8s, 2013 | 1,695,000 | 1,610,250 |
|
| E*Trade Financial Corp. sr. unsec. unsub. notes 12 1/2s, 2017 ‡‡ | 2,369,000 | 2,641,435 |
|
| GMAC, Inc. 144A company guaranty sr. unsec. notes 8s, 2020 | 1,270,000 | 1,301,750 |
|
| GMAC, LLC company guaranty sr. unsec. notes 6 7/8s, 2012 | 4,210,000 | 4,304,725 |
|
| GMAC, LLC company guaranty sr. unsec. notes 6 5/8s, 2012 | 1,291,000 | 1,313,593 |
|
29
| | |
| CORPORATE BONDS AND NOTES (85.0%)* cont. | Principal amount | Value |
|
| Financials cont. | | |
| GMAC, LLC company guaranty sr. unsec. notes Ser. 8, 6 3/4s, 2014 | $4,734,000 | $4,698,495 |
|
| GMAC, LLC company guaranty sr. unsec. unsub. notes FRN | | |
| 2.738s, 2014 | 624,000 | 536,470 |
|
| GMAC, LLC sr. unsec. unsub. notes 6 3/4s, 2014 | 1,442,000 | 1,425,231 |
|
| GMAC, LLC 144A company guaranty sr. unsec. notes 8.3s, 2015 | 2,485,000 | 2,584,400 |
|
| HBOS Capital Funding LP 144a bank guaranty jr. unsec. | | |
| sub. FRB 6.071s, 2049 (Jersey) | 1,760,000 | 1,372,800 |
|
| HBOS PLC 144A sr. unsec. sub. notes 6 3/4s, 2018 | | |
| (United Kingdom) | 2,805,000 | 2,742,336 |
|
| HUB International Holdings, Inc. 144A | | |
| sr. sub. notes 10 1/4s, 2015 | 1,156,000 | 1,092,420 |
|
| Icahn Enterprises LP/Ichan Enterprises Finance Corp. | | |
| company guaranty sr. unsec. notes 8s, 2018 | 5,295,000 | 5,268,525 |
|
| Interactive Data Corp. 144A company | | |
| guaranty sr. notes 10 1/4s, 2018 | 2,395,000 | 2,484,813 |
|
| iStar Financial, Inc. sr. unsec. unsub. notes Ser. B, 5.95s, 2013 R | 960,000 | 720,000 |
|
| Leucadia National Corp. sr. unsec. notes 8 1/8s, 2015 | 1,345,000 | 1,432,425 |
|
| Leucadia National Corp. sr. unsec. notes 7 1/8s, 2017 | 1,824,000 | 1,828,560 |
|
| NB Capital Trust IV jr. unsec. sub. notes 8 1/4s, 2027 | 680,000 | 696,788 |
|
| Nuveen Investments, Inc. company guaranty sr. unsec. | | |
| unsub. notes 10 1/2s, 2015 | 2,492,000 | 2,367,400 |
|
| Provident Funding Associates 144A sr. notes 10 1/4s, 2017 | 2,395,000 | 2,436,913 |
|
| Residential Capital LLC company guaranty jr. notes 9 5/8s, 2015 | 6,165,000 | 6,103,350 |
|
| Royal Bank of Scotland Group PLC jr. unsec. sub. bonds FRB | | |
| 7.648s, 2049 (United Kingdom) | 2,285,000 | 1,942,250 |
|
| SLM Corp. sr. notes Ser. MTN, 8s, 2020 | 1,975,000 | 1,728,125 |
|
| SLM Corp. sr. unsec. unsub. notes Ser. MTNA, 5s, 2013 | 6,590,000 | 6,211,075 |
|
| USI Holdings Corp. 144A company guaranty sr. unsec. | | |
| notes FRN 4.25125s, 2014 | 756,000 | 640,710 |
|
| | | 100,548,484 |
| Gaming and lottery (2.8%) | | |
| American Casino & Entertainment Properties LLC | | |
| sr. notes 11s, 2014 | 2,560,000 | 2,496,000 |
|
| Ameristar Casinos, Inc. company guaranty sr. unsec. | | |
| notes 9 1/4s, 2014 | 3,260,000 | 3,455,600 |
|
| Harrah’s Operating Co., Inc. company guaranty sr. notes 10s, 2018 | 5,856,000 | 4,567,680 |
|
| Harrah’s Operating Co., Inc. company guaranty sr. notes 10s, 2015 | 710,000 | 633,675 |
|
| Harrah’s Operating Co., Inc. sr. notes 11 1/4s, 2017 | 4,810,000 | 5,146,700 |
|
| Isle of Capri Casinos, Inc. company guaranty 7s, 2014 | 3,875,000 | 3,342,188 |
|
| Mashantucket Western Pequot Tribe 144A bonds 8 1/2s, | | |
| 2015 (In default) † | 4,615,000 | 738,400 |
|
| MGM Mirage, Inc. company guaranty sr. unsec. notes 6 5/8s, 2015 | 1,160,000 | 917,850 |
|
| MGM Mirage, Inc. sr. notes 10 3/8s, 2014 | 485,000 | 528,650 |
|
| MGM Mirage, Inc. sr. notes 6 3/4s, 2012 | 2,000 | 1,835 |
|
| MGM Mirage, Inc. 144A sr. notes 9s, 2020 | 515,000 | 534,313 |
|
| MTR Gaming Group, Inc. company guaranty sr. notes 12 5/8s, 2014 | 3,455,000 | 3,627,750 |
|
| Penn National Gaming, Inc. sr. unsec. sub. notes 8 3/4s, 2019 | 675,000 | 705,375 |
|
| Pinnacle Entertainment, Inc. company guaranty sr. unsec. | | |
| notes 8 5/8s, 2017 | 1,475,000 | 1,545,063 |
|
30
| | |
| CORPORATE BONDS AND NOTES (85.0%)* cont. | Principal amount | Value |
|
| Gaming and lottery cont. | | |
| Pinnacle Entertainment, Inc. company guaranty sr. unsec. | | |
| sub. notes 8 3/4s, 2020 | $475,000 | $458,375 |
|
| Pinnacle Entertainment, Inc. company guaranty sr. unsec. | | |
| sub. notes 7 1/2s, 2015 | 2,940,000 | 2,844,450 |
|
| Wynn Las Vegas, LLC/Wynn Las Vegas Capital Corp. 144A | | |
| company guaranty 1st mtge. notes 7 3/4s, 2020 | 1,485,000 | 1,499,850 |
|
| Yonkers Racing Corp. 144A sr. notes 11 3/8s, 2016 | 4,122,000 | 4,431,150 |
|
| | | 37,474,904 |
| Health care (6.6%) | | |
| Biomet, Inc. company guaranty sr. unsec. bond 10s, 2017 | 4,425,000 | 4,801,125 |
|
| Capella Healthcare, Inc. 144A company | | |
| guaranty sr. notes 9 1/4s, 2017 | 3,400,000 | 3,519,000 |
|
| Community Health Systems, Inc. company guaranty 8 7/8s, 2015 | 1,969,000 | 2,042,838 |
|
| DaVita, Inc. company guaranty 6 5/8s, 2013 | 3,127,000 | 3,142,635 |
|
| DaVita, Inc. company guaranty sr. unsec. sub. notes 7 1/4s, 2015 | 820,000 | 847,675 |
|
| Elan Finance PLC/Elan Finance Corp. 144A company | | |
| guaranty sr. notes 8 3/4s, 2016 (Ireland) | 3,550,000 | 3,443,500 |
|
| HCA, Inc. company guaranty sr. notes 9 5/8s, 2016 ‡‡ | 4,305,000 | 4,622,494 |
|
| HCA, Inc. company guaranty sr. notes 8 1/2s, 2019 | 4,655,000 | 5,103,044 |
|
| HCA, Inc. sr. sec. notes 9 1/4s, 2016 | 5,580,000 | 5,984,550 |
|
| HCA, Inc. sr. sec. notes 9 1/8s, 2014 | 4,712,000 | 4,947,600 |
|
| Health Management Associates, Inc. sr. notes 6 1/8s, 2016 | 3,165,000 | 3,066,094 |
|
| IASIS Healthcare/IASIS Capital Corp. sr. sub. notes 8 3/4s, 2014 | 80,000 | 81,600 |
|
| Multiplan, Inc. 144A company guaranty sr. notes 9 7/8s, 2018 | 2,010,000 | 2,020,050 |
|
| Psychiatric Solutions, Inc. company guaranty 7 3/4s, 2015 | 1,169,000 | 1,206,993 |
|
| Psychiatric Solutions, Inc. company guaranty sr. unsec. | | |
| sub. notes 7 3/4s, 2015 | 520,000 | 536,900 |
|
| Quintiles Transnational Corp. 144A sr. notes 9 1/2s, 2014 ‡‡ | 1,055,000 | 1,076,100 |
|
| Select Medical Corp. company guaranty 7 5/8s, 2015 | 3,095,000 | 2,917,038 |
|
| Stewart Enterprises, Inc. sr. notes 6 1/4s, 2013 | 6,211,000 | 6,203,236 |
|
| Sun Healthcare Group, Inc. company guaranty sr. unsec. | | |
| unsub. notes 9 1/8s, 2015 | 279,000 | 291,206 |
|
| Surgical Care Affiliates, Inc. 144A sr. sub. notes 10s, 2017 | 3,850,000 | 3,874,063 |
|
| Surgical Care Affiliates, Inc. 144A sr. unsec. | | |
| notes 8 7/8s, 2015 ‡‡ | 762,852 | 764,759 |
|
| Talecris Biotherapeutics Holdings Corp. company | | |
| guaranty sr. unsec. notes 7 3/4s, 2016 | 1,850,000 | 2,011,875 |
|
| Tenet Healthcare Corp. company guaranty sr. notes 10s, 2018 | 1,340,000 | 1,507,500 |
|
| Tenet Healthcare Corp. sr. notes 9s, 2015 | 5,394,000 | 5,744,610 |
|
| Tenet Healthcare Corp. 144A sr. unsec. notes 8s, 2020 | 2,450,000 | 2,376,500 |
|
| United Surgical Partners International, Inc. company | | |
| guaranty sr. unsec. sub. notes 8 7/8s, 2017 | 1,000,000 | 1,025,000 |
|
| US Oncology Holdings, Inc. sr. unsec. notes FRN 6.64344s, 2012 ‡‡ | 4,034,000 | 3,791,960 |
|
| US Oncology, Inc. company guaranty sr. unsec. | | |
| sub. notes 10 3/4s, 2014 | 2,142,000 | 2,211,615 |
|
| Ventas Realty LP/Capital Corp. company guaranty 9s, 2012 R | 6,916,000 | 7,319,756 |
|
| Ventas Realty LP/Capital Corp. sr. notes 6 5/8s, 2014 R | 1,556,000 | 1,617,207 |
|
| | | 88,098,523 |
31
| | |
| CORPORATE BONDS AND NOTES (85.0%)* cont. | Principal amount | Value |
|
| Homebuilding (1.3%) | | |
| Beazer Homes USA, Inc. company guaranty sr. unsec. | | |
| unsub. notes 9 1/8s, 2018 | $1,390,000 | $1,230,150 |
|
| Lennar Corp. 144A company guaranty sr. unsec. notes | | |
| 6.95s, 2018 | 3,450,000 | 3,048,938 |
|
| M/I Schottenstein Homes, Inc. company guaranty sr. unsec. | | |
| notes 6 7/8s, 2012 | 3,822,000 | 3,798,113 |
|
| Meritage Homes Corp. company guaranty 6 1/4s, 2015 | 698,000 | 664,845 |
|
| Realogy Corp. company guaranty sr. notes 11s, 2014 ‡‡ | 790,270 | 638,143 |
|
| Realogy Corp. company guaranty sr. unsec. notes 10 1/2s, 2014 | 5,650,000 | 4,604,750 |
|
| Standard Pacific Corp. company guaranty sr. notes 10 3/4s, 2016 | 1,950,000 | 2,052,375 |
|
| Standard Pacific Corp. company guaranty sr. unsec. | | |
| unsub. notes 7s, 2015 | 1,690,000 | 1,554,800 |
|
| | | 17,592,114 |
| Household furniture and appliances (0.2%) | | |
| Sealy Mattress Co. 144A company guaranty sr. sec. | | |
| notes 10 7/8s, 2016 | 2,331,000 | 2,599,065 |
|
| | | 2,599,065 |
| Lodging/Tourism (0.4%) | | |
| FelCor Lodging LP company guaranty sr. notes 10s, 2014 R | 3,790,000 | 4,045,825 |
|
| Marina District Finance Co., Inc. 144A company | | |
| guaranty sr. notes 9 7/8s, 2018 | 800,000 | 798,000 |
|
| Marina District Finance Co., Inc. 144A company | | |
| guaranty sr. notes 9 1/2s, 2015 | 800,000 | 794,000 |
|
| | | 5,637,825 |
| Media (1.5%) | | |
| Affinion Group, Inc. company guaranty 11 1/2s, 2015 | 2,361,000 | 2,482,001 |
|
| Affinion Group, Inc. company guaranty 10 1/8s, 2013 | 1,340,000 | 1,373,500 |
|
| Interpublic Group of Companies, Inc. (The) sr. unsec. | | |
| notes 10s, 2017 | 240,000 | 276,000 |
|
| Nielsen Finance LLC/Nielsen Finance Co. company | | |
| guaranty 10s, 2014 | 2,866,000 | 3,009,300 |
|
| Nielsen Finance LLC/Nielsen Finance Co. company | | |
| guaranty sr. unsec. sub. disc. notes stepped-coupon zero % | | |
| (12 1/2s, 8/1/11), 2016 †† | 4,160,000 | 4,123,600 |
|
| QVC Inc. 144A sr. notes 7 3/8s, 2020 | 1,425,000 | 1,446,375 |
|
| QVC Inc. 144A sr. sec. notes 7 1/2s, 2019 | 2,615,000 | 2,667,300 |
|
| WMG Acquisition Corp. company guaranty sr. sec. | | |
| notes 9 1/2s, 2016 | 2,280,000 | 2,382,600 |
|
| WMG Acquisition Corp. company | | |
| guaranty sr. sub. notes 7 3/8s, 2014 | 1,265,000 | 1,157,475 |
|
| WMG Holdings Corp. company guaranty sr. unsec. disc. | | |
| notes 9 1/2s, 2014 | 655,000 | 622,250 |
|
| | | 19,540,401 |
| Oil and gas (7.6%) | | |
| ATP Oil & Gas Corp. 144A sr. notes 11 7/8s, 2015 | 1,142,000 | 922,165 |
|
| Chaparral Energy, Inc. company guaranty sr. unsec. | | |
| notes 8 7/8s, 2017 | 4,203,000 | 4,034,880 |
|
| Chesapeake Energy Corp. company guaranty sr. unsec. | | |
| notes 9 1/2s, 2015 | 790,000 | 888,750 |
|
| Compton Petroleum Corp. company guaranty 7 5/8s, | | |
| 2013 (Canada) | 5,369,000 | 4,644,185 |
|
32
| | |
| CORPORATE BONDS AND NOTES (85.0%)* cont. | Principal amount | Value |
|
| Oil and gas cont. | | |
| Comstock Resources, Inc. company | | |
| guaranty sr. unsub. notes 8 3/8s, 2017 | $1,255,000 | $1,283,238 |
|
| Comstock Resources, Inc. sr. notes 6 7/8s, 2012 | 3,950,000 | 3,959,875 |
|
| Connacher Oil and Gas, Ltd. 144A sec. notes | | |
| 10 1/4s, 2015 (Canada) | 4,277,000 | 4,277,000 |
|
| Connacher Oil and Gas, Ltd. 144A sr. sec. notes 11 3/4s, | | |
| 2014 (Canada) | 2,435,000 | 2,641,975 |
|
| Crosstex Energy/Crosstex Energy Finance Corp. company | | |
| guaranty sr. unsec. notes 8 7/8s, 2018 | 2,960,000 | 3,056,200 |
|
| Denbury Resources, Inc. company | | |
| guaranty sr. sub. notes 9 3/4s, 2016 | 475,000 | 523,688 |
|
| Denbury Resources, Inc. company guaranty sr. unsec. | | |
| sub. notes 8 1/4s, 2020 | 2,062,000 | 2,201,185 |
|
| Denbury Resources, Inc. sr. sub. notes 7 1/2s, 2015 | 3,647,000 | 3,756,410 |
|
| Ferrellgas LP/Ferrellgas Finance Corp. sr. notes 6 3/4s, 2014 | 5,849,000 | 5,878,245 |
|
| Ferrellgas Partners LP sr. unsec. notes Ser. UNRE, 6 3/4s, 2014 | 374,000 | 375,870 |
|
| Forest Oil Corp. sr. notes 8s, 2011 | 4,280,000 | 4,477,950 |
|
| Inergy LP/Inergy Finance Corp. sr. unsec. notes 6 7/8s, 2014 | 6,319,000 | 6,350,595 |
|
| Newfield Exploration Co. sr. unsec. sub. notes 7 1/8s, 2018 | 490,000 | 512,050 |
|
| Newfield Exploration Co. sr. unsec. sub. notes 6 5/8s, 2014 | 6,054,000 | 6,190,215 |
|
| Offshore Group Investments, Ltd. 144A sr. notes 11 1/2s, 2015 | 1,590,000 | 1,586,025 |
|
| OPTI Canada, Inc. company guaranty sr. sec. notes 8 1/4s, | | |
| 2014 (Canada) | 2,275,000 | 1,774,500 |
|
| OPTI Canada, Inc. company guaranty sr. sec. notes 7 7/8s, | | |
| 2014 (Canada) | 5,540,000 | 4,265,800 |
|
| OPTI Canada, Inc. 144A company guaranty sr. notes 9 3/4s, | | |
| 2013 (Canada) | 625,000 | 618,750 |
|
| OPTI Canada, Inc. 144A sr. notes 9s, 2012 (Canada) | 210,000 | 210,525 |
|
| Petrohawk Energy Corp. company guaranty sr. unsec. | | |
| notes 10 1/2s, 2014 | 585,000 | 653,738 |
|
| Petrohawk Energy Corp. 144A company guaranty sr. unsec. | | |
| notes 7 1/4s, 2018 | 1,990,000 | 1,975,075 |
|
| Petroleum Development Corp. company guaranty sr. unsec. | | |
| notes 12s, 2018 | 3,325,000 | 3,574,375 |
|
| Plains Exploration & Production Co. company | | |
| guaranty 7 3/4s, 2015 | 787,000 | 798,805 |
|
| Plains Exploration & Production Co. company guaranty 7s, 2017 | 4,966,000 | 4,879,095 |
|
| Quicksilver Resources, Inc. company guaranty 7 1/8s, 2016 | 1,017,000 | 976,320 |
|
| Quicksilver Resources, Inc. company guaranty sr. unsec. | | |
| notes 8 1/4s, 2015 | 1,223,000 | 1,247,460 |
|
| Quicksilver Resources, Inc. sr. notes 11 3/4s, 2016 | 1,585,000 | 1,822,750 |
|
| Range Resources Corp. company | | |
| guaranty sr. sub. notes 6 3/4s, 2020 | 1,080,000 | 1,088,100 |
|
| Rosetta Resources, Inc. 144A company guaranty sr. unsec. | | |
| notes 9 1/2s, 2018 | 2,430,000 | 2,478,600 |
|
| Sabine Pass LNG LP sec. notes 7 1/2s, 2016 | 4,926,000 | 4,365,668 |
|
| SandRidge Energy, Inc. 144A company guaranty sr. unsec. | | |
| unsub. notes 8s, 2018 | 5,452,000 | 5,124,880 |
|
| SandRidge Energy, Inc. 144A sr. unsec. notes 9 7/8s, 2016 | 925,000 | 920,375 |
|
33
| | |
| CORPORATE BONDS AND NOTES (85.0%)* cont. | Principal amount | Value |
|
| Oil and gas cont. | | |
| Whiting Petroleum Corp. company guaranty 7s, 2014 | $2,107,000 | $2,180,745 |
|
| Williams Cos., Inc. (The) notes 7 3/4s, 2031 | 474,000 | 550,840 |
|
| Williams Cos., Inc. (The) sr. unsec. notes 7 7/8s, 2021 | 1,033,000 | 1,254,525 |
|
| Williams Cos., Inc. (The) 144A notes 6 3/8s, 2010 | 1,915,000 | 1,920,806 |
|
| | | 100,242,233 |
| Publishing (0.9%) | | |
| American Media Operations, Inc. 144A sr. sub. notes 14s, 2013 ‡‡ | 3,996,959 | 2,598,023 |
|
| American Media Operations, Inc. 144A sr. unsec. notes 9s, 2013 ‡‡ | 318,584 | 324,956 |
|
| Cengage Learning Acquisitions, Inc. 144A sr. notes 10 1/2s, 2015 | 3,280,000 | 3,132,400 |
|
| Cenveo Corp. company guaranty sr. notes 8 7/8s, 2018 | 2,080,000 | 1,981,200 |
|
| Cenveo Corp. 144A company guaranty sr. unsec. | | |
| notes 10 1/2s, 2016 | 849,000 | 847,939 |
|
| McClatchy Co. (The) 144A company | | |
| guaranty sr. notes 11 1/2s, 2017 | 2,365,000 | 2,441,863 |
|
| Vertis, Inc. company guaranty sr. notes 13 1/2s, 2014 ‡‡ | 3,160,547 | 1,208,909 |
|
| | | 12,535,290 |
| Regional Bells (1.2%) | | |
| Cincinnati Bell, Inc. company guaranty sr. unsec. notes 7s, 2015 | 1,218,000 | 1,181,460 |
|
| Cincinnati Bell, Inc. company guaranty sr. unsec. | | |
| sub. notes 8 3/4s, 2018 | 2,745,000 | 2,621,475 |
|
| Frontier Communications Corp. sr. unsec. notes 8 1/2s, 2020 | 2,615,000 | 2,775,169 |
|
| Frontier Communications Corp. sr. unsec. notes 8 1/4s, 2017 | 2,770,000 | 2,929,275 |
|
| Frontier Communications Corp. sr. unsec. notes 8 1/8s, 2018 | 2,540,000 | 2,686,050 |
|
| Qwest Communications International, Inc. company | | |
| guaranty 7 1/2s, 2014 | 462,000 | 470,663 |
|
| Qwest Corp. sr. unsec. unsub. notes 7 1/4s, 2025 | 2,586,000 | 2,673,278 |
|
| | | 15,337,370 |
| Retail (3.2%) | | |
| Autonation, Inc. company guaranty sr. unsec. notes 6 3/4s, 2018 | 800,000 | 803,000 |
|
| Blockbuster, Inc. 144A company guaranty sr. notes 11 3/4s, | | |
| 2014 (In default) † | 1,810,000 | 923,100 |
|
| Bon-Ton Stores, Inc. (The) company guaranty 10 1/4s, 2014 | 3,701,000 | 3,441,930 |
|
| Burlington Coat Factory Warehouse Corp. company | | |
| guaranty sr. unsec. notes 11 1/8s, 2014 | 3,121,000 | 3,230,235 |
|
| Dollar General Corp. company guaranty sr. unsec. | | |
| notes 10 5/8s, 2015 | 2,028,000 | 2,225,730 |
|
| Harry & David Operations Corp. company guaranty sr. unsec. | | |
| notes 9s, 2013 | 2,279,000 | 1,492,745 |
|
| Harry & David Operations Corp. company guaranty sr. unsec. | | |
| notes FRN 5.29688s, 2012 | 1,012,000 | 652,740 |
|
| Limited Brands, Inc. company guaranty sr. unsec. | | |
| unsub. notes 7s, 2020 | 1,040,000 | 1,086,800 |
|
| Macy’s Retail Holdings, Inc. company guaranty sr. unsec. | | |
| unsub. notes 8 7/8s, 2015 | 2,580,000 | 2,915,400 |
|
| Michaels Stores, Inc. company guaranty 11 3/8s, 2016 | 4,555,000 | 4,885,238 |
|
| Neiman-Marcus Group, Inc. company guaranty sr. unsec. | | |
| notes 9s, 2015 ‡‡ | 6,290,434 | 6,369,064 |
|
| Neiman-Marcus Group, Inc. company guaranty sr. unsec. | | |
| sub. notes 10 3/8s, 2015 | 1,415,000 | 1,439,763 |
|
34
| | |
| CORPORATE BONDS AND NOTES (85.0%)* cont. | Principal amount | Value |
|
| Retail cont. | | |
| Toys R Us Property Co., LLC company guaranty sr. unsec. | | |
| notes 10 3/4s, 2017 | $4,475,000 | $5,045,563 |
|
| Toys R Us Property Co., LLC 144A sr. notes 8 1/2s, 2017 | 2,400,000 | 2,496,000 |
|
| Toys R US-Delaware, Inc. 144A company | | |
| guaranty sr. notes 7 3/8s, 2016 | 610,000 | 616,100 |
|
| United Auto Group, Inc. company guaranty 7 3/4s, 2016 | 4,421,000 | 4,222,055 |
|
| | | 41,845,463 |
| Technology (4.5%) | | |
| Advanced Micro Devices, Inc. sr. unsec. notes 8 1/8s, 2017 | 1,940,000 | 1,983,650 |
|
| Advanced Micro Devices, Inc. 144A sr. notes 7 3/4s, 2020 | 835,000 | 826,650 |
|
| Ceridian Corp. company guaranty sr. unsec. notes | | |
| 12 1/4s, 2015 ‡‡ | 2,751,850 | 2,504,184 |
|
| Ceridian Corp. sr. unsec. notes 11 1/4s, 2015 | 3,360,000 | 3,112,200 |
|
| Compucom Systems, Inc. 144A sr. sub. notes 12 1/2s, 2015 | 1,462,000 | 1,536,928 |
|
| Fidelity National Information Services, Inc. 144A company | | |
| guaranty sr. notes 7 7/8s, 2020 | 1,475,000 | 1,548,750 |
|
| Fidelity National Information Services, Inc. 144A company | | |
| guaranty sr. notes 7 5/8s, 2017 | 1,475,000 | 1,537,688 |
|
| First Data Corp. company guaranty sr. unsec. notes 10.55s, | | |
| 2015 ‡‡ | 7,036,938 | 5,295,296 |
|
| First Data Corp. company guaranty sr. unsec. | | |
| sub. notes 11 1/4s, 2016 | 3,375,000 | 2,219,063 |
|
| First Data Corp. 144A company guaranty sr. notes 8 7/8s, 2020 | 1,015,000 | 1,017,538 |
|
| Freescale Semiconductor, Inc. company guaranty sr. unsec. | | |
| notes 9 1/8s, 2014 ‡‡ | 4,808,551 | 4,459,931 |
|
| Freescale Semiconductor, Inc. company guaranty sr. unsec. | | |
| notes 8 7/8s, 2014 | 226,000 | 209,615 |
|
| Freescale Semiconductor, Inc. company guaranty sr. unsec. | | |
| sub. notes 10 1/8s, 2016 | 635,000 | 520,700 |
|
| Freescale Semiconductor, Inc. 144A company | | |
| guaranty sr. notes 10 1/8s, 2018 | 1,495,000 | 1,536,113 |
|
| Freescale Semiconductor, Inc. 144A company | | |
| guaranty sr. notes 9 1/4s, 2018 | 2,645,000 | 2,651,613 |
|
| Iron Mountain, Inc. company guaranty 8 3/4s, 2018 | 698,000 | 736,390 |
|
| Iron Mountain, Inc. company guaranty 7 3/4s, 2015 | 60,000 | 60,600 |
|
| Iron Mountain, Inc. company guaranty 6 5/8s, 2016 | 211,000 | 211,000 |
|
| Iron Mountain, Inc. sr. sub. notes 8 3/8s, 2021 | 960,000 | 1,020,000 |
|
| Jazz Technologies, Inc. 144A notes 8s, 2015 F | 2,491,000 | 2,142,260 |
|
| Lucent Technologies, Inc. unsec. debs. 6.45s, 2029 | 529,000 | 357,075 |
|
| NXP BV/NXP Funding, LLC company guaranty Ser. EXCH, 9 1/2s, | | |
| 2015 (Netherlands) | 2,685,000 | 2,611,163 |
|
| NXP BV/NXP Funding, LLC company guaranty sr. sec. notes FRN | | |
| Ser. EXCH, 3.27594s, 2013 (Netherlands) | 2,565,000 | 2,398,275 |
|
| NXP BV/NXP Funding, LLC sec. notes Ser. EXCH, 7 7/8s, | | |
| 2014 (Netherlands) | 1,165,000 | 1,170,825 |
|
| NXP BV/NXP Funding, LLC 144A company | | |
| guaranty sr. notes 9 3/4s, 2018 (Netherlands) | 3,105,000 | 3,198,150 |
|
| STATS ChipPAC, Ltd. 144A company guaranty sr. unsec. | | |
| notes 7 1/2s, 2015 (Singapore) | 400,000 | 416,500 |
|
| SunGard Data Systems, Inc. company guaranty 10 1/4s, 2015 | 3,027,000 | 3,178,350 |
|
35
| | |
| CORPORATE BONDS AND NOTES (85.0%)* cont. | Principal amount | Value |
|
| Technology cont. | | |
| SunGard Data Systems, Inc. company guaranty 9 1/8s, 2013 | $2,624,000 | $2,679,760 |
|
| SunGard Data Systems, Inc. company guaranty sr. unsec. | | |
| unsub. notes 10 5/8s, 2015 | 589,000 | 650,845 |
|
| Syniverse Technologies, Inc. sr. sub. notes Ser. B, 7 3/4s, 2013 | 641,000 | 653,179 |
|
| Unisys Corp. sr. unsec. unsub. notes 12 1/2s, 2016 | 835,000 | 914,325 |
|
| Unisys Corp. 144A company guaranty sr. sub. notes 14 1/4s, 2015 | 4,285,000 | 5,034,875 |
|
| Xerox Capital Trust I company guaranty 8s, 2027 | 1,647,000 | 1,679,620 |
|
| | | 60,073,111 |
| Telecommunications (7.0%) | | |
| Angel Lux Common Sarl 144A sr. bond 8 7/8s, 2016 (Denmark) | 931,000 | 977,550 |
|
| CC Holdings GS V, LLC/Crown Castle GS III Corp. 144A | | |
| sr. sec. notes 7 3/4s, 2017 | 1,095,000 | 1,193,550 |
|
| Clearwire Communications, LLC/Clearwire Finance, Inc. 144A | | |
| company guaranty sr. notes 12s, 2015 | 3,545,000 | 3,545,000 |
|
| Clearwire Communications, LLC/Clearwire Finance, Inc. 144A | | |
| company guaranty sr. notes 12s, 2015 | 2,640,000 | 2,646,600 |
|
| Digicel Group, Ltd. 144A sr. notes 10 1/2s, 2018 (Jamaica) | 1,490,000 | 1,598,025 |
|
| Digicel Group, Ltd. 144A sr. notes 8 1/4s, 2017 (Jamaica) | 2,540,000 | 2,638,425 |
|
| Digicel Group, Ltd. 144A sr. unsec. notes 8 7/8s, 2015 (Jamaica) | 1,064,000 | 1,071,980 |
|
| Inmarsat Finance PLC 144A company | | |
| guaranty sr. notes 7 3/8s, 2017 (United Kingdom) | 315,000 | 322,875 |
|
| Intelsat Bermuda, Ltd. company guaranty sr. unsec. | | |
| notes 11 1/2s, 2017 (Luxembourg) ‡‡ | 1,411,000 | 1,453,330 |
|
| Intelsat Bermuda, Ltd. company guaranty sr. unsec. | | |
| notes 11 1/4s, 2017 (Luxembourg) | 5,774,000 | 5,976,090 |
|
| Intelsat Intermediate Holding Co., Ltd. company | | |
| guaranty sr. unsec. notes 9 1/2s, 2015 (Luxembourg) | 765,000 | 793,688 |
|
| Intelsat Intermediate Holding Co., Ltd. company | | |
| guaranty sr. unsec. notes 9 1/4s, 2015 (Luxembourg) | 2,118,000 | 2,181,540 |
|
| Intelsat Jackson Holding Co. company guaranty sr. unsec. | | |
| notes 11 1/4s, 2016 (Bermuda) | 7,644,000 | 8,221,886 |
|
| Intelsat Subsidiary Holding Co., Ltd. company | | |
| guaranty sr. unsec. notes 8 7/8s, 2015 (Bermuda) | 1,825,000 | 1,884,313 |
|
| Intelsat Subsidiary Holding Co., Ltd. company | | |
| guaranty sr. unsec. notes 8 1/2s, 2013 (Bermuda) | 557,000 | 563,963 |
|
| Level 3 Financing, Inc. company guaranty 9 1/4s, 2014 | 5,208,000 | 4,589,550 |
|
| MetroPCS Wireless, Inc. company guaranty sr. unsec. | | |
| notes 9 1/4s, 2014 | 6,625,000 | 6,890,000 |
|
| Nextel Communications, Inc. company guaranty sr. unsec. | | |
| notes Ser. D, 7 3/8s, 2015 | 6,135,000 | 6,073,650 |
|
| NII Capital Corp. company guaranty sr. unsec. | | |
| unsub. notes 10s, 2016 | 4,280,000 | 4,798,950 |
|
| PAETEC Holding Corp. company guaranty sr. notes 8 7/8s, 2017 | 2,080,000 | 2,152,800 |
|
| PAETEC Holding Corp. company guaranty sr. unsec. | | |
| unsub. notes 9 1/2s, 2015 | 2,571,000 | 2,564,573 |
|
| SBA Telecommunications, Inc. company guaranty sr. unsec. | | |
| notes 8 1/4s, 2019 | 465,000 | 504,525 |
|
| SBA Telecommunications, Inc. company guaranty sr. unsec. | | |
| notes 8s, 2016 | 3,030,000 | 3,230,738 |
|
| Sprint Capital Corp. company guaranty 6 7/8s, 2028 | 6,828,000 | 5,701,380 |
|
36
| | | |
| CORPORATE BONDS AND NOTES (85.0%)* cont. | Principal amount | Value |
|
| Telecommunications cont. | | | |
| Sprint Nextel Corp. sr. notes 8 3/8s, 2017 | | $3,700,000 | $3,820,250 |
|
| West Corp. company guaranty 9 1/2s, 2014 | | 4,023,000 | 4,103,460 |
|
| Wind Acquisition Finance SA 144A sr. notes 11 3/4s, 2017 | | | |
| (Netherlands) | | 4,555,000 | 5,010,500 |
|
| Wind Acquisition Finance SA 144A sr. notes 11 3/4s, 2017 | | | |
| (Netherlands) | EUR | 255,000 | 353,379 |
|
| Wind Acquisition Holdings Finance SA 144A company | | | |
| guaranty sr. notes zero %, 2017 (Italy) ‡‡ | | $2,046,485 | 2,118,112 |
|
| Windstream Corp. company guaranty 8 5/8s, 2016 | | 3,492,000 | 3,605,490 |
|
| Windstream Corp. company guaranty 8 1/8s, 2013 | | 1,975,000 | 2,105,844 |
|
| Windstream Corp. company guaranty sr. unsec. | | | |
| unsub. notes 7 7/8s, 2017 | | 450,000 | 456,750 |
|
| | | | 93,148,766 |
| Telephone (0.4%) | | | |
| Cricket Communications, Inc. company guaranty 9 3/8s, 2014 | | 3,612,000 | 3,657,150 |
|
| Cricket Communications, Inc. company | | | |
| guaranty sr. unsub. notes 7 3/4s, 2016 | | 1,855,000 | 1,915,288 |
|
| | | | 5,572,438 |
| Textiles (0.8%) | | | |
| Hanesbrands, Inc. company guaranty sr. unsec. notes FRN | | | |
| Ser. B, 4.12113s, 2014 | | 4,800,000 | 4,560,000 |
|
| Hanesbrands, Inc. sr. unsec. notes 8s, 2016 | | 1,640,000 | 1,707,650 |
|
| Levi Strauss & Co. sr. unsec. notes 8 7/8s, 2016 | | 972,000 | 1,023,030 |
|
| Levi Strauss & Co. sr. unsec. unsub. notes 7 5/8s, 2020 | | 2,965,000 | 3,016,888 |
|
| | | | 10,307,568 |
| Tire and rubber (0.4%) | | | |
| Goodyear Tire & Rubber Co. (The) sr. unsec. notes 10 1/2s, 2016 | | 4,535,000 | 5,033,850 |
|
| | | | 5,033,850 |
| Transportation (0.3%) | | | |
| Inaer Aviation Finance Ltd. 144A sr. notes 9 1/2s, 2017 (Spain) | EUR | 1,545,000 | 1,893,426 |
|
| RailAmerica, Inc. company guaranty sr. notes 9 1/4s, 2017 | | $2,085,000 | 2,262,225 |
|
| | | | 4,155,651 |
| Utilities and power (4.6%) | | | |
| AES Corp. (The) sr. unsec. notes 8s, 2020 | | 1,291,000 | 1,355,550 |
|
| AES Corp. (The) sr. unsec. unsub. notes 9 3/4s, 2016 | | 270,000 | 301,050 |
|
| AES Corp. (The) sr. unsec. unsub. notes 8s, 2017 | | 1,655,000 | 1,741,888 |
|
| AES Corp. (The) 144A sec. notes 8 3/4s, 2013 | | 1,240,000 | 1,261,700 |
|
| Calpine Corp. 144A company guaranty sr. notes 7 7/8s, 2020 | | 2,230,000 | 2,241,150 |
|
| Calpine Corp. 144A sr. sec. notes 7 1/4s, 2017 | | 4,228,000 | 4,217,430 |
|
| Colorado Interstate Gas Co. debs. 6.85s, 2037 (Canada) | | 3,247,000 | 3,460,867 |
|
| Dynegy Holdings, Inc. sr. unsec. notes 7 3/4s, 2019 | | 2,320,000 | 1,496,400 |
|
| Dynegy-Roseton Danskamme company guaranty Ser. B, | | | |
| 7.67s, 2016 | | 4,885,000 | 4,420,925 |
|
| Edison Mission Energy sr. unsec. notes 7 3/4s, 2016 | | 1,916,000 | 1,410,655 |
|
| Edison Mission Energy sr. unsec. notes 7 1/2s, 2013 | | 435,000 | 396,394 |
|
| Edison Mission Energy sr. unsec. notes 7.2s, 2019 | | 1,900,000 | 1,263,500 |
|
| Edison Mission Energy sr. unsec. notes 7s, 2017 | | 60,000 | 40,950 |
|
| El Paso Corp. sr. unsec. notes 12s, 2013 | | 1,005,000 | 1,208,513 |
|
| El Paso Corp. sr. unsec. notes Ser. GMTN, 7.8s, 2031 | | 121,000 | 121,303 |
|
| El Paso Natural Gas Co. debs. 8 5/8s, 2022 | | 1,597,000 | 2,025,555 |
|
37
| | |
| CORPORATE BONDS AND NOTES (85.0%)* cont. | Principal amount | Value |
|
| Utilities and power cont. | | |
| Energy Future Holdings Corp. company guaranty sr. unsec. | | |
| notes 11 1/4s, 2017 ‡‡ | $565,900 | $271,632 |
|
| Energy Future Holdings Corp. 144A sr. sec. bond 10s, 2020 | 940,000 | 905,223 |
|
| Energy Future Intermediate Holdings Co., LLC sr. notes 10s, 2020 | 1,354,000 | 1,301,170 |
|
| Ipalco Enterprises, Inc. sr. sec. notes 8 5/8s, 2011 | 914,000 | 959,700 |
|
| Ipalco Enterprises, Inc. 144A sr. sec. notes 7 1/4s, 2016 | 562,000 | 587,290 |
|
| Mirant Americas Generation, Inc. sr. unsec. notes 9 1/8s, 2031 | 2,070,000 | 1,855,238 |
|
| Mirant Americas Generation, Inc. sr. unsec. notes 8.3s, 2011 | 1,866,000 | 1,914,983 |
|
| Mirant North America, LLC company guaranty 7 3/8s, 2013 | 4,782,000 | 4,889,595 |
|
| NRG Energy, Inc. company guaranty 7 3/8s, 2017 | 2,440,000 | 2,467,450 |
|
| NRG Energy, Inc. sr. notes 7 3/8s, 2016 | 9,600,000 | 9,672,000 |
|
| PNM Resources, Inc. unsec. unsub. notes 9 1/4s, 2015 | 440,000 | 471,350 |
|
| Sierra Pacific Resources sr. unsec. notes 8 5/8s, 2014 | 2,367,000 | 2,435,051 |
|
| Tennessee Gas Pipeline Co. sr. unsec. unsub. debs. 7s, 2028 | 639,000 | 710,077 |
|
| Texas Competitive Electric Holdings Co., LLC company | | |
| guaranty sr. unsec. notes zero %, 2016 (United Kingdom) ‡‡ | 3,638,781 | 2,110,493 |
|
| Texas Competitive Electric Holdings Co., LLC company | | |
| guaranty sr. unsec. notes Ser. B, 10 1/4s, 2015 (United Kingdom) | 4,025,000 | 2,565,938 |
|
| Utilicorp United, Inc. sr. unsec. notes 7.95s, 2011 | 156,000 | 160,201 |
|
| | | 60,241,221 |
| | | |
| Total corporate bonds and notes (cost $1,102,970,688) | | $1,125,268,530 |
| |
| |
| SENIOR LOANS (5.7%)* c | Principal amount | Value |
|
| Automotive (0.2%) | | |
| Visteon Corp. bank term loan FRN Ser. B, 5 1/4s, 2013 | $3,060,000 | $3,281,850 |
|
| | | 3,281,850 |
| Basic materials (0.4%) | | |
| Ineos Holdings, Ltd. bank term loan FRN Ser. B2, 7.501s, | | |
| 2013 (United Kingdom) | 1,593,854 | 1,577,916 |
|
| Ineos Holdings, Ltd. bank term loan FRN Ser. C2, 8.001s, | | |
| 2014 (United Kingdom) | 1,593,854 | 1,577,916 |
|
| Smurfit-Stone Container Enterprises, Inc. bank term loan | | |
| FRN 6 3/4s, 2016 | 1,880,000 | 1,885,371 |
|
| | | 5,041,203 |
| Broadcasting (0.3%) | | |
| Clear Channel Communications, Inc. bank term loan FRN | | |
| Ser. B, 3.966s, 2016 | 1,999,026 | 1,590,060 |
|
| Univision Communications, Inc. bank term loan FRN Ser. B, | | |
| 2.566s, 2014 | 2,297,918 | 1,974,486 |
|
| | | 3,564,546 |
| Capital goods (0.2%) | | |
| Exopack Holding Corp. bank term loan FRN 4 3/4s, 2014 | 3,185,000 | 3,165,056 |
|
| | | 3,165,056 |
| Communication services (0.2%) | | |
| CCO Holdings, LLC/CCO Holdings Capital Corp. bank term | | |
| loan FRN, 3.038s, 2014 | 2,430,000 | 2,214,945 |
|
| | | 2,214,945 |
| Consumer cyclicals (1.4%) | | |
| CCM Merger, Inc. bank term loan FRN Ser. B, 8 1/2s, 2012 | 3,965,895 | 3,924,998 |
|
| Cedar Fair LP bank term loan FRN Ser. B, 5 1/2s, 2016 | 1,095,000 | 1,098,935 |
|
| Dex Media West, LLC bank term loan FRN Ser. A, 7s, 2014 | 627,347 | 542,786 |
|
38
| | |
| SENIOR LOANS (5.7%)* c cont. | Principal amount | Value |
|
| Consumer cyclicals cont. | | |
| GateHouse Media, Inc. bank term loan FRN Ser. B, 2.33s, 2014 | $2,394,574 | $922,509 |
|
| GateHouse Media, Inc. bank term loan FRN Ser. DD, 2.275s, 2014 | 893,497 | 344,220 |
|
| QVC, Inc. bank term loan FRN 5.762s, 2014 | 170,438 | 170,140 |
|
| Reynolds Consumer Products, Inc. bank term loan FRN Ser. B, | | |
| 6 1/4s, 2015 | 1,520,438 | 1,512,455 |
|
| Six Flags Theme Parks bank term loan FRN 9 1/4s, 2016 | 1,980,000 | 2,022,075 |
|
| Six Flags Theme Parks bank term loan FRN Ser. B, 6s, 2016 | 2,873,571 | 2,869,083 |
|
| Thomas Learning bank term loan FRN Ser. B, 3.03s, 2014 | 1,432,728 | 1,268,289 |
|
| Tribune Co. bank term loan FRN Ser. B, 5 1/4s, | | |
| 2014 (In default) † | 6,410,500 | 4,043,192 |
|
| | | 18,718,682 |
| Consumer staples (0.4%) | | |
| Claire’s Stores, Inc. bank term loan FRN 3.088s, 2014 | 3,179,301 | 2,718,283 |
|
| Revlon Consumer Products bank term loan FRN 6s, 2015 | 1,920,188 | 1,899,956 |
|
| Rite-Aid Corp. bank term loan FRN Ser. B, 2.046s, 2014 | 327,149 | 291,758 |
|
| Spectrum Brands, Inc. bank term loan FRN 8s, 2016 | 880,000 | 889,167 |
|
| | | 5,799,164 |
| Energy (0.1%) | | |
| MEG Energy Corp. bank term loan FRN 6s, 2016 (Canada) | 764,225 | 762,314 |
|
| | | 762,314 |
| Financials (0.7%) | | |
| AGFS Funding Co. bank term loan FRN 7 1/4s, 2015 | 2,435,000 | 2,406,084 |
|
| CB Richard Ellis Services, Inc. bank term loan FRN Ser. B, | | |
| 5 1/2s, 2013 | 907,619 | 907,336 |
|
| HUB International Holdings, Inc. bank term loan FRN 6 3/4s, 2014 | 1,374,613 | 1,348,839 |
|
| Interactive Data Corp. bank term loan FRN Ser. B, 6 3/4s, 2016 | 2,065,000 | 2,077,045 |
|
| iStar Financial, Inc. bank term loan FRN 1.766s, 2011 | 2,045,000 | 1,821,328 |
|
| Nuveen Investments, Inc. bank term loan FRN Ser. B, 3.511s, 2014 | 1,145,028 | 1,010,846 |
|
| | | 9,571,478 |
| Gaming and lottery (0.1%) | | |
| Harrah’s Operating Co., Inc. bank term loan FRN Ser. B, | | |
| 9 1/2s, 2016 | 855,700 | 873,290 |
|
| Harrah’s Operating Co., Inc. bank term loan FRN Ser. B2, | | |
| 3.498s, 2015 | 1,275,000 | 1,092,732 |
|
| | | 1,966,022 |
| Health care (0.4%) | | |
| Ardent Health Systems bank term loan FRN Ser. B, 6 1/2s, 2015 | 2,683,275 | 2,614,516 |
|
| Fenwal, Inc. bank term loan FRN 5.788s, 2014 | 500,000 | 410,000 |
|
| IASIS Healthcare, LLC/IASIS Capital Corp. bank term loan | | |
| FRN 5.725s, 2014 ‡‡ | 2,284,944 | 2,170,697 |
|
| Select Medical Corp. bank term loan FRN Ser. B, 2.339s, 2012 | 434,398 | 422,181 |
|
| | | 5,617,394 |
| Homebuilding (0.1%) | | |
| Realogy Corp. bank term loan FRN 0.109s, 2013 | 147,333 | 127,127 |
|
| Realogy Corp. bank term loan FRN Ser. B, 3.295s, 2013 | 859,460 | 741,592 |
|
| | | 868,719 |
| Technology (0.2%) | | |
| Compucom Systems, Inc. bank term loan FRN 3.82s, 2014 | 1,079,129 | 1,030,568 |
|
| First Data Corp. bank term loan FRN Ser. B1, 3.017s, 2014 | 1,523,175 | 1,300,221 |
|
| | | 2,330,789 |
| Telecommunications (—%) | | |
| Level 3 Financing, Inc. bank term loan FRN Ser. B, 8.956s, 2014 | 235,000 | 253,653 |
|
| | | 253,653 |
39
| | |
| SENIOR LOANS (5.7%)* c cont. | Principal amount | Value |
|
| Transportation (0.4%) | | |
| Swift Transportation Co., Inc. bank term loan FRN 6.563s, 2014 | $5,490,119 | $5,311,690 |
|
| | | 5,311,690 |
| Utilities and power (0.6%) | | |
| TXU Energy Corp. bank term loan FRN Ser. B2, 3.975s, 2014 | 187,410 | 141,987 |
|
| TXU Energy Corp. bank term loan FRN Ser. B3, 3.796s, 2014 | 9,949,956 | 7,499,779 |
|
| | | 7,641,766 |
| | | |
| Total senior loans (cost $80,818,713) | | $76,109,271 |
| |
| |
| COMMON STOCKS (2.6%)* | Shares | Value |
|
| AES Corp. (The) † | 144,010 | $1,474,662 |
|
| Alliance Imaging, Inc. † | 340,211 | 1,428,886 |
|
| Alpha Natural Resources, Inc. † | 41,275 | 1,532,541 |
|
| American Media Operations, Inc. 144A † F | 63,915 | 6 |
|
| Avis Budget Group, Inc. † | 70,380 | 641,866 |
|
| Bohai Bay Litigation, LLC (Escrow) F § | 3,899 | 12,165 |
|
| CIT Group, Inc. † | 31,093 | 1,140,491 |
|
| Community Health Systems, Inc. † | 41,775 | 1,089,074 |
|
| Dana Holding Corp. † | 120,744 | 1,238,833 |
|
| El Paso Corp. | 120,275 | 1,369,932 |
|
| FelCor Lodging Trust, Inc. † R | 182,130 | 724,877 |
|
| Freeport-McMoRan Copper & Gold, Inc. Class B | 23,780 | 1,711,684 |
|
| Interpublic Group of Companies, Inc. (The) † | 132,405 | 1,129,415 |
|
| Leap Wireless International, Inc. † | 132,660 | 1,375,684 |
|
| Louisiana-Pacific Corp. † | 151,171 | 1,006,799 |
|
| LyondellBasell Industries NV Class A (Netherlands) † | 60,594 | 1,242,177 |
|
| LyondellBasell Industries NV Class B (Netherlands) † | 23,146 | 474,262 |
|
| Macy’s, Inc. | 85,175 | 1,655,802 |
|
| Nortek, Inc. † | 64,161 | 2,662,682 |
|
| PetroHawk Energy Corp. † | 88,840 | 1,343,261 |
|
| Sealy Corp. † | 644,663 | 1,527,851 |
|
| Service Corporation International | 240,756 | 1,851,414 |
|
| Spectrum Brands Holdings, Inc. † | 56,236 | 1,434,580 |
|
| Sprint Nextel Corp. † | 408,745 | 1,667,680 |
|
| Stallion Oilfield Holdings, Ltd. | 78,079 | 1,366,383 |
|
| Temple-Inland, Inc. | 79,935 | 1,273,365 |
|
| Thermadyne Holdings Corp. † | 69,804 | 769,938 |
|
| Trump Entertainment Resorts, Inc. F | 3,732 | 78,372 |
|
| TRW Automotive Holdings Corp. † | 36,720 | 1,276,387 |
|
| Vertis Holdings, Inc. F † | 135,886 | 136 |
|
| Total common stocks (cost $39,347,171) | | $34,501,205 |
| |
| |
| CONVERTIBLE BONDS AND NOTES (1.6%)* | Principal amount | Value |
|
| Advanced Micro Devices, Inc. cv. sr. unsec. notes 6s, 2015 | $303,000 | $296,561 |
|
| Alliant Techsystems, Inc. cv. company guaranty sr. sub. notes 3s, 2024 | 2,180,000 | 2,294,450 |
|
| Digital Realty Trust LP 144A cv. sr. unsec. notes 5 1/2s, 2029 R | 1,325,000 | 1,948,578 |
|
| Ford Motor Co. cv. sr. unsec. notes 4 1/4s, 2016 | 1,173,000 | 1,630,587 |
|
40
| | |
| CONVERTIBLE BONDS AND NOTES (1.6%)* cont. | Principal amount | Value |
|
| General Cable Corp. cv. unsec. sub. notes stepped-coupon | | |
| 4 1/2s (2 1/4s, 11/15/19) 2029 †† | $1,929,000 | $1,683,053 |
|
| Level 3 Communications, Inc. cv. sr. unsec. unsub. notes | | |
| 5 1/4s, 2011 | 800,000 | 784,000 |
|
| Level 3 Communications, Inc. cv. sr. unsec. unsub. notes | | |
| 3 1/2s, 2012 | 1,880,000 | 1,731,950 |
|
| Owens Brockway Glass Container, Inc. 144A cv. company | | |
| guaranty sr. notes 3s, 2015 | 1,460,000 | 1,385,394 |
|
| Pantry, Inc. (The) cv. company guaranty sr. unsec. | | |
| sub. notes 3s, 2012 | 4,669,000 | 4,377,188 |
|
| Safeguard Scientifics, Inc. cv. sr. unsec. | | |
| sub. notes 10 1/8s, 2014 | 382,000 | 404,920 |
|
| Steel Dynamics, Inc. cv. sr. notes 5 1/8s, 2014 | 930,000 | 1,041,600 |
|
| Trinity Industries, Inc. cv. unsec. sub. notes 3 7/8s, 2036 | 1,649,000 | 1,364,548 |
|
| Virgin Media, Inc. cv. sr. unsec. notes 6 1/2s, 2016 | 975,000 | 1,318,688 |
|
| XM Satellite Radio Holdings, Inc. 144A cv. sr. unsec. | | |
| sub. notes 7s, 2014 | 1,532,000 | 1,493,853 |
|
| Total convertible bonds and notes (cost $19,711,639) | | $21,755,370 |
| |
| |
| CONVERTIBLE PREFERRED STOCKS (1.0%)* | Shares | Value |
|
| Apache Corp. Ser. D, $3.00 cv. pfd. | 39,100 | $2,116,092 |
|
| Crown Castle International Corp. $3.125 cum. cv. pfd. | 34,320 | 2,003,773 |
|
| Dole Food Automatic Exchange 144A 7.00% cv. pfd. † | 103,165 | 921,263 |
|
| Entertainment Properties Trust Ser. C, $1.438 cv. pfd | 74,812 | 1,392,999 |
|
| Great Plains Energy, Inc. $6.00 cv. pfd. | 20,030 | 1,235,250 |
|
| Hartford Financial Services Group, Inc. (The) | | |
| $1.182 cv. pfd. | 74,594 | 1,648,065 |
|
| Lehman Brothers Holdings, Inc. Ser. P, | | |
| 7.25% cv. pfd. (In default) † | 4,338 | 4,772 |
|
| PPL Corp. $4.75 cv. pfd. † | 38,367 | 2,166,201 |
|
| XL Group, Ltd. $2.688 cv. pfd. | 70,185 | 1,899,908 |
|
| Total convertible preferred stocks (cost $16,817,554) | | $13,388,323 |
| |
| |
| PREFERRED STOCKS (0.3%)* | Shares | Value |
|
| Decrane Aircraft Holdings, Inc. $16.00 pfd. ‡‡ | 21,000 | $147,000 |
|
| GMAC, Inc. 144A Ser. G, 7.00% cum. pfd. | 4,652 | 3,842,698 |
|
| Total preferred stocks (cost $2,016,929) | | $3,989,698 |
| | | |
| | | | |
| WARRANTS (—%)* † | Expiration | Strike | | |
| | date | price | Warrants | Value |
|
| Charter Communications, Inc. Class A | 11/30/14 | $46.86 | 420 | $2,520 |
|
| New ASAT (Finance), Ltd. (Cayman Islands) F | 2/01/11 | 0.01 | 714,514 | — |
|
| Smurfit Kappa Group PLC 144A (Ireland) | 10/01/13 | EUR.001 | 4,137 | 185,928 |
|
| Tower Semiconductor, Ltd. 144A (Israel) F | 6/30/15 | $0.01 | 672,570 | 154,691 |
|
| Vertis Holdings, Inc. F | 10/18/15 | 0.01 | 9,578 | 1 |
|
| Total warrants (cost $320,929) | | | | $343,140 |
41
| | |
| U.S TREASURY OBLIGATIONS (—%)* | | |
| | | |
| | Principal amount | Value |
|
| U.S. Treasury Notes 1.75s, January 31, 2014 i | $180,000 | $185,753 |
|
| Total U.S treasury obligations (cost $185,753) | | $185,753 |
| |
| |
| SHORT-TERM INVESTMENTS (1.1%)* | Principal amount/shares | Value |
|
| Putnam Money Market Liquidity Fund 0.15% e | 14,249,439 | $14,249,439 |
|
| U.S. Treasury Bills for an effective yield of 0.30%, | | |
| November 18, 2010 | $250,000 | 249,928 |
|
| Total short-term investments (cost $14,499,278) | | $14,499,367 |
| |
| |
| TOTAL INVESTMENTS | | |
|
| Total investments (cost $1,276,688,654) | | $1,290,040,657 |
Key to holding’s currency abbreviations
Key to holding’s abbreviations
| | | |
| FRB | Floating Rate Bonds | | |
| FRN | Floating Rate Notes | | |
| GMTN | Global Medium Term Notes | | |
| MTN | Medium Term Notes | | |
| MTNA | Medium Term Notes Class A | | |
| MTNI | Medium Term Notes Class I | | |
Notes to the fund’s portfolio
Unless noted otherwise, the notes to the fund’s portfolio are for the close of the fund’s reporting period, which ran from September 1, 2009 through August 31, 2010 (the reporting period).
* Percentages indicated are based on net assets of $1,323,841,889.
† Non-income-producing security.
† † The interest rate and date shown parenthetically represent the new interest rate to be paid and the date the fund will begin accruing interest at this rate.
‡ Restricted, excluding 144A securities, as to public resale. The total market value of restricted securities held at the close of the reporting period was $5, or less than 0.1% of net assets.
‡‡ Income may be received in cash or additional securities at the discretion of the issuer.
§ Affiliated Companies (Note 8).
c Senior loans are exempt from registration under the Securities Act of 1933, as amended, but contain certain restrictions on resale and cannot be sold publicly. These loans pay interest at rates which adjust periodically. The interest rates shown for senior loans are the current interest rates at the close of the reporting period. Senior loans are also subject to mandatory and/or optional prepayment which cannot be predicted. As a result, the remaining maturity may be substantially less than the stated maturity shown (Notes 1 and 7).
e See Note 6 to the financial statements regarding investments in Putnam Money Market Liquidity Fund. The rate quoted in the security description is the annualized 7-day yield of the fund at the close of the reporting period.
F Is valued at fair value following procedures approved by the Trustees. Securities may be classified as Level 2 or Level 3 for Accounting Standards Codification ASC 820 Fair Value Measurements and Disclosures (ASC 820) based on the securities valuation inputs.
i Security purchased with cash or security received, that was pledged to the fund for collateral on certain derivatives contracts (Note 1).
R Real Estate Investment Trust.
At the close of the reporting period, the fund is maintaining liquid assets totaling $71,843 to cover certain derivatives contracts.
42
Debt obligations are considered secured unless otherwise indicated.
144A after the name of an issuer represents securities exempt from registration under Rule 144A under the Securities Act of 1933, as amended. These securities may be resold in transactions exempt from registration, normally to qualified institutional buyers.
The rates shown on FRB and FRN are the current interest rates at the close of the reporting period.
The dates shown on debt obligations are the original maturity dates.
| | | | | | |
| FORWARD CURRENCY CONTRACTS at 8/31/10 (aggregate face value $16,162,799) | | |
| |
| | | | | | | Unrealized |
| | | Contract | Delivery | | Aggregate | appreciation/ |
| Counterparty | Currency | type | date | Value | face value | (depreciation) |
|
| Bank of America, N.A. | | | | | | |
|
| Euro | Sell | 9/15/10 | $645,370 | $674,700 | $29,330 |
|
| Barclays Bank PLC | | | | | | |
|
| Euro | Sell | 9/15/10 | 1,507,804 | 1,576,081 | 68,277 |
|
| Citibank, N.A. | | | | | | |
|
| Euro | Buy | 9/15/10 | 1,006,554 | 1,051,822 | (45,268) |
|
| Credit Suisse AG | | | | | | |
|
| Euro | Sell | 9/15/10 | 2,770,049 | 2,895,920 | 125,871 |
|
| Deutsche Bank AG | | | | | | |
|
| Euro | Sell | 9/15/10 | 583,948 | 610,245 | 26,297 |
|
| Goldman Sachs International | | | | | | |
|
| Euro | Sell | 9/15/10 | 423,745 | 442,562 | 18,817 |
|
| HSBC Bank USA, National Association | | | | |
|
| | Euro | Sell | 9/15/10 | 1,071,268 | 1,119,168 | 47,900 |
|
| JPMorgan Chase Bank, N.A. | | | | | | |
|
| Euro | Buy | 9/15/10 | 739,338 | 772,116 | (32,778) |
|
| Royal Bank of Scotland PLC (The) | | | | | | |
|
| | Euro | Sell | 9/15/10 | 1,206,016 | 1,259,664 | 53,648 |
|
| UBS AG | | | | | | |
|
| Euro | Sell | 9/15/10 | 4,112,079 | 4,296,658 | 184,579 |
|
| Westpac Banking Corp. | | | | | | |
|
| | Euro | Sell | 9/15/10 | 1,402,058 | 1,463,863 | 61,805 |
|
| Total | | | | | | $538,478 |
43
ASC 820 establishes a three-level hierarchy for disclosure of fair value measurements. The valuation hierarchy is based upon the transparency of inputs to the valuation of the fund’s investments. The three levels are defined as follows:
Level 1 — Valuations based on quoted prices for identical securities in active markets.
Level 2 — Valuations based on quoted prices in markets that are not active or for which all significant inputs are observable, either directly or indirectly.
Level 3 — Valuations based on inputs that are unobservable and significant to the fair value measurement.
The following is a summary of the inputs used to value the fund’s net assets as of the close of the reporting period:
| | | | |
| | | Valuation inputs | |
|
| Investments in securities: | Level 1 | Level 2 | Level 3 |
|
| Common stocks: | | | |
|
| Basic materials | $5,708,287 | $— | $— |
|
| Capital goods | 769,938 | — | — |
|
| Communication services | 3,043,364 | — | — |
|
| Consumer cyclicals | 10,215,847 | — | 78,514 |
|
| Consumer staples | 3,927,860 | — | — |
|
| Energy | 2,875,802 | 1,366,383 | 12,165 |
|
| Financials | 1,140,491 | — | — |
|
| Health care | 2,517,960 | — | — |
|
| Utilities and power | 2,844,594 | — | — |
|
| Total common stocks | 33,044,143 | 1,366,383 | 90,679 |
| | | | |
| Convertible bonds and notes | — | 21,755,370 | — |
|
| Convertible preferred stocks | — | 13,388,323 | — |
|
| Corporate bonds and notes | — | 1,123,114,311 | 2,154,219 |
|
| Preferred stocks | — | 3,989,698 | — |
|
| Senior loans | — | 76,109,271 | — |
|
| Warrants | — | 188,448 | 154,692 |
|
| U.S treasury obligations | — | 185,753 | — |
|
| Short-term investments | 14,249,439 | 249,928 | — |
|
| Totals by level | $47,293,582 | $1,240,347,485 | $2,399,590 |
| | | | |
| | | Valuation inputs | |
|
| Other financial instruments: | Level 1 | Level 2 | Level 3 |
|
| Forward currency contracts | $— | $538,478 | $— |
|
| Totals by level | $— | $538,478 | $— |
At the start and/or close of the reporting period, Level 3 investments in securities and other financial instruments were not considered a significant portion of the fund’s portfolio.
The accompanying notes are an integral part of these financial statements.
44
Statement of assets and liabilities 8/31/10
| |
| ASSETS | |
|
| Investment in securities, at value, (Note 1): | |
| Unaffiliated issuers (identified cost $1,262,439,215) | $1,275,779,053 |
| Affiliated issuers (identified cost $14,249,439) (Notes 6 and 8) | 14,261,604 |
|
| Cash | 3,934,100 |
|
| Foreign currency (cost $2) (Note 1) | 2 |
|
| Dividends, interest and other receivables | 27,782,294 |
|
| Receivable for shares of the fund sold | 1,083,663 |
|
| Receivable for investments sold | 8,509,562 |
|
| Unrealized appreciation on forward currency contracts (Note 1) | 616,524 |
|
| Total assets | 1,331,966,802 |
| |
| LIABILITIES | |
|
| Payable for investments purchased | 4,243,689 |
|
| Payable for shares of the fund repurchased | 1,641,296 |
|
| Payable for compensation of Manager (Note 2) | 655,513 |
|
| Payable for investor servicing fees (Note 2) | 156,077 |
|
| Payable for custodian fees (Note 2) | 2,422 |
|
| Payable for Trustee compensation and expenses (Note 2) | 369,566 |
|
| Payable for administrative services (Note 2) | 13,757 |
|
| Payable for distribution fees (Note 2) | 553,128 |
|
| Unrealized depreciation on forward currency contracts (Note 1) | 78,046 |
|
| Collateral on certain derivative contracts, at value (Note 1) | 185,753 |
|
| Other accrued expenses | 225,666 |
|
| Total liabilities | 8,124,913 |
| |
| Net assets | $1,323,841,889 |
|
| |
| REPRESENTED BY | |
|
| Paid-in capital (Unlimited shares authorized) (Notes 1 and 4) | $2,239,444,742 |
|
| Undistributed net investment income (Note 1) | 4,880,493 |
|
| Accumulated net realized loss on investments and foreign currency transactions (Note 1) | (934,370,577) |
|
| Net unrealized appreciation of investments and assets and liabilities in foreign currencies | 13,887,231 |
|
| Total — Representing net assets applicable to capital shares outstanding | $1,323,841,889 |
| |
| COMPUTATION OF NET ASSET VALUE AND OFFERING PRICE | |
|
| Net asset value and redemption price per class A share | |
| ($1,120,786,351 divided by 151,380,205 shares) | $7.40 |
|
| Offering price per class A share (100/96.00 of $7.40)* | $7.71 |
|
| Net asset value and offering price per class B share ($41,108,849 divided by 5,562,747 shares)** | $7.39 |
|
| Net asset value and offering price per class C share ($38,399,553 divided by 5,220,893 shares)** | $7.35 |
|
| Net asset value and redemption price per class M share ($19,217,806 divided by 2,591,505 shares) | $7.42 |
|
| Offering price per class M share (100/96.75 of $7.42)*** | $7.67 |
|
| Net asset value, offering price and redemption price per class R share | |
| ($5,084,954 divided by 696,755 shares) | $7.30 |
|
| Net asset value, offering price and redemption price per class Y share | |
| ($99,244,376 divided by 13,580,856 shares) | $7.31 |
|
* On single retail sales of less than $100,000. On sales of $100,000 or more the offering price is reduced.
** Redemption price per share is equal to net asset value less any applicable contingent deferred sales charge.
*** On single retail sales of less than $50,000. On sales of $50,000 or more the offering price is reduced.
The accompanying notes are an integral part of these financial statements.
45
Statement of operations Year ended 8/31/10
| |
| INVESTMENT INCOME | |
|
| Interest (including interest income of $23,917 from investments in affiliated issuers) (Note 6) | $113,039,827 |
|
| Dividends | 1,023,809 |
|
| Total investment income | 114,063,636 |
| |
| EXPENSES | |
|
| Compensation of Manager (Note 2) | 7,750,592 |
|
| Investor servicing fees (Note 2) | 1,968,659 |
|
| Custodian fees (Note 2) | 42,283 |
|
| Trustee compensation and expenses (Note 2) | 99,835 |
|
| Administrative services (Note 2) | 68,998 |
|
| Distribution fees — Class A (Note 2) | 2,815,858 |
|
| Distribution fees — Class B (Note 2) | 543,236 |
|
| Distribution fees — Class C (Note 2) | 368,398 |
|
| Distribution fees — Class M (Note 2) | 74,281 |
|
| Distribution fees — Class R (Note 2) | 18,502 |
|
| Other | 588,093 |
|
| Fees waived and reimbursed by Manager (Note 2) | (118,165) |
|
| Total expenses | 14,220,570 |
| | |
| Expense reduction (Note 2) | (20,851) |
|
| Net expenses | 14,199,719 |
| |
| Net investment income | 99,863,917 |
|
| |
| Net realized gain on investments (Notes 1 and 3) | 22,792,482 |
|
| Net realized gain on swap contracts (Note 1) | 12,794 |
|
| Net realized gain on foreign currency transactions (Note 1) | 2,328,528 |
|
| Net unrealized appreciation of assets and liabilities in foreign currencies during the year | 490,654 |
|
| Net unrealized appreciation of investments, swap contracts and receivable | |
| purchase agreements during the year | 101,170,771 |
|
| Net gain on investments | 126,795,229 |
| |
| Net increase in net assets resulting from operations | $226,659,146 |
|
The accompanying notes are an integral part of these financial statements.
46
Statement of changes in net assets
| | |
| INCREASE (DECREASE) IN NET ASSETS | Year ended 8/31/10 | Year ended 8/31/09 |
|
| Operations: | | |
| Net investment income | $99,863,917 | $97,790,248 |
|
| Net realized gain (loss) on investments and | | |
| foreign currency transactions | 25,133,804 | (268,199,862) |
|
| Net unrealized appreciation of investments and | | |
| assets and liabilities in foreign currencies | 101,661,425 | 92,854,212 |
|
| Net increase (decrease) in net assets resulting from operations | 226,659,146 | (77,555,402) |
|
| Distributions to shareholders (Note 1): | | |
| From ordinary income | | |
| Net investment income | | |
|
| Class A | (83,487,129) | (89,005,603) |
|
| Class B | (3,572,268) | (5,979,813) |
|
| Class C | (2,476,238) | (2,515,249) |
|
| Class M | (1,077,022) | (1,230,461) |
|
| Class R | (272,008) | (158,987) |
|
| Class Y | (5,750,399) | (6,935,943) |
|
| Increase in capital from settlement payments | 86,505 | 76,316 |
|
| Redemption fees (Note 1) | 561,720 | 153,902 |
|
| Decrease from capital share transactions (Note 4) | (39,638,707) | (267,281,965) |
|
| Total increase (decrease) in net assets | 91,033,600 | (450,433,205) |
| |
| NET ASSETS | | |
|
| Beginning of year | 1,232,808,289 | 1,683,241,494 |
|
| End of year (including undistributed net investment income | | |
| of $4,880,493 and distributions in excess of net investment | | |
| income of $96,393, respectively) | $1,323,841,889 | $1,232,808,289 |
|
The accompanying notes are an integral part of these financial statements.
47
Financial highlights (For a common share outstanding throughout the period)
| | | | | | | | | | | | | | |
| INVESTMENT OPERATIONS: | LESS DISTRIBUTIONS: | RATIOS AND SUPPLEMENTAL DATA: |
|
| | | | | | | | | | | | | Ratio | Ratio | |
| | | | Net realized | | | | | | | | | of expenses | of net investment | |
| | Net asset value, | | and unrealized | Total from | From | | | | | Total return | Net assets, | to average | income (loss) | Portfolio |
| | beginning | Net investment | gain (loss) | investment | net investment | Total | Redemption | Non-recurring | Net asset value, | at net asset | end of period | net assets | to average | turnover |
| Period ended | of period | income (loss) a | on investments | operations | income | distributions | fees b | reimbursements | end of period | value (%) c | (in thousands) | (%) d,e | net assets (%) d | (%) |
|
| Class A | | | | | | | | | | | | | | |
| August 31, 2010 | $6.68 | .56 | .70 | 1.26 | (.54) | (.54) | — | — g | $7.40 | 19.29 | $1,120,786 | 1.04 | 7.67 | 70.53 |
| August 31, 2009 | 7.21 | .49 | (.48) | .01 | (.54) | (.54) | — | — h,i | 6.68 | 1.73 | 1,070,781 | 1.13 | 8.37 | 44.15 |
| August 31, 2008 | 7.82 | .57 | (.60) | (.03) | (.58) | (.58) | — | — | 7.21 | (.50) | 1,298,019 | 1.07 | 7.51 | 27.59 |
| August 31, 2007 | 7.87 | .58 | (.04) | .54 | (.59) | (.59) | — | — | 7.82 | 6.87 | 1,570,488 | 1.03 | 7.17 | 57.18 |
| August 31, 2006 | 8.10 | .58 f | (.22) | .36 | (.59) | (.59) | — | — | 7.87 | 4.64 f | 1,657,357 | 1.01 f | 7.26 f | 45.50 |
|
| Class B | | | | | | | | | | | | | | |
| August 31, 2010 | $6.67 | .50 | .70 | 1.20 | (.48) | (.48) | — | — g | $7.39 | 18.39 | $41,109 | 1.79 | 6.96 | 70.53 |
| August 31, 2009 | 7.19 | .45 | (.47) | (.02) | (.50) | (.50) | — | — h,i | 6.67 | 1.12 | 65,487 | 1.88 | 7.75 | 44.15 |
| August 31, 2008 | 7.79 | .51 | (.59) | (.08) | (.52) | (.52) | — | — | 7.19 | (1.14) | 113,832 | 1.82 | 6.79 | 27.59 |
| August 31, 2007 | 7.84 | .51 | (.04) | .47 | (.52) | (.52) | — | — | 7.79 | 6.05 | 197,581 | 1.78 | 6.42 | 57.18 |
| August 31, 2006 | 8.06 | .51 f | (.20) | .31 | (.53) | (.53) | — | — | 7.84 | 3.99 f | 342,227 | 1.76 f | 6.52 f | 45.50 |
|
| Class C | | | | | | | | | | | | | | |
| August 31, 2010 | $6.65 | .50 | .69 | 1.19 | (.49) | (.49) | — | — g | $7.35 | 18.19 | $38,400 | 1.79 | 6.92 | 70.53 |
| August 31, 2009 | 7.17 | .45 | (.47) | (.02) | (.50) | (.50) | — | — h,i | 6.65 | 1.14 | 34,786 | 1.88 | 7.58 | 44.15 |
| August 31, 2008 | 7.78 | .51 | (.60) | (.09) | (.52) | (.52) | — | — | 7.17 | (1.28) | 39,507 | 1.82 | 6.75 | 27.59 |
| August 31, 2007 | 7.84 | .52 | (.05) | .47 | (.53) | (.53) | — | — | 7.78 | 5.95 | 46,276 | 1.78 | 6.42 | 57.18 |
| August 31, 2006 | 8.06 | .51 f | (.20) | .31 | (.53) | (.53) | — | — | 7.84 | 4.02 f | 63,687 | 1.76 f | 6.50 f | 45.50 |
|
| Class M | | | | | | | | | | | | | | |
| August 31, 2010 | $6.69 | .54 | .71 | 1.25 | (.52) | (.52) | — | — g | $7.42 | 19.12 | $19,218 | 1.29 | 7.46 | 70.53 |
| August 31, 2009 | 7.23 | .47 | (.48) | (.01) | (.53) | (.53) | — | — h,i | 6.69 | 1.36 | 17,087 | 1.38 | 8.03 | 44.15 |
| August 31, 2008 | 7.83 | .55 | (.60) | (.05) | (.55) | (.55) | — | — | 7.23 | (.67) | 13,273 | 1.32 | 7.25 | 27.59 |
| August 31, 2007 | 7.88 | .56 | (.05) | .51 | (.56) | (.56) | — | — | 7.83 | 6.54 | 16,162 | 1.28 | 6.92 | 57.18 |
| August 31, 2006 | 8.10 | .56 f | (.22) | .34 | (.56) | (.56) | — | — | 7.88 | 4.46 f | 19,785 | 1.26 f | 7.00 f | 45.50 |
|
| Class R | | | | | | | | | | | | | | |
| August 31, 2010 | $6.61 | .53 | .69 | 1.22 | (.53) | (.53) | — | — g | $7.30 | 18.80 | $5,085 | 1.29 | 7.36 | 70.53 |
| August 31, 2009 | 7.16 | .46 | (.48) | (.02) | (.53) | (.53) | — | — h,i | 6.61 | 1.23 | 2,296 | 1.38 | 7.93 | 44.15 |
| August 31, 2008 | 7.77 | .54 | (.59) | (.05) | (.56) | (.56) | — | — | 7.16 | (.75) | 1,446 | 1.32 | 7.22 | 27.59 |
| August 31, 2007 | 7.85 | .56 | (.07) | .49 | (.57) | (.57) | — | — | 7.77 | 6.24 | 1,096 | 1.28 | 6.92 | 57.18 |
| August 31, 2006 | 8.08 | .55 f | (.21) | .34 | (.57) | (.57) | — | — | 7.85 | 4.37 f | 390 | 1.26 f | 7.00 f | 45.50 |
|
| Class Y | | | | | | | | | | | | | | |
| August 31, 2010 | $6.61 | .57 | .69 | 1.26 | (.56) | (.56) | — | — g | $7.31 | 19.49 | $99,244 | .79 | 7.80 | 70.53 |
| August 31, 2009 | 7.14 | .54 | (.52) | .02 | (.55) | (.55) | — | — h,i | 6.61 | 1.98 | 42,372 | .88 | 9.11 | 44.15 |
| August 31, 2008 | 7.76 | .58 | (.60) | (.02) | (.60) | (.60) | — | — | 7.14 | (.35) | 217,165 | .82 | 7.73 | 27.59 |
| August 31, 2007 | 7.83 | .60 | (.06) | .54 | (.61) | (.61) | — | — | 7.76 | 6.96 | 225,031 | .78 | 7.42 | 57.18 |
| August 31, 2006 | 8.06 | .59 f | (.21) | .38 | (.61) | (.61) | — | — | 7.83 | 4.99 f | 193,290 | .76 f | 7.51 f | 45.50 |
|
See notes to financial highlights at the end of this section.
The accompanying notes are an integral part of these financial statements.
Financial highlights (Continued)
a Per share net investment income (loss) has been determined on the basis of the weighted average number of shares outstanding during the period.
b Amount represents less than $0.01 per share.
c Total return assumes dividend reinvestment and does not reflect the effect of sales charges.
d Reflects an involuntary contractual expense limitation in effect during the period. For periods prior to August 31, 2009, certain fund expenses were waived in connection with the fund’s investment in Putnam Prime Money Market Fund. As a result of such limitation and/or waivers, the expenses of each class reflect a reduction of the following amounts (Note 2):
| |
| | Percentage of |
| | average net assets |
|
| August 31, 2010 | 0.01% |
|
| August 31, 2009 | 0.04 |
|
| August 31, 2008 | <0.01 |
|
| August 31, 2007 | <0.01 |
|
| August 31, 2006 | <0.01 |
|
e Includes amounts paid through expense offset arrangements (Note 2).
f Reflects a non-recurring reimbursement from Putnam Investments relating to the calculation of certain amounts paid by the fund to Putnam in previous years for transfer agent services, which amounted to less than $0.01 per share and 0.01% of average net assets for the period ended August 31, 2006.
g Reflects a non-recurring reimbursement pursuant to a settlement between the Securities and Exchange Commission (the SEC) and Prudential Securities, Inc., which amounted to less than $0.01 per share outstanding on March 30, 2010.
h Reflects non-recurring reimbursement pursuant to a settlement between the SEC and Millennium Partners, L.P., Millennium Management, L.L.C and Millennium International Management, LLC, which amounted to less than $0.01 per share outstanding as of June 23, 2009.
i Reflects non-recurring reimbursement pursuant to a settlement between the SEC and Bear Stearns & Co., Inc. and Bear Stearns Securities Corp., which amounted to less than $0.01 per share outstanding as of May 21, 2009.
The accompanying notes are an integral part of these financial statements.
50
Notes to financial statements 8/31/10
Note 1: Significant accounting policies
Putnam High Yield Trust (the fund), a Massachusetts business trust, is registered under the Investment Company Act of 1940, as amended, as a diversified, open-end management investment company. The fund seeks high current income by investing primarily in high-yielding, lower-rated fixed-income securities. These securities may have a higher rate of default. Capital growth is a secondary goal when consistent with achieving high current income.
The fund offers class A, class B, class C, class M, class R and class Y shares. Class A and class M shares are sold with a maximum front-end sales charge of 4.00% and 3.25%, respectively, and generally do not pay a contingent deferred sales charge. Class B shares, which convert to class A shares after approximately eight years, do not pay a front-end sales charge and are subject to a contingent deferred sales charge, if those shares are redeemed within six years of purchase. Class C shares have a one-year 1.00% contingent deferred sales charge and do not convert to class A shares. Class R shares, which are offered to qualified employee-benefit plans, are sold at net asset value. The expenses for class A, class B, class C, class M and class R shares may differ based on the distribution fee of each class, which is identified in Note 2. Class Y shares, which are sold at net asset value, are generally subject to the same expenses as class A, class B, class C, class M and class R shares, but do not bear a distribution fee. Class Y shares are generally only available to corporate and institutional clients and clients in other approved programs.
A 1.00% redemption fee applied on certain shares that were redeemed (either by selling or exchanging into another fund) within 90 days of purchase. The redemption fee is accounted for as an addition to paid-in-capital. Effective August 2, 2010, the redemption fee may apply on certain shares that are redeemed (either by selling or exchanging into another fund) within 30 days of purchase.
Investment income, realized and unrealized gains and losses and expenses of the fund are borne pro-rata based on the relative net assets of each class to the total net assets of the fund, except that each class bears expenses unique to that class (including the distribution fees applicable to such classes). Each class votes as a class only with respect to its own distribution plan or other matters on which a class vote is required by law or determined by the Trustees. If the fund were liquidated, shares of each class would receive their pro-rata share of the net assets of the fund. In addition, the Trustees declare separate dividends on each class of shares.
In the normal course of business, the fund enters into contracts that may include agreements to indemnify another party under given circumstances. The fund’s maximum exposure under these arrangements is unknown as this would involve future claims that may be, but have not yet been, made against the fund. However, the fund’s management team expects the risk of material loss to be remote.
The following is a summary of significant accounting policies consistently followed by the fund in the preparation of its financial statements. The preparation of financial statements is in conformity with accounting principles generally accepted in the United States of America and requires management to make estimates and assumptions that affect the reported amounts of assets and liabilities in the financial statements and the reported amounts of increases and decreases in net assets from operations. Actual results could differ from those estimates. Subsequent events after the Statement of assets and liabilities date through the date that the financial statements were issued have been evaluated in the preparation of the financial statements. Unless otherwise noted, the “reporting period” represents the period from September 1, 2009 through August 31, 2010.
A) Security valuation Investments for which market quotations are readily available are valued at the last reported sales price on their principal exchange, or official closing price for certain markets and are classified as Level 1 securities. If no sales are reported — as in the case of some securities traded over-the-counter — a security is valued at its last reported bid price and is generally categorized as a Level 2 security.
Market quotations are not considered to be readily available for certain debt obligations; such investments are valued on the basis of valuations furnished by an independent pricing service approved by the Trustees or dealers selected by Putnam Investment Management, LLC (Putnam Management), the fund’s manager, an indirect wholly-owned subsidiary of Putnam Investments, LLC. Such services or dealers determine valuations for normal institutional-size trading units of such securities using methods based on market transactions for comparable securities and various relationships, generally recognized by institutional traders, between securities (which considers such factors as security prices, yields, maturities and ratings). These securities will generally be categorized as Level 2.
Many securities markets and exchanges outside the U.S. close prior to the close of the New York Stock Exchange and therefore the closing prices for securities in such markets or on such exchanges may not fully reflect events
51
that occur after such close but before the close of the New York Stock Exchange. Accordingly, on certain days, the fund will fair value foreign equity securities taking into account multiple factors including movements in the U.S. securities markets, currency valuations and comparisons to the valuation of American Depository Receipts, exchange-traded funds and futures contracts. These securities, which will generally represent a transfer from a Level 1 to a Level 2 security, will be classified as Level 2. The number of days on which fair value prices will be used will depend on market activity and it is possible that fair value prices will be used by the fund to a significant extent. Securities quoted in foreign currencies, if any, are translated into U.S. dollars at the current exchange rate.
To the extent a pricing service or dealer is unable to value a security or provides a valuation that Putnam Management does not believe accurately reflects the security’s fair value, the security will be valued at fair value by Putnam Management. Certain investments, including certain restricted and illiquid securities and derivatives, are also valued at fair value following procedures approved by the Trustees. These valuations consider such factors as significant market or specific security events such as interest rate or credit quality changes, various relationships with other securities, discount rates, U.S. Treasury, U.S. swap and credit yields, index levels, convexity exposures and recovery rates. These securities are classified as Level 2 or as Level 3 depending on the priority of the significant inputs.
Such valuations and procedures are reviewed periodically by the Trustees. The fair value of securities is generally determined as the amount that the fund could reasonably expect to realize from an orderly disposition of such securities over a reasonable period of time. By its nature, a fair value price is a good faith estimate of the value of a security in a current sale and does not reflect an actual market price, which may be different by a material amount.
B) Security transactions and related investment income Security transactions are recorded on the trade date (the date the order to buy or sell is executed). Gains or losses on securities sold are determined on the identified cost basis. Interest income is recorded on the accrual basis. Dividend income, net of applicable withholding taxes, is recognized on the ex-dividend date except that certain dividends from foreign securities, if any, are recognized as soon as the fund is informed of the ex-dividend date. Non-cash dividends, if any, are recorded at the fair market value of the securities received. Dividends representing a return of capital or capital gains, if any, are reflected as a reduction of cost and/or as a realized gain. All premiums/discounts are amortized/accreted on a yield-to-maturity basis.
The fund earned certain fees in connection with its senior loan purchasing activities. These fees are treated as market discount and are amortized into income in the Statement of operations.
C) Foreign currency translation The accounting records of the fund are maintained in U.S. dollars. The market value of foreign securities, currency holdings, and other assets and liabilities is recorded in the books and records of the fund after translation to U.S. dollars based on the exchange rates on that day. The cost of each security is determined using historical exchange rates. Income and withholding taxes are translated at prevailing exchange rates when earned or incurred. The fund does not isolate that portion of realized or unrealized gains or losses resulting from changes in the foreign exchange rate on investments from fluctuations arising from changes in the market prices of the securities. Such gains and losses are included with the net realized and unrealized gain or loss on investments. Net realized gains and losses on foreign currency transactions represent net realized exchange gains or losses on closed forward curr ency contracts, disposition of foreign currencies, currency gains and losses realized between the trade and settlement dates on securities transactions and the difference between the amount of investment income and foreign withholding taxes recorded on the fund’s books and the U.S. dollar equivalent amounts actually received or paid. Net unrealized appreciation and depreciation of assets and liabilities in foreign currencies arise from changes in the value of open forward currency contracts and assets and liabilities other than investments at the period end, resulting from changes in the exchange rate. Investments in foreign securities involve certain risks, including those related to economic instability, unfavorable political developments, and currency fluctuations, not present with domestic investments.
D) Forward currency contracts The fund buys and sells forward currency contracts, which are agreements between two parties to buy and sell currencies at a set price on a future date. These contracts are used to hedge foreign exchange risk.
The U.S. dollar value of forward currency contracts is determined using current forward currency exchange rates supplied by a quotation service. The market value of the contract will fluctuate with changes in currency exchange rates. The contract is marked to market daily and the change in market value is recorded as an unrealized gain or loss. When the contract is closed, the fund records a realized gain or loss equal to the difference between the value of the contract at the time it was opened and the value at the time it was closed. The fund could be exposed to risk if the value of the currency changes unfavorably, if the counterparties to the contracts are unable to meet the terms of their contracts or if the fund is unable to enter into a closing position. Risks may exceed amounts recognized on
52
the Statement of assets and liabilities. Forward currency contracts outstanding at period end, if any, are listed after the fund’s portfolio. The fund had an average contract amount of approximately $14,300,000 on forward currency contracts for the reporting period.
E) Credit default contracts The fund enters into credit default contracts to hedge the fund’s exposure to credit risk, to hedge the fund’s exposure to market risk and to gain exposure to individual names and/or baskets of securities.
In a credit default contract, the protection buyer typically makes an up front payment and a periodic stream of payments to a counterparty, the protection seller, in exchange for the right to receive a contingent payment upon the occurrence of a credit event on the reference obligation or all other equally ranked obligations of the reference entity. Credit events are contract specific but may include bankruptcy, failure to pay, restructuring and obligation acceleration. An upfront payment received by the fund, as the protection seller, is recorded as a liability on the fund’s books. An upfront payment made by the fund, as the protection buyer, is recorded as an asset on the fund’s books. Periodic payments received or paid by the fund are recorded as realized gains or losses. The credit default contracts are marked to market daily based upon quotations from an independent pricing service or market makers and the change, if any, is recorded as an unrealized gain or loss. Upon the occurrence of a credit event, the difference between the par value and market value of the reference obligation, net of any proportional amount of the upfront payment, is recorded as a realized gain or loss.
In addition to bearing the risk that the credit event will occur, the fund could be exposed to market risk due to unfavorable changes in interest rates or in the price of the underlying security or index or the possibility that the fund may be unable to close out its position at the same time or at the same price as if it had purchased the underlying reference obligations. In certain circumstances, the fund may enter into offsetting credit default contracts which would mitigate its risk of loss. Risks of loss may exceed amounts recognized on the Statement of assets and liabilities. The fund’s maximum risk of loss from counterparty risk, either as the protection seller or as the protection buyer, is the fair value of the contract. This risk may be mitigated by having a master netting arrangement between the fund and the counterparty. Where the fund is a seller of protection, the maximum potential amount of future payments the fund may be required t o make is equal to the notional amount of the relevant credit default contract. Credit default contracts outstanding, including their respective notional amounts at period end, if any, are listed after the fund’s portfolio. The fund had an average notional amount of approximately $2,200,000 on credit default swap contracts for the reporting period.
F) Master agreements The fund is a party to ISDA (International Swap and Derivatives Association, Inc.) Master Agreements (Master Agreements) with certain counterparties that govern over-the-counter derivative and foreign exchange contracts entered into from time to time. The Master Agreements may contain provisions regarding, among other things, the parties’ general obligations, representations, agreements, collateral requirements, events of default and early termination. With respect to certain counterparties, in accordance with the terms of the Master Agreements, collateral posted to the fund is held in a segregated account by the fund’s custodian and with respect to those amounts which can be sold or repledged, are presented in the fund’s portfolio. Collateral pledged by the fund is segregated by the fund’s custodian and identified in the fund’s portfolio. Collateral can be in the form of cash or debt securities issued by the U.S. Government or related agencies or other securities as agreed to by the fund and the applicable counterparty. Collateral requirements are determined based on the fund’s net position with each counterparty. Termination events applicable to the fund may occur upon a decline in the fund’s net assets below a specified threshold over a certain period of time. Termination events applicable to counterparties may occur upon a decline in the counterparty’s long-term and short-term credit ratings below a specified level. In each case, upon occurrence, the other party may elect to terminate early and cause settlement of all derivative and foreign exchange contracts outstanding, including the payment of any losses and costs resulting from such early termination, as reasonably determined by the terminating party. Any decision by one or more of the fund’s counterparties to elect early termination could impact the fund’s future derivative activity.
At the close of the reporting period, the fund had a net liability position of $78,046 on derivative contracts subject to the Master Agreements. There was no collateral posted by the fund.
G) Interfund lending Effective July 2010, the fund, along with other Putnam funds, may participate in an interfund lending program pursuant to an exemptive order issued by the Securities and Exchange Commission (the SEC). This program allows the fund to borrow from or lend to other Putnam funds that permit such transactions. Interfund lending transactions are subject to each fund’s investment policies and borrowing and lending limits. Interest earned or paid on the interfund lending transaction will be based on the average of certain current market rates. During the reporting period, the fund did not utilize the program.
53
H) Line of credit Effective July 2010, the fund participates, along with other Putnam funds, in a $285 million unsecured committed line of credit and a $165 million unsecured uncommitted line of credit, both provided by State Street Bank and Trust Company (State Street). Borrowings may be made for temporary or emergency purposes, including the funding of shareholder redemption requests and trade settlements. Interest is charged to the fund based on the fund’s borrowing at a rate equal to the Federal Funds rate plus 1.25% for the committed line of credit and the Federal Funds rate plus 1.30% for the uncommitted line of credit. A closing fee equal to 0.03% of the committed line of credit and $100,000 for the uncommitted line of credit has been paid by the participating funds. In addition, a commitment fee of 0.15% per annum on any unutilized portion of the committed line of credit is allocated to the partic ipating funds based on their relative net assets and paid quarterly. During the reporting period, the fund had no borrowings against these arrangements.
I) Federal taxes It is the policy of the fund to distribute all of its taxable income within the prescribed time period and otherwise comply with the provisions of the Internal Revenue Code of 1986, as amended (the Code), applicable to regulated investment companies. It is also the intention of the fund to distribute an amount sufficient to avoid imposition of any excise tax under Section 4982 of the Code. The fund is subject to the provisions of Accounting Standards Codification ASC 740 Income Taxes (ASC 740). ASC 740 sets forth a minimum threshold for financial statement recognition of the benefit of a tax position taken or expected to be taken in a tax return. The fund did not have a liability to record for any unrecognized tax benefits in the accompanying financial statements. No provision has been made for federal taxes on inco me, capital gains or unrealized appreciation on securities held nor for excise tax on income and capital gains. Each of the fund’s federal tax returns for the prior three fiscal years remains subject to examination by the Internal Revenue Service.
At August 31, 2010, the fund had a capital loss carryover of $909,216,251 available to the extent allowed by the Code to offset future net capital gain, if any. The amounts of the carryovers and the expiration dates are:
| | |
| Loss carryover | Expiration |
|
| $499,955,886 | | August 31, 2011 |
|
| 61,743,291 | | August 31, 2012 |
|
| 76,944,480 | | August 31, 2013 |
|
| 14,070,646 | | August 31, 2014 |
|
| 2,600,677 | | August 31, 2015 |
|
| 20,028,690 | | August 31, 2016 |
|
| 96,252,247 | | August 31, 2017 |
|
| 137,620,334 | | August 31, 2018 |
|
Pursuant to federal income tax regulations applicable to regulated investment companies, the fund has elected to defer to its fiscal year ending August 31, 2011 approximately $22,657,402 of losses recognized during the period November 1, 2009 to August 31, 2010.
J) Distributions to shareholders Distributions to shareholders from net investment income are recorded by the fund on the ex-dividend date. Distributions from capital gains, if any, are recorded on the ex-dividend date and paid at least annually. The amount and character of income and gains to be distributed are determined in accordance with income tax regulations, which may differ from generally accepted accounting principles. These differences include temporary and/or permanent differences of losses on wash sale transactions, foreign currency gains and losses, post-October loss deferrals, the expiration of a capital loss carryover and defaulted bond interest. Reclassifications are made to the fund’s capital accounts to reflect income and gains available for distribution (or available capital loss carryovers) under income tax regulations. For the reporting period ended, the fund reclassified $1,555,247 t o increase undistributed net investment income and $301,116,662 to decrease paid-in-capital, with a decrease to accumulated net realized losses of $299,561,415.
54
The tax basis components of distributable earnings and the federal tax cost as of the close of the reporting period were as follows:
| |
| Unrealized appreciation | $65,823,398 |
| Unrealized depreciation | (54,968,319) |
|
| Net unrealized appreciation | 10,855,079 |
| Undistributed ordinary income | 6,463,997 |
| Capital loss carryforward | (909,216,251) |
| Post-October loss | (22,657,402) |
| Cost for federal income tax purposes | $1,279,185,578 |
Note 2: Management fee, administrative services and other transactions
Effective January 1, 2010, the fund pays Putnam Management a management fee (based on the fund’s average net assets and computed and paid monthly) at annual rates that may vary based on the average of the aggregate net assets of most open-end funds, as defined in the fund’s management contract, sponsored by Putnam Management. Such annual rates may vary as follows: 0.72% of the first $5 billion, 0.67% of the next $5 billion, 0.62% of the next $10 billion, 0.57% of the next $10 billion, 0.52% of the next $50 billion, 0.50% of the next $50 billion, 0.49% of the next $100 billion and 0.485% on any excess thereafter.
Prior to January 1, 2010, the fund paid Putnam Management for management and investment advisory services quarterly based on the average net assets of the fund. Such fee was based on the following annual rates: 0.70% of the first $500 million, 0.60% of the next $500 million, 0.55% of the next $500 million, 0.50% of the next $5 billion, 0.475% of the next $5 billion, 0.455% of the next $5 billion, 0.44% of the next $5 billion, and 0.43% on any excess thereafter.
Putnam Management has contractually agreed, through June 30, 2011, to waive fees or reimburse the fund’s expenses to the extent necessary to limit the cumulative expenses of the fund, exclusive of brokerage, interest, taxes, investment-related expenses, extraordinary expenses and payments under the fund’s investor servicing contract, investment management contract and distribution plans, on a fiscal year-to-date basis to an annual rate of 0.20% of the fund’s average net assets over such fiscal year-to-date period. During the reporting period, the fund’s expenses were not reduced as a result of this limit.
Putnam Management has also contractually agreed, through December 30, 2010, to limit the management fee for the fund to an annual rate of 0.60% of the fund’s average net assets. During the reporting period, the fund’s expenses were reduced by $118,165 as a result of this limit.
Putnam Investments Limited (PIL), an affiliate of Putnam Management, is authorized by the Trustees to manage a separate portion of the assets of the fund as determined by Putnam Management from time to time. Putnam Management pays a quarterly sub-management fee to PIL for its services at an annual rate of 0.40% of the average net assets of the portion of the fund managed by PIL.
On September 15, 2008, the fund terminated its outstanding derivatives contracts with Lehman Brothers Special Financing, Inc. (LBSF) in connection with the bankruptcy filing of LBSF’s parent company, Lehman Brothers Holdings, Inc. On September 26, 2008, the fund entered into receivable purchase agreements (Agreements) with other registered investment companies (each a Purchaser) managed by Putnam Management. Under the Agreements, the fund sold to the Purchasers the fund’s right to receive, in the aggregate, $11,983,721 in net payments from LBSF in connection with certain terminated derivatives transactions (the Receivable), in exchange for an initial payment plus (or minus) additional amounts based on the applicable Purchaser’s ultimate realized gain (or loss) on the Receivable. The fund received $3,724,900 (exclusive of the initial payment) from the Purchasers in accordance with the terms of the Agreements.
The fund reimburses Putnam Management an allocated amount for the compensation and related expenses of certain officers of the fund and their staff who provide administrative services to the fund. The aggregate amount of all such reimbursements is determined annually by the Trustees.
Custodial functions for the fund’s assets are provided by State Street Bank and Trust Company (State Street). Custody fees are based on the fund’s asset level, the number of its security holdings and transaction volumes.
Putnam Investor Services, Inc., an affiliate of Putnam Management, provides investor servicing agent functions to the fund. Putnam Investor Services, Inc. received fees for investor servicing, subject to certain limitations, based on the fund’s retail asset level, the number of shareholder accounts in the fund and the level of defined contribution
55
plan assets in the fund. The amounts incurred for investor servicing agent functions during the reporting period are included in Investor servicing fees in the Statement of operations.
The fund has entered into expense offset arrangements with Putnam Investor Services, Inc. and State Street whereby Putnam Investor Services, Inc.’s and State Street’s fees are reduced by credits allowed on cash balances. For the reporting period, the fund’s expenses were reduced by $20,851 under the expense offset arrangements.
Each independent Trustee of the fund receives an annual Trustee fee, of which $984, as a quarterly retainer, has been allocated to the fund, and an additional fee for each Trustees meeting attended. Trustees also are reimbursed for expenses they incur relating to their services as Trustees.
The fund has adopted a Trustee Fee Deferral Plan (the Deferral Plan) which allows the Trustees to defer the receipt of all or a portion of Trustees fees payable on or after July 1, 1995. The deferred fees remain invested in certain Putnam funds until distribution in accordance with the Deferral Plan.
The fund has adopted an unfunded noncontributory defined benefit pension plan (the Pension Plan) covering all Trustees of the fund who have served as a Trustee for at least five years and were first elected prior to 2004. Benefits under the Pension Plan are equal to 50% of the Trustee’s average annual attendance and retainer fees for the three years ended December 31, 2005. The retirement benefit is payable during a Trustee’s lifetime, beginning the year following retirement, for the number of years of service through December 31, 2006. Pension expense for the fund is included in Trustee compensation and expenses in the Statement of operations. Accrued pension liability is included in Payable for Trustee compensation and expenses in the Statement of assets and liabilities. The Trustees have terminated the Pension Plan with respect to any Trustee first elected after 2003.
The fund has adopted distribution plans (the Plans) with respect to its class A, class B, class C, class M and class R shares pursuant to Rule 12b-1 under the Investment Company Act of 1940. The purpose of the Plans is to compensate Putnam Retail Management Limited Partnership, a wholly-owned subsidiary of Putnam Investments, LLC and Putnam Retail Management GP, Inc., for services provided and expenses incurred in distributing shares of the fund. The Plans provide for payments by the fund to Putnam Retail Management Limited Partnership at an annual rate of up to 0.35%, 1.00%, 1.00%, 1.00% and 1.00% of the average net assets attributable to class A, class B, class C, class M and class R shares, respectively. The Trustees have approved payment by the fund at an annual rate of 0.25%, 1.00%, 1.00%, 0.50% and 0.50% of the average net assets attributable to class A, class B, class C, class M and class R shares, respectively.
For the reporting period, Putnam Retail Management Limited Partnership, acting as underwriter, received net commissions of $81,036 and $902 from the sale of class A and class M shares, respectively, and received $33,736 and $2,292 in contingent deferred sales charges from redemptions of class B and class C shares, respectively.
A deferred sales charge of up to 1.00% and 0.40% is assessed on certain redemptions of class A and class M shares, respectively. For the reporting period, Putnam Retail Management Limited Partnership, acting as underwriter, received no monies on class A and class M redemptions.
Note 3: Purchases and sales of securities
During the reporting period, cost of purchases and proceeds from sales of investment securities other than short-term investments aggregated $893,949,426 and $947,532,740, respectively. There were no purchases or proceeds from sales of long-term U.S. government securities.
Note 4: Capital shares
At the close of the reporting period, there was an unlimited number of shares of beneficial interest authorized. Transactions in capital shares were as follows:
| | | | |
| | Year ended 8/31/10 | Year ended 8/31/09 |
|
| Class A | Shares | Amount | Shares | Amount |
|
| Shares sold | 16,339,921 | $119,272,563 | 21,917,836 | $125,754,089 |
|
| Shares issued in connection with | | | | |
| reinvestment of distributions | 7,803,731 | 56,766,141 | 10,571,135 | 60,813,179 |
|
| | 24,143,652 | 176,038,704 | 32,488,971 | 186,567,268 |
|
| Shares repurchased | (32,947,995) | (239,860,126) | (52,345,832) | (302,414,789) |
|
| Net decrease | (8,804,343) | $(63,821,422) | (19,856,861) | $(115,847,521) |
|
56
| | | | |
| | Year ended 8/31/10 | Year ended 8/31/09 |
|
| Class B | Shares | Amount | Shares | Amount |
|
| Shares sold | 1,363,615 | $10,067,495 | 2,189,386 | $11,903,293 |
|
| Shares issued in connection with | | | | |
| reinvestment of distributions | 311,974 | 2,260,394 | 635,042 | 3,627,559 |
|
| | 1,675,589 | 12,327,889 | 2,824,428 | 15,530,852 |
|
| Shares repurchased | (5,932,555) | (43,107,472) | (8,840,717) | (51,042,369) |
|
| Net decrease | (4,256,966) | $(30,779,583) | (6,016,289) | $(35,511,517) |
|
| |
| | Year ended 8/31/10 | Year ended 8/31/09 |
|
| Class C | Shares | Amount | Shares | Amount |
|
| Shares sold | 1,219,229 | $8,900,797 | 1,617,420 | $9,098,752 |
|
| Shares issued in connection with | | | | |
| reinvestment of distributions | 218,598 | 1,580,863 | 277,682 | 1,593,866 |
|
| | 1,437,827 | 10,481,660 | 1,895,102 | 10,692,618 |
|
| Shares repurchased | (1,451,508) | (10,469,845) | (2,168,535) | (12,449,199) |
|
| Net increase (decrease) | (13,681) | $11,815 | (273,433) | $(1,756,581) |
|
| |
| | Year ended 8/31/10 | Year ended 8/31/09 |
|
| Class M | Shares | Amount | Shares | Amount |
|
| Shares sold | 1,529,701 | $11,393,027 | 1,326,688 | $7,256,380 |
|
| Shares issued in connection with | | | | |
| reinvestment of distributions | 114,195 | 830,139 | 163,850 | 946,039 |
|
| | 1,643,896 | 12,223,166 | 1,490,538 | 8,202,419 |
|
| Shares repurchased | (1,604,675) | (11,668,101) | (775,223) | (4,413,948) |
|
| Net increase | 39,221 | $555,065 | 715,315 | $3,788,471 |
|
| |
| | Year ended 8/31/10 | Year ended 8/31/09 |
|
| Class R | Shares | Amount | Shares | Amount |
|
| Shares sold | 597,409 | $4,298,248 | 381,094 | $2,157,017 |
|
| Shares issued in connection with | | | | |
| reinvestment of distributions | 34,174 | 246,140 | 26,047 | 149,058 |
|
| | 631,583 | 4,544,388 | 407,141 | 2,306,075 |
|
| Shares repurchased | (282,137) | (2,033,142) | (261,888) | (1,547,098) |
|
| Net increase | 349,446 | $2,511,246 | 145,253 | $758,977 |
|
| |
| | Year ended 8/31/10 | Year ended 8/31/09 |
|
| Class Y | Shares | Amount | Shares | Amount |
|
| Shares sold | 13,821,378 | $100,563,899 | 4,066,190 | $23,419,266 |
|
| Shares issued in connection with | | | | |
| reinvestment of distributions | 719,317 | 5,192,751 | 1,223,124 | 6,935,943 |
|
| | 14,540,695 | 105,756,650 | 5,289,314 | 30,355,209 |
|
| Shares repurchased | (7,369,113) | (53,872,478) | (6,952,263) | (39,565,080) |
|
| Redemptions in kind | — | — | (22,323,593) | (109,503,923) |
|
| Net increase (decrease) | 7,171,582 | $51,884,172 | (23,986,542) | $(118,713,794) |
|
57
Note 5: Summary of derivative activity
The following is a summary of the market values of derivative instruments as of the close of the reporting period:
Market values of derivative instruments as of the close of the reporting period
| | | | |
| | Asset derivatives | Liability derivatives |
|
| Derivatives not | | | | |
| accounted for as | Statement of | | Statement of | |
| hedging instruments | assets and | | assets and | |
| under ASC 815 | liabilities location | Market value | liabilities location | Market value |
|
| Foreign exchange | | | | |
| contracts | Receivables | $616,524 | Payables | $78,046 |
|
| Equity contracts | Investments, Receivables | 343,140 | Payables | — |
|
| Total | | $959,664 | | $78,046 |
|
The following is a summary of realized and change in unrealized gains or losses of derivative instruments on the Statement of operations for the reporting period (see Note 1):
Amount of realized gain or (loss) on derivatives recognized in net gain or (loss) on investments
| | | | |
| Derivatives not | | | | |
| accounted for as | | | | |
| hedging instruments | | Forward currency | | |
| under ASC 815 | Warrants | contracts | Swaps | Total |
|
| Credit contracts | $— | $— | $12,794 | $12,794 |
|
| Foreign exchange | | | | |
| contracts | — | 2,371,917 | — | $2,371,917 |
|
| Equity contracts | (300,918) | — | — | $(300,918) |
|
| Total | $(300,918) | $2,371,917 | $12,794 | $2,083,793 |
|
Change in unrealized appreciation or (depreciation) on derivatives recognized in net gain or (loss) on investments
| | | | |
| Derivatives not | | | | |
| accounted for as | | | | |
| hedging instruments | | Forward currency | | |
| under ASC 815 | Warrants | contracts | Swaps | Total |
|
| Credit contracts | $— | $— | $508,232 | $508,232 |
|
| Foreign exchange | | | | |
| contracts | — | 497,206 | — | 497,206 |
|
| Equity contracts | 331,708 | — | — | 331,708 |
|
| Total | $331,708 | $497,206 | $508,232 | $1,337,146 |
|
Note 6: Investment in Putnam Money Market Liquidity Fund
The fund invested in Putnam Money Market Liquidity Fund, an open-end management investment company managed by Putnam Management. Investments in Putnam Money Market Liquidity Fund are valued at its closing net asset value each business day. Income distributions earned by the fund are recorded as interest income in the Statement of operations and totaled $23,917 for the reporting period. During the reporting period, cost of purchases and proceeds of sales of investments in Putnam Money Market Liquidity Fund aggregated $492,527,670 and $483,447,755, respectively. Management fees charged to Putnam Money Market Liquidity Fund have been waived by Putnam Management.
58
Note 7: Senior loan commitments
Senior loans are purchased or sold on a when-issued or delayed delivery basis and may be settled a month or more after the trade date, which from time to time can delay the actual investment of available cash balances; interest income is accrued based on the terms of the securities. Senior loans can be acquired through an agent, by assignment from another holder of the loan, or as a participation interest in another holder’s portion of the loan. When the fund invests in a loan or participation, the fund is subject to the risk that an intermediate participant between the fund and the borrower will fail to meet its obligations to the fund, in addition to the risk that the borrower under the loan may default on its obligations.
Note 8: Transactions with affiliated issuers
Transactions during the reporting period with companies in which the fund owned at least 5% of the voting securities were as follows:
| | | | |
| | Purchase | Sales | Dividend | Market |
| Affiliates | cost | proceeds | income | value |
|
| Bohai Bay Litigation, LLC (Escrow) | $— | $— | $— | $12,165 |
|
| Totals | $— | $— | $— | $12,165 |
|
Market values are shown for those securities affiliated at the close of the reporting period.
Note 9: Regulatory matters and litigation
In late 2003 and 2004, Putnam Management settled charges brought by the Securities and Exchange Commission (the SEC) and the Massachusetts Securities Division in connection with excessive short-term trading in Putnam funds. Distribution of payments from Putnam Management to certain open-end Putnam funds and their shareholders is expected to be completed in the next several months. These allegations and related matters have served as the general basis for certain lawsuits, including purported class action lawsuits against Putnam Management and, in a limited number of cases, some Putnam funds. Putnam Management believes that these lawsuits will have no material adverse effect on the funds or on Putnam Management’s ability to provide investment management services. In addition, Putnam Management has agreed to bear any costs incurred by the Putnam funds as a result of these matters.
Note 10: Market and credit risk
In the normal course of business, the fund trades financial instruments and enters into financial transactions where risk of potential loss exists due to changes in the market (market risk) or failure of the contracting party to the transaction to perform (credit risk). The fund may be exposed to additional credit risk that an institution or other entity with which the fund has unsettled or open transactions will default.
59
Federal tax information (Unaudited)
The fund designated 0.97% of ordinary income distributions as qualifying for the dividends received deduction for corporations.
For its tax year ended August 31, 2010, the fund hereby designates 1.02%, or the maximum amount allowable, of its taxable ordinary income distributions as qualified dividends taxed at the individual net capital gain rates.
For the tax year ended August 31, 2010, pursuant to §871(k) of the Internal Revenue Code, the fund hereby designates $90,427,200 of distributions paid as qualifying to be taxed as interest-related dividends, and no monies to be taxed as short-term capital gain dividends for nonresident alien shareholders.
The Form 1099 that will be mailed to you in January 2011 will show the tax status of all distributions paid to your account in calendar 2010.
60
Shareholder meeting results (Unaudited)
November 19, 2009 meeting
At the meeting, each of the nominees for Trustees was elected, as follows:
| | | |
| | | Votes for | Votes withheld |
|
| Ravi Akhoury | | 153,041,211 | 5,337,719 |
|
| Jameson A. Baxter | | 153,097,852 | 5,281,078 |
|
| Charles B. Curtis | | 152,999,187 | 5,379,743 |
|
| Robert J. Darretta | | 153,241,736 | 5,137,194 |
|
| Myra R. Drucker | | 153,182,801 | 5,196,129 |
|
| John A. Hill | | 153,198,202 | 5,180,728 |
|
| Paul L. Joskow | | 153,133,201 | 5,245,729 |
|
| Elizabeth T. Kennan* | | 152,922,642 | 5,456,288 |
|
| Kenneth R. Leibler | | 153,213,469 | 5,165,461 |
|
| Robert E. Patterson | | 153,063,862 | 5,315,068 |
|
| George Putnam, III | | 153,062,814 | 5,316,116 |
|
| Robert L. Reynolds | | 153,268,841 | 5,110,089 |
|
| W. Thomas Stephens | | 153,049,696 | 5,329,234 |
|
| Richard B. Worley | | 153,184,678 | 5,194,252 |
|
* Dr. Kennan retired from the Board of Trustees of the Putnam funds effective June 30, 2010.
A proposal to approve a new management contract between the fund and Putnam Management was approved as follows:
| | | |
| Votes | Votes | | Broker |
| for | against | Abstentions | non-votes |
|
| 103,769,560 | 3,475,056 | 3,830,017 | 47,304,297 |
|
All tabulations are rounded to the nearest whole number.
61
About the Trustees
| | |
| Name | | |
| Year of birth | | |
| Position held | Principal occupations during past five years | Other directorships |
|
| Ravi Akhoury | Advisor to New York Life Insurance Company. Trustee of | Jacob Ballas Capital |
| Born 1947 | American India Foundation and of the Rubin Museum. | India, a non-banking |
| Trustee since 2009 | From 1992 to 2007, was Chairman and CEO of MacKay | finance company |
| | Shields, a multi-product investment management firm | focused on private |
| | with over $40 billion in assets under management. | equity advisory services |
|
| Barbara M. Baumann | President and Owner of Cross Creek Energy Corporation, | SM Energy Company, |
| Born 1955 | a strategic consultant to domestic energy firms and direct | a publicly held energy |
| Trustee since 2010 | investor in energy assets. Trustee, and Co-Chair of the | company focused on |
| | Finance Committee, of Mount Holyoke College. Former | natural gas and crude |
| | Chair and current board member of Girls Incorporated of | oil in the United States; |
| | Metro Denver. Member of the Finance Committee, The | Unisource Energy |
| | Children’s Hospital. | Corporation, a publicly |
| | | held provider of natural |
| | | gas and electric service |
| | | across Arizona; Cody |
| | | Resources Management, |
| | | LLP, a privately held |
| | | energy, ranching, and |
| | | commercial real estate |
| | | company |
|
| Jameson A. Baxter | President of Baxter Associates, Inc., a private investment | ASHTA Chemicals, Inc. |
| Born 1943 | firm. Chairman of Mutual Fund Directors Forum. | |
| Trustee since 1994 and | Chairman Emeritus of the Board of Trustees of Mount | |
| Vice Chairman since 2005 | Holyoke College. | |
|
| Charles B. Curtis | President Emeritus of the Nuclear Threat Initiative, a | Edison International; |
| Born 1940 | private foundation dealing with national security issues. | Southern California |
| Trustee since 2001 | Senior Advisor to the United Nations Foundation. Senior | Edison |
| | Advisor to the Center for Strategic and International | |
| Studies. Member of the Council on Foreign Relations and | |
| | the National Petroleum Council. | |
|
| Robert J. Darretta | Health Care Industry Advisor to Permira, a global private | United-Health |
| Born 1946 | equity firm. Until April 2007, was Vice Chairman of the | Group, a diversified |
| Trustee since 2007 | Board of Directors of Johnson & Johnson. Served as | health-care company |
| Johnson & Johnson’s Chief Financial Officer for a decade. | |
|
| Myra R. Drucker | Vice Chair of the Board of Trustees of Sarah Lawrence | Grantham, Mayo, |
| Born 1948 | College, and a member of the Investment Committee of | Van Otterloo & Co., |
| Trustee since 2004 | the Kresge Foundation, a charitable trust. Advisor to the | LLC, an investment |
| | Employee Benefits Investment Committee of The Boeing | management company |
| Company. Retired in 2009 as Chair of the Board of Trustees | |
| of Commonfund, a not-for-profit firm that manages assets | |
| for educational endowments and foundations. Until July | |
| 2010, Advisor to RCM Capital Management and member of | |
| | the Board of Interactive Data Corporation. | |
|
| John A. Hill | Founder and Vice-Chairman of First Reserve | Devon Energy |
| Born 1942 | Corporation, the leading private equity buyout firm | Corporation, a leading |
| Trustee since 1985 and | focused on the worldwide energy industry. Serves as a | independent natural gas |
| Chairman since 2000 | Trustee and Chairman of the Board of Trustees of Sarah | and oil exploration and |
| | Lawrence College. Also a member of the Advisory Board | production company |
| | of the Millstein Center for Corporate Governance and | |
| | Performance at the Yale School of Management. | |
|
62
| | |
| Name | | |
| Year of birth | | |
| Position held | Principal occupations during past five years | Other directorships |
|
| Paul L. Joskow | Economist and President of the Alfred P. Sloan | TransCanada |
| Born 1947 | Foundation, a philanthropic institution focused primarily | Corporation, an energy |
| Trustee since 1997 | on research and education on issues related to science, | company focused on |
| | technology, and economic performance. Elizabeth and | natural gas transmission |
| | James Killian Professor of Economics and Management, | and power services; |
| | Emeritus at the Massachusetts Institute of Technology | Exelon Corporation, an |
| | (MIT). Prior to 2007, served as the Director of the Center | energy company focused |
| | for Energy and Environmental Policy Research at MIT. | on power services |
|
| Kenneth R. Leibler | Founder and former Chairman of Boston Options | Ruder Finn Group, a |
| Born 1949 | Exchange, an electronic marketplace for the trading | global communications |
| Trustee since 2006 | of derivative securities. Vice Chairman of the Board of | and advertising firm; |
| | Trustees of Beth Israel Deaconess Hospital in Boston, | Northeast Utilities, |
| | Massachusetts. | which operates New |
| | | England’s largest energy |
| | | delivery system |
|
| Robert E. Patterson | Senior Partner of Cabot Properties, LP and Co-Chairman | None |
| Born 1945 | of Cabot Properties, Inc., a private equity firm investing in | |
| Trustee since 1984 | commercial real estate. Past Chairman and Trustee of the | |
| | Joslin Diabetes Center. | |
|
| George Putnam, III | Chairman of New Generation Research, Inc., a publisher | None |
| Born 1951 | of financial advisory and other research services, and | |
| Trustee since 1984 | founder and President of New Generation Advisors, LLC, | |
| | a registered investment advisor to private funds. | |
| Director of The Boston Family Office, LLC, a registered | |
| | investment advisor. | |
|
| Robert L. Reynolds* | President and Chief Executive Officer of Putnam | None |
| Born 1952 | Investments since 2008. Prior to joining Putnam | |
| Trustee since 2008 and | Investments, served as Vice Chairman and Chief | |
| President of the Putnam | Operating Officer of Fidelity Investments from | |
| Funds since July 2009 | 2000 to 2007. | |
|
| W. Thomas Stephens | Retired as Chairman and Chief Executive Officer of Boise | TransCanada |
| Born 1942 | Cascade, LLC, a paper, forest products, and timberland | Corporation, an energy |
| Trustee from 1997 to 2008 | assets company, in December 2008. | company focused on |
| and since 2009 | | natural gas transmission |
| | | and power services |
|
| Richard B. Worley | Managing Partner of Permit Capital LLC, an investment | Neuberger Berman, |
| Born 1945 | management firm. Serves as a Trustee of the University of | an investment |
| Trustee since 2004 | Pennsylvania Medical Center, the Robert Wood Johnson | management firm |
| | Foundation, a philanthropic organization devoted to | |
| health-care issues, and the National Constitution Center. | |
| | Also serves as a Director of the Colonial Williamsburg | |
| Foundation, a historical preservation organization, and as | |
| | Chairman of the Philadelphia Orchestra Association. | |
The address of each Trustee is One Post Office Square, Boston, MA 02109.
As of August 31, 2010, there were 105 Putnam funds. All Trustees serve as Trustees of all Putnam funds.
Each Trustee serves for an indefinite term, until his or her resignation, retirement at age 72, removal, or death.
* Mr. Reynolds is an “interested person” (as defined in the Investment Company Act of 1940) of the fund, Putnam Management, and/or Putnam Retail Management. He is President and Chief Executive Officer of Putnam Investments, as well as the President of your fund and each of the other Putnam funds.
63
Officers
In addition to Robert L. Reynolds, the other officers of the fund are shown below:
| |
| Jonathan S. Horwitz (Born 1955) | Francis J. McNamara, III (Born 1955) |
| Executive Vice President, Principal Executive | Vice President and Chief Legal Officer |
| Officer, Treasurer and Compliance Liaison | Since 2004 |
| Since 2004 | Senior Managing Director, Putnam Investments |
| Senior Vice President and Treasurer, | and Putnam Management |
| The Putnam Funds | |
| James P. Pappas (Born 1953) |
| Steven D. Krichmar (Born 1958) | Vice President |
| Vice President and Principal Financial Officer | Since 2004 |
| Since 2002 | Managing Director, Putnam Investments and |
| Senior Managing Director, Putnam Investments | Putnam Management |
| and Putnam Management | |
| Judith Cohen (Born 1945) |
| Janet C. Smith (Born 1965) | Vice President, Clerk and Assistant Treasurer |
| Vice President, Assistant Treasurer, and Principal | Since 1993 |
| Accounting Officer | Vice President, Clerk and Assistant Treasurer, |
| Since 2007 | The Putnam Funds |
| Managing Director, Putnam Investments and | |
| Putnam Management | Michael Higgins (Born 1976) |
| Vice President, Senior Associate Treasurer, |
| Beth S. Mazor (Born 1958) | Assistant Clerk |
| Vice President | Since 2010 |
| Since 2002 | Manager of Finance, Dunkin’ Brands (2008– |
| Managing Director, Putnam Investments and | 2010); Senior Financial Analyst, Old Mutual Asset |
| Putnam Management | Management (2007–2008); Senior Financial |
| Analyst, Putnam Investments (1999–2007) |
| Robert R. Leveille (Born 1969) | |
| Vice President and Chief Compliance Officer | Nancy E. Florek (Born 1957) |
| Since 2007 | Vice President, Assistant Clerk, |
| Managing Director, Putnam Investments, | Assistant Treasurer and Proxy Manager |
| Putnam Management and Putnam | Since 2000 |
| Retail Management | Vice President, Assistant Clerk, |
| Assistant Treasurer and Proxy Manager, |
| Mark C. Trenchard (Born 1962) | The Putnam Funds |
| Vice President and BSA Compliance Officer | |
| Since 2002 | Susan G. Malloy (Born 1957) |
| Managing Director, Putnam Investments and | Vice President and Assistant Treasurer |
| Putnam Retail Management | Since 2007 |
| Managing Director, Putnam Management |
The principal occupations of the officers for the past five years have been with the employers as shown above although in some cases, they have held different positions with such employers. The address of each Officer is One Post Office Square, Boston, MA 02109.
64
Services for shareholders
Investor services
Systematic investment plan Tell us how much you wish to invest regularly — weekly, semimonthly, or monthly — and the amount you choose will be transferred automatically from your checking or savings account. There’s no additional fee for this service, and you can suspend it at any time. This plan may be a great way to save for college expenses or to plan for your retirement.
Please note that regular investing does not guarantee a profit or protect against loss in a declining market. Before arranging a systematic investment plan, consider your financial ability to continue making purchases in periods when prices are low.
Systematic exchange You can make regular transfers from one Putnam fund to another Putnam fund. There are no additional fees for this service, and you can cancel or change your options at any time.
Dividends PLUS You can choose to have the dividend distributions from one of your Putnam funds automatically reinvested in another Putnam fund at no additional charge.
Free exchange privilege You can exchange money between Putnam funds free of charge, as long as they are the same class of shares. A signature guarantee is required if you are exchanging more than $500,000. The fund reserves the right to revise or terminate the exchange privilege.
Reinstatement privilege If you’ve sold Putnam shares or received a check for a dividend or capital gain, you may reinvest the proceeds with Putnam within 90 days of the transaction and they will be reinvested at the fund’s current net asset value — with no sales charge. However, reinstatement of class B shares may have special tax consequences. Ask your financial or tax representative for details.
Check-writing service You have ready access to many Putnam accounts. It’s as simple as writing a check, and there are no special fees or service charges. For more information about the check-writing service, call Putnam or visit our Web site.
Dollar cost averaging When you’re investing for long-term goals, it’s time, not timing, that counts. Investing on a systematic basis is a better strategy than trying to figure out when the markets will go up or down. This means investing the same amount of money regularly over a long period. This method of investing is called dollar cost averaging. When a fund’s share price declines, your investment dollars buy more shares at lower prices. When it increases, they buy fewer shares. Over time, you will pay a lower average price per share.
For more information
Visit the Individual Investors section at putnam.com A secure section of our Web site contains complete information on your account, including balances and transactions, updated daily. You may also conduct transactions, such as exchanges, additional investments, and address changes. Log on today to get your password.
Call us toll free at 1-800-225-1581 Ask a helpful Putnam representative or your financial advisor for details about any of these or other services, or see your prospectus.
65
The Putnam family of funds
The following is a list of Putnam’s open-end mutual funds offered to the public. Investors should carefully consider the investment objective, risks, charges, and expenses of a fund before investing. For a prospectus, or a summary prospectus if available, containing this and other information for any Putnam fund or product, call your financial advisor at 1-800-225-1581 and ask for a prospectus. Please read the prospectus carefully before investing.
| |
| Growth | Value |
| Growth Opportunities Fund | Convertible Securities Fund |
| International Growth Fund | Prior to September 30, 2010, the fund was known as |
| Prior to January 1, 2010, the fund was known as | Putnam Convertible Income-Growth Trust |
| Putnam International New Opportunities Fund | Equity Income Fund |
| Multi-Cap Growth Fund | George Putnam Balanced Fund |
| Prior to September 1, 2010, the fund was known as | Prior to September 30, 2010, the fund was known as |
| Putnam New Opportunities Fund | The George Putnam Fund of Boston |
| Small Cap Growth Fund | The Putnam Fund for Growth and Income |
| Voyager Fund | International Value Fund |
| | Prior to January 1, 2010, the fund was known as |
| Blend | Putnam International Growth and Income Fund |
| Asia Pacific Equity Fund | Multi-Cap Value Fund |
| Capital Opportunities Fund | Prior to September 1, 2010, the fund was known as |
| Capital Spectrum Fund | Putnam Mid Cap Value Fund |
| Emerging Markets Equity Fund | Small Cap Value Fund |
| Equity Spectrum Fund | |
| Europe Equity Fund | Income |
| Global Equity Fund | American Government Income Fund |
| International Capital Opportunities Fund | Diversified Income Trust |
| International Equity Fund | Floating Rate Income Fund |
| Investors Fund | Global Income Trust |
| Multi-Cap Core Fund | High Yield Advantage Fund |
| Research Fund | High Yield Trust |
| Income Fund |
| | Money Market Fund* |
| | U.S. Government Income Trust |
* An investment in a money market fund is not insured or guaranteed by the Federal Deposit Insurance Corporation or any other government agency. Although the fund seeks to preserve the value of your investment at $1.00 per share, it is possible to lose money by investing in the fund.
66
| |
| Tax-free income | Asset allocation |
| AMT-Free Municipal Fund | Income Strategies Fund |
| Tax Exempt Income Fund | Putnam Asset Allocation Funds — three |
| Tax Exempt Money Market Fund* | investment portfolios that spread your |
| Tax-Free High Yield Fund | money across a variety of stocks, bonds, |
| and money market investments. |
| State tax-free income funds: | |
| Arizona, California, Massachusetts, Michigan, | The three portfolios: |
| Minnesota, New Jersey, New York, Ohio, | Asset Allocation: Balanced Portfolio |
| and Pennsylvania | Asset Allocation: Conservative Portfolio |
| Asset Allocation: Growth Portfolio |
| Absolute Return | |
| Absolute Return 100 Fund | Putnam RetirementReady® |
| Absolute Return 300 Fund | Putnam RetirementReady Funds — 10 |
| Absolute Return 500 Fund | investment portfolios that offer diversifi- |
| Absolute Return 700 Fund | cation among stocks, bonds, and money |
| market instruments and adjust to become |
| Global Sector | more conservative over time based on a |
| Global Consumer Fund | target date for withdrawing assets. |
| Global Energy Fund | |
| Global Financials Fund | The 10 funds: |
| Global Health Care Fund | Putnam RetirementReady 2050 Fund |
| Global Industrials Fund | Putnam RetirementReady 2045 Fund |
| Global Natural Resources Fund | Putnam RetirementReady 2040 Fund |
| Global Sector Fund | Putnam RetirementReady 2035 Fund |
| Global Technology Fund | Putnam RetirementReady 2030 Fund |
| Global Telecommunications Fund | Putnam RetirementReady 2025 Fund |
| Global Utilities Fund | Putnam RetirementReady 2020 Fund |
| | Putnam RetirementReady 2015 Fund |
| | Putnam RetirementReady 2010 Fund |
| | Putnam RetirementReady Maturity Fund |
A short-term trading fee of 1% may apply to redemptions or exchanges from certain funds within the time period specified in the fund's prospectus.
Check your account balances and the most recent month-end performance in the Individual Investors section at putnam.com.
67
Fund information
Founded over 70 years ago, Putnam Investments was built around the concept that a balance between risk and reward is the hallmark of a well-rounded financial program. We manage over 100 funds across income, value, blend, growth, asset allocation, absolute return, and global sector categories.
| | |
| Investment Manager | Trustees | Susan G. Malloy |
| Putnam Investment | John A. Hill, Chairman | Vice President and |
| Management, LLC | Jameson A. Baxter, | Assistant Treasurer |
| One Post Office Square | Vice Chairman | |
| Boston, MA 02109 | Ravi Akhoury | Beth S. Mazor |
| | Barbara M. Baumann | Vice President |
| Investment Sub-Manager | Charles B. Curtis | |
| Putnam Investments Limited | Robert J. Darretta | James P. Pappas |
| 57–59 St James’s Street | Myra R. Drucker | Vice President |
| London, England SW1A 1LD | Paul L. Joskow | |
| | Kenneth R. Leibler | Francis J. McNamara, III |
| Investment Sub-Advisor | Robert E. Patterson | Vice President and |
| The Putnam Advisory | George Putnam, III | Chief Legal Officer |
| Company, LLC | Robert L. Reynolds | |
| One Post Office Square | W. Thomas Stephens | Robert R. Leveille |
| Boston, MA 02109 | Richard B. Worley | Vice President and |
| | Chief Compliance Officer |
| Marketing Services | Officers | |
| Putnam Retail Management | Robert L. Reynolds | Mark C. Trenchard |
| One Post Office Square | President | Vice President and |
| Boston, MA 02109 | | BSA Compliance Officer |
| Jonathan S. Horwitz | |
| Custodian | Executive Vice President, | Judith Cohen |
| State Street Bank | Principal Executive | Vice President, Clerk |
| and Trust Company | Officer, Treasurer and | and Assistant Treasurer |
| Compliance Liaison | |
| Legal Counsel | | Michael Higgins |
| Ropes & Gray LLP | Steven D. Krichmar | Vice President, Senior Associate |
| Vice President and | Treasurer, Assistant Clerk |
| Independent Registered | Principal Financial Officer | |
| Public Accounting Firm | | Nancy E. Florek |
| KPMG LLP | Janet C. Smith | Vice President, Assistant Clerk, |
| Vice President, Principal | Assistant Treasurer and |
| Accounting Officer and | Proxy Manager |
| | Assistant Treasurer | |
| | |
| | | |
| | | |
| | | |
| | | |
This report is for the information of shareholders of Putnam High Yield Trust. It may also be used as sales literature when preceded or accompanied by the current prospectus, the most recent copy of Putnam’s Quarterly Performance Summary, and Putnam’s Quarterly Ranking Summary. For more recent performance, please visit putnam.com. Investors should carefully consider the investment objective, risks, charges, and expenses of a fund, which are described in its prospectus. For this and other information or to request a prospectus, or a summary prospectus if available, call 1-800-225-1581 toll free. Please read the prospectus carefully before investing. The fund’s Statement of Additional Information contains additional information about the fund’s Trustees and is available without charge upon request by calling 1-800-225-1581.
68
Item 2. Code of Ethics:
(a) The fund’s principal executive, financial and accounting officers are employees of Putnam Investment Management, LLC, the Fund's investment manager. As such they are subject to a comprehensive Code of Ethics adopted and administered by Putnam Investments which is designed to protect the interests of the firm and its clients. The Fund has adopted a Code of Ethics which incorporates the Code of Ethics of Putnam Investments with respect to all of its officers and Trustees who are employees of Putnam Investment Management, LLC. For this reason, the Fund has not adopted a separate code of ethics governing its principal executive, financial and accounting officers.
(c) In May 2008, the Code of Ethics of Putnam Investment Management, LLC was updated in its entirety to include the amendments adopted in August 2007 as well as a several additional technical, administrative and non-substantive changes. In May of 2009, the Code of Ethics of Putnam Investment Management, LLC was amended to reflect that all employees will now be subject to a 90-day blackout restriction on holding Putnam open-end funds, except for portfolio managers and their supervisors (and each of their immediate family members), who will be subject to a one-year blackout restriction on the funds that they manage or supervise. In June 2010, the Code of Ethics of Putnam Investments was updated in its entirety to include the amendments adopted in May of 2009 and to change certain rules and limits contained in the Code of Ethics. In addition, the updated Code of Ethics included numerous technical, administrative and non - -substantive changes, which were intended primarily to make the document easier to navigate and understand.
Item 3. Audit Committee Financial Expert:
The Funds' Audit and Compliance Committee is comprised solely of Trustees who are "independent" (as such term has been defined by the Securities and Exchange Commission ("SEC") in regulations implementing Section 407 of the Sarbanes-Oxley Act (the "Regulations")). The Trustees believe that each of the members of the Audit and Compliance Committee also possess a combination of knowledge and experience with respect to financial accounting matters, as well as other attributes, that qualify them for service on the Committee. In addition, the Trustees have determined that each of Mr. Patterson, Mr. Leibler, Mr. Hill, Mr. Darretta and Ms. Baumann qualifies as an "audit committee financial expert" (as such term has been defined by the Regulations) based on their review of his or her pertinent experience and education. The SEC has stated that the designation or identification of a person as an audit committee financial expert pursuant to this Item 3 of Form N- CSR does not impose on such person any duties, obligations or liability that are greater than the duties, obligations and liability imposed on such person as a member of the Audit and Compliance Committee and the Board of Trustees in the absence of such designation or identification.
Item 4. Principal Accountant Fees and Services:
The following table presents fees billed in each of the last two fiscal years for services rendered to the fund by the fund’s independent auditor:
| | | | |
| Fiscal | | Audit- | | |
| year | Audit | Related | Tax | All Other |
| ended | Fees | Fees | Fees | Fees |
| August 31, 2010 | $62,286 | $-- | $5,800 | $-- |
| August 31, 2009 | $69,936 | $-- | $5,800 | $-- |
For the fiscal years ended August 31, 2010 and August 31, 2009, the fund’s independent auditor billed aggregate non-audit fees in the amounts of $ 5,800 and $5,800 respectively, to the fund, Putnam Management and any entity controlling, controlled by or under common control with Putnam Management that provides ongoing services to the fund.
Audit Fees represent fees billed for the fund's last two fiscal years relating to the audit and review of the financial statements included in annual reports and registration statements, and other services that are normally provided in connection with statutory and regulatory filings or engagements.
Audit-Related Fees represent fees billed in the fund’s last two fiscal years for services traditionally performed by the fund’s auditor, including accounting consultation for proposed transactions or concerning financial accounting and reporting standards and other audit or attest services not required by statute or regulation.
Tax Fees represent fees billed in the fund’s last two fiscal years for tax compliance, tax planning and tax advice services. Tax planning and tax advice services include assistance with tax audits, employee benefit plans and requests for rulings or technical advice from taxing authorities.
Pre-Approval Policies of the Audit and Compliance Committee. The Audit and Compliance Committee of the Putnam funds has determined that, as a matter of policy, all work performed for the funds by the funds’ independent auditors will be pre-approved by the Committee itself and thus will generally not be subject to pre-approval procedures.
The Audit and Compliance Committee also has adopted a policy to pre-approve the engagement by Putnam Management and certain of its affiliates of the funds’ independent auditors, even in circumstances where pre-approval is not required by applicable law. Any such requests by Putnam Management or certain of its affiliates are typically submitted in writing to the Committee and explain, among other things, the nature of the proposed engagement, the estimated fees, and why this work should be performed by that particular audit firm as opposed to another one. In reviewing such requests, the Committee considers, among other things, whether the provision of such services by the audit firm are compatible with the independence of the audit firm.
The following table presents fees billed by the fund’s independent auditor for services required to be approved pursuant to paragraph (c)(7)(ii) of Rule 2-01 of Regulation S-X.
| | | | |
| Fiscal | Audit- | | All | Total |
| year | Related | Tax | Other | Non-Audit |
| ended | Fees | Fees | Fees | Fees |
| August 31, 2010 | $ - | $ - | $ - | $ - |
| August 31, 2009 | $ - | $ - | $ - | $ - |
|
Item 5. Audit Committee of Listed Registrants
Not applicable
Item 6. Schedule of Investments:
The registrant’s schedule of investments in unaffiliated issuers is included in the report to shareholders in Item 1 above.
Item 7. Disclosure of Proxy Voting Policies and Procedures For Closed-End Management Investment Companies:
Not applicable
Item 8. Portfolio Managers of Closed-End Investment Companies
Not Applicable
Item 9. Purchases of Equity Securities by Closed-End Management Investment Companies and Affiliated Purchasers:
Not applicable
Item 10. Submission of Matters to a Vote of Security Holders:
Not applicable
Item 11. Controls and Procedures:
(a) The registrant's principal executive officer and principal financial officer have concluded, based on their evaluation of the effectiveness of the design and operation of the registrant's disclosure controls and procedures as of a date within 90 days of the filing date of this report, that the design and operation of such procedures are generally effective to provide reasonable assurance that information required to be disclosed by the registrant in this report is recorded, processed, summarized and reported within the time periods specified in the Commission's rules and forms.
(b) Changes in internal control over financial reporting: Not applicable
Item 12. Exhibits:
(a)(1) The Code of Ethics of The Putnam Funds, which incorporates the Code of Ethics of Putnam Investments, is filed herewith.
(a)(2) Separate certifications for the principal executive officer and principal financial officer of the registrant as required by Rule 30a-2(a) under the Investment Company Act of 1940, as amended, are filed herewith.
(b) The certifications required by Rule 30a-2(b) under the Investment Company Act of 1940, as amended, are filed herewith.
SIGNATURES
Pursuant to the requirements of the Securities Exchange Act of 1934 and the Investment Company Act of 1940, the registrant has duly caused this report to be signed on its behalf by the undersigned, thereunto duly authorized.
Putnam High Yield Trust
By (Signature and Title):
/s/Janet C. Smith
Janet C. Smith
Principal Accounting Officer
Date: October 29, 2010
Pursuant to the requirements of the Securities Exchange Act of 1934 and the Investment Company Act of 1940, this report has been signed below by the following persons on behalf of the registrant and in the capacities and on the dates indicated.
By (Signature and Title):
/s/Jonathan S. Horwitz
Jonathan S. Horwitz
Principal Executive Officer
Date: October 29, 2010
By (Signature and Title):
/s/Steven D. Krichmar
Steven D. Krichmar
Principal Financial Officer
Date: October 29, 2010