| | |
| UNITED STATES
SECURITIES AND EXCHANGE COMMISSION |
| | |
| CERTIFIED SHAREHOLDER REPORT OF REGISTERED
MANAGEMENT INVESTMENT COMPANIES
|
| | |
| Investment Company Act file number: | (811-02796) |
| | |
| Exact name of registrant as specified in charter: | Putnam High Yield Trust |
| | |
| Address of principal executive offices: | One Post Office Square, Boston, Massachusetts 02109 |
| | |
| Name and address of agent for service: | Robert T. Burns, Vice President
One Post Office Square
Boston, Massachusetts 02109 |
| | |
| Copy to: | Bryan Chegwidden, Esq.
Ropes & Gray LLP
1211 Avenue of the Americas
New York, New York 10036 |
| | |
| Registrant's telephone number, including area code: | (617) 292-1000 |
| | |
| Date of fiscal year end: | August 31, 2016 |
| | |
| Date of reporting period : | September 1, 2015 — August 31, 2016 |
| | |
|
Item 1. Report to Stockholders: | |
| | |
| The following is a copy of the report transmitted to stockholders pursuant to Rule 30e-1 under the Investment Company Act of 1940: | |

Putnam
High Yield
Trust
Annual report
8 | 31 | 16
| | | |
| Message from the Trustees | 1 | | |
| | |
| About the fund | 2 | | |
| | |
| Interview with your fund’s portfolio manager | 4 | | |
| | |
| Performance snapshot | 4 | | |
| | |
| Your fund’s performance | 11 | | |
| | |
| Your fund’s expenses | 14 | | |
| | |
| Terms and definitions | 16 | | |
| | |
| Other information for shareholders | 17 | | |
| | |
| Important notice regarding Putnam’s privacy policy | 18 | | |
| | |
| Trustee approval of management contract | 19 | | |
| | |
| Financial statements | 24 | | |
| | |
| Federal tax information | 70 | | |
| | |
| About the Trustees | 71 | | |
| | |
| Officers | 73 | | |
| | |
Consider these risks before investing: Bond prices may fall or fail to rise over time for several reasons, including general financial market conditions, changing market perceptions of the risk of default, changes in government intervention, and factors related to a specific issuer or industry. These factors may also lead to periods of high volatility and reduced liquidity in the bond markets. Lower-rated bonds may offer higher yields in return for more risk. Bond investments are subject to interest-rate risk (the risk of bond prices falling if interest rates rise) and credit risk (the risk of an issuer defaulting on interest or principal payments). Interest-rate risk is generally greater for longer term bonds, and credit risk is generally greater for below-investment-grade bonds. Risks associated with derivatives include increased investment exposure (which may be considered leverage) and, in the case of over-the-counter instruments, the potential inability to terminate or sell derivatives positions and the potential failure of the other party to the instrument to meet its obligations. Unlike bonds, funds that invest in bonds have fees and expenses. You can lose money by investing in the fund.
Message from the Trustees
Dear Fellow Shareholder:
Over the past several months, multiple headwinds have tested the mettle of the U.S. stock market as it ascended to record highs. At the same time, international financial markets have weathered myriad macroeconomic challenges. We acknowledge that bouts of volatility can be challenging for investors, but the lesson, we believe, is to stay invested and maintain a diversified portfolio despite short-term fluctuations.
In the United States, many analysts believe that we are close to full employment, and the threat of a recession, which was a concern earlier this year, appears to have diminished. Overseas, stock markets are also near all-time highs, but we believe growth prospects are positive for many countries, as central banks remain accommodative.
All market environments present challenges, which is why we favor active strategies based on fundamental research like the investment approach practiced at Putnam. Backed by a network of global analysts, Putnam portfolio managers bring years of experience to navigating changing market conditions and pursuing investment opportunities. In the following pages, you will find an overview of your fund’s performance for the reporting period ended August 31, 2016, as well as an outlook for the coming months.
As always, we believe it is important to consult regularly with your financial advisor, who can help you to determine whether your portfolio remains aligned with your long-term goals, time horizon, and tolerance for risk.
Thank you for investing with Putnam.


Interview with your fund’s portfolio manager

Paul, what was the market environment like for high-yield bonds during the 12 months ended August 31, 2016?
The early months of the period were volatile, as falling oil prices and mounting fears of an economic slowdown in China weighed on credit markets generally, including high-yield bonds. High-yield credit spreads — the yield advantage high-yield bonds offered over comparable-maturity U.S. Treasuries — rose significantly, as investors demanded greater compensation for risk that spread beyond the already punished energy and metals & mining sectors. Global economic concerns and heightened volatility overshadowed generally stable fundamentals in many industries.
Market turbulence reached a peak on February 11, after which high-yield bonds began to benefit from incremental improvements across a broad range of global issues. Oil and other commodity prices rallied, easing concerns in the energy and metals & mining groups. China’s central bank eased concerns by implementing additional stimulus measures, and improving U.S. economic data helped allay fears that global economic

Current performance may be lower or higher than the quoted past performance, which cannot guarantee future results. Share price, principal value, and return will fluctuate, and you may have a gain or a loss when you sell your shares. Performance of class A shares assumes reinvestment of distributions and does not account for taxes. Fund returns in the bar chart do not reflect a sales charge of 4.00%; had they, returns would have been lower. See pages 5 and 11–13 for additional performance information. For a portion of the periods, the fund had expense limitations, without which returns would have been lower. To obtain the most recent month-end performance, visit putnam.com.
* The fund’s benchmark, the JPMorgan Developed High Yield Index, was introduced on 12/31/94, which post-dates the inception of the fund’s class A shares.
developments would stall the U.S. expansion. The Federal Reserve backed away from its earlier statements, saying that it would take a gradual approach toward raising interest rates, based on a variety of U.S. and global economic factors.
The market upturn accelerated considerably in March and April — the largest consecutive-month advance for the asset class since 2009 — as demand for risk assets continued to improve and credit spreads tightened. And the rally continued in May amid a six-month high for oil prices and a jump in stock prices later in the month.
The rally was briefly disrupted in late June, as the so-called “Brexit” referendum vote by the United Kingdom to exit the European Union surprised investors and reverberated throughout global markets. However, as investors reassessed Brexit in the days immediately following the vote, concluding that its impact outside of Britain would likely be limited, credit-sensitive securities moved higher once again.
Reflecting a more favorable environment for riskier assets during the period’s second half, lower-quality bonds generated the best relative performance within the fund’s benchmark. From a sector/industry perspective, metals & mining bounced back strongly and was the top-performing group in the index. Telecommunications, gaming, lodging & leisure, and technology also outperformed, posting sizable double-digit gains. By contrast, health care, transportation, energy, and broadcasting lagged on a relative basis.
The fund trailed its benchmark but outpaced the average return of its Lipper peer group. What factors had the greatest impact on relative performance?
Generally speaking, it was a challenging period for high-yield managers. This was true partly because the majority of managers had underweight exposure to the rallying metals/mining sector, as we also did. Lighter-than-benchmark allocations to energy and technology also hampered performance versus the benchmark.
In addition, the fund had a modest underweight in Caa-rated bonds, and this area of the market performed the best. Modest allocations to cash and floating-rate bank
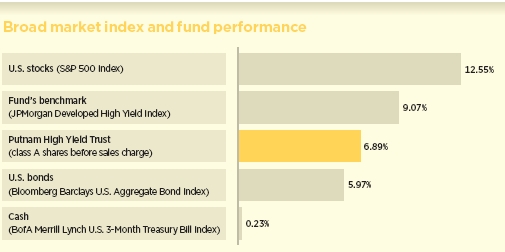
This comparison shows your fund’s performance in the context of broad market indexes for the 12 months ended 8/31/16. See pages 4 and 11–13 for additional fund performance information. Index descriptions can be found on page 16.
debt also dampened relative performance in a rising market.
On the positive side, overweights in telecommunications and housing, along with strong security selection in industrials, aided the fund’s relative results.
Which holdings contributed to relative performance?
Oil and gas exploration and production company SM Energy was the top relative contributor, as the firm’s bonds rallied in step with rising energy prices.
Telecom services provider Windstream was another contributor. In June, Windstream completed a debt-for-equity exchange with its creditors that enabled the firm to reduce its outstanding debt by about $3.9 billion, thereby strengthening its balance sheet.
Mobile communications firm T-Mobile also helped on a relative basis. The company announced a new unlimited data plan and continued to take market share from competitors.
Which positions weren’t as productive?
Our investment in Chesapeake Energy was hurt by weak natural gas prices during the first half of the period. Since then, Chesapeake reduced its dividend and sold certain assets, helping to improve the firm’s liquidity.

Credit qualities are shown as a percentage of the fund’s net assets as of 8/31/16. A bond rated BBB or higher (A-3 or higher, for short-term debt) is considered investment grade. This chart reflects the highest security rating provided by one or more of Standard & Poor’s, Moody’s, and Fitch. Ratings and portfolio credit quality will vary over time.
Cash and net other assets, if any, represent the market value weights of cash, derivatives, and short-term securities in the portfolio. The fund itself has not been rated by an independent rating agency.
Bonds issued by satellite services provider Intelsat also worked against the fund’s relative return. The company experienced disappointing financial results in its government business unit. Intelsat also faced increased competition from the installation of fiber optic cable in some of its international markets. These factors pressured the firm’s operating margin.
The fund trimmed its dividend rate during the period. What factors led to that decision?
The fund had maintained a stable dividend since December 2013. However, from 2013 through the first half of 2015, there was a substantial amount of refinancing activity in the high-yield market. As a result, new securities were issued with lower coupons, or stated interest rates, replacing older bonds that had higher coupons. As these lower-coupon bonds were added to the fund, the total amount of income generated by the portfolio declined. Consequently, it became necessary to modestly reduce the fund’s monthly distribution rate, which we did in May 2016,
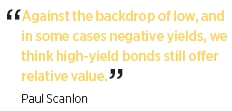
This table shows the fund’s top 10 holdings and the percentage of the fund’s net assets that each represented as of 8/31/16. Short-term investments, TBA commitments, and derivatives, if any, are excluded. Holdings may vary over time.
lowering it from $0.035 to $0.031 per class A share. Similar reductions were made to other share classes.
What is your outlook for the high-yield market over the coming months?
We evaluate the high-yield market on three levels: fundamentals, valuation, and “technicals,” or the balance of supply and demand. As of period-end, we thought the fundamental backdrop was constructive, while valuation and technicals were neutral.
Looking at fundamentals, we believe the U.S. economy may continue to grow at a moderate pace in the months ahead, and could provide a supportive backdrop for high-yield bonds.
High-yield default activity decreased in August 2016, registering a 17-month low in default volume and the fewest number of defaults since October 2015. The total default rate was 4.51% at period-end, but excluding the energy and metals & mining sectors, the default rate was a mere 0.53%. All told, we believe most high-yield issuers — excluding those in commodity-sensitive sectors — are in reasonably good shape from a credit perspective.
At period-end, we thought high-yield valuations were not as attractive as they were during the early months of the period. The
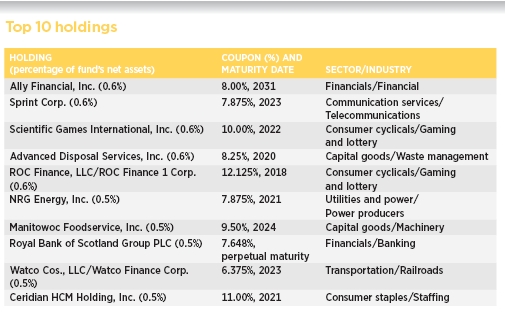
This chart shows how the fund’s credit quality has changed over the past six months. Credit qualities are shown as a percentage of the fund’s net assets. A bond rated BBB or higher (A-3 or higher, for short-term debt) is considered investment grade. This chart reflects the highest security rating provided by one or more of Standard & Poor’s, Moody’s, and Fitch. Ratings and portfolio credit quality will vary over time.
Cash and net other assets, if any, represent the market value weights of cash, derivatives, and short-term securities in the portfolio. The fund itself has not been rated by an independent rating agency.
Data in the chart reflect a new calculation methodology put into effect within the past twelve months.
benchmark’s yield spread had tightened considerably and the median bond price had moved closer to par, or face value. Although valuations were less compelling, we believed spreads remained fair on the heels of generally favorable fundamental conditions.
As for technicals, new issuance of high-yield bonds rose during the second half of the period, reflecting, in our view, greater comfort with current marketplace dynamics. Industry-wide high-yield bond fund inflows also increased, totaling $10 billion year to date in 2016.
Overall, against the backdrop of low, and in some cases negative, yields we think high-yield bonds still offer relative value.
How do you plan to position the fund in light of this outlook?
Overall, we plan to maintain broad diversification across market sectors. At period-end, the majority of the fund’s holdings were in split Ba-rated or B-rated bonds, which occupy the middle tier of high-yield credit quality. From a sector/industry perspective, we favored gaming, lodging & leisure, housing, and telecommunications. Conversely, the fund was underweight in energy, technology, services, food and beverages, and metals & mining.
We modestly increased our allocation to bank debt to about 6% of the portfolio. Many corporations issue both bank loans and high-yield bonds. Bank loans are secured by the issuer’s assets, giving loans a senior position in the firm’s capital structure, whereas high-yield bonds are usually unsecured. This means that in the event of bankruptcy, bank-loan investors will typically be paid back before bondholders, if any assets remain available for distribution. Given that the market appears to be in a later stage of the credit cycle, we think holding securities that are more senior in an issuer’s capital structure is prudent. Moreover, loans have underperformed high-yield bonds thus far in 2016, so we think their relative valuation is attractive. And, if interest rates begin to move higher, we believe bank loans could benefit from renewed retail investor demand, since loan coupons — their stated interest rates — may begin to adjust higher.
Lastly, we plan to hold a slightly higher-than-normal cash allocation in the portfolio to provide a cushion against bouts of market volatility, as well as any disruptions in the market’s supply/demand environment.
Thanks for your time and for bringing us up to date, Paul.
The views expressed in this report are exclusively those of Putnam Management and are subject to change. They are not meant as investment advice.
Please note that the holdings discussed in this report may not have been held by the fund for the entire period. Portfolio composition is subject to review in accordance with the fund’s investment strategy and may vary in the future. Current and future portfolio holdings are subject to risk.
Portfolio Manager Paul D. Scanlon is Co-Head of Fixed Income at Putnam. He has an M.B.A. from The University of Chicago Booth School of Business and a B.A. from Colgate University. Paul joined Putnam in 1999 and has been in the investment industry since 1986.
In addition to Paul, your fund’s portfolio managers are Norman P. Boucher and Robert L. Salvin.
IN THE NEWS
In what President Barack Obama called a “turning point for the world,” the United States and China in early September ratified the Paris agreement to curb climate-warming emissions. China is the largest emitter of greenhouse gasses, followed by the United States, with both countries accounting for an estimated 40% of the world’s man-made CO2 emissions. The pact, which could take effect as early as the end of 2016, could be a boon for “green” industries, including companies that make wind turbines, solar panels, and electric cars, as well as those that specialize in energy-efficient buildings and carbon-capture technologies. China was motivated to join the pact for various reasons. For instance, many of the country’s large cities are choked with severe pollution, which threatens China’s political stability. In addition, China is the leading manufacturer of wind and solar technologies. Meanwhile, in the United States, the coal industry would likely be hard hit by the enactment of the Paris agreement as efforts are made to reduce CO2 emissions. The burning of coal is the largest single source of greenhouse gas emissions. In an interview with The New York Times, President Obama said that it is society’s responsibility to ensure that the coal-mine workers and others affected by the agreement are retrained to “build wind turbines and install solar panels.”
Your fund’s performance
This section shows your fund’s performance, price, and distribution information for periods ended August 31, 2016, the end of its most recent fiscal year. In accordance with regulatory requirements for mutual funds, we also include performance information as of the most recent calendar quarter-end and expense information taken from the fund’s current prospectus. Performance should always be considered in light of a fund’s investment strategy. Data represent past performance. Past performance does not guarantee future results. More recent returns may be less or more than those shown. Investment return and principal value will fluctuate, and you may have a gain or a loss when you sell your shares. Performance information does not reflect any deduction for taxes a shareholder may owe on fund distributions or on the redemption of fund shares. For the most recent month-end performance, please visit the Individual Investors section at putnam.com or call Putnam at 1-800-225-1581. Class R and Y shares are not available to all investors. See the Terms and Definitions section in this report for definitions of the share classes offered by your fund.
Fund performance Total return for periods ended 8/31/16
| | | | | | | | | | |
| | Class A | Class B | Class C | Class M | Class R | Class Y |
| (inception dates) | (2/14/78) | (3/1/93) | (3/19/02) | (7/3/95) | (1/21/03) | (12/31/98) |
|
| | Before | After | | | | | Before | After | Net | Net |
| | sales | sales | Before | After | Before | After | sales | sales | asset | asset |
| | charge | charge | CDSC | CDSC | CDSC | CDSC | charge | charge | value | value |
|
| Annual average | | | | | | | | | | |
| (life of fund) | 8.44% | 8.33% | 8.21% | 8.21% | 7.62% | 7.62% | 8.09% | 7.99% | 8.14% | 8.55% |
|
| 10 years | 90.23 | 82.62 | 79.56 | 79.56 | 76.32 | 76.32 | 85.45 | 79.42 | 83.85 | 94.08 |
| Annual average | 6.64 | 6.21 | 6.03 | 6.03 | 5.84 | 5.84 | 6.37 | 6.02 | 6.28 | 6.86 |
|
| 5 years | 37.69 | 32.18 | 32.63 | 30.63 | 32.62 | 32.62 | 35.97 | 31.55 | 36.14 | 39.41 |
| Annual average | 6.61 | 5.74 | 5.81 | 5.49 | 5.81 | 5.81 | 6.34 | 5.64 | 6.36 | 6.87 |
|
| 3 years | 13.50 | 8.96 | 11.11 | 8.22 | 11.08 | 11.08 | 12.78 | 9.11 | 12.79 | 14.49 |
| Annual average | 4.31 | 2.90 | 3.58 | 2.67 | 3.56 | 3.56 | 4.09 | 2.95 | 4.09 | 4.61 |
|
| 1 year | 6.89 | 2.61 | 6.10 | 1.10 | 6.15 | 5.15 | 6.73 | 3.26 | 6.68 | 7.18 |
|
Current performance may be lower or higher than the quoted past performance, which cannot guarantee future results. After-sales-charge returns for class A and M shares reflect the deduction of the maximum 4.00% and 3.25% sales charge, respectively, levied at the time of purchase. Class B share returns after contingent deferred sales charge (CDSC) reflect the applicable CDSC, which is 5% in the first year, declining over time to 1% in the sixth year, and is eliminated thereafter. Class C share returns after CDSC reflect a 1% CDSC for the first year that is eliminated thereafter. Class R and Y shares have no initial sales charge or CDSC. Performance for class B, C, M, R, and Y shares before their inception is derived from the historical performance of class A shares, adjusted for the applicable sales charge (or CDSC) and the higher operating expenses for such shares, except for class Y shares, for which 12b-1 fees are not applicable.
For a portion of the periods, the fund had expense limitations, without which returns would have been lower.
Class B share performance reflects conversion to class A shares after eight years.
Comparative index returns For periods ended 8/31/16
| | |
| | JPMorgan Developed High | Lipper High Yield Funds |
| | Yield Index | category average* |
|
| Annual average (life of fund) | —† | 8.22% |
|
| 10 years | 116.31% | 83.94 |
| Annual average | 8.02 | 6.25 |
|
| 5 years | 44.73 | 35.43 |
| Annual average | 7.67 | 6.22 |
|
| 3 years | 17.08 | 12.37 |
| Annual average | 5.40 | 3.94 |
|
| 1 year | 9.07 | 6.12 |
|
Index and Lipper results should be compared with fund performance before sales charge, before CDSC, or at net asset value.
* Over the 1-year, 3-year, 5-year, 10-year, and life-of-fund periods ended 8/31/16, there were 660, 552, 437, 293, and 9 funds, respectively, in this Lipper category.
† The fund’s benchmark, the JPMorgan Developed High Yield Index, was introduced on 12/31/94, which post-dates the inception of the fund’s class A shares.
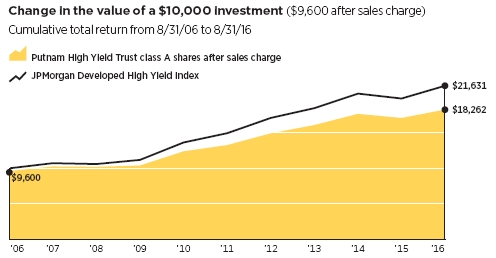
Past performance does not indicate future results. At the end of the same time period, a $10,000 investment in the fund’s class B and C shares would have been valued at $17,956 and $17,632, respectively, and no contingent deferred sales charges would apply. A $10,000 investment in the fund’s class M shares ($9,675 after sales charge) would have been valued at $17,942. A $10,000 investment in the fund’s class R and Y shares would have been valued at $18,385 and $19,408, respectively.
Fund price and distribution information For the 12-month period ended 8/31/16
| | | | | | | | |
| Distributions | Class A | Class B | Class C | Class M | Class R | Class Y |
|
| Number | 12 | 12 | 12 | 12 | 12 | 12 |
|
| Income | $0.404 | $0.350 | $0.350 | $0.386 | $0.389 | $0.422 |
|
| Capital gains | — | — | — | — | — | — |
|
| Total | $0.404 | $0.350 | $0.350 | $0.386 | $0.389 | $0.422 |
|
| | Before | After | Net | Net | Before | After | Net | Net |
| | sales | sales | asset | asset | sales | sales | asset | asset |
| Share value | charge | charge | value | value | charge | charge | value | value |
|
| 8/31/15 | $7.52 | $7.83 | $7.51 | $7.45 | $7.55 | $7.80 | $7.36 | $7.36 |
|
| 8/31/16 | 7.60 | 7.92 | 7.59 | 7.53 | 7.64 | 7.90 | 7.43 | 7.43 |
|
| | Before | After | Net | Net | Before | After | Net | Net |
| | sales | sales | asset | asset | sales | sales | asset | asset |
| Current rate (end of period) | charge | charge | value | value | charge | charge | value | value |
|
| Current dividend rate 1 | 4.89% | 4.70% | 4.11% | 4.14% | 4.55% | 4.41% | 4.68% | 5.33% |
|
| Current 30-day SEC yield 2 | N/A | 4.54 | 3.99 | 3.97 | N/A | 4.33 | 4.48 | 4.98 |
|
The classification of distributions, if any, is an estimate. Before-sales-charge share value and current dividend rate for class A and M shares, if applicable, do not take into account any sales charge levied at the time of purchase. After-sales-charge share value, current dividend rate, and current 30-day SEC yield, if applicable, are calculated assuming that the maximum sales charge (4.00% for class A shares and 3.25% for class M shares) was levied at the time of purchase. Final distribution information will appear on your year-end tax forms.
1 Most recent distribution, including any return of capital and excluding capital gains, annualized and divided by share price before or after sales charge at period-end.
2 Based only on investment income and calculated using the maximum offering price for each share class, in accordance with SEC guidelines.
Fund performance as of most recent calendar quarter
Total return for periods ended 9/30/16
| | | | | | | | | | |
| | Class A | Class B | Class C | Class M | Class R | Class Y |
| (inception dates) | (2/14/78) | (3/1/93) | (3/19/02) | (7/3/95) | (1/21/03) | (12/31/98) |
|
| | Before | After | | | | | Before | After | Net | Net |
| | sales | sales | Before | After | Before | After | sales | sales | asset | asset |
| | charge | charge | CDSC | CDSC | CDSC | CDSC | charge | charge | value | value |
|
| Annual average | | | | | | | | | | |
| (life of fund) | 8.44% | 8.33% | 8.21% | 8.21% | 7.62% | 7.62% | 8.09% | 7.99% | 8.14% | 8.54% |
|
| 10 years | 89.12 | 81.56 | 78.48 | 78.48 | 75.29 | 75.29 | 84.37 | 78.37 | 82.79 | 92.96 |
| Annual average | 6.58 | 6.15 | 5.96 | 5.96 | 5.77 | 5.77 | 6.31 | 5.96 | 6.22 | 6.79 |
|
| 5 years | 44.60 | 38.82 | 39.31 | 37.31 | 39.13 | 39.13 | 42.96 | 38.32 | 42.92 | 46.33 |
| Annual average | 7.66 | 6.78 | 6.85 | 6.55 | 6.83 | 6.83 | 7.41 | 6.70 | 7.40 | 7.91 |
|
| 3 years | 13.12 | 8.59 | 10.59 | 7.71 | 10.55 | 10.55 | 12.26 | 8.61 | 12.27 | 13.80 |
| Annual average | 4.19 | 2.79 | 3.41 | 2.51 | 3.40 | 3.40 | 3.93 | 2.79 | 3.93 | 4.40 |
|
| 1 year | 10.63 | 6.21 | 9.83 | 4.83 | 9.76 | 8.76 | 10.46 | 6.87 | 10.37 | 10.87 |
|
See the discussion following the fund performance table on page 11 for information about the calculation of fund performance.
Your fund’s expenses
As a mutual fund investor, you pay ongoing expenses, such as management fees, distribution fees (12b-1 fees), and other expenses. In the most recent six-month period, your fund’s expenses were limited; had expenses not been limited, they would have been higher. Using the following information, you can estimate how these expenses affect your investment and compare them with the expenses of other funds. You may also pay one-time transaction expenses, including sales charges (loads) and redemption fees, which are not shown in this section and would have resulted in higher total expenses. For more information, see your fund’s prospectus or talk to your financial representative.
Expense ratios
| | | | | | |
| | Class A | Class B | Class C | Class M | Class R | Class Y |
|
| Total annual operating expenses | | | | | | |
| for the fiscal year ended 8/31/15 | 1.00% | 1.75% | 1.75% | 1.25% | 1.25% | 0.75% |
|
| Annualized expense ratio for | | | | | | |
| the six-month period ended | | | | | | |
| 8/31/16* | 1.03% | 1.78% | 1.78% | 1.28% | 1.28% | 0.78% |
|
Fiscal-year expense information in this table is taken from the most recent prospectus, is subject to change, and may differ from that shown for the annualized expense ratio and in the financial highlights of this report.
Expenses are shown as a percentage of average net assets.
* Expense ratios for each class are for the fund’s most recent fiscal half year. As a result of this, ratios may differ from expense ratios based on one-year data in the financial highlights.
Expenses per $1,000
The following table shows the expenses you would have paid on a $1,000 investment in each class of the fund from 3/1/16 to 8/31/16. It also shows how much a $1,000 investment would be worth at the close of the period, assuming actual returns and expenses.
| | | | | | |
| | Class A | Class B | Class C | Class M | Class R | Class Y |
|
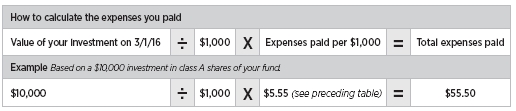
| Expenses paid per $1,000*† | $5.55 | $9.57 | $9.57 | $6.89 | $6.89 | $4.20 |
|
| Ending value (after expenses) | $1,142.50 | $1,138.70 | $1,138.20 | $1,140.40 | $1,141.50 | $1,144.00 |
|
* Expenses for each share class are calculated using the fund’s annualized expense ratio for each class, which represents the ongoing expenses as a percentage of average net assets for the six months ended 8/31/16. The expense ratio may differ for each share class.
† Expenses are calculated by multiplying the expense ratio by the average account value for the period; then multiplying the result by the number of days in the period; and then dividing that result by the number of days in the year.
Estimate the expenses you paid
To estimate the ongoing expenses you paid for the six months ended 8/31/16, use the following calculation method. To find the value of your investment on 3/1/16, call Putnam at 1-800-225-1581.
Compare expenses using the SEC’s method
The Securities and Exchange Commission (SEC) has established guidelines to help investors assess fund expenses. Per these guidelines, the following table shows your fund’s expenses based on a $1,000 investment, assuming a hypothetical 5% annualized return. You can use this information to compare the ongoing expenses (but not transaction expenses or total costs) of investing in the fund with those of other funds. All mutual fund shareholder reports will provide this information to help you make this comparison. Please note that you cannot use this information to estimate your actual ending account balance and expenses paid during the period.
| | | | | | |
| | Class A | Class B | Class C | Class M | Class R | Class Y |
|
| Expenses paid per $1,000*† | $5.23 | $9.02 | $9.02 | $6.50 | $6.50 | $3.96 |
|
| Ending value (after expenses) | $1,019.96 | $1,016.19 | $1,016.19 | $1,018.70 | $1,018.70 | $1,021.22 |
|
* Expenses for each share class are calculated using the fund’s annualized expense ratio for each class, which represents the ongoing expenses as a percentage of average net assets for the six months ended 8/31/16. The expense ratio may differ for each share class.
† Expenses are calculated by multiplying the expense ratio by the average account value for the six-month period; then multiplying the result by the number of days in the six-month period; and then dividing that result by the number of days in the year.
Terms and definitions
Important terms
Total return shows how the value of the fund’s shares changed over time, assuming you held the shares through the entire period and reinvested all distributions in the fund.
Before sales charge, or net asset value, is the price, or value, of one share of a mutual fund, without a sales charge. Before-sales-charge figures fluctuate with market conditions, and are calculated by dividing the net assets of each class of shares by the number of outstanding shares in the class.
After sales charge is the price of a mutual fund share plus the maximum sales charge levied at the time of purchase. After-sales-charge performance figures shown here assume the 4.00% maximum sales charge for class A shares and 3.25% for class M shares.
Contingent deferred sales charge (CDSC) is generally a charge applied at the time of the redemption of class B or C shares and assumes redemption at the end of the period. Your fund’s class B CDSC declines over time from a 5% maximum during the first year to 1% during the sixth year. After the sixth year, the CDSC no longer applies. The CDSC for class C shares is 1% for one year after purchase.
Share classes
Class A shares are generally subject to an initial sales charge and no CDSC (except on certain redemptions of shares bought without an initial sales charge).
Class B shares are not subject to an initial sales charge and may be subject to a CDSC.
Class C shares are not subject to an initial sales charge and are subject to a CDSC only if the shares are redeemed during the first year.
Class M shares have a lower initial sales charge and a higher 12b-1 fee than class A shares and no CDSC.
Class R shares are not subject to an initial sales charge or CDSC and are available only to employer-sponsored retirement plans.
Class Y shares are not subject to an initial sales charge or CDSC, and carry no 12b-1 fee. They are generally only available to corporate and institutional clients and clients in other approved programs.
Fixed-income terms
Current rate is the annual rate of return earned from dividends or interest of an investment. Current rate is expressed as a percentage of the price of a security, fund share, or principal investment.
Yield curve is a graph that plots the yields of bonds with equal credit quality against their differing maturity dates, ranging from shortest to longest. It is used as a benchmark for other debt, such as mortgage or bank lending rates.
Comparative indexes
Bloomberg Barclays U.S. Aggregate Bond Index is an unmanaged index of U.S. investment-grade fixed-income securities.
BofA Merrill Lynch U.S. 3-Month Treasury Bill Index is an unmanaged index that seeks to measure the performance of U.S. Treasury bills available in the marketplace.
JPMorgan Developed High Yield Index is an unmanaged index of high-yield fixed-income securities issued in developed countries.
S&P 500 Index is an unmanaged index of common stock performance.
Indexes assume reinvestment of all distributions and do not account for fees. Securities and performance of a fund and an index will differ. You cannot invest directly in an index.
Lipper is a third-party industry-ranking entity that ranks mutual funds. Its rankings do not reflect sales charges. Lipper rankings are based on total return at net asset value
relative to other funds that have similar current investment styles or objectives as determined by Lipper. Lipper may change a fund’s category assignment at its discretion. Lipper category averages reflect performance trends for funds within a category.
Other information for shareholders
Proxy voting
Putnam is committed to managing our mutual funds in the best interests of our shareholders. The Putnam funds’ proxy voting guidelines and procedures, as well as information regarding how your fund voted proxies relating to portfolio securities during the 12-month period ended June 30, 2016, are available in the Individual Investors section of putnam.com, and on the Securities and Exchange Commission (SEC) website, www.sec.gov. If you have questions about finding forms on the SEC’s website, you may call the SEC at 1-800-SEC-0330. You may also obtain the Putnam funds’ proxy voting guidelines and procedures at no charge by calling Putnam’s Shareholder Services at 1-800-225-1581.
Fund portfolio holdings
The fund will file a complete schedule of its portfolio holdings with the SEC for the first and third quarters of each fiscal year on Form N-Q. Shareholders may obtain the fund’s Form N-Q on the SEC’s website at www.sec.gov. In addition, the fund’s Form N-Q may be reviewed and copied at the SEC’s Public Reference Room in Washington, D.C. You may call the SEC at 1-800-SEC-0330 for information about the SEC’s website or the operation of the Public Reference Room.
Trustee and employee fund ownership
Putnam employees and members of the Board of Trustees place their faith, confidence, and, most importantly, investment dollars in Putnam mutual funds. As of August 31, 2016, Putnam employees had approximately $495,000,000 and the Trustees had approximately $132,000,000 invested in Putnam mutual funds. These amounts include investments by the Trustees’ and employees’ immediate family members as well as investments through retirement and deferred compensation plans.
Important notice regarding Putnam’s privacy policy
In order to conduct business with our shareholders, we must obtain certain personal information such as account holders’ names, addresses, Social Security numbers, and dates of birth. Using this information, we are able to maintain accurate records of accounts and transactions.
It is our policy to protect the confidentiality of our shareholder information, whether or not a shareholder currently owns shares of our funds. In particular, it is our policy not to sell information about you or your accounts to outside marketing firms. We have safeguards in place designed to prevent unauthorized access to our computer systems and procedures to protect personal information from unauthorized use.
Under certain circumstances, we must share account information with outside vendors who provide services to us, such as mailings and proxy solicitations. In these cases, the service providers enter into confidentiality agreements with us, and we provide only the information necessary to process transactions and perform other services related to your account. Finally, it is our policy to share account information with your financial representative, if you’ve listed one on your Putnam account.
Trustee approval of management contract
General conclusions
The Board of Trustees of The Putnam Funds oversees the management of each fund and, as required by law, determines annually whether to approve the continuance of your fund’s management contract with Putnam Investment Management, LLC (“Putnam Management”) and the sub-management contract with respect to your fund between Putnam Management and its affiliate, Putnam Investments Limited (“PIL”). The Board, with the assistance of its Contract Committee, requests and evaluates all information it deems reasonably necessary under the circumstances in connection with its annual contract review. The Contract Committee consists solely of Trustees who are not “interested persons” (as this term is defined in the Investment Company Act of 1940, as amended (the “1940 Act”)) of The Putnam Funds (“Independent Trustees”).
At the outset of the review process, members of the Board’s independent staff and independent legal counsel discussed with representatives of Putnam Management the annual contract review materials furnished to the Contract Committee during the course of the previous year’s review, identifying possible changes in these materials that might be necessary or desirable for the coming year. Following these discussions and in consultation with the Contract Committee, the Independent Trustees’ independent legal counsel requested that Putnam Management and its affiliates furnish specified information, together with any additional information that Putnam Management considered relevant, to the Contract Committee. Over the course of several months ending in June 2016, the Contract Committee met on a number of occasions with representatives of Putnam Management, and separately in executive session, to consider the information that Putnam Management provided, as well as supplemental information provided in response to an additional request made by the Contract Committee. Throughout this process, the Contract Committee was assisted by the members of the Board’s independent staff and by independent legal counsel for The Putnam Funds and the Independent Trustees.
In May 2016, the Contract Committee met in executive session to discuss and consider its recommendations with respect to the continuance of the contracts. At the Trustees’ June 24, 2016 meeting, the Contract Committee met in executive session with the other Independent Trustees to review a summary of the key financial, performance and other data that the Contract Committee considered in the course of its review. The Contract Committee then presented its written report, which summarized the key factors that the Committee had considered and set forth its recommendations. The Contract Committee then recommended, and the Independent Trustees approved, the continuance of your fund’s management and sub-management contracts, effective July 1, 2016. (Because PIL is an affiliate of Putnam Management and Putnam Management remains fully responsible for all services provided by PIL, the Trustees have not attempted to evaluate PIL as a separate entity, and all subsequent references to Putnam Management below should be deemed to include reference to PIL as necessary or appropriate in the context.)
The Independent Trustees’ approval was based on the following conclusions:
• That the fee schedule in effect for your fund represented reasonable compensation in light of the nature and quality of the services being provided to the fund, the fees paid by competitive funds, the costs incurred by Putnam Management in providing services to the
fund, and the continued application of certain reductions and waivers noted below; and
• That the fee schedule in effect for your fund represented an appropriate sharing between fund shareholders and Putnam Management of such economies of scale as may exist in the management of the fund at current asset levels.
These conclusions were based on a comprehensive consideration of all information provided to the Trustees and were not the result of any single factor. Some of the factors that figured particularly in the Trustees’ deliberations and how the Trustees considered these factors are described below, although individual Trustees may have evaluated the information presented differently, giving different weights to various factors. It is also important to recognize that the management arrangements for your fund and the other Putnam funds are the result of many years of review and discussion between the Independent Trustees and Putnam Management, that some aspects of the arrangements may receive greater scrutiny in some years than others, and that the Trustees’ conclusions may be based, in part, on their consideration of fee arrangements in previous years. For example, with some minor exceptions, the funds’ current fee arrangements under the management contracts were first implemented at the beginning of 2010 following extensive review by the Contract Committee and discussions with representatives of Putnam Management, as well as approval by shareholders.
Management fee schedules and total expenses
The Trustees reviewed the management fee schedules in effect for all Putnam funds, including fee levels and breakpoints. The Trustees also reviewed the total expenses of each Putnam fund, recognizing that in most cases management fees represented the major, but not the sole, determinant of total costs to shareholders. (In a few instances, funds have implemented so-called “all-in” management fees covering substantially all routine fund operating costs.)
In reviewing fees and expenses, the Trustees generally focus their attention on material changes in circumstances — for example, changes in assets under management, changes in a fund’s investment style, changes in Putnam Management’s operating costs or profitability, or changes in competitive practices in the mutual fund industry — that suggest that consideration of fee changes might be warranted. The Trustees concluded that the circumstances did not indicate that changes to the management fee structure for your fund would be appropriate at this time.
Under its management contract, your fund has the benefit of breakpoints in its management fee schedule that provide shareholders with economies of scale in the form of reduced fee rates as assets under management in the Putnam family of funds increase. The Trustees concluded that the fee schedule in effect for your fund represented an appropriate sharing of economies of scale between fund shareholders and Putnam Management.
As in the past, the Trustees also focused on the competitiveness of each fund’s total expense ratio. In order to support the effort to have fund expenses meet competitive standards, the Trustees and Putnam Management have implemented certain expense limitations that were in effect during your fund’s fiscal year ending in 2015. These expense limitations were: (i) a contractual expense limitation applicable to specified retail open-end funds, including your fund, of 32 basis points on investor servicing fees and expenses and (ii) a contractual expense limitation applicable to specified open-end funds, including your fund, of 20 basis points on so-called “other expenses” (i.e., all expenses exclusive of management fees, distribution fees, investor servicing fees, investment-related expenses, interest, taxes,
brokerage commissions, acquired fund fees and expenses and extraordinary expenses). These expense limitations attempt to maintain competitive expense levels for the funds. Most funds, including your fund, had sufficiently low expenses that these expense limitations were not operative during their fiscal years ending in 2015. Putnam Management has agreed to maintain these expense limitations until at least December 30, 2017 and to reduce the contractual expense limitation on investor servicing fees and expenses from 32 basis points to 25 basis points effective September 1, 2016. Putnam Management’s support for these expense limitation arrangements was an important factor in the Trustees’ decision to approve the continuance of your fund’s management and sub-management contracts.
The Trustees reviewed comparative fee and expense information for a custom group of competitive funds selected by Lipper Inc. (“Lipper”). This comparative information included your fund’s percentile ranking for effective management fees and total expenses (excluding any applicable 12b-1 fee), which provides a general indication of your fund’s relative standing. In the custom peer group, your fund ranked in the second quintile in effective management fees (determined for your fund and the other funds in the custom peer group based on fund asset size and the applicable contractual management fee schedule) and in the second quintile in total expenses (excluding any applicable 12b-1 fees) as of December 31, 2015. The first quintile represents the least expensive funds and the fifth quintile the most expensive funds. The fee and expense data reported by Lipper as of December 31, 2015 reflected the most recent fiscal year-end data available in Lipper’s database at that time.
In connection with their review of fund management fees and total expenses, the Trustees also reviewed the costs of the services provided and the profits realized by Putnam Management and its affiliates from their contractual relationships with the funds. This information included trends in revenues, expenses and profitability of Putnam Management and its affiliates relating to the investment management, investor servicing and distribution services provided to the funds. In this regard, the Trustees also reviewed an analysis of Putnam Management’s revenues, expenses and profitability, allocated on a fund-by-fund basis, with respect to the funds’ management, distribution, and investor servicing contracts. For each fund, the analysis presented information about revenues, expenses and profitability for each of the agreements separately and for the agreements taken together on a combined basis. The Trustees concluded that, at current asset levels, the fee schedules in place represented reasonable compensation for the services being provided and represented an appropriate sharing between fund shareholders and Putnam Management of such economies of scale as may exist in the management of the Putnam funds at that time.
The information examined by the Trustees as part of their annual contract review for the Putnam funds included information regarding fees charged by Putnam Management and its affiliates to institutional clients such as defined benefit pension plans, college endowments, sub-advised third-party mutual funds, and the like. This information included comparisons of those fees with fees charged to the Putnam funds, as well as an assessment of the differences in the services provided to these different types of clients. The Trustees observed that the differences in fee rates between these clients and the Putnam funds are by no means uniform when examined by individual asset sectors, suggesting that differences in the pricing of investment management services to these types of clients may reflect, among other things, historical competitive forces operating in separate markets. The Trustees considered the fact that in many cases fee rates across
different asset classes are higher on average for mutual funds than for institutional clients, as well as the differences between the services that Putnam Management provides to the Putnam funds and those that it provides to its other clients. The Trustees did not rely on these comparisons to any significant extent in concluding that the management fees paid by your fund are reasonable.
Investment performance
The quality of the investment process provided by Putnam Management represented a major factor in the Trustees’ evaluation of the quality of services provided by Putnam Management under your fund’s management contract. The Trustees were assisted in their review of the Putnam funds’ investment process and performance by the work of the investment oversight committees of the Trustees, which meet on a regular basis with the funds’ portfolio teams and with the Chief Investment Officer and other senior members of Putnam Management’s Investment Division throughout the year. The Trustees concluded that Putnam Management generally provides a high-quality investment process — based on the experience and skills of the individuals assigned to the management of fund portfolios, the resources made available to them, and in general Putnam Management’s ability to attract and retain high-quality personnel — but also recognized that this does not guarantee favorable investment results for every fund in every time period.
The Trustees considered that 2015 was a year of mixed performance results for the Putnam funds, with generally strong results for the international equity, global sector and global asset allocation funds, but generally disappointing results for the U.S. and small-cap equity, Spectrum and fixed income funds. They noted that the longer-term performance of the Putnam funds generally continued to be strong, exemplified by the fact that the Putnam funds were ranked by the Barron’s/Lipper Fund Families survey as the 18th-best performing mutual fund complex out of 58 complexes for the five-year period ended December 31, 2015. They also noted, however, the disappointing investment performance of some funds for periods ended December 31, 2015 and considered information provided by Putnam Management regarding the factors contributing to the underperformance and actions being taken to improve the performance of these particular funds. The Trustees indicated their intention to continue to monitor performance trends to assess the effectiveness of these efforts and to evaluate whether additional actions to address areas of underperformance are warranted.
For purposes of evaluating investment performance, the Trustees generally focus on a competitive industry ranking of each fund’s total net return over a one-year, three-year and five-year period. For a number of Putnam funds with relatively unique investment mandates for which meaningful competitive performance rankings are not considered to be available, the Trustees evaluated performance based on their total gross and net returns and, in most cases, comparisons of those returns with the returns of selected investment benchmarks. In the case of your fund, the Trustees considered that its class A share cumulative total return performance at net asset value was in the following quartiles of its Lipper peer group (Lipper High Yield Funds) for the one-year, three-year and five-year periods ended December 31, 2015 (the first quartile representing the best-performing funds and the fourth quartile the worst-performing funds):
| |
| One-year period | 3rd |
|
| Three-year period | 3rd |
|
| Five-year period | 3rd |
|
Over the one-year, three-year and five-year periods ended December 31, 2015, there were 657, 532 and 432 funds, respectively, in your fund’s Lipper peer group. (When considering
performance information, shareholders should be mindful that past performance is not a guarantee of future results.)
The Trustees also considered Putnam Management’s continued efforts to support fund performance through initiatives including structuring compensation for portfolio managers and research analysts to enhance accountability for fund performance, emphasizing accountability in the portfolio management process, and affirming its commitment to a fundamental-driven approach to investing. The Trustees noted further that Putnam Management continued to strengthen its fundamental research capabilities by adding new investment personnel.
Brokerage and soft-dollar allocations; investor servicing
The Trustees considered various potential benefits that Putnam Management may receive in connection with the services it provides under the management contract with your fund. These include benefits related to brokerage allocation and the use of soft dollars, whereby a portion of the commissions paid by a fund for brokerage may be used to acquire research services that are expected to be useful to Putnam Management in managing the assets of the fund and of other clients. Subject to policies established by the Trustees, soft dollars generated by these means are used primarily to acquire brokerage and research services (including third-party research and market data) that enhance Putnam Management’s investment capabilities and supplement Putnam Management’s internal research efforts. However, the Trustees noted that a portion of available soft dollars continues to be used to pay fund expenses. The Trustees indicated their continued intent to monitor regulatory and industry developments in this area with the assistance of their Brokerage Committee and also indicated their continued intent to monitor the allocation of the Putnam funds’ brokerage in order to ensure that the principle of seeking best price and execution remains paramount in the portfolio trading process.
Putnam Management may also receive benefits from payments that the funds make to Putnam Management’s affiliates for investor or distribution services. In conjunction with the annual review of your fund’s management and sub-management contracts, the Trustees reviewed your fund’s investor servicing agreement with Putnam Investor Services, Inc. (“PSERV”) and its distributor’s contracts and distribution plans with Putnam Retail Management Limited Partnership (“PRM”), both of which are affiliates of Putnam Management. The Trustees concluded that the fees payable by the funds to PSERV and PRM, as applicable, for such services are reasonable in relation to the nature and quality of such services, the fees paid by competitive funds, and the costs incurred by PSERV and PRM, as applicable, in providing such services.
Financial statements
These sections of the report, as well as the accompanying Notes, preceded by the Report of Independent Registered Public Accounting Firm, constitute the fund’s financial statements.
The fund’s portfolio lists all the fund’s investments and their values as of the last day of the reporting period. Holdings are organized by asset type/and industry sector, country, or state to show areas of concentration and/diversification.
Statement of assets and liabilities shows how the fund’s net assets and share price are determined. All investment and non-investment assets are added together. Any unpaid expenses and other liabilities are subtracted from this total. The result is divided by the number of shares to determine the net asset value per share, which is calculated separately for each class of shares. (For funds with preferred shares, the amount subtracted from total assets includes the liquidation preference of preferred shares.)
Statement of operations shows the fund’s net investment gain or loss. This is done by first adding up all the fund’s earnings — from dividends and interest income — and subtracting its operating expenses to determine net investment income (or loss). Then, any net gain or loss the fund realized on the sales of its holdings — as well as any unrealized gains or losses over the period — is added to or subtracted from the net investment result to determine the fund’s net gain or loss for the fiscal year.
Statement of changes in net assets shows how the fund’s net assets were affected by the fund’s net investment gain or loss, by distributions to shareholders, and by changes in the number of the fund’s shares. It lists distributions and their sources (net investment income or realized capital gains) over the current reporting period and the most recent fiscal year-end. The distributions listed here may not match the sources listed in the Statement of operations because the distributions are determined on a tax basis and may be paid in a different period from the one in which they were/earned.
Financial highlights provide an overview of the fund’s investment results, per-share distributions, expense ratios, net investment income ratios, and portfolio turnover in one summary table, reflecting the five most recent reporting periods. In a semiannual report, the highlights table also includes the current reporting period.
Report of Independent Registered Public Accounting Firm
The Board of Trustees and Shareholders
Putnam High Yield Trust:
We have audited the accompanying statement of assets and liabilities of Putnam High Yield Trust (the fund), including the fund’s portfolio, as of August 31, 2016, and the related statement of operations for the year then ended, the statements of changes in net assets for each of the years in the two-year period then ended, and the financial highlights for each of the years in the five-year period then ended. These financial statements and financial highlights are the responsibility of the fund’s management. Our responsibility is to express an opinion on these financial statements and financial highlights based on our audits.
We conducted our audits in accordance with the standards of the Public Company Accounting Oversight Board (United States). Those standards require that we plan and perform the audit to obtain reasonable assurance about whether the financial statements and financial highlights are free of material misstatement. An audit includes examining, on a test basis, evidence supporting the amounts and disclosures in the financial statements. Our procedures included confirmation of securities owned as of August 31, 2016, by correspondence with the custodian and brokers or by other appropriate auditing procedures. An audit also includes assessing the accounting principles used and significant estimates made by management, as well as evaluating the overall financial statement presentation. We believe that our audits provide a reasonable basis for our opinion.
In our opinion, the financial statements and financial highlights referred to above present fairly, in all material respects, the financial position of Putnam High Yield Trust as of August 31, 2016, the results of its operations for the year then ended, the changes in its net assets for each of the years in the two-year period then ended, and the financial highlights for each of the years in the five-year period then ended, in conformity with U.S. generally accepted accounting principles.

Boston, Massachusetts
October 7, 2016
The fund’s portfolio 8/31/16
| | |
| CORPORATE BONDS AND NOTES (83.6%)* | Principal amount | Value |
|
| Advertising and marketing services (0.5%) | | |
| Lamar Media Corp. company guaranty sr. unsec. sub. notes | | |
| 5.875%, 2/1/22 | $1,815,000 | $1,905,750 |
|
| Lamar Media Corp. company guaranty sr. unsec. sub. notes | | |
| 5.375%, 1/15/24 | 989,000 | 1,053,285 |
|
| Outfront Media Capital, LLC/Outfront Media Capital Corp. | | |
| company guaranty sr. unsec. sub. notes 5.875%, 3/15/25 | 1,340,000 | 1,433,800 |
|
| Outfront Media Capital, LLC/Outfront Media Capital Corp. | | |
| company guaranty sr. unsec. sub. notes 5.625%, 2/15/24 | 1,670,000 | 1,778,550 |
|
| | 6,171,385 |
| Automotive (0.9%) | | |
| Fiat Chrysler Automobiles NV sr. unsec. unsub. notes 5.25%, | | |
| 4/15/23 (Italy) | 2,835,000 | 2,924,303 |
|
| General Motors Co. sr. unsec. notes 6.25%, 10/2/43 | 1,750,000 | 2,097,533 |
|
| General Motors Financial Co., Inc. company guaranty sr. unsec. | | |
| notes 3.20%, 7/6/21 | 1,585,000 | 1,610,881 |
|
| General Motors Financial Co., Inc. company guaranty sr. unsec. | | |
| unsub. notes 3.45%, 4/10/22 | 1,585,000 | 1,615,649 |
|
| Lear Corp. company guaranty sr. unsec. unsub. notes | | |
| 5.375%, 3/15/24 | 690,000 | 740,025 |
|
| Navistar International Corp. company guaranty sr. unsec. notes | | |
| 8.25%, 11/1/21 | 1,395,000 | 1,143,900 |
|
| | 10,132,291 |
| Broadcasting (2.2%) | | |
| Clear Channel Worldwide Holdings, Inc. company guaranty sr. | | |
| unsec. sub. notes 7.625%, 3/15/20 | 1,865,000 | 1,878,988 |
|
| Clear Channel Worldwide Holdings, Inc. company guaranty sr. | | |
| unsec. unsub. notes 6.50%, 11/15/22 | 3,395,000 | 3,556,263 |
|
| Entercom Radio, LLC company guaranty sr. unsec. notes | | |
| 10.50%, 12/1/19 | 1,205,000 | 1,260,731 |
|
| iHeartCommunications, Inc. company guaranty sr. notes | | |
| 9.00%, 12/15/19 | 2,740,000 | 2,215,975 |
|
| LIN Television Corp. company guaranty sr. unsec. unsub. notes | | |
| 5.875%, 11/15/22 | 748,000 | 791,010 |
|
| Nexstar Escrow Corp. 144A company guaranty sr. unsec. notes | | |
| 5.625%, 8/1/24 | 2,115,000 | 2,157,300 |
|
| Sinclair Television Group, Inc. 144A company guaranty sr. unsec. | | |
| sub. notes 5.625%, 8/1/24 | 4,900,000 | 5,103,840 |
|
| Sirius XM Radio, Inc. 144A company guaranty sr. unsec. sub. | | |
| notes 6.00%, 7/15/24 | 1,330,000 | 1,423,100 |
|
| Townsquare Media, Inc. 144A company guaranty sr. unsec. | | |
| notes 6.50%, 4/1/23 | 1,240,000 | 1,249,300 |
|
| Tribune Media Co. company guaranty sr. unsec. notes | | |
| 5.875%, 7/15/22 | 2,305,000 | 2,356,863 |
|
| Univision Communications, Inc. 144A company guaranty sr. sub. | | |
| notes 5.125%, 2/15/25 | 1,909,000 | 1,994,905 |
|
| Univision Communications, Inc. 144A company guaranty sr. | | |
| unsec. notes 8.50%, 5/15/21 | 935,000 | 972,400 |
|
| | | 24,960,675 |
| | |
| CORPORATE BONDS AND NOTES (83.6%)* cont. | Principal amount | Value |
|
| Building materials (0.9%) | | |
| Masonite International Corp. 144A company guaranty sr. unsec. | | |
| notes 5.625%, 3/15/23 | $2,458,000 | $2,605,480 |
|
| Nortek, Inc. company guaranty sr. unsec. sub. notes | | |
| 8.50%, 4/15/21 | 3,518,000 | 3,685,105 |
|
| Standard Industries, Inc. 144A sr. unsec. notes 6.00%, 10/15/25 | 1,460,000 | 1,600,525 |
|
| Standard Industries, Inc. 144A sr. unsec. notes | | |
| 5.375%, 11/15/24 | 2,030,000 | 2,159,413 |
|
| Standard Industries, Inc./NJ 144A sr. unsec. notes | | |
| 5.125%, 2/15/21 | 280,000 | 295,750 |
|
| | 10,346,273 |
| Cable television (5.4%) | | |
| Altice SA 144A company guaranty sr. unsec. notes 7.75%, | | |
| 5/15/22 (Luxembourg) | 3,995,000 | 4,239,694 |
|
| Altice SA 144A company guaranty sr. unsec. notes 7.625%, | | |
| 2/15/25 (Luxembourg) | 1,635,000 | 1,684,050 |
|
| Cablevision Systems Corp. sr. unsec. unsub. notes | | |
| 8.625%, 9/15/17 | 737,000 | 783,247 |
|
| Cablevision Systems Corp. sr. unsec. unsub. notes | | |
| 7.75%, 4/15/18 | 903,000 | 963,953 |
|
| CCO Holdings, LLC/CCO Holdings Capital Corp. company | | |
| guaranty sr. unsec. notes 6.625%, 1/31/22 | 1,585,000 | 1,668,213 |
|
| CCO Holdings, LLC/CCO Holdings Capital Corp. company | | |
| guaranty sr. unsec. notes 5.25%, 9/30/22 | 3,328,000 | 3,494,400 |
|
| CCO Holdings, LLC/CCO Holdings Capital Corp. 144A company | | |
| guaranty sr. unsec. bonds 5.50%, 5/1/26 | 1,345,000 | 1,424,019 |
|
| CCO Holdings, LLC/CCO Holdings Capital Corp. 144A company | | |
| guaranty sr. unsec. notes 5.875%, 4/1/24 | 3,843,000 | 4,131,225 |
|
| CCO Holdings, LLC/CCO Holdings Capital Corp. 144A sr. unsec. | | |
| notes 5.75%, 2/15/26 | 634,000 | 678,380 |
|
| CCO Holdings, LLC/CCO Holdings Capital Corp. 144A sr. unsec. | | |
| unsub. notes 5.125%, 5/1/23 | 3,200,000 | 3,367,008 |
|
| Cequel Communications Holdings I, LLC/Cequel Capital Corp. | | |
| 144A sr. unsec. unsub. notes 5.125%, 12/15/21 | 3,980,000 | 4,014,825 |
|
| Cequel Communications Holdings I, LLC/Cequel Capital Corp. | | |
| 144A sr. unsec. unsub. notes 5.125%, 12/15/21 | 2,080,000 | 2,103,400 |
|
| CSC Holdings, LLC sr. unsec. unsub. bonds 5.25%, 6/1/24 | 4,905,000 | 4,773,154 |
|
| CSC Holdings, LLC sr. unsec. unsub. notes 6.75%, 11/15/21 | 750,000 | 803,438 |
|
| DISH DBS Corp. company guaranty sr. unsec. unsub. notes | | |
| 5.875%, 11/15/24 | 1,750,000 | 1,725,938 |
|
| Neptune Finco Corp. 144A sr. unsec. unsub. notes | | |
| 10.875%, 10/15/25 | 1,670,000 | 1,958,075 |
|
| Neptune Finco Corp. 144A sr. unsec. unsub. notes | | |
| 10.125%, 1/15/23 | 2,175,000 | 2,483,578 |
|
| SFR Group SA 144A company guaranty sr. notes 7.375%, | | |
| 5/1/26 (France) | 2,275,000 | 2,348,938 |
|
| SFR Group SA 144A company guaranty sr. notes 6.00%, | | |
| 5/15/22 (France) | 4,570,000 | 4,638,550 |
|
| Numericable-SFR SA 144A sr. bonds 6.25%, 5/15/24 (France) | 3,440,000 | 3,483,000 |
|
| Quebecor Media, Inc. sr. unsec. unsub. notes 5.75%, | | |
| 1/15/23 (Canada) | 460,000 | 485,875 |
|
| | | |
| CORPORATE BONDS AND NOTES (83.6%)* cont. | Principal amount | Value |
|
| Cable television cont. | | | |
| SFR Group SA 144A company guaranty sr. notes 5.625%, | | | |
| 5/15/24 (France) | EUR | 410,000 | $484,482 |
|
| Unitymedia GmbH 144A company guaranty sr. notes 6.125%, | | | |
| 1/15/25 (Germany) | | $1,920,000 | 2,059,200 |
|
| Videotron, Ltd. company guaranty sr. unsec. unsub. notes | | | |
| 5.00%, 7/15/22 (Canada) | | 2,930,000 | 3,076,500 |
|
| Virgin Media Finance PLC 144A company guaranty sr. unsec. | | | |
| notes 6.375%, 4/15/23 (United Kingdom) | | 1,265,000 | 1,344,063 |
|
| Virgin Media Secured Finance PLC 144A sr. notes 5.375%, | | | |
| 4/15/21 (United Kingdom) | | 958,500 | 998,038 |
|
| WideOpenWest Finance, LLC/WideOpenWest Capital Corp. | | | |
| company guaranty sr. unsec. sub. notes 10.25%, 7/15/19 | | 2,509,000 | 2,640,723 |
|
| | 61,855,966 |
| Capital goods (7.2%) | | | |
| Adient Global Holdings, Ltd. 144A company guaranty sr. unsec. | | | |
| bonds 4.875%, 8/15/26 (Jersey) | | 2,000,000 | 2,027,500 |
|
| Advanced Disposal Services, Inc. company guaranty sr. unsec. | | | |
| notes 8.25%, 10/1/20 | | 6,428,000 | 6,725,295 |
|
| Amstead Industries, Inc. 144A company guaranty sr. unsec. sub. | | | |
| notes 5.375%, 9/15/24 | | 3,035,000 | 3,050,175 |
|
| Amstead Industries, Inc. 144A company guaranty sr. unsec. sub. | | | |
| notes 5.00%, 3/15/22 | | 362,000 | 367,430 |
|
| Ardagh Packaging Finance PLC/Ardagh Holdings USA, | | | |
| Inc. 144A company guaranty sr. unsec. notes 7.25%, | | | |
| 5/15/24 (Ireland) | | 3,950,000 | 4,206,750 |
|
| ATS Automation Tooling Systems, Inc. 144A sr. unsec. notes | | | |
| 6.50%, 6/15/23 (Canada) | | 2,010,000 | 2,058,994 |
|
| Belden, Inc. 144A company guaranty sr. unsec. sub. notes | | | |
| 5.50%, 9/1/22 | | 605,000 | 630,713 |
|
| Belden, Inc. 144A company guaranty sr. unsec. sub. notes | | | |
| 5.25%, 7/15/24 | | 3,624,000 | 3,678,360 |
|
| Berry Plastics Corp. company guaranty notes 6.00%, 10/15/22 | | 865,000 | 916,900 |
|
| Bombardier, Inc. 144A sr. unsec. unsub. notes 4.75%, | | | |
| 4/15/19 (Canada) | | 2,415,000 | 2,421,038 |
|
| Briggs & Stratton Corp. company guaranty sr. unsec. notes | | | |
| 6.875%, 12/15/20 | | 3,493,000 | 3,842,300 |
|
| Crown Cork & Seal Co., Inc. company guaranty sr. unsec. bonds | | | |
| 7.375%, 12/15/26 | | 935,000 | 1,051,875 |
|
| DH Services Luxembourg Sarl 144A company guaranty sr. | | | |
| unsec. sub. notes 7.75%, 12/15/20 (Luxembourg) | | 1,277,000 | 1,332,869 |
|
| Gates Global, LLC/Gates Global Co. 144A company guaranty sr. | | | |
| unsec. notes 6.00%, 7/15/22 | | 5,510,000 | 5,268,938 |
|
| KLX, Inc. 144A company guaranty sr. unsec. notes | | | |
| 5.875%, 12/1/22 | | 3,781,000 | 3,968,160 |
|
| Legrand France SA sr. unsec. unsub. notes 8.50%, | | | |
| 2/15/25 (France) | | 3,362,000 | 4,629,444 |
|
| Manitowoc Foodservice, Inc. 144A sr. unsec. notes | | | |
| 9.50%, 2/15/24 | | 5,291,000 | 5,978,830 |
|
| MasTec, Inc. company guaranty sr. unsec. unsub. notes | | | |
| 4.875%, 3/15/23 | | 3,890,000 | 3,890,000 |
|
| Moog, Inc. 144A company guaranty sr. unsec. notes | | | |
| 5.25%, 12/1/22 | | 2,856,000 | 2,941,680 |
|
| | |
| CORPORATE BONDS AND NOTES (83.6%)* cont. | Principal amount | Value |
|
| Capital goods cont. | | |
| Oshkosh Corp. company guaranty sr. unsec. sub. notes | | |
| 5.375%, 3/1/25 | $1,240,000 | $1,302,000 |
|
| Oshkosh Corp. company guaranty sr. unsec. sub. notes | | |
| 5.375%, 3/1/22 | 2,630,000 | 2,754,925 |
|
| Reynolds Group Issuer, Inc./Reynolds Group Issuer, LLC/ | | |
| Reynolds Group Issuer Lu company guaranty sr. unsec. unsub. | | |
| notes 9.875%, 8/15/19 | 162,000 | 166,658 |
|
| Reynolds Group Issuer, Inc./Reynolds Group Issuer, LLC/ | | |
| Reynolds Group Issuer Lu company guaranty sr. unsec. unsub. | | |
| notes 8.25%, 2/15/21 (New Zealand) | 395,000 | 410,800 |
|
| Reynolds Group Issuer, Inc./Reynolds Group Issuer, LLC/ | | |
| Reynolds Group Issuer Lu 144A company guaranty sr. unsec. | | |
| unsub. notes 7.00%, 7/15/24 | 1,943,000 | 2,081,439 |
|
| Tenneco, Inc. company guaranty sr. unsec. unsub. notes | | |
| 5.375%, 12/15/24 | 1,538,000 | 1,637,970 |
|
| Tenneco, Inc. company guaranty sr. unsec. unsub. notes | | |
| 5.00%, 7/15/26 | 590,000 | 607,700 |
|
| Terex Corp. company guaranty sr. unsec. notes 6.00%, 5/15/21 | 982,000 | 1,012,442 |
|
| TI Group Automotive Systems, LLC 144A sr. unsec. notes | | |
| 8.75%, 7/15/23 | 3,930,000 | 4,097,025 |
|
| TransDigm, Inc. company guaranty sr. unsec. sub. notes | | |
| 7.50%, 7/15/21 | 500,000 | 530,313 |
|
| TransDigm, Inc. company guaranty sr. unsec. unsub. notes | | |
| 6.50%, 7/15/24 | 2,156,000 | 2,236,850 |
|
| TransDigm, Inc. 144A company guaranty sr. unsec. sub. bonds | | |
| 6.375%, 6/15/26 | 1,460,000 | 1,489,200 |
|
| ZF North America Capital, Inc. 144A company guaranty sr. | | |
| unsec. unsub. notes 4.75%, 4/29/25 | 3,175,000 | 3,369,469 |
|
| ZF North America Capital, Inc. 144A company guaranty sr. | | |
| unsec. unsub. notes 4.50%, 4/29/22 | 1,130,000 | 1,194,975 |
|
| | 81,879,017 |
| Chemicals (3.2%) | | |
| A Schulman, Inc. 144A company guaranty sr. unsec. unsub. | | |
| notes 6.875%, 6/1/23 | 2,131,000 | 2,141,655 |
|
| Axalta Coating Systems, LLC 144A company guaranty sr. unsec. | | |
| unsub. notes 4.875%, 8/15/24 | 1,770,000 | 1,845,225 |
|
| Blue Cube Spinco, Inc. 144A company guaranty sr. unsec. notes | | |
| 9.75%, 10/15/23 | 2,415,000 | 2,861,775 |
|
| Celanese US Holdings, LLC company guaranty sr. unsec. notes | | |
| 5.875%, 6/15/21 (Germany) | 2,309,000 | 2,633,692 |
|
| Chemours Co. (The) company guaranty sr. unsec. unsub. notes | | |
| 7.00%, 5/15/25 | 1,420,000 | 1,358,763 |
|
| Chemours Co. (The) company guaranty sr. unsec. unsub. notes | | |
| 6.625%, 5/15/23 | 1,705,000 | 1,636,800 |
|
| Compass Minerals International, Inc. 144A company guaranty sr. | | |
| unsec. notes 4.875%, 7/15/24 | 2,094,000 | 2,005,005 |
|
| GCP Applied Technologies, Inc. 144A company guaranty sr. | | |
| unsec. notes 9.50%, 2/1/23 | 4,498,000 | 5,150,210 |
|
| Huntsman International, LLC company guaranty sr. unsec. notes | | |
| 5.125%, 11/15/22 | 1,480,000 | 1,528,100 |
|
| Huntsman International, LLC company guaranty sr. unsec. | | |
| unsub. notes 4.875%, 11/15/20 | 1,775,000 | 1,841,563 |
|
| | |
| CORPORATE BONDS AND NOTES (83.6%)* cont. | Principal amount | Value |
|
| Chemicals cont. | | |
| Kraton Polymers LLC/Kraton Polymers Capital Corp. 144A | | |
| company guaranty sr. unsec. notes 10.50%, 4/15/23 | $2,155,000 | $2,402,825 |
|
| Perstorp Holding AB 144A company guaranty sr. notes 8.75%, | | |
| 5/15/17 (Sweden) | 2,440,000 | 2,433,900 |
|
| PQ Corp. 144A company guaranty sr. notes 6.75%, 11/15/22 | 650,000 | 689,813 |
|
| Tronox Finance, LLC company guaranty sr. unsec. notes | | |
| 6.375%, 8/15/20 | 430,000 | 389,150 |
|
| Tronox Finance, LLC 144A company guaranty sr. unsec. notes | | |
| 7.50%, 3/15/22 | 1,270,000 | 1,139,825 |
|
| Univar USA, Inc. 144A company guaranty sr. unsec. notes | | |
| 6.75%, 7/15/23 | 1,965,000 | 2,033,775 |
|
| WR Grace & Co.- Conn. 144A company guaranty sr. unsec. notes | | |
| 5.625%, 10/1/24 | 3,842,000 | 4,149,360 |
|
| | 36,241,436 |
| Commercial and consumer services (0.3%) | | |
| Mustang Merger Corp. 144A sr. unsec. notes 8.50%, 8/15/21 | 530,000 | 553,850 |
|
| Sabre GLBL, Inc. 144A company guaranty sr. notes | | |
| 5.375%, 4/15/23 | 2,675,000 | 2,765,281 |
|
| | 3,319,131 |
| Construction (2.4%) | | |
| Beacon Roofing Supply, Inc. company guaranty sr. unsec. | | |
| unsub. notes 6.375%, 10/1/23 | 3,180,000 | 3,418,500 |
|
| Builders FirstSource, Inc. 144A company guaranty sr. unsec. | | |
| notes 10.75%, 8/15/23 | 2,870,000 | 3,257,450 |
|
| Builders FirstSource, Inc. 144A company guaranty sr. unsub. | | |
| notes 5.625%, 9/1/24 | 1,740,000 | 1,770,450 |
|
| Cemex Finance, LLC 144A company guaranty sr. notes 9.375%, | | |
| 10/12/22 (Mexico) | 1,595,000 | 1,766,463 |
|
| Cemex Finance, LLC 144A company guaranty sr. notes 6.00%, | | |
| 4/1/24 (Mexico) | 1,205,000 | 1,271,275 |
|
| Cemex SAB de CV 144A company guaranty sr. notes 6.50%, | | |
| 12/10/19 (Mexico) | 675,000 | 722,250 |
|
| Cemex SAB de CV 144A company guaranty sr. notes 6.125%, | | |
| 5/5/25 (Mexico) | 550,000 | 579,260 |
|
| Cemex SAB de CV 144A company guaranty sr. sub. notes 5.70%, | | |
| 1/11/25 (Mexico) | 2,020,000 | 2,078,075 |
|
| CPG Merger Sub, LLC 144A company guaranty sr. unsec. notes | | |
| 8.00%, 10/1/21 | 935,000 | 953,700 |
|
| HD Supply, Inc. company guaranty sr. unsec. sub. notes | | |
| 7.50%, 7/15/20 | 1,806,000 | 1,880,498 |
|
| HD Supply, Inc. 144A company guaranty sr. unsec. notes | | |
| 5.75%, 4/15/24 | 1,105,000 | 1,176,825 |
|
| U.S. Concrete, Inc. company guaranty sr. unsec. unsub. notes | | |
| 6.375%, 6/1/24 | 1,735,000 | 1,808,738 |
|
| USG Corp. 144A company guaranty sr. unsec. notes | | |
| 5.875%, 11/1/21 | 485,000 | 508,644 |
|
| USG Corp. 144A company guaranty sr. unsec. notes | | |
| 5.50%, 3/1/25 | 1,975,000 | 2,142,875 |
|
| Weekley Homes, LLC/Weekley Finance Corp. sr. unsec. notes | | |
| 6.00%, 2/1/23 | 3,911,000 | 3,598,120 |
|
| | | 26,933,123 |
| | |
| CORPORATE BONDS AND NOTES (83.6%)* cont. | Principal amount | Value |
|
| Consumer (0.3%) | | |
| Spectrum Brands, Inc. company guaranty sr. unsec. notes | | |
| 5.75%, 7/15/25 | $1,390,000 | $1,506,413 |
|
| Spectrum Brands, Inc. company guaranty sr. unsec. sub. notes | | |
| 6.625%, 11/15/22 | 140,000 | 149,800 |
|
| Spectrum Brands, Inc. company guaranty sr. unsec. sub. notes | | |
| 6.375%, 11/15/20 | 175,000 | 181,781 |
|
| Spectrum Brands, Inc. company guaranty sr. unsec. unsub. | | |
| notes 6.125%, 12/15/24 | 1,350,000 | 1,456,313 |
|
| | 3,294,307 |
| Consumer staples (4.1%) | | |
| 1011778 BC ULC/New Red Finance, Inc. 144A company | | |
| guaranty notes 6.00%, 4/1/22 (Canada) | 3,850,000 | 4,028,063 |
|
| 1011778 BC ULC/New Red Finance, Inc. 144A company | | |
| guaranty sr. notes 4.625%, 1/15/22 (Canada) | 990,000 | 1,023,413 |
|
| Ashtead Capital, Inc. 144A company guaranty notes | | |
| 6.50%, 7/15/22 | 2,345,000 | 2,473,975 |
|
| Ashtead Capital, Inc. 144A company guaranty notes | | |
| 5.625%, 10/1/24 | 1,630,000 | 1,713,538 |
|
| BlueLine Rental Finance Corp. 144A notes 7.00%, 2/1/19 | 1,635,000 | 1,414,275 |
|
| CEC Entertainment, Inc. company guaranty sr. unsec. sub. notes | | |
| 8.00%, 2/15/22 | 3,305,000 | 3,305,000 |
|
| Ceridian HCM Holding, Inc. 144A sr. unsec. notes | | |
| 11.00%, 3/15/21 | 5,374,000 | 5,562,090 |
|
| Constellation Brands, Inc. company guaranty sr. unsec. unsub. | | |
| notes 6.00%, 5/1/22 | 2,576,000 | 2,988,160 |
|
| Dean Foods Co. 144A company guaranty sr. unsec. notes | | |
| 6.50%, 3/15/23 | 3,060,000 | 3,243,600 |
|
| ESAL GmbH 144A company guaranty sr. unsec. notes 6.25%, | | |
| 2/5/23 (Brazil) | 1,845,000 | 1,872,675 |
|
| JBS USA, LLC/JBS USA Finance, Inc. 144A company guaranty | | |
| sr. unsec. notes 7.25%, 6/1/21 (Brazil) | 685,000 | 708,975 |
|
| JBS USA, LLC/JBS USA Finance, Inc. 144A company guaranty | | |
| sr. unsec. notes 7.25%, 6/1/21 (Brazil) | 589,000 | 609,615 |
|
| JBS USA, LLC/JBS USA Finance, Inc. 144A sr. unsec. notes | | |
| 8.25%, 2/1/20 (Brazil) | 120,000 | 124,800 |
|
| KFC Holding Co./Pizza Hut Holdings, LLC/Taco Bell of America, | | |
| LLC 144A company guaranty sr. unsec. notes 5.25%, 6/1/26 | 1,845,000 | 1,960,313 |
|
| KFC Holding Co./Pizza Hut Holdings, LLC/Taco Bell of America, | | |
| LLC 144A company guaranty sr. unsec. notes 5.00%, 6/1/24 | 1,845,000 | 1,934,888 |
|
| Landry’s Holdings II, Inc. 144A sr. unsec. notes 10.25%, 1/1/18 | 460,000 | 468,050 |
|
| Pilgrim’s Pride Corp. 144A company guaranty sr. unsec. notes | | |
| 5.75%, 3/15/25 | 1,160,000 | 1,197,700 |
|
| Prestige Brands, Inc. 144A company guaranty sr. unsec. notes | | |
| 5.375%, 12/15/21 | 2,015,000 | 2,088,044 |
|
| Revlon Consumer Products Corp. company guaranty sr. unsec. | | |
| sub. notes 5.75%, 2/15/21 | 4,440,000 | 4,539,900 |
|
| Revlon Escrow Corp. 144A sr. unsec. notes 6.25%, 8/1/24 | 1,024,000 | 1,064,960 |
|
| Rite Aid Corp. 144A company guaranty sr. unsec. unsub. notes | | |
| 6.125%, 4/1/23 | 3,081,000 | 3,326,186 |
|
| | |
| CORPORATE BONDS AND NOTES (83.6%)* cont. | Principal amount | Value |
|
| Consumer staples cont. | | |
| Vander Intermediate Holding II Corp. 144A sr. unsec. notes | | |
| 9.75%, 2/1/19 ‡‡ | $570,437 | $305,184 |
|
| WhiteWave Foods Co. (The) company guaranty sr. unsec. notes | | |
| 5.375%, 10/1/22 | 1,150,000 | 1,296,625 |
|
| | 47,250,029 |
| Energy (9.6%) | | |
| Anadarko Petroleum Corp. sr. unsec. unsub. notes | | |
| 5.55%, 3/15/26 | 1,200,000 | 1,327,273 |
|
| Antero Resources Corp. company guaranty sr. unsec. notes | | |
| 5.625%, 6/1/23 | 1,145,000 | 1,147,863 |
|
| Antero Resources Corp. company guaranty sr. unsec. sub. notes | | |
| 5.125%, 12/1/22 | 1,385,000 | 1,367,688 |
|
| Antero Resources Finance Corp. company guaranty sr. unsec. | | |
| sub. notes 5.375%, 11/1/21 | 1,365,000 | 1,366,706 |
|
| Archrock Partners LP/Archrock Partners Finance Corp. | | |
| company guaranty sr. unsec. notes 6.00%, 10/1/22 | 1,988,000 | 1,838,900 |
|
| Archrock Partners LP/Archrock Partners Finance Corp. | | |
| company guaranty sr. unsec. notes 6.00%, 4/1/21 | 415,000 | 389,063 |
|
| Baytex Energy Corp. 144A company guaranty sr. unsec. sub. | | |
| notes 5.625%, 6/1/24 (Canada) | 1,707,000 | 1,382,670 |
|
| Baytex Energy Corp. 144A company guaranty sr. unsec. sub. | | |
| notes 5.125%, 6/1/21 (Canada) | 255,000 | 212,925 |
|
| California Resources Corp. 144A company guaranty notes | | |
| 8.00%, 12/15/22 | 4,125,000 | 2,784,375 |
|
| Cenovus Energy, Inc. sr. unsec. bonds 6.75%, | | |
| 11/15/39 (Canada) | 3,230,000 | 3,448,774 |
|
| Cenovus Energy, Inc. sr. unsec. bonds 4.45%, 9/15/42 (Canada) | 995,000 | 809,967 |
|
| CHC Helicopter SA company guaranty sr. notes 9.25%, | | |
| 10/15/20 (Canada) (In default) † | 1,390,500 | 681,345 |
|
| Chesapeake Energy Corp. 144A company guaranty notes | | |
| 8.00%, 12/15/22 | 3,768,000 | 3,589,020 |
|
| Concho Resources, Inc. company guaranty sr. unsec. notes | | |
| 5.50%, 4/1/23 | 3,545,000 | 3,660,213 |
|
| Continental Resources, Inc. company guaranty sr. unsec. notes | | |
| 3.80%, 6/1/24 | 605,000 | 546,013 |
|
| Continental Resources, Inc. company guaranty sr. unsec. sub. | | |
| notes 5.00%, 9/15/22 | 1,765,000 | 1,707,638 |
|
| Continental Resources, Inc. company guaranty sr. unsec. unsub. | | |
| notes 4.50%, 4/15/23 | 1,580,000 | 1,489,150 |
|
| Denbury Resources, Inc. company guaranty sr. unsec. sub. notes | | |
| 6.375%, 8/15/21 | 1,653,000 | 1,210,823 |
|
| Denbury Resources, Inc. 144A company guaranty notes | | |
| 9.00%, 5/15/21 | 2,785,000 | 2,861,588 |
|
| Devon Financing Company, LLC company guaranty sr. unsec. | | |
| unsub. bonds 7.875%, 9/30/31 | 2,575,000 | 3,159,739 |
|
| EP Energy, LLC/Everest Acquisition Finance, Inc. company | | |
| guaranty sr. unsec. notes 6.375%, 6/15/23 | 290,000 | 158,775 |
|
| EP Energy, LLC/Everest Acquisition Finance, Inc. company | | |
| guaranty sr. unsec. sub. notes 9.375%, 5/1/20 | 5,415,000 | 3,519,750 |
|
| Halcon Resources Corp. company guaranty sr. unsec. notes | | |
| 9.75%, 7/15/20 (In default) † | 45,000 | 11,138 |
|
| | |
| CORPORATE BONDS AND NOTES (83.6%)* cont. | Principal amount | Value |
|
| Energy cont. | | |
| Halcon Resources Corp. company guaranty sr. unsec. unsub. | | |
| notes 8.875%, 5/15/21 (In default) † | $6,110,000 | $1,451,125 |
|
| Halcon Resources Corp. 144A company guaranty notes | | |
| 8.625%, 2/1/20 | 1,240,000 | 1,178,000 |
|
| Hess Corp. sr. unsec. unsub. notes 7.30%, 8/15/31 | 1,310,000 | 1,520,905 |
|
| Holly Energy Partners LP/Holly Energy Finance Corp. 144A | | |
| company guaranty sr. unsec. notes 6.00%, 8/1/24 | 2,235,000 | 2,296,463 |
|
| Key Energy Services, Inc. company guaranty sr. unsec. unsub. | | |
| notes 6.75%, 3/1/21 (In default) † | 473,000 | 111,155 |
|
| Laredo Petroleum, Inc. company guaranty sr. unsec. notes | | |
| 7.375%, 5/1/22 | 3,965,000 | 4,004,650 |
|
| Linn Energy, LLC/Linn Energy Finance Corp. 144A company | | |
| guaranty notes 12.00%, 12/15/20 (In default) † | 5,923,000 | 2,546,890 |
|
| Lone Pine Resources Canada, Ltd. escrow company guaranty sr. | | |
| unsec. notes 10.375%, 2/15/17 (Canada) F | 699,000 | 38 |
|
| Marathon Oil Corp. sr. unsec. unsub. notes 3.85%, 6/1/25 | 1,015,000 | 949,233 |
|
| MEG Energy Corp. 144A company guaranty sr. unsec. notes | | |
| 7.00%, 3/31/24 (Canada) | 1,097,000 | 883,085 |
|
| MEG Energy Corp. 144A company guaranty sr. unsec. notes | | |
| 6.50%, 3/15/21 (Canada) | 755,000 | 619,100 |
|
| Murphy Oil Corp. sr. unsec. unsub. notes 6.875%, 8/15/24 | 1,692,000 | 1,769,407 |
|
| Newfield Exploration Co. sr. unsec. unsub. notes 5.75%, 1/30/22 | 3,240,000 | 3,361,500 |
|
| Newfield Exploration Co. sr. unsec. unsub. notes 5.625%, 7/1/24 | 1,130,000 | 1,166,725 |
|
| Newfield Exploration Co. sr. unsec. unsub. notes 5.375%, 1/1/26 | 2,140,000 | 2,150,700 |
|
| Oasis Petroleum, Inc. company guaranty sr. unsec. notes | | |
| 6.50%, 11/1/21 | 906,000 | 839,183 |
|
| Oasis Petroleum, Inc. company guaranty sr. unsec. sub. notes | | |
| 6.875%, 1/15/23 | 1,130,000 | 1,042,425 |
|
| Oasis Petroleum, Inc. company guaranty sr. unsec. unsub. notes | | |
| 6.875%, 3/15/22 | 3,445,000 | 3,203,850 |
|
| Range Resources Corp. company guaranty sr. unsec. sub. notes | | |
| 5.75%, 6/1/21 | 2,685,000 | 2,725,275 |
|
| Rose Rock Midstream LP/Rose Rock Finance Corp. company | | |
| guaranty sr. unsec. sub. notes 5.625%, 11/15/23 | 1,120,000 | 1,019,200 |
|
| Rose Rock Midstream LP/Rose Rock Finance Corp. company | | |
| guaranty sr. unsec. sub. notes 5.625%, 7/15/22 | 600,000 | 552,000 |
|
| Sabine Pass Liquefaction, LLC sr. notes 6.25%, 3/15/22 | 1,385,000 | 1,481,950 |
|
| Sabine Pass Liquefaction, LLC sr. notes 5.75%, 5/15/24 | 1,820,000 | 1,933,750 |
|
| Sabine Pass Liquefaction, LLC sr. notes 5.625%, 4/15/23 | 1,850,000 | 1,947,125 |
|
| Sabine Pass Liquefaction, LLC 144A sr. notes 5.875%, 6/30/26 | 2,430,000 | 2,600,100 |
|
| Samson Investment Co. company guaranty sr. unsec. notes | | |
| 9.75%, 2/15/20 (In default) † | 4,125,000 | 165,000 |
|
| SandRidge Energy, Inc. 144A company guaranty notes 8.75%, | | |
| 6/1/20 (In default) † | 2,760,000 | 1,083,300 |
|
| Seven Generations Energy, Ltd. 144A sr. unsec. bonds 6.75%, | | |
| 5/1/23 (Canada) | 2,300,000 | 2,363,250 |
|
| Seven Generations Energy, Ltd. 144A sr. unsec. sub. notes | | |
| 8.25%, 5/15/20 (Canada) | 1,470,000 | 1,563,713 |
|
| Seventy Seven Energy, Inc. sr. unsec. notes 6.50%, 7/15/22 F | 1,280,000 | 128 |
|
| | | |
| CORPORATE BONDS AND NOTES (83.6%)* cont. | Principal amount | Value |
|
| Energy cont. | | | |
| Seventy Seven Operating, LLC company guaranty sr. unsec. | | | |
| unsub. notes 6.625%, 11/15/19 F | | $3,145,000 | $315 |
|
| SM Energy Co. sr. unsec. notes 6.50%, 11/15/21 | | 1,780,000 | 1,762,200 |
|
| SM Energy Co. sr. unsec. sub. notes 5.00%, 1/15/24 | | 2,593,000 | 2,369,354 |
|
| SM Energy Co. sr. unsec. unsub. notes 6.50%, 1/1/23 | | 1,213,000 | 1,176,610 |
|
| SM Energy Co. sr. unsec. unsub. notes 6.125%, 11/15/22 | | 1,160,000 | 1,128,100 |
|
| Tervita Corp. 144A company guaranty sr. notes 9.00%, | | | |
| 11/15/18 (Canada) | CAD | 1,400,000 | 1,046,210 |
|
| Tervita Corp. 144A sr. unsec. notes 10.875%, 2/15/18 (Canada) | | | |
| (In default) † | | $665,000 | 179,550 |
|
| Triangle USA Petroleum Corp. 144A company guaranty sr. | | | |
| unsec. notes 6.75%, 7/15/22 (In default) † | | 1,190,000 | 285,600 |
|
| Unit Corp. company guaranty sr. unsec. sub. notes | | | |
| 6.625%, 5/15/21 | | 652,000 | 541,160 |
|
| Western Gas Partners LP sr. unsec. unsub. notes 4.65%, 7/1/26 | | 700,000 | 724,080 |
|
| Whiting Petroleum Corp. company guaranty sr. unsec. unsub. | | | |
| notes 5.75%, 3/15/21 | | 623,000 | 557,585 |
|
| Whiting Petroleum Corp. company guaranty sr. unsec. unsub. | | | |
| notes 5.00%, 3/15/19 | | 1,845,000 | 1,706,625 |
|
| Williams Cos., Inc. (The) sr. unsec. unsub. notes 7.875%, 9/1/21 | | 639,000 | 744,435 |
|
| Williams Cos., Inc. (The) sr. unsec. unsub. notes 7.75%, 6/15/31 | | 438,000 | 505,890 |
|
| Williams Partners LP/ACMP Finance Corp. company guaranty sr. | | | |
| unsec. unsub. notes 6.125%, 7/15/22 | | 1,986,000 | 2,064,934 |
|
| Williams Partners LP/ACMP Finance Corp. sr. unsec. sub. notes | | | |
| 4.875%, 3/15/24 | | 2,175,000 | 2,227,333 |
|
| Williams Partners LP/ACMP Finance Corp. sr. unsec. unsub. | | | |
| notes 4.875%, 5/15/23 | | 1,350,000 | 1,363,500 |
|
| WPX Energy, Inc. sr. unsec. notes 7.50%, 8/1/20 | | 1,430,000 | 1,468,431 |
|
| WPX Energy, Inc. sr. unsec. unsub. notes 6.00%, 1/15/22 | | 5,101,000 | 4,960,723 |
|
| | 110,013,256 |
| Entertainment (1.6%) | | | |
| AMC Entertainment, Inc. company guaranty sr. unsec. sub. | | | |
| notes 5.875%, 2/15/22 | | 1,760,000 | 1,812,800 |
|
| AMC Entertainment, Inc. 144A company guaranty sr. unsec. | | | |
| sub. notes 5.75%, 6/15/25 | | 1,920,000 | 1,968,154 |
|
| Cinemark USA, Inc. company guaranty sr. unsec. notes | | | |
| 5.125%, 12/15/22 | | 1,846,000 | 1,910,610 |
|
| Cinemark USA, Inc. company guaranty sr. unsec. sub. notes | | | |
| 4.875%, 6/1/23 | | 1,179,000 | 1,208,475 |
|
| GLP Capital LP/GLP Financing II, Inc. company guaranty sr. | | | |
| unsec. sub. notes 4.875%, 11/1/20 | | 2,805,000 | 3,001,350 |
|
| GLP Capital LP/GLP Financing II, Inc. company guaranty sr. | | | |
| unsec. unsub. notes 5.375%, 4/15/26 | | 1,010,000 | 1,103,425 |
|
| Regal Entertainment Group sr. unsec. sub. notes 5.75%, 2/1/25 | | 770,000 | 781,550 |
|
| Regal Entertainment Group sr. unsec. sub. notes 5.75%, 6/15/23 | | 2,365,000 | 2,427,081 |
|
| Six Flags Entertainment Corp. 144A company guaranty sr. | | | |
| unsec. unsub. notes 5.25%, 1/15/21 | | 3,704,000 | 3,833,640 |
|
| | | | 18,047,085 |
| | | |
| CORPORATE BONDS AND NOTES (83.6%)* cont. | Principal amount | Value |
|
| Financials (7.4%) | | | |
| Alliance Data Systems Corp. 144A company guaranty sr. unsec. | | | |
| notes 5.375%, 8/1/22 | | $2,615,000 | $2,575,775 |
|
| Ally Financial, Inc. company guaranty sr. unsec. notes | | | |
| 8.00%, 11/1/31 | | 5,627,000 | 7,047,761 |
|
| Ally Financial, Inc. sub. unsec. notes 5.75%, 11/20/25 | | 1,460,000 | 1,553,075 |
|
| American International Group, Inc. jr. unsec. sub. FRB | | | |
| 8.175%, 5/15/58 | | 2,072,000 | 2,714,320 |
|
| Australia & New Zealand Banking Group, Ltd./United | | | |
| Kingdom 144A jr. unsec. sub. FRB 6.75%, perpetual maturity | | | |
| (United Kingdom) | | 655,000 | 736,182 |
|
| Banco Bilbao Vizcaya Argentaria SA jr. unsec. sub. FRB 9.00%, | | | |
| perpetual maturity (Spain) | | 1,200,000 | 1,254,000 |
|
| Bank of America Corp. jr. unsec. sub. FRN Ser. AA, 6.10%, | | | |
| perpetual maturity | | 1,010,000 | 1,060,500 |
|
| CBRE Services, Inc. company guaranty sr. unsec. notes | | | |
| 5.25%, 3/15/25 | | 495,000 | 534,124 |
|
| CIT Group, Inc. sr. unsec. sub. notes 5.00%, 8/1/23 | | 1,435,000 | 1,521,100 |
|
| CIT Group, Inc. sr. unsec. unsub. notes 5.375%, 5/15/20 | | 1,560,000 | 1,667,250 |
|
| CIT Group, Inc. sr. unsec. unsub. notes 5.00%, 8/15/22 | | 1,536,000 | 1,628,160 |
|
| Citigroup, Inc. jr. unsec. sub. FRN Ser. Q, 5.95%, | | | |
| perpetual maturity | | 645,000 | 656,691 |
|
| CNG Holdings, Inc./OH 144A sr. notes 9.375%, 5/15/20 | | 2,780,000 | 1,542,900 |
|
| CNO Financial Group, Inc. sr. unsec. unsub. notes | | | |
| 5.25%, 5/30/25 | | 1,995,000 | 1,980,038 |
|
| Credit Acceptance Corp. company guaranty sr. unsec. notes | | | |
| 7.375%, 3/15/23 | | 1,060,000 | 1,081,200 |
|
| Credit Acceptance Corp. company guaranty sr. unsec. notes | | | |
| 6.125%, 2/15/21 | | 1,930,000 | 1,939,650 |
|
| Credit Suisse Group AG 144A jr. unsec. sub. FRN 6.25%, | | | |
| perpetual maturity (Switzerland) | | 525,000 | 513,188 |
|
| DFC Finance Corp. 144A company guaranty sr. notes | | | |
| 10.50%, 6/15/20 | | 1,760,000 | 1,108,800 |
|
| Dresdner Funding Trust I 144A jr. unsec. sub. notes | | | |
| 8.151%, 6/30/31 | | 2,092,000 | 2,485,819 |
|
| E*Trade Financial Corp. sr. unsec. unsub. notes 4.625%, 9/15/23 | | 2,150,000 | 2,238,688 |
|
| ESH Hospitality, Inc. 144A company guaranty sr. unsec. notes | | | |
| 5.25%, 5/1/25 R | | 2,165,000 | 2,164,329 |
|
| Genworth Holdings, Inc. company guaranty jr. unsec. sub. FRN | | | |
| 6.15%, 11/15/66 | | 1,016,000 | 396,240 |
|
| Hub Holdings, LLC/Hub Holdings Finance, Inc. 144A sr. unsec. | | | |
| sub. notes 8.125%, 7/15/19 ‡‡ | | 705,000 | 687,375 |
|
| HUB International, Ltd. 144A sr. unsec. notes 7.875%, 10/1/21 | | 2,858,000 | 2,922,305 |
|
| Icahn Enterprises LP/Icahn Enterprises Finance Corp. company | | | |
| guaranty sr. unsec. notes 6.00%, 8/1/20 | | 1,183,000 | 1,137,159 |
|
| Icahn Enterprises LP/Icahn Enterprises Finance Corp. company | | | |
| guaranty sr. unsec. notes 5.875%, 2/1/22 | | 1,902,000 | 1,775,993 |
|
| Liberty Mutual Group, Inc. 144A company guaranty jr. unsec. | | | |
| sub. bonds 7.80%, 3/15/37 | | 830,000 | 962,800 |
|
| Lloyds Bank PLC jr. unsec. sub. FRN Ser. EMTN, 13.00%, | | | |
| perpetual maturity (United Kingdom) | GBP | 985,000 | 2,236,379 |
|
| | |
| CORPORATE BONDS AND NOTES (83.6%)* cont. | Principal amount | Value |
|
| Financials cont. | | |
| Lloyds Banking Group PLC jr. unsec. sub. FRB 7.50%, perpetual | | |
| maturity (United Kingdom) | $343,000 | $348,574 |
|
| MGM Growth Properties Operating Partnership LP/MGP | | |
| Finance Co-Issuer, Inc. 144A company guaranty sr. unsec. notes | | |
| 5.625%, 5/1/24 | 920,000 | 998,200 |
|
| MPT Operating Partnership LP/MPT Finance Corp. company | | |
| guaranty sr. unsec. notes 6.375%, 3/1/24 R | 995,000 | 1,092,013 |
|
| Nationstar Mortgage, LLC/Nationstar Capital Corp. company | | |
| guaranty sr. unsec. unsub. notes 7.875%, 10/1/20 | 1,380,000 | 1,390,350 |
|
| Nationstar Mortgage, LLC/Nationstar Capital Corp. company | | |
| guaranty sr. unsec. unsub. notes 6.50%, 7/1/21 | 3,565,000 | 3,395,663 |
|
| Neuberger Berman Group, LLC/Neuberger Berman Finance | | |
| Corp. 144A sr. unsec. notes 5.875%, 3/15/22 | 2,340,000 | 2,439,450 |
|
| OneMain Financial Holdings, LLC 144A company guaranty sr. | | |
| unsec. sub. notes 6.75%, 12/15/19 | 1,180,000 | 1,239,000 |
|
| OneMain Financial Holdings, LLC 144A company guaranty sr. | | |
| unsec. unsub. notes 7.25%, 12/15/21 | 2,337,000 | 2,450,929 |
|
| Provident Funding Associates LP/PFG Finance Corp. 144A | | |
| company guaranty sr. unsec. notes 6.75%, 6/15/21 | 3,211,000 | 3,162,835 |
|
| Royal Bank of Scotland Group PLC jr. unsec. sub. FRB 8.00%, | | |
| perpetual maturity (United Kingdom) | 1,055,000 | 1,018,286 |
|
| Royal Bank of Scotland Group PLC jr. unsec. sub. FRB 7.648%, | | |
| perpetual maturity (United Kingdom) | 4,955,000 | 5,915,031 |
|
| Royal Bank of Scotland Group PLC jr. unsec. sub. FRB 7.50%, | | |
| perpetual maturity (United Kingdom) | 1,340,000 | 1,269,650 |
|
| Springleaf Finance Corp. company guaranty sr. unsec. unsub. | | |
| notes 8.25%, 12/15/20 | 760,000 | 830,300 |
|
| Springleaf Finance Corp. company guaranty sr. unsec. unsub. | | |
| notes 7.75%, 10/1/21 | 835,000 | 876,750 |
|
| Springleaf Finance Corp. sr. unsec. unsub. notes | | |
| 5.25%, 12/15/19 | 615,000 | 628,838 |
|
| Stearns Holdings, Inc. 144A company guaranty sr. notes | | |
| 9.375%, 8/15/20 | 1,625,000 | 1,543,750 |
|
| TMX Finance, LLC/TitleMax Finance Corp. 144A company | | |
| guaranty sr. notes 8.50%, 9/15/18 | 1,919,000 | 1,504,016 |
|
| TRI Pointe Group, Inc./TRI Pointe Homes, Inc. company | | |
| guaranty sr. unsec. unsub. notes 5.875%, 6/15/24 | 2,181,000 | 2,279,145 |
|
| USI, Inc./NY 144A sr. unsec. notes 7.75%, 1/15/21 | 2,220,000 | 2,264,400 |
|
| Wayne Merger Sub, LLC 144A sr. unsec. notes 8.25%, 8/1/23 | 1,739,000 | 1,797,474 |
|
| | 84,566,455 |
| Forest products and packaging (1.9%) | | |
| Boise Cascade Co. 144A company guaranty sr. unsec. notes | | |
| 5.625%, 9/1/24 | 2,620,000 | 2,672,400 |
|
| Coveris Holdings SA 144A company guaranty sr. unsec. notes | | |
| 7.875%, 11/1/19 (Luxembourg) | 4,150,000 | 4,233,000 |
|
| Louisiana-Pacific Corp. company guaranty sr. unsec. notes | | |
| 7.50%, 6/1/20 | 2,550,000 | 2,652,000 |
|
| Mercer International, Inc. company guaranty sr. unsec. notes | | |
| 7.75%, 12/1/22 (Canada) | 2,664,000 | 2,770,560 |
|
| Norbord, Inc. 144A company guaranty sr. notes 6.25%, | | |
| 4/15/23 (Canada) | 2,635,000 | 2,809,569 |
|
| | | |
| CORPORATE BONDS AND NOTES (83.6%)* cont. | Principal amount | Value |
|
| Forest products and packaging cont. | | | |
| Pactiv, LLC sr. unsec. unsub. bonds 8.375%, 4/15/27 | | $260,000 | $286,650 |
|
| Sealed Air Corp. 144A company guaranty sr. unsec. notes | | | |
| 6.875%, 7/15/33 | | 2,177,000 | 2,356,603 |
|
| Smurfit Kappa Treasury Funding, Ltd. company guaranty sr. | | | |
| unsec. unsub. notes 7.50%, 11/20/25 (Ireland) | | 2,943,000 | 3,520,564 |
|
| | 21,301,346 |
| Gaming and lottery (2.7%) | | | |
| Boyd Gaming Corp. company guaranty sr. unsec. sub. notes | | | |
| 6.875%, 5/15/23 | | 2,470,000 | 2,667,600 |
|
| Boyd Gaming Corp. 144A company guaranty sr. unsec. unsub. | | | |
| bonds 6.375%, 4/1/26 | | 730,000 | 777,450 |
|
| Eldorado Resorts, Inc. company guaranty sr. unsec. unsub. | | | |
| notes 7.00%, 8/1/23 | | 2,475,000 | 2,611,125 |
|
| Great Canadian Gaming Corp. 144A company guaranty sr. | | | |
| unsec. notes 6.625%, 7/25/22 (Canada) | CAD | 3,139,000 | 2,489,370 |
|
| Isle of Capri Casinos, Inc. company guaranty sr. unsec. notes | | | |
| 5.875%, 3/15/21 | | $1,765,000 | 1,842,219 |
|
| Penn National Gaming, Inc. sr. unsec. sub. notes | | | |
| 5.875%, 11/1/21 | | 2,599,000 | 2,702,960 |
|
| Rivers Pittsburgh Borrower LP/Rivers Pittsburgh Finance Corp. | | | |
| 144A sr. notes 6.125%, 8/15/21 | | 3,260,000 | 3,357,800 |
|
| ROC Finance, LLC/ROC Finance 1 Corp. 144A notes | | | |
| 12.125%, 9/1/18 | | 6,261,000 | 6,448,830 |
|
| Scientific Games International, Inc. company guaranty sr. unsec. | | | |
| notes 10.00%, 12/1/22 | | 7,489,000 | 6,927,325 |
|
| Scientific Games International, Inc. company guaranty sr. unsec. | | | |
| sub. notes 6.25%, 9/1/20 | | 675,000 | 502,875 |
|
| Scientific Games International, Inc. 144A company guaranty sr. | | | |
| notes 7.00%, 1/1/22 | | 565,000 | 600,313 |
|
| | 30,927,867 |
| Health care (7.4%) | | | |
| Acadia Healthcare Co., Inc. company guaranty sr. unsec. sub. | | | |
| notes 6.125%, 3/15/21 | | 3,145,000 | 3,270,800 |
|
| Acadia Healthcare Co., Inc. company guaranty sr. unsec. sub. | | | |
| notes 5.125%, 7/1/22 | | 1,675,000 | 1,670,813 |
|
| AMAG Pharmaceuticals, Inc. 144A company guaranty sr. unsec. | | | |
| notes 7.875%, 9/1/23 | | 2,910,000 | 2,862,713 |
|
| Centene Corp. sr. unsec. unsub. notes 6.125%, 2/15/24 | | 2,175,000 | 2,370,750 |
|
| Centene Corp. sr. unsec. unsub. notes 5.625%, 2/15/21 | | 675,000 | 718,031 |
|
| Centene Corp. sr. unsec. unsub. notes 4.75%, 5/15/22 | | 1,945,000 | 2,020,369 |
|
| CHS/Community Health Systems, Inc. company guaranty sr. | | | |
| notes 5.125%, 8/1/21 | | 1,170,000 | 1,153,913 |
|
| CHS/Community Health Systems, Inc. company guaranty sr. | | | |
| unsec. notes 6.875%, 2/1/22 | | 2,150,000 | 1,784,500 |
|
| Concordia International Corp. 144A company guaranty sr. | | | |
| unsec. notes 7.00%, 4/15/23 (Canada) | | 2,755,000 | 2,128,238 |
|
| ConvaTec Healthcare E SA 144A company guaranty sr. unsec. | | | |
| unsub. notes 10.50%, 12/15/18 (Luxembourg) | | 2,131,000 | 2,192,266 |
|
| Crimson Merger Sub, Inc. 144A sr. unsec. notes 6.625%, 5/15/22 | | 3,825,000 | 3,423,375 |
|
| DPx Holdings BV 144A sr. unsec. sub. notes 7.50%, | | | |
| 2/1/22 (Netherlands) | | 2,360,000 | 2,507,925 |
|
| | |
| CORPORATE BONDS AND NOTES (83.6%)* cont. | Principal amount | Value |
|
| Health care cont. | | |
| Endo Finance, LLC/Endo Finco, Inc. 144A company guaranty sr. | | |
| unsec. unsub. notes 5.375%, 1/15/23 | $1,298,000 | $1,174,690 |
|
| Endo Limited/Endo Finance LLC/Endo Finco, Inc. 144A | | |
| company guaranty sr. unsec. notes 6.50%, 2/1/25 (Ireland) | 875,000 | 776,563 |
|
| Endo Limited/Endo Finance LLC/Endo Finco, Inc. | | |
| 144A company guaranty sr. unsec. unsub. notes 6.00%, | | |
| 7/15/23 (Ireland) | 3,850,000 | 3,493,875 |
|
| Halyard Health, Inc. company guaranty sr. unsec. unsub. notes | | |
| 6.25%, 10/15/22 | 2,685,000 | 2,745,413 |
|
| HCA, Inc. company guaranty sr. bonds 5.25%, 6/15/26 | 1,955,000 | 2,089,406 |
|
| HCA, Inc. company guaranty sr. notes 6.50%, 2/15/20 | 4,955,000 | 5,450,500 |
|
| HCA, Inc. company guaranty sr. unsec. unsub. notes | | |
| 7.50%, 2/15/22 | 705,000 | 801,938 |
|
| HCA, Inc. company guaranty sr. unsec. unsub. notes | | |
| 5.375%, 2/1/25 | 690,000 | 710,700 |
|
| Jaguar Holding Co. II/Pharmaceutical Product Development, | | |
| LLC 144A company guaranty sr. unsec. notes 6.375%, 8/1/23 | 2,605,000 | 2,728,738 |
|
| Kinetic Concepts, Inc./KCI USA, Inc. company guaranty sub. | | |
| notes 10.50%, 11/1/18 | 3,935,000 | 4,033,375 |
|
| Kinetic Concepts, Inc./KCI USA, Inc. 144A company guaranty sr. | | |
| notes 7.875%, 2/15/21 | 2,160,000 | 2,332,800 |
|
| Mallinckrodt International Finance SA/Mallinckrodt CB, | | |
| LLC 144A company guaranty sr. unsec. unsub. notes 5.50%, | | |
| 4/15/25 (Luxembourg) | 2,050,000 | 2,014,125 |
|
| MEDNAX, Inc. 144A company guaranty sr. unsec. unsub. notes | | |
| 5.25%, 12/1/23 | 910,000 | 957,775 |
|
| Molina Healthcare, Inc. 144A company guaranty sr. unsec. notes | | |
| 5.375%, 11/15/22 | 1,605,000 | 1,653,150 |
|
| Omega Healthcare Investors, Inc. company guaranty sr. unsec. | | |
| unsub. notes 4.95%, 4/1/24 R | 2,145,000 | 2,244,228 |
|
| Service Corp. International/US sr. unsec. notes 5.375%, 1/15/22 | 2,554,000 | 2,672,250 |
|
| Service Corp. International/US sr. unsec. unsub. notes | | |
| 5.375%, 5/15/24 | 3,375,000 | 3,619,688 |
|
| Sterigenics-Nordion Holdings, LLC 144A sr. unsec. notes | | |
| 6.50%, 5/15/23 | 1,285,000 | 1,342,928 |
|
| Tenet Healthcare Corp. company guaranty sr. bonds | | |
| 4.50%, 4/1/21 | 1,625,000 | 1,640,438 |
|
| Tenet Healthcare Corp. company guaranty sr. FRN | | |
| 4.153%, 6/15/20 | 2,920,000 | 2,923,650 |
|
| Tenet Healthcare Corp. company guaranty sr. notes | | |
| 6.25%, 11/1/18 | 860,000 | 915,900 |
|
| Tenet Healthcare Corp. company guaranty sr. sub. notes | | |
| 6.00%, 10/1/20 | 2,520,000 | 2,661,750 |
|
| Valeant Pharmaceuticals International, Inc. 144A company | | |
| guaranty sr. unsec. notes 6.125%, 4/15/25 | 2,100,000 | 1,845,375 |
|
| Valeant Pharmaceuticals International, Inc. 144A company | | |
| guaranty sr. unsec. notes 5.875%, 5/15/23 | 2,345,000 | 2,063,600 |
|
| Valeant Pharmaceuticals International, Inc. 144A company | | |
| guaranty sr. unsec. notes 5.625%, 12/1/21 | 925,000 | 834,813 |
|
| | |
| CORPORATE BONDS AND NOTES (83.6%)* cont. | Principal amount | Value |
|
| Health care cont. | | |
| Valeant Pharmaceuticals International, Inc. 144A company | | |
| guaranty sr. unsec. notes 5.50%, 3/1/23 | $1,100,000 | $959,750 |
|
| Valeant Pharmaceuticals International, Inc. 144A company | | |
| guaranty sr. unsec. notes 5.375%, 3/15/20 | 3,460,000 | 3,261,050 |
|
| | 84,052,161 |
| Homebuilding (2.1%) | | |
| American Builders & Contractors Supply Co., Inc. 144A sr. unsec. | | |
| notes 5.75%, 12/15/23 | 1,944,000 | 2,050,920 |
|
| Brookfield Residential Properties, Inc. 144A company guaranty | | |
| sr. unsec. notes 6.50%, 12/15/20 (Canada) | 3,150,000 | 3,236,625 |
|
| Brookfield Residential Properties, Inc./Brookfield Residential | | |
| US Corp. 144A company guaranty sr. unsec. notes 6.125%, | | |
| 7/1/22 (Canada) | 815,000 | 820,094 |
|
| CalAtlantic Group, Inc. company guaranty sr. unsec. sub. notes | | |
| 6.25%, 12/15/21 | 2,948,000 | 3,235,430 |
|
| CalAtlantic Group, Inc. company guaranty sr. unsec. sub. notes | | |
| 5.875%, 11/15/24 | 1,230,000 | 1,328,400 |
|
| Howard Hughes Corp. (The) 144A sr. unsec. notes | | |
| 6.875%, 10/1/21 | 5,030,000 | 5,281,500 |
|
| Lennar Corp. company guaranty sr. unsec. unsub. notes | | |
| 4.75%, 11/15/22 | 500,000 | 526,250 |
|
| Lennar Corp. company guaranty sr. unsec. unsub. notes | | |
| 4.75%, 4/1/21 | 1,375,000 | 1,475,375 |
|
| Mattamy Group Corp. 144A sr. unsec. notes 6.50%, | | |
| 11/15/20 (Canada) | 3,056,000 | 3,017,800 |
|
| PulteGroup, Inc. company guaranty sr. unsec. unsub. notes | | |
| 7.875%, 6/15/32 | 2,499,000 | 2,910,086 |
|
| PulteGroup, Inc. company guaranty sr. unsec. unsub. notes | | |
| 5.50%, 3/1/26 | 150,000 | 160,500 |
|
| | 24,042,980 |
| Household furniture and appliances (0.1%) | | |
| Tempur Sealy International, Inc. 144A company guaranty sr. | | |
| unsec. unsub. bonds 5.50%, 6/15/26 | 1,160,000 | 1,211,620 |
|
| | 1,211,620 |
| Lodging/Tourism (1.0%) | | |
| Dakota Merger Sub, Inc. 144A sr. notes 7.75%, 9/1/23 | 3,370,000 | 3,416,338 |
|
| Dakota Merger Sub, Inc. 144A sr. unsec. notes 10.75%, 9/1/24 | 1,350,000 | 1,326,375 |
|
| Hilton Escrow Issuer, LLC/Hilton Escrow Issuer Corp. 144A sr. | | |
| sub. notes 4.25%, 9/1/24 | 420,000 | 428,138 |
|
| MGM Resorts International company guaranty sr. unsec. unsub. | | |
| notes 8.625%, 2/1/19 | 419,000 | 473,994 |
|
| MGM Resorts International company guaranty sr. unsec. unsub. | | |
| notes 6.625%, 12/15/21 | 945,000 | 1,060,763 |
|
| SugarHouse HSP Gaming Prop. Mezz LP/SugarHouse HSP | | |
| Gaming Finance Corp. 144A sr. notes 6.375%, 6/1/21 | 4,607,000 | 4,618,518 |
|
| | 11,324,126 |
| Media (0.6%) | | |
| EMI Music Publishing Group North America Holdings, Inc. 144A | | |
| sr. unsec. notes 7.625%, 6/15/24 | 2,005,000 | 2,185,450 |
|
| Nielsen Co. Luxembourg Sarl (The) 144A company guaranty sr. | | |
| unsec. sub. notes 5.50%, 10/1/21 (Luxembourg) | 2,680,000 | 2,793,900 |
|
| WMG Acquisition Corp. 144A company guaranty sr. notes | | |
| 5.00%, 8/1/23 | 1,706,000 | 1,752,915 |
|
| | | 6,732,265 |
| | |
| CORPORATE BONDS AND NOTES (83.6%)* cont. | Principal amount | Value |
|
| Metals (3.5%) | | |
| Allegheny Technologies, Inc. sr. unsec. unsub. notes | | |
| 7.875%, 8/15/23 | $175,000 | $166,250 |
|
| Allegheny Technologies, Inc. sr. unsec. unsub. notes | | |
| 5.95%, 1/15/21 | 645,000 | 601,463 |
|
| ArcelorMittal SA sr. unsec. unsub. bonds 10.85%, | | |
| 6/1/19 (France) | 1,525,000 | 1,818,563 |
|
| ArcelorMittal SA sr. unsec. unsub. bonds 6.125%, | | |
| 6/1/25 (France) | 2,199,000 | 2,380,418 |
|
| First Quantum Minerals, Ltd. 144A company guaranty sr. unsec. | | |
| notes 7.25%, 5/15/22 (Canada) | 1,654,000 | 1,418,305 |
|
| First Quantum Minerals, Ltd. 144A company guaranty sr. unsec. | | |
| notes 7.00%, 2/15/21 (Canada) | 1,520,000 | 1,322,400 |
|
| First Quantum Minerals, Ltd. 144A company guaranty sr. unsec. | | |
| notes 6.75%, 2/15/20 (Canada) | 1,554,000 | 1,367,520 |
|
| Freeport-McMoran Oil & Gas, LLC/FCX Oil & Gas, Inc. company | | |
| guaranty sr. unsec. notes 6.75%, 2/1/22 | 1,190,000 | 1,190,000 |
|
| Freeport-McMoran Oil & Gas, LLC/FCX Oil & Gas, Inc. company | | |
| guaranty sr. unsec. unsub. notes 6.875%, 2/15/23 | 2,225,000 | 2,163,813 |
|
| Freeport-McMoRan, Inc. company guaranty sr. unsec. notes | | |
| 3.55%, 3/1/22 (Indonesia) | 855,000 | 745,988 |
|
| HudBay Minerals, Inc. company guaranty sr. unsec. notes 9.50%, | | |
| 10/1/20 (Canada) | 3,199,000 | 3,199,000 |
|
| Joseph T Ryerson & Son, Inc. 144A sr. notes 11.00%, 5/15/22 | 1,980,000 | 2,178,000 |
|
| New Gold, Inc. 144A company guaranty sr. unsec. unsub. notes | | |
| 7.00%, 4/15/20 (Canada) | 1,405,000 | 1,447,150 |
|
| New Gold, Inc. 144A company guaranty sr. unsec. unsub. notes | | |
| 6.25%, 11/15/22 (Canada) | 1,060,000 | 1,099,750 |
|
| Novelis Corp. 144A company guaranty sr. unsec. notes | | |
| 6.25%, 8/15/24 | 2,155,000 | 2,241,200 |
|
| Novelis, Inc. company guaranty sr. unsec. notes | | |
| 8.75%, 12/15/20 | 5,045,000 | 5,284,638 |
|
| Steel Dynamics, Inc. company guaranty sr. unsec. unsub. notes | | |
| 6.375%, 8/15/22 | 3,670,000 | 3,871,850 |
|
| Steel Dynamics, Inc. company guaranty sr. unsec. unsub. notes | | |
| 5.50%, 10/1/24 | 855,000 | 902,025 |
|
| Steel Dynamics, Inc. company guaranty sr. unsec. unsub. notes | | |
| 5.25%, 4/15/23 | 1,150,000 | 1,196,000 |
|
| Teck Resources, Ltd. 144A company guaranty sr. unsec. notes | | |
| 8.50%, 6/1/24 (Canada) | 320,000 | 358,400 |
|
| Teck Resources, Ltd. 144A company guaranty sr. unsec. notes | | |
| 8.00%, 6/1/21 (Canada) | 480,000 | 518,400 |
|
| TMS International Corp. 144A company guaranty sr. unsec. sub. | | |
| notes 7.625%, 10/15/21 | 3,680,000 | 3,164,800 |
|
| Zekelman Industries, Inc. 144A company guaranty sr. notes | | |
| 9.875%, 6/15/23 | 1,830,000 | 1,958,100 |
|
| | | 40,594,033 |
| | |
| CORPORATE BONDS AND NOTES (83.6%)* cont. | Principal amount | Value |
|
| Regional Bells (0.7%) | | |
| Frontier Communications Corp. sr. unsec. notes | | |
| 11.00%, 9/15/25 | $2,393,000 | $2,584,440 |
|
| Frontier Communications Corp. sr. unsec. notes | | |
| 10.50%, 9/15/22 | 2,555,000 | 2,780,159 |
|
| Frontier Communications Corp. sr. unsec. notes | | |
| 8.875%, 9/15/20 | 785,000 | 855,650 |
|
| Frontier Communications Corp. sr. unsec. notes 6.25%, 9/15/21 | 1,605,000 | 1,565,389 |
|
| | 7,785,638 |
| Retail (2.5%) | | |
| Bon-Ton Department Stores, Inc. (The) company guaranty notes | | |
| 10.625%, 7/15/17 | 1,355,000 | 1,355,000 |
|
| Bon-Ton Department Stores, Inc. (The) company guaranty notes | | |
| 8.00%, 6/15/21 | 1,941,000 | 1,077,255 |
|
| Dollar Tree, Inc. company guaranty sr. unsec. unsub. notes | | |
| 5.75%, 3/1/23 | 870,000 | 935,250 |
|
| JC Penney Corp, Inc. company guaranty sr. unsec. bonds | | |
| 8.125%, 10/1/19 | 2,320,000 | 2,496,900 |
|
| JC Penney Corp, Inc. company guaranty sr. unsec. unsub. notes | | |
| 5.65%, 6/1/20 | 420,000 | 417,900 |
|
| JC Penney Corp, Inc. 144A company guaranty sr. notes | | |
| 5.875%, 7/1/23 | 545,000 | 568,653 |
|
| Jo-Ann Stores Holdings, Inc. 144A sr. unsec. notes 9.75%, | | |
| 10/15/19 ‡‡ | 1,815,000 | 1,724,250 |
|
| Jo-Ann Stores, Inc. 144A sr. unsec. notes 8.125%, 3/15/19 | 3,805,000 | 3,805,000 |
|
| L Brands, Inc. company guaranty sr. unsec. notes | | |
| 6.625%, 4/1/21 | 215,000 | 248,325 |
|
| L Brands, Inc. company guaranty sr. unsec. sub. notes | | |
| 5.625%, 2/15/22 | 1,470,000 | 1,639,050 |
|
| Neiman Marcus Group, LLC (The) company guaranty sr. notes | | |
| 7.125%, 6/1/28 | 1,996,000 | 1,916,160 |
|
| Neiman Marcus Group, Ltd. 144A company guaranty sr. unsec. | | |
| sub. notes 8.75%, 10/15/21 ‡‡ | 3,665,000 | 2,977,813 |
|
| Neiman Marcus Group, Ltd. 144A company guaranty sr. unsec. | | |
| sub. notes 8.00%, 10/15/21 | 3,085,000 | 2,639,835 |
|
| Penske Automotive Group, Inc. company guaranty sr. unsec. | | |
| sub. notes 5.75%, 10/1/22 | 2,490,000 | 2,583,375 |
|
| Penske Automotive Group, Inc. company guaranty sr. unsec. | | |
| sub. notes 5.50%, 5/15/26 | 1,305,000 | 1,305,809 |
|
| Penske Automotive Group, Inc. company guaranty sr. unsec. | | |
| sub. notes 5.375%, 12/1/24 | 1,780,000 | 1,811,150 |
|
| Wolverine World Wide, Inc. 144A company guaranty sr. unsec. | | |
| bonds 5.00%, 9/1/26 | 1,469,000 | 1,470,836 |
|
| | 28,972,561 |
| Technology (4.2%) | | |
| Avaya, Inc. 144A company guaranty notes 10.50%, 3/1/21 | 1,400,000 | 364,000 |
|
| Avaya, Inc. 144A company guaranty sr. notes 7.00%, 4/1/19 | 6,075,000 | 4,525,875 |
|
| CommScope Technologies Finance, LLC 144A sr. unsec. notes | | |
| 6.00%, 6/15/25 | 3,111,000 | 3,301,549 |
|
| Diamond 1 Finance Corp./Diamond 2 Finance Corp. 144A | | |
| company guaranty sr. unsec. notes 7.125%, 6/15/24 | 1,455,000 | 1,576,282 |
|
| Diamond 1 Finance Corp./Diamond 2 Finance Corp. 144A sr. | | |
| bonds 8.35%, 7/15/46 | 505,000 | 588,507 |
|
| | |
| CORPORATE BONDS AND NOTES (83.6%)* cont. | Principal amount | Value |
|
| Technology cont. | | |
| Diamond 1 Finance Corp./Diamond 2 Finance Corp. 144A sr. | | |
| notes 5.45%, 6/15/23 | $2,740,000 | $2,921,336 |
|
| Diamond 1 Finance Corp./Diamond 2 Finance Corp. 144A sr. | | |
| unsec. notes 5.875%, 6/15/21 | 2,465,000 | 2,606,348 |
|
| First Data Corp. 144A company guaranty sr. unsec. unsub. notes | | |
| 7.00%, 12/1/23 | 3,915,000 | 4,100,963 |
|
| First Data Corp. 144A notes 5.75%, 1/15/24 | 2,590,000 | 2,651,513 |
|
| First Data Corp. 144A sr. notes 5.375%, 8/15/23 | 2,095,000 | 2,173,563 |
|
| Infor Software Parent LLC/Infor Software Parent, Inc. 144A | | |
| company guaranty sr. unsec. notes 7.125%, 5/1/21 ‡‡ | 1,690,000 | 1,584,375 |
|
| Infor US, Inc. company guaranty sr. unsec. notes 6.50%, 5/15/22 | 3,122,000 | 3,164,928 |
|
| Iron Mountain, Inc. company guaranty sr. unsec. notes | | |
| 6.00%, 8/15/23 R | 2,400,000 | 2,562,000 |
|
| Iron Mountain, Inc. 144A company guaranty sr. unsec. notes | | |
| 6.00%, 10/1/20 R | 915,000 | 972,197 |
|
| Micron Technology, Inc. company guaranty sr. unsec. unsub. | | |
| notes 5.875%, 2/15/22 | 2,195,000 | 2,216,950 |
|
| Micron Technology, Inc. 144A sr. notes 7.50%, 9/15/23 | 1,110,000 | 1,223,775 |
|
| NXP BV/NXP Funding, LLC 144A Company guaranty sr. unsec. | | |
| notes 4.625%, 6/1/23 (Netherlands) | 3,045,000 | 3,212,475 |
|
| Plantronics, Inc. 144A company guaranty sr. unsec. notes | | |
| 5.50%, 5/31/23 | 3,135,000 | 3,260,400 |
|
| Syniverse Holdings, Inc. company guaranty sr. unsec. notes | | |
| 9.125%, 1/15/19 | 520,000 | 343,200 |
|
| Zebra Technologies Corp. sr. unsec. unsub. bonds | | |
| 7.25%, 10/15/22 | 4,035,000 | 4,377,975 |
|
| | 47,728,211 |
| Telecommunications (3.4%) | | |
| Altice Finco SA 144A company guaranty sr. unsec. unsub. notes | | |
| 7.625%, 2/15/25 (Luxembourg) | 1,100,000 | 1,113,750 |
|
| Digicel Group, Ltd. 144A sr. unsec. notes 8.25%, | | |
| 9/30/20 (Jamaica) | 3,465,000 | 3,135,825 |
|
| Digicel, Ltd. 144A company guaranty sr. unsec. notes 6.75%, | | |
| 3/1/23 (Jamaica) | 2,585,000 | 2,365,275 |
|
| Intelsat Jackson Holdings SA company guaranty sr. unsec. notes | | |
| 7.50%, 4/1/21 (Bermuda) | 926,000 | 696,815 |
|
| Intelsat Luxembourg SA company guaranty sr. unsec. bonds | | |
| 7.75%, 6/1/21 (Luxembourg) | 379,000 | 111,805 |
|
| Intelsat Luxembourg SA company guaranty sr. unsec. sub. | | |
| bonds 8.125%, 6/1/23 (Luxembourg) | 758,000 | 224,558 |
|
| Level 3 Communications, Inc. sr. unsec. unsub. notes | | |
| 5.75%, 12/1/22 | 1,925,000 | 2,011,625 |
|
| Level 3 Financing, Inc. company guaranty sr. unsec. unsub. | | |
| notes 6.125%, 1/15/21 | 965,000 | 1,001,188 |
|
| Level 3 Financing, Inc. company guaranty sr. unsec. unsub. | | |
| notes 5.375%, 1/15/24 | 1,005,000 | 1,053,994 |
|
| Level 3 Financing, Inc. company guaranty sr. unsec. unsub. | | |
| notes 5.375%, 8/15/22 | 1,275,000 | 1,332,566 |
|
| Qwest Corp. sr. unsec. unsub. notes 7.25%, 9/15/25 | 1,656,000 | 1,791,752 |
|
| Sprint Capital Corp. company guaranty sr. unsec. unsub. notes | | |
| 6.875%, 11/15/28 | 5,277,000 | 4,749,300 |
|
| | |
| CORPORATE BONDS AND NOTES (83.6%)* cont. | Principal amount | Value |
|
| Telecommunications cont. | | |
| Sprint Communications, Inc. 144A company guaranty sr. unsec. | | |
| notes 9.00%, 11/15/18 | $2,086,000 | $2,297,208 |
|
| Sprint Corp. company guaranty sr. unsec. sub. notes | | |
| 7.875%, 9/15/23 | 7,240,000 | 7,037,208 |
|
| Sprint Corp. company guaranty sr. unsec. sub. notes | | |
| 7.25%, 9/15/21 | 5,335,000 | 5,274,981 |
|
| West Corp. 144A company guaranty sr. unsec. sub. notes | | |
| 5.375%, 7/15/22 | 3,285,000 | 3,194,663 |
|
| Wind Acquisition Finance SA 144A company guaranty notes | | |
| 7.375%, 4/23/21 (Luxembourg) | 1,405,000 | 1,447,150 |
|
| | 38,839,663 |
| Telephone (1.5%) | | |
| T-Mobile USA, Inc. company guaranty sr. unsec. notes | | |
| 6.625%, 4/1/23 | 2,054,000 | 2,197,780 |
|
| T-Mobile USA, Inc. company guaranty sr. unsec. notes | | |
| 6.375%, 3/1/25 | 4,140,000 | 4,450,500 |
|
| T-Mobile USA, Inc. company guaranty sr. unsec. notes | | |
| 6.25%, 4/1/21 | 1,444,000 | 1,508,980 |
|
| T-Mobile USA, Inc. company guaranty sr. unsec. unsub. notes | | |
| 6.633%, 4/28/21 | 2,015,000 | 2,125,825 |
|
| T-Mobile USA, Inc. company guaranty sr. unsec. unsub. notes | | |
| 6.125%, 1/15/22 | 2,353,000 | 2,491,239 |
|
| Windstream Services, LLC company guaranty sr. unsec. notes | | |
| 6.375%, 8/1/23 | 4,699,000 | 4,270,216 |
|
| | 17,044,540 |
| Textiles (0.1%) | | |
| Hanesbrands, Inc. 144A company guaranty sr. unsec. unsub. | | |
| notes 4.625%, 5/15/24 | 1,450,000 | 1,517,063 |
|
| | 1,517,063 |
| Tire and rubber (0.2%) | | |
| American Tire Distributors, Inc. 144A sr. unsec. sub. notes | | |
| 10.25%, 3/1/22 | 2,766,000 | 2,453,110 |
|
| | 2,453,110 |
| Transportation (0.8%) | | |
| Air Medical Merger Sub Corp. 144A sr. unsec. notes | | |
| 6.375%, 5/15/23 | 3,445,000 | 3,367,488 |
|
| Watco Cos., LLC/Watco Finance Corp. 144A company guaranty | | |
| sr. unsec. notes 6.375%, 4/1/23 | 5,792,000 | 5,806,480 |
|
| | 9,173,968 |
| Utilities and power (4.9%) | | |
| AES Corp./Virginia (The) sr. unsec. notes 8.00%, 6/1/20 | 791,000 | 931,403 |
|
| AES Corp./Virginia (The) sr. unsec. notes 5.50%, 4/15/25 | 3,336,000 | 3,436,080 |
|
| AES Corp./Virginia (The) sr. unsec. notes 4.875%, 5/15/23 | 950,000 | 959,500 |
|
| AES Corp./Virginia (The) sr. unsec. unsub. notes 7.375%, 7/1/21 | 3,465,000 | 3,976,088 |
|
| Boardwalk Pipelines LP company guaranty sr. unsec. unsub. | | |
| bonds 5.95%, 6/1/26 | 1,110,000 | 1,212,925 |
|
| Calpine Corp. sr. unsec. sub. notes 5.75%, 1/15/25 | 4,635,000 | 4,617,619 |
|
| Calpine Corp. 144A company guaranty sr. notes 6.00%, 1/15/22 | 900,000 | 942,750 |
|
| Calpine Corp. 144A company guaranty sr. sub. notes | | |
| 5.875%, 1/15/24 | 550,000 | 579,563 |
|
| Colorado Interstate Gas Co., LLC company guaranty sr. unsec. | | |
| notes 6.85%, 6/15/37 | 3,492,000 | 3,757,451 |
|
| | |
| CORPORATE BONDS AND NOTES (83.6%)* cont. | Principal amount | Value |
|
| Utilities and power cont. | | |
| DPL, Inc. sr. unsec. sub. notes 6.50%, 10/15/16 | $231,000 | $231,556 |
|
| Dynegy, Inc. company guaranty sr. unsec. notes | | |
| 7.375%, 11/1/22 | 225,000 | 222,188 |
|
| Dynegy, Inc. company guaranty sr. unsec. notes 6.75%, 11/1/19 | 4,379,000 | 4,488,475 |
|
| Dynegy, Inc. company guaranty sr. unsec. unsub. notes | | |
| 7.625%, 11/1/24 | 150,000 | 147,000 |
|
| El Paso Natural Gas Co., LLC company guaranty sr. unsec. notes | | |
| 8.625%, 1/15/22 | 1,597,000 | 1,991,809 |
|
| Energy Future Intermediate Holding Co., LLC/EFIH Finance, Inc. | | |
| 144A notes 11.75%, 3/1/22 (In default) † | 2,519,128 | 3,070,187 |
|
| Energy Transfer Equity LP company guaranty sr. notes | | |
| 7.50%, 10/15/20 | 1,785,000 | 1,954,575 |
|
| Energy Transfer Equity LP sr. sub. notes 5.875%, 1/15/24 | 1,440,000 | 1,476,000 |
|
| GenOn Americas Generation, LLC sr. unsec. notes | | |
| 9.125%, 5/1/31 | 1,285,000 | 1,034,425 |
|
| GenOn Americas Generation, LLC sr. unsec. notes | | |
| 8.50%, 10/1/21 | 1,035,000 | 828,000 |
|
| GenOn Energy, Inc. sr. unsec. sub. notes 9.875%, 10/15/20 | 570,000 | 401,850 |
|
| NRG Energy, Inc. company guaranty sr. unsec. sub. notes | | |
| 7.875%, 5/15/21 | 6,021,000 | 6,276,893 |
|
| NRG Energy, Inc. 144A company guaranty sr. unsec. bonds | | |
| 6.625%, 1/15/27 | 2,430,000 | 2,434,544 |
|
| NRG Energy, Inc. 144A company guaranty sr. unsec. notes | | |
| 7.25%, 5/15/26 | 1,695,000 | 1,760,258 |
|
| Regency Energy Partners LP/Regency Energy Finance Corp. | | |
| company guaranty sr. unsec. notes 5.00%, 10/1/22 | 1,260,000 | 1,339,607 |
|
| Regency Energy Partners LP/Regency Energy Finance Corp. | | |
| company guaranty sr. unsec. unsub. notes 6.50%, 7/15/21 | 200,000 | 206,463 |
|
| Regency Energy Partners LP/Regency Energy Finance Corp. | | |
| company guaranty sr. unsec. unsub. notes 5.875%, 3/1/22 | 1,840,000 | 2,019,989 |
|
| Regency Energy Partners LP/Regency Energy Finance Corp. | | |
| company guaranty sr. unsec. unsub. notes 5.50%, 4/15/23 | 1,720,000 | 1,779,785 |
|
| Regency Energy Partners LP/Regency Energy Finance Corp. | | |
| company guaranty sr. unsec. unsub. notes 4.50%, 11/1/23 | 1,177,000 | 1,190,498 |
|
| Southern Star Central Corp. 144A sr. unsec. notes | | |
| 5.125%, 7/15/22 | 2,385,000 | 2,390,963 |
|
| Texas Competitive Electric Holdings Co., LLC/TCEH Finance, Inc. | | |
| 144A company guaranty sr. notes 11.50%, 10/1/20 (In default) † | 1,345,000 | 437,125 |
|
| | | 56,095,569 |
| | | |
| Total corporate bonds and notes (cost $957,282,531) | | $954,807,150 |
| |
| |
| SENIOR LOANS (6.4%)* c | Principal amount | Value |
|
| Basic materials (0.4%) | | |
| Kraton Polymers, LLC/Kraton Polymers Capital Corp. bank term | | |
| loan FRN Ser. B, 6.00%, 1/6/22 | $2,120,000 | $2,115,836 |
|
| Solenis International LP bank term loan FRN 7.75%, 7/31/22 | 460,000 | 439,530 |
|
| Solenis International LP bank term loan FRN 4.25%, 7/31/21 | 1,100,000 | 1,087,797 |
|
| Zekelman Industries, Inc. bank term loan FRN Ser. B, | | |
| 6.00%, 6/14/21 | 1,115,000 | 1,119,181 |
|
| | | 4,762,344 |
| | |
| SENIOR LOANS (6.4%)* c cont. | Principal amount | Value |
|
| Capital goods (0.1%) | | |
| Manitowac Foodservice, Inc. bank term loan FRN 5.75%, 3/3/23 | $1,168,385 | $1,180,799 |
|
| | 1,180,799 |
| Communication services (0.2%) | | |
| Asurion, LLC bank term loan FRN 8.50%, 3/3/21 | 1,865,000 | 1,858,006 |
|
| | 1,858,006 |
| Consumer cyclicals (3.7%) | | |
| Academy, Ltd. bank term loan FRN Ser. B, 5.00%, 7/2/22 | 2,538,280 | 2,477,996 |
|
| Caesars Entertainment Operating Co., Inc. bank term loan FRN | | |
| Ser. B6, 11.25%, 3/1/17 | 5,210,117 | 5,522,724 |
|
| Caesars Entertainment Operating Co., Inc. bank term loan FRN | | |
| Ser. B7, 10.75%, 3/1/17 | 1,029,825 | 1,125,942 |
|
| Caesars Growth Properties Holdings, LLC bank term loan FRN | | |
| 6.25%, 5/8/21 | 3,660,300 | 3,489,485 |
|
| CPG International, Inc. bank term loan FRN Ser. B, | | |
| 4.75%, 9/30/20 | 994,583 | 994,583 |
|
| DBP Holding Corp. bank term loan FRN Ser. B, 5.25%, 10/11/19 | 916,070 | 859,578 |
|
| Getty Images, Inc. bank term loan FRN Ser. B, 4.75%, 10/18/19 | 2,295,421 | 1,945,369 |
|
| iHeartCommunications, Inc. bank term loan FRN Ser. D, | | |
| 6.938%, 1/30/19 | 2,546,000 | 1,948,220 |
|
| J Crew Group, Inc. bank term loan FRN Ser. B, 4.00%, 3/5/21 | 3,024,063 | 2,384,474 |
|
| Jeld-Wen, Inc. bank term loan FRN 5.25%, 10/15/21 | 1,518,438 | 1,526,980 |
|
| Jeld-Wen, Inc. bank term loan FRN Ser. B, 4.75%, 7/1/22 | 1,875,825 | 1,885,204 |
|
| Navistar, Inc. bank term loan FRN Ser. B, 6.50%, 8/7/20 | 3,862,678 | 3,635,746 |
|
| Petco Animal Supplies, Inc. bank term loan FRN Ser. B1, | | |
| 5.00%, 1/26/23 | 2,970,076 | 2,987,578 |
|
| ROC Finance, LLC bank term loan FRN 5.00%, 6/20/19 | 2,296,674 | 2,233,515 |
|
| Scientific Games International, Inc. bank term loan FRN Ser. B2, | | |
| 6.00%, 10/1/21 | 1,462,576 | 1,460,748 |
|
| Talbots, Inc. (The) bank term loan FRN 9.50%, 3/19/21 | 1,563,988 | 1,449,296 |
|
| Talbots, Inc. (The) bank term loan FRN 5.50%, 3/19/20 | 1,573,340 | 1,534,007 |
|
| Travelport Finance Luxembourg Sarl bank term loan FRN Ser. B, | | |
| 5.00%, 9/2/21 (Luxembourg) | 2,218,248 | 2,221,575 |
|
| VGD Merger Sub, LLC bank term loan FRN 8.50%, 7/26/24 | 415,000 | 416,124 |
|
| VGD Merger Sub, LLC bank term loan FRN 5.00%, 7/22/23 | 1,000,000 | 1,000,208 |
|
| Yonkers Racing Corp. bank term loan FRN 4.25%, 8/20/19 | 1,247,302 | 1,233,790 |
|
| | 42,333,142 |
| Consumer staples (0.3%) | | |
| Del Monte Foods, Inc. bank term loan FRN 8.25%, 8/18/21 | 1,440,000 | 1,018,800 |
|
| Revlon Consumer Products Corp. bank term loan FRN Ser. B, | | |
| 4.25%, 7/14/23 | 2,690,000 | 2,689,518 |
|
| | 3,708,318 |
| Energy (0.6%) | | |
| Chesapeake Energy Corp. bank term loan FRN 8.50%, 8/16/21 | 3,370,000 | 3,461,270 |
|
| MEG Energy Corp. bank term loan FRN Ser. B, 3.75%, | | |
| 3/31/20 (Canada) | 3,324,180 | 3,050,966 |
|
| Western Refining, Inc. bank term loan FRN Ser. B2, | | |
| 4.50%, 6/23/23 | 980,000 | 954,684 |
|
| | | 7,466,920 |
| | |
| SENIOR LOANS (6.4%)* c cont. | Principal amount | Value |
|
| Health care (0.6%) | | |
| AMAG Pharmaceuticals, Inc. bank term loan FRN Ser. B, | | |
| 4.75%, 8/17/21 | $938,438 | $938,438 |
|
| Concordia International Corp. bank term loan FRN Ser. B, 5.25%, | | |
| 10/21/21 (Canada) | 2,184,025 | 2,059,354 |
|
| DPx Holdings BV bank term loan FRN Ser. B, 4.25%, | | |
| 3/11/21 (Netherlands) | 1,362,877 | 1,358,107 |
|
| Multiplan, Inc. bank term loan FRN Ser. B, 5.00%, 5/25/23 | 960,000 | 969,943 |
|
| Quorum Health Corp. bank term loan FRN 6.75%, 4/29/22 | 1,291,763 | 1,230,404 |
|
| | 6,556,246 |
| Technology (0.2%) | | |
| Avaya, Inc. bank term loan FRN Ser. B7, 6.25%, 5/29/20 | 2,568,256 | 1,967,926 |
|
| | 1,967,926 |
| Utilities and power (0.3%) | | |
| Dynegy, Inc. bank term loan FRN Ser. C, 5.00%, 6/27/23 | 1,070,000 | 1,068,997 |
|
| Energy Transfer Equity LP bank term loan FRN Ser. C, | | |
| 4.00%, 12/2/19 | 1,030,000 | 1,014,035 |
|
| Texas Competitive Electric Holdings Co., LLC bank term loan | | |
| FRN 4.676%, 10/10/17 | 4,891,407 | 1,575,439 |
|
| Texas Competitive Electric Holdings Co., LLC bank term loan | | |
| FRN 4.676%, 10/10/17 | 50,201 | 16,169 |
|
| | | 3,674,640 |
| | | |
| Total senior loans (cost $78,192,472) | | $73,508,341 |
| |
| |
| COMMON STOCKS (1.8%)* | Shares | Value |
|
| ACC Claims Holding, LLC Class A (Units) † F | 4,192,615 | $25,156 |
|
| Ally Financial, Inc. | 122,265 | 2,450,191 |
|
| Berry Plastics Group, Inc. † | 51,960 | 2,358,464 |
|
| Boise Cascade Co. † | 66,332 | 1,740,552 |
|
| CIT Group, Inc. | 35,508 | 1,309,535 |
|
| Eldorado Resorts, Inc. † | 87,925 | 1,227,433 |
|
| Gaming and Leisure Properties, Inc. R | 50,034 | 1,711,663 |
|
| General Motors Co. | 31,956 | 1,020,036 |
|
| Live Nation Entertainment, Inc. † | 72,585 | 1,939,471 |
|
| Lone Pine Resources Canada, Ltd. (Canada) † F | 87,188 | 872 |
|
| Lone Pine Resources, Inc. Class A (Canada) † F | 87,188 | 872 |
|
| Milagro Oil & Gas, Inc. (Units) † F | 918 | 579,120 |
|
| Penn National Gaming, Inc. † | 139,835 | 1,982,860 |
|
| Rite Aid Corp. † | 91,520 | 689,146 |
|
| Service Corp. International/US | 60,225 | 1,592,349 |
|
| Seventy Seven Energy, Inc. † | 105,019 | 1,843,083 |
|
| Tribune Media Co. Class 1C † F | 297,958 | 74,489 |
|
| Vantage Drilling International (Units) (Cayman Islands) † | 1,472 | 116,288 |
|
| Total common stocks (cost $19,828,957) | | $20,661,580 |
| | | | |
| CONVERTIBLE PREFERRED STOCKS (1.1%)* | | | Shares | Value |
|
| Allergan PLC Ser. A, 5.50% cv. pfd. | | | 2,467 | $2,054,172 |
|
| American Tower Corp. $5.50 cv. pfd. R | | | 23,000 | 2,517,063 |
|
| Belden, Inc. $6.75 cv. pfd. † | | | 10,700 | 1,147,468 |
|
| Crown Castle International Corp. Ser. A, $4.50 cv. pfd. R | | 9,325 | 1,051,021 |
|
| EPR Properties Ser. C, $1.438 cv. pfd. R | | | 58,913 | 1,786,719 |
|
| T-Mobile US, Inc. Ser. A, $2.75 cv. pfd. | | | 40,485 | 3,131,515 |
|
| Tyson Foods, Inc. $2.375 cv. pfd. | | | 15,619 | 1,294,347 |
|
| Total convertible preferred stocks (cost $11,242,108) | | | $12,982,305 |
| |
| |
| CONVERTIBLE BONDS AND NOTES (0.6%)* | | Principal amount | Value |
|
| DISH Network Corp. 144A cv. sr. unsec. bonds 3.375%, 8/15/26 | $2,033,000 | $2,120,673 |
|
| iStar, Inc. cv. sr. unsec. unsub. notes 3.00%, 11/15/16 R | | 1,377,000 | 1,401,098 |
|
| Jazz US Holdings, Inc. cv. company guaranty sr. unsec. notes | | | |
| 8.00%, 12/31/18 | | | 1,132,000 | 1,857,895 |
|
| Navistar International Corp. cv. sr. unsec. sub. bonds | | | |
| 4.50%, 10/15/18 | | | 906,000 | 695,355 |
|
| ON Semiconductor Corp. cv. company guaranty sr. unsec. | | | |
| unsub. notes 1.00%, 12/1/20 | | | 1,008,000 | 980,910 |
|
| Total convertible bonds and notes (cost $6,261,677) | | | $7,055,931 |
| |
| |
| WARRANTS (0.0%)* † | Expiration | Strike | | |
| | date | price | Warrants | Value |
|
| Seventy Seven Energy, Inc. F | 8/1/21 | $23.82 | 11,043 | $52,454 |
|
| Total warrants (cost $44,172) | | | | $52,454 |
| |
| |
| SHORT-TERM INVESTMENTS (5.4%)* | | Principal amount/shares | Value |
|
| Putnam Short Term Investment Fund .044% L | | Shares | 59,865,676 | $59,865,676 |
|
| U.S. Treasury Bills 0.257%, 11/10/16 § | | | $3,000 | 2,999 |
|
| U.S. Treasury Bills 0.271%, 11/3/16 | | | 1,073,000 | 1,072,498 |
|
| U.S. Treasury Bills 0.226%, 9/8/16 § | | | 5,000 | 5,000 |
|
| U.S. Treasury Bills 0.251%, 9/1/16 § | | | 1,112,000 | 1,111,877 |
|
| Total short-term investments (cost $62,058,173) | | | $62,058,050 |
| |
| |
| TOTAL INVESTMENTS | | | | |
|
| Total investments (cost $1,134,910,090) | | | | $1,131,125,811 |
Key to holding’s currency abbreviations
| |
| CAD | Canadian Dollar |
| EUR | Euro |
| GBP | British Pound |
Key to holding’s abbreviations
| |
| EMTN | Euro Medium Term Notes |
| FRB | Floating Rate Bonds: the rate shown is the current interest rate at the close of the reporting period |
| FRN | Floating Rate Notes: the rate shown is the current interest rate or yield at the close of the reporting period |
Notes to the fund’s portfolio
Unless noted otherwise, the notes to the fund’s portfolio are for the close of the fund’s reporting period, which ran from September 1, 2015 through August 31, 2016 (the reporting period). Within the following notes to the portfolio, references to “ASC 820” represent Accounting Standards Codification 820 Fair Value Measurements and Disclosures and references to “OTC”, if any, represent over-the-counter.
* Percentages indicated are based on net assets of $1,142,153,873.
† This security is non-income-producing.
‡‡ Income may be received in cash or additional securities at the discretion of the issuer.
§ This security, in part or in entirety, was pledged and segregated with the custodian for collateral on the initial margin on certain centrally cleared derivative contracts at the close of the reporting period.
c Senior loans are exempt from registration under the Securities Act of 1933, as amended, but contain certain restrictions on resale and cannot be sold publicly. These loans pay interest at rates which adjust periodically. The interest rates shown for senior loans are the current interest rates at the close of the reporting period. Senior loans are also subject to mandatory and/or optional prepayment which cannot be predicted. As a result, the remaining maturity may be substantially less than the stated maturity shown (Notes 1 and 6).
F This security is valued by Putnam Management at fair value following procedures approved by the Trustees. Securities may be classified as Level 2 or Level 3 for ASC 820 based on the securities’ valuation inputs (Note 1).
L Affiliated company (Note 5). The rate quoted in the security description is the annualized 7-day yield of the fund at the close of the reporting period.
R Real Estate Investment Trust.
At the close of the reporting period, the fund maintained liquid assets totaling $30,595,865 to cover certain derivative contracts.
Unless otherwise noted, the rates quoted in Short-term investments security descriptions represent the weighted average yield to maturity.
Debt obligations are considered secured unless otherwise indicated.
144A after the name of an issuer represents securities exempt from registration under Rule 144A under the Securities Act of 1933, as amended. These securities may be resold in transactions exempt from registration, normally to qualified institutional buyers.
The dates shown on debt obligations are the original maturity dates.
FORWARD CURRENCY CONTRACTS at 8/31/16 (aggregate face value $7,103,534)
| | | | | | |
| | | | | | Unrealized |
| | Contract | Delivery | | Aggregate | appreciation/ |
| Counterparty | Currency | type | date | Value | face value | (depreciation) |
|
| Goldman Sachs International | | | | | |
| Euro | Sell | 9/21/16 | $509,274 | $511,502 | $2,228 |
|
| JPMorgan Chase Bank N.A. | | | | | |
| British Pound | Buy | 9/21/16 | 635,451 | 704,941 | (69,490) |
|
| Canadian Dollar | Sell | 10/19/16 | 1,110,077 | 1,124,825 | 14,748 |
|
| State Street Bank and Trust Co. | | | | | |
| Canadian Dollar | Sell | 10/19/16 | 2,171,949 | 2,200,355 | 28,406 |
|
| UBS AG | | | | | |
| British Pound | Sell | 9/21/16 | 2,333,577 | 2,561,911 | 228,334 |
|
| Total | | | | | $204,226 |
CENTRALLY CLEARED CREDIT DEFAULT CONTRACTS OUTSTANDING at 8/31/16
| | | | | | | |
| | | Upfront | | | | Payments | |
| | | premium | | | Termi- | received | Unrealized |
| | | received | Notional | | nation | (paid) by fund | appreciation/ |
| Referenced debt* | Rating*** | (paid)** | amount | | date | per annum | (depreciation) |
|
| NA HY Series 26 | B+/P | $879,155 | $30,540,000 | | 6/20/21 | (500 bp) | $(734,276) |
| Index | | | | | | | |
|
| Total | | $879,155 | | | | | $(734,276) |
*Payments related to the referenced debt are made upon a credit default event.
**Upfront premium is based on the difference between the original spread on issue and the market spread on day of execution.
***Ratings are presented for credit default contracts in which the fund has sold protection on the underlying referenced debt. Ratings for an underlying index represent the average of the ratings of all the securities included in that index. The Moody’s, Standard & Poor’s or Fitch ratings are believed to be the most recent ratings available at August 31, 2016. Securities rated by Fitch are indicated by “/F.” Securities rated by Putnam are indicated by “/P.” The Putnam rating categories are comparable to the Standard & Poor’s classifications.
ASC 820 establishes a three-level hierarchy for disclosure of fair value measurements. The valuation hierarchy is based upon the transparency of inputs to the valuation of the fund’s investments. The three levels are defined as follows:
Level 1: Valuations based on quoted prices for identical securities in active markets.
Level 2: Valuations based on quoted prices in markets that are not active or for which all significant inputs are observable, either directly or indirectly.
Level 3: Valuations based on inputs that are unobservable and significant to the fair value measurement.
The following is a summary of the inputs used to value the fund’s net assets as of the close of the reporting period:
| | | | |
| | | | | Valuation inputs | |
|
| Investments in securities: | | Level 1 | Level 2 | Level 3 |
|
| Common stocks*: | | | | |
|
| Basic materials | | $1,740,552 | $— | $— |
|
| Capital goods | | 2,358,464 | — | — |
|
| Communication services | | — | — | 25,156 |
|
| Consumer cyclicals | | 6,169,800 | — | 74,489 |
|
| Consumer staples | | 689,146 | — | — |
|
| Energy | | 1,959,371 | — | 580,864 |
|
| Financials | | 5,471,389 | — | — |
|
| Health care | | 1,592,349 | — | — |
|
| Total common stocks | | 19,981,071 | — | 680,509 |
| | | | | |
| Convertible bonds and notes | | — | 7,055,931 | — |
|
| Convertible preferred stocks | | — | 12,982,305 | — |
|
| Corporate bonds and notes | | — | 954,806,669 | 481 |
|
| Senior loans | | — | 73,508,341 | — |
|
| Warrants | | — | — | 52,454 |
|
| Short-term investments | | 59,865,676 | 2,192,374 | — |
|
| Totals by level | | $79,846,747 | $1,050,545,620 | $733,444 |
| | | | |
| | | | | Valuation inputs | |
|
| Other financial instruments: | | Level 1 | Level 2 | Level 3 |
|
| Forward currency contracts | | $— | $204,226 | $— |
|
| Credit default contracts | | — | (1,613,431) | — |
|
| Totals by level | | $— | $(1,409,205) | $— |
* Common stock classifications are presented at the sector level, which may differ from the fund’s portfolio presentation.
During the reporting period, transfers within the fair value hierarchy, if any, did not represent, in the aggregate, more than 1% of the fund’s net assets measured as of the end of the period. Transfers are accounted for using the end of period pricing valuation method.
At the start and close of the reporting period, Level 3 investments in securities represented less than 1% of the fund’s net assets and were not considered a significant portion of the fund’s portfolio.
The accompanying notes are an integral part of these financial statements.
Statement of assets and liabilities 8/31/16
| |
| ASSETS | |
|
| Investment in securities, at value (Note 1): | |
| Unaffiliated issuers (identified cost $1,075,044,414) | $1,071,260,135 |
| Affiliated issuers (identified cost $59,865,676) (Notes 1 and 5) | 59,865,676 |
|
| Cash | 85,635 |
|
| Dividends, interest and other receivables | 19,172,709 |
|
| Receivable for shares of the fund sold | 427,618 |
|
| Receivable for investments sold | 3,276,600 |
|
| Receivable for variation margin (Note 1) | 68,944 |
|
| Unrealized appreciation on forward currency contracts (Note 1) | 273,716 |
|
| Prepaid assets | 29,683 |
|
| Total assets | 1,154,460,716 |
| |
| LIABILITIES | |
|
| Payable for investments purchased | 9,033,486 |
|
| Payable for shares of the fund repurchased | 1,184,443 |
|
| Payable for compensation of Manager (Note 2) | 543,262 |
|
| Payable for custodian fees (Note 2) | 16,299 |
|
| Payable for investor servicing fees (Note 2) | 290,094 |
|
| Payable for Trustee compensation and expenses (Note 2) | 566,430 |
|
| Payable for administrative services (Note 2) | 4,260 |
|
| Payable for distribution fees (Note 2) | 412,821 |
|
| Unrealized depreciation on forward currency contracts (Note 1) | 69,490 |
|
| Other accrued expenses | 186,258 |
|
| Total liabilities | 12,306,843 |
| | |
| Net assets | $1,142,153,873 |
|
| |
| REPRESENTED BY | |
|
| Paid-in capital (Unlimited shares authorized) (Notes 1 and 4) | $1,428,576,434 |
|
| Undistributed net investment income (Note 1) | 6,517,136 |
|
| Accumulated net realized loss on investments and foreign currency transactions (Note 1) | (288,624,994) |
|
| Net unrealized depreciation of investments and assets and liabilities in foreign currencies | (4,314,703) |
|
| Total — Representing net assets applicable to capital shares outstanding | $1,142,153,873 |
(Continued on next page)
Statement of assets and liabilities (Continued)
| |
| COMPUTATION OF NET ASSET VALUE AND OFFERING PRICE | |
|
| Net asset value and redemption price per class A share | |
| ($826,637,740 divided by 108,699,844 shares) | $7.60 |
|
| Offering price per class A share (100/96.00 of $7.60)* | $7.92 |
|
| Net asset value and offering price per class B share ($12,837,804 divided by 1,690,725 shares)** | $7.59 |
|
| Net asset value and offering price per class C share ($53,094,515 divided by 7,051,523 shares)** | $7.53 |
|
| Net asset value and redemption price per class M share ($13,960,344 divided by 1,826,582 shares) | $7.64 |
|
| Offering price per class M share (100/96.75 of $7.64)† | $7.90 |
|
| Net asset value, offering price and redemption price per class R share | |
| ($8,617,844 divided by 1,160,247 shares) | $7.43 |
|
| Net asset value, offering price and redemption price per class Y share | |
| ($227,005,626 divided by 30,554,134 shares) | $7.43 |
|
* On single retail sales of less than $100,000. On sales of $100,000 or more the offering price is reduced.
** Redemption price per share is equal to net asset value less any applicable contingent deferred sales charge.
† On single retail sales of less than $50,000. On sales of $50,000 or more the offering price is reduced.
The accompanying notes are an integral part of these financial statements.
Statement of operations Year ended 8/31/16
| |
| INVESTMENT INCOME | |
|
| Interest (including interest income of $247,883 from investments in affiliated issuers) (Note 5) | $68,638,871 |
|
| Dividends | 848,236 |
|
| Total investment income | 69,487,107 |
| |
| EXPENSES | |
|
| Compensation of Manager (Note 2) | 6,071,867 |
|
| Investor servicing fees (Note 2) | 1,685,498 |
|
| Custodian fees (Note 2) | 31,834 |
|
| Trustee compensation and expenses (Note 2) | 85,088 |
|
| Distribution fees (Note 2) | 2,688,777 |
|
| Administrative services (Note 2) | 29,886 |
|
| Other | 468,785 |
|
| Fees waived and reimbursed by Manager (Note 2) | (15,299) |
|
| Total expenses | 11,046,436 |
| | |
| Expense reduction (Note 2) | (2,356) |
|
| Net expenses | 11,044,080 |
| | |
| Net investment income | 58,443,027 |
|
| |
| Net realized loss on investments (Notes 1 and 3) | (57,220,388) |
|
| Net realized gain on swap contracts (Note 1) | 1,126,728 |
|
| Net realized gain on foreign currency transactions (Note 1) | 288,995 |
|
| Net increase from payments by affiliates (Note 2) | 6,025 |
|
| Net unrealized appreciation of assets and liabilities in foreign currencies during the year | 110,295 |
|
| Net unrealized appreciation of investments, and swap contracts during the year | 68,107,710 |
|
| Net gain on investments | 12,419,365 |
| | |
| Net increase in net assets resulting from operations | $70,862,392 |
|
The accompanying notes are an integral part of these financial statements.
Statement of changes in net assets
| | |
| INCREASE (DECREASE) IN NET ASSETS | Year ended 8/31/16 | Year ended 8/31/15 |
|
| Operations: | | |
| Net investment income | $58,443,027 | $64,552,513 |
|
| Net realized gain (loss) on investments | | |
| and foreign currency transactions | (55,798,640) | 14,142,104 |
|
| Net unrealized appreciation (depreciation) of investments | | |
| and assets and liabilities in foreign currencies | 68,218,005 | (121,433,718) |
|
| Net increase (decrease) in net assets resulting | | |
| from operations�� | 70,862,392 | (42,739,101) |
|
| Distributions to shareholders (Note 1): | | |
| From ordinary income | | |
| Net investment income | | |
|
| Class A | (44,717,515) | (50,014,866) |
|
| Class B | (607,072) | (754,931) |
|
| Class C | (2,203,258) | (2,230,568) |
|
| Class M | (687,490) | (861,599) |
|
| Class R | (456,972) | (587,353) |
|
| Class Y | (11,518,306) | (11,777,809) |
|
| Increase (decrease) from capital share transactions (Note 4) | 6,055,557 | (109,641,188) |
|
| Total increase (decrease) in net assets | 16,727,336 | (218,607,415) |
| |
| NET ASSETS | | |
|
| Beginning of year | 1,125,426,537 | 1,344,033,952 |
|
| End of year (including undistributed net investment income | | |
| of $6,517,136 and $7,883,637, respectively) | $1,142,153,873 | $1,125,426,537 |
|
The accompanying notes are an integral part of these financial statements.
|
| This page left blank intentionally. |
Financial highlights (For a common share outstanding throughout the period)
| | | | | | | | | | | | | |
| INVESTMENT OPERATIONS: | LESS DISTRIBUTIONS: | RATIOS AND SUPPLEMENTAL DATA: |
|
| | | | | | | | | | | | | Ratio of net | |
| | | | | | | | | | | | Ratio | investment | |
| | Net asset | | Net realized | | | | | | | | of expenses | income (loss) | |
| | value, | | and unrealized | Total from | From | | | Net asset | Total return | Net assets, | to average | to average | Portfolio |
| | beginning | Net investment | gain (loss) | investment | net investment | Total | Redemption | value, end | at net asset | end of period | net assets | net assets | turnover |
| Period ended | of period | income (loss)a | on investments | operations | income | distributions | fees | of period | value (%)b | (in thousands) | (%)c | (%) | (%) |
|
| Class A | | | | | | | | | | | | | |
| August 31, 2016 | $7.52 | .39 | .09 | .48 | (.40) | (.40) | — | $7.60 | 6.89 | $826,638 | 1.03e | 5.43e | 42 |
| August 31, 2015 | 8.20 | .41 | (.67) | (.26) | (.42) | (.42) | — | 7.52 | (3.27) | 849,769 | 1.00 | 5.19 | 47 |
| August 31, 2014 | 7.88 | .43 | .33 | .76 | (.44) | (.44) | — | 8.20 | 9.77 | 1,058,920 | 1.01 | 5.29 | 51 |
| August 31, 2013 | 7.76 | .49 | .11 | .60 | (.48) | (.48) | —d | 7.88 | 7.84 | 1,060,905 | 1.02 | 6.11 | 51 |
| August 31, 2012 | 7.39 | .51 | .38 | .89 | (.52) | (.52) | —d | 7.76 | 12.49 | 1,200,821 | 1.02 | 6.81 | 46 |
|
| Class B | | | | | | | | | | | | | |
| August 31, 2016 | $7.51 | .34 | .09 | .43 | (.35) | (.35) | — | $7.59 | 6.10 | $12,838 | 1.78e | 4.69e | 42 |
| August 31, 2015 | 8.19 | .35 | (.67) | (.32) | (.36) | (.36) | — | 7.51 | (4.02) | 14,175 | 1.75 | 4.44 | 47 |
| August 31, 2014 | 7.86 | .37 | .33 | .70 | (.37) | (.37) | — | 8.19 | 9.11 | 19,427 | 1.76 | 4.54 | 51 |
| August 31, 2013 | 7.74 | .43 | .11 | .54 | (.42) | (.42) | —d | 7.86 | 7.05 | 20,077 | 1.77 | 5.34 | 51 |
| August 31, 2012 | 7.38 | .45 | .37 | .82 | (.46) | (.46) | —d | 7.74 | 11.51 | 20,589 | 1.77 | 6.08 | 46 |
|
| Class C | | | | | | | | | | | | | |
| August 31, 2016 | $7.45 | .33 | .10 | .43 | (.35) | (.35) | — | $7.53 | 6.15 | $53,095 | 1.78e | 4.64e | 42 |
| August 31, 2015 | 8.13 | .35 | (.67) | (.32) | (.36) | (.36) | — | 7.45 | (4.05) | 40,895 | 1.75 | 4.45 | 47 |
| August 31, 2014 | 7.81 | .37 | .33 | .70 | (.38) | (.38) | — | 8.13 | 9.05 | 49,810 | 1.76 | 4.54 | 51 |
| August 31, 2013 | 7.69 | .42 | .12 | .54 | (.42) | (.42) | —d | 7.81 | 7.10 | 48,785 | 1.77 | 5.36 | 51 |
| August 31, 2012 | 7.34 | .45 | .36 | .81 | (.46) | (.46) | —d | 7.69 | 11.48 | 55,496 | 1.77 | 6.02 | 46 |
|
| Class M | | | | | | | | | | | | | |
| August 31, 2016 | $7.55 | .38 | .10 | .48 | (.39) | (.39) | — | $7.64 | 6.73 | $13,960 | 1.28e | 5.17e | 42 |
| August 31, 2015 | 8.23 | .39 | (.67) | (.28) | (.40) | (.40) | — | 7.55 | (3.55) | 13,755 | 1.25 | 4.93 | 47 |
| August 31, 2014 | 7.90 | .41 | .33 | .74 | (.41) | (.41) | — | 8.23 | 9.55 | 22,440 | 1.26 | 5.04 | 51 |
| August 31, 2013 | 7.78 | .47 | .11 | .58 | (.46) | (.46) | —d | 7.90 | 7.50 | 20,741 | 1.27 | 5.84 | 51 |
| August 31, 2012 | 7.41 | .49 | .38 | .87 | (.50) | (.50) | —d | 7.78 | 12.16 | 20,501 | 1.27 | 6.56 | 46 |
|
| Class R | | | | | | | | | | | | | |
| August 31, 2016 | $7.36 | .37 | .09 | .46 | (.39) | (.39) | — | $7.43 | 6.68 | $8,618 | 1.28e | 5.18e | 42 |
| August 31, 2015 | 8.03 | .38 | (.65) | (.27) | (.40) | (.40) | — | 7.36 | (3.47) | 11,037 | 1.25 | 4.94 | 47 |
| August 31, 2014 | 7.72 | .40 | .32 | .72 | (.41) | (.41) | — | 8.03 | 9.53 | 12,336 | 1.26 | 5.04 | 51 |
| August 31, 2013 | 7.61 | .46 | .11 | .57 | (.46) | (.46) | —d | 7.72 | 7.60 | 12,462 | 1.27 | 5.83 | 51 |
| August 31, 2012 | 7.26 | .48 | .37 | .85 | (.50) | (.50) | —d | 7.61 | 12.17 | 10,744 | 1.27 | 6.54 | 46 |
|
| Class Y | | | | | | | | | | | | | |
| August 31, 2016 | $7.36 | .40 | .09 | .49 | (.42) | (.42) | — | $7.43 | 7.18 | $227,006 | .78e | 5.66e | 42 |
| August 31, 2015 | 8.04 | .42 | (.66) | (.24) | (.44) | (.44) | — | 7.36 | (3.03) | 195,796 | .75 | 5.47 | 47 |
| August 31, 2014 | 7.73 | .44 | .33 | .77 | (.46) | (.46) | — | 8.04 | 10.16 | 181,102 | .76 | 5.54 | 51 |
| August 31, 2013 | 7.63 | .49 | .11 | .60 | (.50) | (.50) | —d | 7.73 | 8.03 | 182,624 | .77 | 6.30 | 51 |
| August 31, 2012 | 7.28 | .52 | .37 | .89 | (.54) | (.54) | —d | 7.63 | 12.71 | 164,060 | .77 | 7.01 | 46 |
|
See notes to financial highlights at the end of this section.
The accompanying notes are an integral part of these financial statements.
| |
| 56 High Yield Trust | High Yield Trust 57 |
Financial highlights (Continued)
a Per share net investment income (loss) has been determined on the basis of the weighted average number of shares outstanding during the period.
b Total return assumes dividend reinvestment and does not reflect the effect of sales charges.
c Includes amounts paid through expense offset and brokerage/service arrangements, if any (Note 2). Also excludes acquired fund fees and expenses, if any.
d Amount represents less than $0.01 per share.
e Reflects a voluntary waiver of certain fund expenses in effect during the period. As a result of such waivers, the expenses of each class reflect a reduction of less than .01% as a percentage of average net assets per share for each class (Note 2).
The accompanying notes are an integral part of these financial statements.
Notes to financial statements 8/31/16
Within the following Notes to financial statements, references to “State Street” represent State Street Bank and Trust Company, references to “the SEC” represent the Securities and Exchange Commission, references to “Putnam Management” represent Putnam Investment Management, LLC, the fund’s manager, an indirect wholly-owned subsidiary of Putnam Investments, LLC and references to “OTC”, if any, represent over-the-counter. Unless otherwise noted, the “reporting period” represents the period from September 1, 2015 through August 31, 2016.
Putnam High Yield Trust (the fund) is a Massachusetts business trust, which is registered under the Investment Company Act of 1940, as amended, as a diversified open-end management investment company. The goal of the fund is to seek high current income. Capital growth is a secondary goal when consistent with achieving high current income. The fund invests mainly in bonds that are obligations of U.S. companies, are below-investment-grade in quality (sometimes referred to as “junk bonds”), and have intermediate- to long-term maturities (three years or longer). Under normal circumstances, the fund invests at least 80% of the fund’s net assets in securities rated below-investment-grade. This policy may be changed only after 60 days’ notice to shareholders. The fund may also invest in other debt instruments, including loans. Putnam Management may consider, among other factors, credit, interest rate and prepayment risks, as well as general market conditions, when deciding whether to buy or sell investments.
The fund offers class A, class B, class C, class M, class R and class Y shares. Class A and class M shares are sold with a maximum front-end sales charge of 4.00% and 3.25%, respectively. Class A shares generally are not subject to a contingent deferred sales charge, and class M (effective November 1, 2015), class R and class Y shares are not subject to a contingent deferred sales charge. Class B shares, which convert to class A shares after approximately eight years, are not subject to a front-end sales charge and are subject to a contingent deferred sales charge if those shares are redeemed within six years of purchase. Class C shares are subject to a one-year 1.00% contingent deferred sales charge and do not convert to class A shares. Class R shares, which are not available to all investors, are sold at net asset value. The expenses for class A, class B, class C, class M and class R shares may differ based on the distribution fee of each class, which is identified in Note 2. Class Y shares, which are sold at net asset value, are generally subject to the same expenses as class A, class B, class C, class M and class R shares, but do not bear a distribution fee. Class Y shares are not available to all investors.
In the normal course of business, the fund enters into contracts that may include agreements to indemnify another party under given circumstances. The fund’s maximum exposure under these arrangements is unknown as this would involve future claims that may be, but have not yet been, made against the fund. However, the fund’s management team expects the risk of material loss to be remote.
The fund has entered into contractual arrangements with an investment adviser, administrator, distributor, shareholder servicing agent and custodian, who each provide services to the fund. Unless expressly stated otherwise, shareholders are not parties to, or intended beneficiaries of these contractual arrangements, and these contractual arrangements are not intended to create any shareholder right to enforce them against the service providers or to seek any remedy under them against the service providers, either directly or on behalf of the fund.
Under the fund’s Declaration of Trust, any claims asserted against or on behalf of the Putnam Funds, including claims against Trustees and Officers, must be brought in state and federal courts located within the Commonwealth of Massachusetts.
Note 1: Significant accounting policies
The following is a summary of significant accounting policies consistently followed by the fund in the preparation of its financial statements. The preparation of financial statements is in conformity with accounting principles generally accepted in the United States of America and requires management to make estimates and assumptions that affect the reported amounts of assets and liabilities in the financial statements and the reported amounts of increases and decreases in net assets from operations. Actual results could differ from those estimates. Subsequent events after the Statement of assets and liabilities date through the date that the financial statements were issued have been evaluated in the preparation of the financial statements.
Investment income, realized and unrealized gains and losses and expenses of the fund are borne pro-rata based on the relative net assets of each class to the total net assets of the fund, except that each class bears expenses unique to that class (including the distribution fees applicable to such classes). Each class votes as a class only with respect to its own distribution plan or other matters on which a class vote is required by law or determined by the Trustees.
If the fund were liquidated, shares of each class would receive their pro-rata share of the net assets of the fund. In addition, the Trustees declare separate dividends on each class of shares.
Security valuation Portfolio securities and other investments are valued using policies and procedures adopted by the Board of Trustees. The Trustees have formed a Pricing Committee to oversee the implementation of these procedures and have delegated responsibility for valuing the fund’s assets in accordance with these procedures to Putnam Management. Putnam Management has established an internal Valuation Committee that is responsible for making fair value determinations, evaluating the effectiveness of the pricing policies of the fund and reporting to the Pricing Committee.
Investments for which market quotations are readily available are valued at the last reported sales price on their principal exchange, or official closing price for certain markets, and are classified as Level 1 securities under Accounting Standards Codification 820 Fair Value Measurements and Disclosures (ASC 820). If no sales are reported, as in the case of some securities that are traded OTC, a security is valued at its last reported bid price and is generally categorized as a Level 2 security.
Investments in open-end investment companies (excluding exchange-traded funds), if any, which can be classified as Level 1 or Level 2 securities, are valued based on their net asset value. The net asset value of such investment companies equals the total value of their assets less their liabilities and divided by the number of their outstanding shares.
Market quotations are not considered to be readily available for certain debt obligations (including short-term investments with remaining maturities of 60 days or less) and other investments; such investments are valued on the basis of valuations furnished by an independent pricing service approved by the Trustees or dealers selected by Putnam Management. Such services or dealers determine valuations for normal institutional-size trading units of such securities using methods based on market transactions for comparable securities and various relationships, generally recognized by institutional traders, between securities (which consider such factors as security prices, yields, maturities and ratings). These securities will generally be categorized as Level 2.
Many securities markets and exchanges outside the U.S. close prior to the scheduled close of the New York Stock Exchange and therefore the closing prices for securities in such markets or on such exchanges may not fully reflect events that occur after such close but before the scheduled close of the New York Stock Exchange. Accordingly, on certain days, the fund will fair value foreign equity securities taking into account multiple factors including movements in the U.S. securities markets, currency valuations and comparisons to the valuation of American Depository Receipts, exchange-traded funds and futures contracts. These securities, which would generally be classified as Level 1 securities, will be transferred to Level 2 of the fair value hierarchy when they are valued at fair value. The number of days on which fair value prices will be used will depend on market activity and it is possible that fair value prices will be used by the fund to a significant extent. Securities quoted in foreign currencies, if any, are translated into U.S. dollars at the current exchange rate.
To the extent a pricing service or dealer is unable to value a security or provides a valuation that Putnam Management does not believe accurately reflects the security’s fair value, the security will be valued at fair value by Putnam Management in accordance with policies and procedures approved by the Trustees. Certain investments, including certain restricted and illiquid securities and derivatives, are also valued at fair value following procedures approved by the Trustees. These valuations consider such factors as significant market or specific security events such as interest rate or credit quality changes, various relationships with other securities, discount rates, U.S. Treasury, U.S. swap and credit yields, index levels, convexity exposures, recovery rates, sales and other multiples and resale restrictions. These securities are classified as Level 2 or as Level 3 depending on the priority of the significant inputs.
To assess the continuing appropriateness of fair valuations, the Valuation Committee reviews and affirms the reasonableness of such valuations on a regular basis after considering all relevant information that is reasonably available. Such valuations and procedures are reviewed periodically by the Trustees. The fair value of securities is generally determined as the amount that the fund could reasonably expect to realize from an orderly disposition of such securities over a reasonable period of time. By its nature, a fair value price is a good faith estimate of the value of a security in a current sale and does not reflect an actual market price, which may be different by a material amount.
Security transactions and related investment income Security transactions are recorded on the trade date (the date the order to buy or sell is executed). Gains or losses on securities sold are determined on the identified cost basis.
Interest income, net of any applicable withholding taxes, is recorded on the accrual basis. Dividend income, net of any applicable withholding taxes, is recognized on the ex-dividend date except that certain dividends from foreign
securities, if any, are recognized as soon as the fund is informed of the ex-dividend date. Non-cash dividends, if any, are recorded at the fair value of the securities received. Dividends representing a return of capital or capital gains, if any, are reflected as a reduction of cost and/or as a realized gain. All premiums/discounts are amortized/accreted on a yield-to-maturity basis.
The fund earned certain fees in connection with its senior loan purchasing activities. These fees are treated as market discount and are amortized into income in the Statement of operations.
Foreign currency translation The accounting records of the fund are maintained in U.S. dollars. The fair value of foreign securities, currency holdings, and other assets and liabilities is recorded in the books and records of the fund after translation to U.S. dollars based on the exchange rates on that day. The cost of each security is determined using historical exchange rates. Income and withholding taxes are translated at prevailing exchange rates when earned or incurred. The fund does not isolate that portion of realized or unrealized gains or losses resulting from changes in the foreign exchange rate on investments from fluctuations arising from changes in the market prices of the securities. Such gains and losses are included with the net realized and unrealized gain or loss on investments. Net realized gains and losses on foreign currency transactions represent net realized exchange gains or losses on closed forward currency contracts, disposition of foreign currencies, currency gains and losses realized between the trade and settlement dates on securities transactions and the difference between the amount of investment income and foreign withholding taxes recorded on the fund’s books and the U.S. dollar equivalent amounts actually received or paid. Net unrealized appreciation and depreciation of assets and liabilities in foreign currencies arise from changes in the value of open forward currency contracts and assets and liabilities other than investments at the period end, resulting from changes in the exchange rate.
Forward currency contracts The fund buys and sells forward currency contracts, which are agreements between two parties to buy and sell currencies at a set price on a future date. These contracts are used to hedge foreign exchange risk, for hedging currency exposures and to gain exposure to currencies.
The U.S. dollar value of forward currency contracts is determined using current forward currency exchange rates supplied by a quotation service. The fair value of the contract will fluctuate with changes in currency exchange rates. The contract is marked to market daily and the change in fair value is recorded as an unrealized gain or loss. The fund records a realized gain or loss equal to the difference between the value of the contract at the time it was opened and the value at the time it was closed when the contract matures or by delivery of the currency. The fund could be exposed to risk if the value of the currency changes unfavorably, if the counterparties to the contracts are unable to meet the terms of their contracts or if the fund is unable to enter into a closing position. Risks may exceed amounts recognized on the Statement of assets and liabilities.
Forward currency contracts outstanding at period end, if any, are listed after the fund’s portfolio.
Credit default contracts The fund entered into OTC and/or centrally cleared credit default contracts to hedge credit risk, for gaining liquid exposure to individual names, to hedge market risk, for gaining exposure to specific sectors and to gain exposure on individual names and/or baskets of securities.
In OTC and centrally cleared credit default contracts, the protection buyer typically makes a periodic stream of payments to a counterparty, the protection seller, in exchange for the right to receive a contingent payment upon the occurrence of a credit event on the reference obligation or all other equally ranked obligations of the reference entity. Credit events are contract specific but may include bankruptcy, failure to pay, restructuring and obligation acceleration. For OTC credit default contracts, an upfront payment received by the fund is recorded as a liability on the fund’s books. An upfront payment made by the fund is recorded as an asset on the fund’s books. Centrally cleared credit default contracts provide the same rights to the protection buyer and seller except the payments between parties, including upfront premiums, are settled through a central clearing agent through variation margin payments. Upfront and periodic payments received or paid by the fund for OTC and centrally cleared credit default contracts are recorded as realized gains or losses at the reset date or close of the contract. The OTC and centrally cleared credit default contracts are marked to market daily based upon quotations from an independent pricing service or market makers. Any change in value of OTC credit default contracts is recorded as an unrealized gain or loss. Daily fluctuations in the value of centrally cleared credit default contracts are recorded in variation margin on the Statement of assets and liabilities and recorded as unrealized gain or loss. Upon the occurrence of a credit event, the difference between the par value and fair value of the reference obligation, net of any proportional amount of the upfront payment, is recorded as a realized gain or loss.
In addition to bearing the risk that the credit event will occur, the fund could be exposed to market risk due to unfavorable changes in interest rates or in the price of the underlying security or index or the possibility that the
fund may be unable to close out its position at the same time or at the same price as if it had purchased the underlying reference obligations. In certain circumstances, the fund may enter into offsetting OTC and centrally cleared credit default contracts which would mitigate its risk of loss. Risks of loss may exceed amounts recognized on the Statement of assets and liabilities. The fund’s maximum risk of loss from counterparty risk, either as the protection seller or as the protection buyer, is the fair value of the contract. This risk may be mitigated for OTC credit default contracts by having a master netting arrangement between the fund and the counterparty and for centrally cleared credit default contracts through the daily exchange of variation margin. Counterparty risk is further mitigated with respect to centrally cleared credit default swap contracts due to the clearinghouse guarantee fund and other resources that are available in the event of a clearing member default. Where the fund is a seller of protection, the maximum potential amount of future payments the fund may be required to make is equal to the notional amount.
OTC and centrally cleared credit default contracts outstanding, including their respective notional amounts at period end, if any, are listed after the fund’s portfolio.
Master agreements The fund is a party to ISDA (International Swaps and Derivatives Association, Inc.) Master Agreements (Master Agreements) with certain counterparties that govern OTC derivative and foreign exchange contracts entered into from time to time. The Master Agreements may contain provisions regarding, among other things, the parties’ general obligations, representations, agreements, collateral requirements, events of default and early termination. With respect to certain counterparties, in accordance with the terms of the Master Agreements, collateral posted to the fund is held in a segregated account by the fund’s custodian and, with respect to those amounts which can be sold or repledged, is presented in the fund’s portfolio. Collateral posted to the fund which cannot be sold or repledged totaled $247,577 at the close of the reporting period.
Collateral pledged by the fund is segregated by the fund’s custodian and identified in the fund’s portfolio. Collateral can be in the form of cash or debt securities issued by the U.S. Government or related agencies or other securities as agreed to by the fund and the applicable counterparty. Collateral requirements are determined based on the fund’s net position with each counterparty.
Termination events applicable to the fund may occur upon a decline in the fund’s net assets below a specified threshold over a certain period of time. Termination events applicable to counterparties may occur upon a decline in the counterparty’s long-term and short-term credit ratings below a specified level. In each case, upon occurrence, the other party may elect to terminate early and cause settlement of all derivative and foreign exchange contracts outstanding, including the payment of any losses and costs resulting from such early termination, as reasonably determined by the terminating party. Any decision by one or more of the fund’s counterparties to elect early termination could impact the fund’s future derivative activity.
At the close of the reporting period, the fund had a net liability position of $54,742 on open derivative contracts subject to the Master Agreements. There was no collateral posted by the fund at period end for these agreements.
Interfund lending The fund, along with other Putnam funds, may participate in an interfund lending program pursuant to an exemptive order issued by the SEC. This program allows the fund to borrow from or lend to other Putnam funds that permit such transactions. Interfund lending transactions are subject to each fund’s investment policies and borrowing and lending limits. Interest earned or paid on the interfund lending transaction will be based on the average of certain current market rates. During the reporting period, the fund did not utilize the program.
Lines of credit The fund participates, along with other Putnam funds, in a $317.5 million unsecured committed line of credit and a $235.5 million unsecured uncommitted line of credit, both provided by State Street. Prior to September 22, 2016, the fund participated in a $392.5 million syndicated unsecured committed line of credit provided by State Street ($292.5 million) and Northern Trust Company ($100 million) and the same unsecured uncommitted line of credit. Borrowings may be made for temporary or emergency purposes, including the funding of shareholder redemption requests and trade settlements. Interest is charged to the fund based on the fund’s borrowing at a rate equal to the higher of (1) the Federal Funds rate and (2) the overnight LIBOR plus 1.25% for the committed line of credit and the Federal Funds rate plus 1.30% for the uncommitted line of credit. A closing fee equal to 0.04% of the committed line of credit plus a $25,000 flat fee (0.04% prior to September 22, 2016) and 0.04% of the uncommitted line of credit has been paid by the participating funds. In addition, a commitment fee of 0.21% (0.16% prior to September 22, 2016) per annum on any unutilized portion of the committed line of credit is allocated to the participating funds based on their relative net assets and paid quarterly. During the reporting period, the fund had no borrowings against these arrangements.
Federal taxes It is the policy of the fund to distribute all of its taxable income within the prescribed time period and otherwise comply with the provisions of the Internal Revenue Code of 1986, as amended (the Code), applicable to regulated investment companies. It is also the intention of the fund to distribute an amount sufficient to avoid imposition of any excise tax under Section 4982 of the Code.
The fund is subject to the provisions of Accounting Standards Codification 740 Income Taxes (ASC 740). ASC 740 sets forth a minimum threshold for financial statement recognition of the benefit of a tax position taken or expected to be taken in a tax return. The fund did not have a liability to record for any unrecognized tax benefits in the accompanying financial statements. No provision has been made for federal taxes on income, capital gains or unrealized appreciation on securities held nor for excise tax on income and capital gains. Each of the fund’s federal tax returns for the prior three fiscal years remains subject to examination by the Internal Revenue Service.
The fund may also be subject to taxes imposed by governments of countries in which it invests. Such taxes are generally based on either income or gains earned or repatriated. The fund accrues and applies such taxes to net investment income, net realized gains and net unrealized gains as income and/or capital gains are earned. In some cases, the fund may be entitled to reclaim all or a portion of such taxes, and such reclaim amounts, if any, are reflected as an asset on the fund’s books. In many cases, however, the fund may not receive such amounts for an extended period of time, depending on the country of investment.
At August 31, 2016, the fund had a capital loss carryover of $239,040,739 available to the extent allowed by the Code to offset future net capital gain, if any. The amounts of the carryovers and the expiration dates are:
| | | |
| Loss carryover |
|
| Short-term | Long-term | Total | Expiration |
|
| $1,050,608 | $5,790,782 | $6,841,390 | * |
|
| 94,579,015 | N/A | 94,579,015 | August 31, 2017 |
|
| 137,620,334 | N/A | 137,620,334 | August 31, 2018 |
|
* Under the Regulated Investment Company Modernization Act of 2010, the fund will be permitted to carry forward capital losses incurred in taxable years beginning after December 22, 2010 for an unlimited period. However, any losses incurred will be required to be utilized prior to the losses incurred in pre-enactment tax years. As a result of this ordering rule, pre-enactment capital loss carryforwards may be more likely to expire unused. Additionally, post-enactment capital losses that are carried forward will retain their character as either short-term or long-term capital losses rather than being considered all short-term as under previous law.
Pursuant to federal income tax regulations applicable to regulated investment companies, the fund has elected to defer certain capital losses of $49,519,572 recognized during the period between November 1, 2015 and August 31, 2016, to its fiscal year ending August 31, 2017.
Distributions to shareholders Distributions to shareholders from net investment income are recorded by the fund on the ex-dividend date. Distributions from capital gains, if any, are recorded on the ex-dividend date and paid at least annually. The amount and character of income and gains to be distributed are determined in accordance with income tax regulations, which may differ from generally accepted accounting principles.
These differences include temporary and/or permanent differences from late year loss deferrals, and from defaulted bond interest. Reclassifications are made to the fund’s capital accounts to reflect income and gains available for distribution (or available capital loss carryovers) under income tax regulations. At the close of the reporting period, the fund reclassified $381,085 to increase undistributed net investment income and $381,085 to increase accumulated net realized loss.
The tax basis components of distributable earnings and the federal tax cost as of the close of the reporting period were as follows:
| |
| Unrealized appreciation | $44,861,011 |
| Unrealized depreciation | (49,289,380) |
|
| Net unrealized depreciation | (4,428,369) |
| Undistributed ordinary income | 8,396,840 |
| Capital loss carryforward | (239,040,739) |
| Post-October capital loss deferral | (49,519,572) |
| Cost for federal income tax purposes | $1,135,554,180 |
Note 2: Management fee, administrative services and other transactions
The fund pays Putnam Management a management fee (based on the fund’s average net assets and computed and paid monthly) at annual rates that may vary based on the average of the aggregate net assets of all open-end mutual funds sponsored by Putnam Management (excluding net assets of funds that are invested in, or that are invested in by, other Putnam funds to the extent necessary to avoid “double counting” of those assets). Such annual rates may vary as follows:
| | | | |
| 0.720% | of the first $5 billion, | | 0.520% | of the next $50 billion, |
| |
|
| 0.670% | of the next $5 billion, | | 0.500% | of the next $50 billion, |
| |
|
| 0.620% | of the next $10 billion, | | 0.490% | of the next $100 billion and |
| |
|
| 0.570% | of the next $10 billion, | | 0.485% | of any excess thereafter. |
| |
|
For the reporting period, the management fee represented an effective rate (excluding the impact from any expense waivers in effect) of 0.564% of the fund’s average net assets.
Putnam Management has contractually agreed, through December 30, 2017, to waive fees or reimburse the fund’s expenses to the extent necessary to limit the cumulative expenses of the fund, exclusive of brokerage, interest, taxes, investment-related expenses, extraordinary expenses, acquired fund fees and expenses and payments under the fund’s investor servicing contract, investment management contract and distribution plans, on a fiscal year-to-date basis to an annual rate of 0.20% of the fund’s average net assets over such fiscal year-to-date period. During the reporting period, the fund’s expenses were not reduced as a result of this limit.
Putnam Management may from time to time voluntarily undertake to waive fees and/or reimburse certain fund expenses. Any such waiver or reimbursement would be voluntary and may be modified or discontinued by Putnam Management at any time without notice. For the reporting period, Putnam Management voluntarily waived $15,299.
Putnam Investments Limited (PIL), an affiliate of Putnam Management, is authorized by the Trustees to manage a separate portion of the assets of the fund as determined by Putnam Management from time to time. PIL did not manage any portion of the assets of the fund during the reporting period. If Putnam Management were to engage the services of PIL, Putnam Management would pay a quarterly sub-management fee to PIL for its services at an annual rate of 0.40% of the average net assets of the portion of the fund managed by PIL.
Putnam Management has agreed to reimburse the fund $6,025 for a compliance exception which occurred during the reporting period. The effect of the loss incurred and the reimbursement by Putnam Management of such amounts had no material impact on total return.
The fund reimburses Putnam Management an allocated amount for the compensation and related expenses of certain officers of the fund and their staff who provide administrative services to the fund. The aggregate amount of all such reimbursements is determined annually by the Trustees.
Custodial functions for the fund’s assets are provided by State Street. Custody fees are based on the fund’s asset level, the number of its security holdings and transaction volumes.
Putnam Investor Services, Inc., an affiliate of Putnam Management, provides investor servicing agent functions to the fund. Putnam Investor Services, Inc. received fees for investor servicing for class A, class B, class C, class M, class R and class Y shares that included (1) a per account fee for each direct and underlying non-defined contribution account (“retail account”) of the fund and each of the other funds in its specified category, which was totaled and then allocated to each fund in the category based on its average daily net assets; (2) a specified rate of the fund’s assets attributable to defined contribution plan accounts; and (3) a specified rate based on the average net
assets in retail accounts. Putnam Investor Services has agreed that the aggregate investor servicing fees for each fund’s retail and defined contribution accounts for these share classes will not exceed an annual rate of 0.320% of the fund’s average assets attributable to such accounts.
Effective September 1, 2016, Putnam Investor Services, Inc. will receive fees for investor servicing for class A, class B, class C, class M, class R and class Y shares that include (1) a per account fee for each retail account of the fund; (2) a specified rate of the fund’s assets attributable to defined contribution plan accounts; and (3) a specified rate based on the average net assets in retail accounts. Putnam Investor Services has agreed that the aggregate investor servicing fees for each fund’s retail and defined contribution accounts for these share classes will not exceed an annual rate of 0.25% of the fund’s average assets attributable to such accounts.
During the reporting period, the expenses for each class of shares related to investor servicing fees were as follows:
| | | | |
| Class A | $1,255,898 | | Class R | 13,157 |
| |
|
| Class B | 19,686 | | Class Y | 306,131 |
| |
|
| Class C | 70,373 | | Total | $1,685,498 |
| |
|
| Class M | 20,253 | | | |
| | |
The fund has entered into expense offset arrangements with Putnam Investor Services, Inc. and State Street whereby Putnam Investor Services, Inc.’s and State Street’s fees are reduced by credits allowed on cash balances. The fund also reduced expenses through brokerage/service arrangements. For the reporting period, the fund’s expenses were reduced by $2,265 under the expense offset arrangements and by $91 under the brokerage/service arrangements.
Each Independent Trustee of the fund receives an annual Trustee fee, of which $784, as a quarterly retainer, has been allocated to the fund, and an additional fee for each Trustees meeting attended. Trustees also are reimbursed for expenses they incur relating to their services as Trustees.
The fund has adopted a Trustee Fee Deferral Plan (the Deferral Plan) which allows the Trustees to defer the receipt of all or a portion of Trustees fees payable on or after July 1, 1995. The deferred fees remain invested in certain Putnam funds until distribution in accordance with the Deferral Plan.
The fund has adopted an unfunded noncontributory defined benefit pension plan (the Pension Plan) covering all Trustees of the fund who have served as a Trustee for at least five years and were first elected prior to 2004. Benefits under the Pension Plan are equal to 50% of the Trustee’s average annual attendance and retainer fees for the three years ended December 31, 2005. The retirement benefit is payable during a Trustee’s lifetime, beginning the year following retirement, for the number of years of service through December 31, 2006. Pension expense for the fund is included in Trustee compensation and expenses in the Statement of operations. Accrued pension liability is included in Payable for Trustee compensation and expenses in the Statement of assets and liabilities. The Trustees have terminated the Pension Plan with respect to any Trustee first elected after 2003.
The fund has adopted distribution plans (the Plans) with respect to its class A, class B, class C, class M and class R shares pursuant to Rule 12b–1 under the Investment Company Act of 1940. The purpose of the Plans is to compensate Putnam Retail Management Limited Partnership, an indirect wholly-owned subsidiary of Putnam Investments, LLC, for services provided and expenses incurred in distributing shares of the fund. The Plans provide for payments by the fund to Putnam Retail Management Limited Partnership at an annual rate of up to 0.35%, 1.00%, 1.00%, 1.00% and 1.00% of the average net assets attributable to class A, class B, class C, class M and class R shares, respectively. The Trustees have approved payment by the fund at an annual rate of 0.25%, 1.00%, 1.00%, 0.50% and 0.50% of the average net assets attributable to class A, class B, class C, class M and class R shares, respectively. During the reporting period, the class specific expenses related to distribution fees were as follows:
| | | | |
| Class A | $2,006,160 | | Class M | 64,780 |
| |
|
| Class B | 125,819 | | Class R | 42,017 |
| |
|
| Class C | 450,001 | | Total | $2,688,777 |
| |
|
For the reporting period, Putnam Retail Management Limited Partnership, acting as underwriter, received net commissions of $48,051 and $1,079 from the sale of class A and class M shares, respectively, and received $6,652 and $1,061 in contingent deferred sales charges from redemptions of class B and class C shares, respectively.
A deferred sales charge of up to 1.00% and 0.40% (no longer applicable effective November 1, 2015) is assessed on certain redemptions of class A and class M shares, respectively. For the reporting period, Putnam Retail Management Limited Partnership, acting as underwriter, received $4 and no monies on class A and class M redemptions, respectively.
Note 3: Purchases and sales of securities
During the reporting period, the cost of purchases and the proceeds from sales, excluding short-term investments, were as follows:
| | |
| | Cost of purchases | Proceeds from sales |
|
| Investments in securities (Long-term) | $426,390,252 | $421,207,503 |
|
| U.S. government securities (Long-term) | — | — |
|
| Total | $426,390,252 | $421,207,503 |
|
The fund may purchase or sell investments from or to other Putnam funds in the ordinary course of business, which can reduce the fund’s transaction costs, at prices determined in accordance with SEC requirements and policies approved by the Trustees. During the reporting period, purchases or sales of long-term securities from or to other Putnam funds, if any, did not represent more than 5% of the fund’s total cost of purchases and/or total proceeds from sales.
Note 4: Capital shares
At the close of the reporting period, there were an unlimited number of shares of beneficial interest authorized. Transactions in capital shares were as follows:
| | | | |
| | Year ended 8/31/16 | Year ended 8/31/15 |
|
| Class A | Shares | Amount | Shares | Amount |
|
| Shares sold | 25,227,778 | $181,550,011 | 21,338,215 | $168,941,686 |
|
| Shares issued in connection with | | | | |
| reinvestment of distributions | 5,348,287 | 38,492,978 | 5,439,190 | 42,750,858 |
|
| | 30,576,065 | 220,042,989 | 26,777,405 | 211,692,544 |
|
| Shares repurchased | (34,896,539) | (251,459,816) | (42,858,782) | (338,226,004) |
|
| Net decrease | (4,320,474) | $(31,416,827) | (16,081,377) | $(126,533,460) |
|
| |
| | Year ended 8/31/16 | Year ended 8/31/15 |
|
| Class B | Shares | Amount | Shares | Amount |
|
| Shares sold | 235,873 | $1,699,374 | 209,508 | $1,646,924 |
|
| Shares issued in connection with | | | | |
| reinvestment of distributions | 75,398 | 541,605 | 83,585 | 656,254 |
|
| | 311,271 | 2,240,979 | 293,093 | 2,303,178 |
|
| Shares repurchased | (508,746) | (3,648,281) | (777,339) | (6,121,444) |
|
| Net decrease | (197,475) | $(1,407,302) | (484,246) | $(3,818,266) |
|
| |
| | Year ended 8/31/16 | Year ended 8/31/15 |
|
| Class C | Shares | Amount | Shares | Amount |
|
| Shares sold | 5,359,223 | $38,261,770 | 2,379,281 | $18,533,108 |
|
| Shares issued in connection with | | | | |
| reinvestment of distributions | 273,717 | 1,956,922 | 253,599 | 1,975,958 |
|
| | 5,632,940 | 40,218,692 | 2,632,880 | 20,509,066 |
|
| Shares repurchased | (4,071,889) | (28,933,302) | (3,272,214) | (25,449,662) |
|
| Net increase (decrease) | 1,561,051 | $11,285,390 | (639,334) | $(4,940,596) |
|
| | | | |
| | Year ended 8/31/16 | Year ended 8/31/15 |
|
| Class M | Shares | Amount | Shares | Amount |
|
| Shares sold | 638,041 | $4,641,703 | 433,364 | $3,432,855 |
|
| Shares issued in connection with | | | | |
| reinvestment of distributions | 86,356 | 625,195 | 99,086 | 783,161 |
|
| | 724,397 | 5,266,898 | 532,450 | 4,216,016 |
|
| Shares repurchased | (718,960) | (5,185,559) | (1,436,721) | (11,157,488) |
|
| Net increase (decrease) | 5,437 | $81,339 | (904,271) | $(6,941,472) |
|
| |
| | Year ended 8/31/16 | Year ended 8/31/15 |
|
| Class R | Shares | Amount | Shares | Amount |
|
| Shares sold | 353,796 | $2,489,483 | 464,753 | $3,572,833 |
|
| Shares issued in connection with | | | | |
| reinvestment of distributions | 63,395 | 445,705 | 75,259 | 578,810 |
|
| | 417,191 | 2,935,188 | 540,012 | 4,151,643 |
|
| Shares repurchased | (757,359) | (5,461,240) | (575,418) | (4,420,872) |
|
| Net decrease | (340,168) | $(2,526,052) | (35,406) | $(269,229) |
|
| |
| | Year ended 8/31/16 | Year ended 8/31/15 |
|
| Class Y | Shares | Amount | Shares | Amount |
|
| Shares sold | 17,362,492 | $122,807,578 | 31,278,631 | $241,420,023 |
|
| Shares issued in connection with | | | | |
| reinvestment of distributions | 1,602,644 | 11,292,372 | 1,500,232 | 11,524,968 |
|
| | 18,965,136 | 134,099,950 | 32,778,863 | 252,944,991 |
|
| Shares repurchased | (15,027,087) | (104,060,941) | (28,690,407) | (220,083,156) |
|
| Net increase | 3,938,049 | $30,039,009 | 4,088,456 | $32,861,835 |
|
Note 5: Affiliated transactions
Transactions during the reporting period with Putnam Short Term Investment Fund, which is under common ownership and control, were as follows:
| | | | | |
| | Fair value at the | | | | Fair value at |
| | beginning of | | | | the end of |
| | the reporting | | | Investment | the reporting |
| Name of affiliate | period | Purchase cost | Sale proceeds | income | period |
|
| Putnam Short Term | | | | | |
| Investment Fund* | $42,679,199 | $423,174,270 | $405,987,793 | $247,883 | $59,865,676 |
|
* Management fees charged to Putnam Short Term Investment Fund have been waived by Putnam Management.
Note 6: Senior loan commitments
Senior loans are purchased or sold on a when-issued or delayed delivery basis and may be settled a month or more after the trade date, which from time to time can delay the actual investment of available cash balances; interest income is accrued based on the terms of the securities. Senior loans can be acquired through an agent, by assignment from another holder of the loan, or as a participation interest in another holder’s portion of the loan. When the fund invests in a loan or participation, the fund is subject to the risk that an intermediate participant between the fund and the borrower will fail to meet its obligations to the fund, in addition to the risk that the borrower under the loan may default on its obligations.
Note 7: Market, credit and other risks
In the normal course of business, the fund trades financial instruments and enters into financial transactions where risk of potential loss exists due to changes in the market (market risk) or failure of the contracting party to the transaction to perform (credit risk). The fund may be exposed to additional credit risk that an institution or other entity with which the fund has unsettled or open transactions will default. Investments in foreign securities involve certain risks, including those related to economic instability, unfavorable political developments, and currency fluctuations. The fund may invest in higher-yielding, lower-rated bonds that may have a higher rate of default.
Note 8: Summary of derivative activity
The volume of activity for the reporting period for any derivative type that was held during the period is listed below and was based on an average of the holdings at the end of each fiscal quarter:
| |
| Forward currency contracts (contract amount) | $10,700,000 |
|
| Centrally cleared credit default contracts (notional) | $20,800,000 |
|
| Warrants (number of warrants) | 4,000 |
|
The following is a summary of the fair value of derivative instruments as of the close of the reporting period:
Fair value of derivative instruments as of the close of the reporting period
| | | | |
| | Asset derivatives | Liability derivatives |
|
| Derivatives not | | | | |
| accounted for as | Statement of | | Statement of | |
| hedging instruments | assets and | | assets and | |
| under ASC 815 | liabilities location | Fair value | liabilities location | Fair value |
|
| | Net assets — | | Net assets — | |
| | Unrealized | | Unrealized | |
| Credit contracts | appreciation | $— | depreciation | $1,613,431* |
|
| Foreign exchange | | | | |
| contracts | Receivables | 273,716 | Payables | 69,490 |
|
| | | | Payables, Net | |
| | | | assets — Unrealized | |
| Equity contracts | Investments | 52,454 | depreciation | — |
|
| Total | | $326,170 | | $1,682,921 |
|
* Includes cumulative appreciation/depreciation of centrally cleared swaps as reported in the fund’s portfolio. Only current day’s variation margin is reported within the Statement of assets and liabilities.
The following is a summary of realized and change in unrealized gains or losses of derivative instruments in the Statement of operations for the reporting period (see Note 1):
Amount of realized gain or (loss) on derivatives recognized in net gain or (loss) on investments
| | | | |
| Derivatives not accounted for | | Forward | | |
| as hedging instruments under | | currency | | |
| ASC 815 | Warrants | contracts | Swaps | Total |
|
| Credit contracts | $— | $— | $1,126,728 | $1,126,728 |
|
| Foreign exchange contracts | — | 308,635 | — | 308,635 |
|
| Equity contracts | (42,051) | — | — | (42,051) |
|
| Total | $(42,051) | $308,635 | $1,126,728 | $1,393,312 |
|
Change in unrealized appreciation or (depreciation) on derivatives recognized in net gain or (loss) on investments
| | | | |
| Derivatives not accounted for | | Forward | | |
| as hedging instruments under | | currency | | |
| ASC 815 | Warrants | contracts | Swaps | Total |
|
| Credit contracts | $— | $— | $(734,276) | $(734,276) |
|
| Foreign exchange contracts | — | 108,979 | — | 108,979 |
|
| Equity contracts | 53,628 | — | — | 53,628 |
|
| Total | $53,628 | $108,979 | $(734,276) | $(571,669) |
|
Note 9: Offsetting of financial and derivative assets and liabilities
The following table summarizes any derivatives, repurchase agreements and reverse repurchase agreements, at the end of the reporting period, that are subject to an enforceable master netting agreement or similar agreement. For securities lending transactions or borrowing transactions associated with securities sold short, if any, see Note 1. For financial reporting purposes, the fund does not offset financial assets and financial liabilities that are subject to the master netting agreements in the Statement of assets and liabilities.
| | | | | | |
| | Barclays Capital Inc. (clearing broker) | Goldman Sachs International | JPMorgan Chase Bank N.A. | State Street Bank and Trust Co. | UBS AG | Total |
|
| Assets: | | | | | | |
|
| Centrally cleared credit default contracts§ | $68,944 | $— | $— | $— | $— | $68,944 |
|
| Forward currency contracts# | — | 2,228 | 14,748 | 28,406 | 228,334 | 273,716 |
|
| Total Assets | $68,944 | $2,228 | $14,748 | $28,406 | $228,334 | $342,660 |
|
| Liabilities: | | | | | | |
|
| Centrally cleared credit default contracts§ | — | — | — | — | — | — |
|
| Forward currency contracts# | — | — | 69,490 | — | — | 69,490 |
|
| Total Liabilities | $— | $— | $69,490 | $— | $— | $69,490 |
|
| Total Financial and Derivative Net Assets | $68,944 | $2,228 | $(54,742) | $28,406 | $228,334 | $273,170 |
|
| Total collateral received (pledged)†## | $— | $— | $— | $— | $228,334 | |
|
| Net amount | $68,944 | $2,228 | $(54,742) | $28,406 | $— | |
|
† Additional collateral may be required from certain brokers based on individual agreements.
# Covered by master netting agreement (Note 1).
## Any over-collateralization of total financial and derivative net assets is not shown. Collateral may include amounts related to unsettled agreements.
§ Includes current day’s variation margin only as reported on the Statement of assets and liabilities, which is not collateralized. Cumulative appreciation/(depreciation) for futures contracts and centrally cleared swap contracts is represented in the tables listed after the fund’s portfolio.
Federal tax information (Unaudited)
The fund designated 0.88% of ordinary income distributions as qualifying for the dividends received deduction for corporations.
For the reporting period, the fund hereby designates 0.88%, or the maximum amount allowable, of its taxable ordinary income distributions as qualified dividends taxed at the individual net capital gain rates.
The Form 1099 that will be mailed to you in January 2017 will show the tax status of all distributions paid to your account in calendar 2016.
About the Trustees
Independent Trustees


* Mr. Reynolds is an “interested person” (as defined in the Investment Company Act of 1940) of the fund and Putnam Investments. He is President and Chief Executive Officer of Putnam Investments, as well as the President of your fund and each of the other Putnam funds.
The address of each Trustee is One Post Office Square, Boston, MA 02109.
As of August 31, 2016, there were 116 Putnam funds. All Trustees serve as Trustees of all Putnam funds.
Each Trustee serves for an indefinite term, until his or her resignation, retirement at age 75, removal, or death.
Officers
In addition to Robert L. Reynolds, the other officers of the fund are shown below:
| |
| Jonathan S. Horwitz (Born 1955) | Janet C. Smith (Born 1965) |
| Executive Vice President, Principal Executive | Vice President, Principal Accounting Officer, |
| Officer, and Compliance Liaison | and Assistant Treasurer |
| Since 2004 | Since 2007 |
| Director of Fund Administration Services, |
| Steven D. Krichmar (Born 1958) | Putnam Investments and Putnam Management |
| Vice President and Principal Financial Officer | |
| Since 2002 | Susan G. Malloy (Born 1957) |
| Chief of Operations, Putnam Investments and | Vice President and Assistant Treasurer |
| Putnam Management | Since 2007 |
| Director of Accounting & Control Services, |
| Robert T. Burns (Born 1961) | Putnam Investments and Putnam Management |
| Vice President and Chief Legal Officer | |
| Since 2011 | James P. Pappas (Born 1953) |
| General Counsel, Putnam Investments, Putnam | Vice President |
| Management, and Putnam Retail Management | Since 2004 |
| Director of Trustee Relations, |
| James F. Clark (Born 1974) | Putnam Investments and Putnam Management |
| Vice President and Chief Compliance Officer | |
| Since 2016 | Mark C. Trenchard (Born 1962) |
| Chief Compliance Officer, Putnam Investments | Vice President and BSA Compliance Officer |
| and Putnam Management | Since 2002 |
| Director of Operational Compliance, |
| Michael J. Higgins (Born 1976) | Putnam Investments and Putnam |
| Vice President, Treasurer, and Clerk | Retail Management |
| Since 2010 | |
| Manager of Finance, Dunkin’ Brands (2008– | Nancy E. Florek (Born 1957) |
| 2010); Senior Financial Analyst, Old Mutual Asset | Vice President, Director of Proxy Voting |
| Management (2007–2008); Senior Financial | and Corporate Governance, Assistant Clerk, |
| Analyst, Putnam Investments (1999–2007) | and Associate Treasurer |
| | Since 2000 |
The principal occupations of the officers for the past five years have been with the employers as shown above, although in some cases they have held different positions with such employers. The address of each officer is One Post Office Square, Boston, MA 02109.
Putnam family of funds
The following is a list of Putnam’s open-end mutual funds offered to the public. Investors should carefully consider the investment objective, risks, charges, and expenses of a fund before investing. For a prospectus, or a summary prospectus if available, containing this and other information for any Putnam fund or product, contact your financial advisor or call Putnam Investor Services at 1-800-225-1581. Please read the prospectus carefully before investing.
| |
| Growth | International Value Fund |
| Growth Opportunities Fund | Multi-Cap Value Fund |
| International Growth Fund | Small Cap Value Fund |
| Multi-Cap Growth Fund | |
| Small Cap Growth Fund | Income |
| Voyager Fund | American Government Income Fund |
| Diversified Income Trust |
| Blend | Emerging Markets Income Fund |
| Asia Pacific Equity Fund | Floating Rate Income Fund |
| Capital Opportunities Fund | Global Income Trust |
| Capital Spectrum Fund | Government Money Market Fund* |
| Emerging Markets Equity Fund | High Yield Advantage Fund |
| Equity Spectrum Fund | High Yield Trust |
| Europe Equity Fund | Income Fund |
| Global Equity Fund | Money Market Fund* |
| International Capital Opportunities Fund | Short Duration Income Fund |
| International Equity Fund | U.S. Government Income Trust |
| Investors Fund | |
| Low Volatility Equity Fund | Tax-free Income |
| Multi-Cap Core Fund | AMT-Free Municipal Fund |
| Research Fund | Intermediate-Term Municipal Income Fund |
| Strategic Volatility Equity Fund | Short-Term Municipal Income Fund |
| Tax Exempt Income Fund |
| Value | Tax-Free High Yield Fund |
| Convertible Securities Fund | |
| Equity Income Fund | State tax-free income funds†: |
| Global Dividend Fund | Arizona, California, Massachusetts, Michigan, |
| The Putnam Fund for Growth and Income | Minnesota, New Jersey, New York, Ohio, |
| and Pennsylvania. |
| |
| Absolute Return | Retirement Income Lifestyle Funds — |
| Absolute Return 100 Fund® | portfolios with managed allocations to |
| Absolute Return 300 Fund® | stocks, bonds, and money market |
| Absolute Return 500 Fund® | investments to generate retirement income. |
| Absolute Return 700 Fund® | |
| Retirement Income Fund Lifestyle 1 |
| Global Sector | Retirement Income Fund Lifestyle 2 |
| Global Consumer Fund | Retirement Income Fund Lifestyle 3 |
| Global Energy Fund | |
| Global Financials Fund | RetirementReady® Funds — portfolios with |
| Global Health Care Fund | adjusting allocations to stocks, bonds, and |
| Global Industrials Fund | money market instruments, becoming more |
| Global Natural Resources Fund | conservative over time. |
| Global Sector Fund | |
| Global Technology Fund | RetirementReady® 2060 Fund |
| Global Telecommunications Fund | RetirementReady® 2055 Fund |
| Global Utilities Fund | RetirementReady® 2050 Fund |
| | RetirementReady® 2045 Fund |
| Asset Allocation | RetirementReady® 2040 Fund |
| George Putnam Balanced Fund | RetirementReady® 2035 Fund |
| RetirementReady® 2030 Fund |
| Global Asset Allocation Funds — four | RetirementReady® 2025 Fund |
| investment portfolios that spread your | RetirementReady® 2020 Fund |
| money across a variety of stocks, bonds, and | |
| money market instruments. | |
| | |
| Dynamic Asset Allocation Balanced Fund | |
| Dynamic Asset Allocation Conservative Fund | |
| Dynamic Asset Allocation Growth Fund | |
| Dynamic Risk Allocation Fund | |
* An investment in a money market fund is not insured or guaranteed by the Federal Deposit Insurance Corporation or any other government agency. Although the fund seeks to preserve the value of your investment at $1.00 per share, it is possible to lose money by investing in the fund.
† Not available in all states.
Check your account balances and the most recent month-end performance in the Individual Investors section at putnam.com.
Services for shareholders
Investor services
Systematic investment plan Tell us how much you wish to invest regularly — weekly, semimonthly, or monthly — and the amount you choose will be transferred automatically from your checking or savings account. There’s no additional fee for this service, and you can suspend it at any time. This plan may be a great way to save for college expenses or to plan for your retirement.
Please note that regular investing does not guarantee a profit or protect against loss in a declining market. Before arranging a systematic investment plan, consider your financial ability to continue making purchases in periods when prices are low.
Systematic exchange You can make regular transfers from one Putnam fund to another Putnam fund. There are no additional fees for this service, and you can cancel or change your options at any time.
Dividends PLUS You can choose to have the dividend distributions from one of your Putnam funds automatically reinvested in another Putnam fund at no additional charge.
Free exchange privilege You can exchange money between Putnam funds free of charge, as long as they are the same class of shares. A signature guarantee is required if you are exchanging more than $500,000. The fund reserves the right to revise or terminate the exchange privilege.
Reinstatement privilege If you’ve sold Putnam shares or received a check for a dividend or capital gain, you may reinvest the proceeds with Putnam within 90 days of the transaction and they will be reinvested at the fund’s current net asset value — with no sales charge. However, reinstatement of class B shares may have special tax consequences. Ask your financial or tax representative for details.
Check-writing service You have ready access to many Putnam accounts. It’s as simple as writing a check, and there are no special fees or service charges. For more information about the check-writing service, call Putnam or visit our website.
Dollar cost averaging When you’re investing for long-term goals, it’s time, not timing, that counts. Investing on a systematic basis is a better strategy than trying to figure out when the markets will go up or down. This means investing the same amount of money regularly over a long period. This method of investing is called dollar cost averaging. When a fund’s share price declines, your investment dollars buy more shares at lower prices. When it increases, they buy fewer shares. Over time, you will pay a lower average price per share.
For more information
Visit the Individual Investors section at putnam.com A secure section of our website contains complete information on your account, including balances and transactions, updated daily. You may also conduct transactions, such as exchanges, additional investments, and address changes. Log on today to get your password.
Call us toll free at 1-800-225-1581 Ask a helpful Putnam representative or your financial advisor for details about any of these or other services, or see your prospectus.
Fund information
Founded over 75 years ago, Putnam Investments was built around the concept that a balance between risk and reward is the hallmark of a well-rounded financial program. We manage over 100 funds across income, value, blend, growth, asset allocation, absolute return, and global sector categories.
| | |
| Investment Manager | Trustees | James F. Clark |
| Putnam Investment | Jameson A. Baxter, Chair | Vice President and |
| Management, LLC | Kenneth R. Leibler, Vice Chair | Chief Compliance Officer |
| One Post Office Square | Liaquat Ahamed | |
| Boston, MA 02109 | Ravi Akhoury | Michael J. Higgins |
| | Barbara M. Baumann | Vice President, Treasurer, |
| Investment Sub-Advisor | Robert J. Darretta | and Clerk |
| Putnam Investments Limited | Katinka Domotorffy | |
| 57–59 St James’s Street | John A. Hill | Janet C. Smith |
| London, England SW1A 1LD | Paul L. Joskow | Vice President, |
| Robert E. Patterson | Principal Accounting Officer, |
| Marketing Services | George Putnam, III | and Assistant Treasurer |
| Putnam Retail Management | Robert L. Reynolds | |
| One Post Office Square | W. Thomas Stephens | Susan G. Malloy |
| Boston, MA 02109 | | Vice President and |
| | Officers | Assistant Treasurer |
| Custodian | Robert L. Reynolds | |
| State Street Bank | President | James P. Pappas |
| and Trust Company | | Vice President |
| | Jonathan S. Horwitz | |
| Legal Counsel | Executive Vice President, | Mark C. Trenchard |
| Ropes & Gray LLP | Principal Executive Officer, and | Vice President and |
| Compliance Liaison | BSA Compliance Officer |
| Independent Registered | | |
| Public Accounting Firm | Steven D. Krichmar | Nancy E. Florek |
| KPMG LLP | Vice President and | Vice President, Director of |
| Principal Financial Officer | Proxy Voting and Corporate |
| | | Governance, Assistant Clerk, |
| | Robert T. Burns | and Associate Treasurer |
| | Vice President and | |
| | Chief Legal Officer | |
This report is for the information of shareholders of Putnam High Yield Trust. It may also be used as sales literature when preceded or accompanied by the current prospectus, the most recent copy of Putnam’s Quarterly Performance Summary, and Putnam’s Quarterly Ranking Summary. For more recent performance, please visit putnam.com. Investors should carefully consider the investment objectives, risks, charges, and expenses of a fund, which are described in its prospectus. For this and other information or to request a prospectus or summary prospectus, call 1-800-225-1581 toll free. Please read the prospectus carefully before investing. The fund’s Statement of Additional Information contains additional information about the fund’s Trustees and is available without charge upon request by calling 1-800-225-1581.

| |
| (a) The fund's principal executive, financial and accounting officers are employees of Putnam Investment Management, LLC, the Fund's investment manager. As such they are subject to a comprehensive Code of Ethics adopted and administered by Putnam Investments which is designed to protect the interests of the firm and its clients. The Fund has adopted a Code of Ethics which incorporates the Code of Ethics of Putnam Investments with respect to all of its officers and Trustees who are employees of Putnam Investment Management, LLC. For this reason, the Fund has not adopted a separate code of ethics governing its principal executive, financial and accounting officers. |
| |
| (c) In November 2015, the Code of Ethics of Putnam Investment Management, LLC was amended. The key changes to the Code of Ethics are as follows: (i) Non-Access Persons are no longer required to pre-clear their trades, (ii) a new provision governing conflicts of interest has been added, (iii) modifying certain provisions of the pre-clearance requirements, Contra-Trading Rule and 60-Day Short-Term Rule, (iv) modifying and adding language relating to reporting of unethical or illegal acts, including anti-retaliation provision, and (v) certain other changes. |
| |
| Item 3. Audit Committee Financial Expert: |
| |
| The Funds' Audit, Compliance and Distributions Committee is comprised solely of Trustees who are “independent” (as such term has been defined by the Securities and Exchange Commission (“SEC”) in regulations implementing Section 407 of the Sarbanes-Oxley Act (the “Regulations”)). The Trustees believe that each of the members of the Audit, Compliance and Distributions Committee also possess a combination of knowledge and experience with respect to financial accounting matters, as well as other attributes, that qualify them for service on the Committee. In addition, the Trustees have determined that each of Mr. Darretta, Mr. Patterson, Mr. Hill, and Ms. Baumann qualifies as an “audit committee financial expert” (as such term has been defined by the Regulations) based on their review of his or her pertinent experience and education. The SEC has stated, and the funds' amended and restated agreement and Declaration of Trust provides, that the designation or identification of a person as an audit committee financial expert pursuant to this Item 3 of Form N-CSR does not impose on such person any duties, obligations or liability that are greater than the duties, obligations and liability imposed on such person as a member of the Audit, Compliance and Distribution Committee and the Board of Trustees in the absence of such designation or identification. |
| |
| Item 4. Principal Accountant Fees and Services: |
| |
| The following table presents fees billed in each of the last two fiscal years for services rendered to the fund by the fund's independent auditor: |
| | | | | |
| Fiscal year ended | Audit Fees | Audit-Related Fees | Tax Fees | All Other Fees |
|
|
| | | | | |
| August 31, 2016 | $86,194 | $ — | $7,000 | $ — |
| August 31, 2015 | $83,626 | $ — | $6,750 | $ — |
| |
| For the fiscal years ended August 31, 2016 and August 31, 2015, the fund's independent auditor billed aggregate non-audit fees in the amounts of $7,000 and $6,750 respectively, to the fund, Putnam Management and any entity controlling, controlled by or under common control with Putnam Management that provides ongoing services to the fund. |
| |
| Audit Fees represent fees billed for the fund's last two fiscal years relating to the audit and review of the financial statements included in annual reports and registration statements, and other services that are normally provided in connection with statutory and regulatory filings or engagements. |
| |
| Audit-Related Fees represent fees billed in the fund's last two fiscal years for services traditionally performed by the fund's auditor, including accounting consultation for proposed transactions or concerning financial accounting and reporting standards and other audit or attest services not required by statute or regulation. |
| |
| Tax Fees represent fees billed in the fund's last two fiscal years for tax compliance, tax planning and tax advice services. Tax planning and tax advice services include assistance with tax audits, employee benefit plans and requests for rulings or technical advice from taxing authorities. |
| |
| Pre-Approval Policies of the Audit, Compliance and Distributions Committee. The Audit, Compliance and Distributions Committee of the Putnam funds has determined that, as a matter of policy, all work performed for the funds by the funds' independent auditors will be pre-approved by the Committee itself and thus will generally not be subject to pre-approval procedures. |
| |
| The Audit, Compliance and Distributions Committee also has adopted a policy to pre-approve the engagement by Putnam Management and certain of its affiliates of the funds' independent auditors, even in circumstances where pre-approval is not required by applicable law. Any such requests by Putnam Management or certain of its affiliates are typically submitted in writing to the Committee and explain, among other things, the nature of the proposed engagement, the estimated fees, and why this work should be performed by that particular audit firm as opposed to another one. In reviewing such requests, the Committee considers, among other things, whether the provision of such services by the audit firm are compatible with the independence of the audit firm. |
| |
| The following table presents fees billed by the fund's independent auditor for services required to be approved pursuant to paragraph (c)(7)(ii) of Rule 2-01 of Regulation S-X. |
| | | | | |
| Fiscal year ended | Audit-Related Fees | Tax Fees | All Other Fees | Total Non-Audit Fees |
|
|
| | | | | |
| August 31, 2016 | $ — | $ — | $ — | $ — |
| | | | | |
| August 31, 2015 | $ — | $ — | $ — | $ — |
| |
| Item 5. Audit Committee of Listed Registrants |
| |
| Item 6. Schedule of Investments: |
| |
| The registrant's schedule of investments in unaffiliated issuers is included in the report to shareholders in Item 1 above. |
| |
| Item 7. Disclosure of Proxy Voting Policies and Procedures For Closed-End Management Investment Companies: |
| |
| Item 8. Portfolio Managers of Closed-End Investment Companies |
| |
| Item 9. Purchases of Equity Securities by Closed-End Management Investment Companies and Affiliated Purchasers: |
| |
| Item 10. Submission of Matters to a Vote of Security Holders: |
| |
| Item 11. Controls and Procedures: |
| |
| (a) The registrant's principal executive officer and principal financial officer have concluded, based on their evaluation of the effectiveness of the design and operation of the registrant's disclosure controls and procedures as of a date within 90 days of the filing date of this report, that the design and operation of such procedures are generally effective to provide reasonable assurance that information required to be disclosed by the registrant in this report is recorded, processed, summarized and reported within the time periods specified in the Commission's rules and forms. |
| |
| (b) Changes in internal control over financial reporting: Not applicable |
| |
| (a)(1) The Code of Ethics of The Putnam Funds, which incorporates the Code of Ethics of Putnam Investments, is filed herewith. |
| |
| (a)(2) Separate certifications for the principal executive officer and principal financial officer of the registrant as required by Rule 30a-2(a) under the Investment Company Act of 1940, as amended, are filed herewith. |
| |
| (b) The certifications required by Rule 30a-2(b) under the Investment Company Act of 1940, as amended, are filed herewith. |
| |
| Pursuant to the requirements of the Securities Exchange Act of 1934 and the Investment Company Act of 1940, the registrant has duly caused this report to be signed on its behalf by the undersigned, thereunto duly authorized. |
| |
| By (Signature and Title): |
| |
| /s/ Janet C. Smith
Janet C. Smith
Principal Accounting Officer
|
| |
| Pursuant to the requirements of the Securities Exchange Act of 1934 and the Investment Company Act of 1940, this report has been signed below by the following persons on behalf of the registrant and in the capacities and on the dates indicated. |
| |
| By (Signature and Title): |
| |
| /s/ Jonathan S. Horwitz
Jonathan S. Horwitz
Principal Executive Officer
|
| |
| By (Signature and Title): |
| |
| /s/S teven D. Krichmar
Steven D. Krichmar
Principal Financial Officer
|