QuickLinks -- Click here to rapidly navigate through this document
Exhibit 99.c
1
Budget Statement
Economic and budget policy guidelines

1.1 Responsibility for Sweden in unsettled times
The international situation has been marked for some considerable time by a lack of confidence and economic downturn. The war in Iraq has exacerbated the uncertainties. Its consequences—for the people of Iraq and democracy in that country, and for the international economy—have yet to be revealed. It is important that we continue to work for peace and security internationally, in accordance with the principles of the United Nations.
All countries are affected by the unstable situation. In Sweden and in the world around us, banks and financial institutions are downgrading their growth forecasts. Companies and investors are playing a waiting game. Consumers are holding back. Growth and employment are suffering. The public finances are coming under strain.
Yet in international terms, the Swedish economy still remains strong. By comparison with other European countries, employment and growth rates are high and unemployment low. Sweden is one of the few countries that has a surplus in its public finances. This is because we in Sweden made sure to secure safety margins in time. So as not to be obliged to make big savings during future economic downturns, the Government and Riksdag set targets for public finances surpluses and introduced expenditure ceilings. Now, when the decline has become prolonged, it is obvious how important this was.
The successes of recent years—a strong economy, a high rate of growth and low unemployment—constitute a good foundation for aggressive policies for welfare, employment and sustainable development. In spite of the downturn, it has been possible to implement a series of reforms that will enter into effect this year and next. More resources are being allocated to health care and dental care. Parental insurance is being enhanced, the system of maximum charges has been brought in as has universal pre-school for 4 and 5-year-olds. The municipalities are being given extra resources to employ more teachers and other specialist staff in schools. Pensions are being improved and the upper secondary study grant is being extended by a month. The expansion of higher education and investments in research are continuing. Environmental appropriations are going up. Housing construction will be stimulated.
These reforms are important for Sweden's development and competitiveness so they remain firm commitments. In addition, two tasks that are crucial to future growth and welfare will require major investments: to create a more humane working life where fewer people become sick, and to open up the labour market to new Swedes. These are tasks that will require resources, a long-term approach and broad cooperation.
Yet the harsher economic climate calls for caution as well. We need to cut our expenses. Healthy public finances are the foundation for welfare and employment. This foundation is the last thing that should be put at risk in times of great uncertainty. The economic policy objectives must remain firm and the expenditure ceilings must be kept. This is why the Government and the parties cooperating with us are proposing expenditure cuts.
The aim is to create good conditions for a rapid recovery of growth in Sweden when the international downturn ends. Thus, the Government is proposing measures to enhance conditions for growth, restrain joblessness and increase the employment rate. Work and growth lay the foundation for welfare. Hence, a strong basis is being ensured for forward-looking policies to promote welfare and full employment. Sound public finances, stable prices and efficient wage formation are essential conditions for achieving our objectives.
Since 1994 growth in Sweden has been higher than both the OECD and the EU average. Sweden's public finances are currently among the strongest in the EU. Inflation is low, and unemployment and
3
the need for social assistance have declined. The employment rate is among the highest in the whole of the EU. Sweden is also the leading EU country in terms of economic reforms.
The election in autumn 2002 resulted in an agreement between the Swedish Social Democratic Party, the Left Party and the Green Party on 121 points for a more secure, fairer and greener Sweden. This agreement made it clear that our common policy for Sweden is based on our conviction that the ecological, social and economic dimensions must be interwoven so as to generate sustainable development that is good for Sweden. We want, together, to work on the basis of clearly formulated policies for a green, gender-equal welfare society, where sustainable growth, full employment and secure welfare are advanced by technological development, modernisation, broad participation and reduced disparities.
Our policies must be characterised by order and responsibility. In unsettled times clearly stated priorities are more urgently required, but so, above all, is a common assumption of responsibility. The Government and the parties cooperating with us are prepared to shoulder this responsibility. Broad cooperation is the best environment for Sweden's development. Our responsibility lies with our country, but also extends to the world around us, on which we are so dependent.
Forms for cooperation
The Spring Fiscal Policy Bill is based on an agreement between the Social Democratic Government, the Left Party and the Green Party, which jointly endorse the guidelines for economic policy, budget policy and the supplementary budget for 2003.
1.2 The state of the economy
1.2.1 International developments
The international economy is marked by uncertainty. Growth has been weaker than expected and remains so. The war in Iraq and the further course of events there will have a crucial effect on economic developments.
In the euro zone, the trend for household consumption and business investment has been subdued. Unemployment has continued up. A number of countries are facing strained public finances and may have difficulty living up to the demands of the EU's Stability and Growth Pact this year. No upturn is expected in the euro zone economy before the end of this year, at the earliest. Since the euro zone accounts for some 40 per cent of total Swedish exports, the weak trend will have an adverse impact on Sweden's economy.
Developments in the United States appear highly uncertain. The latest statistics suggest a certain slackening of household consumption. In Japan the prospects for growth remain dim and the situation is still precarious.
1.2.2 The outlook for Sweden
Like other countries, Sweden is feeling the effects of the international economic downturn. Growth is forecast to be just 1.4 per cent this year, rising to 2.4 per cent in 2004.
4
Table 1.1 GDP growth in Sweden and other countries
Percentage change
| | 1999 | 2000 | 2001 | 2002 | ||||
|---|---|---|---|---|---|---|---|---|
| Sweden | 4.6 | 4.4 | 1.1 | 1.9 | ||||
| United States | 4.1 | 3.8 | 0.3 | 2.4 | ||||
| Japan | 0.2 | 2.8 | 0.4 | 0.3 | ||||
| EU | 2.8 | 3.5 | 1.6 | 1.0 | ||||
| OECD | 3.2 | 3.9 | 0.8 | 1.8 |
Sources: National sources, Ministry of Finance.
Table 1.2 Balance of resources
| | | SEK bn | Volume change in per cent | |||||
|---|---|---|---|---|---|---|---|---|
| | 2002 | 2002 | 2003 | 2004 | ||||
| Household consumption expenditure | 1139 | 1.3 | 1.9 | 2.2 | ||||
| Public sector consumption expenditure | 656 | 2.1 | 0.5 | 0.2 | ||||
| Gross fixed capital formation | 400 | -2.5 | -0.5 | 2.9 | ||||
| Stocks(1) | 4 | -0.1 | 0.2 | 0.0 | ||||
| Exports | 1012 | 0.4 | 2.3 | 7.0 | ||||
| Imports | 871 | -2.7 | 2.3 | 6.0 | ||||
| GDP | 2340 | 1.9 | 1.4 | 2.4 | ||||
- (1)
- Contribution to GDP growth.
Sources: Statistics Sweden, Ministry of Finance.
The weakness of international demand has obvious repercussions for Swedish exports. Despite some improvement in recent months, new export orders remain weak. Demand for Swedish investment goods, however, is expected to pick up gradually in the course of the year as international recovery begins. Imports to Sweden are expected to increase this year when stock liquidation is completed and demand in the economy begins to grow.
The international downturn is restraining household demand. Nevertheless, demand is forecast to grow this year on aggregate, partly because the economic position of households remains strong and interest rates low. A gradual diminishing of uncertainty about the economic situation in the world around—and hence also in Sweden—is expected to contribute to increasing household demand.
In consequence of a previous substantial expansion of capacity and a lower rate of growth in production, business investments are expected to continue weak this year as well.
5
Table 1.3 Key indicators
Annual percentage change, unless otherwise indicated
| | 2002 | 2003 | 2004 | |||
|---|---|---|---|---|---|---|
| CPI(1) | 2.4 | 2.4 | 1.8 | |||
| Hourly wage | 4.0 | 3.5 | 3.5 | |||
| Open unemployment(2) | 4.0 | 4.5 | 4.3 | |||
| Labour market programmes(2) | 2.6 | 2.2 | 2.0 | |||
| Number of persons employed | 0.1 | -0.3 | 0.3 | |||
| Real disposable income(3) | 4.7 | 1.7 | 1.4 | |||
| Household net saving ratio, level(4) | 2.8 | 2.6 | 1.9 | |||
| Balance on current account(3) | 4.2 | 4.3 | 4.1 | |||
| German 10-year government bond rate(1) | 4.8 | 4.3 | 5.0 | |||
| Swedish 10-year government bond rate(1) | 5.3 | 4.9 | 5.4 | |||
| TCW index(1) | 133.7 | 128.8 | 127 |
(1)- Annual average.
- (2)
- Per cent of labour force.
- (3)
- Per cent of GDP.
- (4)
- Excluding savings in occupational pension schemes.
Sources: Statistics Sweden, National Labour Market Board, National Mediation Office, Riksbank and Ministry of Finance.
Table 1.4 Employment, unemployment and wage growth
| | 1995 | 1996 | 1997 | 1998 | 1999 | 2000 | 2001 | 2002 | 2003 | 2004 | |||||||||||
|---|---|---|---|---|---|---|---|---|---|---|---|---|---|---|---|---|---|---|---|---|---|
| Number of persons employed(1) | 3986 | 3963 | 3922 | 3979 | 4069 | 4159 | 4239 | 4244 | 4232 | 4247 | |||||||||||
| of whom in private sector(1) | 2697 | 2698 | 2695 | 2735 | 2805 | 2888 | 2969 | 2960 | — | — | |||||||||||
| of whom in public sector(1) | 1287 | 1263 | 1223 | 1240 | 1260 | 1264 | 1262 | 1278 | — | — | |||||||||||
| Regular employment ratio(2) | 74.9 | 74.7 | 73.9 | 74.6 | 75.9 | 77.2 | 78.2 | 78.1 | 77.6 | 77.6 | |||||||||||
| Open unemployment(3) | 7.7 | 8.1 | 8.0 | 6.5 | 5.6 | 4.7 | 4.0 | 4.0 | 4.5 | 4.3 | |||||||||||
| Cyclically dependent labour market programmes(3) | 4.6 | 4.7 | 4.5 | 4.1 | 3.3 | 2.6 | 2.5 | 2.6 | 2.2 | 2.0 | |||||||||||
| Hourly wage(4) | 3.3 | 6.0 | 4.5 | 3.8 | 3.4 | 3.7 | 4.3 | 4.0 | 3.5 | 3.5 | |||||||||||
| Productivity growth, private sector(4) | 3.6 | 1.9 | 5.2 | 2.0 | 2.6 | 4.1 | 0.6 | 4.2 | 2.6 | 2.3 | |||||||||||
Note: In LFS, Church of Sweden employees were not transferred from the local authority sector to the private services employed in the public sector is overestimated by approximately 22 000 in 2000.
- (1)
- In thousands.
- (2)
- Population aged 20-64 in regular employment as a percentage of total population in the age group.
- (3)
- In per cent of the labour force.
- (4)
- Annual percentage change.
Sources: Statistics Sweden, National Labour Market Board, National Mediation Office and Ministry of Finance.
6
Table 1.5 Employment and unemployment disaggregated by sex
| | 1998 | 1999 | 2000 | 2001 | 2002 | ||||||||||||||||
|---|---|---|---|---|---|---|---|---|---|---|---|---|---|---|---|---|---|---|---|---|---|
| | Women | Men | Women | Men | Women | Men | Women | Men | Women | Men | |||||||||||
| Number of persons employed(1) | 1901 | 2079 | 1947 | 2121 | 1992 | 2167 | 2036 | 2203 | 2047 | 2197 | |||||||||||
| of whom in private sector(1) | 967 | 1768 | 997 | 1808 | 1037 | 1852 | 1080 | 1891 | 1080 | 1879 | |||||||||||
| of whom in public sector(1) | 932 | 308 | 949 | 311 | 953 | 312 | 954 | 307 | 965 | 314 | |||||||||||
| Open unemployment(2) | 6.0 | 6.9 | 5.2 | 5.9 | 4.3 | 5.0 | 3.6 | 4.3 | 3.6 | 4.4 | |||||||||||
Note: In LFS, Church of Sweden employees were not transferred from the local authority sector to the private services sector until 2001. As a result, the number of people employed in the public sector is overestimated by approximately 22 000 in 2000.
- (1)
- In thousands.
- (2)
- In per cent of the labour force.
Source: Statistics Sweden.
The municipal sector
Municipal consumption underwent strong growth in 2001 and 2002, while the rise in employment lost momentum and the tax base grew rather more slowly than in previous years as a result. The figures for 2002 indicate a decline in the number of municipal and county councils with positive results. Tax increases averaging SEK 0.65 per SEK 100 in 2003 (corresponding to SEK 8.5 billion in increased tax revenues) and the extension of the temporary employment support system in 2004 have helped improve the finances of the local government sector.
Since 2000 local authorities have been required to balance their budgets. Each generation must bear the costs of the services it approves and consumes. The demographic development makes great demands on local authorities to use resources efficiently, so as to sustain welfare in the future. An inquiry has been undertaken and proposals presented regarding the balanced budget requirement. The matter is currently being processed by the Government Offices.
In order to support local authorities in a particularly vulnerable position, the Government has entered into agreements with 36 municipalities and four county councils on economic help aimed at bringing about a reorganisation of activities and achieving a balanced economy. These measures have proved highly effective.
In the long term, low unemployment and high numbers of people in work are vital to the prospects of local authorities managing to maintain welfare in the long run.
The labour market
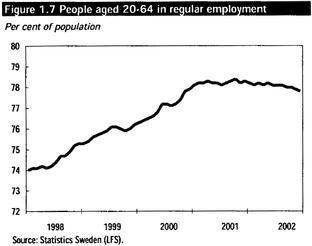
Between 1997 and 2002 the number of people in work rose by approximately 320 000. The bulk of this increase came in the private sector, where the number of people employed climbed by some 260 000. Open unemployment has hovered around the four per cent mark since the end of 2000.
The relatively weak growth this year and last is having an adverse effect on the labour market. Open unemployment is forecast to rise this year to an annual average of 4.5 per cent. Next year, however, unemployment is expected to decline as the employment figures increase again. The proportion of people aged 20 to 64 in regular employment is predicted to be 77.6 per cent in 2004.
7
Medium-range outlook
Cyclical fluctuations are hard to predict in the years after 2004. No forecast is therefore made regarding the state of the economy. A projection is, however, presented.
The calculations are based on an assumption that there will be unexploited resources at the end of 2004 that can be taken into use without inflationary bottlenecks arising in the Swedish economy. GDP growth is thus slightly higher than the long-term trend in 2005 and 2006.
The trend for employment is good and open unemployment falls to 3.8 per cent in 2006. Although the population aged 20 to 64 will increase, it is mostly age groups with relatively low labour force participation and low employment rates that will grow larger. Consequently, the rate of regular employment in the 20-64 age bracket will not change markedly in the years up to 2006.
Table 1.6 Medium-term projection
| | 2002 | 2003 | 2004 | 2005 | 2006 | |||||
|---|---|---|---|---|---|---|---|---|---|---|
| GDP growth | 1.9 | 1.4 | 2.4 | 2.6 | 2.5 | |||||
| Rate of regular employment(1) | 78.1 | 77.6 | 77.6 | 77.7 | 77.8 | |||||
| Government saving | 1.1 | 0.4 | 1.0 | 1.4 | 2.1 |
- (1)
- Percentage of population aged 20-64 in regular employment.
1.3 Fiscal policy
The aim of the fiscal policy is to maintain surpluses in the public finances. There are several reasons for this objective.
- —
- The proportion of elderly people in the population will grow substantially in future. This will mean higher costs for pensions, health and social care, while revenues will grow more slowly since the working population is likely to decline relative to the total population. To prepare Sweden for this situation, public debt should be reduced.
- —
- Those who are dependent on welfare must be able to feel confident that it will continue to function even in harder times when it is needed most. Without strong public finances, there is a risk that every economic downturn will force major cutbacks that will diminish public confidence and undermine the will to pay for welfare when times are good.
- —
- To make it possible to pursue an active stabilisation policy without deficits becoming too large, a safety margin is required so that fiscal policy can help to moderate economic fluctuations.
There are two overall budget policy objectives: the public finances surplus target and the expenditure ceilings.
1.3.1 Surplus target for sound public finances
The surplus target entails that public finances are required to show a surplus of 2 per cent of GDP on average over a business cycle. This implies that a surplus of less than 2 per cent can be allowed in an economic slowdown, so as to help sustain private sector income levels and limit the downturn. Conversely, during an upswing in the business cycle, a larger surplus will restrain economic activity and reduce the risk of overheating. The surplus is adjusted to take into account the economic situation and the level of resource utilisation in the Swedish economy.
In the 2003 Budget Bill, the Government made the assessment that in the light of the economic situation and the level of resource utilisation in the economy, a surplus of 1.5 per cent of GDP in 2003 was compatible with the surplus target. However, if the economy developed less well than anticipated, a
8
smaller surplus would be acceptable. Compared with the forecast in the Budget Bill, 2003 growth has been revised downwards by more than 1 percentage point.
Since the target of a 2 per cent surplus over the business cycle began to apply in 2000, the annual surplus in the public finances has averaged 3 per cent of GDP. The estimated surplus in 2003 is 0.4 per cent of GDP. After the measures proposed in this bill, it is calculated that the average surplus for the period 2000 to 2006 will be 2.0 per cent. This means that public savings are in line with the overall target of a surplus of 2 per cent over an economic cycle.
Table 1.7 Public finances
Per cent of GDP
| | 2000 | 2001 | 2002 | 2003 | 2004 | 2005 | 2006 | |||||||
|---|---|---|---|---|---|---|---|---|---|---|---|---|---|---|
| Expenditure ratio | 54.8 | 54.4 | 55.8 | 56.4 | 55.5 | 54.7 | 53.9 | |||||||
| Revenue ratio | 58.2 | 59.0 | 56.8 | 56.8 | 56.5 | 56.1 | 56.1 | |||||||
| Tax ratio incl. EU contribution | 52.4 | 54.0 | 51.8 | 51.5 | 51.2 | 50.8 | 50.7 | |||||||
| Financial saving | 3.4 | 4.6 | 1.1 | 0.4 | 1.0 | 1.4 | 2.1 | |||||||
| Net debt | 1.3 | -3.5 | 2.5 | 1.2 | 0.2 | -1.0 | -3.1 | |||||||
| Consolidated gross debt | 52.9 | 54.4 | 52.4 | 51.0 | 50.0 | 48.4 | 46.4 |
Sources: Statistics Sweden, Ministry of Finance.
By international comparison, Sweden's public finances are strong. In 2002 Sweden had one of the largest public sector surpluses in the EU, while a number of large EU countries in contrast had substantial deficits to show. Sweden will continue to note surpluses in 2003 and 2004 while the EU countries as a whole will show deficits.
Table 1.8 Public sector financial savings in Sweden and other countries
Per cent of GDP
| | 2002 | 2003 | 2004 | |||
|---|---|---|---|---|---|---|
| Sweden | 1.1 | 0.4 | 1.0 | |||
| EU | -2.0 | -1.9 | -1.6 | |||
| Euro zone | -2.2 | -2.1 | -1.8 | |||
| Germany | -3.7 | -3.3 | -2.6 | |||
| France | -2.7 | -2.9 | -2.5 | |||
| Italy | -2.3 | -2.1 | -2.8 | |||
| Finland | 3.2 | 2.9 | 3.6 | |||
| UK | -1.4 | -1.4 | -1.3 | |||
| Denmark | 2.2 | 2.4 | 2.9 | |||
| USA | -3.1 | -3.0 | -2.7 | |||
| Japan | -7.9 | -7.7 | -7.8 |
Sources: OECD Economic Outlook 72, Dec. 2002, and Ministry of Finance.
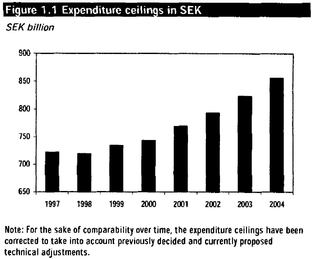
1.3.2 Expenditure ceilings
Expenditure ceilings play an instrumental role in guiding budget policy. The ceilings are set three years in advance. Central government expenditure is then not allowed to exceed these ceilings. The expenditure ceilings prevent the use of temporarily higher income to finance permanently higher expenditure.
9
On the whole, the system has functioned well and has helped maintain balance in the growth of expenditure during the good years, which in turn has enabled Sweden to face the international economic slowdown with strong public finances. A working party including representatives from the parties in cooperation is currently following up the Budget Act.
The expenditure ceilings have been met every year since their introduction in 1997.
The Government considers there is a risk of the expenditure ceilings for 2003 and 2004 being exceeded unless action is taken to prevent this. The Government therefore proposes a number of measures to rein in expenditure growth and make it possible to meet the ceilings for 2003 and 2004. One crucial component consists of the measures now proposed to reverse the trend towards increasing numbers of people on sick leave. In addition, certain reforms announced earlier will be postponed until later in this Government's term of office. Further, the Government intends to introduce restrictions on the expenditures allowed under certain appropriations. The Government is monitoring expenditure developments on an ongoing basis and will take additional measures if the expenditure ceilings come under threat. The expenditure ceilings must be met.
Table 1.9 Overall impact on expenditure of appropriation cuts and restrictions
SEK million
| Appropriation cuts | 2003 | 2004 | ||
|---|---|---|---|---|
| Sickness allowance to equal unemployment benefit | 300 | 600 | ||
| Delay in raising sickness insurance ceiling | 920 | 2 000 | ||
| New sickness insurance qualifying income | 565 | 1 140 | ||
| Longer period of sick pay | 669 | 1 338 | ||
| Delay in raising parental insurance ceiling | 395 | 865 | ||
| The partly unemployed | 550 | |||
| Exits from unemployment | 1 000 | |||
| Priority study grants | 126 | |||
| Education recruitment grants | 700 | |||
| Higher maximum child care charges | 240 | |||
| Culture | 92 | |||
| Environment | 150 | 315 | ||
| Infrastructure | 500 | 1 000 | ||
| Other appropriation cuts | 404 | 785 | ||
Expenditure restrictions | ||||
| Defence | 1 027 | 373 | ||
| Development assistance | 400 | -200 | ||
| Miscellaneous | 631 | -461 | ||
| Total impact on expenditure | 5 287 | 10 810 |
Defence equipment is one category of expenditure that will be postponed. Part of the increase in development assistance will be transferred from 2003 to 2004. As from 1 July, the regulations for sickness allowances will be changed to make compensation in the event of sickness equivalent to the compensation paid by unemployment insurance. This will mean that an unemployed person who is given a sickness certificate will no longer receive more compensation when sick than when healthy.
The higher ceiling in the sickness and parental insurance systems will be delayed. The contact days for which a temporary parent's allowance can be claimed will be eliminated. A number of measures are expected to result in less people on sick leave, which will mean lower expenditures. These include the
10
government bill that has already been presented on improvements in sick leave procedures (Gov. bill 2003/03:89); the proposals in this bill on changes in the calculation of qualifying income in the sickness insurance system; a more consistent application of the rules on moving from sickness allowance to sickness compensation; the proposal for a consistent application of the initial no-benefit day regulations; and upcoming proposals for a system of financial incentives for employers.
The regulations for unemployment benefits in the event of partial unemployment will be applied more consistently. Efficiency measures will be implemented in labour market policy with a view to promoting a speedier transition from unemployment to work.
Adults who have already completed three-year upper secondary education will no longer be eligible for the higher study grant for adult education. The financial framework available to local authorities for recruitment grants for adult education will shrink. The ceiling on maximum charges for child care will be raised in 2004, though the ceiling of 3 per cent of parental income will remain in place.
The introduction of free entry to museums will be postponed. Infrastructure investments will be delayed. The Government estimates that Sweden's EU contribution will be lowered by some SEK 900 million in 2003 as a result of the EU budget surplus in 2002.
A higher total in the municipal equalisation system, moreover, will entail an adjustment of SEK 3 billion in the expenditure ceiling in 2003.
In view of the short time available for planning between the Riksdag election and the 2003 Budget Bill, the Government did not present a proposed expenditure ceiling for 2005 in the autumn. The Government announced that it would return to the issue of expenditure ceilings for 2005 and 2006 in the Spring Fiscal Policy Bill instead.
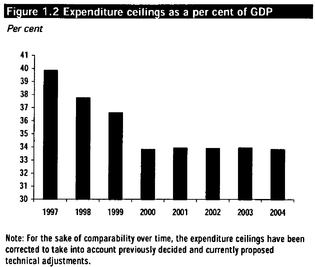
Since 2001 the expenditure ceiling has been set at levels that essentially mean the ceiling is constant as a percentage of GDP, given trend growth of about 2 per cent per year. The slight rise in the expenditure ceiling as a percentage of GDP between 2002 and 2003 reflects the relatively low growth rate this year. Growth next year is forecast to increase to over 2 per cent, which will result in a slight lowering of the expenditure ceiling expressed in terms of GDP.
Calculations of general government expenditure show that there is a risk that the demographic trend, with an ageing population, will lead the expenditure ratio to grow. The desirability of avoiding deficits and major expenditure cuts as the number of older citizens increases is an important argument for keeping expenditure rises in check and conducting policies to promote a higher rate of employment, which in turn will boost revenues.
If the expenditure ceilings are held technically constant as a proportion of GDP and growth is on trend, the expenditure ceiling would be SEK 890 billion for 2005 and SEK 927 billion for 2006. The Government intends to make its proposals for expenditure ceilings in 2005 and 2006 later, in the 2004 Budget Bill.
11
1.4 Prices and wages
1.4.1 Stable prices
Stable prices are a fundamental prerequisite for a successful economic policy. A high rate of inflation, particularly when difficult to foresee, has negative distributional effects. In addition, a high rate of inflation makes for poorer prospects of strong, sustained growth, and so also undermines the chances of a stable high rate of employment and welfare.
The overriding task of monetary policy has been defined by the Riksdag as price stability. The Riksbank, which conducts monetary policy as an independent institution, has defined price stability such that the increase in the consumer price index must be limited to 2 per cent, plus or minus 1 per cent. The Government supports the orientation of monetary policy and endorses the target for inflation.
Inflation is forecast to be high temporarily during the first six months of this year, partly because of higher oil and electricity prices. Lower inflationary pressure in Sweden and weaker import price growth will lead inflation gradually to fall back to approximately 2 per cent, i.e. close to the target set by the Riksbank, half way through the year. In the following years, inflation is expected to remain in line with the target.
In recent years monetary policy has been based on forecasts of UND1X for the coming two years. UND1X is a measure of inflation based on the consumer price index, but excluding the direct effects of
12
changes in interest rates, taxes and subsidies. This year UND1X inflation is forecast to be 2.6 per cent as an annual average. Next year UND1X inflation is expected to decline to 1.5 per cent.
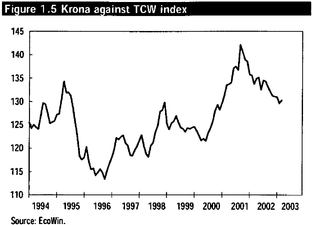
The interest rate and the krona
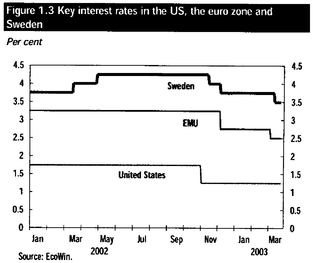
International interest rates have continued to fall. As a result of the uncertain state of the economy, world stock markets have continued to lose value. The expected upturn in the economy has been delayed and the outlook for corporate profits has weakened.
Several central banks have continued to lower their interest rates in 2002 and early 2003, in an attempt to bolster economic recovery. Towards the end of 2002 and at the beginning of 2003 interest rates have fallen particularly sharply in Europe. The Riksbank has lowered its key rate by 0.75 percentage points to 3.5 per cent.
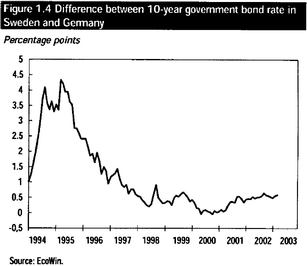
The krona has grown stronger since autumn 2001, particularly against the US dollar.
13
EMU
The introduction of euro notes and coins on 1 January 2002 was a historic and significant step in European integration. The euro is now a reality in large parts of Europe.
Sweden has elected not to participate in the currency union from the start. However, the Riksdag decided in 1997 that Sweden should keep the door open for entry at a later date and meanwhile see to it that the country is prepared for possible Swedish participation in the single currency.
The Riksdag has decided that a referendum on the introduction of the euro as Sweden's currency will be held on 14 September 2003. All parties have declared that they are prepared to respect the outcome of the referendum.
Participation in the European exchange rate cooperation, ERM2, is not being considered at the present time.
1.4.2 Wage formation
Efficient wage formation is of crucial importance for sustaining the satisfactory development of the national economy. Wage increases within the given national economic parameters make for lower unemployment and higher employment and production levels. Moderate nominal wage increases are essential if it is to be possible to meet the Government's target of 80 per cent of the population aged 20-64 in regular employment.
Between 1994 and 2001, real wages have gone up on average by 3 per cent per year. For the sake of comparison, in the 1980s they rose by less than 0.5 per cent. Nominal wage increases in the latter part of the 1990s, however, were only about half as high as in the 1980s.
The trend in recent years shows that moderate nominal wage increases and augmented responsibility on the part of the social partners create good conditions for low unemployment and healthy real wage growth.
In 2001 and 2002, however, nominal wages rose more rapidly than in previous years, despite the more subdued state of the economy and employment trends. In 2001 wage increases across the economy came to 4.3 per cent. This is higher than in the euro zone and the United States. Total wage increases are estimated to have been slightly more restrained last year, at about 4 per cent. Wage increases were slightly higher in the public sector than in the business sector.
Over the period 1996-2001, labour cost growth in the Swedish business sector has exceeded the EU average by about 1.5 percentage points per year, measured in the national currency. Despite this, Swedish competitiveness has been enhanced over the period due to strong productivity growth and the falling krona.
The Government assumes that the high rate of nominal wage growth witnessed in recent years will be adjusted downwards in future so as to avoid any weakening of Sweden's competitiveness. This is
14
vital in order to sustain the positive trend for the economy and to achieve the Government's employment target. It is also important that the wage formation process allows changes in relative wages, within the framework of the overall rate of wage increases that the economy can tolerate. For the sake of employment and welfare, it is of vital importance that the social partners demonstrate will and responsibility in coming collective negotiations.
Gender-related wage discrimination must be overcome. Women are paid 82 per cent of men's wages. Correcting for age, education, working hours and sector, the difference shrinks to give a figure of 92 per cent. The reasons for this disparity are complex. They include the value assigned to different types of work and the effects of segregation in the labour market, as well as direct wage discrimination.
The new Act concerning Equality between Men and Women is one instrument for evening out unjustified gender pay differentials. Wage formation is an issue that the social partners must address; unjustified pay differentials attributable to sex are an infringement of the law. The Government is monitoring action in this area via the Office of the Equal Opportunities Ombudsman and the National Mediation Office. The outcome of efforts made by the social partners in this area will determine the need for further measures, such as tougher legislation.
The Government intends to present an action plan for increased equality between women and men in the course of the year. The action plan is to propose means of ensuring that structural wage differentials between women and men diminish.
1.5 Jobs and growth—for welfare and justice
Since 1994 the Government has conducted a long-term policy to strengthen the prospects for economic growth in Sweden. This policy is based on macroeconomic policies to promote stability and sound public finances. A range of reforms has been carried out, aimed, among other things, at improving the functioning of the labour market and increasing competition in the economy. The average marginal effects on incomes from work have been lowered by five percentage points since 1999. Substantial investments are being made in education, research and the infrastructure.
The policies are having results. Over the period 1994-2002, GDP growth in Sweden has averaged 3.1 per cent per year. For comparison, the average annual growth rate for the EU countries has been 2.3 per cent. The Government's policies are intended to further strengthen Sweden's position.
The conditions are better than they have been for a long time. In Lisbon in 2000, the EU set the objective of becoming the most competitive and dynamic knowledge-based economy in the world, capable of sustainable economic growth with more and better jobs and greater social cohesion. Each year there is a follow-up of the different measures taken by the Member States in pursuit of these objectives, using comparisons of about 40 different indicators, such as employment, growth, inflation, price trends, etc.
The latest follow-up conducted by the European Commission shows that Sweden is the country that has most top-three ratings in the various comparisons. Sweden is held up as an example. The Commission draws attention to Sweden as a leader in terms of economic reforms, employment, the environment and research and innovation.
15

One important condition for a high growth rate is to increase understanding and dialogue between different parts of society. The best conditions for growth are achieved in a climate of understanding.
The prospects for growth and renewal in Sweden must be further reinforced during this term of office. Cooperation between the business sector, higher education and society will be stimulated at national and regional level. Entrepreneurship will be facilitated. Enterprise will be given better operating conditions. The flow of knowledge from research and development to the business sector will be eased. Sweden's research strengths and profile areas must be kept up and further developed. All of this presupposes close interplay between many policy areas.
1.5.1 Full employment
Full employment is at the top of the Government's agenda. A high employment rate and low unemployment are the cornerstones of welfare. The keys to enhancing social justice and gender equality are a high growth rate, rising numbers of people in work and fewer and fewer jobless. These conditions lead to increased resources, making it possible to extend welfare, step by step. In the autumn of 1998, the Government and Riksdag set the interim target that the proportion of the population aged 20-64 in regular employment should increase from 73.9 per cent in 1997 to 80 per cent in 2004.
In terms of both GDP growth and the number of people employed, developments have been more favourable since 1998 than was assumed when the employment target was set. The Government's assessment in 1998 was that annual growth of 2.75 per cent was needed, and that the number of people aged 20-64 in regular employment needed to increase by 1.3 per cent each year in order to reach the target of 80 per cent regular employment. These levels have been surpassed. From 1998 to 2002, GDP growth has averaged 3.1 per cent per year and regular employment in the 20-64 age group has increased by an average of 1.5 per cent per year.
16
In spite of the favourable trend, the chances of reaching the employment goal in 2004 have declined. Regular employment is forecast at 77.6 per cent in 2004. One major explanation lies in the repercussions of the weakened international economy in Sweden. Other factors include the rise in the number of students and the increase in net immigration since the target was set.
Efforts to reach the employment goal are continuing. The Government is now proposing a range of measures to promote increased employment and to give all groups better opportunities on the labour market. Efforts are focusing on the following groups:
Youth: At the beginning of the 1990s, 80 per cent of young people aged 20-24 were employed. The corresponding figure today is 60 per cent. The difference is largely due to the fact that more young people are continuing their education to higher levels, but the desire of young people to work and to combine work and studies needs to be harnessed more adequately.
- •
- Increase knowledge about the results and impact of programmes of higher education
Impact analyses give prospective students information about the effect different programmes of higher education have on employability. The Government intends to instruct the National Agency for Higher Education to conduct impact studies and to follow up and analyse the extent to which individuals subsequently become established on the labour market. - •
- Review the possibilities of granting credit for previous courses at university level
Sweden has ratified the Lisbon Convention, which means students are entitled to credit for courses taken previously as long as there are no substantial differences between the programmes involved. The Government intends to commission the National Agency for Higher Education to review procedures for granting credit for previous studies and to propose measures to facilitate this process. - •
- Speedier transition from upper secondary to higher education
In labour market terms, it is desirable for more young people to get out onto the market more quickly, assuming there is no concomitant loss of quality. Those who apply to university should be offered a place and complete their educational programme as soon as possible. The Government has appointed a special expert to examine ways of modifying university selection rules and admission procedures so as to reduce incentives for prospective students to take municipal adult education courses to obtain more competitive upper secondary grades.
- •
- The option of claiming higher study grants for refresher courses at upper secondary level will be eliminated
Future admission rules should be designed so as to avoid unnecessary upgrading of passing upper secondary grades. One basic issue for the expert will be to increase direct entry to higher education from upper secondary school. The Government intends to make proposals at a later point aimed at increasing the efficiency and effectiveness of the educational system.
17
Among adults studying at compulsory school and upper secondary school levels, there are two groups who are eligible for the higher study grant of 82 per cent in the study support system: students who lack leaving certificates from compulsory or three-year upper secondary school, and students repeating or supplementing subjects taken at these levels. The Government proposes that as from 2004, students who have completed three-year upper secondary education should no longer be eligible for the higher grant for refresher courses and supplementary courses at upper secondary level.
Immigrants: Immigrants represent a great potential resource that Sweden must use better. Between 1997 and 2002, the employment rate has risen more rapidly for immigrants than for people born in Sweden. Nevertheless, the gap in employment level between immigrants and native Swedes remains broad. In the 16-64 age group, the employment rate for people born outside Europe was barely 54 per cent in 2002, as against nearly 77 per cent for native Swedes.
- •
- Improved valuation of qualifications
Acknowledgement of previously acquired knowledge and abilities, whether formal or informal, leads to increased employability and better labour market matching. An improved validation system is important, not least to make it easier for immigrants to enter the labour market. The Government intends later to announce proposals for a temporary central government initiative to stimulate the development of effective and appropriate validation systems. - •
- Workplace experience to facilitate language learning
The chances of newly arrived immigrants mastering the Swedish language and obtaining work increase if language teaching is integrated with working life. Work experience opportunities build contacts in working life, provide work training and increase employability. In 2004, the Government intends to propose measures aimed at improving the integration of language learning and workplace experience. - •
- More effective Swedish instruction
Knowledge of the Swedish language is important if people born outside Sweden are to establish themselves on the labour market and participate in society. There is considerable variation between education providers in terms of educational quality and student throughput. In 2004 the Government intends to propose a reform of Swedish language instruction for immigrants. Such instruction will be regularly linked to studies in the local authority adult education system or higher education, work experience, employment or other activities.
The unemployed: The successful policies of recent years have kept unemployment steady at about four per cent despite the international economic slowdown. Nevertheless, 41 000 individuals were still enrolled long-term at employment offices in 2002. Most of these are participating in the activity guarantee programme.
- •
- Give priority to individuals furthest from the labour market
Recruitment incentives are an effective tool for bringing individuals into the labour market. Yet they also risk crowding out other jobseekers. The efficiency and legitimacy of recruitment incentives are affected by the number of recipients and by targeting the groups that are most removed from the labour market. The Government intends to review the recruitment incentives to enhance their efficiency and to give priority to those who have greatest difficulty in obtaining regular employment. - •
- Shortening periods of unemployment
Continued efforts are being made to consolidate the effects of changes in the unemployment insurance regulations. The Government intends to take several steps to make the application and supervision of the regulations affecting jobseekers entitled to unemployment benefits more effective. For example, the management of labour market policy will be improved, differences in the results achieved by the different regional divisions of the Swedish National Labour Market
18
- •
- More consistent application of regulations for the partly unemployed and inquiry into the right to full-time work
The Government intends to take steps to limit the costs of partial unemployment. The management of labour market policy will be improved, differences in the results achieved by the different regional divisions of the Swedish National Labour Market Administration will be followed up more thoroughly and the use of action plans by employment offices will be evaluated. The Government will follow developments closely and if necessary will implement additional measures within the framework of current legislation. A commission of inquiry will be appointed to study the possibility of introducing a right to full-time employment. - •
- Stimulate labour force participation
At present there are many people outside the labour market, for one reason or another. The reason may be, for example, that the employment office considers the person in question to be unemployable, or that the recruitment process excludes certain individuals with non-Swedish ethnic backgrounds. A further obstacle lies in the high marginal effects that people attempting to enter the labour market at present face. These marginal effects often arise in the interplay between the taxation and welfare systems. The Government accordingly intends to find an appropriate way to consider means of reducing the marginal effects associated with labour force entry.
Administration will be followed up more adequately and the use of action plans by employment offices will be evaluated.
The elderly: The proportion of elderly people in the population is growing. The 60-64 age bracket is the group that will experience most population growth in the near future. This is an age group that has a considerably lower employment rate than the average in the population as a whole.
- •
- Making it easier for elderly people to work
It has become apparent that a relatively large number of employers rarely or never recruit elderly people. The attitude of employers towards elderly employees is one of the reasons why it is difficult for elderly people who have left working life to re-enter the labour market. The Government is considering further measures.
The sick: The Government's objectives for sickness absence are designed to reduce individual suffering, give more people a chance to support themselves by their own work and bring down the costs to society. A lower incidence of sick leave and sickness compensation is also a prerequisite for high levels of employment. Each individual receiving sickness or activity compensation who returns to work represents a victory. In order to achieve high employment levels long-term, sick leave must diminish.
- •
- Reducing the number of people receiving sickness or activity compensation by making it easier to change jobs
Mobility in general leads to a more efficient labour market. The Government intends to analyse different factors that can generate locking-in effects. The purpose is to identify measures that will prevent working-age individuals disappearing from employment and the labour market, for example by being granted sickness or activity compensation. Such measures should be able to help ensure that fewer elderly employees leave working life prematurely. - •
- Recruitment incentives for individuals on long-term sick leave
A form of recruitment subsidy will be introduced to make it easier for individuals on long-term sick leave to begin working again by moving to another employer. The National Labour Market Board will be given the task of administering the subsidy, which is forecast to cover an average of 3 000 individuals.
The Government's approach to the issue of working hours is based on the belief that it is desirable to reduce working hours and to increase the influence individual workers exercise over the organisation of their time at work.
19
The interim target of an 80 per cent employment rate remains firmly in place. In the light of the weak international situation, additional measures will be required to reach the target. The Government intends to propose further measures later, in the 2004 Budget Bill.
Strong, vigorous enterprises
Strong, vigorous enterprises are crucial if Sweden is to be distinguished by sustained growth and social justice.
The Government has set aside funds for a national programme to promote entrepreneurship. The aim is to create a better entrepreneurial climate, foster positive attitudes towards entrepreneurial and business operations and boost entrepreneurial activity.
To enhance growth, the Government is preparing a number of proposals aimed at facilitating the establishment of more and growing companies. The idea is to boost the supply of capital at an early phase of development. It must become easier to start and run a business.
The amount of information small enterprises are required to submit to authorities will be cut during this Government's term of office, as will the number of occasions involved. The Government intends to formulate measurable targets for reducing the administrative burden and to give SimpLex (the Government Offices department responsible for regulatory simplification) the resources to scrutinise existing legislation.
1.5.2 Halving the need for social assistance
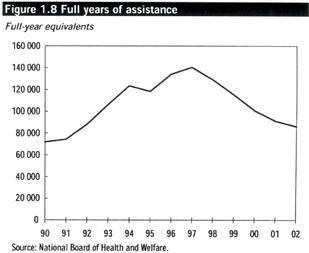
The need for social assistance is an expression of economic and social disparities. It leads to a lack of economic independence and to economic vulnerability. In the 2001 Spring Fiscal Policy Bill, the Government set the target of halving the need for social assistance. This means halving the number of full years of social assistance from 115 200 in 1999 to 57 600 in 2004.
Between 1999 and 2001 the number of full years of social assistance fell by 24 000, i.e. by 21 per cent. The cost trend for 2002 indicates a continued, albeit slower, decline.
The projections in the 2003 Budget Bill show that reaching the employment target is a necessary, but not sufficient, condition for meeting the social assistance target. The poorer economic climate is affecting Sweden and having adverse effects on employment, which will make it more difficult to meet the social assistance target. However, if the favourable employment trend for immigrants in recent years continues, the chances of success will grow. Moreover, the Government's measures to promote increased employment will have a positive impact on the prospects of reaching the social assistance target. The Government remains committed to the objective of halving the need for social assistance.
20
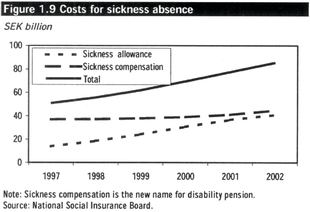
1.5.3 Reducing sick leave
Sickness absence is a human problem above all. But it also has economic consequences. In the last few years the costs of sickness absence have shot up. Recently the number of days of sickness allowance claimed has stopped increasing and the Government expects it to decline in the course of the year. The number of people on long-term sick leave, however, remains persistently high. In both the public and the private sector, women specifically are heavily overrepresented among those on long-term sick leave. This trend has entailed suffering for individuals, difficulties for employers and a heavy burden on the social insurance systems. If the trend is not broken, important welfare initiatives will have to be sidelined.
Sickness absence has many causes: an ageing labour force, a lack of incentives for employers, the health services and people on sick leave, a more demanding working life, a worse psychosocial working environment, deficiencies in the rehabilitation programmes set up by the social insurance offices and employers, waiting times for health and medical care, changes in the attitudes towards sick leave, etc. In view of the multiple causes, measures are required in a range of areas. Actions against sickness absence must be followed closely and improved on an ongoing basis.
The Government has set the target of halving the number of days of sick leave between 2002 and 2008 and bringing down the number of new activity and sickness allowances (which replace disability pensions and sickness benefits). The Riksdag has endorsed this target.
The Government inaugurated a major concerted effort in the autumn of 2001, when an 11-point programme was presented in conjunction with the 2002 Budget Bill. One component has been to invest SEK 70 million in pilot projects to promote better health in the public sector. These trials will now be followed up and evaluated, and the experience gained will be disseminated. Extra resources worth a total of SEK 3.75 billion will be committed over the period 2002 to 2004 to increase the availability of health care. A series of measures were presented in last year's Budget Bill, within the framework of an overall strategy. The social insurance offices, for example, received augmented financial resources to enable them to manage their work. The Riksdag has decided that compulsory reporting of sickness absence will be introduced in annual reports, a decision that will enter into force on 1 July 2003. A proposal has been drawn up for an inquiry into financial coordination. The three-way talks between the Government, employers and trade union organisations have concluded and the chairman has delivered his final report.
The Government is now taking a further step and proposing additional initiatives. In a special bill (Gov. bill 2002/03:89), the Government has described proposals for changes in sickness insurance for the sake of better health in working life. Sick leave will be made a more accurate system, by avoiding
21
full-time sick leave, introducing coordination meetings between the insured individual and the affected parties, improving the information on which decisions are based, enhancing training in insurance medicine and increasing the number of insurance medicine doctors and modifying their role. The employer's rehabilitation report will be made compulsory and the period during which a person is entitled to hold a sickness or activity compensation award dormant will be extended from one to two years.
The Government proposes extending the period during which sick pay is payable by 7 days to a total of 21 days, as from 1 July this year. At the same time, a cost limiting mechanism is proposed for small enterprises.
The procedure for calculating the amount of compensation paid in the form of sickness allowance in the event of sick leave will be changed as from 1 July 2003. The compensation will be cut back by reducing the base for calculating sickness allowances. This reduction will apply to sickness allowance only.
The initial no-benefit day should apply equally to all, irrespective of the timing of sickness notification. The Government will therefore examine the application of the no-benefit day and propose any changes that are required.
The Government proposes further that the sickness allowance paid to unemployed individuals should be adjusted from1 July this year so as not to exceed their unemployment compensation. At present, an unemployed person who is put on sick leave normally receives higher compensation. All those who are employed receive less when they are on sick leave and it is only reasonable that people who are unemployed should not receive a raise in compensation when they are put on sick leave.
Many people on long-term sick leave have jobs to which they cannot return. To make it easier for these individuals to return to work, a form of recruitment incentive is being set up—a temporary subsidy of the wages paid to individuals on long-term sick leave who obtain work with another employer. This support will apply to cases of long-term sick leave where the responsibility for rehabilitation has been transferred from the individual's employer to the social insurance office. The National Labour Market Board will be given the task of administering the subsidy, which is forecast to cover an average of 3 000 individuals. Cooperation will be needed between the social insurance office and the labour market authority to identify individuals who may be relevant.
In its bill on Changes in sickness insurance for better health in working life (Gov. bill 2002/03:89), the Government has proposed that no later than one year after the date of sickness notification, the social insurance offices shall have investigated the possibilities of giving the insured person sickness compensation or activity compensation instead of sickness allowance. The Government will monitor the effects of this change. However, the proposal will not affect people who have already been on sick leave for more than a year. Since the size of this group varies greatly from one county to another, the Government will also instruct the National Social Insurance Board and the social insurance offices to make their working procedures more uniform.
The previously announced raising of the sickness insurance ceiling from 7.5 to 10 price base amounts will be postponed to a later date.
22

While the Government is seeking comprehensive solutions, measures against ill health cannot be delayed. The measures proposed now are simply a first step.
Additional measures
The measures that have already been implemented and those that are now proposed are necessary to meet the target of halving the number of days of sick leave. But this is an ambitious target and additional steps will be required. The three-way talks have delivered proposals in the shape of a programme. As efforts continue, the social partners will bear a considerable responsibility. The steps that need to be taken will depend on various factors, including the impact of the measures already adopted and announced. The Government intends to return to a number of issues in the 2004 Budget Bill.
- —
- More vigorous preventive efforts
In the 2003 Budget Bill, the Government has emphasised the need to improve preventive efforts and rehabilitation. Further development of efforts in the workplace, in cooperation between employers and employees, is fundamental to continued endeavours to promote better health in working life. Measures have been announced relating to the development and augmenting of preventive action. These measures concern occupational health services and inspections in the working environment area.
23
- —
- Increased responsibility for those on sick leave to actively assist in breaking out of sick leave
The responsibility for facilitating a return to work also lies in part with the individual. At present it very seldom happens that compensation is suspended or reduced when a person refrains from participating in rehabilitation or in some other way obstructs a return to work. One reason for this is that the social insurance offices have limited powers to act. Consequently, the Government intends to consider whether the regulations and their application should be made more rigorous.
- —
- Sickness compensation for a maximum of three years at a time
This proposed change was announced in the 2003 Budget Bill, but the labour law consequences need further analysis before a proposal can be put forward. The Government intends to make a proposal in this area at a later date.
- —
- Stronger economic incentives to employers to reduce ill health
- —
- The system will encompass the entire labour market and will be designed to strengthen both individuals and enterprise—and hence also the general economy—in a long-term perspective.
- —
- Employers will pay part of the compensation even after the period of sick pay.
- —
- The design of the economic incentives will entail that steps leading to less ill health and lower sickness allowance costs will lower employers' costs.
- —
- When designing a system incorporating increased responsibility for costs, the current arrangements in the collective agreements on the labour market must be taken into account.
- —
- It is proposed that a mechanism to protect small enterprises in connection with the proposed lengthening of the period of sick pay to 21 days should already be introduced this year. This mechanism will be designed to prevent increased responsibility for costs after the period of sick pay inhibiting growth. Threshold effects should be minimised and
As early as the 11-point programme presented in connection with the Budget Bill in the autumn of 2001, the Government indicated that it intended to bring in augmented economic incentives of some type to encourage employers to tackle the problem of increased ill health in working life. Within the framework of the three-way talks, a model has also been proposed that places an increased responsibility for costs on employers, even in cases of relatively long-term sick leave. The Swedish Trade Union Confederation, the Confederation of Professional Employees and the Swedish Confederation of Professional Associations (SACO) have also proposed a similar model with an increased responsibility for costs. Employers will also face higher costs if they fail to provide rehabilitation plans.
At present employers have considerable costs in connection with absences of short and medium duration; there are costs for sick pay, costs for replacement personnel and overtime, and not least costs in the form of disturbances of production. But the longer a person is on sick leave, the more the costs to the individual employer tend to disappear. The person who is sick is not infrequently replaced by a substitute who, as time goes by, does the job equally well. The employer then has nothing to gain economically from getting the sick employee back, especially if he or she returns with a lower capacity for work. To increase the employer's motivation to get staff back to work, the Government therefore wishes to introduce economic incentives.
Proposals on the detailed design of a system of economic incentives will be presented in connection with the 2004 Budget Bill. The planned starting date for the system is 1 January 2004. The following pointers can already be noted:
24
- —
- Various sanctions are being considered against employers who have failed to draw up complete rehabilitation plans.
- —
- Particular attention must be paid to groups that already have difficulty entering the labour market, so as to prevent any increase in selective practices in the labour market.
application straightforward. Small enterprises will not face excessively high costs in conjunction with long-term sick leave.
1.6 Reforms to promote justice and security
Welfare will continue to be extended at the rate the economy allows. An extensive system of welfare that provides security in the midst of change makes the economy more dynamic. Secure people can be more daring.
A range of reforms are being implemented this year to enhance social justice. These reforms will give higher pensions, more teachers in schools, more places in higher education, improved study grants, universal pre-school, more international development assistance and more money for health and social services.
In spite of the savings and expenditure cuts that are now proposed, a number of reforms will be carried out in 2004 as well. There will be further investments to put more teachers and specialist staff in schools, measures to support health care and medical services, environmental and infrastructure investments and a further increase in development assistance to 0.868 per cent of GNI, which will mean a rise of SEK 2 887 million to SEK 21 833 million.
Table 1.10 Approved and announced reforms
Impact on the budget compared with previous year
| SEK billion | 2003 | 2004 | ||
|---|---|---|---|---|
| Justice | 0.20 | 0.40 | ||
| International development cooperation | 1.64 | 1.46 | ||
| Health and medical care, schools and community services | 6.24 | 2.80 | ||
| Pensions, etc. | 2.80 | 0.00 | ||
| Extra month for mother/father | 0.50 | 0.50 | ||
| Labour market | 1.70 | 0.00 | ||
| Education and research | 2.10 | 0.76 | ||
| Housing | 0.35 | 0.12 | ||
| Infrastructure | 1.20 | 2.10 | ||
| Other expenditure reforms | 2.68 | 1.40 | ||
| Expenditure reforms, total | 19.40 | 9.54 | ||
1.6.1 Children and the young—Sweden's future
The system of maximum charges has given families with children substantially lower fees for childcare. Special resources will be committed in future as well to recruit extra staff so as to safeguard the quality of operations. The first follow-up of the maximum charges reform, conducted by the National Agency for Education, indicates that the Government's aims have been fulfilled. Standards have been maintained. More children are attending preschool, but the increase in the number of children has not affected the size of groups or the amount of time children spend at pre-school. There has been no negative impact on staffing ratios either. On 1 January this year universal pre-school was introduced for all children aged four or five. This means all children are entitled to three hours of
25
pre-school per day, free of charge. As part of the expenditure cuts announced in this bill, the Government proposes a rise in the ceiling for maximum childcare charges in 2004.
Parental insurance will be enhanced. The one-month extension of parental insurance will take effect this year. At the same time, the minimum daily allowance will be raised to SEK 150 per day and a further increase to SEK 180 per day is planned for 2004. When the economic situation permits, the Government intends to go further and enhance parental insurance additionally by raising the income ceiling in the system.
The upper secondary study grant has been extended from 9 to 10 months of the year. This will mean an extra SEK 950 per year for families with a teenager at upper secondary school.
Table 1.11 Investments in schools and pre-school
SEK billion
| | 2002 | 2003 | 2004 | |||
|---|---|---|---|---|---|---|
| Maximum charges | 3.9 | 3.9 | 3.7 | |||
| Right for children of jobseekers or parents on parental leave to attend pre-school | 0.5 | 0.5 | 0.5 | |||
| Universal pre-school for 4-5- year-olds | 1.2 | 1.2 | ||||
| Extra staff in schools and after school centres | 1.5 | 2.5 | 3.5 | |||
| Total | 5.9 | 8.1 | 8.9 | |||
1.6.2 Security for the elderly
The elderly have a right to grow old in security. A welfare society like Sweden should be distinguished by solidarity between women and men, individuals, groups and generations. During the Government's previous term of office, a series of important reforms were carried out. Pensions and housing supplements were raised repeatedly, while taxes on pensioners went down. A maximum charge was introduced in elder care, together with a minimum guaranteed income after charges, and a new and better system to protect against high costs was implemented in dental care for the elderly.
Further steps have been taken this year in strengthening intergenerational solidarity and enhancing security for the elderly.
Pensions have been raised by between SEK 300 and SEK 600 a month for those with the lowest pensions. Another SEK 300 million are being committed this year as part of the process of improving dental care support for the elderly. A new form of maintenance support for elderly persons has been brought in to guarantee all people in Sweden over the age of 65 a reasonable standard of living. This reduces the need of the elderly for social allowances.
1.6.3 Standards will be kept up in health care and social services
Health and medical care, schools and community services are at the very heart of social welfare. Availability must be determined by need, not by private economic circumstances or where in the country a person lives. Health and medical care, schools and community services must therefore be universal, cover the whole population and maintain high standards.
Local authorities have recently enjoyed good income growth. Rising employment levels and higher government grants have led to increased revenues. Now times have changed. The weakness of the international economy and the prevailing uncertainty are affecting the Swedish economy and the weaker income growth has repercussions for Swedish local authorities.
26
In order to develop welfare and continue to meet commitments in future, employment levels must go up. To strengthen the position of local authorities in the short term, the temporary employment support provided in 2002 has been extended to apply in 2003 as well. The Government now proposes to augment the employment support in 2003 and to continue such support in 2004. The fixed sum of SEK 200 that all income earners pay in state income tax will accrue to the local authorities this year. The Government proposes that these tax resources should also go to municipalities and county councils in 2004. These changes will entail a boost for local authorities totalling SEK 0.3 billion in 2003 and SEK 4.3 billion in 2004.
The special health care initiative earlier approved by the Riksdag provides additional resources of SEK 9 billion over the period 2001-2004. These funds have been made available largely by adjustments in total defence priorities. In addition, SEK 3.75 billion is being committed in 2002-2004 to reduce waiting times in the health service.
Table 1.12 Commitments to health care
SEK billion
| | 2002 | 2003 | 2004 | |||
|---|---|---|---|---|---|---|
| Health care | 1 | 3 | 4 | |||
| Shorter waiting lists | 1.25 | 1.25 | 1.25 | |||
| Total | 2.25 | 4.25 | 5.25 | |||
1.6.4 Sweden—a knowledge society
Knowledge is a powerful tool for economic growth and social justice. Education is essential for equality and development. This being so, major initiatives are under way in compulsory school, upper secondary school, adult education and higher education.
Over the next few years, up to 2006, schools and after school centres will receive SEK 1 billion per year. This means raising the total level of resources by SEK 5 billion. The resources are to be used to employ more school staff, e.g. teachers, school nurses, remedial teachers, school librarians and other specialist staff.
A special initiative for higher education is also in progress. The Government's long-term goal is that at least half the young people born in any year shall have embarked on university-level studies by the age of 25. Resources have been allocated corresponding to an expansion by nearly 100 000 student places between 1997 and 2003.
On 1 January this year a specific government grant for adult education was launched. At the same time, a form of special adult study support known as an education recruitment grant has been introduced, for use by municipalities in recruiting adults over the age of 25 who have limited previous education, are unemployed or at risk of unemployment or have some type of disability.
In order to make it more possible for higher education institutions to incorporate both breadth and specialisation in the research they pursue, government appropriations for research and postgraduate education will increase by SEK 1.5 billion between 2000 and 2004.
As part of the green tax shift, money has been set aside for individual learning and skills development. This matter is currently under preparation at the Government Offices. The Government intends to put forward proposals on learning and skills development later in this term of office.
27
1.6.5 Good housing for all
The objective of housing policy is good housing for all people at reasonable prices. Housing is an integral part of welfare.
The Swedish housing market is polarised. In many municipalities the population is declining. A large proportion of the existing dwellings are unoccupied, particularly accommodation owned by the municipal housing companies. On 1 August 2002, the Government established the National Public Housing Board to help municipalities and municipal housing companies to restructure their property holdings.
In growth regions, the situation is the reverse. Population increase is generating higher demand, while housing construction has been low over the last ten years. In 2001 a special investment grant was introduced to encourage the production of new small and medium-sized rental dwellings in growth regions. The Government has recently proposed further incentives to increase the production of small rental units and student accommodation (Gov. bill 2002/03:98).
New housing must be built at reasonable cost. To achieve this, competition in the building sector must also improve. Further action is required to produce good indoor environments.
1.6.6 Challenges for social policy
Much remains to be done in the social domain, and in some respects things are still moving in the wrong direction. This is the case, for example, with drug abuse and alcohol consumption. Drink and drug abuse are often the key to other social problems, e.g. crime, homelessness and prostitution.
SEK 550 million has been set aside for the action plan on alcohol policy in the period 2001-2003, for use in improving and expanding local preventive measures, conducting a broad information campaign and other activities. The aim is to reduce alcohol abuse, delay young people's alcohol debut and bring down total consumption.
The action plan on drug policy includes initiatives to reduce new recruitment to drug abuse, induce more addicts to stop using drugs and reduce the availability of drugs. A total of SEK 325 million is being committed to this between 2002 and 2004. SEK 100 million of this has been allocated to the prison and probation services for use in preventing and combating drug abuse in prisons and helping more inmates overcome their addiction. This bill announces more resources for the prison and probation services, which will also be significant for the campaign against drugs.
The Government intends to continue to take initiatives during this term of office to improve preventive activities in the area of alcohol and drugs, to enhance the care available to addicts and to reduce homelessness.
The appropriation to the Swedish Police will be augmented in 2004 and subsequently so as to increase the number of police officers and permit operational development. The Government will specify the levels in the Budget Bill for 2004.
1.6.7 Balanced regional development
In its development, society must aim to use and develop the resources of the entire country. All parts of the country must be able to contribute to Sweden's growth. Sweden needs cohesion—both among its people and between and within its regions.
Sweden, with its great distances, needs a well developed infrastructure. The tax equalisation system will be further developed. Cooperation creates the best conditions for growth. Regional growth programmes will be developed and implemented in agreement and dialogue between different parts of society.
28
The prime purpose of taxation is to finance social welfare. Taxation policies must simultaneously encourage work and investment, stimulate sustainable growth and help to close economic and social gaps. The Government can never accept large tax cuts for those members of society who are already well off, at the expense of health care, schools and community services.
Proceeding from this basic outlook, the Government will give priority to further improvements for employees and small enterprises. At present there is no scope for unfinanced tax cuts.
During the coming year, taxation policy will focus on four areas.
1.7.1 Globalisation and the structure of Swedish taxation
The continuing process of globalisation presents a range of challenges to the Swedish tax system. At the end of 2002, the Tax Base Commission delivered its final report. The report has been circulated to a wide range of bodies for comment by the summer of 2003.
One of the main messages from the Tax Base Commission is that while the present level of taxation can be maintained, this will only be possible if we look after the tax system and tax bases. Countries with high levels of public spending require broad tax bases and need to limit various types of special regulations. This is essential to minimise marginal taxes in certain strategic areas.
1.7.2 Small enterprises
The Government strives as far as possible to create consistent and straightforward tax regulations for different forms of small enterprises and their owners. One of the benefits of such regulations is to facilitate the transitions between different corporate forms that often naturally accompany operational development.
In June 2002 the 3:12 Commission delivered its report Taxation of small entrepreneurs (Swedish Government Official Reports 2002:52). The Commission proposes amendments in the basic regulations governing the taxation of income from small limited companies, as well as relief in the form of lighter inheritance taxation in connection with generational handovers and gifts. The report has been circulated for comment and the proposals are now being processed at the Government Offices. The Government wants to change the 3:12 rules to make them more favourable to entrepreneurs.
Last year the Committee for Simplification of Taxation Rules for Small Enterprises presented its final report, which included a proposal on a reform of tax regulations for partnerships. The report has been circulated for comment and the Government will take a position on the Committee's proposal in conjunction with the continuing work on tax regulations for small enterprises.
1.7.3 Action against tax evasion
Tax evasion distorts competition in the economy, impairs the legitimacy of the tax system and ultimately represents a threat to welfare. The Government continues to give priority to the fight against tax evasion and economic crime.
The Swedish Tax Administration was allocated a total of SEK 300 million in 2001 and 2002 for tougher tax enforcement. As a result more and more criminal investigations have been brought to a conclusion and an increasing number of tax offences have been reported to the prosecution authorities. Efforts to make tax control more effective are also under way at the National Tax Board. The Government has recently submitted a bill containing proposals for reforming the organisation of the Swedish Tax Administration and enhancing its efficiency and effectiveness. The bill proposes replacing the present organisation by a national authority, the Tax Board.
29
Over and above organisational changes and measures to improve control, changes are required in the tax legislation to prevent tax evasion and avoidance.
In its report Pull your socks up, lads! (Swedish Government Official Reports 2002:115), for example, the National Commission on Construction proposes the establishment of special contract accounts and "reversed" VAT liability for general contractors, as measures to combat unregistered labour in the construction sector. These proposals are currently being processed by the Government Offices and will be evaluated after comments from referral bodies.
In the course of the spring, the Government will take a position on standard taxation in certain industries, as proposed in the National Tax Board report Standard taxation: a basic outline (National Tax Board Report 2002:3).
In addition, the Government intends to appoint a special expert in autumn 2003 to look over the instruments and powers at the disposal of the tax offences departments and determine whether they are sufficiently effective. A system of type-approved cash registers for cash transactions is also being considered. The Government is working on these issues and plans to present definite proposals later this year.
1.7.4 Green tax shift
In the 2000 Spring Fiscal Policy Bill, the Government stated that there was an overall scope of SEK 30 billion for the green tax shift in the period 2001-2010. On the basis of this assessment, the Government presented a green tax shift strategy in its 2001 Budget Bill and a first step was taken that included changes in the energy and carbon dioxide taxes and in the taxes on labour, in the form of higher basic income tax deductions and lower employers' social contributions. Further steps were taken in the same direction by proposals in the two subsequent budget bills. So far a tax shift of more than SEK 8 billion has been implemented. A tax shift worth SEK 9 billion is planned for the remainder of this term of office.
A stronger link between the tax system and the environment presupposes rational energy taxation. The Government is aiming for energy taxes that are sustainable in the long term and that will also comply with the requirements of EC law. The proposals made by the Tax Reduction Committee will now be circulated for comment, along with an upcoming report from the Commission on application of the flexible mechanisms of the Kyoto Protocol. After comments have been received, the Government intends to take a position on the ideas and draw up a proposal for presentation to the Riksdag aimed at establishing energy taxes that are sustainable in the long term and can serve as a basis for the future tax shift, while complying with the requirements of EC law.
In preparation for and alongside the continuing tax shift, there is reason for more in-depth analysis of the strategy's impact on income distribution both between individuals and between regions. It is important that the tax shift, as it continues, results in positive environmental effects, has a satisfactory outcome in terms of distribution policy and safeguards the competitiveness of Swedish industry.
1.8 A sustainable Sweden
Sweden shall continue to be one of the countries leading the way in the transition to development that is sustainable in all dimensions—economic, social and ecological. This will require measures that reconcile environmental policies with economic growth, employment and social welfare.
1.8.1 Growth and the environment
The connections between growth and the environment are complex. While economic growth has made it possible to develop more efficient and more environmentally friendly technology, it has also led to increased exploitation of natural resources.
30
Since the mid-1950s, the amount of raw materials used per unit produced has been more or less halved in Sweden, while the volume of production in the business sector has more than tripled. The principal explanation for this is a change in the composition of business sector production to favour more knowledge-intensive production.
Carbon dioxide emissions in Sweden are now about seven times what they were a hundred years ago. On average this is equivalent to a rate of increase of 2 per cent per year, i.e. about the same rate of increase as for GDP. However, it has not been a matter of steady growth. In the 1960s emissions rose very rapidly, while a sharp decline set in after 1975. From the end of the 1980s onwards, carbon dioxide emissions seem to have stabilised. The purpose of the climate investment programmes is to promote a positive development.
Where many environmentally harmful emissions are concerned, the situation has improved in recent decades, even if certain emissions are still a worsening problem in global terms. Environmental action has been successful above all in reducing emissions from major point sources, improving urban air quality and curbing the eutrophication of lakes and watercourses. However, new environmental challenges, including emissions from small, diffuse sources and the use of chemicals, remain a problem.
1.8.2 Future use of resources
In autumn 1998 the Government appointed a special expert to conduct an inquiry into the connection between economic growth and environmental impact and to examine whether objectives and measures were needed to promote more efficient use of natural resources so as to achieve sustainable development. The inquiry, which took the name Resource Efficiency Commission, delivered a report in January 2001 entitled Efficient use of natural resources (Swedish Government Official Reports 2001:2). This report points out, among other things, that unless measures are taken to the contrary, resource use, energy use and environmentally harmful emissions are likely to increase in the next few decades.
Even if continued efficiency gains are made in the use of energy and raw materials, this will not suffice to counteract the volume effects of increased production and consumption. A continued reduction of carbon dioxide and nitrogen oxides will require further raising the levels of ambition in climate and environmental policy. Cooperation with other countries and our own actions in Sweden are decisive. The Resource Efficiency Commission has provided a valuable basis for designing a policy directed towards efficient resource use and sustainable development.
1.8.3 Objectives and measures
The Government's overall environmental quality objective is to hand over to the next generation a society in which the major environmental problems have been solved.
One key task for environmental policy is to establish a system in which the party responsible for environmental impact is also made to bear the cost to the general economy. The green tax shift is one component of such a policy.
In the spring of 1999, the Riksdag adopted 15 national environmental quality objectives. These objectives have been formulated on the basis of what is currently known about the environmental impact that nature can tolerate and they define the state of the environment to be achieved within a generation.
An environmental objectives council has been established, which is responsible for conducting a comprehensive follow-up of the environmental objectives and the interim targets that have been set. According to the council's first report, most of the interim targets will probably be met but additional measures will need to be taken. Moreover, international efforts are crucial to achieving some of the goals.
31
Nature conservation issues will continue to have high priority. A municipal nature conservation initiative is in progress which is designed to stimulate local and municipal nature conservation, as a means of supplementing central government action aimed at meeting the environmental quality objectives and interim objectives that are associated with nature conservation. Some of the key concepts are local projects, partnership, links with outdoor activities and public health, natural environments near urban areas and access to such areas.
1.8.4 Green indicators
As part of the Government's high level of ambition in the environmental area, green indicators are reported alongside economic indicators. The purpose of green indicators is to reflect the national trend for important environmental problems. Green indicators thus constitute a tool that can provide an indication of progress towards the general environmental quality objective of passing on to the next generation a society in which the major environmental problems have been solved.
Energy use has increased in recent years, but over time there has been a gradual improvement in energy efficiency, expressed in terms of energy use relative to GDP. Variations in energy use from year to year are primarily due to economic ups and downs, temperature differentials and other variations in the weather.
Unlike in many other countries, carbon dioxide emissions fell sharply in Sweden in the 1970s and 1980s. This was a consequence, above all, of the energy policy pursued during the period, which aimed to reduce dependence on oil. Around 1990 the downward trend was broken and since then emissions have stabilised at about the 1990 level. According to the latest available statistics, emissions in 2001, including bunkering (i.e. emissions attributable to international aviation and shipping), were just above 1990 levels.
Table 1.13 Green indicators
Energy use (TWh, Wh/SEK)
| | 1980 | 1990 | 1999 | 2000 | 2001 | |||||
|---|---|---|---|---|---|---|---|---|---|---|
| Total final use(1) | 436 | 442 | 471 | 474 | 478 | |||||
| Energy intensity(2) | 325 | 266 | 246 | 239 | 239 |
Emissions to air (thousands of tonnes)(3)
| | 1980 | 1990 | 1999 | 2000 | 2001 | |||||
|---|---|---|---|---|---|---|---|---|---|---|
| Climate impact | ||||||||||
| Carbon dioxide | 82 438 | 59 986 | 63 247 | 60 315 | 61 649 | |||||
| Acidification | ||||||||||
| Sulphur dioxide | 508 | 112 | 68 | 71 | 74 | |||||
| Nitrogen oxides | 448 | 387 | 369 | 361 | 357 |
Burden on offshore waters (thousands of tonnes)
| | 1987 | 1990 | 1995 | 1998 | 2000 | |||||
|---|---|---|---|---|---|---|---|---|---|---|
| Eutrophication | ||||||||||
| Phosphorus | 5.8 | 4.6 | 4.8 | 4.9 | 5.2 | |||||
| Nitrogen | 148.2 | 122.9 | 134.5 | 152.6 | 158.1 |
32
Impact on air quality (micrograms per cubic metre)
| | 1992/93 | 1994/95 | 1996/97 | 1999/00 | 2001/02 | |||||
|---|---|---|---|---|---|---|---|---|---|---|
| Benzene(4) | 4.3-10.4 | 2.4-6.2 | 1.9-5.1 | 1.4-3.5 | 1.5-7.2 |
- (1)
- Total energy use excluding energy conversion losses at nuclear power stations.
- (2)
- Energy intensity is measured as total energy use relative to GDP. GDP is taken from the revised National Accounts, in 1995 prices.
- (3)
- Includes bunkering for international aviation and shipping and therefore differs from accounts under the United Nations Framework Convention on Climate Change and the Convention on Long-range Transboundary Air Pollution.
- (4)
- Benzene concentrations in air, winter half-year means in different urban areas (11, 24, 25, 31 and 35 sites respectively). Sources: Swedish Energy Agency, Swedish Environmental Protection Agency, Swedish Energy Agency and Swedish Environmental Research Institute AB.
If bunkering is excluded, however, emissions are below the level in 1990. Emissions of carbon dioxide vary widely from year to year. These variations are largely due to economic fluctuations, the supply of hydroelectric power and the weather.
Swedish emissions of sulphur dioxide have fallen sharply since 1980 and were almost halved in the 1990s. This is due above all to the increased use of low-sulphur oil and new purification technology. Swedish emissions of nitrogen oxides have also declined, though to a lesser extent. The main factors here are improved combustion and purification technologies.
Until the mid-1990s, the phosphorous and nitrogen burden on offshore waters was decreasing. Since then the total burden has increased, particularly where nitrogen is concerned, even though emissions from point sources have continued to decline. No new data on the phosphorus and nitrogen burden on offshore waters is available for 2001, as statistics are not produced every year.
The 1990s saw a marked improvement in urban air quality. Thanks to catalytic converters and lower benzene contents in petrol, the average concentrations of benzene in urban air have fallen since the beginning of the 1990s. However, during the winter half-year the level still exceeds the low-risk mark in all built-up areas where measurements are made.
1.8.5 Congestion charges
The preparations for trying out congestion charges in central Stockholm are making progress. In June 2003 the Stockholm Transport Commission will present proposals for the formulation of legislation on congestion charges. Planning for the practical aspects of the trial project is in progress in the City of Stockholm, while the County Council is planning augmented public transport operations.
The Government is monitoring developments and is prepared to support the trial project, both where legislation is concerned and in other respects. A decision on the exact form central government assistance will take—e.g. in terms of guarantees and investment costs for the trial project—will be taken as soon as the proposals presented by the Stockholm Transport Commission have been processed by the Government Offices, though the City of Stockholm and Stockholm County Council will also be involved.
1.9 A Sweden for all
Economic policies must help to enhance growth and narrow the gaps in society. Growth alone is no guarantee, however, that the gaps will close. Apart from an economic policy that fosters growth, an active policy to promote social justice is therefore required.
33
Not everyone has the same access to jobs and personal development. Many people have narrow margins and have difficulty making ends meet in everyday life. The unemployed, lone parents, people on long-term sick leave and immigrants are particularly vulnerable groups.
These problems notwithstanding, Sweden is one of the countries in the world with the least income dispersion, lowest poverty rate and lowest proportion of children in poverty. The Swedish welfare system, with its taxes, grants and public services, enhances equality by undertaking a substantial redistribution of resources.
A further key component of the Government's policy for social justice consists of reforms to promote greater equality between women and men. For this reason, Government decisions are analysed from a gender perspective. The Government is preparing a special gender appendix to the 2004 Budget Bill.
The opportunities that are open to individuals in society must not be limited by any form of discrimination. New legislation is therefore being brought in to strengthen protection against discrimination. Action is also under way to break the pattern of segregation in some parts of the metropolitan areas. The metropolitan initiative will receive additional resources in 2003.
Full employment is at the top of the Government's agenda. Accordingly, the Government has set interim goals of raising the rate of regular employment in the 20-64 age group to 80 per cent in 2004 and halving the need for social assistance between 1999 and 2004. The objective of halving open unemployment to four per cent was achieved at the end of 2000.
Being outside the labour market and needing social assistance leads to exclusion and resignation, makes people less free and increases the disparities in society. But higher employment rates and a reduced need for social allowances are not only a significant matter of justice for the individuals now affected; they are also vital to financing schools, elder care and health services in the future.
The international economic slowdown is affecting Sweden and making it more difficult to reach the goals we have set ourselves. But the Government is determined to achieve these goals, even if additional action is needed and it takes more time than previously estimated.
Figure 1.11 shows the distributional effects of 80 per cent employment and a halving of the need for social assistance. The columns show how incomes change in different income groups when the employment rate goes up, the need for social assistance is halved and unemployment remains at a level of about four per cent. Those with the lowest incomes are in category 1 and those with the highest incomes are in category 10. The figure shows that it is those with the lowest incomes who will benefit most from a higher employment rate and a halving of the need for social assistance.
34
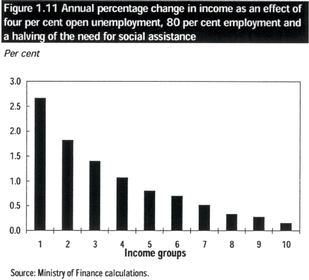
In order to achieve the two objectives we have set ourselves, measures are needed to make it easier to move from passivity and welfare dependence to active participation in the labour market. This applies to individuals who are engaged in involuntary part-time work, are unemployed, are sick or are outside working life for some other reason.
Between 1997 and 2002, the number of people in employment rose by some 320 000, from 73.9 to 78.1 per cent of the population aged 20 to 64. In order to reach the goal of 80 per cent employment, another 100 000 people need to begin to work.
The need for social assistance is estimated to have declined by the equivalent of 29 000 claimants between 1999 and 2002, and so has been brought down to about 86 000 full-year equivalents. About another 28 000 full-year equivalents remain before the target of halving the need for social assistance is reached.
1.10 The long-term outlook
The Government's policies are intended to create conditions for development that is sustainable in the long term, with high growth and employment rates, satisfactory welfare provision and an ecologically balanced society.
The demographic trend presents a major challenge. With more elderly people and less people of working age, combined with disturbing trends in labour force participation and absence from work, there is a risk that the number of hours of work performed will decline in the long run. Consequently, a higher proportion of the working-age population will need to be employed in future and sickness absence must become less common. The measures proposed now will support a development along these lines.
The total population will grow by nearly a million by 2050. There will be little change in the number of children and young people or people of working age (20-64), whereas the number of elderly people will steadily increase. This means there will be a sharp increase in the demand for health care and social services, while the number of people employed—the base for future income tax revenues—will grow only slowly.
The working-age population is expected to expand by more than 100 000 in the years up to 2015 and then shrink again. This increase over the coming decade, however, will be due almost exclusively to the fact that groups that currently exhibit below average rates of labour force participation will expand. It is above all the number of people aged 20-24 and 60-64 that will grow, while the number of people in the age groups where labour force participation is higher will decline.
35
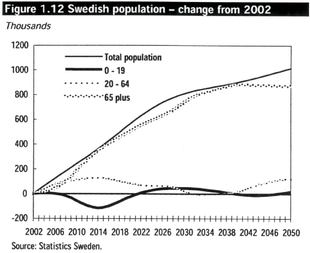
Even though the number of people aged between 20 and 64 who are born in Sweden is expected to fall, the working-age population will grow in the coming years because of immigration. At present, however, immigrants are less commonly gainfully employed than native Swedes. If the large-scale exclusion of immigrants from the labour market continues, there is a risk of a weak trend for employment and number of hours worked.
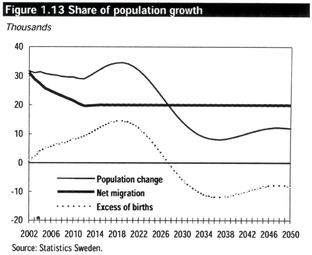
To prevent the number of people in employment falling, action will be needed to raise the employment rate in groups that now have difficulty entering the labour market.
36
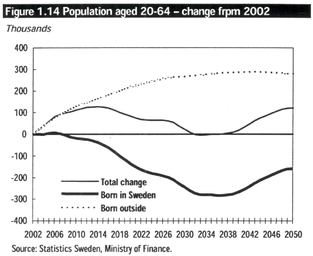
Supply of labour by different groups
On average, labour supplied by working age men declined by approximately 400 working hours per year, or 20 per cent, between 1970 and 2002. A substantial proportion of this decline came early on, in the 1970s, as a result of collective agreements on shorter working hours. More extended periods of education have lowered both the proportion of men under the age of 25 who are employed and the average number of hours they work.
Where women are concerned, the situation is slightly different. Older women have increased the amount of labour they supply, so that women over the age of 55 now perform more hours of paid work per person than ever before. This is because paid work was less common among women in earlier generations.
Over the past ten years, however, the proportion of women under the age of 55 who are in employment has declined. This trend increases the risk that the supply of labour by the oldest group of working women may also drop off in future.
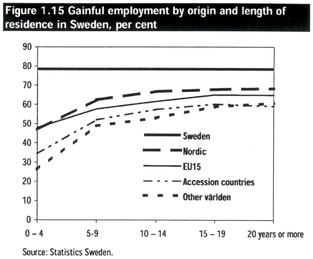
The employment rate is considerably lower for people born abroad than for native Swedes. Employment increases with the number of years spent in Sweden, but never reaches the same level as for native Swedes. The group currently responsible for the largest proportion of immigration—people born outside the post-enlargement EU—is also the group that has the greatest difficulty establishing itself in the labour market.
37
Employment must increase
If women and men of different ages and different origins continue to work to the same extent as in 2002, the number of people in employment will fall by about 50 000 by 2020. This development is partly attributable to the increasing proportion of foreign-born individuals in the working age population.
Yet these immigrants also embody a great potential for the future labour supply. If the employment rate for all those born abroad is raised to the current level for native Swedes, the number of people in employment will climb by almost 250 000 by 2020. This would mean approximately 300 000 more people in employment than if the present employment rates persisted.
The total population will continue to grow considerably faster than the working age population. In the long run this trend will lead to a lower number of hours worked per capita.
The Government's policies are directed towards increasing the supply of labour and thereby improving the conditions for continuing to finance high-quality welfare in the future.
38
Appendix 1
Sweden's Economy
Sweden's Economy
Contents
| Foreword | 6 | |||
| 1 | Introduction | 6 | ||
| 1.1 | Summary | 6 | ||
| 1.2 | Resource situation | 9 | ||
| 1.3 | Fiscal policy | 10 | ||
| 1.4 | Developments within different areas | 11 | ||
2 | International Developments | 19 | ||
| 2.1 | Developments in Europe | 22 | ||
| 2.2 | Developments in the United States | 23 | ||
| 2.3 | Developments in Asia and Latin America | 25 | ||
| 2.4 | Developments in Poland, the Baltic States and Russia | 26 | ||
| 2.5 | Swedish world market growth | 26 | ||
3 | Capital markets | 27 | ||
| 3.1 | International developments | 27 | ||
| 3.2 | Sweden | 30 | ||
4 | Foreign trade | 34 | ||
| 4.1 | Exports of goods | 35 | ||
| 4.2 | Imports of goods | 37 | ||
| 4.3 | Trade in services | 39 | ||
| 4.4 | Current account balance | 39 | ||
| 4.5 | Gross national income | 40 | ||
5 | Business sector output | 41 | ||
| 5.1 | Industry | 42 | ||
| 5.2 | Construction industry | 44 | ||
| 5.3 | Service sectors | 45 | ||
6 | Labour market | 47 | ||
7 | Wages | 53 | ||
8 | Inflation | 56 | ||
9 | Household sector finances and consumption expenditure | 61 | ||
| 9.1 | Household income | 61 | ||
| 9.2 | Household consumption expenditure | 66 | ||
10 | Gross capital formation | 72 | ||
| 10.1 | Business sector | 73 | ||
| 10.2 | The general government sector | 76 | ||
| 10.3 | Housing investment | 76 | ||
| 10.4 | Stocks | 78 | ||
11 | General government sector | 79 | ||
| 11.1 | Consolidated general government sector | 79 | ||
| 11.2 | Central government | 85 | ||
| 11.3 | The old-age pension system | 86 | ||
| 11.4 | Local government | 87 | ||
| 11.5 | Fiscal policy targets and indicators | 90 | ||
12 | Evaluation of forecasts | 95 | ||
| 12.1 | The Ministry of Finance's forecasts for 2002 | 95 | ||
| 12.2 | Comparison with other forecasters | 97 | ||
| 12.3 | Why are forecasters so cautious? | 99 | ||
3
Tables
| Table 1.1 | Assumptions for the forecast | 7 | |
| Table 1.2 | Selected statistics | 10 | |
| Table 1.3 | Demand and output | 14 | |
| Table 1.4 | Contribution to GDP growth | 16 | |
| Table 1.5 | Components of saving | 16 | |
| Table 1.6 | General government finances | 19 | |
| Table 2.1 | GDP growth, inflation and unemployment | 20 | |
| Table 3.1 | Balance of payments financial accounts | 32 | |
| Table 3.2 | Interest and exchange rate assumptions | 32 | |
| Table 4.1 | Exports and imports of goods and services | 35 | |
| Table 4.2 | Balance of payments | 40 | |
| Table 4.3 | Gross national income | 40 | |
| Table 5.1 | Business sector output | 41 | |
| Table 5.2 | Selected industrial statistics | 42 | |
| Table 5.3 | Construction industry | 45 | |
| Table 6.1 | Selected labour market statistics | 47 | |
| Table 7.1 | Hourly nominal wages | 54 | |
| Table 7.2 | Hourly labour costs in business sector | 56 | |
| Table 8.1 | Consumer price development | 61 | |
| Table 9.1 | Real household disposable income | 62 | |
| Table 9.2 | Contribution to growth in real household income | 63 | |
| Table 9.3 | Transfer income divided by purpose | 64 | |
| Table 9.4 | Adjusted real household disposable income | 65 | |
| Table 9.5 | Household financial wealth | 69 | |
| Table 9.6 | Household saving | 71 | |
| Table 10.1 | Gross fixed capital formation | 73 | |
| Table 10.2 | Gross fixed capital formation in goods-producing sectors | 75 | |
| Table 10.3 | Gross fixed capital formation in the service sector | 76 | |
| Table 11.1 | General government net lending | 80 | |
| Table 11.2 | General government finances | 81 | |
| Table 11.3 | Taxes and charges | 82 | |
| Table 11.4 | General government expenditure | 84 | |
| Table 11.5 | Central government finances | 85 | |
| Table 11.6 | The old-age pension system | 87 | |
| Table 11.7 | Local government finances | 88 | |
| Table 11.8 | Structural balance in the general government sector | 92 | |
| Table 11.9 | Fiscal impact | 94 | |
| Table 12.1 | Ministry of Finance's forecasts and outcomes for 2002 | 95 | |
| Table 12.2 | Average absolute forecast error for GDP growth | 99 |
4
Diagrams
| 1.1 | GDP growth, forecast and potential GDP | 6 | ||
| 2.1 | The forecast economic upswing in the United States compared with the average for previous economic upswings since World War II | 24 | ||
| 3.1 | Key interest rates in the United states, the euro area and Sweden | 28 | ||
| 3.2 | 10-year government bond yields in the United States, Germany and Sweden | 28 | ||
| 3.3 | The US dollar against the euro | 29 | ||
| 3.4 | Stock market development in the United states, the euro area and Sweden | 30 | ||
| 3.5 | The differential between 10-year government bond yields in Sweden and Germany | 31 | ||
| 3.6 | The Swedish krona as measured by the TCW index | 31 | ||
| 4.1 | Export orders and exports of goods | 36 | ||
| 5.1 | Industry's labour costs per produced unit in Sweden compared with 11 OECD countries | 43 | ||
| 5.2 | Industry's share of gross operating surplus | 44 | ||
| 6.1 | Newly reported vacancies and notices of redundancy | 49 | ||
| 6.2 | Number of employed and persons at work | 50 | ||
| 6.3 | People in labour force and number of employed | 52 | ||
| 6.4 | Open unemployment and people in labour market policy programmes | 52 | ||
| 7.1 | Hourly wage development 1960-2002 | 53 | ||
| 8.1 | Inflation (CPI) excl. electricity, oil, and petrol | 57 | ||
| 8.2 | Impact on CPI inflation of certain goods and services | 57 | ||
| 8.3 | Consumer price development | 60 | ||
| 9.1 | Real disposable income | 66 | ||
| 9.2 | Household disposable income and consumption expenditure | 67 | ||
| 9.3 | Household consumption of goods and services | 68 | ||
| 9.4 | Liabilities in relation to disposable income | 69 | ||
| 9.5 | Liabilities in relation to real and financial assets | 70 | ||
| 9.6 | Household expectations about the economy 12 months ahead | 70 | ||
| 9.7 | Household net savings ratio | 72 | ||
| 10.1 | Gross fixed capital formation | 73 | ||
| 10.2 | Capacity utilisation in industry | 74 | ||
| 10.3 | Capital ratio in industry | 74 | ||
| 10.4 | Number of dwellings—housing starts | 77 | ||
| 11.1 | General government net lending | 78 | ||
| 11.2 | General government financial net wealth | 80 | ||
| 11.3 | General government revenue and expenditure | 83 | ||
| 11.4 | Local government finances | 89 | ||
| 11.5 | Local government consumption expenditure | 90 | ||
| 12.1 | Average absolute forecast errors for 2002 | 98 | ||
| 12.2 | Average forecasts, preliminary outcomes and revised outcomes for GDP growth | 100 |
5
Foreword
This appendix to the Government Spring Fiscal Policy Bill for the year 2003 contains a forecast of economic developments both internationally and in Sweden up to the end of the year 2004. In addition, it contains an estimate of developments in 2005 and 2006.
The assessments are based on material from Statistics Sweden, OECD and the National Institute of Economic Research (NIER). The Ministry of Finance is, however, solely responsible for the assessments presented here.
The estimates have been made with the aid of the National Institute of Economic Research's model, KOSMOS, and are contingent upon a number of assumptions being fulfilled.
For the estimates of development in volume, the year 2001 has been used as the fixed base year.
Mats Dillén, Director at the Ministry of Finance, is responsible for this appendix. The estimates contained in the appendix are based on information received up to 9 April 2003.
1 Introduction
The recovery in the global economy is weaker than previously assumed. The global uncertainty related to the Iraq crisis has an impact on firms' will to invest, while high oil prices have dampened household purchasing power. The deterioration in the global economic situation, combined with weak growth in some of Sweden's important export sectors, including the telecommunication equipment industry, and a marked decline in household income growth contribute to an anticipated increase in gross national product (GDP) of 1.4 per cent this year. Open unemployment will rise as a consequence of the subdued demand. Next year, investment is expected to increase again, after having fallen for two consecutive years. Export growth will increase as the global economic situation gradually improves. In 2004, GDP is forecast to rise by 2.4 per cent and unemployment to fall.
1.1 Summary
Global growth is limited this year by weak growth in the euro area and continued low activity in Japan. The situation in Germany, where growth is expected to be less than 1 per cent for the third consecutive year, is particularly disquieting. In the United States, a highly expansionary economic policy stance has stimulated consumption and thereby offset the reduction in demand resulting from the substantial stock market falls and weak industrial activity of the last few years. Strong growth in the United States is an important prerequisite for the continuation of the global economic recovery.
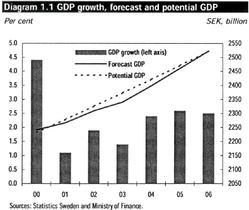
The geopolitical situation resulting from the Iraq crisis currently constitutes a restraining factor in the global economy. The forecast is based on the assumption that uncertainty regarding the geopolitical
6
situation will continue, but will be considerably reduced in the second half of 2003. It is also based on the assumption that the oil price will not remain at high levels for prolonged periods. As political uncertainty diminishes, firms' will to invest and household consumption demand are forecast to rise globally.
Table 1.1 Assumptions for the forecast
| | 2002 | 2003 | 2004 | 2005 | 2006 | |||||
|---|---|---|---|---|---|---|---|---|---|---|
| GDP world(1) | 2.9 | 3.2 | 4.0 | 3.9 | 3.8 | |||||
| HICP EU(2) | 2.1 | 2.0 | 1.9 | 1.8 | 1.7 | |||||
| Hourly wages in Sweden(3) | 4.0 | 3.5 | 3.5 | 3.5 | 3.5 | |||||
| TCW index(2) | 133.7 | 128.8 | 127.0 | 127.0 | 127.0 | |||||
| German long-term rate(4) | 4.8 | 4.3 | 5.0 | 5.4 | 5.4 | |||||
| Swedish long-term rate(4) | 5.3 | 4.9 | 5.4 | 5.8 | 5.8 | |||||
| Swedish short-term rate(5) | 4.1 | 3.5 | 4.0 | 4.8 | 4.9 |
- (1)
- Percentage change.
- (2)
- Annual average.
- (3)
- Costs, annual average.
- (4)
- 10-year government bond, annual average.
- (5)
- 6-month treasury bill, annual average.
Sources: OECD, Statistics Sweden, National Mediation Office and Ministry of Finance.
However, there is considerable uncertainty regarding the continued course of the Iraq conflict and its knock-on effects. On the one hand, the course of events may be such that the pessimistic sentiment is broken earlier than anticipated and the oil price is lower on average than expected. In such a scenario, the global economic recovery is accelerated. On the other hand, the Iraq conflict may lead to weaker economic growth and considerable continued uncertainty and to the oil price remaining high for a prolonged period. Investment and consumption decisions may then be postponed. The risk scenario is asymmetrical in that the possible negative forecast deviations are greater than the positive ones.
Weak global demand is expected to lead to a continued expansionary monetary policy stance in the United States, the euro area and Sweden. In the United States, the key rate is forecast to remain at below 2 per cent for the rest of the year. In the euro area and Sweden, the central banks are expected to continue lowering their respective key rates. In Sweden's case, the framing of monetary policy is assumed to be affected by both the economic outlook and the gradual tightening of fiscal policy. The forecast is based on an unchanged assumption that Sweden will not participate in EMU. In the event of a "yes" vote in the referendum on the adoption of the euro, the conditions of both fiscal and monetary policy will change.
According to the preliminary National Accounts, GDP rose by 1.9 per cent in Sweden in 2002, which may be compared with the forecast in the Budget Bill of 2.1 per cent. The seasonally adjusted development of GDP indicates that growth slowed down in the second half of the year. The outcome for 2002 further shows that exports, household consumption and gross fixed capital formation developed considerably more weakly than estimated in the Budget Bill. Stocks and general government consumption made higher contributions to growth than anticipated. Imports developed more weakly than estimated. The composition of growth in 2002 has a negative impact on growth in 2003 compared with the forecast in the Budget Bill. The reversal in stocks is forecast to be smaller this year and the
7
scope for continued local government expansion has declined. The slightly lower than expected growth in 2002, the fact that growth declined in the second half of the year and the more unfavourable composition of growth have appreciably weakened the initial position for 2003, compared with the forecast in the Budget Bill.
In the light of the weak global economic situation, growth nevertheless held up well in the Swedish economy in 2002. By comparison, GDP in the euro area rose by only just under 1 per cent last year. The reason for the relatively strong growth is probably not to be found in Sweden having been exposed to fewer or less growth-restraining disturbances than other countries. On the contrary, the stock market trend was more negative and the continued downturn in the information and communication technology (ICT) sector had, if anything, a more severe impact on Sweden than other OECD countries. Sweden's relatively strong growth was due instead to an expansionary fiscal policy and a weakened exchange rate. These offset, to some extent, the global negative growth impulses, the weak growth in the ICT sector and falling stock markets.
An equivalent positive impact on demand is not expected this year or next year, from either the exchange rate or fiscal policy. The strengthening of the Swedish krona that has taken place since the autumn of 2002 is assumed to last, which will dampen export growth this year. However, the anticipated improvement in the global economic situation will contribute to a gradual increase in export growth this year and next year. Fiscal policy will tighten this year and next year after having been highly expansionary. As a result, household income will not be strengthened through, for example, tax cuts, as was the case in the immediately preceding years. However, households have not fully utilised the high income increases in previous years for consumption, but are considered, to some extent, to have saved as a precaution in reaction to the weak stock market trend. The household wealth position is still favourable, partly due to rising house prices. Combined with low interest rates, this is forecast to lead to relatively strong consumption growth in the future.
There is considerable uncertainty regarding the future demand for telecommunication equipment. In the forecast, it is assumed that both output and exports of telecommunication equipment will rise weakly during the course of this year and next year. The downturn has nevertheless been so substantial that the export volume in 2004 is only expected to be just under 60 per cent of the export volume in the peak year 2000. The telecommunication equipment industry has also been subject to very substantial revisions in the National Accounts, which further increases the uncertainty in future assessments. However, the prospects of a better than forecast development are estimated to be equal to the risk of a weaker development.
The investment trend is also difficult to assess. Investment volumes fell sharply in both industry and the service sectors in 2002 and the decline is expected to continue this year. The levels are, however, still relatively high and the current uncertainty may result in investment in these sectors falling next year as well. However, it is considered more likely that the expected increase in output will lead to investment rising in 2004. The positive signals of an improvement in industrial activity evident in, for example, the NIER's monthly Business Tendency Survey and low interest rates also indicate a gradual improvement in investment activity in the business sector. General government investment will rise both this year and next year, mainly due to central government infrastructure investment. However, the increase will be dampened by the cutbacks proposed in this bill.
The demand for labour is currently weak. The Labour Force Surveys of the last few months indicate falling employment and rising open unemployment. During 2002, employment and unemployment were largely unchanged compared with 2001. However, the number of hours worked fell by just over 1 per cent due to declining average hours worked per person employed. The lower average hours worked were in turn mainly due to rising absence, e.g. as a result of illness. The rising absence resulted in a reduction in the number of persons at work of just over 0.5 per cent in 2002. This year, employment is forecast to decline by 0.3 per cent, while the fall in average hours worked will slow
8
down. Open unemployment is expected to rise to 4.5 per cent, measured as an annual average. Next year, the general economic strengthening is expected to lead to an improved labour market situation, with rising employment and falling open unemployment. The regular employment rate for persons aged 20 to 64 is estimated at 77.6 per cent in 2004.
Inflation rose sharply during the winter. On the whole, the rise in inflation is entirely due to rising heating oil, petrol and electricity prices. These prices are expected to fall gradually and therefore have only a temporary inflationary impact. The domestic inflationary pressure for both goods and services, which was evident in late 2001 and early 2002, has since gradually declined. In spite of recent high inflation, the assessment is therefore that the underlying inflationary pressure over the next one to two years will be low.
One explanation for the dampened service sector inflation is that employment growth in the private service sectors has slowed down and wage drift has therefore declined. The statistics received also show that the rate of wage increase in the whole economy declined somewhat in 2002. The decline was particularly evident in the service sectors. The profile of the centrally agreed wage increases means that these may be expected to be somewhat lower in 2003 than in previous years. The forecast is based on the assumption that the increase in hourly wages for 2003 onwards is limited to 3.5 per cent per year. One disquieting factor is the development of other labour costs. In 2001 and 2002, these rose slightly more rapidly than wages. This year, many firms and local authorities will be forced to increase their pension provisions in reaction to the stock market falls of the last few years, which will contribute to higher labour costs.
1.2 Resource situation
The downward revision of GDP growth for this year, in relation to the assessment in the Budget Bill, results in the resources in the economy not being utilised as previously anticipated. The GDP gap, i.e. the difference between the actual and potential output level, is estimated at -1.4 per cent this year. In the Budget Bill, the GDP gap was estimated at -0.5 per cent for 2003. Next year, growth will increase and the GDP gap will narrow to -1.0 per cent. The economic situation during the medium-term years 2005 and 2006 is difficult to assess. The growth forecasts for these years are therefore based on the assumption that the GDP gap will close in 2006.
The GDP gap can be broken down into a productivity gap, an employment gap and an average hours worked gap, where the respective gap expresses the percentage difference between the variable's actual and potential level.
Productivity growth was approximately 3 per cent in 2002. This historically high rate of increase should partly be seen in conjunction with the weak productivity growth of 2001 (0.6 per cent), and partly as an effect of the high absence not being fully reflected in reduced output. The productivity increase resulting from increased absence is, however, not considered sustainable in the long term. In other words, last year's strong productivity growth is considered to be largely temporary. The productivity gap is forecast, on the whole, to close this year, which will lead to productivity growth this year and onwards developing in line with trend productivity growth, which is estimated at 1.8 per cent for the economy as a whole.
The employment gap is estimated at -0.4 per cent this year and will rise to approximately -0.5 per cent in 2004. Employment is expected to rise by 0.6 per cent per year in 2005 and 2006. The increase in employment is made possible by the fact that the working-age population will grow by 0.6 per cent per year. Potential employment will rise by 0.4 per cent per year in 2005 and 2006, and will thus develop more weakly than the growth in the working-age population. The assessment of potential employment growth takes into account the fact that age groups with a low employment rate will grow as a proportion of the working-age population. Employment growth in 2005 and 2006 will consequently exceed potential employment growth for these years. This is made possible by the fact that open
9
unemployment is expected to fall to just under 4 per cent in 2006. The number of persons in labour market policy programmes is also forecast to decline, releasing manpower.
The average hours worked gap is estimated at -0.8 per cent in 2003 and approximately -0.5 per cent in 2004. Potential average hours worked are estimated for demographic reasons to decline by 0.2 per cent per year in 2005 and 2006. However, actual average hours worked are forecast to be positively affected by the government's programme for increased occupational health.
Overall, the assessments of the resource situation and trend growth mean that GDP is estimated to increase by 2.6 per cent in 2005 and by 2.5 per cent in 2006.
Table 1.2 Selected statistics
| | 2002 | 2003 | 2004 | 2005 | 2006 | |||||
|---|---|---|---|---|---|---|---|---|---|---|
| CPI, Dec-Dec | 2.3 | 1.6 | 2.5 | 2.3 | 2.0 | |||||
| UND1X, Dec-Dec | 2.2 | 1.9 | 1.7 | — | — | |||||
| Real disposable income(1) | 4.7 | 1.7 | 1.4 | 0.9 | 1.6 | |||||
| Savings ratio (level)(2) | 2.8 | 2.6 | 1.9 | 0.6 | -0.1 | |||||
| Industrial production(1) | 2.9 | 2.2 | 5.0 | 4.2 | 3.9 | |||||
| Relative unit labour costs in industry(1,3) | 0.3 | 2.8 | 0.3 | — | — | |||||
| Number of employed(1) | 0.1 | -0.3 | 0.3 | 0.6 | 0.6 | |||||
| Open unemployment(4) | 4.0 | 4.5 | 4.3 | 4.0 | 3.8 | |||||
| Labour market policy programmes(4) | 2.6 | 2.2 | 2.0 | 1.7 | 1.7 | |||||
| Regular employment ratio(5) | 78.1 | 77.6 | 77.6 | 77.7 | 77.8 | |||||
| Trade balance(6) | 147 | 156 | 171 | 188 | 204 | |||||
| Current account(7) | 4.2 | 4.3 | 4.1 | 4.1 | 4.3 | |||||
| General government net lending(7) | 1.1 | 0.4 | 1.0 | 1.4 | 2.1 |
- (1)
- Annual percentage change.
- (2)
- Excluding saving in pension fund reserves.
- (3)
- In common currency, SEK.
- (4)
- Per cent of labour force.
- (5)
- Number of employed in age group 20-64, excluding employed in labour market policy programmes, in per cent of population in that age group.
- (6)
- SEK billion.
- (7)
- Per cent of GDP.
Sources: Statistics Sweden, National Labour Market Board, Riksbank and Ministry of Finance.
1.3 Fiscal policy
The target for the public finances is an average surplus of 2 per cent of GDP over a business cycle. This strengthens the general government wealth position, creating financial scope to meet the demographic trends in the next few decades.
Net lending in the general government sector is estimated at 0.4 per cent of GDP this year and 1.0 per cent of GDP in 2004. The GDP gap is expected to be negative in both 2003 and 2004. The structural surplus is therefore higher than the reported surplus and is estimated at 1.4 per cent of GDP this year and 1.7 per cent of GDP in 2004. During the following two years, the structural surplus will strengthen further and amount to 2.2 per cent in 2006. Since the GDP gap is expected to be closed,
10
reported and structural lending will largely converge in 2006. In these circumstances, the forecast surpluses up to the end of 2006 are considered to be consistent with the target of an average surplus of 2 per cent of GDP over a business cycle. For a more detailed discussion, see Chapter 11.
The change in general government lending is an indicator of the effects of the public finances on demand in the economy. The change can be divided into discretionary measures in the government budget, automatic stabilisers and other factors.
Net lending will gradually strengthen between 2003 and 2006, which will have a restraining effect on demand in the economy. Around half of the strengthening of public finances is explained by an improvement in the economic situation, i.e. by the automatic stabilisers. The other half is due to the increase in the structural surplus. The fiscal policy stance, measured as the change in structural lending, is therefore expected to be weakly contractionary in the period up to 2006 (see Table 1.6 and Section 11.5).
1.4 Developments within different areas
International developments
The global recovery, which began in the first half of 2002, diminished in strength in the latter part of the year. In the euro area, growth weakened, and in the United States, growth was weak in the fourth quarter. Developments in regions outside the OECD area were favourable in 2002, with the exception of Latin America. The current global security policy situation has a dampening effect on global activity. Given that uncertainty declines, the conditions are, however, favourable for the recovery to gain renewed strength in the latter part of 2003. In 2002, global growth is estimated at 2.9 per cent. It is expected to rise to 3.2 per cent this year and to 4 per cent in 2004.
In the United States, a highly expansionary economic policy has strengthened household purchasing power and partly offset weak industrial and investment activity. Over the past two years, extensive cost adjustment has taken place in the business sector. Imbalances due to earlier over-investment have gradually been corrected. The cost adjustment has resulted in an improvement in the profit outlook of firms, which together with low interest rates lays the basis for increased investment. US export firms also benefit from the weakening of the dollar over the past year.
The US economy is in a sensitive situation. The growth, so far largely maintained by an expansionary economic policy, is expected to become self-supporting. In a negative risk scenario, growth in household consumption dampens before a solid increase in industrial output and investment has been established. A protracted Iraq crisis with continued high uncertainty, a weak stock market trend or a fall in housing prices are factors that may jeopardise the recovery. Overall, GDP in the United States is estimated to rise by 2.6 per cent this year and 3.8 per cent in 2004.
The Japanese economy continues to wrestle with major problems. Domestic demand is very low. Household consumption is negatively affected by a weak labour market, falling equity prices and weak public finances. Japanese consumer prices have continued to fall. It is thus advantageous for households to postpone consumption decisions. The uncertain geopolitical situation and the shortage of venture capital as a result of the banking system's consolidation needs contribute to low investment activity. Although external demand is expected to strengthen, weak domestic demand is expected to lead to only a very moderate increase in GDP during the forecast period. GDP is expected to rise by 0.7 per cent this year and by 0.8 per cent next year.
As stated above, the already moderate growth in the euro area slowed towards the end of 2002. GDP for the full year 2002 rose by a historically low 0.8 per cent. Leading indicators do not suggest any immediate strengthening of growth, although the outlook varies between euro area countries. In Germany in particular, consumer and business confidence in the future is subdued. The strengthening of the euro and an anticipated tight fiscal policy stance limit, to some extent, global and domestic
11
demand. The recovery this year is therefore expected to be moderate and growth in the euro area is estimated at only just over 1 per cent. Further easing of monetary policy is forecast and as global demand strengthens, growth is expected to be 2.2 per cent next year.
In the UK, growth over the past few years has been driven by strong domestic demand and a fast-growing service sector, while industrial output has developed weakly. However, consumption growth is expected to dampen this year and next year as a result of the stock market falls in the last few years and of the deterioration in the financial wealth position of households, due to rising indebtedness. Household disposable income is also expected to increase at a slightly slower rate. The anticipated global economic upturn and a weaker pound are expected to strengthen export growth. The dichotomy that has characterised the British economy is therefore forecast to decline. GDP growth is expected to be 2.1 per cent this year and 2.3 per cent in 2004. In Norway and Denmark, growth was moderate last year. In Norway, GDP rose by 1.0 per cent. In Denmark, growth was slightly higher at 1.6 per cent, but fell back markedly during the second half of the year. In both Norway and Denmark, the conditions are good for a favourable development of household consumption. In Denmark, the stock adjustment that limited growth in 2002 appears to be completed and in Norway, general government consumption is expected to rise at a good rate in the future. Growth is forecast at 1.2 per cent in Norway and 1.4 per cent in Denmark this year, and at 2.0 per cent in Norway and 2.3 per cent in Denmark next year.
Interest rates, currencies and inflation
The demand for high-risk assets, e.g. shares, continued to be low at the beginning of the year. The explanation lies partly in the considerable uncertainty surrounding economic development and the security policy situation, and partly in the fact that the weak stock market trend of the last few years has reduced the risk propensity of investors. This has in turn affected price formation on the financial markets, since equity prices have continued to fall and bond prices have risen (i.e. yields have fallen). The low interest rates are also a result of the leading central banks operating an expansionary monetary policy with low key rates. This shift in the investment focus of investors in favour of bonds has also led to a reduction in the difference in yield between corporate and government bonds. However, a clear feature in recent developments is that the assessments of the development of the Iraq crisis and its consequences shift rapidly, giving rise to substantial price movements on the financial markets.
The combination of high risk and a low risk propensity has forced down long market rates to very low levels. In the United States, the yield on 10-year government bonds in March was around or less than 4 per cent. Equivalent levels have not been seen since the 1950s. Another unusual feature in the global interest rate structure is that German bond yields have been higher than US bond yields. The difference is, however, relatively small. In the second half of 2003, an improvement in the economic situation and lower geopolitical uncertainty are expected to lead to a rise in long market rates. At the end of 2004, interest rates are expected to have normalised, and the German 10-year government bond yield is expected to be just under 5.5 per cent and the equivalent US yield just under 6 per cent. The difference between Swedish and German 10-year government bond yields has been fairly stable at around 0.5 percentage points over the past few years. The difference is estimated to fall to 0.4 percentage points at the end of 2004.
The increasing uncertainty, the deterioration in the economic outlook and thus declining inflationary pressure led to the US Federal Reserve, the European Central Bank (ECB) and the Riksbank lowering their key rates in late 2002 and early 2003. US monetary policy is highly expansionary and the key rate was 1.25 per cent at the beginning of April. Even though further interest rate cuts cannot be ruled out, the US Federal Reserve is forecast to let the key rate remain at this low level until the end of the year, when a period of interest rate increases is expected to begin. In the euro area, the economic outlook is weaker than in the United States and fiscal policy is expected to be somewhat tightened. The ECB is therefore forecast to continue to ease monetary policy and to lower
12
its key rate to 2 per cent, which is also anticipated to be the level at the end of the year. In 2004, when the economic recovery is expected to be stable, the US Federal Reserve and the ECB are expected to tighten monetary policy. However, it should be emphasised that even if the key rates in the United States and the euro area are raised, the level of the key rates will be lower throughout 2004 than the levels considered normal in the long term. In other words, the monetary policy stance is expected to be expansionary in 2004.
Since the beginning of 2002, the dollar has weakened by approximately 20 per cent against the euro. There are probably a number of interacting factors underlying the weakening of the dollar, but one important explanation is probably the shift in investment focus towards low-risk investments. The relatively low level of interest rates in the United States compared with the euro area, which has been partly due to the expansionary monetary policy, has led to a substantial capital inflow to the euro area from the United States. The weak stock market trend and the downward adjusted profit outlook have probably also contributed to it having become more difficult to attract the capital required to finance the US current account deficit, which is in the region of 5 per cent of GDP.
Since the autumn of 2001, the Swedish krona has strengthened from 146 to approximately 130 in terms of the trade-weighted TCW index. Some further strengthening is forecast during the course of 2003. At the end of 2003, the TCW index is estimated at 127. No further lasting strengthening is expected in subsequent years.
Swedish monetary policy is guided by an inflation target. Inflation, measured as the change in the consumer price index (CPI) over twelve months, is to amount to 2 per cent with a tolerance interval of +/-1 percentage point. The Riksbank has clarified that the framing of monetary policy is currently guided by UND1X. UND1X is the Riksbank's measure of underlying inflation, where the direct effects of the changes in interest rates, indirect taxes and subsidies have been excluded from the CPI. The Riksbank is assumed to adjust monetary policy so that inflation develops in line with the inflation target.
Inflation rose during the winter and was 3.4 per cent in February, measured as the 12-month change in the CPI. Electricity, heating oil and petrol price increases accounted for 1.6 percentage points of CPI inflation in February. Excluding these goods, a fairly steady fall in inflation can be seen in 2002. Since electricity and oil price increases are only expected to give rise to temporary inflationary effects, these are not anticipated to affect the framing of monetary policy. In view of declining underlying inflationary pressure, a change towards a tighter fiscal policy and weak total demand, the Riksbank is expected to implement further key rate cuts this year. The so-called repo rate is expected to be 2.75 per cent at the end of 2003. As the economic situation improves in 2004, the Riksbank is assumed to raise the repo rate. At the end of 2004, the repo rate is assumed to be 4 per cent.
Demand and output
Exports of good rose by just over 2 per cent in 2002, which was a relatively favourable development in view of the weak economic situation in important Swedish export markets. Export growth was particularly strong in the first half of 2002. In retrospect, it may be stated that export successes in the telecommunication equipment and automotive industries were temporary. In the second half of the year, export volumes in these sectors fell substantially. As in 2001, exports of telecommunication equipment made a large negative contribution to the development of exports of goods in 2002. Excluding telecommunication equipment, exports of goods rose by approximately 4 per cent in 2002.
In the forecast, exports of telecommunication equipment are assumed to rise by approximately 8 per cent during the course of 2003, but the weak development in the second half of 2002 results in an annual average for the development of telecommunication equipment exports of -12 per cent for 2003. Telecommunication equipment will thus make a negative contribution to total growth in exports of
13
goods of 1.1 percentage points in 2003. This illustrates the sensitivity of Swedish exports of goods to the recovery of the telecommunication equipment industry. The current considerable uncertainty regarding the future outlook entails a significant risk of forecasting errors.
Table 1.3 Demand and output
| | | | | | | Percentage change in volume | |||||||||||
|---|---|---|---|---|---|---|---|---|---|---|---|---|---|---|---|---|---|
| | SEK billion 2002(1) | | | | | ||||||||||||
| | 2000 | 2001 | 2002 | 2003 | 2004 | 2005 | 2006 | ||||||||||
| Household consumption expenditure | 1139 | 4.0(2) | 0.2 | 1.3 | 1.9 | 2.2 | 2.3 | 2.4 | |||||||||
| General government consumption expenditure | 656 | 0.7(2) | 0.9 | 2.1 | 0.5 | 0.2 | 0.3 | 0.3 | |||||||||
| Central government | 188 | -2.8 | -2.5 | 1.7 | -0.5 | -0.5 | 0.0 | 0.0 | |||||||||
| Local government | 468 | 2.2(2) | 2.4 | 2.3 | 0.8 | 0.5 | 0.5 | 0.5 | |||||||||
| Gross fixed capital formation | 400 | 6.6 | 0.8 | -2.5 | -0.5 | 2.9 | 4.9 | 4.7 | |||||||||
| Business sector, excluding housing | 280 | 9.6 | -0.2 | -6.9 | -2.2 | 3.0 | 5.2 | 5.0 | |||||||||
| Housing | 49 | 10.0 | 3.6 | 10.4 | 2.3 | 4.2 | 8.0 | 8.0 | |||||||||
| Authorities | 70 | -8.1 | 4.2 | 9.5 | 4.5 | 1.4 | 1.3 | 1.2 | |||||||||
| Change in stocks(3) | 4 | 0.5 | -0.4 | -0.1 | 0.2 | 0.0 | 0.1 | 0.0 | |||||||||
| Exports | 1012 | 11.3 | -0.8 | 0.4 | 2.3 | 7.0 | 6.3 | 6.0 | |||||||||
| Imports | 871 | 11.5 | -3.5 | -2.7 | 2.3 | 6.0 | 6.2 | 6.1 | |||||||||
| GDP | 2340 | 4.4 | 1.1 | 1.9 | 1.4 | 2.4 | 2.6 | 2.5 | |||||||||
- (1)
- Current prices.
- (2)
- Excluding the effect of the transfer of the Church of Sweden from the local government sector to the household sector in the National Accounts from 1 January 2000. The corresponding development for 2000 including this effect is 5.0% for household consumption expenditure, -1.1% for general government consumption expenditure and -0.3% for local government consumption expenditure.
- (3)
- The change in volume is calculated as per cent of GDP last year.
Sources: Statistics Sweden and Ministry of Finance.
The most recent indicators for the Swedish export industry have been relatively positive. However, the picture is divided. The NIER's Business Tendency Surveys for January and February show an increase in the inflow of export orders, while the Purchasing Managers Index for March shows a dampening of the inflow of export orders. One possible partial explanation is that industrial firms worldwide are stockbuilding in order to guard against trade disruption as a result of the Iraq conflict. During the second half of the year, the anticipated global recovery is, however, expected to gain renewed strength. The Swedish export industry, with its relative emphasis on investment goods, will then face a more favourable composition of demand, since global investment demand will gradually increase. In these circumstances, Swedish exports of goods are forecast to rise by 2.3 per cent this year and 7.0 per cent in 2004.
The fluctuations in imports of goods have had a substantial impact on GDP growth over the past few years. In 2001, imports of goods fell, for example, by 5.5 per cent. The fall cannot be fully explained by reduced demand and changes in the composition of demand. The weak krona exchange rate in 2001 probably led to demand focusing to a greater extent on Swedish output rather than imports. This had a positive impact on GDP growth. In 2002, imports of goods were also unexpectedly weak and fell by approximately 1.5 per cent. The downturn in the telecommunication equipment
14
market has not only weakened exports, but has also contributed to low imports. In 2002, imports in this commodity group declined by 14 per cent. The stock adjustment that took place last year in industry and trade also dampened imports.
The strengthening of the krona results in less expensive import goods, which together with an increase in exports and household consumption will contribute to increased imports this year. Import demand is strengthened by the anticipated completion of stock adjustment this year. Overall, imports of goods are expected to rise by approximately 3 per cent this year, which is higher growth in relation to the development of the demand components compared with the previous two years. Next year, imports of goods are forecast to rise by 6.5 per cent.
The decline in trade in services, which began in early 2001, continued in 2002. In the fourth quarter of 2002, exports of services declined by 16 per cent compared with the fourth quarter of 2001, according to the National Accounts. In 2002, the services balance made no contribution to growth, but the weak development of exports of services at the end of the year results in trade in services being expected to make a negative contribution of 0.4 percentage points in 2003. Next year, trade in services is estimated to make a positive contribution to growth of 0.1 percentage points.
As in the rest of the OECD area, Swedish investment activity was weak in 2002. Investment in the business sector fell by 6.9 per cent. However, housing investment and infrastructure investment rose. Overall, investment declined by 2.5 per cent in 2002. The uncertain global situation and weak profitability are expected to dampen the business sector's will to invest this year. Despite continued favourable growth in general government investment and housing investment, total investment in the economy will therefore decline by approximately 0.5 per cent this year. Next year, the output growth of the last few years will have increased capacity utilisation to such an extent that investment volumes have to rise again in order that demand can be met by increased output. Overall, investment is expected to rise by approximately 3 per cent in 2004.
The decline in industrial investment has been substantial. In 2001 and 2002, investment fell overall by almost 13 per cent. This year, it is expected to decline by a further 4 per cent. The substantial fall clearly shows that the investment level in 2000 was unsustainably high. However, it is very difficult to determine how large an adjustment of the capital stock is necessary. The forecast includes an increase of just under 5 per cent in 2004.
Investment in the service sector fell by approximately 8 per cent in 2002. As in industry, the decline was largely a consequence of previous high investment volumes. This year, investment is expected to continue to fall in the majority of service sectors. The exception is trade, where investment will rise. Overall, investment in the service sector is estimated to fall by approximately 2.5 per cent this year. The slowdown in services output in the last few years has been relatively mild. Services output is expected to continue to increase at a favourable rate in the future. In these circumstances, investment is estimated to rise by just over 2 per cent next year.
Housing investment rose by just over 10 per cent in 2002. Underlying the rise was the increased construction of single-family dwellings in particular. A number of indicators show that the increase in new construction of single-family dwellings and apartment buildings has slowed. Overall, total housing investment is expected to rise by 2.3 per cent this year and 4.2 per cent next year. The rise must be described as moderate in the light of the fact that housing construction is still at a historically very low level.
Trade and industry reduced their stocks last year. However, unexpectedly large stockbuilding in the fourth quarter resulted in the negative effect of changes in stocks on GDP growth being limited to 0.1 per cent of GDP. Since stocks declined last year and are expected to increase somewhat this year, stocks will make a positive contribution to GDP growth of 0.2 per cent of GDP in 2003. Next year, stockbuilding is forecast to have a neutral effect on growth.
15
Following a number of years of very high growth rates, growth in household consumption expenditure halted in late 2000. In early 2002, a marked recovery began. Consumption increased by 1.3 per cent as an annual average in 2002 and rose by approximately 2 per cent during the course of the year. Falling equity prices contributed to a reduction in household financial wealth of approximately SEK 250 billion last year, which had a negative impact on consumption. The most important explanation for the nevertheless relatively favourable consumption growth probably lies in the substantial increase in household disposable income, partly as a result of reduced income taxes. According to the National Accounts, real disposable income rose by a full 4.7 per cent in 2002, of which 2.3 percentage points were due to economic reforms. However, the level of real disposable income in 2001 was restrained by the fact that households paid high capital gains taxes mainly on shares as a result of stock market rises in previous years (capital gains are not, however, included in household disposable income in the National Accounts). Adjusted for this effect, real disposable income rose by approximately 3.5 per cent in 2002. In 2003 and 2004, household income is forecast to develop more weakly than in 2001 and 2002, partly as a result of a tighter fiscal policy. The anticipated reduction in employment this year will also have a dampening effect on household income growth.
However, monthly statistics received indicate continued good growth in retailing, particularly for durable goods. Consumer confidence in the future has declined somewhat, but households are nevertheless relatively optimistic in their view of their own finances. The reason for this may be partly that the household wealth position is still favourable, due to strong real wealth growth, and partly low interest rates. As previously indicated, the Riksbank is assumed to continue to implement key rate cuts, which will further stimulate consumption. Overall, household consumption expenditure is estimated to rise by approximately 2 per cent per year this year and next year.
Central government consumption expenditure rose by a full 1.7 per cent in 2002. Growth is expected to be weaker this year and next year, partly due to defence expenditure restrictions, and will amount to -0.5 per cent in both years.
Local government consumption developed strongly last year, while revenue rose at a slightly slower rate than previous years. The balanced budget requirement came into force in 2000 and entails local authorities and county councils preparing budgets in which revenue exceeds expenditure. In 2002, the local government sector as a whole showed a negative result. This year, taxes are being increased by SEK 0.65 and the local government sector's finances are therefore expected to improve. Within the scope of the balanced budget requirement, consumption growth is forecast at 0.8 per cent in 2003 and 0.5 per cent next year.
Table 1.4 Contribution to GDP growth
Percentage points
| | 2002 | 2003 | 2004 | 2005 | 2006 | ||||||
|---|---|---|---|---|---|---|---|---|---|---|---|
| Household consumption expenditure | 0.6 | 0.9 | 1.1 | 1.1 | 1.1 | ||||||
| General government consumption expenditure | 0.6 | 0.1 | 0.1 | 0.1 | 0.1 | ||||||
| Gross fixed capital formation | -0.4 | -0.1 | 0.5 | 0.8 | 0.8 | ||||||
| Change in stocks | -0.1 | 0.2 | 0.0 | 0.1 | 0.0 | ||||||
| Net foreign trade | 1.2 | 0.2 | 0.9 | 0.5 | 0.5 | ||||||
| Exports | 0.2 | 1.0 | 3.1 | 2.9 | 2.9 | ||||||
| Imports | 1.1 | -0.9 | -2.3 | -2.4 | -2.5 | ||||||
| GDP | 1.9 | 1.4 | 2.4 | 2.6 | 2.5 | ||||||
Sources: Statistics Sweden and Ministry of Finance.
16
Composition of growth and saving
The decline in GDP growth from 1.9 per cent in 2002 to 1.4 per cent in 2003 is largely attributable to a substantial reduction in the contribution to growth from foreign trade (see Table 1.4). Considering the fact that export growth is increasing, it may seem somewhat surprising that foreign trade gives a lower contribution to growth this year than in 2002, but this is because of the very substantial reversal in the contribution to growth from imports. The contribution to growth from general government consumption expenditure is also declining this year. However, these negative effects are offset to some extent by the rising contribution to growth from inventories and household consumption expenditure.
Gross saving in the economy will remain almost unchanged between 2002 and 2004 (see Table 1.5). Net lending, which largely parallels the development of the current account balance, is expected to remain stable at about 4 per cent of GDP all the way through 2006. The gradual improvement in saving in the general government sector helps to strengthen net lending. In contrast, household saving is expected to weaken, which reduces total net lending. Fixed capital formation declined somewhat this year as a share of GDP, but an upturn is forecast for 2005 and 2006.
Table 1.5 Components of saving
Current prices, per cent of GDP
| | 2002 | 2003 | 2004 | 2005 | 2006 | ||||||
|---|---|---|---|---|---|---|---|---|---|---|---|
| Real balance | 17.2 | 17.1 | 17.1 | 17.5 | 17.8 | ||||||
| Fixed capital formation | 17.1 | 16.7 | 16.7 | 17.1 | 17.4 | ||||||
| Change in stocks | 0.2 | 0.4 | 0.4 | 0.4 | 0.4 | ||||||
| Net lending(1) | 4.1 | 4.1 | 3.9 | 4.1 | 4.3 | ||||||
| General government(2) | 1.1 | 0.4 | 1.0 | 1.4 | 2.1 | ||||||
| Household | 4.6 | 4.4 | 4.2 | 3.5 | 3.3 | ||||||
| Business sector | -1.6 | -0.7 | -1.3 | -0.8 | -1.1 | ||||||
| Gross balance | 21.3 | 21.2 | 21.0 | 21.6 | 22.1 | ||||||
- (1)
- According to Riksbank definition.
- (2)
- According to forecast.
Sources: Statistics Sweden, Riksbank and Ministry of Finance.
The labour market
Employment was essentially unchanged during 2001 and 2002. Last year, employment in the business sector declined, especially in industry. In the private service sector employment rose somewhat. The upturn in the service sector is significantly slower than the expansion in employment that took place between 1998 and 2001. Overall, employment rose by 0.1 per cent in 2002.
17
Indicators for future developments suggest that employment will decline this year. According to the NIER's Business Tendency Survey, industry intends to continue to cut the size of the workforce. The survey presents an overall picture for hiring plans in the service sectors which also suggests that a reduction can be expected although differences exist among the various sectors. Statistics Sweden's vacancy statistics for the fourth quarter of 2002 also show weak demand for labour. Outcome statistics, leading indicators and the demand situation in the economy all lead to the assessment that employment will decline by 0.3 per cent this year. Production is expected to gain momentum during the second six months of 2003. This should also lead to an increase in employment, though with some delay. The number of employed is predicted to rise by 0.3 per cent in 2004.
The average number of hours worked decreased by a full 3.8 per cent between 1999 and 2002. In addition to the increased absence from work, the lower average number of hours worked is due to a decline in the number of hours of overtime worked as well as in the amount of "ordinary" time worked. The average number of hours worked is predicted to decline by 0.2 per cent this year and increase by the same amount next year. Thus the recent trend for diminishing average hours worked will be broken, attributable in part to government measures to improve health in working life and the employment policy initiatives proposed in this government bill.
The labour supply shows solid covariance with business cycle and labour market trends. Because this year's labour market is considered to be weak, the supply of labour is restrained. The labour supply is also affected by the number of students. The number of participants in labour market policy programmes, most of whom are classified as students, will decline during the forecast years, making a positive contribution to the labour supply. The number of other students will increase somewhat, which will have an effect in the opposite direction. Also to be considered here is the development of the composition of the working age population. Since population growth is mainly expected to occur in age categories with low participation in the workforce, this factor has a negative effect on the supply of labour. The composition of the working age population also has a negative impact on the development of the number of sick people outside the labour force. The government action programme for health in working life is predicted to gradually reduce the number of sick people in each age group.
An analysis of the above conditions suggests that the labour supply will increase by 0.2 per cent this year and next year. Consequently, open unemployment will increase to 4.5 per cent this year and next year it will decline to 4.3 per cent.
Public finances
General government net lending amounted to 1.1 per cent of GDP in 2002. Direct taxes and charges as a percentage of GDP amounted to 51.3 per cent and total revenues to 56.8 per cent, while expenditure corresponded with 55.8 per cent of GDP. Net lending is expected to fall to 0.4 per cent of GDP in 2003. Tax revenues as a percentage of GDP will remain largely unchanged while expenditure will increase. In 2004 net lending is estimated to rise to 1 per cent of GDP, assuming that both income and expenditure decrease as a percentage of GDP. Net lending will increase to 1.4 per cent in 2005 and 2.1 per cent in 2006.
In 2003, net lending is allocated so that the central government shows a deficit of SEK 43 billion while the old-age pension system shows a surplus of SEK 51 billion. The central government deficit is expected to diminish during the forecast period at the same time as the pension system surplus increases somewhat. After a small surplus in 2003, local government sector finances are expected to show a deficit between 2004 and 2006. Nevertheless, the local government net lending deficit is considered to be consistent with a financial performance that meets the requirements for a balanced budget.
Because net lending has been high in recent years, net debt was replaced by positive net wealth in 2001, at 3.5 per cent of GDP. Net debt, as defined by Statistics Sweden, was revised downward by SEK 74 billion, which means that the net financial position was stronger than previously reported. The
18
drastic fall in the value of shares in 2002 resulted once again in net debt, despite continued positive lending. No assumptions are made in the forecast about future changes in values other than the effect of exchange rate developments on central government debt. This means that net debt will grow in pace with net lending. Favourable net lending entails a decrease in net debt during the forecast period and in 2005, the financial assets of the general government sector are expected to exceed debts once again.
Net lending between central government and the old-age pension system is allocated in such a way that the financial position is improved because of increased assets in the pension system. Because of the deficit in central government's finances, the liability side of the public sector balance sheet will increase during the forecast period. However, the rise in debt will not be large enough to prevent central government debt and consolidated gross debt from continuing to fall as a percentage of GDP. In 2006 the consolidated debt ratio is estimated to amount to 46.4 per cent of GDP.
Compared with the Government Budget Bill, general government net lending in 2002 was revised downward by SEK 13 billion, while tax revenues were somewhat higher than expected. The worsening is completely attributable to higher public expenses. From 2003 and onward, the lower GDP will be felt in lower tax revenues than the amount calculated in the Government Budget Bill, despite higher than expected local government tax hikes. Higher expenditure also contributes to a worsening of net lending compared with the calculations in the Government Budget Bill. Overall, general government net lending is estimated to fall by SEK 25 billion in 2003 and by SEK 15 billion in 2004 compared with the Government Budget Bill.
Table 1.6 General government finances
Per cent of GDP
| | 2002 | 2003 | 2004 | 2005 | 2006 | |||||
|---|---|---|---|---|---|---|---|---|---|---|
| Revenue | 56,8 | 56,8 | 56,5 | 56,1 | 56,1 | |||||
| Taxes(1) | 51,8 | 51,5 | 51,2 | 50,9 | 50,8 | |||||
| Expenditure | 55,8 | 56,4 | 55,5 | 54,7 | 53,9 | |||||
| Net lending | 1,1 | 0,4 | 1,0 | 1,4 | 2,1 | |||||
| Structural lending | 0,8 | 1,4 | 1,7 | 1,9 | 2,2 | |||||
| Consolidated gross debt | 52,4 | 51,0 | 50,0 | 48,4 | 46,4 | |||||
| Net debt | 2,5 | 1,2 | 0,2 | -1,0 | -3,1 |
- (1)
- Including taxes to EU.
Sources: Statistics Sweden and Ministry of Finance.
2 International Developments
Last year the global economy began a tentative recovery. This followed a relatively shallow downturn by historical standards. So far the recovery has been restrained due to a number of underlying problems and a need to correct them, partly through the continued consolidation of corporate balance sheets and the adjustment of the capital stock following previous overinvestment. The economic recovery has also been weighed down by the uncertain geopolitical situation(1). The increased uncertainty has contributed to a drop in confidence in the economy among both firms and households, the postponement of economic decisions, weak stock markets and rising oil prices. Altogether this has had a negative impact on global economic performance.
- (1)
- Geopolitical uncertainty denotes the global political and territorial uncertainty currently centring on the Iraq conflict, terrorist threats, uncertainty about access to raw materials, etc.
However, there are substantial regional variations. Growth in the United States has remained good after recovering at the beginning of last year, while the already moderate growth across much of the
19
EU lost momentum towards the end of last year. At the same time, the Japanese economy continued to perform badly, while the rest of Asia showed dynamic development.
The recovery in the global economy is forecast to continue and strengthen this year. However, the geopolitical situation is key to future economic performance. In the forecast it has been assumed that uncertainty about the global political situation will be lower in the second half of this year. A reduction in uncertainty is expected to lead to a strengthening of confidence among households and firms and so stimulate consumption and investment growth. Thus the recovery, which so far has been driven largely by an expansive economic policy is expected to shift to a more self-supporting increase in growth during the year.
Besides considerable confidence effects on economic performance, the geopolitical situation has had a direct impact on oil prices. The price of crude oil rose sharply during the autumn and winter. The main reason for the high price of oil has been a hefty risk premium due to the global political instability centring on Iraq. The underlying supply and demand situation—including the impact of the political unrest in Venezuela on supply—also contributed to the high price of oil at the beginning of this year. Some sources of turbulence persist with respect to oil production, and the price of Brent crude is predicted to be 25.5 US dollars per barrel at the end of both 2003 and 2004.
Table 2.1 GDP growth, inflation and unemployment
Percentage change, unless otherwise stated
| | 2001 | 2002 | 2003 | 2004 | 2005 | 2006 | ||||||
|---|---|---|---|---|---|---|---|---|---|---|---|---|
| Gross domestic product | ||||||||||||
| World | 2.3 | 2.9 | 3.2 | 4.0 | 3.9 | 3.8 | ||||||
| United States | 0.3 | 2.4 | 2.6 | 3.8 | 3.7 | 3.6 | ||||||
| Japan | 0.4 | 0.3 | 0.7 | 0.8 | 0.9 | 0.9 | ||||||
| EU(1) | 1.6 | 1.0 | 1.3 | 2.2 | 2.7 | 2.6 | ||||||
| Euro area | 1.5 | 0.8 | 1.1 | 2.2 | 2.7 | 2.7 | ||||||
| Germany | 0.6 | 0.2 | 0.5 | 1.8 | 2.5 | 2.5 | ||||||
| France | 1.8 | 1.2 | 1.2 | 2.2 | 2.4 | 2.4 | ||||||
| Italy | 1.8 | 0.4 | 1.1 | 2.2 | 2.7 | 2.6 | ||||||
| United Kingdom | 2.0 | 1.6 | 2.1 | 2.3 | 2.4 | 2.4 | ||||||
| Nordic countries | 1.1 | 1.5 | 1.6 | 2.5 | 2.5 | 2.4 | ||||||
| Denmark | 1.4 | 1.6 | 1.4 | 2.3 | 2.9 | 2.9 | ||||||
| Finland | 0.7 | 1.6 | 2.4 | 3.2 | 2.5 | 2.5 | ||||||
| Norway | 1.3 | 1.0 | 1.2 | 2.0 | 1.7 | 1.7 | ||||||
| Consumer prices(2) | ||||||||||||
| EU | 2.3 | 2.1 | 2.0 | 1.9 | 1.8 | 1.7 | ||||||
| Euro area | 2.5 | 2.3 | 2.0 | 1.9 | 1.9 | 1.7 | ||||||
| United States | 2.8 | 1.6 | 1.9 | 2.2 | 2.2 | 2.2 | ||||||
| Unemployment, as a percentage of labour force(3) | ||||||||||||
| EU | 7.4 | 7.5 | 8.1 | 8.0 | 7.5 | 7.3 | ||||||
| Euro area | 8.0 | 8.3 | 8.8 | 8.7 | 8.2 | 7.9 | ||||||
| United States | 4.8 | 5.8 | 5.8 | 5.5 | 5.3 | 5.2 | ||||||
| Market growth for Swedish exports | -0.1 | 2.1 | 5.6 | 7.7 | 7.7 | 7.5 |
- (1)
- EU figures refer to the 15 existing member states for all years.
- (2)
- HICP for the EU and CPI for the United States.
- (3)
- ILO definition for EU and national definition for United States.
Sources: National sources and Ministry of Finance.
20
In 2002 GDP growth in the United States was just under 2.5 per cent. Given that the economy suffered several shocks, this can be viewed as a relatively strong figure. One important reason behind the resilience of the US economy can be found in the historically strong economic policy stimulus, which contributed to continued stable consumption growth despite the prevailing uncertainty. However, growth in industrial activity has been subdued. Underlying domestic demand still looks stable for the most part and is expected to receive continued stimulus from a favourable interest rate and good growth in real disposable income well into 2003. Continued improvements in corporate profits and more favourable stock market conditions are predicted to stimulate growth in investment and employment and provide the foundations for more self-supporting growth during the second half of the year. A relatively tentative recovery is expected to result in GDP growth in the United States of just over 2.5 per cent this year, rising to just under 4.0 per cent next year.
Developments in the euro area contrast in several ways to those in the United States. Most tangible is the difference when it comes to domestic demand, which has not been able to help lift the euro area out of an extended period of weak economic growth. This difference has been seen for some time, and one contributing factor is probably the far higher productivity growth in the United States since the mid-1990s, which has benefited households through better wage growth. In this context it can be noted that calculations consistently reveal much higher potential growth in the United States than in the euro area. Another difference is that the economic policy stimulus, in the absence of room for manoeuvre for fiscal policy, has been more limited in the euro area. Since foreign trade did not provide any real impetus either, this resulted in a slight slowing of the growth rate in the euro area at the end of 2002. Particularly weak development was seen in the euro area's largest economy—Germany. Growth in the euro area is expected to remain weak during the first half of this year. However, previous and anticipated interest rate cuts will continue to stabilise developments, and a certain increase in the growth rate is predicted towards the end of the year, driven primarily by the recovery in the global economy. GDP growth in the euro area is forecast to be just over 1.0 per cent this year and just over 2.0 per cent next year.
In Japan the shortfall in domestic demand is even more worrying. In the past year, external demand has almost been the only source of growth in the economy. However, exports account for a relatively small proportion of the Japanese economy and cannot lift the Japanese economy out of its precarious situation on their own. The remaining underlying structural problems are expected to lead to continued weak domestic demand during the forecast period, and GDP growth is expected to be just under 1 per cent both this year and next.
Altogether global GDP growth is expected to be 3.2 per cent this year and 4.0 per cent next year. Against this background, Swedish world market growth—defined as the trade-weighted average import growth in Sweden's most important export markets—is forecast to grow by 5.6 per cent this year and 7.7 per cent next year.
The prevailing geopolitical situation makes the economic situation unusually difficult to gauge. A prolonged conflict in Iraq accompanied by continued high levels of uncertainty would probably have serious negative consequences for the global economy as a whole. However, the rapid resolution of the current situation could lead to a more positive performance than anticipated. Thus the geopolitical situation dominates the risk picture for the global economy as a whole. The more region-specific risks in the forecast include corporate pension commitments in the United States, which, combined with continued weak stock markets, could necessitate further consolidation of corporate balance sheets at the expense of investment and recruitment. Public finances are also a risk factor for growth in the euro area; further fiscal policy tightening cannot be ruled out as member states attempt to meet the criteria in the EU's Stability and Growth Pact. The situation in Japan is still uncertain, and substantial structural problems and risks remain.
21
2.1 Developments in Europe
Euro area
In 2002 the euro area's aggregate GDP grew by 0.8 per cent, which is the lowest growth since 1993. Economic growth was particularly weak in the euro area's three largest economies—Germany, France and Italy. Growth slowed in the fourth quarter last year and several indicators suggest that the euro area economy remained weak at the beginning of this year.
Economic activity picked up during the first half of 2002 but fell back again as early as the summer. This temporary upswing can be attributed primarily to a stronger contribution from foreign trade. However, uncertainty about the international economy increased during the summer and autumn as the geopolitical situation deteriorated and confidence among firms and households fell back again.
Household consumption was boosted by good real wage growth and low interest rates, but household confidence deteriorated markedly during the second half of 2002. At the same time the fall in investment and substantial stock reductions had a continued dampening effect on growth. Corrections to the capital stock as a result of previous overinvestment have meant that investment has fallen over the last two years.
Developments in recent months do not suggest a quick economic recovery, however some signs indicate that the downturn may have bottomed out. The decline in industrial production and investment has ended. Nevertheless, there is considerable uncertainty about the timing and strength of an upswing in the euro area. The key issue is how the geopolitical situation develops and how the repercussions of the Iraq conflict might impact on the global economy. Developments in the financial markets and corporate profits will also be of crucial importance for the strength and sustainability of the recovery.
During the first half of this year, growth is expected to remain weak. Rising global demand, better real incomes and an expansive monetary policy are then expected to contribute to an improved economic climate. Investments are forecast to stabilise and industrial activity is forecast to pick up. However, a clear upswing in investment is not expected until next year when capacity utilisation and profit margins have grown. Household consumption is being boosted by stable growth in real disposable incomes and low interest rates. However, consumer prices (HICP) are expected to rise temporarily during the first half of the year as a result of higher oil prices. Core inflation is forecast to fall during the year due to the appreciation of the euro and slower price growth in the service sector.
Following a slight increase in unemployment this year, the labour market situation is expected to brighten next year as the economy rallies. Public finances are strained in most countries in the euro area—including Germany, France and Portugal -and overall fiscal policy in the euro area is expected to be mildly restrictive during the forecast period.
Altogether GDP in the euro area is expected to grow by 1.1 per cent this year and 2.2 per cent next year. However, there will be major variations between the different member states. The low-growth countries include Germany and the Netherlands, where growth is expected to be less than 1.0 per cent, while Greece and Ireland are expected to see growth in excess of 3.0 per cent this year. This means that the euro area is forecast to grow well below its potential growth rate this year but slightly above it next year.
Besides the global political instability, the labour market and strained public finances are the main risk factors for the euro area. Both could lead to a substantial dampening of consumption growth.
Employment growth slowed considerably back at the beginning of 2001 but there was no increase in unemployment until the beginning of last year despite the economic slowdown.
22
The United Kingdom
The UK has coped relatively well with the international downturn but the performance of the economy is still mixed. Expansive fiscal and monetary policies have played a key role in strengthening the economy over the last year, and growth has been driven by good private consumption growth and a dynamic service sector. However, industrial activity has remained weak. In the year ahead, economic policy is expected to continue to support economic growth. Growth in private consumption is forecast to slow somewhat, not least in the light of high household debt relative to disposable income. At the same time a relatively weaker pound and a global economic recovery are expected to lead to a more favourable situation for UK industry, which means that a certain rebalancing of the economy may begin during the forecast period. GDP growth is forecast to be 2.1 per cent this year and 2.3 per cent next year. One special risk factor in the UK is developments in the private housing market, where prices have risen sharply in recent years.
The Nordic countries
Common to all of the Nordic economies bar Sweden is the way that household consumption has been an important driving force in recent years and is expected to remain so in the future.
The Norwegian economy performed relatively poorly in 2002. Growth was hampered primarily by falling investment. The profitability and competitiveness of Norwegian firms have deteriorated as a result of substantial wage increases combined with high interest rates and the appreciation of the krone. These problems have been exacerbated by the weak demand growth abroad. However, household consumption has grown strongly and is expected to remain the principal driving force in the Norwegian economy during the forecast period. Increased utilisation of the petroleum fund may provide greater scope for public consumption and so also help to boost growth. Altogether GDP is expected to grow by 1.2 per cent this year and 2.0 per cent next year.
Following the strong recovery in the first half of 2002, GDP growth in Denmark slowed substantially over the rest of the year. Part of the reason for this can be found in Danish export growth, which slowed towards the end of the year. At the same time there was a good rate of growth in household consumption over the year as a whole. After several years of subdued consumption growth, consumption is expected to be the principal driver in the economy again this year, fuelled by increased real incomes and low interest rates. After the slowdown at the end of 2002, exports are expected to take off again, albeit not until the latter part of this year. Investment growth is not expected to accelerate until next year. Altogether GDP growth is expected to be 1.4 per cent this year and 2.3 per cent next year.
The Finnish economy recovered in 2002 after weakening the previous year. It was primarily export growth and an increase in household consumption that contributed to this growth. The recovery was also reflected in industrial output, which grew markedly last year. Consumption is expected to remain one of the key driving forces in the Finnish economy alongside exports, which are expected to continue growing as the global economy picks up. GDP growth is forecast to be 2.4 per cent this year and 3.2 per cent next year.
2.2 Developments in the United States
Last year the US economy continued the recovery that began at the end of 2001. Overall the economy grew by just under 2.5 per cent despite the negative impact of several considerable shocks. These included the repercussions of the terrorist attacks on 11 September 2001, accounting scandals, the continued slide in the stock markets, and increased geopolitical risks in the light of the Iraq conflict. The geopolitical risks in particular have had negative effects on confidence among households and at many firms.
23
The recovery last year was otherwise stimulated by a highly expansive economic policy by historical standards. Interest rates were at their lowest for 40 years. Households have to a great extent continued to remortgage at lower rates of interest, and many households have also been able to increase their borrowings as property prices have continued to climb. This has provided greater scope for household consumption. The fiscal policy stimulus was also substantial. Tax cuts led to a substantial increase in households' disposable income, which has probably also made a major contribution to growth in household consumption. Car companies' offers of discounts and interest-free credit on purchase of new cars have also boosted consumption. Growth in household consumption has therefore remained relatively stable despite the considerable uncertainty about the future that households have expressed in questionnaires and consumer surveys.
The adjustment of the capital stock seen in recent years due to previous overinvestment, which has had a dampening effect on the economy, is believed to be largely complete. At the end of last year aggregate investment increased for the first time in two years.
The assumption that global political instability is set to decrease means that confidence will improve and the stock markets will pick up. Firms have cut their costs substantially in recent years. In a scenario where confidence is recovering and stock markets are rallying, demand in the economy will increase. This means that profits this year should continue to grow. Firms will be better equipped, and earnings growth will provide increased scope for firms to invest and recruit. A better labour market situation will stimulate consumption. As a result, a self-supporting recovery is anticipated during the second half of this year.
Monetary policy is expected to continue to contribute to stable consumption growth this year. Historical experience shows that there is a certain time lag before many households react to falling mortgage interest rates. Falling mortgage interest rates are therefore expected to continue to provide a stimulus for households well into this year.
Continued high productivity growth means continued high potential growth. Increased use of new technology and organisational improvements has probably had a positive effect on productivity.
GDP growth is expected to be 2.6 per cent this year and rise to 3.8 per cent next year. The recovery predicted for this year is weak by historical standards, which can be seen in diagram 2.1.
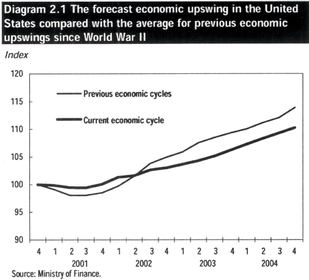
Note: The diagram refers to quarterly statistics. The years on the x-axis refer to the developments for the current business cycle. Both curves are indexed and the index 100 was obtained the last quarter before the recession.
24
The weak recovery this year should be seen in the light of the underlying geopolitical uncertainty, the weak stock markets and the deficits in corporate pension funding, which are to some extent limiting the scope for corporate investment. During the autumn and next year these factors are expected to have a substantially reduced dampening effect on the economy.
Uncertainty about future developments in the United States relates primarily to developments in the Iraq conflict. Continued or increased geopolitical uncertainty would lead to the stock market recovery predicted for this year being pushed back. This in turn would, among other things, increase the deficits in corporate pension funding and so have a dampening effect on investment, recruitment and households' propensity to consume. The outcome would be substantially worse performance this year than assumed.
2.3 Developments in Asia and Latin America
Japan
Growth in Japan remained weak in 2002. Although GDP growth was better than anticipated and was positive in each quarter, domestic demand was still very weak.
Household consumption is being held back partly by the subdued labour market situation. Investment growth is also weak, probably due to uncertainty about the future in the business sector. However, growth is being hampered primarily by Japan's underlying structural problems, with deflation and a high proportion of bad loans in the bank sector.
Deflation fell slightly in 2002, possibly as a result of the central bank's attempts to increase the liquidity of the economy through extensive monetary policy initiatives. However, deflation looks set to stay. Furthermore the scope for stimulating the economy through fiscal policy measures is limited as Japan is running a substantial budget deficit and has large and growing public debt.
Future growth in Japan will depend primarily on how far the Japanese government is able to take its reform agenda. It is clear that Japan is in major need of structural reforms to bring about higher long-term growth. However, it has proved difficult for the government to push the necessary reforms through. If the government manages to implement extensive reforms, there is a risk of this leading to a worse economic situation in the short term as it would probably mean a credit crunch, higher bankruptcies and rising unemployment.
During the forecast period, domestic demand is expected to remain weak while external demand is expected to strengthen as the global economy picks up. However, Japan's export sector is not sufficiently large to generate substantial GDP growth (the export sector accounts for just over 10 per cent of GDP). In view of Japan's structural problems and the rate of reform that the government has achieved so far, growth is expected to remain weak throughout the forecast period. GDP is expected to grow by 0.7 per cent this year and 0.8 per cent next year.
The rest of Asia
The Asian economies have been relatively unaffected by the slowdown in the global economy. Asia excluding Japan was the world's fastest growing region last year. This growth was driven primarily by strong export growth fuelled by the region's competitive position. China is accounting for the greatest growth and is making a positive contribution to growth in the region with its strong domestic demand and imports from neighbouring countries. The favourable situation in Asia is expected to continue during the forecast period and GDP growth is forecast to be 6.1 per cent this year and 6.3 per cent next year.
25
Latin America
Domestic problems in several Latin American countries had a negative impact on economic activity in the region in 2002. Combined with the global slowdown, which resulted in, among other things, reduced interest in inward investment, this triggered a recession in the region last year. However, the economy is expected to pick up in 2003. The situation in Brazil and Argentina looks set to stabilise somewhat, and developments in Mexico remain relatively favourable. Exports and industrial output are expected to grow as a result of the recovery in the international economy and depreciated exchange rates. However, uncertainty about domestic political developments has dampened growth. Altogether GDP is expected to grow by 1.6 per cent this year and 3.0 per cent in 2004.
2.4 Developments in Poland, the Baltic States and Russia
The Polish economy is expected to recover gradually after a period of weak economic growth. The recovery is likely to be driven above all by household consumption but also by gradual growth in exports. In the longer term investment is also expected to contribute to growth. GDP growth is forecast to be around 2.5 per cent this year and 4.0 per cent next year. However, high unemployment, continued weak investment growth and dependence on the weak German economy are risk factors for the anticipated economic recovery in Poland.
The Baltic States have bucked the global economic downturn thanks to strong domestic demand fuelled by falling unemployment and rising real wages. The region's average rate of growth has been substantially above that of the EU and is expected to remain so in 2003 and 2004 at 5-6 per cent. Both continued strong domestic demand and stronger exports are expected to boost GDP growth. However, the need for fiscal policy tightening may dampen growth.
Despite a slowdown at the end of the year, the Russian economy grew by 4.3 per cent in 2002. Exports of energy and household consumption were the main drivers. Government finances were favourable and the previous outflow of capital slowed. A sharp drop in oil prices is the greatest threat to the Russian economy in the short and medium term. Provided that this does not happen, growth is expected to be 4.0 per cent in both 2003 and 2004.
2.5 Swedish world market growth
As a result of the relatively weak global recovery last year, the situation for Swedish exports improved only marginally. World market growth—the trade-weighted import demand for processed goods encountered by Sweden's exporters—is estimated to have been just 1.9 per cent last year. This can be compared with a historically low - -0.1 per cent in 2001. There are some signs of recovery in world trade and, given continued global economic recovery, world market growth is expected to rise to 5.6 per cent this year and 7.7 per cent next year.
26
The Iraq crisis has dominated developments in the financial markets at the beginning of this year. Investors have been widely offloading equities in favour of safer interest-bearing securities.
During the autumn it appeared that the financial markets were beginning to normalise. Yields and, above all, equity prices rallied strongly. One factor contributing to the stock market rally was the fact that corporate earnings for the third quarter were not quite as weak as had been feared. The absence of further major accounting scandals also helped to increase interest in equities. However, the macroeconomic signals continued to reveal a mixed picture of the economic outlook, and firms were being cautious in their projections. Combined with increased concern about war in Iraq, this caused share prices to begin to fall again at the end of 2002. The geopolitical uncertainty has since continued to weigh down the financial markets.
The credit market has developed positively and the yield differential between corporate and government bonds has narrowed since September. Interest in corporate bonds has been boosted by firms focusing on cleaning up their balance sheets and reducing their debt. At the same time the low yields on government bonds, coupled with the poor performance of the stock markets, have helped to fuel investors' interest in corporate bonds. In the currency market the uncertain geopolitical situation and related uncertainty about the outlook for both the economy and earnings meant that the dollar began to weaken against the euro once again at the end of 2002 and has continued to do so at the beginning of 2003.
The Riksbank, the European Central Bank (ECB) and the US Federal Reserve lowered their key interest rates in late 2002 and early 2003 due to reduced inflationary pressure and the uncertain economic climate. Further interest rate cuts from the ECB and the Riksbank are anticipated during the spring and summer. The Federal Reserve is expected to begin to tighten monetary policy from very low levels at the end of 2003 in line with reduced uncertainty and a better economy. It is forecast that the ECB and the Riksbank will also begin to return to a more neutral monetary policy in 2004.
After a brief upswing in the autumn, market interest rates have fallen back and are now at very low levels by historical standards. Market interest rates are predicted to remain low for a while until the uncertainty in the financial markets subsides. They are expected to rise during the course of 2003 as the geopolitical uncertainty abates and the international economy picks up.
The krona continued to strengthen in 2002 and early 2003. The trade-weighted TCW index stood at around 130 at the beginning of April 2003, which is the strongest level for more than two years. Some further appreciation of the krona is forecast during the course of the year.
3.1 International developments
Low market rates in the United States
The Federal Reserve lowered its key interest rate by 0.5 percentage points in November 2002. The cut was prompted by the increased geopolitical uncertainty being expected to dampen activity in the US economy. The key interest rate is expected to hold at its current level for some time, but a further reduction during the spring to boost economic recovery cannot be ruled out. The recovery in the US economy is expected to take off in the second half of this year, and the Federal Reserve is expected to raise its key rate at the end of 2003. This tightening of monetary policy is expected to continue in 2004 as the recovery gains momentum and resource utilisation in the US economy increases. The forecast for the key US interest rate is 1.75 per cent in December 2003 and 4.0 per cent in December 2004.
27
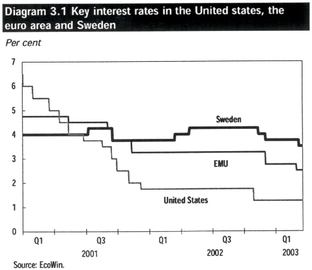
US market interest rates are at historically low levels. Concern about developments in the Iraq conflict and the effects this might have on the economy and the security policy situation has dominated developments in the financial markets in 2002 and early 2003. Any remaining major geopolitical risks following on from the Iraq conflict could lead to a less favourable economic climate than anticipated. It is assumed that the geopolitical uncertainty will abate and the economic upswing will become obvious during 2003, leading to rising market interest rates. A growing US borrowing requirement is predicted for 2003, which may contribute to an increase in interest rates. The forecast for the US 10-year government bond yield is 5.0 per cent in December 2003 and 5.8 per cent in December 2004.
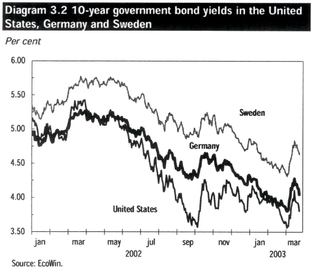
Interest rates in the euro area
The ECB lowered its key interest rate by a total of 0.75 percentage points during the winter and the refi rate is now 2.5 per cent. In its latest statements, the ECB has signalled increased concern about economic growth and toned down the inflationary risks. The European economy is expected to perform weakly in 2003 and inflation is expected to fall back during the second half of the year. It is therefore estimated that the ECB has scope to lower its key interest rate by a further 0.5 percentage points during the year. The key interest rate is estimated to be 2.0 per cent in December 2003. The European economy is expected to follow the US economy after a certain time lag, with recovery expected at the end of 2003. In 2004 the ECB is expected to tighten monetary policy slightly as the economy improves and inflation begins to rise. The key interest rate is estimated to be 3.5 per cent in December 2004.
28
European market interest rates have fallen to very low levels. Long rates are expected to start rising in late 2003 as the security policy uncertainty subsides and the economic outlook brightens. The forecast for the German 10-year government bond yield is 4.5 per cent in December 2003 and 5.4 per cent in December 2004.
Euro/dollar exchange rate
The depreciation of the dollar that began in spring 2002 continued with renewed vigour during the winter. Several factors have weakened the dollar over the last year. Several major accounting scandals broke in the United States in 2001 and 2002, which undermined international investors' interest in investing in US assets. In late 2002 and early 2003, uncertainty about the Iraq conflict put pressure on the dollar. The currency market was worried partly that war in Iraq would prove costly for the United States. There are probably several factors contributing to the depreciation of the dollar, the common denominator being that investors' focus has shifted from growth differentials and corporate earnings to interest rate differentials. The low interest rates in the United States relative to the euro area and the United Kingdom, for example, are currently not attracting sufficiently large capital inflows, which is having a dampening effect on the dollar.
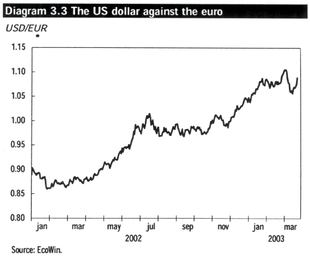
Once uncertainty about the situation in Iraq and the economic outlook gradually begins to subside over the course of this year, this is expected to help strengthen the dollar somewhat. The US economy is forecast to grow faster than that of the euro area, which is expected to lead to demand for US assets increasing once again as investors' focus returns to corporate earnings.
International stock markets
Uncertainty is dominating developments in the international stock markets. In autumn 2002 the stock market slide was temporarily interrupted in connection with the publication of third-quarter results. One factor contributing to the upswing was the fact that corporate earnings for the third quarter were not quite as weak as had been feared. In late 2002 and early 2003 the security policy situation deteriorated again, as did the earnings outlook in a number of sectors, which put the dampers on the stock markets. The Iraq conflict and uncertainty about the more long-term economic effects of the crisis have also weighed down the stock markets. The downturn has been sharpest in Germany but the stock market has also fallen sharply in the United Kingdom, for example. The stock market slide has not been quite as marked in the USA and Sweden. One explanation for the sharp fall in Germany is that the insurance companies, which make up a major part of the index, are battling with major problems.
29
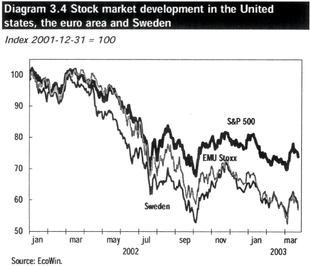
In the immediate future the stock markets will be affected by the geopolitical situation but in the longer term the outlook appears to be brighter. The assumption that uncertainty relating to the Iraq war will subside means that investors' focus will return to economic growth. Continued economic recovery will pave the way for a recovery in corporate earnings, which will boost equity prices.
3.2 Sweden
The Riksbank lowered its key interest rate during the winter. The cuts were motivated primarily by the poor performance of both the Swedish and international economies and a deterioration in the outlook. The increase in oil and energy prices in late 2002 and early 2003 undoubtedly helped to push inflation above the Riksbank's upper tolerance level in February. However, the Riksbank has toned down the inflation risks and believes that the upswing in inflation is temporary. Instead the Riksbank has emphasised the unstable geopolitical situation and the associated economic uncertainty. Weak economic growth in 2003 coupled with a restrictive fiscal policy will pave the way for slower price growth in 2003 and 2004. Lower energy prices are also anticipated during the spring, which will also help to dampen inflationary pressure in the Swedish economy. The Riksbank is therefore expected to lower its repo rate further in 2003. In 2004 the Riksbank is expected to tighten monetary policy as resource utilisation in the Swedish economy increases. The repo rate is estimated to be 2.75 per cent in December 2003 and 4.0 per cent in December 2004.
Swedish market interest rates dropped in line with international rates in 2002 and early 2003. Market interest rates have been trending downwards since roughly a year back. Weak stock markets coupled with an uncertain economic and security policy situation have helped to increase investors' risk aversion and so boosted demand for government bonds. Swedish market interest rates are forecast to begin to rise in line with international rates in 2003 as the economic climate improves and uncertainty in the financial markets subsides. The forecast for the Swedish 10-year government bond yield is 5.0 per cent in December 2003 and 5.8 per cent in December 2004.
The differential between Swedish and German 10-year government bond yields has been relatively stable at around 50 basis points (0.5 percentage points) over the last year. The differential is forecast to narrow slightly during the forecast period, partly as a result of the Swedish repo rate being expected to draw close to the ECB's key rate. Relatively stable Swedish public finances are also expected to contribute to a smaller differential. The forecast for the differential between Swedish and German 10-year government bond yields is 50 basis points in December 2003 and 40 basis points in December 2004.
30
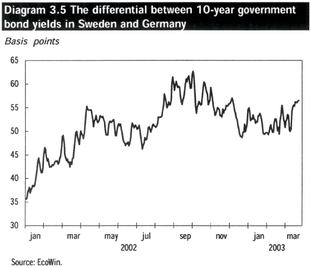
Since autumn 2001 the krona has appreciated from around 146 to around 130 as measured by the TCW index. Some further appreciation is predicted, based in part on continued improvements in the current account balance and reduced unrest in the financial markets. The forecast for the TCW index is 127 for both December 2003 and December 2004.
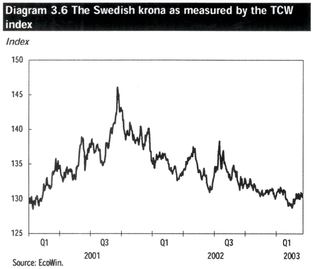
The Stockholm Stock Exchange (Stockholms-börsen) has continued to develop in line with leading international stock markets. From the beginning of October to the end of November the exchange gained around 37 per cent. The Swedish stock market has since performed relatively poorly and the SAX index has fallen by around 3 per cent since the beginning of the year. Altogether the exchange has lost around 65 per cent of its value since peaking in March 2000.
The Riksbank's balance of payments statistics reveal that foreign investors made net purchases of Swedish portfolio shares totalling SEK 18.3 billion in 2002. The total of the current account balance, capital transfers, direct investment and income on equity has historically shown a relatively good correlation with the path of the krona. In 2002 this measure amounted to SEK 116.7 billion, which may have contributed to the appreciation of the krona.
31
Table 3.1 Balance of payments financial accounts
Flows, SEK billions
| | 2001 | 2002 | |||||
|---|---|---|---|---|---|---|---|
| A. Current account | 88.2 | 97.2 | |||||
| B. Capital transfers | -2.1 | -0.8 | |||||
| C. Financial account | 16.8 | -140.8 | |||||
| Direct investments | 53.6 | 2.1 | |||||
| Portfolio investments | -135.4 | -108.3 | |||||
| Debt securities | 123 | -126.5 | |||||
| Swedish | -4.5 | -35.2 | |||||
| Foreign | 127.5 | -91.3 | |||||
| Equities | -258.3 | 18.2 | |||||
| Swedish | -230.3 | -10.1 | |||||
| Foreign | -28 | 28.3 | |||||
| Financial derivatives | -53.2 | -1.8 | |||||
| Other investments | 141.1 | -25.4 | |||||
| Reserve assets | 10.7 | -7.4 | |||||
| D. Net errors and omissions | -102.9 | 44.4 | |||||
Source: Riksbank.
Table 3.2 Interest and exchange rate assumptions
Final entry for each year
| | 2002 | 2003 | 2004 | 2005 | 2006 | |||||
|---|---|---|---|---|---|---|---|---|---|---|
| Repo rate | 3.75 | 2.75 | 4.00 | 4.75 | 4.75 | |||||
| 6-mth interest rate | 3.54 | 3.35 | 4.60 | 4.90 | 4.90 | |||||
| 5-year interest rate | 4.14 | 4.50 | 5.30 | 5.30 | 5.30 | |||||
| 10-year interest rate | 4.71 | 5.00 | 5.80 | 5.80 | 5.80 | |||||
| Spread SEK-DEM, 10 yr | 0.52 | 0.50 | 0.40 | 0.40 | 0.40 | |||||
| 6-mth EURIBOR | 2.80 | 2.60 | 4.10 | 4.60 | 4.60 | |||||
| TCW index | 131 | 127 | 127 | 127 | 127 |
Source: Ministry of Finance.
Economic effects of interest rate convergence following a "yes" in the referendum on the introduction of the euro
Participation in EMU would mean that Swedish interest rates would approach those in the euro area. The ECB's monetary policy decisions would dictate short-term Swedish market interest rates, while long-term Swedish market interest rates would be affected by the krona being replaced by the euro and by the Swedish bond and money markets being integrated with those in the euro area. The following provides an assessment of the scope of interest rate convergence and its short-term effects on growth.
Interest rate convergence
Following the introduction of the third stage of EMU, all countries in the euro area will have the same currency and a common monetary policy. This means that interest rates on short-term
32
government paper with the same maturities tend to be the same irrespective of the country in which the bills are issued. Following a "no" in the referendum, the Riksbank's key interest rate is expected to be higher than the ECB's key rate over the next few years. Following a "yes" in the referendum, short-term interest rates will close on the corresponding rates in the euro area. On 1 January 2006 interest rates on Swedish government bills are expected to be the same as those in the euro area. Thus interest rate convergence will take place even before the krona is replaced by the euro. The speed of the convergence process depends in part on how the Riksbank formulates its monetary policy, but it is reasonable to assume that interest rates on short-term government paper during the ERM2 period will on average be higher following a "no" in the referendum than a "yes".
When it comes to government bonds, interest rates vary between the euro countries. The differences are small and depend in part on each country's credit risk, the liquidity of its government bonds and the general state of central government finances. Other factors that can impact on government bond interest rates are exchange rate risk and the central bank's monetary policy, but these factors are the same for all EMU participants and do not contribute to any interest rate differentials between them. Since Swedish government bond interest rates are substantially higher than the equivalent interest rates in the euro area, this interest rate differential will probably be smaller on 1 January 2006 than it is today.
One pertinent example is Finland, which joined ERM2 in autumn 1996 and participated in EMU from January 1999. Upon the country's entry into ERM2, Finnish government bond interest rates converged with those in Germany, and the 10-year interest rate differential has been around 0.1 percentage points since 1999. For Sweden, which is comparable to Finland in terms of credit rating and market liquidity, among other things, this means that the differential between Swedish and German 10-years government bonds could narrow by as much as 0.5 percentage points.
Participation in EMU is also expected to lead to lower credit interest rates. This means that interest charges for households and firms are expected to be lower following a "yes" in the referendum than following a "no". The interest rate differential between Swedish credit instruments and equivalent credit instruments in the euro area will probably narrow further than the differential for government bonds. There are two factors pulling in this direction. Firstly, participation in EMU should mean that competition between banks and credit institutions increases and puts pressure on interest margins. Secondly, the Swedish banking system will be integrated with the banking system in the euro area. Credit risks can then be managed more efficiently, which can be expected to lead to lower interest rates. Interest rate variations will probably also decrease following participation in EMU.
Following a "yes" in the referendum, Swedish credit interest rates are forecast to converge with interest rates in the euro area as early as this year (see table below). Credit market interest rates are forecast to be around 0.7 percentage points lower at the end of 2004 than following a "no" in the referendum and around 0.4 percentage points lower at the end of 2005.
Anticipated effects on the real economy
The lower interest rates following participation in ERM2/EMU (relative to interest rates following a "no" in the referendum) are expected to provide a positive stimulus for Swedish households and firms. The effect on the economy depends in part on the size of the output gap, i.e. the difference between actual and potential output. If resource utilisation is low, the drop in interest rates will have a positive impact on growth and employment; if resource utilisation is high from the outset, the more expansive climate may lead to inflationary pressure that needs to be countered with a tighter fiscal policy. However, resource utilisation in the Swedish economy is believed to be low at present and the output gap for 2003 is estimated to be - -1.4 per cent of GDP.
To analyse how a number of key variables—such as GDP growth, inflation and fiscal policy orientation—are likely to be affected by lower interest rates, a simulation model has been used. It is
33
important to stress that model simulations always reflect a simplified picture of reality, which means that the results should first and foremost be interpreted in qualitative terms.
The simulations indicate that the lower interest rates following a "yes" in the referendum may have quite considerable effects on GDP growth. According to these calculations, GDP growth will be around 0.7 percentage points higher in 2004 and 0.3 percentage points higher in 2005 following a "yes" in the referendum than following a "no". The lower interest rates and higher growth will also lead to the output gap closing more quickly, and inflationary pressure is expected to increase slightly at the end of the ERM2 period.
Since GDP growth in 2004 and 2005 is expected to be higher following a "yes" than following a "no", public finances will also be stronger. Besides the improved demand situation, lower government bond interest rates will have a positive impact on public finances through lower interest charges on the central government debt. The faster closing of the output gap will not result in any major structural improvement in public finances, but lower interest rates on the central government debt will mean that structural saving is likely to be higher following a "yes" than following a "no".
In the long term, participation in EMU may lead to slightly lower real interest rates in Sweden. This is due in part to the removal of the exchange rate risk associated with investments in krona assets, which currently means that investors demand a compensatory margin. Lower real interest rates have positive effects on investment and should therefore lead to higher GDP levels in the long term as well.
In summary, a "yes" in the referendum will probably lead to lower interest rates. There are believed to be unutilised resources in the Swedish economy, and a demand stimulus is needed to keep this period of underutilisation brief. The lower interest rates following a "yes" in the referendum are therefore expected to have positive effects on growth and employment, primarily in the short term.
Anticipated effects of participation in EMU on GDP growth and interest rates
Differences in growth and market interest rates compared with a "no" in the referendum
| | 2003 | 2004 | 2005 | |||
|---|---|---|---|---|---|---|
| GDP growth | 0.00 | 0.70 | 0.30 | |||
| Market interest rate | -0.25 | -0.70 | -0.40 |
Source: Ministry of Finance.
4 Foreign trade
Swedish exports have suffered from an unfavourable export composition and unusually weak investment activity in several important export markets ever since the beginning of the global economic downturn in late 2000. In early 2002, the negative trend was broken—unexpectedly—by very strong growth in exports of, mainly, motor vehicles and ICT products(2). The total increase in the first half of the year was approximately 6 per cent compared with the previous six months. A slowdown in the latter part of 2002 was nevertheless forecast in the Budget Bill for 2003. However, exports of goods fell considerably more than forecast, and the consecutive decline for the second half of 2002 is estimated at -3 per cent according to the National Accounts. Excluding ICT products and motor vehicles, the trend was, however, more in line with the global economy. During the winter months, exports of goods have again improved, particularly demand for consumer and intermediate goods and motor vehicles.
- (2)
- ICT refers to information and communication technology.
34
However, uncertainty in connection with the Iraq crisis is having a restraining effect on the economic players, as reflected in statements by major export firms. As uncertainty declines and the global economy improves, demand for Swedish export goods is assumed to increase. World market growth is not expected to approach the historical average until 2004, and Swedish exports of goods are then estimated to rise by 7.4 per cent, compared with 3.8 per cent this year.
Imports of goods declined last year for the second consecutive year. The weak trend was largely a result of the weak export trend. However, imports of goods are expected to increase in the future for a number of reasons. Industrial activity is strengthening and exports of goods are expected to increase. The demand for imported intermediate goods for production will therefore increase. Moreover, destocking mainly of intermediate goods, which has had a restraining effect on imports over the past year, is now estimated to be completed. Household consumption is also expected to continue to rise during the forecast period, thereby increasing household demand for imported goods. This trend is moreover supported by an anticipated fall in import prices in the next few quarters as the Swedish krona continues to strengthen.
The downturn in trade in services, which began in the winter of 2001, accelerated during the course of 2002. A sharp reduction in exports, mainly of ICT-related services and so-called merchanting(3), resulted in exports of services declining by just over 16 per cent year on year in the fourth quarter of last year. Nevertheless, the services balance made a neutral contribution to growth, but the trend towards the end of last year results in trade in services being forecast to make a negative contribution to growth equivalent to 0.4 percentage points this year. Once again making a positive contribution in 2004.
- (3)
- Merchanting refers mainly to trade margins, i.e. the profit obtained in various commodity broking agreements.
Table 4.1 Exports and imports of goods and services
| | | Percentage change in volume | |||||||||||
|---|---|---|---|---|---|---|---|---|---|---|---|---|---|
| | SEK billion 2002 | ||||||||||||
| | 2002 | 2003 | 2004 | 2005 | 2006 | ||||||||
| Exports of goods | 806 | 2.3 | 3.8 | 7.4 | 6.6 | 6.3 | |||||||
| Processed goods(1) | 672 | 2.2 | 4.6 | 8.4 | — | — | |||||||
| Exports of services | 226 | -5.9 | -3.2 | 5.3 | 5.0 | 5.0 | |||||||
| Total exports | 1032 | 0.4 | 2.3 | 7.0 | 6.3 | 6.0 | |||||||
| Imports of goods | 638 | -1.4 | 2.8 | 6.5 | 6.3 | 6.1 | |||||||
| Processed goods(1) | 498 | -3.1 | 2.5 | 7.0 | — | — | |||||||
| Imports of services | 229 | -6.1 | 0.8 | 4.3 | 6.0 | 6.0 | |||||||
| Total imports | 867 | -2.7 | 2.3 | 6.0 | 6.2 | 6.1 | |||||||
- (1)
- Classification according to SNI.
Sources: Statistcs Sweden and Ministry of Finance.
4.1 Exports of goods
The latter part of the 1990s was a very successful period for Swedish export firms. Strong global demand for investment goods, especially ICT products, together with a favourable competitive situation in other respects, contributed to Swedish exports of processed goods increasing their market shares by just over 1 per cent per year between 1994 and 2000. Since then, the economic players have, however, become more cautious when making investment decisions, and financing conditions have in many cases deteriorated significantly. Overall, this has had a restraining effect on investment, and global investment
35
activity has consequently been weak over the past two years, which has had a major impact on the investment goods intensive Swedish export industry. The positive trend for rising Swedish market shares was therefore broken in 2001, but thanks to the increase in exports mainly of commodities and commodity-related products, market shares increased again last year. As indicated in the introduction, the underlying demand for processed goods was, however, weak and Swedish exports are therefore expected to lose market shares this year before regaining market shares as global demand for goods from traditional Swedish basic industry recovers.
Underlying increase in exports of goods
The positive export growth in the first half of 2002 was focused on the United States, while other markets showed negative or unchanged growth in demand. Even though exports to the US market fell back after a strong start, trade statistics broken down by country from the end of 2002 indicate that exports to the United States are again rising. Moreover, exports to non-OECD countries including China and the rest of South-east Asia rose in the second half of the year. Although imports in the EU and the Euro area recovered in late 2002, Swedish exports of goods to the European economies continued to be low and show no clear signs of improvement.
The sharp increase in exports of ICT products and motor vehicles at the start of last year was largely based on temporary factors. For example, complementary investments in second generation mobile systems may be assumed to have caused the strong exports of ICT products. Instead, underlying exports of processed goods, excluding motor vehicles and ICT products, continued to be weak.
Exports of goods in the second half of the year, which in aggregated terms showed low growth rates, appear to have been, however, the start of the cautious upturn now to be seen in various indicators. Thanks to increased demand for consumer goods, intermediate goods and, to some extent, investment goods, Statistics Sweden's foreign trade statistics have shown a continuous improvement since the end of last year. Overall, it may therefore be said that the growth conditions for Swedish exports of goods appear, from both an industrial and a geographical perspective, to be more broadly based than previously, despite the risks associated with the Iraq crisis.
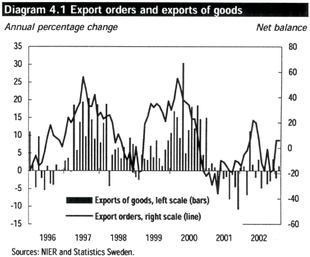
Improved outlook, but considerable risks remain
In the EU and the euro area, which accounted for 54 per cent and 39 per cent respectively of the Swedish export market in 2002, investment is not expected to rise significantly this year. In the USA, however, some improvement in the will to invest has been seen, but low capacity utilisation in industry and strained balance sheets will probably result in investment rising relatively slowly this year. In non-OECD countries, the economic situation appears to have already improved, and exports of Swedish goods to these countries are forecast to develop favourably. The demand for imports of processed goods on Swedish export markets, i.e. world market growth, is estimated to rise overall by 5.6
36
per cent this year and 7.7 per cent in 2004. The uncertain global outlook, mainly as a consequence of the Iraq crisis, may change the conditions, however, for Swedish exports, particularly if the conflict is prolonged or leads to an increased risk of terrorism.
Notwithstanding such a development, Swedish competitiveness is supported by low relative unit labour costs, measured in a common currency. Together with relatively strong exports of intermediate goods, this will help to limit the loss of market shares in 2003. As global investment activity improves, Swedish exports will increasingly strengthen and are expected to regain market shares.
The NIER's Business Tendency Survey, in which confidence has increased on a broad front over the past few months, suggests that both the intermediate goods and the investment goods industries are experiencing an increased inflow of export orders. This picture is confirmed, to some extent, by Statistics Sweden's order statistics and by the Purchasing Managers Index. On the whole, statements by companies and trade associations are cautiously positive, although the majority point to the current genuine uncertainty owing to the Iraq crisis. The relatively bright picture currently to be seen in various indicators is assumed to be at least partly a result of some stockbuilding, as the Iraq war may potentially lead to significant supply and production disruptions.
World market growth is expected to be considerably higher this year than last year, but demand is assumed to be mainly focused on consumer and intermediate goods. Consequently, Swedish exports of goods are only estimated to rise by 3.8 per cent this year. As resource utilisation and industrial output rise, investment goods are, however, expected to account for an increasing proportion of global imports. A favo-urable composition of demand for Swedish export goods, together with further slightly higher world market growth, is overall estimated to lead to an increase in exports of goods of 7.4 per cent in 2004.
Continued high price competitiveness on export markets
Weak global demand for traditional Swedish export products last year led to a fall of 2.5 per cent in export prices, i.e. Swedish export firms' prices expressed in Swedish krona. The negative impact on profit margins was limited to some extent by a weak exchange rate and high productivity. However, the forecast strengthening of the krona will reduce the scope for Swedish firms to compete on price, and price rises announced in some export sectors may be assumed to be due to the recent exchange rate trend. Competitive pressure is expected to be high throughout the forecast period, but will decline as the demand for intermediate and investment goods rises.
Exports of goods during the estimate years
Considerable uncertainty is inherent in forecasting developments for the estimate years, i.e. 2005 and 2006. The estimates are largely based on assumptions regarding trend growth in GDP and foreign trade.
The global economy is expected to continue strengthening after 2004, resulting in increased demand for investment and intermediate goods. Export growth during the estimate years is limited, however, by the historical pattern, which indicates that world market growth exceeds Swedish export growth, if the exchange rate remains unchanged.
In 2005 and 2006, exports of goods are forecast to rise by just under 6.5 per cent per year. Increased global demand also makes higher export prices possible, which are estimated to rise by an average of 1.1 per cent during the estimate years.
4.2 Imports of goods
During the period 1994-2000, imports of goods to Sweden rose by on average almost 9 per cent per year. The large increase was mainly due to the successes reaped by the Swedish export industry during this period. The explanation is that a large part of Sweden's exports are produced using
37
imported intermediate goods. However, there was a rapid reversal in Swedish imports of goods in the first half of 2001 and the trend has since been considerably weaker. The reversal was due to a dampening of domestic demand in general and substantially weakened exports of goods in particular.
Following a decline of 5.5 per cent in 2001, imports of goods fell for the second consecutive year last year and a decline of 1.4 per cent was measured. As yet, no clear recovery is to be seen according to the National Accounts, but several factors indicate a future increase in imports of goods to Sweden.
Increased imports of goods in the future
Imports of goods are expected to pick up in the future in connection with the recovery in industrial activity. The inflow of orders is reported to have risen mainly from export markets and the recovery in global demand is expected to continue. Exports of goods rose last year and this increase will continue for the next few years according to the forecast. Household demand for imported goods is also expected to rise, since household consumption will continue to increase during the forecast period. The same applies to investments, which should contribute to increased imports of both intermediate and investment goods particularly in 2004. A further contributory factor is that industry's stocks of intermediate goods declined at the end of last year. It is thus probable that the destocking that restrained imports over the past year is completed and the need to import new intermediate goods has therefore increased from the start of this year. It is true that stocks of finished goods are still estimated to be slightly larger than necessary. On the other hand, stocks of intermediate goods are reported to be just large enough or even slightly too small in some industries.
Import prices are expected to fall this year as the krona appreciates before rising slowly next year as a result of the global economy strengthening.(4) This will stimulate increased imports in the immediate future.
- (4)
- For a more detailed account see Chapter 8.
Overall, imports of goods are estimated to rise by 2.8 per cent this year and 6.5 per cent next year, resulting in the import ratio(5) being largely unchanged this year and then rising somewhat next year. Historically, the import ratio has risen by an average of 1.5-2.0 per cent per year.
- (5)
- Imports of processed goods in relation to import-weighted demand.
During the estimate years, i.e. 2005 and 2006, the import ratio is expected to normalise and imports of goods to rise by 6.3 per cent and 6.1 per cent respectively.
Continued weak trend for imports of telecommunication equipment
Like exports of goods, imports of goods are, to some extent, dependent on developments in the telecommunication equipment market. The exact relationship between exports and imports of telecommunication equipment is difficult to determine, since in many cases different types of commodity groups are involved, but the covari-ation between them is strong. Consequently, recent weak exports of telecommunication equipment are matched by weak imports of telecommunication equipment. In 2002, imports in this commodity group declined by 14 per cent. However, total imports of goods, excluding telecommunication equipment, were largely unchanged compared with the previous year. This may be compared with a reduction of 1.4 per cent if telecommunication equipment is included. The weak recovery forecast for both exports and output of telecommunication equipment means that imports in this sector are not expected to make a large contribution to total imports of goods in the future either.
38
4.3 Trade in services
Travel declined substantially in the aftermath of the terrorist attacks in September 2001 and both exports and imports of travel funds therefore fell. The invasion of Afghanistan, the beginning of the Iraq crisis and anxiety about further terrorist attacks continued to keep travel at low levels throughout 2002. Reduced private imports of foreign cars further improved net exports of travel funds. However, towards the end of the year, the stronger exchange rate contributed to a marked deterioration in the net travel position, mainly as a result of reduced tourism from abroad. The deterioration in net services towards the end of last year was also accentuated by a sharp reduction in exports of ICT-related services and merchanting.
The considerably lower net exports of services at the end of last year will result in a substantial deterioration in the contribution to growth this year. In 2004, the high services content of export industry sales is, however, expected to lead to a weakly positive contribution from trade in services.
4.4 Current account balance
As a consequence of the relatively higher volume of exports than imports and improved relative prices, the trade balance surplus rose by just over SEK 12 billion in 2002. Despite the stronger krona, the current account balance is expected to continue strengthening during both the forecast period and the estimate period. The improvement in the current account balance is mainly due to the forecast strong export growth. However, investment income is also expected to gradually make a positive contribution as Sweden's net financial position strengthens, resulting in an improvement in net interest. The actual and forecast strengthening of the exchange rate will also contribute to amortisation of liabilities in foreign currency becoming less expensive. Net lending, which comprises the current account balance and capital transfers, is estimated to decline as a proportion of GDP, from 4.1 per cent in 2002 to 3.7 per cent in 2004, and then stabilise at just over 4 per cent during the estimate years.
39
Table 4.2 Balance of payments
SEK billion, current prices, unless otherwise stated
| | 2002 | 2003 | 2004 | ||||
|---|---|---|---|---|---|---|---|
| Trade balance | 147,1 | 155,6 | 171,2 | ||||
| % of GDP | 6,3 | 6,4 | 6,8 | ||||
| Exports of goods | 786,8 | 801,5 | 852,9 | ||||
| Imports of goods | 639,7 | 645,9 | 681,7 | ||||
| Services balance | -5,1 | -27,5 | -32,3 | ||||
| Transportation | 15,7 | 14,1 | 14,0 | ||||
| Travel | -26,6 | -28,2 | -30,0 | ||||
| Other services | 5,9 | -13,4 | -16,2 | ||||
| Wages | -2,0 | -2,3 | -2,0 | ||||
| Investment income | -15,5 | -8,0 | -13,5 | ||||
| Interest | -67,6 | -40,0 | -45,0 | ||||
| Direct investment | 50,0 | 30,0 | 30,0 | ||||
| Portfolio investment | 2,1 | 2,0 | 1,5 | ||||
| Current transfers | -27,3 | -14,2 | -19,6 | ||||
| Current account | 97,2 | 103,7 | 103,9 | ||||
| Capital transfers | -0,8 | -5,3 | -6,0 | ||||
| Net lending(1), % of GDP | 4,1 | 4,1 | 3,9 | ||||
Anm: The current account and capital transfers in accordance with Riksbank definitions.
- (1)
- Net lending is the sum of the current account balance and capital transfers.
Sources: Riksbank and Ministry of finance.
4.5 Gross national income
Gross national income (GNI) is obtained by adding Swedish residents' income from abroad to GDP in current prices, and subtracting nonresidents' income in Sweden. GNI is used as the basis for calculating development aid and Sweden's contribution to the EU. Since interest payments abroad are still high, Sweden's GNI is approximately SEK 20 billion less than its GDP, although the difference is expected to decline in the future.
Since GDP in current prices now includes VAT in the general government sector, GNI has been adjusted upwards by the equivalent amount. The change has previously been taken into account in calculating the EU contribution and will consequently not lead to a higher membership cost.
Table 4.3 Gross national income
SEK billion, current prices
| | 2002 | 2003 | 2004 | 2005 | 2006 | |||||
|---|---|---|---|---|---|---|---|---|---|---|
| GDP | 2340 | 2426 | 2532 | 2652 | 2773 | |||||
| Primary income(1) | -21 | -10 | -13 | -12 | -10 | |||||
| GNI | 2319 | 2416 | 2519 | 2640 | 2764 | |||||
- (1)
- Investment income, wages, subsidies and taxes, net to the rest of the world.
40
Sources: Statistics Sweden and Ministry of Finance.
5 Business sector output
After a considerable rise in business sector output in the late 1990s, development in 2001 and 2002 was weak. The slowdown can be explained by the fact that the international economic downturn has affected Swedish output, particularly because of a considerable fall in the global demand for telecommunication equipment. Domestic demand for goods and services from the business sector has also declined in recent years.
Table 5.1 Business sector output
Percentage change in volume
| | 2001 | 2002 | 2003 | 2004 | 2005 | 2006 | ||||||
|---|---|---|---|---|---|---|---|---|---|---|---|---|
| Agriculture, forestry and fisheries | -0,8 | 1,2 | 2,6 | 1,0 | — | — | ||||||
| Industry | -1,5 | 2,9 | 2,2 | 5,0 | 4,2 | 3,9 | ||||||
| Electricity, gas, heating and water | 6,6 | -2,5 | 1,2 | 1,0 | — | — | ||||||
| Construction | 4,1 | 2,3 | 0,1 | 1,9 | — | — | ||||||
| Services | 2,1 | 1,9 | 1,4 | 2,3 | — | — | ||||||
| Total business sector(1) | 1,3 | 2,1 | 1,6 | 2,9 | 3,1 | 2,9 | ||||||
- (1)
- Excluding FISIM.
Sources: Statistics Sweden and Ministry of Finance.
Business sector output is estimated to continue to increase weakly this year as well and then pick up somewhat next year.
There are signs of a strengthening in industrial activity in the first few months of this year, although uncertainty in connection with the conflict in Iraq entails more cautious production plans. Slowed investment activity in Sweden and the rest of the world combined with a continued weak global economy are also estimated to restrain industrial output for the time being. In late 2003 and in 2004, industrial output is forecast to grow stronger in pace with increasing global and domestic demand.
Despite the fact that a recovery in industrial activity seems to have begun, an increase in firms' demand for services is expected to be delayed somewhat. This is expected to contribute to a slight increase in the output of the service sectors this year. Next year, both industrial firms' and household demand for services is expected to be high.
Construction industry output showed considerably weaker growth last year compared with the past few years, mainly as a result of weak investment developments in manufacturing industry. Weak development in construction output is forecast for the future as well, particularly as a result of a continued low level of housing construction.
In total, business sector output is expected to rise by 1.6 per cent in 2003 and 2.9 per cent in 2004.
Since it has been estimated that there will be available resources in the economy in 2004, business sector output is expected to continue to grow relatively quickly the following year as well. Business sector output is estimated to grow by some 3 per cent per year in 2005 and 2006.
Productivity in the business sector grew by 4.2 per cent last year after growth of only 0.6 per cent in 2001. The strong productivity growth last year can primarily be explained by continued staff cutbacks in industry and the service sectors. There are many indications that employment growth will continue to be weak this year, which means that productivity growth will be maintained despite a moderate increase
41
in output. Next year, a slight increase in the number of hours worked has been forecast while output will pick up slightly. Productivity growth in the business sector is estimated to amount to 2.6 per cent in 2003 and 2.3 per cent in 2004.
5.1 Industry
Output to pick up next year
The economic situation for industry improved somewhat last year compared with 2001, but it was still relatively weak. Industrial output grew by 2.9 per cent last year, which is lower than the average rate of growth of the past 20 years. Output growth in the investment goods industry contributed significantly to an overall increase in industrial output, despite the fact that output in the telecommunication equipment industry fell by more than 10 per cent. Other parts of the investment goods industry, such as the engineering industry and metal products and automotive industries, increased their output last year. It may seem somewhat contradictory that the output of investment goods increased last year at the same time as investment activity in Sweden and the rest of the world was weak. Some of this can be explained by the fact that world demand for Swedish automobiles was high early last year. The output of intermediate goods, on the other hand, fell slightly in 2002.
So far this year, a cautious recovery in industrial activity seems to have begun. For example, the Business Tendency Survey of the National Institute of Economic Research (NIER) indicates that both the inflow of orders and the volume of production for industrial firms have increased and their expectations for the next few months are optimistic.
Despite the fact that a recovery in industrial activity seems to have begun, it is estimated that the continued weak demand for Swedish exports combined with a continued low level of investment activity will restrain output for the time being. In addition, it is estimated that the currently uncertain global situation in connection with the conflict in Iraq will entail greater caution as regards production plans. The Iraq conflict, however, may further change the prerequisites for Swedish industrial output, both in the form of changes in demand and costs, for example a persistently high price of oil.
At the end of this year and next year, demand for industrial goods is forecast to rise as the international economy and the domestic economy strengthen.
Overall, industrial output is forecast to rise by 2.2 per cent this year and 5.0 per cent next year.
Table 5.2 Selected industrial statistics
Percentage change
| | 2001 | 2002 | 2003 | 2004 | ||||
|---|---|---|---|---|---|---|---|---|
| Industrial output | -1,5 | 2,9 | 2,2 | 5,0 | ||||
| Hourly wage costs | 5,1 | 6,7 | 4,3 | 3,7 | ||||
| Productivity | 0,9 | 7,6 | 4,5 | 4,3 | ||||
| Unit labour costs (ULC) | 4,2 | -0,8 | -0,2 | -0,6 | ||||
| ULC, 11 OECD countries(1) | 2,4 | 1,5 | 1,3 | 1,1 | ||||
| ULC, 11 OECD countries(1), SEK | 11,8 | -1,1 | -2,9 | -0,8 | ||||
| Relative ULC, SEK | -6,8 | 0,3 | 2,8 | 0,3 | ||||
| Profin margin | -0,9 | -0,6 | 0,1 | 0,3 | ||||
| Gross operating surplus(2) | 38,0 | 36,6 | 37,2 | 38,3 |
- (1)
- 11 OECD countries refer to Canada, United States, Japan, Belgium, France, Italy, Netherlands, United Kingdom, Germany, Denmark and Norway.
- (2)
- Gross operating surplus refers to operating surplus as share of value added at factor prices.
42
Sources: NIER, Statistics Sweden and Ministry of Finance.
Productivity in industry grew by 7.6 per cent in 2002 after a rate of growth of only 0.9 per cent the year before. The poorer industrial outlook began as early as the autumn of 2000, but firm's adaptation of their workforce to the weaker economy took place with some delay. The number of hours worked fell by more than 4 per cent in industry last year. Therefore, productivity growth was high despite the fact that the increase in output was moderate. Productivity growth is estimated to be relatively high this year and next year as well. During the current year, the number of hours worked is expected to continue to fall, which will result in high productivity growth. Next year, firms' adaptation of their workforce is expected to be concluded. A considerable rise in output is expected to boost productivity growth. Productivity growth is forecast at 4.5 per cent for 2003 and 4.3 per cent for 2004.
Continued good competitiveness in Swedish industry
Last year, rising labour costs in Swedish industry were compensated by the high rate of productivity growth, which meant that unit labour costs fell.
Also during the forecast years 2003 and 2004, the relatively high productivity growth is estimated to continue to balance the rising labour costs and the unit labour costs are forecast to fall. This, however, assumes continued moderate wage increases in line with the assumptions mentioned in Chapter 7.
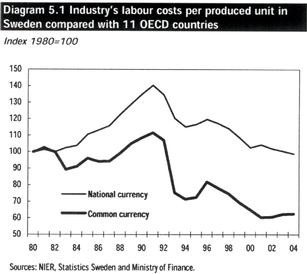
Since 1997 (with the exception of 2001), unit labour costs in Sweden have fallen while they have risen in Sweden's competitor countries, measured in national currency. During the next two years, it is estimated that unit labour costs in national currency will rise more in competitor countries than in Sweden.
The Swedish krona has weakened considerably in the past few years, which has meant that relative unit labour costs, measured in a common currency, have fallen considerably. This means that Swedish competitiveness has been enhanced. This year and next year, however, the anticipated appreciation of the krona is expected to cause an increase in relative unit labour costs, measured in a common currency. In a historical perspective, the competitiveness of Swedish industry is still assessed to be satisfactory.
Profitability of Swedish industry improving somewhat
The appreciation of the Swedish krona last year reduced firms' costs for importing intermediate goods. Furthermore, unit labour costs fell. The stronger krona also forced many firms to lower their prices in Swedish kronor on the export market in order to retain their competitiveness. At the same
43
time, continued subdued industrial activity in Sweden made it difficult for firms to raise their prices on the domestic market. In total, this meant that firms' share of gross operating surplus(6) dropped last year.
- (6)
- Gross operating surplus refers to operating surplus as share of value added at factor prices.
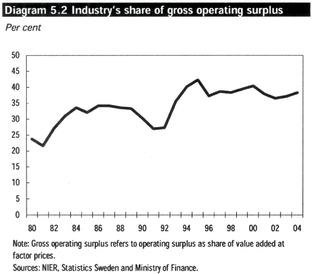
The anticipated appreciation of the Swedish krona this and next year is expected to lead to falling costs for firms importing intermediate goods. The continuing strong productivity growth is expected to compensate for firms' rising labour costs. The appreciation of the Swedish krona is also expected to result in export firms being forced to lower their prices further in order to retain their market shares. On the other hand, firms on the domestic market are expected to be able to raise their prices somewhat. Overall, industry's profitability is expected to improve slightly in the next few years and the share of gross operating surplus is expected to rise to around 37 per cent this year and approximately 38 per cent next year.
5.2 Construction industry
Total construction volume, i.e. construction investment plus repairs, grew by 2.2 per cent last year, which means that the rate of increase has slowed in comparison with the previous two years, when growth was just over 4 per cent. Total construction volume includes parts of the service sectors, for example fees to architects and technical consultants. Costs for building materials are also included in total construction volume. These components are excluded when output in the construction industry is studied in order to prevent these being counted twice when summing up business sector output. Developments in construction volume, however, are much easier to discern in the statistics. Therefore, they function as a target when assessing output in construction industry, which roughly follows the same patterns as developments in construction volume.
In manufacturing industry, construction investment fell by as much as 16 per cent last year, and despite certain promising signs of more industrial activity in the future, these investments in manufacturing industry are expected to continue to decrease this year and then increase slightly in 2004.
The rollout of third-generation mobile networks is taking place in the post and telecommunications sector. At the same time, other investments such as the rollout of broadband services are declining, which means that only a slight rise is forecast for this year. Investment demand is also low for other parts of firms which produce services. The construction of commercial premises, which dropped last year, is expected to continue to drop this year as well as next year. In greater Stockholm, vacancy
44
figures have risen, and as projects that were begun earlier are completed, excess capacity will increase further. However, this is much less of a problem in other parts of the country.
Housing construction, which has up until now boosted construction activity, is now expected to lose momentum although it is still a matter of continued growth. Conditions for the construction of single-family dwellings are estimated to be particularly favourable during the coming year. On the other hand, weak growth is forecast for the construction of apartment buildings this year, followed by a marginal improvement next year.
Within the government sector, investments are expected to follow the grant developments relating to infrastructure investments, which means a continuing increase although at a somewhat slower rate than previously.
According to NIER's latest Business Tendency Survey, the shortage of labour in construction industry lessened during the past two years, at the same time as the percentage of firms stating that demand is insufficient has increased. In pace with the weakening demand situation, prices of submitted tenders have also fallen, which will eventually affect firms' profitability.
As opposed to manufacturing industry, where there are certain signs of a recovery, the developments have continued to be restrained as regards construction industry output and employment. No hopes of a recovery during the next few months were stated in NIER's Business Tendency Survey. Assessments of the size of order books were markedly unsatisfactory last spring, and since then, the majority of construction firms state that the number of orders on hand are unsatisfactory at the existing levels of production resources. The very low demand for architectural services and construction consultants also indicates continued weak construction activity during the forecast period.
Overall, total construction volume is forecast to begin to recover next year. For the whole year 2003, however, the increase is only expected to reach 2.6 per cent and then 2.7 per cent the following year.
Table 5.3 Construction industry
| | | Annual percentage change in volume | |||||||||
|---|---|---|---|---|---|---|---|---|---|---|---|
| | SEK billion 2001 | ||||||||||
| | 2001 | 2002 | 2003 | 2004 | |||||||
| Construction investment | 149 | 4.9 | 1.4 | 2.0 | 2.5 | ||||||
| Business sector | 69 | 4.9 | -12.1 | -2.0 | 1.8 | ||||||
| Authorities | 37 | 6.3 | 16.2 | 7.1 | 1.5 | ||||||
| Housing | 44 | 3.6 | 10.4 | 2.3 | 4.2 | ||||||
| Repairs and maintenance | 76 | 3.6 | 3.7 | 3.7 | 3.3 | ||||||
| Total | 228 | 4.4 | 2.2 | 2.6 | 2.7 | ||||||
Sources: Statistics Sweden and Ministry of Finance.
5.3 Service sectors
Output in the service sectors rose by 1.9 per cent last year. Households stood for the greatest increase in the demand for services. Output in parts of the service sectors linked to households, such as retail and household services, rose considerably last year. This may seem somewhat surprising since household consumption of services was relatively low. One explanation may be that household consumption of goods, particularly retail goods, was high last year. This means a high level of services output in the retail sector. On the other hand, the demand for industrial services weakened and business services and financial services output showed weak growth.
45
During the current year, a recovery in industry is expected to mean that firms will once again require more services. At the same time, household demand is expected to continue to stimulate the production of services.
Overall, output in the service sectors is forecast to rise by 1.4 per cent this year and 2.3 per cent next year.
Productivity growth in the service sectors amounted to 3.2 per cent last year. The high rate of increase in productivity can be explained by a reduction in the number of hours worked for the first time in several years. Service firms' adaptation of their labour force to the weaker demand situation appears to have been subject to a certain time lag. During the current year as well, firms in the service sectors are forecast to reduce the number of hours worked, which will contribute to an anticipated productivity growth of 1.8 per cent. Next year, productivity is forecast to rise by 1.4 per cent.
46
The situation on the labour market is restrained. Employment growth has been weak since early 2001. Measured as an annual average, the number of employed grew by 0.1 per cent last year. Average hours worked per employee fell for the third year in a row. During the year, open unemployment averaged at the same level as in 2001, i.e. 4.0 per cent of the workforce, but at the end of the year, it began to rise. This increase continued during the first few months of this year.
According to the forecast unemployment will continue to rise during most of the year. However, a fall is forecast for late 2003 and, above all, during the course of 2004. On average, open unemployment is expected to reach 4.5 per cent this year. This rise is a consequence of the fact that employment in the economy is falling at the same time as the supply of labour is growing. Output is expected to pick up again during the second half of 2003, which entails greater demand for labour. Therefore, with a certain time lag, employment is expected to once again begin to rise towards the end of the year, with the increase continuing during 2004. At the same time, average hours worked per employee will rise somewhat. Open unemployment is estimated to fall to 4.3 per cent next year.
Table 6.1 Selected labour market statistics
Percentage change unless otherwise stated
| | 2002 | 2003 | 2004 | 2005 | 2006 | |||||
|---|---|---|---|---|---|---|---|---|---|---|
| GDP | 1.9 | 1.4 | 2.4 | 2.6 | 2.5 | |||||
| Productivity | 3.0 | 1.9 | 1.9 | 1.8 | 1.8 | |||||
| Number of hours worked | -1.2 | -0.5 | 0.5 | 0.7 | 0.6 | |||||
| Average hours worked | -1.3 | -0.2 | 0.2 | 0.1 | 0.0 | |||||
| Number of employed | 0.1 | -0.3 | 0.3 | 0.6 | 0.6 | |||||
| Regular employment rate(1) | 78.1 | 77.6 | 77.6 | 77.7 | 77.8 | |||||
| Labour force | 0.1 | 0.2 | 0.2 | 0.3 | 0.4 | |||||
| Open unemployment(2) | 4.0 | 4.5 | 4.3 | 4.0 | 3.8 | |||||
| Labour market policy programmes(3) | 2.6 | 2.2 | 2.0 | 1.7 | 1.7 |
- (1)
- Number of employed in age group 20-64. excluding those employed in labour market policy programmes, as a percentage of the population in that age group.
- (2)
- Percentage of labour force.
- (3)
- People in labour market policy programmes as a percentage of the labour force. The programmes included in this term are those reported by the National Labour Market Board (AMS) as labour market policy programmes and European interpractical scholarships.
Sources: Statistics Sweden, National Labour Market Board and Ministry of Finance.
The number of employed to fall this year
Employment in the business sector fell last year. Indicators of future development indicate that the decline will continue this year. Among other things, Statistics Sweden's vacancy statistics for the fourth quarter of 2002 indicate that the number of vacancies in the private sector continued to fall compared with the same quarter in 2001.
According to the National Institute of Economic Research's (NIER) Business Tendency Survey, firms in manufacturing industry have felt compelled to cut back on the number of employed since early 2001. And this is exactly what they have done. Of the total of 136,000 people who were given notice of redundancy in 2001 and 2002, nearly half were employed in manufacturing industry. Measured as an annual average, employment fell by some 30,000 people between 2000 and 2002. Early this year,
47
manufacturing industry, which last year comprised approximately 17 per cent of total employment in the economy, has been behind just over 35 per cent of the total number of notices of redundancy. Despite relatively expansionary production plans, firms in NIER's Business Tendency Survey state that they are anticipating continuing staff cutbacks. In the forecast, the decline will end during the year.
Construction activity stagnated last year. According to NIER's Business Tendency Survey, firms reduced the number of employees, but this cannot be seen in the outcome of the National Accounts, according to which employment in construction industry actually increased somewhat. This year, the number of employed is expected to remain unchanged. Next year, firms are likely to supplement their workforce somewhat in order to meet growing demand.
The considerable employment growth in the economy as a whole between the years 1998 and 2001 mainly took place within the private service sector. The increase continued last year, even if the extent was much lower than previously. Employment mainly grew in household services, which among other things include private health and medical care. The increase can partly be explained by the fact that several county council operations were corporatised last year. This means that nearly 5,000 people previously classified as county council employees have been registered as household services employees from 1 January 2002. However, even if the corporatisation is taken into account, employment grew in household services nevertheless. This may be due to the temporary employment support payable to municipalities and county councils for 2002. The support is based on labour costs for own operations and on the estimated labour costs of such operations purchased from other producers. Therefore, with this support, municipalities and county councils can not only employ more people themselves, they have also received resources for purchasing more of the services produced by others. The local government sector's increased opportunities for purchasing the labour-intensive services produced by household services may have thus contributed to growing employment in the sector last year.
Employment also continued to grow in business services in 2002. On the other hand, employment in the retail trade and the hotel and restaurant sector fell. According to NIER's Business Tendency Survey, the retail trade is estimating that the number of employees will remain at the same level or increase somewhat in the next few months. In other private service sectors, firms generally intend to cut back on the number of employees somewhat in the future, although there are differences between sectors.
The fact that the total number of employed in the economy nevertheless increased in 2002 is because employment grew in the general government sector. The growth primarily took place in municipalities, which is likely to be partly due to the temporary employment support. A slight increase was also noted in the central government sector whereas the number of employees in county councils fell somewhat as a result of corporatisation. The local government sector has considerable recruitment needs, but the economic situation is expected to only allow for a modest increase in employment during the forecast period. The increase has primarily been made possible by the temporary employment support being extended through 2004. In central government, the level of employment is expected to remain unchanged for the duration of the forecast period.
Overall, the total number of employed in the economy is expected to fall by 0.3 per cent, or 12,000 people, this year. Output is expected to pick up again during the second half of 2003, which entails greater demand for labour. The increase in employment, however, will take place with a certain time lag in relation to GDP growth. The number of employed is expected to increase by 0.3 per cent in 2004.
48
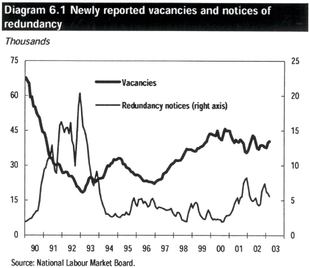
The regular employment rate for persons aged 20-64 in the current forecast is estimated at 77.6 per cent for 2004. By then, the number of people in this age group who are employed in the regular labour market are estimated to have grown by nearly 300,000 since 1997. This can be compared with when the government proposed the target of an 80 per cent regular employment rate in 2004, it was estimated that an increase in employment of some 375,000 people would be needed during the period in order to achieve the target. Higher population growth than assumed earlier implies that it is now estimated that the total increase for 1997-2004 would need to amount to nearly 425,000 people.
One reason for why the relatively weak demand for labour of the past two years has not led to a fall in the number of employed may be that absenteeism has increased.(7) On average, 65,000 more people were absent in 2002 compared with 2000. The growing absenteeism cannot solely be explained by illness, rather the main reason is growing absenteeism due to public holidays. This type of absenteeism arises when public holidays are on what would ordinarily be workdays. Absenteeism due to holidays taken has also increased. In addition, several other types of absenteeism, for example parental leave or when caring for sick children, has increased. The growing absenteeism last year meant that 20,000 fewer people were actually working than compared with 2001. The fall represents 0.5 per cent of all employed persons in 2001. The higher absenteeism may have decreased firms' need to give notice of redundancy.
- (7)
- In the Labour Force Survey (LFS), the employed are defined as the total of 1) persons who have worked at least one hour during a particular week, either as a paid employee or self-employed person, or as an unpaid, assisting family member, and 2) people who ordinarily work as in 1) but who are temporarily absent from work during a particular week. The absenteeism may either be paid or unpaid.
49
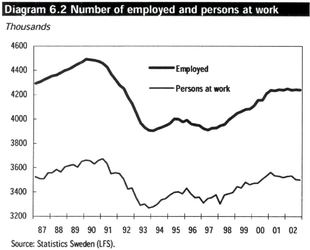
Average hours worked per employee to fall for the fourth consecutive year
Growing absenteeism is also reflected in the fact the average hours worked per employee(8) have fallen. Last year, average hours worked fell by a full 1.3 per cent. The decline was seen in the entire economy. Overall, average hours worked have fallen by 3.8 per cent between 1999 and 2002. An equivalent decline has not been measured since 1980.
- (8)
- Measured as the total number of hours worked during the year according to the National Accounts, divided by the average number of employed according to LFS.
The fall in average hours worked per employee, however, cannot only be explained by the fact that different types of absenteeism have grown. A lower number of ordinary working hours and less overtime have also meant that the average hours worked per person at work have fallen in the past three years, albeit to a much smaller extent.
In the forecast, the average hours worked per employee will continue to fall somewhat this year. Measured per person at work, the average hours worked are unchanged compared with 2002. Next years' considerable production growth in the economy is partly expected to be achieved with the help of a higher level of average hours worked.
Last year's high productivity growth to stabilise during forecast years
The business sector's historically very low rate of productivity growth in 2001 was probably a result of firms' inability to quickly adapt their labour force to weaker demand. There was also probably a certain extent of labour hoarding as well. Labour hoarding refers to firms' retaining labour that they do not fully utilise in the beginning of an economic downturn. This is because they want the labour available when the economy eventually recovers and because they want to avoid costs related to redundancies and recruitment (in a wide sense). Therefore, it was assumed that business sector productivity growth last year was going to be much higher than that of 2001. The increase of 4.2 per cent, however, was larger than forecast. Some of the increase is assumed to be temporary in that the high absenteeism meant that the productivity of persons actually working was higher than what is sustainable in the long run. Productivity growth was surprisingly high in the service sector and retail trade.
This year and next, productivity growth in the business sector is expected to be in line with the average for the latest 20-year period. The increase is estimated to amount to 2.6 per cent this year and 2.3 per cent in 2004.
50
The composition of population growth unfavourable for high labour force participation during forecast years
The supply of labour as well as the number of employed grew by 0.1 per cent last year. This is the equivalent of some 6,000 people. This increase in the supply of labour was primarily due to an increase in the working-age population. At the same time, there was been a reduction in the number of people in early retirement for non-health reasons. The phasing out of the Adult Education Initiative probably contributed to an increased supply of labour, which can be seen by the fact that the number of full-time students in basic education between the ages of 20 and 64 fell. In addition, the number of job seekers who do not fulfil the criteria to be classified as openly unemployed fell, as well as the number of people who consider themselves at leisure. A factor that restrained the increase in the supply of labour was the fact that the number of long-term sick and who are outside the labour force—primarily persons receiving an early retirement pension for health reasons (which from 1 January 2003 is called "sickness compensation")—grew by as many as 31,000 people. In addition, the number of full-time students in basic education between the ages of 16 and 19 grew grown substantially, partly due to a sharply increasing number of people in this age group. The number of students within higher education also grew, as well as other types of students, such as those in labour market policy programmes.
During the forecast period, population growth is also expected to contribute to the supply of labour. However, even if population growth is high in the 16-64 age group overall, the composition of growth is not favourable for a high level of labour force participation at an aggregate level. With the exception of the 35-44 age group, population growth is taking place in age groups with lower than average labour force participation, namely the age groups 16-19, 20-24 and 60-64 years of age.
During the forecast period, the supply of labour will benefit from cutbacks in the number of participants in labour market policy programmes. Most of these are classified by LFS as students. On average, the number participants last year totalled 117,000 per month, which was more than anticipated in the Budget Bill for 2003. This year the number of participants is expected to fall to 97,000, measured as an annual average. As a result of the large number of programme participants since the beginning of this year, this will require a relatively considerable reduction during the remainder of the year. Next year, the number of participants will fall by an additional 10,000 people.
The Adult Education Initiative was concluded last year, when the number of study places in municipal adult education and folk high schools totalled approximately 80,000 altogether. During the period 2003-2005, the municipalities will be offered an earmarked government grant for adult education which will mean the equivalent of 53,500 places. Therefore, it is estimated that the number of full-time students over 20 years of age in basic education will decline this year, which is yet another factor which will contribute to the supply of labour. At the same time, the number of permanent study places in higher education will increase somewhat this year. The high population growth in the 16-19 age group, an age when most people are students, will however limit an increase in the supply of labour. Overall, the number of full-time students will increase somewhat between 2002 and 2004.
The number of sick people outside the labour force is also forecast to increase this year. This is mainly due to an "overhang effect", i.e. the fact that the level in late 2002 was already much higher than the annual average for 2002. The government's proposal for improved occupational health is forecast to result in a stabilisation in the rate of sick leave in each age group and eventually a decline. As a result of the weak labour market, the number of people who for other reasons are outside of the labour market is anticipated to increase somewhat overall during the forecast period.
Overall, the supply of labour is forecast to increase by 0.2 per cent this year and next.
51
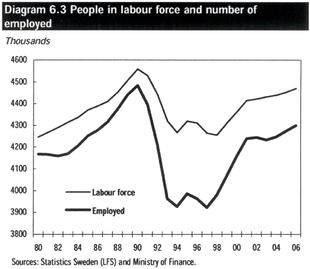
Unemployment to grow this year
The development in terms of the number of people in the labour force and the number of employed last year resulted in an open unemployment equivalent to that of 2001, at 4.0 per cent of the labour force, measured as an annual average. Open unemployment together with the number of participants in labour market policy programmes grew from 6.5 per cent to 6.6 per cent. During the course of 2002, open unemployment gradually grew and the increase continued during the first few months of this year.
The forecast developments in employment and the supply of labour mean that unemployment will continue to grow for the time being. In pace with employment growth next year, however, open unemployment will fall. The government's proposal to ensure that the changed regulations within unemployment insurance will have a full impact will also contribute to the decline. The aim is a more effective job application process and better matching of vacancies and job seekers in order to shorten vacancy and unemployment times.
Overall, open unemployment is forecast to increase to 4.5 per cent this year. As a result of the decline in the number of participants in labour market policy programmes, the number of openly unemployed and programme participants will increase by only 0.1 percentage point. Next year, open unemployment will fall to 4.3 per cent and the total of those who are openly unemployed and programme participants to 6.3 per cent.
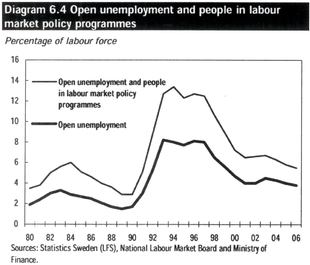
52
Developments after 2004
The medium-term estimate is based on the assessment that there will be available resources at the end of 2004 that can be utilised without creating inflationary bottlenecks. GDP and employment may therefore grow at a relatively high rate in 2005 and 2006. These resources are assumed to be utilised during 2006. As a consequence of the favourable development, open unemployment will fall and the regular employment rate will increase marginally. Relatively high population growth in age groups with relatively low labour force participation and a low employment rate will contribute to weak developments in the employment rate. Productivity is forecast to grow in pace with what is assumed to constitute potential growth. Average hours worked will only rise marginally. The underlying developments are negative as a consequence of demographic developments. Age groups with low average hours worked will grow more than groups with high average hours worked. At the same time, the birth rate is forecast to increase and with it absenteeism for care of sick children. The development in average hours worked in the estimate can therefore be seen as relatively good.
7 Wages
In the 1970s and 1980s, nominal wages rose by an average of approximately 9 per cent per year. At the same time, real wage increases were very moderate as a result of high price increases. In the early 1980s and 1990s, real wages declined. This pattern was broken in the mid-1990s and wage formation has since resulted in relatively low nominal wage increases and higher real wage increases. An equally strong real wage development has not been observed since the 1960s.
One explanation for the favourable development is the benchmarking role of monetary policy in wage formation. The Riksbank's independence has given high credibility to the inflation target, which has led to a clear ceiling for nominal wage increases. This monetary regime has resulted in cooperation agreements between the labour market parties, which have helped to keep nominal wage increases down and created scope for strong real wage increases.
Over the past two years, nominal hourly wages have risen relatively rapidly despite the weak economic situation. Real wages have risen slightly more slowly, as a result of a higher inflation rate.
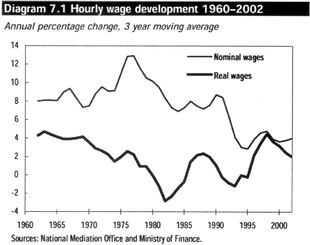
�� According to preliminary statistics from the National Mediation Office, the rate of wage increase fell back somewhat in 2002 compared with 2001. Nominal hourly wage increases were 4.0 per cent for the economy as a whole. The wage development in different sectors reflects resource utilisation in each sector relatively well. In the business sector, wage increases were markedly dampened in the construction sector, where the economic situation was also very weak. Demand was also relatively weak last year in a number of service sectors and business sector wage increases were dampened in the service sectors. The relatively strong rate of wage increase in industry may be related to the small improvement in industrial activity. Productivity growth in industry was a full 7.6 per cent in 2002, which
53
is largely explained by the decline in the number of hours worked. The higher wage increases may therefore also be a consequence of changes in the composition of the labour force.
In the general government sector, wages rose more than in the business sector. Wage increases were particularly high in the local government sector, which may be a consequence of the recruitment difficulties in this sector.
Table 7.1 Hourly nominal wages
Annual percentage change
| | 1999 | 2000 | 2001 | 2002(1) | |||||
|---|---|---|---|---|---|---|---|---|---|
| Business sector | 3.0 | 3.7 | 4.0 | 3.8 | |||||
| Industry | 2.5 | 4.1 | 3.7 | 4.0 | |||||
| Construction | 4.1 | 3.9 | 4.9 | 3.7 | |||||
| Services | 3.5 | 3.4 | 4.3 | 3.7 | |||||
| Public sector | 4.0 | 3.8 | 4.7 | 4.3 | |||||
| Central government | 4.6 | 4.8 | 4.3 | 3.9 | |||||
| Local government | 3.8 | 3.6 | 4.8 | 4.4 | |||||
| Total | 3.4 | 3.7 | 4.3 | 4.0 | |||||
- (1)
- Preliminary figures.
Source: National Mediation Office.
Wage development during the forecast period
The central wage negotiations in 2001 covered the greater part of the labour market and resulted in most cases in three-year agreements. In general, the agreements containing centrally determined wage increases were somewhat front loaded, i.e. the negotiated wage increases gradually declined during the agreement period. As a result, the centrally agreed wage increases are slightly lower for this year than for the past two years. A number of the agreements concluded in 2001 contained a termination clause for the third year of the agreement (1 April 2003 - 31 March 2004). One party—the Swedish Municipal Workers' Union—chose to utilise this opportunity and terminated the agreement with the Swedish Association of Local Authorities and the Swedish Federation of County Councils last autumn. The future agreement will cover approximately 420,000 employees, and due to its size, it will have an impact on wage increases in the whole economy.
At the end of March 2004, the wage agreements for the majority of employees will expire. As a result, a number of central wage negotiations will commence in a period when the Swedish economy is, in general, expected to be characterised by low resource utilisation, which should have a dampening effect on future centrally agreed wage increases. Wage increases beside the centrally determined increases should also rise more slowly.
However, the picture differs between various sectors. In the local government sector, the increasing demand for labour may lead to relatively high centrally agreed wage increases. This could lead to compensation demands, which in turn may lead to higher wage increases in other sectors as well. Historically, various sectors have been highly responsive to wage increases in other sectors, although the conditions in the form of profit levels and resource utilisation have varied. However, in the forecast, wage formation is assumed to function so that relative wage changes are possible without total wage increases in the economy becoming too high.
54
This year, employers' labour costs are particularly burdened by increased premiums to centrally negotiated social security systems. These premium increases alone are expected to contribute to labour costs for the whole economy rising by around 1 per cent this year. The labour market parties are assumed to take these increases into account in the central wage negotiations, reducing the scope for wage increases.
The periodically slightly high inflation rate in the last two years is largely expected to be temporary, and as inflation declines, inflation expectations are also expected to fall. This will also lead to lower wage increases in the future.
Overall, nominal hourly wage increases in the whole economy are assumed to be limited to 3.5 per cent both this year and next year. Since a lower inflation rate is forecast, real wages will also increase at a favourable rate in the next few years.
International comparison
Labour costs, i.e. wages including social security contributions and indirect payroll taxes, have risen more rapidly in Sweden than for its competitors over the past few years (see Table 7.2).
In order to evaluate Sweden's actual change in competitiveness relative to the rest of the world, productivity should be taken into account and the unit labour cost compared, i.e. the labour cost per unit of output. (See Chapter 5 for the development of the unit labour cost in industry.) Taking productivity into account, labour costs in Sweden still have risen more rapidly than is socio-economically desirable.
If labour costs in Sweden rise more rapidly than in the rest of the world, this leads to deterioration in the competitiveness of the business sector, which has a negative impact on output. In the short term, the effect of higher nominal labour cost increases can be offset by a depreciating krona exchange rate and global competitiveness is thus maintained. In order to mitigate inflationary impulses, which may arise both as a result of the weaker krona and increased domestic price pressure, a tightening of monetary policy may, however, be necessary to maintain the objective of price stability. A tighter monetary policy dampens both employment and output, thereby reducing future increases in labour costs. It is therefore not possible for labour costs in Sweden to rise more rapidly than in the rest of the world without this having a negative impact on Sweden's output and employment in the longer term.
Over the past few years, a weakened krona has resulted in Sweden's competitiveness not deteriorating, despite high labour costs. Last year, however, this trend was broken and the krona appreciated against both the euro and the US dollar. At the same time, productivity rose substantially, resulting in competitiveness being largely maintained.
In the next few years, productivity growth in Sweden is assumed to follow the trend in the rest of Europe. At the same time, the krona is expected to appreciate. In order to prevent a weakening of competitiveness, it is therefore important that wage costs in Sweden do not rise more rapidly than for its competitors. If wage increases exceed the assumption in the forecast, output growth and employment growth may be lower than estimated.
55
Table 7.2 Hourly labour costs in business sector
Annual percentage change
| | 1998 | 1999 | 2000 | 2001 | 2002 | |||||
|---|---|---|---|---|---|---|---|---|---|---|
| Sweden | 4.8 | 3.7 | 4.1 | 4.8 | 4.1 | |||||
| EU | 2.7 | 2.8 | 3.5 | 3.7 | 3.6 | |||||
| Euro area | 2.0 | 2.4 | 3.3 | 3.5 | 3.7 | |||||
| US | 3.6 | 3.2 | 4.5 | 4.1 | 3.9 |
Sources: Eurostat and National Mediation Office.
8 Inflation
Sharply rising oil and electricity prices have pulled up inflation in recent months. Nevertheless, energy prices are expected to fall and consequently will have a diminishing influence on inflation during the rest of 2003, after which they will help lower inflation in early 2004. The trend for import prices is expected to continue to dampen inflation. Domestic inflationary pressure is expected to be low during the forecast period, although it is forecast to rise somewhat during 2004.
Inflation, measured with the consumer price index (CPI), is expected to amount to 1.6 per cent at the end of 2003 and to 2.5 per cent at the end of 2004 (see Table 8.1). Measured as an annual average, inflation is estimated to amount to 2.4 per cent this year and 1.8 per cent next year. Underlying inflation, measured with the Riksbank's UND1X, is expected to amount to 1.9 per cent at the end of 2003 and 1.7 per cent at the end of 2004. The difference between CPI inflation and underlying inflation at the end of the period is mainly because according to the forecast, mortgage rates (which are not included in the UND1X) will raise CPI inflation substantially during 2004.
Temporary disturbances have affected inflation in recent years
Inflation has fluctuated greatly over the past two years. These fluctuations have been related more to various temporary supply shocks than to variations in general inflationary pressure in the Swedish economy. Prices rose sharply during spring 2001, especially for meat, fruit and vegetables, as well as oil, petrol and electricity. These price increases were primarily attributable to various temporary supply shocks, pushing inflation up over one percentage point in a short period of time. The final effects of these price increases disappeared from the year-on-year figures during spring 2002, at which time inflation dropped to about 2 per cent.
Over the past few months, substantial price increases for energy have driven inflation up once again. In February, inflation measured with the CPI was 3.4 per cent, while the year-on-year figure for the CPI excluding energy prices was 1.9 per cent (see Diagram 8.1). The price of electricity has risen in recent months, mainly because of a shortage of hydroelectric power, while oil prices have risen, in part because of the uncertainty regarding the developments in Iraq. With the exception of two months, the year-on-year figure for the CPI, excluding energy, has gradually fallen since the beginning of last year.
56
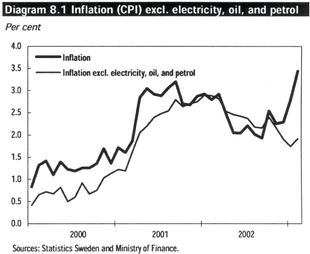
Domestic service prices also drove inflation upwards
However, the supply shocks mentioned above are not the only factors that have contributed to higher inflation over the past two years. When the effects of the price increases of food and energy in 2001 faded in the middle of 2002, CPI inflation was still about 0.5 percentage points higher than it was before these price increases began. This part of the increase in inflation can be explained to some extent by the price of services. The contribution of service prices to total CPI inflation rose steadily from the start of 2001, when it was less than 0.5 percentage points, until later the same year, when it was about 1 percentage point (see Diagram 8.2).
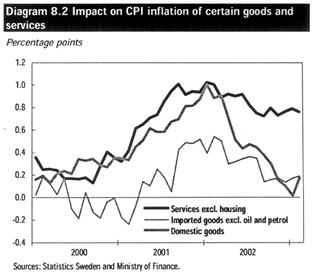
The price of several service components continued to cause inflation to rise during the first six months of 2002, after which its effect declined somewhat, but the price of services still contributes more to inflation than it did in 2000. Higher prices for services are believed in part to be related to several years of high wage increases in consumer-related service industries, which has had a somewhat delayed effect on consumer prices.
Energy prices expected to fall during 2003
High prices for oil, petrol, and electricity-the main reason for the extremely high inflation during early 2003-are expected to continue to contribute to high inflation for a while longer, though they will
57
not last throughout the rest of the year. Both oil and electricity prices are expected to fall during the course of the year.
The price of electricity should fall relatively quickly during spring and summer, and most of the price increases seen during the past six months are expected to have slid back by autumn. Nevertheless, a small portion of the price increases is expected to remain and contribute to strengthening the profit margins of utility companies.
Oil prices are expected to decline from the highest levels up to the war in Iraq to a price of USD 25.5 per barrel at the end of the year. (See also below.)
Energy prices are expected to contribute considerably to holding down inflation in early 2004. The importance of these prices for the course of inflation during the forecast period is substantial, and deviations from the forecast, especially those related to the price of electricity, may cause major forecast errors for individual months.
Import prices are expected to dampen inflation
Price developments for imports affect Swedish consumer prices both directly, because a large portion of consumer goods are imported, and indirectly, because the prices of imported intermediate goods that are used in domestic production affect consumer prices to a varying extent. Import prices are largely determined by fluctuations in the value of the krona in relation to the exchange rates of our most important trading partners.
During 2002 the krona gradually appreciated and import prices fell as the currency grew stronger. The impact of import prices on consumer prices is difficult to assess. The upswing in import prices that preceded last year's downturn was not fully passed on to consumers. When import prices drop, the impact on consumers is not expected to be fully realised. Import companies that have seen their margins narrow in the past will be able to re-establish these in the future to some extent.
The krona is expected to continue to appreciate over the coming year, after which it should retain its value during 2004. This appreciation will lead to an average decline in import prices for processed goods of just over 2 per cent this year, after which they will rise slightly as international commodity prices rise at an accelerating pace. Although the average price of oil is expected to be higher this year than last, exchange rate developments will also result in falling import prices for raw materials in Swedish kronor.
The price of oil rose substantially up to the war in Iraq. The forecast for oil prices constitutes, more so than usually, a source of uncertainty for the inflation forecast. Once the uncertainty related to the situation in Iraq decreases, the world market price is expected to fall within the interval that OPEC set as its goal: between USD 22 and USD 28 per barrel.
Inflation expectations somewhat higher
Households' inflation expectations are measured in the National Institute of Economic Research's monthly survey of household purchasing plans. Twelve-month expectations, which rose in early 2001, fell last summer, after which they rose once again. Because of changes in the survey method over the past few years, the results are not directly comparable over time, but the developments suggest that to some extent, inflation expectations according to the survey of household purchasing plans have followed the actual fluctuations of inflation in recent years.
Inflation expectations among employers' organisations and employee organisations fell somewhat last autumn, to rise once again this year, according to surveys carried out by Prospera on behalf of the Riksbank. In March the average expectations for all groups in Prospera's study were 2.4 per cent for
58
both the coming year and two years from now. In summary, the upswing in inflation expectations is limited and is expected to be temporary.
Low domestic inflationary pressure
As mentioned in the introduction to this section, the impact of service prices on inflation has declined somewhat since the first six months of 2002. Although household consumption increased once again during 2002 and consumption is expected to continue to grow during the forecast period, employment in the private service sector is expected to continue to show weak growth during 2003, after which it will grow somewhat stronger during 2004 (see Section 6). Wage increases are assumed to amount to 3.5 per cent per year. Productivity in the Swedish economy developed favourably last year and is expected to continue to increase at a healthy rate during the forecast period. This will help to limit the increase in unit labour cost along with domestic inflationary pressure.
Indirect effects of high oil and electricity prices may contribute to higher consumer prices for domestically produced goods and services during the period, but these effects are considered to be relatively minor.
Overall, domestic pressure on consumer prices is expected to remain low during the forecast period, though it is predicted to increase somewhat during 2004. The gradual strengthening of demand is expected to increase the potential for retail trade to increase margins, and some strengthening of margins is therefore estimated to contribute to inflation during both this year and next.
Interest rates affect housing costs
Last year housing costs had a substantial impact on inflation. In addition to the price of electricity, inflation figures rose at different periods of the year because of rents and interest expenses. Rent increases amounted to 2.6 per cent during the course of 2002. During 2003, rents are expected to climb 3.0 per cent, in part because of heating costs, and in 2004 rents are estimated to increase by just over 2 per cent.
The forecast for interest rates (see Section 3.2) means a relatively substantial turnaround in the repo rate, and thus in short-term mortgage rates between 2003 and 2004. As a result, interest expenses for housing are expected to help to lower CPI inflation during the course of 2003, but to raise it during 2004.
Taken together, housing costs, excluding tax and residential heating, are expected to contribute about -0.1 percentage points to total CPI inflation during 2003 and about +1.2 percentage points during 2004.
Inflation in line with target once temporary effects disappear
In summary, underlying inflationary pressure during the forecast period is expected to be low. High energy prices, which caused inflation to be high in early 2003, are expected to fall during the year. Consequently, inflation is estimated to be about 2 per cent by the middle of the current year, after which it will fall even more (see Diagram 8.3).
Once temporary effects disappear from the year-on-year figures during 2004, inflation is expected to rise once again. For both 2003 and 2004, the widely varying effects of energy prices will cause inflation during the course of each year (December inflation) to differ significantly from the annual average according to the forecast (see Table 8.1).
59
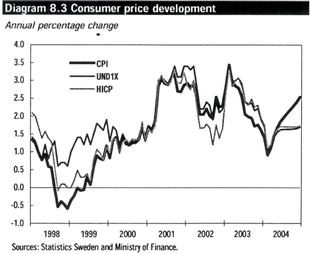
According to the Riksbank, monetary policy is based on the outlook for underlying inflation, measured with UND1X, for up to two years. Unlike the CPI, the UND1X does not include interest expenses for homeowners.(9) The forecast interest rates involve a relatively substantial reversal in short-term mortgage rates between 2003 and 2004, which means that inflation as measured with the CPI during 2004 is expected to rise considerably more than underlying inflation as measured with the UND1X (see Diagram 8.3), which is expected to be 1.7 per cent in December 2004. During 2005 and 2006, monetary policy is expected to be adapted to ensure that inflation develops in line with the Riks-bank's inflation target.
- (9)
- The UND1X also excludes the direct effects of changes in the net of indirect taxes and subsidies.
60
Table 8.1 Consumer price development
Percentage change
| | 2002 | 2003 | 2004 | 2005 | 2006 | |||||
|---|---|---|---|---|---|---|---|---|---|---|
| CPI, year-on-year | 2.4 | 2.4 | 1.8 | 2.4 | 2.1 | |||||
| CPI, Dec-Dec | 2.3 | 1.6 | 2.5 | 2.3 | 2.0 | |||||
| UND1X, year-on-year | 2.5 | 2.6 | 1.5 | — | — | |||||
| UND1X, Dec-Dec | 2.2 | 1.9 | 1.7 | — | — | |||||
| HICP, year-on-year | 2.0 | 2.6 | 1.6 | — | — | |||||
| HICP, Dec-Dec | 1.7 | 1.9 | 1.7 | — | — | |||||
| NPI, year-on-year | 2.2 | 1.8 | 1.8 | — | — | |||||
| NPI, Dec-Dec | 2.1 | 1.1 | 2.7 | — | — | |||||
| Base amount, SEK thousand | 37.9 | 38.6 | 39.6 | 40.3 | 41.2 | |||||
| HICP, EU, year-on-year | 2.1 | 2.0 | 1.9 | 1.8 | 1.7 |
Sources: Statistics Sweden and Ministry of Finance.
9 Household sector finances and consumption expenditure
Real household income is expected to increase less during the forecast period than in recent years. On average, the rate of increase is estimated at just below 1.5 per cent per year.
Despite the relatively weak income development, consumption expenditure is expected to increase by about 2 per cent annually during the forecast period. The relatively good consumption growth that is predicted is supported by an initially solid real wealth, a more stable development of financial wealth and continued low interest rates.
The savings ratio (household savings as a share of disposable income) has improved considerably over the past two years. Household income increased sharply in 2002 at the same time that consumption rose at a moderate rate. The savings ratio rose over 3 percentage points to 2.8 per cent.
9.1 Household income
In recent years, real household income has shown good growth. Employment growth, reforms and tax cuts have made substantial contributions to income growth. In 2002 households' real disposable income increased by a full 4.7 per cent. Such a sharp rise in income has only been noted a few times over the past few decades. This year's increase in real income is expected to decline to 1.7 per cent.
Sharp rise in households' real income in recent years
Over the past five years, households' real income has improved substantially, climbing an average of just over 3 per cent annually. Households have not experienced a similar period with such a high average growth since the 1960s. However, this period came after a number of years with very weak—and some years decreasing—real income. Growth was so weak that the average increase in real income of just over 1 per cent for the past decade is clearly below average for the period between 1950 and 2002 of just over 2 per cent and somewhat below average for the period between 1980 and 2002 of almost 1.5 per cent.
Temporary effects explain the substantial increase in real income in 2002
In 2002, real household income climbed a full 4.7 per cent according to preliminary National Accounts, despite almost unchanged employment and a decline in the number of hours worked. Normally, wages are the main reason for increases in real income. During 2002, household income
61
from wages, before tax, rose by 1.9 per cent in real terms and contributed only 1.6 percentage points to the increase in disposable income, to be compared with 2000 and 2001, when income from wages rose 5.6 per cent and 3.6 per cent in real terms, respectively (see Tables 9.1 and 9.2).
In contrast, the increase in income in 2002 was mainly because of reduced tax payments, which can be explained partly by tax cuts of about SEK 20 billion after the third phase of the compensation for the national pension contributions and partly by much lower taxes on capital gains. Capital gains are not recognised as income in the National Accounts. However, taxes on capital gains affect household income as they are included in household taxes. If taxes on capital gains vary substantially, real household income growth could deviate considerably from underlying developments. Income that is not subject to preliminary tax, especially taxes on capital gains, is not recorded in the National Accounts until the year after the one in which the capital gains occurred. Between 2001 capital gains fell sharply and as a result taxes on capital gains fell between 2001 and 2002.
Table 9.1 Real household disposable income
| | | Annual real percentage change | ||||||||||||||
|---|---|---|---|---|---|---|---|---|---|---|---|---|---|---|---|---|
| | SEK billion 2002 | |||||||||||||||
| | 2000 | 2001 | 2002 | 2003 | 2004 | 2005 | 2006 | |||||||||
| Wages | 997 | 5.6 | 3.6 | 1.9 | 0.7 | 2.2 | 2.3 | 2.2 | ||||||||
| General government transfers | 433 | 1.3 | 0.7 | 2.7 | 4.8 | 0.5 | 0.5 | 1.1 | ||||||||
| Other income | 211 | -5.4 | 7.2 | -12.3 | -1.1 | 0.6 | -5.0 | -0.2 | ||||||||
| Direct taxes and charges | 469 | 4.8 | 2.0 | -7.4 | 1.7 | 2.2 | 2.8 | 2.3 | ||||||||
| Disposable income | 1,172 | 2.7 | 2.5 | 4.7 | 1.7 | 1.4 | 0.9 | 1.6 | ||||||||
Note: Real disposable income is deflated by the implicit price index for household consumption expenditure.
Sources: Statistics Sweden and Ministry of Finance.
Taken together, direct taxes and charges gave a positive contribution to the increases in real income of 3.3 percentage points in 2002. Normally, direct taxes and charges contribute negatively to income growth. When adjusted for the incomplete periodization of taxes in the National Accounts, last year's increase in real income amounted to 3.5 per cent (see Tables 9.2 and 9.4; see also the section on the adjusted increase in real income below).(10)
- (10)
- Other taxes also influence the periodization effect of tax revenues, such as tax adjustments, but the difference between periodized taxes and National Accounts taxes mainly involves taxes on capital gains. Most of the annual change in the periodization effect is because of variations in taxes on capital gains.
62
Table 9.2 Contribution to growth in real household income
Percentage points
| | 2002 | 2003 | 2004 | 2005 | 2006 | ||||||
|---|---|---|---|---|---|---|---|---|---|---|---|
| Wages | 1.6 | 0.6 | 1.9 | 2.0 | 1.9 | ||||||
| General government transfers | 1.0 | 1.8 | 0.2 | 0.2 | 0.4 | ||||||
| Other income | -1.3 | 0.0 | 0.3 | -0.1 | 0.2 | ||||||
| Direct taxes and charges | 3.3 | -0.7 | -0.9 | -1.1 | -0.9 | ||||||
| Real disposable income(1) | 4.7 | 1.7 | 1.4 | 0.9 | 1.6 | ||||||
| Periodization of taxes(2) | -1.2 | -1.3 | 0.0 | 0.4 | 0.0 | ||||||
| Real disposable income with accrual taxes(1) | 3.5 | 0.4 | 1.4 | 1.3 | 1.6 | ||||||
| IPI(3) | 2.0 | 2.4 | 1.8 | 1.9 | 1.9 | ||||||
| Nominal disposable income(1) | 6.8 | 4.1 | 3.3 | 2.8 | 3.5 | ||||||
- (1)
- Percentage change.
- (2)
- A negative periodization effect entails that the development according to the National Accounts is boosted by the incomplete allocation of taxes and vice versa.
- (3)
- Implicit price index for household consumption expenditure. Annual change in per cent.
Note: Real disposable income is deflated by the implicit price index for household consumption expenditure (IPI).
Sources: Statistics Sweden and Ministry of Finance.
Several reforms that raised compensation levels for unemployment insurance as well as the guaranteed amount in parental insurance contributed to the increase in income in 2002. The maximum charge for child daycare services affected households' real income through lower charges.
Negative developments in the stock exchange and increased household indebtedness had a negative impact on household income. Households' net interest worsened and dividend income fell sharply in 2002. In nominal terms, dividends fell a full 24 per cent between 2001 and 2002. Overall, interest and dividends gave a negative contribution to the increase in real income of about 1 percentage point.
Real household income expected to increase at a more modest pace during the forecast period
During the forecast period, real household income is expected to rise at a much slower pace than in recent years. This year, pre-tax income from wages is expected to grow weakly because of fewer hours worked. Local government taxes were raised an average of SEK 0.65, corresponding with SEK 8.5 billion in higher taxes for households. Household capital gains as well as taxes on capital gains continued to fall between 2001 and 2002, holding back the increase in total direct taxes and charges for households.
This year, general government transfers to households provide a relatively large contribution to the increase in real income of 1.8 percentage points. To some extent, the increase is due to the elimination of the special basic tax allowance for pensioners, which has been replaced by a taxed guaranteed pension. As a result of this change, the guaranteed pension has increased at the same time that household tax payments increased by an equivalent extent, leaving the net pension unchanged. The level of unemployment insurance was increased as of 30 June 2002, which also gave a positive contribution to income growth this year.
In 2003, implementation of a green tax exchange will reduce income tax for certain income groups. At the same time, energy taxes will be raised to an equivalent degree, resulting in higher prices. Real
63
household income will remain unaffected. Taken together, real household income is expected to rise by 1.7 per cent. This year real income growth will also be boosted by the incomplete allocation of taxes in the National Accounts. Income with accrual, or fully periodized, taxes is only expected to climb 0.4 per cent.
Increases in household income are expected to be moderate between 2004 and 2006. The number of hours worked is expected to show better growth than in 2003. Wages are expected to contribute about 2 percentage points per year during this period. Real household income is estimated to grow 1.4 per cent in 2004, 0.9 per cent in 2005 and 1.6 per cent in 2006.
Transfer income
This year income from pensions is expected to rise substantially as the special basic tax allowance for pensioners is being replaced by a taxed guaranteed pension. Gross pensions will rise at the same time that taxes fall by an equivalent amount.
Table 9.3 Transfer income divided by purpose
| | | Annual real percentage change | ||||||||||
|---|---|---|---|---|---|---|---|---|---|---|---|---|
| | SEK billion 2002 | |||||||||||
| | 2002 | 2003 | 2004 | 2005 | 2006 | |||||||
| Old age | 201 | 2.9 | 9.6 | 2.9 | 1.8 | 1.8 | ||||||
| Illness | 105 | 7.3 | 4.0 | 1.7 | 4.9 | 1.7 | ||||||
| Labour market | 36 | -0.1 | 4.5 | -10.1 | -10.9 | -4.9 | ||||||
| Families & children | 45 | 1.6 | 1.4 | 0.4 | 0.5 | -0.2 | ||||||
| Studies | 13 | -5.4 | -18.2 | 0.1 | -0.7 | 0.8 | ||||||
| Other | 34 | 1.9 | -0.4 | -0.5 | -1.2 | -1.2 | ||||||
| Tota1(1) | 435 | 2.7 | 4.8 | 0.5 | 0.5 | 1.1 | ||||||
- (1)
- Including capital transfers, which explains the difference compared with Table 9.1.
Sources: Statistics Sweden and Ministry of Finance.
Household income from sickness benefit is expected to fall this year. The previously announced decision to raise the ceiling has been postponed and the compensation level was reduced. At the same time, expenditure for sickness compensation (previously disability pensions) is still rising sharply. Taken together, this means that this year, revenues from the transfer system related to illness will climb about 4 per cent in real terms. Over the next few years, household income from sickness benefit is expected to continue to decline. To some extent this is because the long-term sick will switch to receiving sickness compensation, which are expected to continue to climb. Overall, household income from transfers related to illness will rise substantially throughout the forecast period.
Favourable developments in the labour market in recent years have led to falling unemployment, thus reducing income from unemployment insurance. This year, however, the trend is expected to reverse and income from the labour market compensation system will rise 4.5 per cent in real terms. Unemployment is expected to fall during the rest of the forecast period, which will reduce household income from the unemployment fund. Income from study allowances and similar subsidies will fall this year, mainly because certain types of financial aid for adult education are being phased out.
Adjusted increase in real income
Reported income growth is affected by the National Accounts' accounting methods for various transactions. In some cases it may be of interest to report income growth with a different accounting
64
method for taxes on capital gains.(11) To some extent, the effects of the accounting methods used in the National Accounts for these items have been discussed above.
- (11)
- Throughout this section, "capital gains" refers to the net of capital gains and capital losses.
1. Periodized income
In the National Accounts, income that is not subject to preliminary tax is not accounted for until the year after the year of income (see also footnote 10). This applies to taxes on capital gains in particular. A more accurate picture of income growth for individual years would be obtained if taxes were allocated to the year in which the taxes were incurred.
2. Periodized income, excl. taxes on capital gains
Although capital gains are not included in household income in the National Accounts, taxes on capital gains do reduce income. If household taxes on capital gains grow in pace with other revenue, the growth rate of real income remains unaffected. However, if capital gains vary substantially, as has been the case in recent years, taxes on capital gains could substantially affect reported income growth. Since households may be assumed to pay taxes on capital gains with part of the capital gains, a more accurate picture of underlying household income growth would be obtained if taxes on capital gains were excluded from periodized income growth.
According to the National Accounts, household income rose substantially in 2002 (see Diagram 9.1 and Table 9.4). However, the increase is largely due to diminishing tax payments, which in turn are largely attributable to lower taxes on capital gains.
Table 9.4 Adjusted real household disposable income
Annual real percentage change
| | 1999 | 2000 | 2001 | 2002 | 2003 | 2004 | 2005 | 2006 | ||||||||
|---|---|---|---|---|---|---|---|---|---|---|---|---|---|---|---|---|
| As reported in National Accounts | 4.1 | 2.7 | 2.5 | 4.7 | 1.7 | 1.4 | 0.9 | 1.6 | ||||||||
| Disposable income with accrual taxes | 4.1 | 1.9 | 5.5 | 3.5 | 0.4 | 1.4 | 1.3 | 1.6 | ||||||||
| Disposable income with accrual taxes, excluding taxes on capital gains | 5.2 | 2.7 | 3.6 | 2.9 | 0.5 | 1.4 | 1.4 | 1.7 |
Sources: Statistics Sweden and Ministry of Finance.
If the accounting practice with tax revenue is taken into account, the increase in income was greatest in 2001, which can largely be explained by the substantial decline in periodized taxes on capital gains between 2000 and 2001. Net house hold capital gains fell almost SEK 60 billion between 2000 and 2001, which is equivalent to just over 5 per cent of household income. Household taxes also fell as a result of lower capital gains. Taxes on capital gains reduced income growth with accrual taxes in 2000. The decrease in taxes on capital gains therefore had a beneficial effect on income growth in 2001.
65
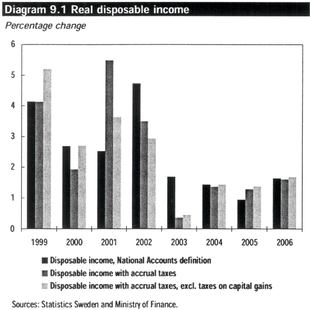
Household income with accrual taxes, excluding taxes on capital gains, shows a more even development. Income growth is relatively high for each year between 1999 and 2002.
In 2003, income as defined by the National Accounts will grow faster than income with accrual taxes because capital gains fell between 2001 and 2002, which is reported in the National Accounts as falling taxes on capital gains in 2003. In periodized terms, the reduction in taxes occurs between 2001 and 2002.
9.2 Household consumption expenditure
After just over a year with unchanged consumption expenditure, household consumption grew once again during 2002. Consumption increased by about 2 per cent during the course of the year, although growth measured as an annual average amounted to only 1.3 per cent. One explanation for the relatively favourable consumption growth is the substantial increases in household income. In contrast, the household wealth position continued to deteriorate because of negative developments in the stock exchange. During the autumn, household expectations about personal finances and the country's future economic situation also weakened.
Between 2003 and 2004 only a modest increase in income is expected, mainly because of the deteriorating labour market situation and more restrictive fiscal policy. This is expected to have a dampening effect on household consumption in the future. Households' weakened confidence is also expected to have a somewhat restraining effect on consumption this year.
66
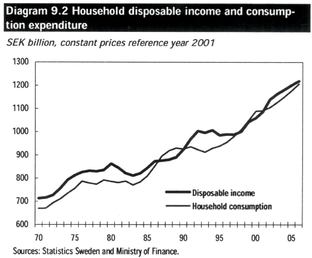
Nevertheless, stable development of real and financial wealth combined with low interest rates are expected to stimulate consumption. Household confidence is also expected to grow stronger as the general economy improves. With less uncertainty and better growth in the value of household financial assets, consumption is predicted to grow faster than income. All factors considered, consumption growth of about 2 per cent per year is forecast for 2003 and 2004. During 2005 and 2006 consumption is expected to increase by just over 2 per cent annually.
Increased consumption during 2002
According to preliminary National Accounts, consumption growth in 2002 amounted to 1.3 per cent. This is a clear recovery compared with the weak developments in late 2000 and all of 2001. One contributing factor to the increased consumption was the favourable development in retail sales. Consumption of retail sales of durable goods increased by almost 6 per cent and contributed just over 1 percentage point to total consumption growth. Car consumption continued to develop weakly and pulled down households' total consumption growth by a few tenths. This negative development can be exclusively attributed to weak used car sales. However, if only new car sales are considered, car consumption increased somewhat last year.
No signs of recovery are visible yet for consumption of services, excluding housing. Consumption of services has essentially been unchanged since the second half of 2000 and even fell somewhat during the fourth quarter of the previous year (see Diagram 9.3).(12)
- (12)
- However, production of services, especially household-related services, increased last year (see Chapter 5). One explanation for the discrepancy could be that production of services was channelled to some extent into consumption of merchandise, such as wholesale and retail sales.
67
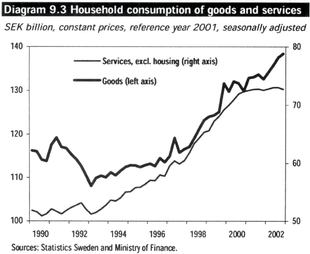
Some services have shown particularly weak growth. Consumption of financial services, which depends in part on stock exchange trends, declined sharply in 2001 and even last year to some extent. Restaurant expenditure has been essentially unchanged for the past two years. Expenditures for charter travel declined by about 11 per cent last year, which held total consumption growth down by 0.2 percentage points. Consumption of life insurance also declined substantially and contributed negatively with 0.1 percentage points to total consumption growth.
Swedish households' consumption expenditure abroad continued to decline during 2002. These expenditures were about 20 per cent lower in 2002 than two years earlier. The reduction last year was about 7 per cent. Foreign households' consumption in Sweden also declined during 2002. This decline amounted to just over 3 per cent.(13) A decline in foreign households' consumption in Sweden has only been noted on one occasion since 1980, in 1990.
- (13)
- The purpose of the National Accounts is to measure Swedish household consumption. Foreign households' consumption in Sweden is therefore a negative item in the National Accounts' measurement of household consumption. Consequently, last year's reduced expenditures from foreign households makes a positive contribution to household consumption expenditure.
68
To date, only a few indicators suggest how consumption has been developing since the beginning of the current year. Household registrations of passenger cars, excluding direct imports, were 4 per cent higher during the first quarter than the same period last year. Retail sales have continued to be high during the first months of the year.
Household wealth position
Household net financial wealth peaked about three years ago. Since then, net wealth has gradually declined, mainly due to reduced share values, but also because indebtedness has continued to rise.
Table 9.5 Household financial wealth
Market value at the end of the year, SEK billion, current prices
| | 1998 | 1999 | 2000 | 2001 | 2002 | ||||||
|---|---|---|---|---|---|---|---|---|---|---|---|
| Financial assets(1) | 2,367 | 2,975 | 2,956 | 2,962 | 2,716 | ||||||
| Equities and mutual funds | 869 | 1,236 | 1,102 | 959 | 661 | ||||||
| Deposits in banks | 449 | 451 | 442 | 491 | 520 | ||||||
| Insurance | 560 | 733 | 800 | 889 | 914 | ||||||
| Other equity | 254 | 334 | 418 | 430 | 423 | ||||||
| Financial liabilities | 961 | 1,042 | 1,134 | 1,235 | 1,326 | ||||||
| Financial net wealth | 1,406 | 1,933 | 1,822 | 1,727 | 1,390 | ||||||
- (1)
- Excluding collective insurance and "other financial assets" included in the Financial Accounts.
Source: Statistics Sweden.
As of 1 January 2003, the value of share and mutual fund holdings amounted to about SEK 660 billion, which can be compared to about SEK 1,240 billion as of 1 January 2000 (see Table 9.5). Households' share assets have been almost halved in three years. At the same time, households have deposited an increasing portion of their savings in banks and insurance assets, which have seen an increase in value of about SEK 250 billion over the past three years. Total financial assets have therefore not declined to the same extent as share assets.
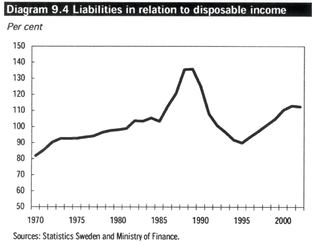
Financial net wealth declined during the same three-year period by about 28 per cent, which can also be attributed to a gradual increase in indebtedness. The debt ratio, defined as liabilities in relation to disposable income, amounted to about 112 per cent in 2002 (see also Diagram 9.4).
69
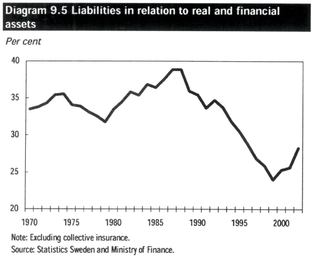
Despite weak developments in the stock exchanges, households' overall wealth position may be considered healthy. The increasing indebtedness is largely associated with the rising prices of single-family dwellings—in other words, an increase in real wealth. Prices for single-family dwellings were about 7 per cent higher in 2002 than the previous year.
Diagram 9.5 shows that household indebtedness compared with total assets is low in a historic perspective. At the same time, interest rates are low, which means that households' total interest expenditure is relatively low.
Lower confidence last autumn
The portion of household income that will be used for consumption probably depends on household expectations for their personal economic development. Diagram 9.6 illustrates household confidence in their personal economy, Sweden's economy and unemployment according to National Institute of Economic Research surveys of household purchasing plans (HIP). As can be seen in the diagram, expectations fell markedly during the second half of 2002. Expectations fell at the same time that several municipalities announced tax hikes and as signs of weaker developments in the labour market became increasingly apparent. Households' weakened confidence is one possible explanation for why consumption did not increase more during 2002, despite the healthy increase in real income. So far this year expectations have continued to be restrained.
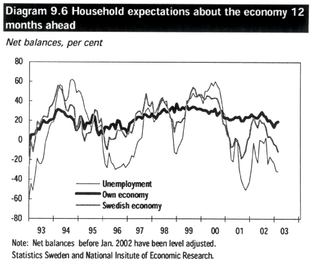
70
Continued good consumption growth in the future
The low real increases in household income and lower confidence are considered to be holding back consumption growth during the current year. Consumption is therefore predicted to develop somewhat weaker than during 2002, even if growth measured as an annual average is estimated to be higher at 1.9 per cent.
Household income is also expected to develop weakly in 2004. Nevertheless, consumption expenditure is forecast to climb 2.2 per cent.
Despite the weak income trend predicted for 2003 and 2004, some factors suggest relatively good consumption growth in the future. According to accepted economic theory, at each point in time, households tend to adapt consumption expenditure to total income over time. Consequently, temporary changes in income only have a limited impact on consumption, which means that consumption and income do not necessarily match in individual years (see Diagram 9.2), which in turn results in a varying savings ratio (see Diagram 9.7). In periods of high yield on share assets, households may choose to consume based on both realised and unrealised increases in value. In periods of low or negative yield, the reverse holds true. Households may choose to compensate for the lack of any increase in value by increasing savings in other assets. Against the background of the weak developments in the stock exchange last year it was therefore not surprising that household saving continued to increase.
Table 9.6 Household saving
Per cent of disposable income
| | 2001 | 2002 | 2003 | 2004 | ||||
|---|---|---|---|---|---|---|---|---|
| Net savings | -0.5 | 2.8 | 2.6 | 1.9 | ||||
| Net lending | -0.2 | 3.3 | 3.2 | 2.5 |
Note: Excluding savings in pension fund reserves.
Sources: Statistics Sweden and Ministry of Finance.
A more stable financial wealth development and an initially strong real wealth are expected to contribute to increased consumption in the future.
Households with an eye on the future also consider expectations about future income in relation to their inclination to consume. If expectations about personal finances in the future are optimistic, it is assumed that the desire to consume will increase. Currently, consumer expectations for the future are relatively subdued, which indeed is expected to have a somewhat restraining effect on consumption this year. As the economy grows stronger and unemployment declines, however, consumption should increase somewhat faster during 2004 than during 2003.
Overall, a decrease in general uncertainty and more stable growth in the value of households' share assets are predicted to contribute to an increase in consumption at a relatively good pace despite weaker income growth. Consumption is predicted to grow faster than income, causing the savings ratio to decline somewhat during the period. However, the savings ratio will remain at a significantly higher level than it was between 1997 and 2000 (see Diagram 9.7).
Part of the risk status involves the uncertainties about the international and Swedish economy for the near future, which may last during the current year, and which could be reflected in falling share prices and continued low confidence about the future. If this development occurs, consumption could be lower than forecast.
71
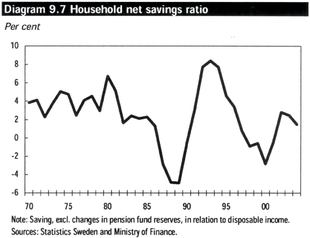
10 Gross capital formation
Gross fixed capital formation fell last year by 2.5 per cent. The weak performance was due to a downturn in the business sector, while investment in housing construction and in the general government sector rose.
This pattern is not expected to change this year. Business sector investment is expected to remain weak. Many sectors suffer from continued overcapacity. Poorer profitability and uncertainty over global growth will also reduce the willingness to invest. As the global economy strengthens later this year, output and resource utilization will gradually rise. Next year, therefore, a slight increase in business sector investment is anticipated. Housing construction will continue to increase in coming years. Also, investment by the general government sector will rise, partly as a result of central government investment in infrastructure.
Total capital formation will fall by 0.5 per cent this year, and will increase by 2.9 per cent next year. There is a great deal of uncertainty over investments over the next few years. There is a substantial risk that growth may be poorer than forecast.
At the end of 2004, it is expected that there will still be available resources in the labour market, and this will make it possible for GDP growth to exceed the long-term trend in subsequent years. This is also expected to lead to a relatively high rate of increase in investments.
72
Table 10.1 Gross fixed capital formation
Percentage change in volume
| | 2002 | 2003 | 2004 | 2005 | 2006 | ||||||
|---|---|---|---|---|---|---|---|---|---|---|---|
| Business sector | -6.9 | -2.2 | 3.0 | 5.2 | 5.0 | ||||||
| Producers of goods | -5.2 | -1.8 | 3.7 | — | — | ||||||
| Producers of services | -8.1 | -2.5 | 2.5 | — | — | ||||||
| Housing | 10.4 | 2.3 | 4.2 | 8.0 | 8.0 | ||||||
| General government | 9.5 | 4.5 | 1.4 | 1.3 | 1.2 | ||||||
| Central government | 12.4 | 8.0 | 1.0 | — | — | ||||||
| Local government | 6.8 | 1.0 | 1.9 | — | — | ||||||
| Total | -2.5 | -0.5 | 2.9 | 4.9 | 4.7 | ||||||
| Building and construction | 1.4 | 2.0 | 2.5 | — | — | ||||||
| Machinery | -4.0 | -1.9 | 3.3 | — | — | ||||||
| Other(1) | -7.2 | -2.3 | 2.7 | — | — | ||||||
- (1)
- Mainly computer software.
Sources: Statistics Sweden and Ministry of Finance.
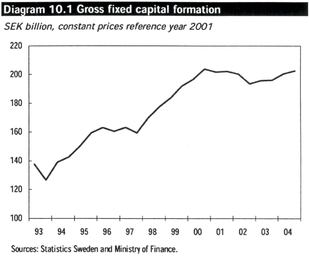
10.1 Business sector
Recovery in investment in the goods-producing sectors will be delayed until next year
After a temporary upturn in the middle of last year, industrial output declined again during the second half of the year. There are signs that economic activity is recovering. Industrial output is expected to increase by just over 2 per cent this year (see Chapter 5).
73
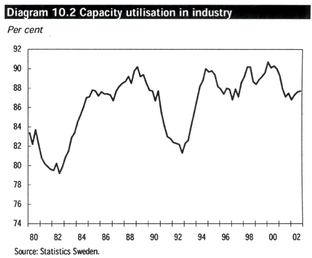
During 2001, industrial investment fell by 5 per cent. Despite a rise in output, investment fell last year as well. The previously high level of investment, however, means that despite the decline in the past two years, production capacity actually increased, i.e. replacement investment and the addition of new machinery and buildings was still greater than the consumption of fixed capital. Given the continued low level of capacity utilisation, it does not appear that there will be a need to expand production capacity this year (see Diagram 10.2). As a result, investment will continue to fall. Statistics Sweden's Investment Survey for February supports this picture. It is true that firms are predicting investment levels unchanged from last year, but in the February surveys firms often overestimate the development. Overall, industrial investment is expected to fall by approximately 4 per cent this year. For this reason, no requirements for increased production capacity are expected to arise before next year. Industrial investment is expected to rise by just under 5 per cent next year.
The forecast implies that the capital ratio, i.e. the value of machinery, buildings and computer software in relation to output, will remain unchanged this year, but will fall next year as growth in output accelerates and capacity utilisation increases. The drop in the ratio indicates that there will be an upturn in investment beginning next year.
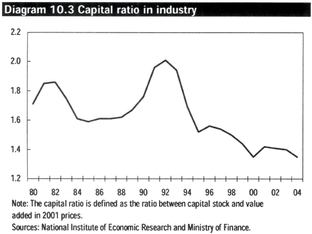
In other goods-producing sectors, the picture is mixed. Construction activity has weakened significantly over the past two years, and there are few signs of a quick recovery. This decline in construction activity reinforces the picture of a generally low level of investment activity and also indicates that construction firms can be expected to reduce their purchases of machinery this year. Investment in infrastructure by central government along with the predicted increases in housing construction are, however, expected to lead to an expansion in the construction sector next year. Plans
74
in the energy sector continue to be optimistic. The upturn is partially explained by the reconstruction and expansion of district heating power plants. Overall, it is estimated that investment in the goods-producing sector, in which manufacturing dominates, will fall by around 2 per cent this year but will increase by around 4 per cent next year when industrial activity improves further.
Table 10.2 Gross fixed capital formation in goods-producing sectors
Percentage change in volume
| | 2001 | 2002 | 2003 | 2004 | ||||
|---|---|---|---|---|---|---|---|---|
| Forestry and agriculture | 0.0 | -0.5 | 2.4 | 1.9 | ||||
| Energy and hydropower | -2.2 | 2.6 | 4.6 | 1.4 | ||||
| Construction | -1.3 | -3.7 | -1.9 | 3.6 | ||||
| Industry | -5.0 | -7.8 | -3.9 | 4.7 | ||||
| Total | -3.8 | -5.2 | -1.8 | 3.7 | ||||
Sources: Statistics Sweden and Ministry of Finance.
Widespread downturn in the service sector this year as well
Several sectors within the service sector are expected to continue to have a weak investment trend this year. As in the industrial sector, the downturn in the service sector is largely a consequence of previously high levels of investment. There is overcapacity in many sectors as a result of the contraction in household demand and the reduced level of industrial activity. The downturn is clearly visible, among other sectors, in household services, corporate services and the property sector. In the property sector, there is considerable evidence that the construction of commercial premises will remain limited next year. In addition to the general decline in construction activity, the number of assignments architects have on hand is the lowest since 1996. The level of incoming orders for construction and technical consulting services is worrying, according to the Business Tendency Survey published by the National Institute of Economic Research (NIER), which indicates that the trend will remain weak over the next one or two years.
In retailing, investment also fell last year. Rising sales are, however, expected to lead to an expansion in retailing over the next few years. In post and telecommunications, the rollout of the third-generation mobile phone networks is expected this year to moderate the downturn from last year. In transport, there was a sharp drop in investment in 2002. This was partly due to the completion of a number of major projects, such as the expansion of Arlanda Airport. Statistics Sweden's survey shows that there are some expansionary plans in this sector for 2003. Given the considerable decline during the course of last year, the annual average is, however, expected to remain negative this year.
For the service sector as a whole, last year's downturn of 8 per cent is expected to be followed by a continued fall of around 2.5 per cent this year. It is very difficult to determine when there will be a requirement for increased investment in the service sector again. As a result of the relatively mild contraction in the output of services over the past few years, and the further increase in activity in this sector this year, it is anticipated that investment in the service sectors will rise by around 2.5 per cent next year.
75
Table 10.3 Gross fixed capital formation in the service sector
Percentage change in volume
| | 2001 | 2002 | 2003 | 2004 | |||||
|---|---|---|---|---|---|---|---|---|---|
| Retailing and wholesaling | 3.0 | -6.9 | 4.1 | 3.5 | |||||
| Financial services | 5.5 | -4.4 | -2.0 | 2.6 | |||||
| Corporate services | 6.6 | -4.3 | -2.7 | 3.9 | |||||
| Property(1) | 9.1 | -5.9 | -3.7 | -3.1 | |||||
| Household services | 0.4 | -6.5 | -3.3 | 3.3 | |||||
| Other services | -2.8 | -12.4 | -5.3 | 2.7 | |||||
| of which Transport | -10.1 | -14.3 | -9.6 | 2.5 | |||||
| Post and telecommunication | 12.9 | -10.9 | -0.2 | 2.8 | |||||
| Hotel, restaurant | -1.4 | -6.7 | 0.1 | 3.3 | |||||
| Other | 6.8 | -9.8 | 3.4 | 3.5 | |||||
| Total | 2.2 | -8.1 | -2.5 | 2.5 | |||||
- (1)
- Dwellings excluded.
Sources: Statistics Sweden and Ministry of Finance.
10.2 The general government sector
Building and construction investment by central government rose sharply last year and contributed one percentage point to total investment growth. The increased resources earmarked for work on infrastructure ensures that central government's building and construction investment will continue to rise in the future, but at a diminishing rate. Local authority investment in building and construction has been substantial in recent years. Local authorities have additional needs, but the rate of investment growth will slow down. Just as in the business sector, it is anticipated that the purchase and in-house development of computer software will continue to fall this year, and this will dampen the upturn in general government sector investments. Overall it is estimated that general government sector investment will rise by 4.5 per cent this year and by 1.4 per cent next year.
10.3 Housing investment
Housing investment increased by just over 10 per cent last year according to the National Accounts. Renovations and extensions were unchanged, and have remained largely at the same level since 1998.(14) New building, on the other hand, increased by a full 18 per cent. The trend in new building is now expected to slow down perceptibly, and overall, this means that the total housing investment is expected to increase by a more moderate 2.3 per cent this year and 4.2 per cent next year.
- (14)
- Renovations and extensions refer to the increase in dwellings, e.g. as a result of loft conversions, extensions to existing buildings or the conversion of premises into dwellings.
76
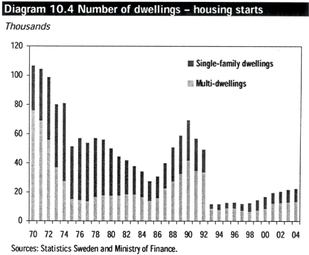
The primary factor underlying the increase in new building starts is a rise in the construction of single-family dwellings. The number of new single-family dwelling starts rose from 7,100 in 2001 to 7,800 last year. The number of new multi-dwelling apartment buildings constructed increased only marginally, to 12,800. In total, therefore, new construction of 20,600 dwellings began last year.(15) Although this represents an increase of 1,000 dwellings compared with the preceding year, it is still, in historical terms, a low level.
- (15)
- The statistics refer to the number of housing starts in single-family dwellings and apartment buildings.
The number of new single-family dwellings is expected to continue to rise this year, and then to remain at the same level next year. As is shown in Chapter 9, the financial situation of households remains strong despite the sharp drop on the stock market last year. Household income is expected to continue to increase, albeit at a lower rate than before, while the situation on the labour market is relatively stable. These are important preconditions for a continued high demand for housing. Another factor suggesting an increase in the construction of single-family dwellings is that selling prices on the secondhand market turned upwards during the second quarter of 2002, after having stayed constant for a year. So far, however, there has been no sign of an increase in the number of building permits granted for single-family dwellings.
An important underlying reason for the increase in the construction of multi-dwelling apartment buildings in recent years has been the substantial rise in prices of existing tenant-owned apartments. This price trend has now slowed down, and in Stockholm the average price of tenant-owned apartments fell during the fourth quarter. It is not, however, certain that the price per square metre has fallen, since the decline may be a result of a greater proportion of smaller apartments sold. The price trend suggests that the extent of investment in the construction of new multi-dwelling apartment buildings will slacken. This can clearly be seen from the fact that although the number of building permits granted has continued to increase in the country as a whole, it has dropped sharply in the growth regions. In the third quarter of last year, the number of building permits granted in Stockholm for multi-dwelling apartment buildings which are not covered by investment grants fell from 4,200 to 2,900 in one year. The forecast for multi-dwelling apartment buildings is that the number of new building starts will remain almost unchanged this year, and will then increase slightly next year.
Overall, this means that the number of new building starts for dwellings in 2003 will be just under 22,000, and for 2004 22,500. In the medium term, i.e. for the years 2005 and 2006, investment volumes are expected to increase and approach longer-term levels. It is estimated that housing investment will increase by 8 per cent each year.
77
In the Government Budget Bill for 2003, the government stated its objective that 120,000 new dwellings are to be built during the period 2003-2006. The need for new housing differs between different parts of the country. The National Board of Housing, Building and Planning's annual survey shows that the number of municipalities with a shortage of housing increased from 77 in last year's survey to 100 this year. It is still the case that rather more municipalities (116) declare that they have a surplus of housing, but the proportion of the population living in municipalities with shortages of housing has increased, and now amounts to 60 per cent. Shortages of housing occur primarily in the major cities, and in university towns. A measure which is being taken with the aim of achieving a better balance in the housing markets of the growth regions is the introduction of the new investment incentive, which is equivalent to a reduction in the VAT on construction from 25 per cent to 6 per cent for the building of smaller rental apartments and student accommodation.
10.4 Stocks
Both trade and industry adjusted their stocks downwards last year. Unexpectedly large stock-building during the fourth quarter, however, limited the negative effects on GDP growth to 0.1 per cent of GDP. Stockbuilding at the end of last year occurred in both the trade and industrial sectors.
In industry, it was stocks of finished goods which grew during the fourth quarter. The increase appears to be partly involuntary, and it would, therefore, seem that there is a certain need to reduce stocks of finished goods at the beginning of the year. After this, a planned increase in stocks is expected to occur in connection with an increasingly high level of output. Intermediate stocks in industry, on the other hand, fell sharply during the fourth quarter, with a notable fall in the stocks ratio, i.e. stocks in relation to output, as a result. Intermediate stock levels appear to be almost too low. These stocks are, therefore, expected to increase from the beginning of this year. It should, however, be emphasised that the changes in industry's stocks this year are expected to be relatively small.
Retail sales increased strongly during the second half of 2002. The growth in stock levels in trade at the end of the year appears, therefore, to be largely a consequence of the continued expansion of the sector. NIER's Business Tendency Survey reinforces this picture. Dissatisfaction with the stock situation certainly rose somewhat at the end of 2002, but changes in stock judgements were limited. Consequently, only small changes in the trade sector's stocks are expected in the near future.
Overall, a slight increase in stocks is expected this year and next. Given last year's reduction of stocks in the trade and industry sectors, this year stockbuilding is expected to make a positive contribution to GDP growth of 0.2 per cent of GDP. Next year, stock trends will be growth-neutral.
78
Net lending in the general government sector will fall this year to a surplus of 0.4 per cent of GDP. From 2004, there will be a gradual strengthening in net lending, and in 2006, it is estimated that there will again be a surplus of 2 per cent of GDP. This will reduce debt as a percentage of GDP, and restore positive financial wealth.
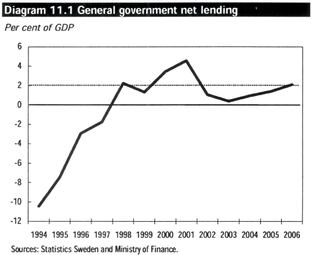
11.1 Consolidated general government sector
Net lending
In 2002, the general government sector's net lending amounted to SEK 25 billion or 1.1 per cent of GDP. This is a substantial reduction from 2001, when net lending amounted to over SEK 100 billion. The high level of net lending in 2001 was, however, largely due to the incomplete periodization of tax revenue in the National Accounts, which in total strengthened net lending by around 2 per cent of GDP (see Table 11.1). The effects of the accounting practice with tax revenue arises primarily as a result of variations in corporate profits and capital gains. Taxes on these are recorded in the National Accounts with a one-year time lag. The exceptionally high level of tax revenues from corporate profits and capital gains in 2000 were consequently reported in 2001.
If net lending is adjusted for tax accruals and the business cycle, it provides a measure of the underlying structural level of net lending. (A more detailed treatment of the assessment of structural net lending is given in Section 11.5.) Structural net lending is estimated to have fallen as a percentage of GDP from 4.2 per cent in 2000 to 0.8 per cent in 2002. This trend reflects an expansionary fiscal policy.
In 2003, reported net lending will fall to 0.4 per cent of GDP, while structural net lending will increase to 1.4 per cent of GDP. The difference in trend is due to the recession (the GDP gap is widening) and to the fact that in 2002 as well, reported net lending was boosted as a result of the accounting practice with tax revenue. These factors affect reported net lending but not structural net lending. In subsequent years, both reported and structural net lending will increase, and in 2006, net lending is expected to exceed 2 per cent of GDP. Structural net lending will increase from 0.8 per cent of GDP in 2002 to 2.2 per cent of GDP in 2006. The direction of fiscal policy during the forecast period, measured as the change in structural net lending, is, therefore, assessed as tight.
In 2002, the general government sector's income amounted to 56.8 per cent of GDP, while expenditure was equivalent to 55.8 per cent. In 2003, income as a percentage of GDP will remain constant, while expenditure will rise. Net lending is estimated at 0.4 per cent of GDP. In 2004, net lending is expected to increase to 1 per cent of GDP, while both income and expenditure will fall as a
79
percentage of GDP. This reduction will continue during 2005 and 2006, and net lending for those years is estimated at 1.4 and 2.1 per cent of GDP respectively (see Table 11.2).
Table 11.1 General government net lending
Per cent of GDP
| | 2000 | 2001 | 2002 | 2003 | 2004 | 2005 | 2006 | ||||||||
|---|---|---|---|---|---|---|---|---|---|---|---|---|---|---|---|
| Net lending according to NA/ESA | 3.4 | 4.6 | 1.1 | 0.4 | 1.0 | 1.4 | 2.1 | ||||||||
| Periodization of taxes | 1.0 | -2.1 | -0.8 | 0.1 | 0.1 | 0.2 | 0.1 | ||||||||
| Cyclical adjustment | -0.3 | 0.4 | 0.5 | 1.0 | 0.7 | 0.3 | 0.0 | ||||||||
| Structural balance | 4.2 | 2.8 | 0.8 | 1.4 | 1.7 | 1.9 | 2.2 | ||||||||
Sources: Statistics Sweden and Ministry of Finance.
Net lending for 2003 is divided between the three government sectors, with central government having a deficit of SEK 43 billion while the old-age pension system will show a surplus of SEK 51 billion. The central government deficit is expected to fall during the forecast period, at the same time as the surplus in the pension system increases slightly. The local government sector's finances are expected to show a deficit in 2004-2006, after a small surplus in 2003. It is estimated that the deficits will be compatible with a positive result as defined in the balanced-budget requirement for municipalities and county councils.
Financial position
The general government sector's financial assets and liabilities are reported in Statistics Sweden's Financial Accounts. Under current EU regulations (ENS-95), assets and liabilities are valued at market price. This means that changes in the net financial position are not only determined by net lending, but are also affected by changes in the value of financial assets and liabilities. This applies to both realised and unrealised changes in value.
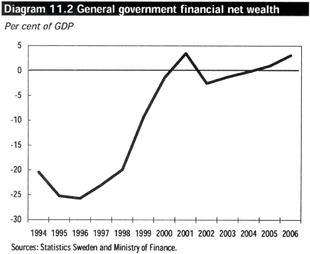
In 1990, the general government sector's financial wealth amounted to over SEK 100 billion, or 8 per cent of GDP. During the severe crisis of the early 1990s, the financial position deteriorated rapidly. The wealth was replaced by net debt, which in 1996 was SEK 467 billion, or almost 27 per cent of GDP. Since 1996, the financial position has improved, and the net debt was replaced by positive wealth in 2001.
80
The substantial reduction in the value of the general government sector's shareholdings in 2002 brought about a situation of net debt again, despite net lending remaining positive. No assumptions are made in the forecast about future changes in value, with the exception of the effects on central government debt from changes in foreign exchange rates. This means that the trend in net debt will follow net lending. The positive net lending will lead to a reduction in net debt during the forecast period, and in 2005 it is expected that the financial assets of the general government sector will once again exceed liabilities.
Table 11.2 General government finances
SEK billion
| | 2002 | 2003 | 2004 | 2005 | 2006 | |||||||
|---|---|---|---|---|---|---|---|---|---|---|---|---|
| Revenue | 1 330 | 1 377 | 1 430 | 1 489 | 1 555 | |||||||
| per cent of GDP | 56.8 | 56.8 | 56.5 | 56.1 | 56.1 | |||||||
| Taxes and charges | 1 201 | 1 241 | 1 290 | 1 341 | 1 400 | |||||||
| per cent of GDP | 51.3 | 51.2 | 51.0 | 50.6 | 50.5 | |||||||
| Capital income | 51 | 53 | 54 | 58 | 62 | |||||||
| Other income | 78 | 82 | 85 | 89 | 93 | |||||||
| Expenditure | 1 305 | 1 367 | 1 406 | 1 452 | 1 496 | |||||||
| per cent of GDP | 55.8 | 56.4 | 55.5 | 54.7 | 53.9 | |||||||
| Expenditure excl. interest | 1 231 | 1 299 | 1 346 | 1 381 | 1 425 | |||||||
| per cent of GDP | 52.6 | 53.5 | 53.2 | 52.1 | 51.4 | |||||||
| Interest | 74 | 68 | 59 | 71 | 71 | |||||||
| per cent of GDP | 3.2 | 2.8 | 2.3 | 2.7 | 2.6 | |||||||
| Net lending | 25 | 10 | 24 | 37 | 59 | |||||||
| per cent of GDP | 1.1 | 0.4 | 1.0 | 1.4 | 2.1 | |||||||
| Central government | -14 | -43 | -23 | -16 | 5 | |||||||
| Pension system | 48 | 51 | 53 | 58 | 57 | |||||||
| Local government | -8 | 1 | -6 | -4 | -4 | |||||||
| Financial position | ||||||||||||
| Net debt | 59 | 29 | 4 | -27 | -86 | |||||||
| per cent of GDP | 2.5 | 1.2 | 0.2 | -1.0 | -3.1 | |||||||
| Consolidated gross debt | 1 227 | 1 237 | 1 267 | 1 284 | 1 287 | |||||||
| per cent of GDP | 52.4 | 51.0 | 50.0 | 48.4 | 46.4 | |||||||
Sources: Statistics Sweden and Ministry of Finance.
The allocation of net lending between central government and the old-age pension system means that the improvement in the financial position will come about through increased assets in the pension system. The deficit in central government net lending means that the liability side of the general government sector's balance sheet will increase over the forecast period. The increase in debt will not, however, be large enough to prevent central government debt and consolidated gross debt continuing to fall as a percentage of GDP.
Consolidated gross debt is defined by EU rules (the Maastricht criteria). The definition means that the general government sector's gross debt is to be consolidated, i.e. reduced by the general government sector's holding of own liabilities. For Sweden, the definition means that the consolidated gross debt consists of central government debt at par value plus the local government sector's liabilities in the credit market, with a deduction for the National Pension Funds' holdings of treasury bonds. The valuation is made at par value.
81
At the end of 2002, the consolidated debt amounted to 52.4 per cent of GDP, which was below the EU reference value of 60 per cent of GDP by a substantial margin. At the end of 2005, consolidated gross debt is expected to be below 50 per cent of GDP.
Comparison with the Government Budget Bill for 2003
General government net lending in 2002 was SEK 13 billion lower than the estimate in the Government Budget Bill, despite tax revenues being rather higher than expected. The deterioration is due to higher central and local government expenditure. In and after 2003, the downwards revision of GDP growth since the Government Budget Bill will have an impact in the form of lower tax revenues than estimated, despite the fact that the increase in local government taxes was greater than expected. Higher expenditure will also contribute to the deterioration in net lending compared with the estimate in Government Budget Bill. Overall, the general government sector's net lending has been revised downwards by SEK 25 billion in 2003 and SEK 15 billion in 2004, compared with the estimates in the Government Budget Bill.
Net debt, as reported in Statistics Sweden's Financial Accounts, was revised downwards by SEK 74 billion in 2001, which means that the net financial position was stronger than had been reported previously. Despite the improved initial position, it is now calculated that net debt in 2002 was already higher than in the Government Budget Bill. This is a consequence of the substantial fall in the value of shares last year. In addition, both gross and net debt will increase in relation to the forecast in the Government Budget Bill as a result of lower net lending.
Taxes and charges
The taxes recorded in the general government sector are somewhat lower than total tax revenues. In the National Accounts, the portion of value added tax and customs revenues, which is included as part of the EU contribution, is not accounted for as transactions in the general government sector but is treated as a tax for abroad.
Table 11.3 Taxes and charges
Per cent of GDP
| | 2002 | 2003 | 2004 | 2005 | 2006 | ||||||
|---|---|---|---|---|---|---|---|---|---|---|---|
| Household taxes and charges | 19.6 | 19.7 | 19.6 | 19.6 | 19.6 | ||||||
| Company direct taxes | 2.7 | 2.4 | 2.4 | 2.3 | 2.4 | ||||||
| Payroll charges | 14.8 | 14.7 | 14.6 | 14.6 | 14.5 | ||||||
| Value added tax | 9.4 | 9.5 | 9.4 | 9.3 | 9.3 | ||||||
| Property tax | 1.0 | 1.0 | 1.0 | 0.9 | 0.9 | ||||||
| Other production taxes | 4.4 | 4.3 | 4.2 | 4.1 | 4.1 | ||||||
| Total in NA/ESA, incl. tax to EU | 51.8 | 51.5 | 51.2 | 50.9 | 50.8 | ||||||
| of which to EU | 0.5 | 0.4 | 0.3 | 0.3 | 0.3 | ||||||
| Periodization | -1.1 | 0.1 | 0.1 | 0.2 | 0.1 | ||||||
| Accrual taxes | 50.8 | 51.6 | 51.3 | 51.0 | 50.9 | ||||||
Sources: Statistics Sweden and Ministry of Finance.
In 2002, total tax revenues amounted to 51.8 per cent of GDP according to the National Accounts (see Table 11.3). If taxes are allocated to the income year that they refer to, a fairer picture emerges of the changes in the tax ratio, and its current level, which is expected to be 50.8 per cent. (The outcome of the allocated taxes for 2002 is based on the tax assessment in autumn 2003.) With accruals, the tax ratio will increase this year by 0.8 percentage points to 51.6 per cent. The increase is partly due to
82
higher municipal taxes, and partly to fact that the special basic tax allowance for pensioners has been abolished and replaced by a taxed guaranteed pension. No major changes in tax rules are included in the forecasts for subsequent years. Nevertheless, the tax ratio will fall both in the National Accounts and in accrual terms. This is primarily due to the fact that the most important tax bases will grow more slowly than GDP.
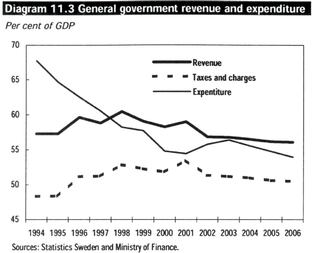
Other income
Alongside taxes, the general government sector receives other income, which in 2002 amounted to SEK 130 billion, or 5.5 per cent of GDP. Around 40 per cent of this income consists of property income in the form of interest and dividends, and approximately half of this is the yield on the pension funds. Eighty per cent of remaining income consists of imputed pension charges and consumption of fixed capital. This income is imputed and is matched on the expenditure side by equally large costs, which are included in general government consumption expenditure. The general government sector also receives income from certain transfers from households, firms and from abroad. Overall, it is estimated that the percentage of GDP represented by other income will remain unchanged during the forecast period.
Expenditure
In 2002, the general government sector's expenditure amounted to 55.8 per cent of GDP (the expenditure ratio). The expenditure ratio is expected to rise by 0.6 percentage points this year. Excluding interest expenditure, the expenditure ratio will rise by just under 1 percentage point (see Table 11.4). Half of this increase is due to the fact that the special basic tax allowance for pensioners is being abolished and replaced by a taxed guaranteed pension. This also raises the general government sector's income by a corresponding amount. Higher local government consumption expenditure explains most of the remaining increase. It is expected that the expenditure ratio will fall from 2004, partly due to acceleration in economic growth.
Transfers to households will rise in 2003 as a percentage of GDP, partly in consequence of the above-mentioned introduction of the taxed guaranteed pension. The sharp increase in expenditure on health insurance in recent years will stop, but disability pensions will continue to rise. From 2004, the transfers are expected to fall as unemployment is reduced. Pension expenditure, which will increase substantially in volume throughout the forecast period, will, however, fall as a percentage of GDP in 2005. The indices that govern pensions (index of earnings and CPI) will increase more slowly than GDP.
83
Other transfers will rise to some extent in 2003 and 2004 as the GNI-based EU-contribution increases. This is partly a result of the fact that the larger part of the total EU contribution is based on GNI. That part of the EU contribution, which is based on the VAT base, is not accounted for as expenditure in the National Accounts but as a tax for abroad.
Table 11.4 General government expenditure
Per cent of GDP
| | 2002 | 2003 | 2004 | 2005 | 2006 | ||||||
|---|---|---|---|---|---|---|---|---|---|---|---|
| Transfers to households | 18.6 | 19.2 | 18.9 | 18.4 | 18.2 | ||||||
| Old age | 8.6 | 9.2 | 9.2 | 8.9 | 8.9 | ||||||
| Illness | 4.5 | 4.6 | 4.6 | 4.7 | 4.6 | ||||||
| Labour market | 1.5 | 1.6 | 1.4 | 1.2 | 1.1 | ||||||
| Family and children | 1.9 | 1.9 | 1.9 | 1.9 | 1.8 | ||||||
| Studies | 0.6 | 0.5 | 0.4 | 0.4 | 0.4 | ||||||
| Social assistance etc. | 0.5 | 0.5 | 0.5 | 0.4 | 0.4 | ||||||
| Other | 1.0 | 1.0 | 0.9 | 0.9 | 0.9 | ||||||
| Other transfers | 2.9 | 3.0 | 3.2 | 3.0 | 2.9 | ||||||
| of which GNI-fee to EU | 0.5 | 0.6 | 0.7 | 0.7 | 0.7 | ||||||
| Consumption | 28.0 | 28.2 | 27.9 | 27.5 | 27.2 | ||||||
| Central government and old-age pension system | 8.0 | 7.9 | 7.8 | 7.6 | 7.5 | ||||||
| Local government | 20.0 | 20.3 | 20.1 | 19.9 | 19.7 | ||||||
| Investment | 3.1 | 3.1 | 3.2 | 3.1 | 3.1 | ||||||
| Interest | 3.2 | 2.8 | 2.3 | 2.7 | 2.6 | ||||||
| Total expenditure | 55.8 | 56.4 | 55.5 | 54.7 | 53.9 | ||||||
| exclusive of interest | 52.6 | 53.5 | 53.2 | 52.1 | 51.4 | ||||||
Sources: Statistics Sweden and Ministry of Finance.
Central government consumption expenditure is expected to fall in constant prices by 0.5 per cent per year in 2003 and 2004. Within the framework of the balanced budget requirement, there is financial scope for continued growth in the local government sector's consumption expenditure to 0.8 per cent in 2003 and to 0.5 per cent in 2004. Despite the increase this year being significantly lower than for GDP, general government consumption will rise as a percentage of GDP. This is due to a relatively high rate of price increase for local government consumption, particularly as a result of the increased premiums for occupational insurance.
Investment in infrastructure will contribute to an increase in general government investment in volume terms throughout the forecast period, and it will remain at a relatively high percentage of GDP during the forecast period.
Interest expenditure in 2002 amounted to 3.2 per cent of GDP. The low level of interest rates and the strengthening of the exchange rate are expected to lead to a sharp reduction in interest expenditure during 2003 and 2004. Between 2002 and 2004 interest expenditure will fall by SEK 15 billion or almost 1 per cent of GDP. The reduced level of interest expenditure means that the net deficit in property income and interest expenditure will be reduced from SEK 23 billion in 2002 to only SEK 5 billion in 2004. A normalization of interest rate levels and rising central government debt will lead to a rise in interest expenditure in 2005.
84
11.2 Central government
Central government net lending showed a deficit of SEK 14 billion in 2002, while the budget recorded a surplus of SEK 1 billion. The difference between net lending and the budget balance is partly due to an extra dividend of SEK 20 billion from the Riksbank being credited to the budget balance but not to net lending. Under the current rules governing National Accounts within the EU, only the "normal" dividend is included in net lending.
In 2003, central government tax revenues will increase by only SEK 8 billion, while the general government sector's tax revenues will increase by SEK 40 billion. The bulk of the increase will accrue to the local government sector as a result of the rises in local government taxation and the final settlement of local government tax funds. Central government expenditure will increase by SEK 38 billion, and the deficit in net lending will increase to SEK 43 billion. The budget deficit will be lower, partly as a result of the assumed sales of shares of SEK 15 billion being included in the budget balance but not in net lending.
In 2004, revenues are expected to grow more strongly, and the savings now proposed in the budget, as well as the continuing fall in interest expenditure, will contribute to a reduction of the deficit in net lending to SEK 23 billion. In subsequent years, the strengthening of central government finances will continue, and it is estimated that there will be a small surplus in net lending in 2006.
Table 11.5 Central government finances
SEK billion
| | 2002 | 2003 | 2004 | 2005 | 2006 | |||||||
|---|---|---|---|---|---|---|---|---|---|---|---|---|
| Revenue | 742 | 752 | 788 | 819 | 855 | |||||||
| Taxes and charges | 678 | 686 | 722 | 749 | 783 | |||||||
| Other income | 64 | 65 | 66 | 69 | 72 | |||||||
| Expenditure | 756 | 794 | 811 | 835 | 850 | |||||||
| Transfers to private sector and abroad | 310 | 344 | 355 | 359 | 365 | |||||||
| Contributions to local government | 120 | 122 | 124 | 127 | 129 | |||||||
| Old-age pension charges to the pension funds | 22 | 21 | 23 | 25 | 25 | |||||||
| Transfers to premium reserve funds | 20 | 22 | 24 | 24 | 25 | |||||||
| Consumption and investments | 219 | 227 | 235 | 239 | 246 | |||||||
| Interest | 66 | 59 | 50 | 61 | 60 | |||||||
| Net lending | -14 | -43 | -23 | -16 | 5 | |||||||
| per cent of GDP | -0.6 | -1.8 | -0.9 | -0.6 | 0.2 | |||||||
| Budget balance | 1 | -21 | -27 | -9 | -1 | |||||||
| per cent of GDP | 0.1 | -0.9 | -1.1 | -0.3 | 0.0 | |||||||
| Central government debt(1) | 1 165 | 1 164 | 1 189 | 1 202 | 1 202 | |||||||
| per cent of GDP | 49.8 | 48.0 | 47.0 | 45.3 | 43.3 | |||||||
- (1)
- The central government debt presented is consolidated (in accordance with the publication Annual Report for Central government), which means that central government authorities holdings of central government bonds are consolidated.
Sources: National Debt Office, Statistics Sweden and Ministry of Finance.
With effect from 1 January 2003, new principles apply to the National Debt Office's definition of the central government debt. The new definition means that debt swap agreements and currency futures are included in the debt, and all debt instruments are valued at the nominal terminal value. The
85
use of the new definition raises the reported central government debt by SEK 44 billion at 31 December 2002. The National Debt Office records the debt gross, while general government holdings of treasury bonds are credited in the central government Annual Accounts and in Table 11.5. This consolidated debt constitutes the central government debt's contribution to the general government sector's consolidated gross debt, as measured for EU purposes.
The central government debt will fall in 2003 according to the new measure, despite a budget deficit (borrowing requirement) of SEK 21 billion. This is due to the debt in foreign currency being reduced by the predicted appreciation of the krona. The central government debt will thereafter increase during the forecast period, but the increase will not be large enough to prevent the debt falling as a percentage of GDP.
11.3 The old-age pension system
The old-age pension system consists of an income-related part and a prefunded part. The income-related part is financed through the National Pension Funds, which act as buffer funds in the reformed pension system. Alongside the income-related system, an asset base is being built up within a prefunded section of the pension system administrated by the Premium Pension Authority. The funds allocated since 1995 correspond to earned premium pension rights and are invested initially with the Swedish National Debt Office and subsequently with a fund manager chosen by the beneficiary. As the Premium Pension Authority, a central government agency, is the formal owner of the mutual funds, savings in the prefunded pension system are included the general government sector.
During the temporary management by the Swedish National Debt Office, transfers to the prefunded pension system are included in central government net lending, and thereby reduce central government debt. Funds corresponding to the premium pension right are transferred to the Premium Pension Authority in the second year after the year of income. The balance in the prefunded pension system will, therefore, correspond to a reduced central government balance.
In 2002, the balance in the pension system, i.e. the National Pension Funds and the Premium Pension Authority, amounted to SEK 48 billion or 2 per cent of GDP. Despite the positive balance, investment assets in the pension system fell by almost SEK 90 million last year. This is due to the substantial reduction in the value of shares, which make up the majority of the assets in both the National Pension Funds and the funds managed by the Premium Pension Authority. Changes in value do not affect net lending, which includes only yields in the form of interest and dividends.
86
Table 11.6 The old-age pension system
SEK billion
| | 2002 | 2003 | 2004 | 2005 | 2006 | |||||||
|---|---|---|---|---|---|---|---|---|---|---|---|---|
| Revenue | 203 | 209 | 220 | 231 | 241 | |||||||
| Contributions | 161 | 165 | 171 | 179 | 185 | |||||||
| Premium reserve funds | 20 | 22 | 24 | 24 | 25 | |||||||
| Interest and dividends | 22 | 23 | 26 | 28 | 31 | |||||||
| Expenditure | 155 | 158 | 167 | 173 | 184 | |||||||
| Pensions | 152 | 155 | 164 | 170 | 180 | |||||||
| Other | 3 | 3 | 3 | 4 | 4 | |||||||
| Net lending | 48 | 51 | 53 | 58 | 57 | |||||||
| per cent of GDP | 2.0 | 2.1 | 2.1 | 2.2 | 2.1 | |||||||
| of which Pension funds(1) | 26 | 27 | 26 | 29 | 27 | |||||||
| Premium pension authority | 21 | 24 | 27 | 28 | 30 | |||||||
- (1)
- The pension funds noted here comprise the distribution part of the old-age pension system.
Sources: National Debt Office, Statistics Sweden and Ministry of Finance.
In 2003, net lending will rise in consequence of central government taking over pension expenditure of SEK 7 billion. Net lending is thereafter predicted to remain at a level just above 2 per cent of GDP during the forecast period. This means that the whole of the surplus target of 2 per cent of GDP for the general government sector will be in the pension system and will be used to build up the pension funds.
The balance in the premium pension system will rise during the forecast period, and in 2006 it will be larger than in the distribution system.
11.4 Local government
The finances of the local government sector improved at the end of the 1990s and in 2000. Above all it was the favourable trend in employment in the economy which contributed to a growing tax base, and thereby increased tax revenues for municipalities and county councils. The central government grants also rose during this period, as a result of a number of reforms implemented in the local government area.
Local government consumption has increased sharply since 2000. Simultaneously, the growth in employment in the economy slowed down during 2001 and 2002, and this contributed to the tax base rising at a rather slower rate than in previous years. Expenditure increased during these years more than revenue, and in 2002 the local government sector recorded a deficit in net lending of SEK 8 billion. The balanced budget requirement came into force in 2000, and this means that municipalities and county councils must prepare a balanced budget. If a deficit arises, there must be a return to balance within two years. In 2002, the local government sector as a whole recorded a negative result.(16)
- (16)
- The results which municipalities and county councils record in their income statements differ from the definition of net lending used in the National Accounts.
87
Local government finances
In 2003, taxes were raised by an average of SEK 0.65 in the local government sector as a whole. The average tax rate after the increase is 31.17 per cent, and it is assumed that this will remain unchanged during the forecast period. The rise is equivalent to SEK 8.5 billion in increased tax revenues. This will improve finances during the current year, and it is estimated that net lending for the sector as a whole will amount to SEK 1 billion.
Despite the increase in taxes, net lending is being revised downwards for 2003 from the forecast in the Government Budget Bill for 2003 (an average tax increase of SEK 0.25 was forecast in the Government Budget Bill). The downwards revision of net lending is primarily due to increased premiums for occupational insurance, and this is equivalent to an increase in costs of SEK 4 billion.
It is expected that the increase in revenue will be dampened relatively quickly next year despite the extension of temporary employment support and the "SEK 200"(17) until 2004. At current prices, revenue will increase by 2.1 per cent, compared with an increase in revenue of around 6 per cent per year in 2002 and 2003. The slowing down of the increase in local government sector revenue is largely due to the large final settlements of local government tax, which will contribute to a reduction in revenue equivalent to SEK 4.5 billion in 2004.(18) Net lending will deteriorate to SEK -6 billion in 2004, despite a moderate increase in expenditure.
- (17)
- Transfer of central government income tax to municipalities and county councils.
- (18)
- In the National Accounts, the difference between the preliminary and final local government taxes is taken up in the year following the income year. In 2003, the municipalities will receive a positive final settlement of just over SEK 2 billion. In 2004, this item is expected to amount to almost SEK -2.5 billion, i.e. there will be a change of nearly SEK 4.5 billion in 2004.
Table 11.7 Local government finances
SEK billion
| | 2002 | 2003 | 2004 | 2005 | 2006 | ||||||
|---|---|---|---|---|---|---|---|---|---|---|---|
| Revenue | 549 | 584 | 596 | 618 | 641 | ||||||
| Taxes and central government grants | 503 | 534 | 544 | 565 | 585 | ||||||
| Other revenues | 46 | 50 | 52 | 53 | 56 | ||||||
| Expenditure | 558 | 582 | 601 | 623 | 645 | ||||||
| Consumption | 468 | 492 | 509 | 527 | 545 | ||||||
| percentage change in volume | 2.3 | 0.8 | 0.5 | 0.5 | 0.5 | ||||||
| Other expenditure | 90 | 90 | 92 | 96 | 100 | ||||||
| Net lending | -8 | 1 | -6 | -4 | -4 | ||||||
| per cent of GDP | -0.4 | 0.1 | -0.2 | -0.2 | -0.1 | ||||||
Note: Central government grants and taxes have been combined in the table since the impact of reforms affecting the tax base are neutralised through adjustments in central government grants.
Sources: Statistics Sweden and Ministry of Finance.
Tax revenues will increase faster during 2005 than in 2004 at the same time as the temporary employment support and the "SEK 200" ceases. Net lending will improve somewhat in 2005 and 2006, to SEK -4 billion. A financial deficit of this order of magnitude is regarded as compatible with an overall surplus in the local government income statement. The balanced budget requirement for the
88
sector as a whole will be met in the years 2004-2006 provided that the increase in operational volumes is limited to 0.5 per cent per year.
In recent years, the financial position of county councils has been worse than that of municipalities. In 2002, 62 per cent of municipalities recorded a positive result, while only 5 of the 18 county councils reported a surplus. This year, taxes were raised by SEK 0.17 in municipalities and SEK 0.48 in county councils. This will improve finances, particularly of county councils. Net lending in municipalities is expected to be negative during the period 2003-2006, while county councils are forecast to show positive net lending. For municipalities, some degree of deficit is net lending is regarded as compatible with fulfilling the balanced budget requirement.
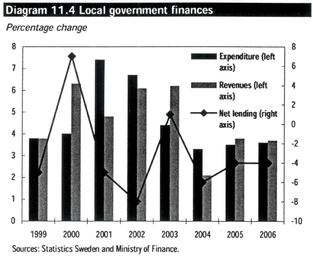
Limited scope for increased consumption expenditure
If the balanced budget requirement is to be fulfilled during the forecast period, consumption must increase at a significantly lower rate than it has in recent years. This year, the scope for increased operational volumes is estimated at 0.8 per cent. During the period 2004-2006, it is estimated that consumption expenditure will increase by 0.5 per cent per year in volume terms, which is in line with the expected requirements from demographic trends.
Local government employment
Last year, the number of people employed in municipalities and county councils increased by 1.1 per cent, while employment in the economy as a whole increased by only 0.1 per cent. A likely partial explanation for the increase is the temporary employment support grant which municipalities and county councils received last year, and which it is now proposed should be extended until 2004. The increase in local government employment is expected to continue this year and next, but at a decreasing rate.
Price trends in the local government sector
85 per cent of local government expenditure is consumption expenditure. The local government sector's consumption expenditure at current prices has risen relatively sharply over the past three years. In 2002, consumption expenditure rose by almost 7 per cent at current prices. A large proportion of local government costs is wage-related, either as direct wages or as purchases of labour-intensive services. The strong growth at current prices compared with volume growth of 2.3 per cent is due
89
above all to rising wages in local government operations and the introduction of a maximum charge for child day-care services.(19)
- (19)
- The maximum charge will mean that a smaller proportion of the costs will be financed through charges, and this will raise local government consumption at current prices.
Wage growth was higher in the local government sector than in the economy as a whole during 2002.(20) Increases in local government wages in line with wage increases in the economy as a whole have a limited effect on municipal finances, since the tax base grows at around the same rate as costs. If the wage increases are higher in the local government sector than in other sectors, however, this has a negative effect on local government finances.
- (20)
- Preliminary statistics from the Mediation Institute.
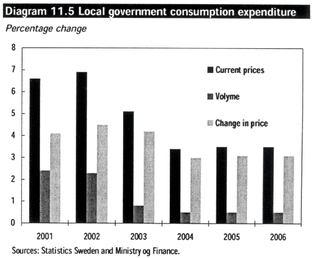
Consumption expenditure is expected to increase by 5.1 per cent in 2003 at current prices. This relatively large increase at current prices compared with volume growth of 0.8 per cent is largely due to the increase in wage costs related to the rise in premiums for occupational insurance. Despite the assumption of a 3.5 per cent increase in hourly wages, price increases during the current year are also expected to be relatively high. During the period 2004-2006, the rate of increase in consumption expenditure at current prices will be dampened and the local government sector expenditure will grow at the same rate as revenues.
11.5 Fiscal policy targets and indicators
The central target of fiscal policy is to maintain an average surplus in the general government sector's net lending equivalent to 2 per cent of GDP over a business cycle. The main aim is to strengthen the wealth position of the general government sector in preparation for impending demographic changes over the next few decades. Simultaneously, the surplus target creates sufficient scope to avoid excessive deficits in a recession within the regulatory framework of the EU. The automatic stabilisers can have their full impact, and there is scope for labour market policy and other active fiscal measures when economic activity weakens, without the deficit limit of 3 per cent of GDP being exceeded. In this way, fiscal policy can help stabilise demand and employment.
An indicator for the surplus target
Public finances are affected by automatic variation in tax revenue and expenditures over the business cycle. The surplus for any individual year may therefore deviate from 2 per cent of GDP
90
without putting the medium-term target at risk. When there are available resources in the economy, the surplus can be permitted to fall below 2 per cent, and when resource utilisation is above the long-term sustainable level, the surplus should be greater than 2 per cent.
To determine whether the target for the surplus is being met in any individual year, an indicator is used. The indicator reflects the structural level of the surplus, adjusted for temporary effects. The temporary effects normally consist of variations in taxes and expenditure linked to the business cycle, but it is also possible for other types of one-off effects to arise. Temporary tax revenues and the accounting practice with tax revenue can affect the actual balance by a significant amount.
The structural surplus in public finances should normally be close to 2 per cent of GDP. The economic situation may, however, be such that the automatic stabilisers require reinforcement through active measures to support monetary policy. In such situations, it may be necessary for the structural balance to deviate from 2 per cent of GDP. A higher or lower structural surplus may, however, be necessary in a particular year if the surplus for the preceding year deviates substantially from the target. In the event of a large surplus, for example, a rapid adjustment of public finances towards the target can have an excessively expansionary effect on demand.
The cyclical adjustment of the surplus is based on an assessment of the economic situation as well as on the effects of the economic situation on public finances. The economic situation is estimated by the GDP gap, which constitutes the difference between actual and potential GDP. The size of the GDP gap is based on an overall assessment of a number of indicators for output, the labour market and for price and wage formation.
Calculations of the cyclical sensitivity of public finances show that a 1 percentage point change in the GDP gap affects the public balance by between 0.65 and 0.90 per cent of GDP. Values in the lower part of the range emerge when only the automatic stabilisers are measured. Higher values are obtained when labour market policy is also taken into account. Labour market policy can be regarded as a "semi-automatic" stabiliser, which as a rule is used to stabilise unemployment, even though this presupposes formal decisions.
The assessment is that, on average, a change in the GDP gap of 1 percentage point affects the surplus in public finances by 0.7 per cent of GDP. Sensitivity varies from year to year, depending on how the components of GDP develop in relation to each other. Public finances are more sensitive to a change in household consumption, which constitutes an important tax base, than if the business cycle is being affected by international trade.
Structural surplus in the general government sector
In 2001 and 2002, net lending in the general government sector amounted to 4.6 and 1.1 per cent of GDP respectively. The recorded net lending was, however, strongly affected by the allocation of tax revenues. If the surplus is adjusted for the incomplete allocation of, in particular, taxes on capital income in the National Accounts, a fairer picture of the developments emerges. Between 2001 and 2002, the accrued surplus fell from 2.5 to 0.3 per cent of GDP. The principal explanation is the expansionary fiscal policy, which last year contributed to a weakening of the balance by 1.8 per cent of GDP.
In the Budget Bill for 2003, the government judged that the target for the surplus should be 1.5 per cent of GDP in 2003. Economic growth is now considered to be substantially weaker than was predicted in the Budget Bill. GDP growth for 2003 has been revised downward from 2.5 per cent to 1.4 per cent. The surplus in the general government sector's finances is now estimated at 0.4 per cent of GDP, i.e. 1.1 percentage points below the estimate in the Budget Bill. The reduced surplus is largely explained by growth being weaker than expected.
91
The estimates show that the recorded surplus will be lower than 2 per cent of GDP also in 2004 and 2005. The GDP gap is, however, expected to remain negative, which means that the structural surplus will be higher than the recorded surplus and, for 2005, the structural surplus is estimated at close to 2 per cent of GDP. In 2006, it is expected that the output gap will be closed, and the surplus will amount to just over 2 per cent. Even if the structural surplus deviates relatively sharply from 2 per cent of GDP in 2002 and 2003, the forecast surpluses up until the end of 2006 are regarded as being compatible with a surplus target of 2 per cent of GDP on average over a business cycle. The estimate of the potential output level is not certain. If the productive capacity of the economy is overestimated, then the structural surplus will also be overestimated.
An indicator for the effects of public finances on demand
Demand in the private sector is affected by changes in public finances. A falling surplus in public finances means that taxes and charges are increasing more slowly than public expenditure, which normally strengthens income growth in the private sector. For a variety of reasons, however, the effects on demand are difficult to assess. Households with different propensities to consume react differently to fiscal stimulus. Households with good access to credit are able to smooth out their consumption expenditure in the event of changes in income. For other households, consumption expenditure is affected more directly. There is also some uncertainty as to when the effects arise.
For fiscal policy to have its desired effects, there must be confidence in the long-term sustainability of public finances. Households become more cautious in their expenditure decisions if the general government deficit is large, since the deficit must be financed sooner or later by increases in taxes or cuts in expenditure. On the other hand, consumer confidence may be affected positively when public finances show a substantial surplus. For this reason, the annual change in net lending constitutes only a rough indicator of the effects of public finances on demand.
Table 11.8 Structural balance in the general government sector
Per cent of GDP
| | 2000 | 2001 | 2002 | 2003 | 2004 | 2005 | 2006 | ||||||||
|---|---|---|---|---|---|---|---|---|---|---|---|---|---|---|---|
| Net lending | 3.4 | 4.6 | 1.1 | 0.4 | 1.0 | 1.4 | 2.1 | ||||||||
| Periodization of taxes | 1.0 | -2.1 | -0.8 | 0.1 | 0.1 | 0.2 | 0.1 | ||||||||
| Net lending with accrual taxes | 4.5 | 2.5 | 0.3 | 0.5 | 1.0 | 1.6 | 2.2 | ||||||||
| Cyclical adjustment | -0.3 | 0.4 | 0.5 | 1.0 | 0.7 | 0.3 | 0.0 | ||||||||
| Structural balance | 4.2 | 2.8 | 0.8 | 1.4 | 1.7 | 1.9 | 2.2 | ||||||||
| GDP-gap | 0.4 | -0.5 | -0.7 | -1.4 | -1.0 | -0.4 | 0.0 | ||||||||
Sources: Statistics Sweden and Ministry of Finance.
The change in general government net lending from year to year can be described using three components that affect the balance:
- 1.
- Automatic stabilisers
The automatic stabilisers in public finances make an important contribution to stabilisation policy. When GDP growth is above the trend level, public finances are strengthened as tax revenues increase and the costs for unemployment decrease, and this, in turn, moderates income growth in the private sector. This helps limit domestic demand in the economy and reduces the risk of overheating. Conversely, the economy is stimulated when GDP growth is below trend. The high tax and expenditure ratios in Sweden mean that the effects of the automatic stabilisers are high compared with most other countries and that public finances have a comparatively strong moderating effect on swings in the
92
business cycle. The macroeconomic forecast implies that GDP will grow more rapidly than potential growth during the years 2004-2006. The automatic stabilisers will, therefore, make a positive contribution to the change in general government net lending during these years. (See Table 11.9.)
- 2.
- Discretionary fiscal policy
The discretionary component of fiscal policy consists of active reform decisions and savings in the central government budget. A summary of previously decided and now proposed or announced reforms is given in Chapter 4 of the Spring Fiscal Policy Bill for 2003. The budget effect relates to the year in which the decisions are implemented, irrespective of when they are taken.
- 3.
- Other factors affecting the balance
In addition to discretionary fiscal policy and the automatic stabilisers, public finances are affected by a number of other factors. The composition of growth and the incomplete allocation of taxes in the National Accounts can have significant effects on reported general government net lending for individual years. In addition, property income and interest expenditure are affected by changes in the general government sector's assets and liabilities, as well as by the level of interest rates. Transfer expenditure is affected by changes in volume without any direct correlation to the economic situation, e.g. demographic trends or changes in behaviour. Finally, public finances are affected by developments within the local government sector. An increase in taxes with the aim of restoring balance in local government finances will have a tightening effect on the economy.
The change in the general government sector's net lending is made up of the total of the changes in the three above-mentioned components. This constitutes a rough indicator of the effect of public finances on demand. The change in the structural balance, i.e. the change in net lending that is not due to the automatic stabilisers, is an indicator of fiscal stance. This indicator does not, consequently, cover only decisions on reforms and savings in the central government budget, but also other factors affecting the balance.
Effects on demand and fiscal stance
Table 11.9 shows the change in general government net lending for the years 2002-2006. Discretionary fiscal policy was strongly expansionary in 2002. A small degree of stimulus was also generated through the automatic stabilisers, since the GDP gap widened somewhat between 2001 and 2002. Other factors affecting the balance had only a marginal effect. Accordingly, fiscal policy, in combination with the automatic stabilisers, contributed in supporting the level of economic activity despite the international recession.
93
Table 11.9 Fiscal impact
Change in per cent of GDP
| | 2002 | 2003 | 2004 | 2005 | 2006 | ||||||
|---|---|---|---|---|---|---|---|---|---|---|---|
| General government net lending | -3.5 | -0.7 | 0.6 | 0.4 | 0.7 | ||||||
| Periodization of taxes | 1.3 | 0.9 | 0.0 | 0.1 | -0.1 | ||||||
| Net lending with accrual taxes | -2.2 | 0.2 | 0.5 | 0.5 | 0.7 | ||||||
| of which | |||||||||||
| Automatic stabilisers | -0.2 | -0.4 | 0.3 | 0.4 | 0.3 | ||||||
| Structural balance | -2.0 | 0.6 | 0.3 | 0.1 | 0.4 | ||||||
| of which | |||||||||||
| Discretionary fiscal policy | -1.8 | -0.5 | -0.1 | 0.1 | 0.0 | ||||||
| Net capital income | -0.1 | 0.4 | 0.4 | -0.3 | 0.1 | ||||||
| Others | -0.1 | 0.8 | 0.0 | 0.3 | 0.2 | ||||||
| GDP gap, change in percentage points | -0.2 | -0.6 | 0.4 | 0.5 | 0.4 | ||||||
Sources: Statistics Sweden and Ministry of Finance
This year, it is expected that the general government sector's surplus with accrual taxes will strengthen only marginally, which means that the general government sector's finances overall will have a neutral effect on the economy. The automatic stabilisers will have some stimulating effect, but this will be counteracted by the strengthening of the structural balance. Fiscal stance, measured as the change in the structural balance is consequently tight. Discretionary fiscal policy in the central government budget is expansionary, despite the savings that are now proposed. The local government sector's finances will, however, be substantially strengthened, among other things by the increase in local government taxes. The improvement in net interest will also help strengthen the structural balance.
During the period 2004-2006, the surplus with accrual taxes will gradually improve. This process will be helped by the automatic stabilisers and the continued strengthening of the structural balance. Fiscal policy will, therefore, continue to be tight, and this will alleviate the need for a tight monetary policy during the economic upswing. The composition of stabilisation policy will, therefore, be beneficial for growth and employment in the medium term.
94
The Ministry of Finance's forecasts of macroeconomic developments serve as a basis for the formulation of the government's fiscal policy. As economic policy grows ever more target-driven (e.g. through the employment target and the target of a surplus in general government net lending), the quality demanded of these forecasts grows ever higher.
This chapter discusses how the four forecasts for 2002 that the Ministry of Finance published in 2001 and 2002 compare with the preliminary outcome. This year's forecast evaluation also discusses the criticism sometimes made of forecasters' reluctance to take full account of new information in their forecasts with the result that forecast revisions can subsequently seem overly cautious. In line with previous forecast evaluations, the Ministry of Finance's forecasts are also compared with those of other economic analysts.
The Ministry of Finance has previously published three forecast evaluations and intends to continue publishing these evaluations in future Spring Budget Bills. The ultimate purpose of these evaluations is to improve future forecasts.
12.1 The Ministry of Finance's forecasts for 2002
According to the preliminary outcome from the National Accounts, GDP growth was 1.9 per cent in 2002. In general, the forecast errors for the different variables reduced as the forecast horizon grew shorter and more information became available, as illustrated in Table 12.1. Relative to the preliminary outcome for 2002 from the National Accounts, the forecasts can generally be said to have been overoptimistic. Inflation was underestimated in every forecast, due largely to the temporary effects of various supply shocks. Unemployment was generally slightly higher than anticipated, which can in part be explained by the lower GDP growth.
Table 12.1 Ministry of Finance's forecasts and outcomes for 2002
| | Spring 2001 | Autumn 2001 | Spring 2002 | Autumn 2002 | Outcome | ||||||
|---|---|---|---|---|---|---|---|---|---|---|---|
| GDP | 2.6 | 2.4 | 1.4 | 2.1 | 1.9 | ||||||
| Household consum. | 2.4 | 2.7 | 1.7 | 2.0 | 1.3 | ||||||
| Gen. gov. consum. | 0.4 | 1.1 | 0.8 | 1.7 | 2.1 | ||||||
| Gr. fixed. capital | 5.8 | 4.9 | 1.1 | -1.5 | -2.5 | ||||||
| Change in stocks(1) | 0.0 | -0.2 | -0.2 | -0.4 | -0.1 | ||||||
| Exports | 6.5 | 5.2 | 1.3 | 3.8 | 0.4 | ||||||
| Imports | 6.8 | 5.5 | 0.7 | 1.0 | -2.7 | ||||||
| Ind. production | 4.4 | 3.6 | 1.4 | 2.5 | 2.9 | ||||||
| Number of employed | 0.7 | 0.5 | -0.4 | 0.0 | 0.1 | ||||||
| Productivity(2) | 2.2 | 2.3 | 2.5 | 3.3 | 4.2 | ||||||
| Av. hours worked | 0.0 | -0.1 | -0.1 | -0.5 | -1.3 | ||||||
| Op. unemployment(3) | 3.7 | 3.8 | 4.3 | 3.9 | 4.0 | ||||||
| CPI | 1.6 | 1.7 | 2.1 | 2.3 | 2.4 | ||||||
| GDP, world | 3.8 | 3.4 | 2.6 | 2.7 | 2.9 | (4) |
- (1)
- The change in volume is calculated as per cent of last years GDP.
- (2)
- Productivity in industry.
- (3)
- Per cent of the labour force.
- (4)
- For some countries the outcome is forecasted.
95
Sources: Statistics Sweden and Ministry of Finance.
GDP forecasts during 2001
The growth outlook changed considerably during the course of 2001. At the time of the 2001 Spring Budget Bill, the downturn in the US economy at the end of 2000 had not yet spread to the European mainland and demand for Swedish goods and services was relatively strong. However, it subsequently became increasingly clear that the international economy was slowing.
Export orders continued to fall during the summer and autumn of 2001. Households decreased their consumption and increased their saving, despite strong financial wealth and relatively good growth in disposable income. At the time of the 2001 Spring Budget Bill, the Ministry of Finance was, like other economic analysts, predicting that the economy would turn during the second half of 2001. However, the global economic slowdown worsened during the spring and summer of 2001, which hit Swedish export industry hard.
The downturn was particularly acute in the ICT sector, which accounted for a substantial proportion of the strong growth in previous years. Besides falling exports, it became increasingly clear that domestic demand was falling relatively quickly. Household consumption continued to slow. This, together with falling investment and dwindling stocks, meant that GDP growth was revised downwards by 0.2 percentage points in the Budget Bill for 2002.
The international picture painted in this bill was mixed. However, the relatively high levels of confidence among US households, the strong response from the Federal Reserve and an expansive fiscal policy in several countries were interpreted as meaning that the global economy would begin a tentative recovery at the end of 2001. An improved international economy and so higher Swedish exports, combined with proposed tax cuts, were predicted to lead to GDP growth of 2.4 per cent in 2002. However, as subsequent developments in Sweden and abroad would confirm, the forecast revisions made in the Budget Bill did not go far enough.
GDP forecasts during 2002
At the time of the 2002 Spring Budget Bill, it was believed that the growth outlook had improved after a more drawn-out economic slowdown than previously anticipated. Primarily Swedish indicators suggested that recovery had begun, and the strong economic policy stimulus in, above all, the United States was expected to carry the international economy. There were also indications that the stock adjustments were complete in both the North American and European economies. In other words, the foundations for a gradual improvement in the economic climate in Sweden were believed to be in place.
The anticipated improvement in the international economy was expected to boost Swedish exports. An expansive economic policy was assumed to lead to strong growth in disposable income and relatively good growth in consumption. Car sales were expected to rebound from a poor 2001 and further cement generally strong growth in consumption in 2002. The Spring Budget Bill assumed that these higher exports and good consumption growth would be accompanied by the stabilisation of investment activity. However, due to the very weak growth at the end of 2001, GDP growth over the year as a whole was not expected to amount to more than 1.4 per cent. Thus the low overall GDP growth concealed a quite substantial improvement during the course of the year.
At first the forecast in the 2002 Spring Budget Bill seemed to have hit the mark. The Swedish economy performed surprisingly strongly during the first half of 2002. Exports of goods grew considerably faster than forecast in the bill, which was put down to Swedish industry's good competitive position, with favourable exchange rates and low labour costs per unit produced measured in a common currency. Swedish industrial activity was therefore believed to be strong relative to the international situation. Furthermore, according to the preliminary outcomes from the National Accounts, growth in disposable income had given households scope to increase both saving and
96
consumption. As a result, the Budget Bill for 2003 revised the GDP growth forecast for 2002 upwards to 2.1 per cent.
Although economic growth in the United States was in line with expectations, the global recovery—especially in the euro area—seemed to be slower than anticipated in both the spring and autumn budget bills. Swedish exports of goods therefore deviated significantly from the forecast. Exports of services, which had grown strongly throughout 2001, also turned out to be falling at an increasingly rapid rate. A higher-than-expected proportion of the growth in disposable income was saved and so growth in consumption was limited. Furthermore Swedish investment activity did not stabilise at the beginning of 2002. The preliminary outcome for GDP growth in 2002 as a whole was therefore just 1.9%.
The labour market
In 2001 the Ministry of Finance predicted relatively high employment growth in 2002 as a result of the strong economic growth forecast. Open unemployment was expected to fall further to below 4 per cent in both the Spring Budget Bill of 2001 and the Budget Bill for 2002. However, in the Spring Budget Bill for 2002 GDP growth was revised downwards. Leading indicators such as redundancy notices and newly reported vacancies suggested that employment would fall in 2002 and unemployment would rise. When the Budget Bill for 2003 was finalised, it was clear that developments had been slightly better than anticipated, which prompted a more optimistic forecast. The downward revision of unemployment was also due to the upward revision of the number of participants in labour market policy programmes. On average the forecasts overestimated employment more than the supply of labour, which is why the unemployment forecasts were generally lower than the outcome.
Average hours worked was the variable that deviated most from the outcome in the four forecasts. This is due in part to the increase noted in sick leave, which was given as the most important reason for the decline in average hours worked as early as in the Budget Bill for 2002. All of the forecasts predicted that average hours worked would stabilise and then begin to climb, which has yet to happen. Low average hours worked will generally have a negative impact on output, which is seen clearly in the outcomes for 2001. However, output was surprisingly good in 2002, which means that productivity was high in 2002.
Inflation
Inflation was underestimated in all four forecasts, although the autumn 2002 inflation forecast was very close to the outcome. The temporary effects that contributed to the surge in inflation in 2001 did not disappear as quickly as predicted in the forecasts from 2001. There were also fresh supply shocks, e.g. for vegetables and energy. However, underlying inflation was also underestimated. Above all, growth in prices of domestic services was higher than anticipated, which to some extent is believed to be related to the relatively high wage increases in service sectors close to consumers.
12.2 Comparison with other forecasters
As mentioned in the introduction, the Ministry of Finance's forecasts are also evaluated by comparing the magnitude of the forecast errors made by various forecasters for a number of key variables. This kind of comparison does have its limitations. For example, forecasts are published at different times, which means that forecasters do not have access to the same information. This is particularly clear when high-frequency variables such as inflation and unemployment are analysed and when forecasters have access to particularly important information, such as outcomes from the National Accounts. However, this problem has been minimised in the present comparison by basing it on forecasts published at more or less the same time.
There are also more fundamental differences between the various forecasters. For example, the Ministry of Finance bases its forecasts on economic policy measures already decided on or proposed in
97
the Budget Bill. Other forecasters make explicit assumptions about future economic policy. Nevertheless a comparative analysis can still provide an indication of the reliability of the various economic analysts, and perhaps also of the margin of error that can be considered normal. Ranking the various forecasters is not the aim, however.
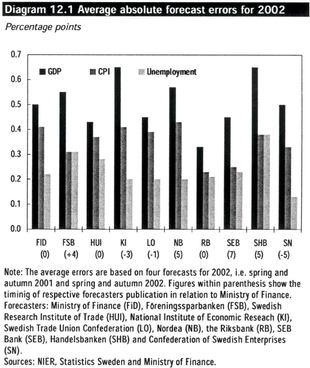
It can be seen from the diagram that the forecasts from the various different analysts for 2002 show roughly the same margin of error for all three variables—GDP, inflation and unemployment. This is because most economic analysts have access to the same information and interpret this information in a similar way. Forecast errors for 2002 were relatively small by historical standards, despite the fact that most forecasters stated that uncertainty about the economic outlook has been unusually high in recent years. However, in 2001, forecast errors were unusually large, which underlines the difficulty of identifying turning points.
Comparing forecasters on the basis of just one outcome year is naturally unreliable. Table 12.2 below therefore shows developments in forecast errors in recent years as a five-year moving average. In the period 1990-2002, forecasters misjudged GDP growth by around 0.5 percentage points on average, which can be compared to average GDP growth during the same period of around 2 per cent. Compared with forecasts looking more than one year ahead, forecasts made during the current year are considerably more accurate: in 1990-2002 the average error was just 0.2 percentage points for forecasts made for the current year.
All forecasters were also significantly more accurate than a "naive" forecast where the forecast for year t is simply the same as the outcome for the previous year, t-1.
98
Table 12.2 Average absolute forecast error for GDP growth
Percentage points, five year moving average
| | 1997 | 1998 | 1999 | 2000 | 2001 | 2002 | ||||||
|---|---|---|---|---|---|---|---|---|---|---|---|---|
| FiD | 0.7 | 0.5 | 0.6 | 0.6 | 0.7 | 0.7 | ||||||
| FSB | 0.7 | 0.6 | 0.6 | 0.6 | 0.8 | 0.7 | ||||||
| HUI | 0.9 | 0.5 | 0.7 | 0.8 | 0.8 | 0.8 | ||||||
| KI | 0.7 | 0.5 | 0.5 | 0.5 | 0.7 | 0.7 | ||||||
| Nordea | 0.6 | 0.4 | 0.5 | 0.5 | 0.7 | 0.8 | ||||||
| OECD | 0.7 | 0.5 | 0.6 | 0.7 | 0.7 | 0.7 | ||||||
| SEB | 0.6 | 0.5 | 0.5 | 0.5 | 0.6 | 0.7 | ||||||
| SHB | 0.6 | 0.4 | 0.6 | 0.6 | 0.9 | 0.9 | ||||||
| SN | 0.6 | 0.6 | 0.7 | 0.7 | 0.9 | 0.9 | ||||||
| Average | 0.7 | 0.5 | 0.6 | 0.6 | 0.8 | 0.8 | ||||||
| Naïve | 1.7 | 1.7 | 1.0 | 1.0 | 1.1 | 1.1 |
Note: Four forecasts per forecast year. Thus the 2002 moving average includes 20 forecasts, showing the absolute forecast error made between 1998 and 2002 in the spring and autumn regarding the following year and spring and autumn regarding growth same year. The naîve forecast has been defined as: prognosis year t equals the outcome of year t-1.
Sources: NIER, Statistics Sweden and Ministry of Finance.
Over time the average forecast accuracy for the various forecast institutes is very similar. The difference between the highest and lowest average forecast error for the period 1990-2002 is just 0.2 percentage points. However, the average forecast error for individual years can vary more widely. One reason why the similarities are greater when looking at the whole of the 1990s is that isolated major errors have less of an impact over a longer period. Forecast institutes that may have been favoured in one particular year by better information due to a later publication date will on average have less of an impact.
One reason why comparisons of GDP forecasts should be interpreted with caution is that GDP is an aggregate measure and so it is possible that a forecaster could make highly inaccurate forecasts for the various components of demand and still end up with a "good" overall GDP forecast. As with GDP, the forecast institutes seem to make very similar errors when it comes to the components of demand and output. With the exception of the Confederation of Swedish Enterprise, all economic analysts have had a tendency to overestimate growth. This pattern is also seen over the longer term—in the period 1990-2002 growth was overestimated by an average of 0.4 percentage points. The Ministry of Finance overestimated growth to the same extent as other economic analysts.
12.3 Why are forecasters so cautious?
Diagram 12.2 shows the average forecasts for GDP growth from the various economic analysts during the period 1990-2002, together with the preliminary and final outcomes from the National Accounts.
99
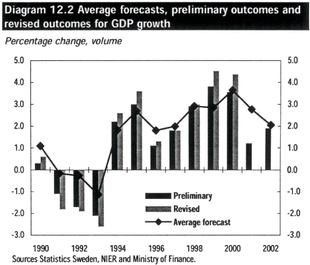
The diagram shows that forecasts tend to fluctuate less than the actual outcomes. It can also be seen that the preliminary outcome from the National Accounts fluctuates less than the second outcome. Furthermore in the 1990s forecasters generally overestimated growth during downturns and underestimated it during upswings.
Do forecasters have anything to learn from this? Could this observation be used systematically to improve forecast accuracy? This issue is complex and depends on many different aspects of forecasting. One aspect concerns the forecast institutes' ability to interpret early economic signals in general, and indications of turning points in the economy in particular.
Another aspect concerns the willingness to revise forecasts. One view sometimes aired in this context is that forecast institutes are too cautious when revising forecasts to take account of new information. One way of illustrating this view is to imagine an alternative approach whereby in each forecast the previous forecast is quite simply revised by a larger margin than is currently the case. If forecasters have on average been overly cautious when revising their projections from one forecast to another, and this explains some of their forecast errors, a systematic increase in the revisions made could result in improved forecast accuracy.
A simple experiment has therefore been carried out to illustrate this discussion whereby each actual forecast revision has been increased by 0.1 and 0.2 percentage points (in the same direction). Where no revision has been made between forecasts, the forecast has not been adjusted. In this context it should be noted that an increase in each revision of 0.1 and 0.2 percentage points is a relatively minor change since the revisions studied averaged 0.8 percentage points. The results of smaller revisions than those actually made were also studied.
The calculations indicate that on average, the forecast accuracy does not increase whether revisions are made larger or smaller than the actual revisions.(21)
- (21)
- The revisions were compared with the first preliminary outcome.
It is also relatively difficult for economic analysts to decide in advance in which direction they should revise their forecasts on the basis of the information available. A review of 423 forecasts from nine domestic forecast institutes shows that economic analysts have revised in the "wrong" direction in 114 out of 329 possible revisions. This means that approximately one in three revisions made in the period 1990-2002 was made in the wrong direction, although the spread is considerable in terms of both time and institutes. It is also clear that the number of revisions in the wrong direction is greatest in years when the economy turns.
It appears therefore that the principal problem is not the actual magnitude of the revisions so much as the ability to interpret new information and decide on both the direction and the magnitude of the revision. In light of the difficulty of interpreting indicators and outcomes, it is therefore not surprising that revisions can appear overly cautious with hindsight.
100
1 Budget Statement
Appendix 1
Sweden's Economy