QuickLinks -- Click here to rapidly navigate through this documentEXHIBIT 99.C
1
The revised
Budget Statement

PROP. 2000/2001:1
1 The revised Budget Statement
1.1 A reform budget
The budget for 2001 is a budget for the future.
The foundation for an active, future oriented policy is a strong economy. Economic policy therefore aims to support and prolong the good economic development of recent years. This involves prioritising growth and social justice while at the same time reducing the burden of debt for future generations.
Children are at the centre of policy. The Swedish school system is to be one of the best in the world. Investing more money in education is a good, sustainable investment in the future. Welfare policy is driving Sweden forward. There is now scope for welfare reforms and tax cuts with our own money, while paying off public debt at the same time. Sweden shall continue to show that growth and social justice can be combined.
A policy for sustainable high growth
The Swedish economy is developing well. Growth is good. Unemployment is decreasing and employment increasing. The target of reducing open employment to 4 per cent has been practically achieved. Public debt is being reduced at a rapid rate. Sweden has a large, increasing surplus in foreign trade. The Swedish economy has not developed so well and in such a balanced way since the 1960s.
The Government now makes the assessment that the resource use that can be achieved without the risk of overheating is greater than was previously thought possible. The good growth is not only a temporary cyclical upturn but an adaptation to a long-term higher resource use.
In order to prolong the upturn and make it sustainable, the Government proposes to increase repayments on public debt and to reduce taxes for those on low and medium incomes. Furthermore, the reforms for growth and social justice that were proposed in the Spring Fiscal Policy Bill will be realised.
The balance struck between debt repayments, expenditure increases and tax reductions will depend on cyclical and distribution policy considerations. Furthermore, the budget targets must be met. The Swedish economy shall continue to grow without tendencies to overheating appearing.
Research, technical leading-edge competence and broad participation contribute to the ability of the Swedish economy to grow at a high rate without imbalances arising. Sweden shall retain its world-leading position in strategically important areas such as information technology, telecommunications and biotechnology. Distributing licences for the new generation of mobile telephones without high fees to those companies that have the best abilities to contribute to this development is a part of this strategy. The Government intends to work for Sweden to retain its leadership also in biotechnology.
A policy for strong public finances
Good social welfare requires strong public finances.
The goal for public finances is that they should generate a surplus of 2 per cent of GDP on average over a business cycle. This target is to be upheld. Thereby, a more stable basis is created for the challenges that come with the great increase in the proportion of elderly people in the next decade.
2
Targets for each year are then set on the basis of the long-term target. In conjunction with the Budget Bill, the Government proposes a target for public finances for the coming year. This target is set on the basis of the contemporary assessment of the state of the economy. In accordance with this, the Government is now proposing that the target for surplus in public finances be increased from 2 to 2.5 per cent of GDP to reduce the risk of overheating.
The expenditure ceilings are to be upheld. A responsible budget policy lays the basis for continued strong economic growth. The expenditure ceilings in relation to GDP will fall until 2002 and stabilise thereafter. Despite this, there is scope for reforms since the expenditure ceilings are increasing in real terms.
A policy for welfare
Universal, publicly financed welfare is required to achieve the goal of a fair society with equality of opportunity.
The reforms that have previously been presented are now being carried out. Resources for education, health care and social services are being increased. Child allowances are being increased and additional resources are being made available for the worst-off pensioners. The first step is being taken in the maximum childcare charge reform. The offensive for growth, equality of opportunity, social justice and full employment is to be accomplished.
However, further steps must be taken to strengthen welfare. In the same way as an additional SEK 9 billion is to be made available to health care in the next few years, a long-term investment in education is now proposed. The vision is a society where all children are treated fairly and get a good start in life.
To make it possible for more children to meet the objectives, additional resources are required, particularly for pupils with special needs. The Government therefore proposes a substantial increase in resources for schools and recreation centres for schoolchildren.
During the coming years, resources for education are to be increased by SEK 1 billion per year. From 2006, an additional SEK 5 billion is to be made available compared with today. More adults in school contribute to creating a better school. The Government is also proposing to reintroduce contact days in the temporary parental benefit next year. This will improve the opportunities for women and men to take an active part in their child's everyday life at school.
The Government is also proposing additional resources in other areas of welfare. In addition to the extra resources previously proposed, the Government is proposing that an additional SEK 100 million be made available for dental care next year. An improvement is also proposed of the special housing supplement for pensioners, which will benefit the worst-off pensioners.
A policy for work
High employment is the foundation for welfare.
In connection with the Spring Fiscal Policy Bill, the Government proposed an offensive for growth and social justice. This offensive is focused on work and is now being carried out with full force.
Measures are taken to further press down unemployment. The target of reducing open unemployment to 4 per in 2000 has practically been achieved.
Measures are taken to increase employment and growth. The goal that at least 80 per cent of the population aged between 20 and 64 shall be in regular employment is to be achieved by 2004.
3
Measures are taken to increase the participation of immigrants in the labour force. It is a waste of resources that people with an immigrant background have higher unemployment and a lower employment ratio than other Swedes.
There is a trend towards an increase in ill health. This is serious from a human as well as an economic perspective. The Government has therefore appointed a working group to produce an action plan to reduce ill health. This work includes a review of sickness benefit, rehabilitation allowance, the supervision of the working environment and disability pension. It is of the greatest importance that working conditions and the work environment do not give rise to ill health and occupational injuries. Preventive work shall therefore be prioritised. Active steps are to be taken to enable those on sick leave and on disability pensions to return to a working life that does not give rise to injuries and illnesses or wear people out.
A policy for growth in the whole of Sweden
The overall design of economic and business policy is very important for ensuring a high sustainable rate of growth throughout the country. During the last few years, the Government has introduced a number of initiatives in the area of business policy aiming to promote growth.
- •
- Proposals are included in the IT bill submitted to the Riksdag to enable support to be provided for expansion of the IT infrastructure.
- •
- A well-functioning infrastructure is of crucial importance for the Swedish business sector to develop well. The Budget Bill gives priority to investments that increase maintenance, the bearing capacity and the reconstruction of roads and railways. Moreover, special funds are being made available for initiatives for flood-damaged roads.
- •
- In order to stimulate the business climate and create good conditions for new establishment of businesses, and to enable existing businesses to expand, work must be continued with respect to supply of capital, simplification of rules, information, service and advice, skills, effective competition and transfer of knowledge.
- •
- The approach in regional policy is to create the prerequisites for sustainable economic growth, social justice and freedom of choice, so that uniform conditions of life are created for citizens throughout Sweden. A regional policy commission is at present working on producing a strategy for regional balance. The Government intends to submit further proposals to the Riksdag when the commission has made its final report.
A policy for fair taxes and a good environment
The strong public finances have made tax cuts possible this year which both stimulate growth and increase social justice. The Government now makes the assessment that there is scope for further tax cuts mainly focused on those on low and medium incomes.
The Government is proposing compensation for a further quarter of the employee contributions paid by wage earners to the pension system. Wage earners will thus be compensated for half of the employee contributions they pay.
4
Table 1.1 Proposals in the Spring Fiscal Policy Bill (SFPB) and the Budget Bill (BB) for 2001
SEK Billion
| | 2001
| | 2002
| | 2003
|
|---|
| Proposals in the SFPB | | | | | | |
| Offensive for growth and social justice | | 1.9 | | 2.2 | | 9.2 |
| Increased social justice and security | | 2.4 | | 3.0 | | 3.4 |
| Children our future | | 0.2 | | 5.4 | | 6.6 |
| An ecologically sustainable Sweden | | 0.6 | | 0.6 | | 2.6 |
| International solidarity | | 0.3 | | 0.3 | | 2.5 |
| Others | | 1.0 | | 0.8 | | 0.8 |
| Less financing | | -1.7 | | -3.4 | | -5.1 |
| | |
| |
| |
|
| Total reforms in SFPB 2000 | | 4.5 | | 8.9 | | 20.0 |
| | |
| |
| |
|
Alcohol preventive measures |
|
0.05 |
|
0.08 |
|
0.10 |
| Dental care | | 0.10 | | | | |
| Guarantee pension | | | | | | 1.00 |
| Contact days r | | 0.06 | | 0.16 | | 0.28 |
| Education | | 0.50 | | 1.50 | | 2.50 |
| Sustainable Sweden | | 0.10 | | 0.12 | | 0.12 |
| Road maintenance | | 0.20 | | | | |
| Other expenditure reforms | | 0.01 | | 0.26 | | 0.53 |
| | |
| |
| |
|
| Total expenditure reforms in BB for 2001 | | 0.97 | | 2.11 | | 4.53 |
| | |
| |
| |
|
1/4 income tax reform |
|
12.50 |
|
13.80 |
|
15.00 |
| Reduced VAT on public transport | | 0.88 | | 0.81 | | 0.81 |
| Increased travel deduction | | 0.00 | | 0.25 | | 0.25 |
| Other | | 0.28 | | 0.29 | | 0.29 |
| Green tax swap | | | | | | |
| | Increased basic deduction | | 2.57 | | 2.80 | | 2.80 |
| | Reduced payroll tax | | 0.47 | | 0.45 | | 0.40 |
| | Increased environmental taxes | | -3.18 | | -2.95 | | -2.84 |
| | |
| |
| |
|
| Total tax cuts in BB for 2001(1) | | 13.52 | | 15.45 | | 16.71 |
| | |
| |
| |
|
- (1)
- Excluding the tax changes proposed to neutralise the effects of increased tax assessment values.
Reporting in the table is made in national accounting terms. This means inter alia that the effects of measures are accrued to the years when payment takes place.
These employee contributions were introduced as a component of the budget consolidation during the 1990s. The improved public finances now make compensation possible. Employee contributions are a heavy burden, particularly for those on low incomes. The Government is also proposing that the threshold for state income tax be increased. Income tax reductions reduce the number of taxpayers who pay state tax to 16 per cent. These measures reduce marginal taxes for those on low and medium incomes and have a positive distribution profile. It is also proposed that the travel deduction be increased to SEK 16 per 10 kilometres. Through these tax cuts, the maximum childcare charge reform, the educational and training initiatives, labour supply can be stimulated.
A green tax swap—increasing tax on environmentally hazardous activities while reducing tax on labour—is part of an ecologically and economically sustainable tax policy.
It is considered that slightly over SEK 3 billion is available for a green tax swap in 2001. The Government is therefore proposing that carbon dioxide tax, diesel tax and electricity tax be increased. These incomes are used to finance a reduction of payroll tax and an increase of the basic deduction by
5
SEK 1,200. The general basic deduction and the special basic deduction for pensioners are both being increased.
A number of other tax changes are proposed in the environmental field. To benefit public transport, it is proposed to halve value-added tax on it. Vehicle tax on older diesel-driven cars is increased while sales tax on motorcycles, light lorries and buses/coaches is abolished. The environmental bonus for windpower is retained.
In recent years, property prices have increased in many places in Sweden. In 2001, there will be a great increase in tax assessment values in the areas where prices have increased the most. If no action is taken, this will lead to an increase in central government revenue of around SEK 10 billion next year.
The Government is now proposing that this tax revenue shall be used to reduce the tax rate on houses from 1.5 to 1.2 per cent and on apartment blocks from 1.2 to 0.7 per cent of the tax assessment value. At the same time, the exempted amount in wealth tax is to be increased for single persons to SEK 1 million and to SEK 1.5 million for jointly taxed couples. In order to avoid persons on low incomes paying too large a proportion of their income in property tax, the Government has initiated work aiming at presenting a proposal on a limitation rule in property tax. The Government is also proposing that tax on sale of private houses be raised from 15 to 20 per cent.
A policy for co-operation
The Government aims to create the greatest possible endorsement for a policy of full employment. The social partners in the labour market have an important role in this context. The Budget Bill is based on an agreement between the Social-Democratic government, the Left Party and the Green Party, which support the guidelines of economic policy, the expenditure ceiling, the supplementary budget for 2000, the appropriations for 2001, and the tax changes now proposed.
This co-operation extends to five areas—the economy, employment, social justice, equality of opportunity and the environment—and includes concrete proposals as well as commitments for the future. This co-operation confirms that there is a political majority for an economic policy directed at full employment, a public budget surplus of 2 per cent of GDP on average over the business cycle, and price stability. The policy pursued also aims at equality of opportunity and ecological sustainability.
1.2 The economic situation
The Swedish economy is developing well due to the increasing domestic demand, increased supply and the good international economic trend. Growth is expected to be 3.9 per cent this year and 3.5 per cent next year.
1.2.1 International economic development
The prospects for the world economy are good. Global growth is expected to be 4.5 per cent this year and 4 per cent next year.
The state of the economy in the EU improves further still and growth is expected to total around 3.5 per cent this year and over 3 per cent next year. Growth is driven by continued strong domestic demand combined with a favourable increase in exports.
The American economy is developing well. The upturn has now continued without interruption since 1992. This year, continued strong domestic demand is expected to contribute to growth in the American economy being as much as 5 per cent. Next year, growth is expected to fall to approximately 3 per cent.
6
The prospects for the Japanese economy are still uncertain. Domestic demand is weak. However, there are certain positive signs, for example in the form of a relatively strong recovery in industrial production. Growth in the Japanese economy is expected to total over 1 per cent this year and just under 1.5 per cent next year.
1.2.2 Swedish economic development
The Swedish economy continues to grow. Between 1997 and 2000, it is estimated that the Swedish economy grew by over 3 per cent per year on average.
The prerequisites for a continued good economic development are favourable. The surpluses in public finances are stable and economic resources are available for increasing welfare, cutting taxes and increasing repayment of the public debt. Despite high growth, price increases are low.
Table 1.2 Demand and output, 1999-2001
| | SEK Billion
| | Percentage change, volume g
|
|---|
| | 1999
| | 2000
| | 2001
|
|---|
| Household consumption expenditure(1) | | 997 | | 3.7 | | 3.4 |
| General government consumption expenditure(1) | | 533 | | 0.6 | | 0.9 |
| Gross fixed capital formation | | 327 | | 5.1 | | 6.8 |
| Stockbuilding(2) | | 6 | | 0.2 | | -0.1 |
| Exports | | 863 | | 9.8 | | 7.7 |
| Imports | | 754 | | 8.8 | | 7.5 |
| GDP | | 1.972 | | 3.9 | | 3.5 |
- (1)
- The statistics for 2000 are affected by the Church of Sweden being included in the household consumption sector from this year. Changes in volume are shown excluding this effect.
- (2)
- Contribution to growth of GDP
Sources: Statistics Sweden and Ministry of Finance
Swedish exports benefit from the rise in the world economy and from the great strength of the Swedish business sector in such areas as telecommunications and information technology. Some capacity restrictions in base industry contribute to the growth of exports being dampened next year compared with this year's very strong increase.
Domestic demand continues to increase strongly. Low inflation and rapidly rising employment leads to a good trend in household income. The tax cuts now proposed strengthen household finances. At the same time, labour supply is stimulated, for instance through reduced marginal effects.
7
Table 1.3 Selected statistics
Annual percentage change unless otherwise stated
| | 1999
| | 2000
| | 2001
|
|---|
| CPI, annual average | | 0.3 | | 1.2 | | 1.4 |
| Hourly wage cost | | 3.4 | | 3.5 | | 3.5 |
| Open unemployment(1) | | 5.6 | | 4.6 | | 3.8 |
| Labour market programme measures(1) | | 3.1 | | 2.6 | | 2.6 |
| Number of employed | | 2.2 | | 2.0 | | 1.3 |
| Real disposable income(2) | | 3.3 | | 3.4 | | 4.2 |
| Household net savings ratio, level(2) | | 2.1 | | 2.2 | | 2.9 |
| Current account balance(3) | | 2.5 | | 2.6 | | 3.6 |
| German 10-year government bond yield(4) | | 4.5 | | 5.3 | | 5.3 |
| Swedish 10-year government bond yield(4) | | 5.0 | | 5.4 | | 5.4 |
| TCW index(4) | | 125 | | 123 | | 122 |
- (1)
- Per cent of labour force, annual average.
- (2)
- The statistics for 2000 are affected by the Church of Sweden being included in the household consumption sector from this year. Changes are shown excluding this effect. The savings ratio includes saving in group pensions.
- (3)
- Per cent of GDP
- (4)
- Annual average
Sources: Statistics Sweden, National Labour Market Board, Riksbank and Ministry of Finance
Investment activity is expected to increase again. Housing construction can accelerate even though supply restrictions dampen this rise. The strong industrial upswing entails a strong need to expand production capacity. The volume of investment in other parts of the business sector is expected to increase more slowly than previously.
Inflation is still low. The rate of price increases only totalled approximately 1.2 per cent in July this year. These price increases are largely due to increased prices for oil products. However, the strong demand is expected to entail some increase in underlying inflation next year. The rate of inflation measured as CPI is expected to total 1.7 per cent towards the end of next year.
Altogether, growth is expected to continue to be good during the next few years while inflation is expected to remain low. Unused resources are so great in the initial situation that GDP can increase by 3.9 per cent this year and 3.5 per cent next year without any significant shortage situations arising.
Employment and unemployment
The Swedish labour market is developing well although problems remain. In 1996, the Government and Riksdag set the target that open unemployment was to be halved from the then 8 per cent to 4 per cent in 2000. This target has now practically been achieved. In May 2000, open unemployment was 4.1 per cent and 3.8 per cent for women.
Open unemployment is expected to be around 4 per cent at the end of the year. Measured as an annual average, open unemployment is expected to be 4.6 per cent this year and 3.8 per cent next year.
The goal ahead is full employment. As a step towards this goal, the Government set the target in 1998 that the proportion of the population aged between 20 and 64 in regular employment should increase from 75 to 80 per cent by 2004. This target is also within reach. Employment is increasing practically throughout the country, although large regional imbalances remain. Most new jobs are in the private services sector.
8
A number of observations indicates that employment will continue to increase during the year. The number of notified vacancies increased sharply at the beginning of the year. Employment is expected to increase by around 134,000 persons between 1999 and 2001. This increase is taking place almost exclusively in the private sector. The regular employment ratio for persons aged between 20 and 64 is expected to rise to 77.7 per cent next year.
Despite the rapidly falling unemployment, unused resources are still available in the labour market. No general shortage situations are expected to arise this year or next year. However, there are indications of shortage situations regionally and in certain sectors.
Energetic action is taken to increase labour supply. The maximum charge reform will lead to reduced marginal effects for families with children. Compensation for part of the individual pension contributions and adjustments of the threshold to reduce the proportion paying state tax reduces marginal tax for those on low and medium incomes.
The system of employment support and the recently introduced activity guarantee aim at increasing the employment ratio for those groups that still have a weak foothold in the labour market. Older persons, those with functional disabilities and citizens from outside the Nordic area are prioritised groups.
The overall goal for the Government's working group in the area of ill health is to give people the prerequisites to remain in or return to work according to their ability. Active measures are to be introduced to enable those on sick leave and disability pensions to be able to return to working life full or part time.
The Government intends to introduce a system for individual increase in skills in working life to reinforce the position of the employee in a more and more demanding and changing labour market. Major investments are made in education and training and the provision of skills. The increase in study places and universities and other institutions of higher education will dampen the increase in labour supply somewhat for a time. However, in a longer period, the increased investment in education will have positive effects for labour supply as the number of well-educated people will increase. This will then improve the prospects for a return to full employment in Sweden.
Table 1.4 Employment, unemployment and wage formation
| | 1994
| | 1995
| | 1996
| | 1997
| | 1998
| | 1999
| | 2000
| | 2001
|
|---|
| No. of employed(1) | | 3 927 | | 3 986 | | 3 963 | | 3 922 | | 3 979 | | 4 068 | | 4 149 | | 4 202 |
| | Private sector(1) | | 2 633 | | 2 697 | | 2 698 | | 2 695 | | 2 735 | | 2 805 | | 2 886 | | 2 929 |
| | Public sector(1) | | 1 290 | | 1 287 | | 1 263 | | 1 223 | | 1 241 | | 1 260 | | 1 260 | | 1 270 |
| Proportion of employed aged between 20 and 64(2) | | 74.2 | | 74.8 | | 74.7 | | 73.9 | | 74.6 | | 75.9 | | 77.0 | | 77.7 |
| Open unemployment(3) | | 8.0 | | 7.7 | | 8.1 | | 8.0 | | 6.5 | | 5.6 | | 4.6 | | 3.8 |
| Labour market programmes(3) | | 5.3 | | 4.4 | | 4.5 | | 4.3 | | 3.9 | | 3.1 | | 2.6 | | 2.6 |
| Hourly wage cost(4) | | 2.4 | | 3.3 | | 6.0 | | 4.5 | | 3.8 | | 3.4 | | 3.5 | | 3.5 |
| Development of productivity in business sector(4) | | 3.8 | | 2.5 | | 1.3 | | 3.3 | | 1.4 | | 1.2 | | 2.2 | | 2.5 |
- (1)
- Thousands of persons
- (2)
- Those in regular employment as a percentage of the population aged between 20 and 64
- (3)
- As a percentage of the labour force
- (4)
- Annual percentage change
Sources: Statistics Sweden, National Labour Market Board and Ministry of Finance
9
1.2.3 Scenarios up to 2002 and 2003
After a long period of good growth, the gap between actual and potential GDP is expected to close at the end of 2001. This means that growth will subsequently be determined by the possibilities of further increasing the use of resources without inflation accelerating.
No forecast has been made for the period after 2001. Instead, an estimate has been made on the basis of certain assumptions. It is assumed that GDP will increase at the same rate as increased productivity and the increase in labour supply, which together is expected to make possible growth of over 2 per cent each year. However, there are indications that the long-term sustainable growth can be one or a few tenths of a percentage point higher than that.
The labour market and wage formation have to date functioned better than many thought possible. Total wage increases including wage drift are expected to be 3.5 per cent per year also after 2001. It is important that wage increases are moderate in order for the trend on the labour market to continue favourable in the next few years.
1.3 Economic policy
The premise for economic policy is that sound public finances, stable prices and a well-functioning wage formation constitute the foundations for high sustainable growth and employment.
1.3.1 Sound public finances
Fiscal and budget policy are controlled by two overriding goals: Public finances shall generate an average surplus of 2 per cent of GDP over a business cycle and expenditure shall not exceed the set expenditure ceilings.
There are a number of reasons why both these goals are of central importance for economic policy:
- •
- Good welfare requires strong public finances. The proportion of elderly people will increase greatly in future. This will mean increased expenditure on pensions and health and social services as well as reduced revenue as the proportion of people of working age will fall.
- •
- There must be a safety margin in public finances so that the next downturn can be counteracted by an active fiscal policy. Excessively high deficits could lead to a large increase in interest rates in a recession as well.
- •
- Saving in Sweden must be high to be able to reduce Sweden's international indebtedness at the same time as the level of investment is high. The public sector must also contribute to this.
- •
- The expenditure ceilings prevent temporary increases in income being used to pay for permanently increased expenditure. In this way, painful savings are avoided when the economic situation deteriorates.
- •
- Sweden has undertaken in the EU Stability and Growth Pact to have a medium-term goal that public finances should be in balance or surplus.
The surplus target for 2001
Detailed targets are set each year on the basis of the long-term goal for public finances of a surplus of 2 per cent of GDP on average over a business cycle. In conjunction with the Budget Bill, the Government is proposing a target for the coming year. The target is set on the basis of the contemporary assessment of the state of the economy. The premise is that a 2 per cent surplus can be achieved when use of resources in the Swedish economy is at a level which it is possible to achieve without inflation accelerating, i.e. the long-term sustainable use of resources.
10
In last year's Budget Bill, it was established that the surplus target for public finances for the current year should be 2 per cent since it was then expected that that the long-term sustainable use of resources would be achieved this year. The Government further maintained that if the growth was to significantly depart from the estimated growth for cyclical reasons, the corresponding discrepancy would be tolerated in the surplus target. This year, it is estimated that public finances will have a surplus of 3.4 per cent of GDP, i.e. clearly over target.
The Government now makes the assessment that the use of resources in the economy can increase more than what was previously assumed to be possible without inflation accelerating. The gap between actual and potential GDP is now assumed to be closed by the end of 2001. This is a very positive development. There is thus scope for growth over the long-term sustainable level this year and next year without inflation accelerating.
There are a number of reasons for this assessment. Since the mid-1990s, the Swedish economy has undergone major changes. Budget consolidation, low inflation policy, increased competition and the investments in education, training and entrepreneurship are some explanations why the Swedish economy is developing better than expected. Another important explanation is the focus of labour market policy on activity and skills.
If fiscal policy was to be focused on achieving a surplus of 2 per cent of GDP in 2001 by proposals for large tax cuts and expenditure increases, this would entail a marked risk for overheating in the present situation. Historical experience clearly indicates that overheating brings great human and economic strains.
The Government is therefore proposing that the target for surplus in public finances in 2001 be increased from 2 to 2.5 per cent of GDP in order to reduce the risk of overheating. In this way, public debt can be decreased. If growth significantly diverges from estimated growth for cyclical reasons, the equivalent discrepancy in the surplus target shall be tolerated, however.
Even after this increase, it is estimated that the surplus in public finances will exceed the goal now set, given the assessment of economic development that can now be made. This increasing surplus, which, among other things is due to extraordinary revenue, shall be regarded as a safety margin and will not be used for reforms. The experiences of the 1990s clearly show the importance of achieving the set targets. Confidence takes an extremely long time to build up, although it can be lost in a very short time.
Despite the increase in the surplus target and the safety margin, resources are available to increase expenditure and reduce taxes without this being accompanied by a substantial increase in the risk of overheating. Moreover, public debt falls strongly which will strengthen Sweden in the long term.
In the Spring Fiscal Policy Bill, the Government proposed a number of reforms but no tax cuts. The Government is now carrying out these reforms but is also proposing tax cuts of around SEK 13 billion next year. Furthermore, it is proposed that the freezing of tax assessment values on houses and apartment blocks be ended so that the connection between tax assessment values and market values is restored. In order to avoid tax revenue increasing as a result of the increase in tax assessment values, a reduction in tax rates for houses and apartment blocks and an adjustment of the exempted amount in wealth tax are proposed.
As a result of the Government's proposal, fiscal policy will be expansive next year. This shall be viewed in the light of there then being unused resources in the Swedish economy. However, fiscal policy will be considerably less expansive than if the whole additional margin over the previous target for the surplus in public finances of 2 per cent had been used.
11
Tabell 1.5 Public Finances
Per cent of GDP
| | 1994
| | 1995
| | 1996
| | 1997
| | 1998
| | 1999
| | 2000
| | 2001
|
|---|
| Expenditure ratio | | 67.3 | | 64.6 | | 62.6 | | 61.1 | | 58.7 | | 58.4 | | 55.5 | | 53.7 |
| Income ratio | | 56.4 | | 56.7 | | 59.3 | | 59.1 | | 60.6 | | 60.2 | | 58.9 | | 57.2 |
| Tax ratio(1) | | 47.3 | | 48.3 | | 51.3 | | 52.0 | | 53.4 | | 53.5 | | 52.6 | | 51.5 |
| Financial savings | | -10.8 | | -7.9 | | -3.4 | | -2.0 | | 1.9 | | 1.9 | | 3.4 | | 3.5 |
| Surplus target | | -3.0 | | 0.0 | | 0.5 | | 2.0 | | 2.5 | | 0.5 | | 2.0 | | 2.5 |
| Net debt | | 21.0 | | 22.7 | | 19.4 | | 18.2 | | 15.8 | | 11.4 | | 0.5 | | -3.7 |
| Consolidated gross debt(2) | | 77.4 | | 76.3 | | 76.0 | | 74.9 | | 72.4 | | 65.6 | | 58.9 | | 53.2 |
- (1)
- Including taxes to the EU.
- (2)
- Measured according to the Maastricht rules.
Sources: Statistics Sweden and Ministry of Finance
Surpluses after 2001
It is assumed that the annual surpluses in public finances will be 2 per cent of GDP in the years after 2001. If no decisions are made on tax cuts or expenditure increases, the surpluses would be considerably larger than this, however. The additional surpluses have therefore been transferred to households for technical accounting purposes. Given the assessment of consumption that has been made, household savings will then increase. Although a development of this kind is not unreasonable, the change in the savings ratio shall in the first place be viewed as a technical consequence of other assumptions.
The consequences of the surpluses for public debt are great. The consolidated gross debt measured according to the Maastricht criteria, is now under 60 per cent of GDP. Net debt is expected to be removed next year.
Reduced debt is a very desirable development. The Long-Term Planning Commission report (SOU 2000:7) shows that the social welfare system will be under considerable pressure as the proportion of elderly in the population increases greatly from around 2008. The number of people of active working age will fall at the same time as a greater number are to be provided for through pensions, etc. At the same time, demand for health care and social services can be expected to increase. A smaller working population is to provide for an increasing number of elderly.
In order to cope with the strains on the economy and public finances ensuing from a great increase in the proportion of elderly in the population after 2008, surpluses in public finances are required for a number of years to come. This is an important reason to maintain the target of a 2 per cent surplus on average over a business cycle.
The expenditure ceilings
Since consolidation of the public finances was started in 1994, the central government budget has improved at a rapid rate. A contributory reason for this success has been the reform of the budget procedure which was carried out at the end of the 1990s.
In the new budget procedure, the Government proposes a ceiling for central government expenditure in the Spring Fiscal Policy Bill. This ceiling must not be exceeded. The expenditure ceilings are set in advance for three years at a time and expenditures have been within the ceiling every year since the ceilings were introduced in 1997. The system with expenditure ceilings has worked well.
12
However, for the current year there is some risk that the expenditure ceiling will be exceeded if no action is taken. The Government is therefore proposing certain measures to limit expenditure. The Government's assessment is that after these measures, expenditure will be under the ceiling with a budgeting margin of approximately SEK 0.6 billion. The Government will monitor events carefully and will take action if it is shown to be necessary. The expenditure ceiling shall be maintained.
In accordance with previous decisions, the expenditure ceiling is increased with SEK 25 billion between 2000 and 2001. This increase will be used inter alia for additional resources for education, health care and social services, increased child allowance, increased resources to the worst-off pensioners and substantial investment in the judicial system. Furthermore, the good development of the economy makes it possible to reduce taxes by approximately SEK 13 billion in relation to this year. Welfare is increasing at the same time as taxes are being reduced.
Next year expenditure is also expected to be close to the expenditure ceiling. A considerable problem is the rise in expenditure for increased ill health. The increase in costs reflects an unacceptable increase in ill health in working life. The Government has appointed a working group to work out a plan of action for the entire ill health area.
The new budget procedure has on the whole worked well and has improved the conditions for responsible economic policy. However, there are some problems. A number of measures have been proposed in the evaluation of the budget procedure (SOU 2000:61). Moreover, a review is taking place in the Riksdag. The Government intends to come back to the question of possible improvements of the budget procedure at a later date.
The basis for the Government's continued development of the budget procedure is that the principles on budget discipline in public finances must not be weakened in relation to the principles that apply now.
1.3.2 Stable prices
Stable prices are a fundamental prerequisite for a successful economic policy. High inflation creates poorer conditions for sustainable high growth and thus also for stable high employment. A high, difficult-to-predict inflation has moreover negative distribution effects.
The Riksbank is carrying out monetary policy independently. The overall task for monetary policy is price stability. The Riksbank has defined price stability so that the increase in the consumer price index is to be limited to 2 per cent with a tolerance of 1 percentage point in each direction.
The Government supports the direction of monetary policy and stands behind the inflation target.
Inflation continues to be at a low despite the high level of demand in the Swedish economy. This year CPI is expected to increase by 1.1 per cent. Next year, CPI is expected to increase by 1.7 per cent.
The Riksbank has clarified that at present it is the assessment of UND1X over a one to two-year horizon that determines the conduct of monetary policy. UND1X is a measure of inflation where the direct effects of changed interest rates, taxes, and subsidies have been excluded from CPI. This year, UND1X is estimated to increase by 1.1 per cent. Next year, UND1X is expected to increase by 1.3 per cent.
13
The interest rate
In 1999, international interest rates increased by approximately 2 per cent due to the increasingly strong global growth. Since the year-end, a stabilisation has taken place and 10-year interest rates have fallen in the range of 0.5 percentage points.
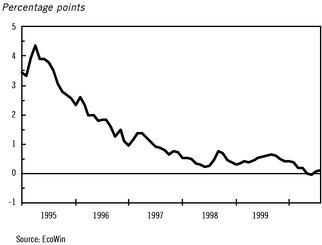
Despite the international increase in interest rates, the Swedish bond yields have risen rather less than the German. The interest gap in relation to Germany which was over 4 percentage points five years ago, has practically disappeared. Consolidation of public finances and confidence in price stability policy has laid the basis for this development.
During May and June, the ten-year Swedish bond yield was even lower than the German. The long interest rate in Sweden was hardly a tenth of a percentage point over the German in September 2000.
Diagram 1.1 Yield differential with Germany, ten-year treasury bonds
During the past year, Swedish monetary policy has been shifted in a less expansive direction in the light of the strong growth and a gradual increase in resource use. Despite strong demand, inflation has continued to be low and inflation expectations have been in line with the inflation target.
Confidence in public finances, the price stability target, increased competition and lower inflation tendencies have created the prerequisites for favourable inflation prospects. The Riksbank has increased the instrumental rate from a minimum of 2.90 to 3.75 per cent. Despite these increases, the Swedish instrumental rate is lower than the ECB instrumental rate.
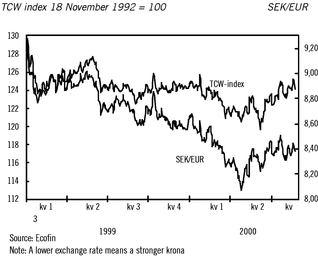
The krona
Since early 1999, the krona has been relatively stable in relation to an average of currencies. The trend has been for the krona to appreciate against the euro and it is now quoted at approximately SEK 8.40 per euro. This appreciation in relation to the euro has mainly been balanced by a weakening in relation to the dollar. The strengthening of the krona during the spring can partly be due to direct investments and purchase of Swedish shares.
14
Diagram 1.2 The exchange rate of the krona in relation to the euro and a weighted average of currencies
EMU
The introduction of the EU's single currency, the euro, is a historical and important step in European integration. The monetary union affects Sweden to a great extent, both economically and politically, also when we, as hitherto, stand outside. Banknotes and coins in euro will be introduced in the monetary union on 1 January 2002. During its presidency of the EU, Sweden will, if necessary, contribute to an efficient introduction. It is important for the growth and stability of the whole EU that the monetary union is a success.
Sweden decided not to participate in the monetary union from the outset. However, Sweden is keeping the door open for participation at a later date. A decision on participation must have broad public support and shall be submitted to the Swedish people for consideration in a referendum.
A commission will be appointed on the prerequisites for fiscal policy in the event of Swedish participation in the monetary union. This commission will also analyse the need for "buffer funds" to increase the possibilities of stabilisation policy.
The Government's view is that it is not at present of immediate interest to take part in the European exchange rate co-operation ERM2.
1.3.3 Wage formation
A well functioning wage formation is of crucial importance for a continued good employment development with the aim full employment. Nominal wage increases must remain moderate even though labour demand continues to increase and open unemployment falls rapidly. If pay increases are too high, there is a risk that unemployment will rise again. The objective is to combine low inflation and good real wage increases with a strong increase in employment.
Swedish wage formation is facing an important test in 2001. For the first time after the deep economic crisis in the 1990s, new wages are to be set for almost the entire labour market in a situation of falling unemployment and rising labour demand in combination with low inflation and dampened pay increases in the surrounding world.
15
The prerequisites for the social partners to be able to deal with the challenge confronting them are favourable in many respects:
- •
- A stable, strong confidence in price stability has been established. No wage earner need risk that the pay increases that have been negotiated will be undermined by uncontrolled inflation.
- •
- In recent years, wage earners have experienced that moderate nominal pay increases can contribute to good, stable development of real wages.
- •
- Employers have become increasingly aware of the limitations that exist as regards passing on costs to consumers.
- •
- Employment has increased and some scope has been created for cutting taxes. The situation has improved markedly for many wage earners during the most recent contract period as a result of the good employment trend.
The Government is now proposing further tax cuts. If the pay bargaining leads to excessively high pay increases, there is a risk that Sweden will end up in an overheating situation. The economic room for further tax cuts in coming years would then disappear. In this situation, there might even be grounds for reviewing fiscal policy.
However, inflation is still low and total pay increases are moderate. Assessments of the future are also favourable. The awareness of the links between employment, productivity growth, and the real wage trends has increased. A continued good employment trend is conditional on the scope for real wage increases created by the long-term productivity development in the economy not being exceeded.
Considerable changes of the institutional frameworks of wage formation have been carried out. Co-operation agreements have been signed in a number of sectors where the parties have reached agreement on, for instance, new bargaining rules. A new mediation institution has been set up with the task of supporting the parties in their endeavour to combine stable real wage development with a continued rapid, sustainable increase in employment. Certain changes have also been introduced in the legal framework within which negotiations are carried out.
Labour market policy has been focused to an increasing extent on reducing the risk for bottlenecks in the labour market and substantial investment in education and training has taken place with a view to increasing the supply of highly qualified labour.
In the present economic situation, the upward pressure on wages for the groups in the labour market that are most in demand and in the fastest growing regions can nevertheless be high. The social partners must be able to deal with the problems that this can entail.
Wage formation has a great influence on many areas. The social partners have a special responsibility for counteracting pay differences due to sex. This is one of the most important issues in equal opportunities policy. The Government has therefore proposed that the equal opportunities act be made more stringent.
Working hours
The starting point for the Government's work on the issue of working hours is that it is important to shorten working hours and to increase the influence of the individual over the allocation of working hours. A reduction in working hours can take place by agreement as well as by legislation. Legislation is required if everybody is to benefit from a reduction in working hours. The Government intends to reduce working hours within the framework of changed legislation.
The working hours issue includes important welfare policy choices. A reduction in working hours is discussed in public debate as a means of reducing the risk of burn-out and providing scope for a life
16
which is not only centred on work. After a number of years with increasing average working hours per employee, many want to increase the time available for life outside of working life.
The value of a reduction in working hours must always, however, be weighed against the need for other reforms and costs must be taken into consideration. If we reduce working hours, we are taking part of future growth in the form of more leisure instead of increased private and public consumption. The long-term consequences of a reduction in working hours for the public sector activities must be particularly taken into account.
The Government Offices' working group for working hours issues has had the task of assessing the prerequisites for and consequences of different changes in working hours. These analyses have referred both to economic aspects and welfare effects. The report "Shorter working hours—for and against" has been circulated for comment. The responses are at present being studied in the Government Offices. The Swedish Trade Union Confederation and the Confederation of Professional Employees have also recently presented proposals on working hours reforms.
A reform of working hours is important. The Government, the Left Party and the Green Party note, however, that the rate, the extent and the approach to a reform of working hours require further consideration.
Work environment
In order to meet the problems in today's working life, a work environment policy is required that allows different solutions adapted to individual preferences and operational requirements and which benefits both employees and employers. The interaction between the employer and the employee in the arrangement and organisation of work is key for the productive work environment and good work.
The Government's work environment policy is to promote good growth and secure welfare. The Government is therefore proposing that the appropriation to the National Board of Occupational Safety and Health be increased by SEK 70 million, SEK 20 million of which was set aside already in the Spring Fiscal Policy Bill. At the same time, legislative work is in process that aims to improve supervision. In this way, work environment work can be improved, in particular with regard to method development and in relation to the most exposed work places.
1.4 Reforms for full employment
Sweden shall be a country with full employment, high growth and good welfare. The basis for this is healthy public finances and stable prices. On this basis, an offensive for full employment is being carried out at the same time as considerable investments are being made in the field of education. Education and training, development and competence shall characterise the whole of Sweden.
An offensive for full employment
The total work input in Sweden, i.e. the total number of hours worked, is of crucial importance for making possible good welfare. A high supply of labour is important for future growth and for opportunities to finance the welfare system when the proportion of elderly persons increases.
In its report (SOU 2000:7), the Long-term Planning Commission underlined the importance of taking steps already today so that Sweden will be well-prepared to meet the future. The policy focused on sustainable growth, increased employment and sound public finances which the Government has conducted since 1994 is well in accord with what is required to meet the challenges that the Long-term Planning Commission drew to attention.
17
In the Spring Fiscal Policy Bill, the Government presented an offensive for growth and social justice. The objective is full employment. Now this offensive is being made a reality:
Unemployment is to be pushed down. Sweden shall again show that it is possible to combine low inflation and low unemployment with social justice and equal conditions of life. A broad programme of measures is being carried out to press unemployment down to 4 per cent in 2000. Among other things this programme includes:
- •
- that the labour market programmes is focused on the long-term unemployed to a greater extent than to date,
- •
- that the requirement for activity in unemployment insurance be clarified,
- •
- that a generous employment support be introduced for employers that employ people who have been unemployed for a long time.
Employment and labour supply shall increase. The most important way for counteracting the risk that people are excluded from the labour market is measures to increase employment. Work has an intrinsic value, it confers self-esteem and makes it possible to earn a livelihood. Moreover, it is very important that each individual's ability to work is made use of for labour supply to increase and for making it possible to retain a good welfare. The programme entails for instance:
- •
- that active measures are carried out to enable those on sick leave and disability pensions to return to working life,
- •
- that the Special Adult Education Initiative is prolonged to increase the supply of trained labour,
- •
- that a maximum childcare charge is introduced to reduce the marginal effects and thus promote work and education.
The opportunities for taking part in working life are to be increased for all. People with an immigrant background have considerable higher unemployment and lower employment than other Swedes. This must be changed. Everyone is needed in the labour market. The programme entails for instance:
- •
- that the opportunities for people with foreign education to complement their education are strengthened,
- •
- that measures to stimulate ethnic/cultural diversity in public administration and private companies are introduced,
- •
- that resources are made available for advisory initiatives for immigrants starting or running small businesses.
Knowledge, education and training
Sweden is to be in the forefront as a knowledge nation. Our future competitiveness will be determined by the breadth of our skills and leading edge competence. Sweden is to be a country characterised by entrepreneurship and innovation. New technology, new knowledge and new ideas are essential driving forces for the development of society.
Knowledge and a well-educated population constitute an important part of the Government's policy for growth and social justice. Internationally prominent education and lifelong learning for all—from pre-school to higher education and in working life—are an effective tool for equality and development.
18
The strengthening of the educational task of the pre-school underlines its task in lifelong learning. Universal pre-school for four and five-year-olds, a maximum childcare charge and expanded right to pre-school for the children of unemployed and those on parental leave give more access to pre-school.
The Swedish school achieves good results in international comparisons. At the same time, schools are faced by considerable difficulties and challenges. The new grade system makes clearer demands. More than every tenth pupil who leaves compulsory school is not eligible for upper secondary school. This is not acceptable. All pupils must obtain good basic knowledge, learn to read, write and count.
Far more pupils must achieve the goals at upper secondary school. Growth and new resources provide municipalities with greatly increased resources, creating good opportunities for investment in schools. Moreover, considerable investments are taking place in developing teachers' skills. The guaranteed tuition time is being expanded on all upper secondary school programmes from next year. The Government also intends to improve the follow-up of results in school.
The Government is therefore proposing greatly increased resources to schools in the coming years. During the period 2001 to 2006, SEK 17.5 billion is to be made available to education, SEK 0.5 billion of it from next year. Thereafter an additional SEK 1 billion will be allocated each year until the level of SEK 5 billion is reached.
Table 1.6 Funds for education
SEK Billion
2001
| | 2002
| | 2003
| | 2004
| | 2005
| | 2006
|
|---|
| 0.5 | | 1.5 | | 2.5 | | 3.5 | | 4.5 | | 5.0 |
The Government is also proposing that the "contact days" in temporary parental benefit be restored next year.
The expansion of higher education is continuing. The long-term goal is for 50 per cent of a year cohort to have started higher education by 25 years of age. The number of places increases with approximately 100.000 between 1997 and 2003. This expansion has been focused on natural sciences and technology but it is now being extended to other areas.
The study support system is being reformed and the study grant portion of study allowance increased. The grant portion will be 34.5 per cent of study support from the second half of 2001. Moreover, the permitted amount of independent earnings will be increased and study allowance will confer pension rights.
Altogether, Sweden uses almost 4 per cent of GDP for research and development (R&D). This is more than any other country in the world. The state has a particular responsibility for guaranteeing the freedom of research and supporting vital basic research and doctoral studies. The central government appropriation for basic research and post-graduate education is increasing by almost SEK 1.3 billion during the period 2000 to 2003. Postgraduate education is of strategic importance since the need for trained researchers is increasing both in higher education and the rest of society.
1.5 Reforms for increased welfare
Substantial resources are being invested in key areas of welfare in the next few years. Universal welfare is the foundation of the Government's endeavour for development and equality. The financial situation of families with children is being strengthened. The resources available for health care, education and social services are increased. In addition to this, a number of measures are proposed to increase social justice and security in Sweden.
19
Children
Sweden is to be a country where all children and young people have a good upbringing. During the next few years, considerable investments are being made for families with children. Altogether, the additional resources to families with children already announced by the Government will total approximately SEK 9 billion by 2003. An additional SEK 6 billion is being made available for the reform of study support.
Child allowances and study grants are being increased as from 1 January 2001 by an additional SEK 100 a month. Child allowance and study grant will then be SEK 950 per child and month. The supplement for large families is being correspondingly increased.
A broad family policy reform is being introduced in stages. Children of the unemployed will be given the right to pre-school activity as from 1 July 2001. A maximum childcare charge will be introduced in 2002 and funds made available to municipalities for quality assurance of this activity. The maximum charge will be 3 per cent of income, at most SEK 1,140 per month to have a child at a day-care centre.
Parental insurance will be extended by a month in 2002. Two months will be reserved for the mother and father respectively within the framework of the extended parental insurance. This will mean the introduction of an additional "father's" and "mother's" month in parental insurance. A right to childcare is also being introduced for children of parents who are unemployed and parents who are on parental leave with younger siblings. Universal pre-school for four-year-olds and five-year-olds will be introduced in 2003.
Table 1.7 Family policy reforms
SEK Million
| | 2001
| | 2002
| | 2003
|
|---|
| Maximum childcare charge, etc. | | 150 | | 4 400 | | 5 600 |
| Study allowance (including pensions) | | 2.100 | | 5.600 | | 6.200 |
| Mother's/Father's month | | | | 1 000 | | 1 000 |
| Increase in child allowance (including study grant in study assistance) | | 2.500 | | 2.500 | | 2.500 |
| Contact days | | 60 | | 160 | | 280 |
| | |
| |
| |
|
| Total reforms | | 4.810 | | 12.660 | | 15.580 |
| | |
| |
| |
|
Good welfare
Sweden shall be a country with equality and equality of opportunity. Every person must have the opportunity to make use of his or her ability and willingness to participate. All discrimination shall therefore be combated. Similar opportunities shall apply to all regardless of sex, ethnic or cultural background.
A policy for social justice is based on education, work and universal welfare. If everyone has access to a good education, there will be an even distribution of knowledge. Needs—not financial circumstances—shall determine health care and social services. This evens out the conditions of life between healthy and sick persons or those with functional disabilities.
As a consequence of this, the Government has consistently given priority to health care, education and social services since 1994. Firstly, through the orientation of the consolidation programme and subsequently by making resources available to municipalities and county councils as the economy improved. The good growth will also entail substantial revenue increases for the local government sector in the next few years.
20
A well-functioning school, health care and social services are a prerequisite for the welfare society. Large parts of local government activity form the foundation for social justice and lay the basis for sustainable growth. This year, an additional SEK 21.3 billion in central government grants is being made available to health care, education and social services compared with 1996. Next year, the Government proposes that these investments be increased to SEK 25.3 billion.
Good growth and increased employment will lead to substantial increases in tax revenues in the next few years. This year, the tax revenue of the local government sector will be approximately SEK 46 billion higher than in 1996 and by 2003 it is expected to have increased by a further SEK 35 billion. The additional resources enable the local government activities to be safeguarded and reinforced.
In addition to general resources in the form of taxes and general central government grants, further resources are made available to municipalities and county councils in a number of areas.
- •
- A total of SEK 9 billion is invested in health care and social services during 2001-2004 primarily by funds released through the defence review. These investments aim at developing primary care, health care for the elderly and psychiatry.
- •
- SEK 0.5 billion is set aside for municipalities that introduce the maximum childcare charge for quality assurance of activities.
- •
- A deficit has arisen in the local government value-added tax system which is estimated to be at most SEK 4.3 billion at the end of the year. Since the Government on a number of occasions has underlined the importance of prioritising health care, education and social services while at the same time requiring the municipalities to run balanced budgets, it is proposed that this deficit shall be written down. The Government will also appoint a working group to review the system as a whole, including its redistributive effects. The Government intends to submit further proposals to the Riksdag at a later date.
Although the local government sector as a whole is now beginning to have strong finances, there is a number of municipalities and county councils that are lagging behind due to decreasing population, imbalances in the age structure, continued high unemployment, and low growth. These are external structural factors that the individual municipality is to a great extent unable to influence and which can only partly be compensated for by the equalisation system. Special initiatives can therefore be required for these municipalities and county councils.
The Government therefore set up a commission to prepare matters concerning temporary financial support to certain municipalities and county councils. The purpose of this support is to make it easier for these municipalities and county councils to carry out reconstruction and long-term sustainable measures to achieve balanced budgets. The responsibility for implementation of the measures required rests on the individual municipality or county council. The commission completed its work in July and proposed that support should be made available to 36 municipalities and 3 county councils. The Government intends to make a decision on the report during the autumn.
A major problem for the local government sector is the difficulty of following up activity. The Government has therefore taken an initiative to a development project concerning follow-up work in municipalities and county councils. An initial interim report has been presented, proposing the development of a municipal database. The database is intended to make it possible for municipalities and county councils to learn from one another and to improve the national follow-up.
The Government considers that it is important to improve follow-up by local government as well as by central government of the sector as a whole on the basis of national targets for different activities. The Government will therefore prioritise the work with the database and its follow up.
21
Security and solidarity
Sweden shall be a country where citizens feel security and participation in change. Universal welfare is to be developed and strengthened. The Government therefore proposed in the Spring Fiscal Policy Bill a number of proposals aiming at increased social justice and security.
The financial situation of the worst-off pensioners must be improved. The Government's proposal to increase the housing supplement and to make permanent the temporary increase of pension supplement is now being implemented. Moreover, a further improvement is proposed of the special housing supplement for pensioners, which will benefit the worst-off pensioners.
The Government is also proposing additional resources in other areas of welfare. In addition to the previously announced additional resources of SEK 200 million for 2002 and SEK 300 million for 2003, the Government is now proposing that a further SEK 100 million be made available to dental care. An action plan for disability policy has been adopted by the Riksdag.
Sweden shall be a country where criminality is low. The reasons for crime must be rectified at the same time as criminality is combated energetically. There has therefore been a substantial increase in resources to the judicial system. Additional resources have also been made available to the tax and customs system.
The Government aims for Sweden to again achieve the one per cent target for development assistance when central government finances so permit. As previously decided, development assistance will increase from SEK 12.5 billion in 2000 to SEK 14.1 billion in 2001.
For 2003, 0.81 per cent of GNP will be allocated to development assistance. A step will thereby be taken towards achieving the one per cent target.
1.6 Reforms for fair taxes
The primary purpose of taxes is to finance common expenses. Strong public finances are a fundamental condition for sustainable welfare. In addition, the tax system shall reduce gaps and stimulate work, investments, and a sustainable development. The distribution policy objective is important. The Government can never accept that the sacrifices made by the wage earners during the difficult years now should come to benefit the affluent through tax reliefs.
Reduced taxes for wage earners
The surpluses that now exist in public finances are a result of the responsible, deliberate policy that aimed to save the welfare society. Resources are now available to increase public expenditure and to reduce taxes at the same time as public debt can be paid off at an increased rate.
In the same way that the most vulnerable groups have been compensated for a number of the measures that were introduced to consolidate the public finances, for instance through the increase in compensation levels to 80 per cent and increased pensions and child allowances, resources are now available to compensate for the tax increases that affected wage earners, primarily those on low and medium incomes.
As a result of the budget consolidation, the proportion paying state tax has increased and employee contributions are now payable by all wage earners. A year ago the Government presented a strategy for an income tax reform. This reform consists of two parts. The first part consists of compensation for employee contributions. The second part consists of increasing the lower threshold in the tax table so that only 15 per cent of taxpayers pay state tax.
On 1 January 2000, the first step towards realising this reform was taken. A quarter of the employee contributions were compensated for at the same time as the threshold was increased so that
22
the proportion of taxpayers paying state tax was estimated to fall from 19 to 18 per cent. With regard to the budget as well as to national economy considerations, the Government now makes the assessment that there is scope to take a another step of the same size.
The Government is proposing a compensation for an additional quarter of the employee contributions. Wage earners will thus have received compensation for half of the employee contributions that she or he pays. The Government is also proposing that the lower threshold limit for charging state income tax be increased. This together with the increase of the basic deduction reduces the proportion of those who pay state tax to 16 per cent. These measures reduce marginal taxes for low and medium income wage earners and they also have a good profile since employee contributions are a heavier burden for low-income earners than for others.
The Government is furthermore proposing that travel deduction be increased from today's SEK 15 per 10 kilometres to SEK 16 per 10 kilometres.
Property tax
This year, property tax is expected to generate an income of SEK 23.1 billion that contributes to financing public welfare.
The charging of property tax has been limited in recent years by a number of decisions. The tax assessment values, i.e. the basis for property tax, have in principle been unchanged since 1997. Moreover, in 1998 the tax rate was reduced from 1.7 to 1.5 per cent. The tax rate in apartment blocks has been further reduced to 1.2 per cent in 2000.
The link between tax assessment values and market values is now to be restored. In recent years, the prices of detached houses and other housing has increased greatly in many areas of Sweden. In 2001, tax assessment values will therefore increase sharply in the areas where house prices have risen most. If no action is taken, central government revenue will increase by around SEK 10 billion next year.
The Government is now proposing that this tax revenue is used to reduce the tax rate on houses from 1.5 to 1.2 per cent and on apartment blocks from 1.2 to 0.7 per cent. At the same time, it is proposed that the exempted amount in wealth tax be increased to SEK 1 million for those living alone and SEK 1.5 million for jointly taxed couples. It is further proposed that capital gain tax on sale of housing be increased from today's 15 per cent to 20 per cent.
Through the measures proposed, a majority of Swedes will share tax reductions on properties.
The Real Estate Taxation Commission has recently submitted proposals as to how a more equitable design of property tax can be achieved and a more uniform treatment of different forms of ownership established. The commission also proposed a limitation rule that entails that charging of property tax for permanent residences be reduced in certain circumstances. The Government has initiated work aiming at being able to present a proposal to the Riksdag in spring 2001 containing proposals for a limitation rule. The approach adopted in this work is that households with normal income and wealth conditions shall not pay more than 6 per cent of household income in property tax. Such a rule should apply from 1 January 2001.
With regard to property taxation in a longer perspective, the Government intends to make proposals at a later date on the basis of the reports of the Real Estate Taxation Commission and the Property Assessment Taxation Commission.
Other tax changes
To benefit public transport and to balance the increase in diesel tax that is taking place within the framework of the green tax swap, value-added tax on public transport is to be reduced from 12 to 6 per
23
cent. The vehicle tax for older diesel-driven cars is to be increased to the level that applies for newer more environmentally friendly vehicles. In accordance with the proposals from the Traffic Taxation Commission, sales tax is being abolished on motorcycles, light lorries and light buses.
Pending it being possible to introduce alternative measures of control to support wind power, Sweden will request the EU Commission that the "environmental bonus" for electricity produced by wind power be extended for another couple of years. Later this autumn, proposals will be presented on a reduction of value-added tax for entry into zoos from 25 to 6 per cent and on improved and expanded opportunities to make tax deductions for professional fishermen.
The Government regards it as important to safeguard the Swedish shipping industry. The goal is to give Swedish shipping equal conditions for competition. The total support should be expanded to include the ferry industry as well. The Government intends to introduce proposals on a new support system which can come into effect on 1 January 2002.
1.7 An ecologically sustainable Sweden
Sweden is to set an example of ecologically sustainable development. The goal is an ecologically sustainable Sweden. The vision of a sustainable Sweden combines the best in the Swedish tradition of taking a comprehensive view and reforming gradually; social justice and internationalism, employment and the struggle for the life environment on the planet Earth.
The transformation of Sweden applies to all policy areas. Tax policy plays a key role and its importance will increase further. With a forward-looking employment, tax and environmental policy, Sweden can become the first country that builds the ecologically sustainable society. Environment and economics shall develop hand in hand. Ecological adaptation can serve as the driving force for green technical development and creation of new jobs.
In April 1999, the Riksdag adopted national environmental quality goals with a broad majority in the following 15 areas:
- 1.
- Fresh air
- 2.
- Good quality groundwater
- 3.
- Living lakes and watercourses
- 4.
- Living wetlands
- 5.
- A sea in balance with a living coast and archipelago
- 6.
- No overfertilisation
- 7.
- Only natural acidification
- 8.
- Living forests
- 9.
- A rich cultivated landscape
- 10.
- A magnificent mountain environment
- 11.
- Good urban environment
- 12.
- An toxic-free environment
- 13.
- A safe radiation environment
- 14.
- Protecting ozone layer
- 15.
- Limited effect on the climate
24
Work on environmental goals rests on five basic values: We shall promote human health, safeguard biological diversity, take care of our cultural heritage, preserve the long-term production capacity of the ecosystem, and ensure economical use of natural resources. This is the intent and purpose of an ecologically sustainable development. In recent years, major reinforcements have taken place with respect to conservation, environmental monitoring, land decontamination, and environmental research. The local investment programme has created a broad commitment in municipalities. Next year, extensive additional resources will be made available within a number of areas such as environmental monitoring, liming, windpower and care of nature reserves.
The foremost purpose of a green tax swap is to relate the tax system more closely to the environment. This leads to economic measures of control being given increased weight in environmental policy alongside administrative and information-related measures of control. If properly designed, economic measures of control give cost-effective signals to market participants to create prerequisites for an environmentally compatible life style and technology that makes sparing use of resources. Environmental taxes put a price on the environment so that it becomes more expensive, for instance, to pollute the air or water. Thereby, the participants in the economy will themselves bear the costs of the environmental effects they cause in the same way as they pay for other goods and services.
A green tax swap does not involve any increase in total tax uptake. Increased taxes on energy and environmental discharges are balanced by a reduction of other taxes, primarily on work.
Sweden was one of the first countries in the world to carry out a green tax swap—even though the concept of "green tax swap" was not used then. This year a further step was taken. Now yet another step is being taken. Energy taxation is being increased at the same time as tax on work is reduced.
Taxes—financing and control
An overall aim of taxes is to finance public expenditure. A lesson that can be drawn from the economic crisis in the 1990s is that welfare must be paid for. It is not possible to live over one's means in the long run. During the previous period of office, tax increases accounted for a large part of the consolidation of public finances, at the same time as they contributed to budget consolidation taking place in a way acceptable from a distribution policy perspective. The latter also illustrates another central main purpose of taxes, namely to contribute to a fairer distribution of income and wealth.
A further purpose of taxes is to contribute to setting the right price on products so that consumers and producers appreciate the real costs. Thus taxes can contribute to financing and fair distribution at the same time as they can contribute to a better use of our total resources.
As one of the few countries in the world, Sweden has examined the idea of a green tax swap in an official commission, the Swedish Green Tax Commission. Its conclusion was that further steps can be taken in a green tax swap if these are taken in a careful and balanced way.
A tax swap should take a number of circumstances into account. Increased energy taxes on households tend to place a relatively heavier burden on those on low and medium incomes. Furthermore, increased energy taxes can have negative regional effects. In a small open economy such as the Swedish, it is also necessary to take into account the situation for sectors exposed to competition. The base for the environmentally related taxes is considerably smaller than the base for taxes on work. Increased taxes on finite raw materials or environmentally hazardous products also dampen use of these—which is in fact one of the intentions. This leads to a reduction in the tax bases and limits the increase in tax revenue. However, the undermining of the tax bases can be counteracted by various kinds of broadening of the bases.
Another aspect of an ecologically sustainable development is that it entails positive welfare effects, such as a healthy life environment and preservation of biological diversity and the natural and cultural landscape. The value of a healthier life environment can be reflected in a reduced number of bed-days,
25
reduced consumption of pharmaceuticals, fewer days off sick, and disability pensions. This tends to particularly favour those with small economic margins.
Altogether, this means—compare with the Green Tax Commission's assessment—that a green tax swap must be carried out in stages and carefully. The effects of the various stages should also be continually monitored.
The Green Tax Commission makes the assessment in its report (SOU 1997:11) that there is scope for a further tax swap in the next fifteen years of the same size that was made use of in the 1980s and 1990s. Adjusted to current prices, and taking into consideration the present level of GDP, this scope should be in the region of SEK 30 billion in the period 2001-2010.
Reduced tax on work
Within the framework of a tax swap, there are a number of different factors to take into account in the choice of reduced tax on work.
As the number of elderly persons increases and the demographic development leads to an increased proportion of elderly, the demands on welfare society increases. Thus, more and more people must work if we are not to have to scale down welfare. A green tax swap should therefore aim to increase employment.
The Social Democrats, the Green Party and the Left Party have in many contexts drawn attention to the importance of a consistent work-first principle. One problem in this context is the combined effects of the grant and tax systems. A high wage-earner with an annual income in the region of SEK 400,000 has to pay a marginal tax of around 55 per cent. This is to be placed in relation to a considerable number of low and medium wage earners can have combined marginal effects of taxes and grants that are clearly above that level.
Some measures have already been taken by the Social Democrats, the Green Party and the Left Party to reduce the marginal effects. The compensation for a part of the employee contributions reduces marginal taxes for those on low and medium incomes. The new childcare charge will contribute to reducing marginal effects for many families with children. Moreover, a commission has been appointed that studies how marginal effects can be reduced in various grant systems.
Increased taxes on energy and consumption with an environmental impact tend to disfavour those on low incomes since they use a larger part of their income for expenditure on energy use. This tendency is reinforced as those with low incomes often have the oldest cars, heating boilers, etc. Great demands have therefore been placed on taxes on work being reduced in such a way that these effects can be balanced. Income tax reductions which mainly benefit those on low and medium incomes are therefore preferable.
The tax swap means that both households and businesses can obtain compensation for tax increases by reduction of other taxes, primarily reduction of taxes on work. Since the idea of a tax swap is to encourage households and businesses to reduce the load they place on the environment, the actual compensation for the individual household or business can sometimes be less and sometimes more than the exact equivalent of the tax increases.
The tax reduction for households can take place through increased basic deduction which gives a reduction acceptable from the perspective of distribution policy for both wage earners and pensioners. In the business and public sector, a reduction of the payroll tax is an administratively simple method to compensate businesses, municipalities and authorities for the increased energy costs. However, in its report the Green Tax Commission concluded that a general reduction in payroll tax would have relatively limited effects on employment.
26
Increased taxes for a better environment
The continued tax swap should be based on the environmental objectives adopted by the Riksdag. A changeover of the energy system with a reduction of carbon dioxide emissions is a central task here. By contributing to a more efficient use of energy, a tax swap can also contribute to a phasing-out of nuclear power.
The predominant part of the income from environmentally related taxes comes from energy tax and carbon dioxide tax, around SEK 50 billion. In a tax swap strategy of the order of SEK 30 billion, the form given to these taxes will be of key importance.
Today's energy tax system is the result of different, conflicting ambitions. Different sectors are treated independently of one another. The system is uneven, complicated and difficult to penetrate. Continual changes have also produced instability and created uncertainty for the taxpayer.
A reform of today's energy tax system is a key component of the green tax swap. An increased relation to the environment requires a rational tax structure based on easily understandable and broadly accepted principles. This reform shall contribute to a more efficient use of energy, favour use of biofuels, give businesses incentives to reduce their impact on the environment, safeguard industrial competitiveness, create the prerequisites for a domestic production of electricity, simplify the energy tax system, and give it a stable basis. The outline presented in the report from the Green Tax Commission makes a good starting point for such a reform. This reform shall take place in stages and contain a number of components:
- •
- The total tax uptake from energy and carbon dioxide taxes is to be redistributed with an increased weight for carbon dioxide tax. The overall environmental control increases even with a distribution that is cost-neutral.
- •
- The energy tax's fiscal character is to be clarified and tax charges for different kinds of energy shall reflect the energy content. In a longer perspective, the base for energy tax is to be broadened through the inclusion of biofuels.
- •
- Carbon dioxide tax is to be increased in addition to what follows from the cost-neutral redistribution from energy tax to carbon dioxide tax. At the same time, the reduced tax take-up is retained for the sectors exposed to competition. Alternative definitions of the areas exposed to competition with generally reduced taxation are to be investigated.
- •
- In the taxation of electricity and heating production, uniformity is striven for with only carbon dioxide tax being charged for sectors directly or indirectly exposed to competition. Uniformity promotes a rational use of resources and contributes to stable tax revenue. The lower tax charged for production of heating is balanced by the introduction of a consumer tax on heating. The competitive situation of electricity production is to be taken into consideration in the choice of tax level. In this context, the development of green certificates should also be taken into consideration.
- •
- A special traffic and environmental component is to be separated from energy tax for fuel in order for environmental effects in addition to emission effects, for instance, congestion and wear on the road network, to be taken into consideration in a clear way.
In addition to the phased reform of the energy tax system, the environmentally related part of the strategy for a green tax swap includes some other key components.
The analysis of alternative economic control measures needs to be deepened and sharpened, with the aim that it should be possible for such measures to complement tax control measures. In addition to traditionally focused grant solutions—operating grants and investment grants—this concerns a system for trade with emission quotas, systems with green certificates and models with long-term agreements.
27
The special environmental and traffic tax component of a reformed energy tax system should be complemented with other measures to relate total road taxation more closely to the environment. A review should be made of the total effects of all traffic-related taxes. The aim is to increase the overall environmental control of traffic taxation and that the road network should in that way pay for its economic costs. Since the low level of diesel tax in relation to petrol tax is not justified from an environmental point of view, the level of diesel tax for private cars and commercial traffic should be reviewed taking into consideration the conditions that apply to different kinds of traffic and developments in our surrounding world. The desirability of replacing today's road charges with a reformed kilometre tax should also be investigated. Previous analyses of systems for environmental-controlling road taxes in built-up areas should be complemented.
Taxes on fertilisers and means of pest and insect control should be reviewed with a view to improving their efficiency as an environmental control measure without neglecting the demand for cost effectiveness.
The recently introduced tax on waste has been in force for too short a time for it to be possible to assess its effects on waste management. However, there is cause to consider the risks of an increased burning of unsorted waste. It is therefore important to follow up and evaluate how the system of waste taxation works. An issue that may then come to the fore is whether the tax base should be broadened to include incineration of waste. This assessment should also include the connection between the waste tax and the future form of natural gravel tax.
An increased tax uptake with increased prices on fossil fuels means at the same time that the relative cost of electricity decreases. In order to counteract an increase of the total use of electricity, changes in electricity taxes are brought to the fore. In an increasingly internationalised electricity market, the most efficient way for this to take place would be through an increase in energy tax on electricity.
A green tax swap is an important part of the policy for a more socially just and ecological society. A correctly introduced green tax swap can contribute to full employment at the same time as it can contribute to a better life environment for our children and grandchildren. The strategy presented above for a successively increased environmental relation of the tax system by a green tax swap constitutes a central part of the work to make Sweden an example of ecologically sustainable development.
Green tax swap in 2001
As a first step in the green tax swap, energy taxes and taxes on work for 2001 are to be changed by a total of SEK 3.3 billion. Energy taxes are being changed and increased by:
- •
- carbon dioxide tax being given an increased weight in relation to energy tax by carbon dioxide tax being increased by 25 per cent while energy tax on electricity and fuel is to be reduced by 8 per cent,
- •
- carbon dioxide tax is to be increased by an additional 15 per cent which gives a tax uptake of SEK 0.53 per kg of carbon dioxide.
- •
- energy tax on electricity is to be increased by SEK 0.018 per kWh,
- •
- tax on diesel oil is to be increased by SEK 0.10 per litre.
With the exception of the increased tax on diesel oil, these measures do not affect transport, the manufacturing industry, agriculture, etc. Taxes on work are to be reduced by:
- •
- the basic deduction for wage earners and pensioners being increased by SEK 1,200,
28
- •
- the payroll tax and the equivalent charges for the self-employed are to be reduced by 0.1 percentage points.
Green key statistics
Since the 1999 Spring Fiscal Policy Bill, green key statistics have been reported as a complement to the economic key ratios. In the Budget Bill for 2001, green key ratios are reported for energy use and energy efficiency.
Transformation and use of energy damage the environment in different ways. Dust from energy production, car exhausts, emissions of dust and carcinogenic substances from small-scale wood burning are considered as local environmental problems. Acidification of land and water are regional environmental problems while climate problems are global.
Sweden is working actively in the EU to achieve cost and resource-effective solutions to reduce emissions of carbon dioxide and other atmospheric pollution. As well as international collaboration, measures are required locally and regionally. In Sweden, the negative impact of the energy system on the environment has been reduced by regulations, charges, taxes, and measures to promote environmentally friendly technology.
The Climate Commission presented its report during the spring and the Government will take a position on the Commission's proposals during the autumn.
The quantity of harmful substances depends on how electricity is produced. When electricity from hydroelectric power and nuclear power plants is not sufficient, Sweden imports electricity from Denmark, Finland and Germany. Imported electricity originates largely from fossil fuels and therefore causes carbon dioxide emissions. Over the year, however, Sweden is a net exporter of electricity which contributes to reducing the global emissions of carbon dioxide.
Total use of energy
In recent years, the total use of energy has increased as a result of the economic recovery since the crisis in the mid-1990s. 1996 was moreover colder than normal which contributed to an extra high use of energy during the year.
Diagram 1.3 Total energy use 1970-1998
The major part of total energy use consists of final use. Other energy use consists of distribution and transformation losses, bunker oils for foreign shipping, and coal and oil products for non-energy uses. The final use takes place within the three sectors housing and service etc, industry, and domestic
29
transport. From 1970 to 1998, an internal shift took place in the sectors' shares of total final use. Industry's share fell from 41 to 38 per cent, the share for housing and service etc. was reduced from 44 to 40 per cent, while domestic transport increased its share from 15 to 22 per cent.
In the short term, industry's use of energy is mainly affected by cyclical developments. Within the transport sector, goods transports are affected to a large extent by the growth of the business sector, while private travel is affected by household disposable income and the price of petrol. Energy for heating, operational and household electricity makes up the major part of the remaining energy use and is less cyclically dependent but is affected instead by variations in temperature.
Energy efficiency
By measuring energy efficiency, i.e. setting the total energy use in relation to the gross national product (GDP), a measure is obtained of how energy use has developed over time taking into consideration the economic growth that has taken place. From 1980 to 1998, energy efficiency has increased by approximately 20 per cent.
Diagram 1.4 Energy Efficiency 1980-1998
According to the Energy Administration's forecast, total energy use will increase by 1.8 per cent from 1999 to 2001, with an assumption of an economic growth averaging 3.5 per cent.
In sum, the development indicates that the total use of energy at present is increasing despite energy being used in a more efficient way. The objectives for energy policy entail that the Swedish energy supply shall have a low impact on the environment and climate and facilitate the changeover to an ecologically sustainable society. The green tax swap announced in the 2000 Spring Fiscal Policy Bill is a measure that is to contribute to this being achieved.
1.8 The Swedish EU Presidency
Sweden shall be actively involved in collaboration within the EU. Sweden shall stand for solidarity and co-operation in the world. A modern active policy shall promote democracy and human rights and prevent and combat hunger, poverty and war.
On 1 January 2001, Sweden is to chair the EU's Council of Ministers for the first time. Sweden's foremost ambition is to work in the interests of the entire union and its citizens, take responsibility for continuity, and drive issues on the EU agenda forwards. This is a unique chance for Sweden to participate in and drive forward European development to an even greater extent than at present. The Government has invited all parliamentary parties to work together to contribute to a successful Swedish presidency. This is of great importance for the whole of Sweden.
30
Three areas are at the top of the Government's agenda: Enlargement, Employment and Environment. These three Es are to characterise the whole of the Swedish Presidency.
The great challenge for the Swedish Presidency is the EU's imminent enlargement. This is a historical task that ultimately is about consolidating the basis for peace, freedom, democracy and welfare in Europe. Sweden will actively drive forward enlargement negotiations with the twelve candidate countries with the aim of preparing the path for a political breakthrough. The rate of negotiations is to be determined by each individual country's ability to adopt and apply the Acquis Communautaire. As soon as an agreement has been ratified at the summit meeting in Nice in December 2000 on the institutional issues, the union is ready to accept the first new members.
A major task is to move co-operation in the field of employment forwards. Full employment is the EU's most important economic and social objective. At its meeting in Lisbon in March 2000, the European Council laid down a new strategic target for the union: to create the worlds most dynamic and competitive knowledge-driven economy with sustainable economic growth, more and better jobs, and increased social cohesion. This objective shall be followed up at annual extra summit meetings. The first takes place during the Swedish Presidency in Stockholm in March 2001. Sweden will strive for an efficient, ambitious follow-up of the Lisbon strategy and for the summit meeting in Stockholm to contribute to further progress being made in areas such as IT, economic reforms, training and measures that promote social cohesion.
The collaboration within the EU in the field of the environment will be given high priority during the Swedish Presidency. This co-operation will be is highly prioritised by the Swedish Presidency which will drive forward the work with a strategy for a sustainable development where environmental, economic and social aspects reinforce one another. Sweden will also continue the work to integrate environmental considerations in the EU's various policy areas and to move the EU's seventh environmental action programme forwards.
In order to meet new challenges, live up to citizens' expectations and for an expanded union to work efficiently, the EU must become more open and modern and build further on the new open forms of co-operation that have been established. It is important that the EU is characterised by cost effectiveness and budgetary stringency. The equal opportunities perspective shall imbue all policy areas. Consumers interests shall be in focus not only with regard to food safety. Collaboration to promote freedom, security and social justice shall be intensified. EU migration policy shall be characterised by respect for the right to asylum, solidarity and humanism.
The EU plays an important role in the field of foreign and security policy and in relations with other regions. Sweden wishes to work for an internationally active union that displays solidarity—a union open to the surrounding world, a union that stands for basic values: democracy, respect for human rights, free trade, cultural diversity, and environmental consideration. Special weight will be given to making the EU's development assistance efficient. Sweden will continue the work of developing the EU's capacity with regard to crisis management and conflict prevention in close collaboration with the UN. Relations between the EU and Russia are of crucial importance.
1.9 A Sweden for all
Sweden shall again show that a good long-term economic development can best be combined with social justice, equality of opportunity, and equal life conditions. Sweden shall be characterised by good education, work, security of income, and health care on equal conditions for all.
Sweden shall be a country where the citizens' influence and their active participation in society is safeguarded and developed. The basic democratic values and popular government are reinforced when people feel that they have an influence.
31
Sweden shall be a country which makes use of all its resources. Everyone shall share in the good development. The whole of Sweden shall thrive.
The distribution policy challenge
The most important distribution policy challenge is to reduce the gaps and the number of economically marginalised. The economic crisis in the early 1990s left a lot of people without means of earning a livelihood. Every tenth person of working age is today to more than 50% dependent on social transfers for their livelihood. Marginalisation increases the gaps and reduces the possibility of safeguarding welfare.
Furthermore, the fast development of society creates new, difficult challenges for a policy of social justice. Globalisation increases international competition in all areas. This entails increased demands on knowledge and skills. Low wages and long-term unemployment increasingly threaten the less well-educated. The fast technological development drives up demand for the well-educated.
The risk for growing distribution policy problems is increasing. During the latter half of the 1990s, wage spread increased slightly, apace with an increasingly high level of economic activity. It is primarily those with high wages that are drawing ahead. Those with low wages have a considerably weaker development.
Increased demands in working life bring with them stress and long-term sick leave. The increased absence due to illness means that marginalisation is not being significantly reduced, despite reduced unemployment. There is a risk of a growing gap between the well-educated who receive increasingly high incomes in the rapidly growing parts of the business sector and the less well-educated who fasten in low pay jobs or in economic marginalisation.
A policy for growth and social justice must therefore be active and long-term. It must place a greater weight on measures that contribute to a more even distribution of knowledge and income opportunities This means a policy which contributes to a more even distribution of work incomes and thus increased equality of opportunity between women and men.
The Government's work for growth and social justice therefore emphasises active, long-term measures. The long-term work for reducing marginal effects and removing poverty traps is continuing. The proposal for a further reduction in taxes for those on low and medium incomes entails together with the introduction of a maximum childcare charge reduced marginal effects for a large number of people.
Within all areas, a policy is being carried out aiming at low unemployment and higher employment. An activity guarantee is being introduced in employment policy. Unemployment insurance is being reformed with a view to reinforcing its role as adaptation insurance. Higher education is to be expanded. Education, health care and social services are to be prioritised. Together, these measures make up a coherent policy for growth and social justice.
Distribution policy analysis
The changes that are proposed for the tax and grant system in 2001 have a favourable distribution policy profile (diagram 1.5 and 1.6). The new step, with compensation for employee contributions, an increased basic deduction, a higher threshold for state tax, a reduced property tax, a higher capital gains tax on housing, tax increases on energy, an increased exemption amount for wealth tax, increased childcare allowance, and increased housing supplement for pensioners, particularly favour those on low and medium incomes.
All persons have been divided into 10 equally large income groups (deciles) taking income into consideration. Income group 1 thus includes those with the lowest economic standard, income group 2
32
those with the second lowest, and income group 10 those with the highest economic standard. The proposals favour women as much as men.
Diagram 1.5 Change for income groups. Changed disposable income adjusted for number of dependants as a result of changed tax and grant rules

Diagram 1.6 Change for women and men

The underlying distribution policy analyses show that taxes, transfers and public consumption even out economic resources considerably. The analyses also demonstrate how important it is that policy makes income opportunities more even.
33
Appendix 2
Sweden's Economy
PROP. 2000/2001:1 BILAGA 2
Appendix 2
Sweden's Economy
Contents
| Foreword | | 5 |
1 Introduction |
|
5 |
| | 1.1 | | Summary | | 5 |
| | 1.2 | | Developments within different areas | | 9 |
2 International developments |
|
18 |
| | 2.1 | | Developments in Europe | | 19 |
| | 2.2 | | The United States | | 21 |
| | 2.3 | | Developments in Asia and Latin America | | 23 |
| | 2.4 | | Developments in Russia, Poland and the Baltic States | | 24 |
| | 2.5 | | Swedish world market growth | | 24 |
3 Capital markets |
|
26 |
| | 3.1 | | United States | | 26 |
| | 3.2 | | Euro zone | | 28 |
| | 3.3 | | Japan | | 29 |
| | 3.4 | | Sweden | | 29 |
| | 3.5 | | Interest and exchange rate assumptions | | 31 |
4 Foreign trade |
|
33 |
| | 4.1 | | Exports of goods | | 33 |
| | 4.2 | | Imports of goods | | 36 |
| | 4.3 | | Trade in services | | 37 |
| | 4.4 | | Current account balance | | 37 |
5 Business sector output |
|
40 |
| | 5.1 | | Industry | | 41 |
| | 5.2 | | Construction | | 44 |
6 Labour market |
|
46 |
7 Wages |
|
53 |
8 Inflation |
|
55 |
9 Household sector finances and consumption expenditure |
|
60 |
| | 9.1 | | Household incomes | | 60 |
| | 9.2 | | Household consumption expenditure | | 61 |
10 Gross capital formation |
|
66 |
| | 10.1 | | Business sector investment | | 67 |
| | 10.2 | | Residential investment | | 70 |
| | 10.3 | | Stocks | | 71 |
11 General government sector |
|
73 |
| | 11.1 | | Consolidated general government sector | | 73 |
| | 11.2 | | Central government | | 80 |
| | 11.3 | | The old-age pension system | | 82 |
| | 11.4 | | Local government | | 84 |
12 Evaluation of short term economic forecasts |
|
88 |
| | 12.1 | | Ministry of Finance forecasts | | 88 |
| | 12.2 | | Comparison with other forecasters | | 92 |
Explanatory boxes |
|
|
| The development of oil prices | | 25 |
| Central government net lending and budget balance | | 87 |
2
Tables
| Table 1.1 | | Assumptions for the forecast | | 7 |
| Table 1.2 | | Selected statistics | | 8 |
| Table 1.3 | | The direction of fiscal policy, change of adjusted primary net lending | | 9 |
| Table 1.4 | | Demand and output | | 12 |
| Table 1.5 | | Contribution to GDP growth | | 15 |
| Table 1.6 | | Components of saving | | 15 |
| Table 1.7 | | General government finances | | 17 |
| Table 2.1 | | GDP growth, inflation and unemployment | | 20 |
| Table 3.1 | | Balance of payments | | 31 |
| Table 3.2 | | Interest and exchange rate assumptions | | 32 |
| Table 4.1 | | Exports and imports of goods and services | | 34 |
| Table 4.2 | | Current account balance | | 38 |
| Table 4.3 | | Gross national income | | 39 |
| Table 5.1 | | Business sector output | | 40 |
| Table 5.2 | | Selected industrial statistics | | 41 |
| Table 5.3 | | Construction | | 45 |
| Table 6.1 | | Selected labour market statistics | | 46 |
| Table 6.2 | | Employment by sector | | 49 |
| Table 6.3 | | Open unemployment and employment ratio in different regions | | 52 |
| Table 7.1 | | Hourly wages | | 53 |
| Table 8.1 | | Consumer prices | | 55 |
| Table 8.2 | | Effects on CPI and UND1X of tax changes in accordance with the Budget Bill for 2001 | | 59 |
| Table 9.1 | | Household disposable income and consumption expenditure | | 61 |
| Table 9.2 | | Household Savings | | 61 |
| Table 10.1 | | Gross fixed capital formation by sector | | 66 |
| Table 10.2 | | Gross fixed capital formation in the business sector excluding industry, real estate and housing | | 69 |
| Table 11.1 | | General government finances | | 74 |
| Table 11.2 | | Taxes and charges | | 76 |
| Table 11.3 | | General government expenditure | | 78 |
| Table 11.4 | | Calculation of the direction of fiscal policy | | 79 |
| Table 11.5 | | Central government finances | | 82 |
| Table 11.6 | | Old-age pension system | | 83 |
| Table 11.7 | | Local government finances | | 84 |
| Table 11.8 | | Municipalities' and county councils' consumption | | 86 |
| Table 12.1 | | Ministry of Finance forecast errors for 1999 | | 90 |
| Table 12.2 | | Evaluated forecasters and average week for publication of selected forecasts 1990-99 | | 94 |
| Table 12.3 | | Average absolute error and average error (bias) for 1990-1999 | | 96 |
| Table 12.4 | | Average absolute error for GDP growth | | 97 |
3
Diagrams
| 1.1 | | GDP growth | | 5 |
| 2.1 | | GDP growth in EU, United States and Japan | | 18 |
| 2.2 | | Employment cost index in the United States | | 21 |
| 2.3 | | Productivity growth in the United States | | 22 |
| 3.1 | | Ten-year government bond yields | | 26 |
| 3.2 | | US corporate yield spread, 30 years | | 27 |
| 3.3 | | Stock exchange developments | | 28 |
| 3.4 | | The US dollar against the Euro | | 29 |
| 3.5 | | 10 year interest rate differential against Germany | | 30 |
| 3.6 | | The Krona against the Euro and a weighted average of currencies | | 30 |
| 4.1 | | Swedish exports to Asia | | 35 |
| 4.2 | | Exports of processed goods | | 36 |
| 5.1 | | Growth in productivity | | 42 |
| 5.2 | | Industry's labour costs per produced unit in Sweden compared with 14 OECD countries | | 43 |
| 5.3 | | Industry's share of gross operating surplus | | 44 |
| 6.1 | | Newly reported vacancies and number of employed | | 48 |
| 6.2 | | Number of employed and people in labour force | | 50 |
| 6.3 | | Open unemployment and people in labour market policy programmes | | 51 |
| 7.1 | | Development of nominal and real hourly wages | | 54 |
| 8.1 | | Gross operating surplus in other business sector excl. real estate and housing | | 57 |
| 8.2 | | Consumer price development | | 58 |
| 9.1 | | Household disposable income and consumption expenditure | | 62 |
| 9.2 | | Household net saving ratio, excluding changes in pension fund reserves | | 64 |
| 9.3 | | Household consumption expenditure: cars and other durables | | 64 |
| 9.4 | | Household debt ratio | | 65 |
| 10.1 | | Capital ratio in industry | | 67 |
| 10.2 | | Real estate prices | | 68 |
| 10.3 | | Capital ratio in other parts of the business sector excluding real estate | | 70 |
| 10.4 | | Number of dwellings—vacant and new constructions | | 71 |
| 12.1 | | Ministry of Finance forecast errors for 1999 | | 88 |
| 12.2 | | Confidence indicators | | 89 |
| 12.3 | | Ministry of Finance average absolute forecast errors regarding three variables | | 91 |
| 12.4 | | Ministry of Finance average absolute forecast errors regarding demand and output | | 92 |
| 12.5 | | Ministry of Finance average absolute forecast errors with regard to GDP growth with different forecast horizons 1990-99 | | 92 |
| 12.6 | | Revisions from previous forecast of GDP growth in 1999 | | 94 |
| 12.7 | | Average absolute forecast errors for 1999 | | 95 |
| 12.8 | | Average absolute error for GDP growth | | 97 |
| 12.9 | | Ministry of Finance average error (bias) regarding GDP growth 1970-99 | | 98 |
| 12.10 | | Provisional and revised outcome for GDP growth | | 99 |
4
Sweden's Economy
Foreword
This appendix to the Government Budget Bill for the year 2001 contains an assessment of economic developments both internationally and in Sweden up to the end of the year 2003.
The assessment is based on material from Statistics Sweden (SCB), OECD and the National Institute of Economic Research. The Ministry of Finance is, however, solely responsible for the assessment presented here.
The estimates have been made with the aid of the National Institute of Economic Research's model, KOSMOS, and are contingent upon a number of assumptions being fulfilled.
For the estimates of development in volume, the year 1999 has been used as the fixed base year for the forecast up to the end of the year 2003.
Mats Dillén, Director at the Ministry of Finance, is responsible for this appendix. The estimates contained in the appendix are based on information received up to 8 September 2000.
1 Introduction
1.1 Summary
The Swedish economy continues to develop very favourably. Employment is rising and open unemployment is falling, which is strengthening domestic demand and public finances. Inflationary pressure is moderate. The international economic situation has improved further. Swedish exports are therefore growing rapidly. Industry's need to expand production capacity is increasing.
High demand, rising employment and an industry-led rise in productivity growth contribute to an expected increase in gross domestic product (GDP) of approximately 4 per cent this year. Underlying inflation is low, even though last year's oil price rise has contributed to a slight increase in consumer prices. Low price pressure indicates that there are still available resources in the economy. There are certain signs, however, that the resource situation has tightened. The percentage of firms reporting a shortage of labour as a factor inhibiting expansion has risen, according to the National Institute of Economic Research's Business Tendency Surveys for Manufacturing, Construction and Retail Trade and for Service Sectors. Shortages are, however, generally still low in a historical perspective.
Diagram 1.1 GDP growth
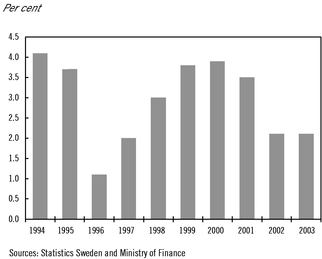
Next year, the resource situation on the labour market is estimated to be slightly more strained, and the rise in employment is therefore forecast to be lower than this year. Global growth is expected to continue to be strong, but to weaken slightly in relation to the high rate of increase this year. In
5
these circumstances, GDP in Sweden is forecast to increase by approximately 3.5 per cent in 2001. By the end of 2001, the output gap, i.e. the difference between actual and potential output, is estimated to be closed. In 2002 and 2003, the Adult Education Initiative and the number of participants in labour market policy programmes will be scaled down. This will release resources in the economy and reduce the risk of overheating. During the estimate years 2002 and 2003, GDP can therefore increase by 2.1 per cent, which is slightly higher than the estimated long-term growth rate, without inflationary pressure increasing.
On the whole, this forecast corresponds to the picture presented in the Government Spring Bill. Growth next year has, however, been revised upward by just over 0.5 percentage points. One reason for this is that leading indicators and outcome statistics point to stronger international economic growth next year than previously assumed. In addition, Swedish export development in certain segments has continued to be unexpectedly positive. This particularly applies to the telecommunication equipment industry, where the increase in exports was approximately 30 per cent during the first five months of the year, compared with the corresponding period in 1999. The most important reason is, however, that the tax cuts, etc. proposed in this Bill have now been explicitly taken into account. The growth in household consumption expenditure next year has consequently been revised upward by 0.7 percentage points.
The positive development has also been confirmed by the National Accounts. According to the preliminary figures, GDP rose 3.6 per cent during the first half of this year, compared with the same period last year. Growth was very strong in the business sector, where output rose by a full 5 per cent. The statistics indicated, however, unexpectedly weak growth in the general government sector. The breadth of the economic upturn is illustrated by the high growth figures for all demand components, except general government consumption.
Despite the fact that employment has increased by almost 250,000 persons since the summer of 1997, wage increases have been moderate, and were just under 3.5 per cent last year. Preliminary wage statistics received so far this year do not confirm that the rate of wage increase or wage drift is rising. The considerable increase in output this year and next year—and the associated increase in employment—mean, however, that the situation on the labour market can change rapidly. In the current situation, it is difficult to assess whether or when shortages, which can threaten sustainable wage developments, will arise. The 2001 wage negotiations, which will take place in an economic situation with lower unemployment and a higher employment level, compared with conditions during the 1995 and 1998 wage negotiations, are a particularly uncertain factor.
Positive factors for wage formation are that inflation expectations are stable at a level around 2 per cent, and that real wages have developed positively despite the fact that the nominal wage increases of the last few years have been low in a historical context. The changes implemented in the institutional framework for wage formation, such as the new negotiation procedure in the industrial sector and the introduction of a Mediation Institute, improve the conditions for moderate nominal wage increases. In order to avoid a situation where a tightening of economic policy becomes necessary, it is of great importance that contractual wage increases are limited and that wage drift is restrained. An important assumption for the forecast is that total wage increases are limited to 3.5 per cent per year.
The international growth outlook is very favourable and has exceeded expectations. The increasing level of activity in the world economy has been combined with continued low inflation and low interest rates. Public finances have developed positively over a number of years in the United States and the EU member states. These healthy signs should contribute to strengthening global economic stability. One of the few exceptions to this positive development is the Japanese economy, where growth is still low, domestic demand is weak and public finances show large deficits. There are, however, certain signs that the Japanese economy has reached a turning point. The long-expected slowdown in the United States has still not been evident from the National Accounts, even though certain forward-looking indicators point to subdued growth. This year, growth is expected to be a full 5 per cent.
6
In the EU area, the growth outlook is good. The European export industry has recovered and domestic demand is strong, partly as a result of favourable developments in the labour market. In Asia, excluding Japan, the recovery following the crisis is broadening to include domestic sectors of the economy. Favourable global growth this year is partly due to the fact that the European economic upturn has been realised before a slowdown in the US economy. The scenario in the forecast is, however, that growth in the United States next year will adjust to the underlying growth trend, and that economic activity in the EU area will continue to develop favourably despite slightly less help from the rest of the world.
A significant uncertain factor in the world economy is the continued oil price development. Recently, the price of Brent oil has periodically been above USD 30 per barrel and has lain at an average of just over USD 27 during the first eight months of the year. The forecast assumes that the oil price will fall to USD 26 towards the end of this year and to USD 24 at the end of 2001. If strong global growth and the associated demand for oil cannot be met through increased output, this may lead to rising inflationary pressure and more subdued growth than that assumed in the forecast.
Table 1.1 Assumptions for the forecast
| | 1998
| | 1999
| | 2000
| | 2001
| | 2002
| | 2003
|
|---|
| GDP world(1) | | 2.5 | | 3.2 | | 4.5 | | 4.1 | | 3.7 | | 3.7 |
| HICP EU(2) | | 1.3 | | 1.2 | | 2.0 | | 1.8 | | 1.8 | | 1.7 |
| Hourly wages in Sweden, costs(1) | | 3.8 | | 3.4 | | 3.5 | | 3.5 | | 3.5 | | 3.5 |
| SEK/USD(2) | | 8.0 | | 8.3 | | 8.9 | | 8.4 | | 8.0 | | 7.6 |
| TCW-index(2) | | 123.2 | | 124.8 | | 123.1 | | 121.9 | | 120.5 | | 119.5 |
| German long-term rate(3) | | 4.6 | | 4.5 | | 5.3 | | 5.3 | | 5.1 | | 5.0 |
| Swedish long-term rate(3) | | 5.0 | | 5.0 | | 5.4 | | 5.4 | | 5.3 | | 5.2 |
| Swedish short-term rate(4) | | 4.2 | | 3.3 | | 4.2 | | 4.6 | | 4.7 | | 4.6 |
- (1)
- Annual percentage change
- (2)
- Annual average
- (3)
- 10-year government bond, annual average
- (4)
- 6-month treasury bill, annual average
Sources: OECD, Statistics Sweden and Ministry of Finance
The strong international economic situation means that the outlook for the Swedish export industry is very bright. The upturn in industrial activity in the EU area will require an expansion of capacity in the European industrial sector. Since investment goods constitute a large percentage of Swedish exports of goods, the Swedish export industry will benefit. Swedish industrial firms will also need to expand capacity relatively strongly to meet the increasingly high demand. The upturn in industrial activity, favourable growth in the telecommunication equipment industry and extensive industrial investment will strengthen productivity growth in the business sector, which is expected to increase from just over 1 per cent in 1999 to just over 2 per cent this year and to approximately 2.5 per cent next year.
Investment in the rest of the business sector and in the general government sector is expected to increase at a more moderate rate in the near future. Residential investment has shown a modest increase so far this year. Various indicators show, however, that growth in residential investment will increase markedly next year from a low initial position. Stocks are expected to make a small positive contribution this year. This is partly explained by the fact that sectors of the economy with large stocks (such as industry) are expected to grow more rapidly than GDP.
Household consumption expenditure is expected to continue to grow rapidly. The increase in employment, low inflation and tax cuts have contributed to expected high growth figures for disposable incomes this year and next year. This, combined with an improved wealth position, strengthens household purchasing power. The effects of the growth in wealth of the last few years are, however, expected to gradually tail off. The tax cuts proposed by the government have been taken into account
7
in the forecast for 2001. General government consumption is forecast to increase slightly this year. In the coming years, there will be financial scope for continued expansion in the local government sector, if municipal tax is maintained at the current level.
The Swedish labour market development continues to be unexpectedly strong, with rapid employment growth and moderate wage increases. This year, employment is expected to increase by approximately 80,000 persons. The private service sector accounts for almost the whole increase. In line with improvements in the labour market situation, the number of persons in labour market policy programmes has fallen. In 1997, 184,000 persons took part in various programmes. This year, the number of participants is assumed to be 115,000. Despite this, open unemployment has fallen. At the end of this year, seasonally adjusted open unemployment is expected to be around 4 per cent. The development of newly reported vacancies is an important indicator for future employment. These are currently at a high level, but the rate of increase has slowed. At the same time, the number of remaining vacancies has risen relatively more than newly reported vacancies, which may be a sign of increasing matching problems. This points to slightly weaker growth in employment in the near future.
The long-term target for public finances is a surplus of an average of 2 per cent over a business cycle. Fulfilment of this target provides the financial scope needed when demographic developments in future decades lead to increased resource requirements. This year, public finances are expected to show a surplus of 3.4 per cent, which is clearly above the target. In 2001, the surplus is also forecast to exceed 2 per cent. If the whole scope above the target were fully utilised, fiscal policy would be too expansionary, increasing the risks of overheating. The government therefore proposes an increase in the balance target for 2001 to 2.5 per cent. The surplus in public finances following proposed tax cuts and expenditure reforms is estimated at 3.5 per cent next year. The difference between the expected surplus and the target surplus is a safety margin, which will not be utilised for reforms.
Table 1.2 Selected statistics
| | 1998
| | 1999
| | 2000
| | 2001
| | 2002
| | 2003
|
|---|
| CPI, Dec-Dec | | -0.6 | | 1.2 | | 1.1 | | 1.7 | | 2.0 | | 2.0 |
| UND1X, Dec-Dec | | 0.6 | | 1.9 | | 1.0 | | 1.3 | | — | | — |
| Disposable income(1),(2),(3) | | 1.2 | | 3.3 | | 3.4 | | 4.2 | | 4.9 | | 2.3 |
| Saving ratio (level)(3) | | 3.1 | | 2.1 | | 2.2 | | 2.9 | | 5.6 | | 5.7 |
| Industrial production(1) | | 4.3 | | 4.2 | | 6.6 | | 5.2 | | 3.0 | | 2.8 |
| Relative unit labour costs, manufacturing(1) | | -0.3 | | -2.1 | | 0.8 | | -0.3 | | — | | — |
| Number of employed(1) | | 1.5 | | 2.2 | | 2.0 | | 1.3 | | 0.5 | | 0.5 |
| Open unemployment(4) | | 6.5 | | 5.6 | | 4.6 | | 3.8 | | 3.9 | | 4.0 |
| Labour market policy programmes(4) | | 3.9 | | 3.1 | | 2.6 | | 2.6 | | 2.3 | | 2.0 |
| Regular employment ratio(5) | | 74.6 | | 75.9 | | 77.0 | | 77.7 | | 77.8 | | 78.0 |
| Trade balance(6) | | 134 | | 130 | | 142 | | 171 | | 184 | | 197 |
| Current account(7) | | 2.8 | | 2.5 | | 2.6 | | 3.6 | | 4.0 | | 4.2 |
| General government net lending before technical transfer(7) | | 1.9 | | 1.9 | | 3.4 | | 3.5 | | 3.3 | | 3.6 |
| General government net lending after technical transfer(7) | | 1.9 | | 1.9 | | 3.4 | | 3.5 | | 2.0 | | 2.0 |
- (1)
- Annual percentage change
- (2)
- The figure for disposable income for 2000 is shown excluding the transfer of the Church of Sweden to the household sector from 2000.
- (3)
- In the years 2002-2003 a technical transfer is included. Saving ratio including contractual pensions.
- (4)
- Per cent of labour force
- (5)
- Number of employed in age group 20-64, excluding employed in labour market policy programmes, in per cent of the population in that age group.
- (6)
- SEK, billion
- (7)
- Per cent of GDP
Sources: Statistics Sweden, National Labour Market Board, Riksbank and Ministry of Finance
Assuming currently adopted and proposed rules, public finances in 2002 and 2003 are expected to show a surplus of 3.3 per cent of GDP and 3.6 per cent of GDP respectively. In the estimates of the
8
general government sector's interest expenditure and of the central government debt, surpluses in excess of 2 per cent of GDP in the estimates reported for 2002 and 2003 have, however, been transferred to the household sector for technical reasons. The technical nature of this transfer should, however, be emphasised. It has not been decided whether the excess surplus will be used for reforms or for repayments of the central government debt.
The change in general government sector net lending, where net lending, among other things, has been adjusted for the effects of cyclical factors, is an indicator of the discretionary direction of fiscal policy. Table 1.3 shows that fiscal policy is forecast to be expansionary both this year and next year. In an assessment of the combined effects and the risks of overheating, which may arise as a result of the expansionary stance, it should also be taken into account that there are apparently still available resources in the economy, and that the household savings ratio (excluding saving in contractual pensions) has fallen over a number of years and is currently negative. It is therefore reasonable to assume that part of household incomes will be used to gradually adjust the savings ratio to a higher level. Before technical transfers, fiscal policy is expected to be restrictive during the years 2002 and 2003. After technical transfers, fiscal policy will, however, be expansionary in 2002, and neutral in practice in 2003. For details concerning the estimate of the fiscal stance, see Chapter 11.
Table 1.3 The direction of fiscal policy, change of adjusted primary net lending
Per cent of GDP
| | 1999
| | 2000
| | 2001
| | 2002
| | 2003
|
|---|
| Before technical transfer | | 0.2 | | -1.1 | | -1.3 | | 0.5 | | 0.2 |
| After technical transfer | | 0.2 | | -1.1 | | -1.3 | | -0.8 | | -0.1 |
Sources: Statistics Sweden and Ministry of Finance
1.2 Developments within different areas
International developments
Global growth is expected to be 4.5 per cent this year and to fall slightly to approximately 4 per cent next year. Increased global integration, deregulation, an economic policy focused on stability, and rising growth in productivity are some of the factors which have probably contributed to the high growth figures in historical terms.
In the United States, rapidly rising productivity has strengthened growth. During the first half of the year, productivity rose by approximately 4.5 per cent, compared with the corresponding period the previous year. Particularly in the IT sector, output has been at very high levels for a number of years. This has required extensive investment and increased productivity growth throughout the economy.
�� Despite good productivity growth, inflationary pressure in the US economy has increased. One important partial explanation for the increase in inflation registered up to now is, however, the rising oil price. In addition, a strained labour market situation has resulted in rising labour costs. In order to prevent the US economy overheating, the Federal Reserve has raised the key rate to 6.50 per cent in a number of steps. The effects of this relatively restrictive monetary policy are now starting to be seen in a slowdown in household consumption, particularly of consumer durables, and more subdued developments on the housing market.
A central question is to what extent the productivity increase is cyclical, permanent or involves a long-term increase in productivity growth. Which assessment is correct is of great importance to the extent to which the strong dollar, the large current account deficit and the highly valued share prices constitute serious imbalances in the economy or not. The forecast assumes that growth next year will decline to approximately 3 per cent and that the US economy will have a "soft landing". There is,
9
however, considerable uncertainty concerning productivity growth, the risks of overheating and the continued development of the oil price.
The Japanese economy is now showing some signs that a recovery has begun. Particularly the industrial sector is developing well, and the Tankan Report shows a dawning optimism about the future among large corporations. Domestic sectors of the economy continue, however, to develop weakly. Household consumption is expected to increase by 0.8 per cent this year. Unemployment has increased sharply, and many firms report that they have too many employees. The conditions for a more expansionary economic policy are limited, since the key rate is just over 0 per cent, and there are considerable deficits in public finances. Gross domestic product is expected to increase by just over 1 per cent this year and by just under 1.5 per cent next year.
In the rest of Asia, the recovery which began in 1999 is broadening to include the domestic sectors of the economies. Growth figures of just over 6 per cent are expected this year and next year. In Latin America, the countries are in different cyclical phases. Growth is expected, however, to be considerable in a number of countries. In the region as a whole, output is estimated to grow by approximately 4 per cent this year and slightly more next year.
The economic situation in Europe has gradually improved. In the euro zone, the weakening of the currency and increased demand from the rest of the world have stimulated exports. Favourable developments in the labour market and low interest rates are factors which contribute to strengthening domestic demand. Even though projective indicators point to a certain slowdown in industrial activity, which has been very strong to date, confidence in the future is still high in both the household and corporate sectors. Growth is therefore expected to increase from just under 2.5 per cent last year to approximately 3.5 per cent this year.
An anticipated appreciation of the euro, higher interest rates and weaker demand from the rest of the world will contribute to slowing growth in 2001. These contraction effects will be counteracted to some extent by the fact that fiscal policy is estimated to be more expansionary, partly as a result of planned tax cuts in Germany and France. Overall, growth is forecast to be a few decimal points lower next year than this year.
In Norway and the United Kingdom, the resource situation in the economy is more strained than in the euro zone. This is marked by a significantly lower unemployment level and a considerably tighter monetary policy in these two countries, compared with the euro zone. Relatively high wage increases, particularly in Norway, have contributed to maintaining household consumption. This year, growth is forecast to be approximately 3 per cent in both Norway and the United Kingdom. A relatively tight monetary policy in the United Kingdom is expected to result in a fall in growth to approximately 2.5 per cent next year. In Norway, growth is estimated to amount to just under 3 per cent in 2001. In Denmark, domestic demand is still weak, partly as a result of a previous tightening of fiscal policy. The effective exchange rate has weakened, strengthening the contribution of net exports to growth. Growth is expected to be just over 2 per cent this year and just under 2.5 per cent next year.
Interest rates, currencies and inflation
In the United States, the key rate is expected to be adjusted downward in the long term in line with the slowdown in growth. In order to counteract the inflationary tendencies currently in evidence, a further minor tightening of monetary policy may, however, be needed. The forecast therefore assumes an increase in the US key rate of 0.25 percentage points to 6.75 per cent at the end of this year, and then a gradual easing of monetary policy. Inflation in the euro zone rose during the first half of this year and was 2.4 per cent in July, which is higher than the European Central Bank's (ECB) ceiling of 2 per cent. Higher oil prices and the effects of the previous weakening of the euro account for the major part of the increase. In view of the gradual utilisation of available resources and the path of underlying inflation up to now, the ECB is expected to raise the key rate by 0.25 percentage points this year and
10
by 0.25 percentage points next year. The Swedish and the German ten-year government bond rates are forecast to remain at the same level as the last few months, i.e. between 5 per cent and 5.50 per cent.
The Swedish krona has not strengthened to the extent assumed in the Government Spring Bill. In this assessment, the strengthening of the krona is assumed to be slightly less extensive. This re-evaluation is due to the good economic growth in the United States. The dollar exchange rate is forecast to weaken relative to both the krona and the euro, but the weakening is less than previously assumed. The Swedish krona is expected to gradually strengthen to 119 in terms of the trade-weighted TCW index. Since its introduction in January 1999, the euro has lost approximately one-quarter of its value against the dollar. The euro is now considered to be substantially undervalued against the dollar and even, though to a considerably smaller extent, against the Swedish krona. In the long term, the value of the krona against the euro is estimated to be 8.60.
Swedish monetary policy is guided by an inflation target. The inflation target is measured as the change in the consumer price index (CPI), which should amount to 2 per cent with a tolerance interval of +/-1 percentage point. The Riksbank has explained that it is currently the assessment of UND1X which guides the framing of monetary policy. UND1X is an inflation measure, where the direct effects of changes in interest rates, indirect taxes and subsidies have been excluded from the CPI.
Inflation according to both the CPI and UND1X was 1.2 per cent in July, over half of which was due to higher petrol and diesel prices. Despite the good growth and rapid increase in employment of the last few years, the underlying inflationary pressure in the Swedish economy is thus still low.
Over the next few years, international prices are forecast to rise at a slightly more rapid rate than previously, as a result of the increasing level of global activity. Since the krona is assumed to appreciate and the oil price to fall, import prices are expected nevertheless to fall. The strong growth in domestic demand is expected at the same time to provide some scope for the trade sector to increase its margins. The indirect effects of the oil price rise are expected to have an impact on consumer prices with a certain time lag. The low wage increases and good productivity growth result in low domestic cost pressure in the economy. The reductions in the tax rates for single-family dwellings and rental apartment blocks proposed in the Government Budget Bill have been taken into account in the forecast. Overall, this means that price developments are expected to be relatively moderate this year and next year. UND1X is expected to be 1.3 per cent at the end of 2001.
The single greatest risks in the inflation forecast are the oil price development and the resource situation on the labour market. As regards the latter risk, the levels of shortages are generally still low. Employment is, however, predicted to continue to rise, resulting in a tighter resource situation next year. In addition, there is uncertainty concerning the outcome of the coming wage negotiations. In view of the positive productivity outlook, the stable low inflation expectations and the low initial price pressure, it is difficult, however, to see any major inflation threat this year or next year.
It is, however, reasonable to assume that the Riksbank will adopt a more neutral monetary policy as the output gap closes. The repo rate is therefore assumed to be 4.25 per cent at the end of this year, 4.75 per cent at the end of 2001, and then 4.50 per cent. As regards 2002 and 2003, it is assumed that monetary policy will be adjusted so that inflation develops in line with the inflation target.
11
Table 1.4 Demand and output
| | SEK
billion
| | Percentage change
|
|---|
| | 1999
| | 1997
| | 1998
| | 1999
| | 2000
| |
| | 2001
| | 2002
| | 2003
|
|---|
| Household consumption expenditure | | 997 | | 1.7 | | 2.4 | | 4.1 | | 4.7 | | (3.7 | ) | 3.4 | | 2.1 | | 2.1 |
| General government consumption expenditure | | 533 | | -1.0 | | 2.2 | | 1.8 | | -1.4 | | (0.6 | ) | 0.9 | | 1.0 | | 0.9 |
| | Central government | | 154 | | -2.7 | | -7.4 | | 1.1 | | 0.0 | | | | 0.5 | | 0.5 | | 0.5 |
| | Local government | | 378 | | -0.2 | | 6.6 | | 2.0 | | -1.9 | | (0.7 | ) | 1.0 | | 1.2 | | 1.1 |
| Gross fixed capital formation | | 327 | | -2.2 | | 9.4 | | 8.1 | | 5.1 | | | | 6.8 | | 2.5 | | 2.8 |
| | Business sector excl. housing | | 246 | | 3.2 | | 10.6 | | 7.6 | | 6.9 | | (6.5 | ) | 6.2 | | 1.2 | | 1.5 |
| | Housing | | 32 | | -22.3 | | 3.6 | | 18.8 | | 4.5 | | | | 13.7 | | 12.0 | | 12.0 |
| | Authorities | | 49 | | -12.1 | | 7.0 | | 4.7 | | -3.2 | | (-1.4 | ) | 4.9 | | 2.3 | | 2.4 |
| Change in stocks(1) | | 6 | | 0.5 | | 0.3 | | -0.5 | | 0.2 | | | | -0.1 | | 0.0 | | 0.0 |
| Exports | | 863 | | 13.0 | | 7.3 | | 5.2 | | 9.8 | | | | 7.7 | | 5.9 | | 5.7 |
| Imports | | 754 | | 11.8 | | 10.4 | | 5.0 | | 8.8 | | | | 7.5 | | 6.0 | | 5.9 |
| GDP | | 1972 | | 2.0 | | 3.0 | | 3.8 | | 3.9 | | | | 3.5 | | 2.1 | | 2.1 |
Note: The figures for 2000 are affected by the fact that the Church of Sweden is included in the household sector from 2000. The corresponding development excluding this effect is shown in parenthesis.
- (1)
- The change in volume is calculated as per cent of GDP last year.
Sources: Statistics Sweden and Ministry of Finance
Demand and output
After last year's weak export development, with the exception of the telecommunication equipment industry, very strong growth in exports is now forecast for both this year and next year. Swedish industry is favoured by the strong international economic activity and an advantageous product orientation, and this is indicated not least by the National Accounts for the first half of the year, which showed an increase in exports of goods of 11.4 per cent, compared with the first half of 1999. This figure comprises continued strong growth in the telecommunication equipment industry and an upturn in cyclically sensitive sectors such as the automotive industry, as well as the forest and steel industries with increases of around 20 per cent. The statistics show a clear recovery for exports to Asia. The value of export shipments to Asia is estimated to have increased by approximately 40 per cent this year.
Available indicators clearly point to continued strong growth in exports. The order situation in the export industry is very favourable and production plans are positive. Initial competitiveness is good. A certain rise in relative prices is, however, expected during the forecast years, partly as a result of rising world market prices for base industry products and the assumed appreciation of the krona. Despite this, the Swedish export industry is expected to gain market shares this year and next year. Overall, this means that exports of goods are expected to increase by just under 11 per cent this year, of which the telecommunication equipment industry will account for approximately half of the increase, and by almost 8 per cent in 2001. The significance of the telecommunication equipment industry on the growth in exports means that the forecast is sensitive to the continued growth of this sector. The probability of even better growth than assumed is, however, considered just as great as the probability of a worse development. Another uncertain factor in the export forecast is that continued high order levels and increasing delivery times may lead to export prices rising more than expected.
12
Imports of goods are expected to rise by approximately 9 per cent this year, which is considerably higher than last year when the growth in imports was barely half that figure. Underlying the sharp rise is rapid growth in demand components with a high import content, e.g. investment in machinery and durable goods. Relatively low import prices compared with domestic output prices contribute to higher growth in imports. Imports of goods are expected to increase by 7.5 per cent next year, i.e. slightly weaker growth than this year. Despite the rapid increase in exports relative to imports, the trade balance in relation to GDP will improve by only 0.3 percentage points to 6.9 per cent of GDP, compared with 1999. This is mainly due to the rapid price rise on oil. Next year, the oil price development is, however, expected to have a smaller negative impact on the trade balance, contributing to an expected rise in the surplus to just under 8 per cent.
The services balance is expected to make a negative contribution to GDP growth of 0.2 to 0.3 percentage points in the coming years, as in the last few years. Underlying this, above all, is the rapidly growing imports of travel currency. This item not only includes Swedes' expenditure in connection with foreign travel, but also direct imports of cars and e-commerce.
Gross capital formation is increasing rapidly and a growing percentage of total output is being used for investment purposes. This year, gross capital formation is expected to increase by approximately 5 per cent, and by just under 7 per cent next year. Investment growth differs between different sectors. Industrial investment barely rose at all in 1999. Expected high capacity utilisation will, however, result in higher investment volumes this year and in the near future. According to SCB's Investment Survey, industrial firms also report expansionary plans. Experience and the outcome of the National Accounts for the first half of the year indicate that industry is unlikely to fully realise these expansionary plans. Industrial investment is nevertheless expected to increase by a good 8 per cent this year. High growth in industrial output is also forecast for next year. Increasingly high capacity utilisation and some postponement of planned investment mean that industrial investment is expected to increase by approximately 8 per cent next year also.
Investment in the rest of the business sector rose by a full 11 per cent in 1999 (partly due to a high level of investment in shipping and airports). It is expected to continue to rise by approximately 6.5 per cent this year and by just under 5.5 per cent next year. However, the picture is not uniform. Strong growth in the service sector has increased the demand for additional capacity. In the metropolitan areas, investment in commercial property is substantial. In the telecommunications sector, the expansion of mobile telephone systems and the broadband network contributes to high investment volumes. In financial services, investment growth is more subdued, following a number of years with very high figures.
Residential investment is increasing, but the strength of the increase is difficult to assess. Good profitability of new construction, the favourable development of household finances and the, in historical terms, low level of interest rates are factors which should have a positive impact on residential construction. Housing demand is, however, geographically uneven. One major problem in expansionary areas is the shortage of subdivided land for development. A low rate of increase in renovations and extensions may be a sign of a growing shortage of construction workers. Low profitability in the construction of rental property is another restraining factor. In view of these circumstances, outcome statistics and indicators, residential investment is estimated to increase by approximately 4.5 per cent this year and by just under 14 per cent next year. The initial investment volume is so low that the housing shortage in expansionary areas will remain.
Household consumption expenditure rose by 4.1 per cent in 1999, which is the highest growth since 1987. The conditions for continued strong growth are very favourable. Household real disposable incomes are estimated to rise by almost 4 per cent per year in 2000 and 2001, adjusted for the effect of the transfer of the Church of Sweden to the household sector. The favourable income growth is related to the expected increase in employment, the income tax cuts implemented this year and proposed for
13
next year, and low inflation, which strengthens real wage growth. The considerable improvement in the wealth position of households increases household propensity to consume further. Despite the fact that developments on the Swedish stock exchange have been slightly calmer this year than previously, statistics from SCB and the Financial Supervisory Authority show that household net wealth has increased by approximately SEK 425 billion since 30 June 1999.
The positive outlook for household consumption is emphasised by the National Accounts for the first half of the year, which showed an increase of just under 4 per cent (excluding the effect of the transfer of the Church of Sweden). Household confidence in the future, as measured by SCB, shows that households continue to be very optimistic about the future. Household expectations regarding their own finances, which are a relatively good indicator of future consumption, remain at historically peak levels. The optimism is probably due to both the good real economic growth and its positive effects on public finances. Given these advantageous conditions, household consumption expenditure is expected to increase by 3.7 per cent this year (4.7 per cent including the effect of the transfer of the Church of Sweden) and by 3.4 per cent next year.
During the years 2002-2003, the surpluses in public finances will exceed the target level of 2 per cent of GDP. A technical assumption is made in the forecast that the surpluses for these years in excess of 2 per cent of GDP are transferred to the household sector. It should, however, be emphasised that the treatment of these surpluses will not be the subject of a decision until a later date, and that the estimates of household consumption for 2002 and 2003 are not based on specific assumptions on the amount of the actual transfers.
It is also relevant in this context that the household savings ratio is currently at a low level, reflecting the sharp growth in wealth, investment in consumer durables and confidence in public finances. In the medium-range perspective, households are therefore expected to increase the proportion of disposable income saved. Given these uncertainty factors, households are estimated to increase their consumption by approximately 2 per cent per year in 2002 and 2003, i.e. at about the same rate as the growth in GDP.
Central government consumption fell unexpectedly by approximately 3 per cent in the first half of this year, according to the preliminary National Accounts. These figures are, however, very uncertain. The information contained in the budget outcomes points to a stronger development of central government consumption this year. In view of this conflicting information, central government consumption is estimated to remain unchanged this year and to increase by 0.5 per cent next year.
Local government consumption expenditure rose by 2.0 per cent between 1998 and 1999. The assessment of the development of local government consumption expenditure has been based on the economic scope that is available on the assumption that each sub-sector meets the balance requirement. Compared with the forecast in the Government Spring Bill, the forecast for local government consumption expenditure this year has been reduced from 1.3 per cent to 0.7 per cent, as a result of the unexpectedly low outcomes in the National Accounts for the first half of this year. If the transfer of the Church of Sweden from the local government sector to non-profit organisations serving households is taken into account, the growth rate this year will be - -1.9 per cent. The favourable development of tax revenues and central government grants provides scope for continued growth in local government consumption expenditure at unchanged tax rates, even though the growth has been moved forward in the forecast, compared with in the Government Spring Bill. In the current forecast, local government consumption expenditure is estimated to grow by approximately 1 per cent per year in volume during the years 2001-2003, compared with approximately 0.5 per cent per year for the same period in the Government Spring Bill.
14
Composition of growth and saving
Growth in the Swedish economy is both high and well balanced this year, with positive contributions to growth from all the components of demand and output (see Table 1.5). Compared with 1999, the contribution from net exports has increased by 0.5 percentage points, which above all reflects the broad economic upturn in the export industry. The contribution from household consumption expenditure will be just over 2 percentage points this year, as last year. In historical terms, this is a very high contribution.
Table 1.5 Contribution to GDP growth
Percentage points
| | 1998
| | 1999
| | 2000
| | 2001
| | 2002
| | 2003
|
|---|
| Household consumption expenditure | | 1.2 | | 2.1 | | 1.9 | | 1.7 | | 1.1 | | 1.1 |
| General government consumption expenditure | | 0.6 | | 0.5 | | 0.2 | | 0.2 | | 0.2 | | 0.2 |
| Gross fixed capital formation | | 1.4 | | 1.3 | | 0.8 | | 1.1 | | 0.4 | | 0.5 |
| Change in stocks | | 0.3 | | -0.5 | | 0.2 | | -0.1 | | 0.0 | | 0.0 |
| Exports | | 3.1 | | 2.3 | | 4.3 | | 3.6 | | 2.9 | | 2.8 |
| Imports | | -3.7 | | -1.9 | | -3.4 | | -3.0 | | -2.5 | | -2.5 |
| Net foreign trade | | -0.6 | | 0.4 | | 0.9 | | 0.6 | | 0.3 | | 0.3 |
| GDP | | 3.0 | | 3.8 | | 3.9 | | 3.5 | | 2.1 | | 2.1 |
Note: The contribution to GDP for 2000 is shown excluding the fact that the Church of Sweden is included in the household sector from 2000.
Sources: Statistics Sweden and Ministry of Finance
The contribution from investment is gradually falling. As seen from Table 1.6, investment is, however, growing more rapidly than GDP for the whole period. Net lending, which largely corresponds to the current account balance, is estimated to strengthen further, since growing trade balance surpluses and falling deficits in investment income more than compensate for the weak development of the net services balance.
This means that net lending will increase from 1.6 per cent in 1999, to 2.6 per cent this year and 3.6 per cent next year. In Table 1.6, the whole technical transfer to households has been implemented for the years 2002 and 2003, and has thereby strengthened household saving. General government sector saving has weakened correspondingly.
Table 1.6 Components of saving
Per cent of GDP
| | 1998
| | 1999
| | 2000
| | 2001
| | 2002
| | 2003
|
|---|
| Gross balance | | 19.8 | | 18.5 | | 19.9 | | 21.2 | | 21.5 | | 21.7 |
| Real balance | | 16.7 | | 16.9 | | 17.3 | | 17.6 | | 17.5 | | 17.6 |
| | Fixed capital | | 15.8 | | 16.6 | | 16.8 | | 17.2 | | 17.2 | | 17.2 |
| | Change in stocks | | 0.9 | | 0.3 | | 0.5 | | 0.4 | | 0.3 | | 0.3 |
| Net lending | | 3.1 | | 1.6 | | 2.6 | | 3.6 | | 4.0 | | 4.2 |
| | General government(1) | | 1.9 | | 1.9 | | 3.4 | | 3.5 | | 2.0 | | 2.0 |
| | Household(1) | | 2.0 | | 1.3 | | 1.2 | | 1.0 | | 2.4 | | 2.3 |
| | Business sector | | -0.8 | | -1.6 | | -2.0 | | -0.9 | | -0.4 | | -0.1 |
- (1)
- After technical transfer
Sources: Statistics Sweden and Ministry of Finance
15
The labour market
Employment growth during the first half of this year has been very positive and exceeded the expectations underlying the forecast in the Government Spring Bill. Employment is estimated to rise by 2 per cent this year and by 1.3 per cent next year. As a result, the regular employment ratio for persons between the ages of 20 and 64, which according to the government's target shall be 80 per cent in 2004, is estimated to rise from 75.9 per cent in 1999 to 77.7 per cent in 2001.
The majority of indicators point to continued good employment growth. Demand in the economy is expected to be strong this year and next year. The increase in employment is particularly extensive in the private service sector, where employment is estimated to rise by a total of just over 6.5 per cent or approximately 110,000 persons during the period 2000- 2001. The number of newly reported vacancies, which has historically been a good employment indicator, points to a continued increase in employment.
However, there are also a number of signs that the labour market situation is becoming more strained. The number of remaining vacancies has risen in relation to newly reported vacancies, which is a sign that it has become more difficult for employers to recruit staff. Even though employment has risen in the majority of counties, regional imbalances are nevertheless considerable. In the metropolitan areas, an incipient labour and housing shortage is limiting opportunities for expansion. Various surveys show that the shortage of graduates, persons with industry specific competence, nurses, doctors and teachers is growing. The increasing recruitment problems must, however, be seen in the light of the relatively low initial shortages. The tighter resource situation is expected, however, to slow down employment growth next year.
The forecast rise in employment also leads to an increased supply of labour. The increase in the supply of labour is partially offset by the planned increase in the number of places in higher education of 19,000 this year and an additional 16,000 next year. Open unemployment is therefore expected to fall from 5.6 per cent in 1999 to 4.6 per cent this year and 3.8 per cent next year.
In 2002 and 2003, when the output gap is assumed to be closed, the number of places in the Adult Education Initiative and the number of persons in labour market policy programmes will be gradually scaled down, increasing the supply of labour. Some of those persons who would otherwise have been included in the Adult Education Initiative or labour market policy programmes will find employment. Others will, at least in the short term, be openly unemployed or outside the labour force. The scaling down will therefore lead to slightly higher employment growth and consequently also higher GDP growth than the long-term growth rate of 2 per cent. It will also lead to slightly higher open unemployment in the short term.
Public finances
Public finances are developing more strongly than estimated in the Government Spring Bill. This year, general government net lending is expected to amount to SEK 71 billion or 3.4 per cent of GDP. This is almost double the surplus for 1999.
In 2001, net lending is estimated to increase to SEK 76 billion or 3.5 per cent of GDP. Saving will, however, be temporarily increased by approximately SEK 8 billion, or 0.4 per cent of GDP, as a result of tax on pension funds repaid by the insurance company SPP. At the same time, the proposed income tax cuts will lead to a reduction in tax revenues of SEK 15 billion or 0.7 per cent of GDP, compared with existing rules this year. In addition, a reduction in the property tax rate and an increase in the wealth tax allowance are proposed in order to avoid the increased tax levy, which would otherwise have been the case when the freeze on tax assessment values ends in 2001. Overall, tax revenues will fall to just under 51 per cent of GDP next year. The expenditure ratio is also expected to fall. This is partly as a result of the strong GDP growth, and partly as a result of the growth also leading to a reduction in
16
unemployment expenditure. Low inflation leads moreover to a limited nominal increase in pensions and other index-linked expenditure. Interest expenditure will fall as a result of the decreasing central government debt. Revenues from interest and dividends will also fall since financial assets will be reduced through transfers from the National Pension Fund to central government.
The estimates for the years 2002 and 2003 show continued strong public finances, with surpluses in net lending of 3.3 per cent and 3.6 per cent respectively of GDP. The estimate of the central government debt and interest expenditure is based, however, on the target surplus of 2 per cent of GDP.
Table 1.7 General government finances
Per cent of GDP
| | 1999
| | 2000
| | 2001
| | 2002
| | 2003
|
|---|
| Revenue | | 60.2 | | 58.9 | | 57.2 | | 56.4 | | 56.5 |
| Expenditure | | 58.4 | | 55.5 | | 53.7 | | 53.1 | | 52.9 |
| Net lending before transfers | | 1.9 | | 3.4 | | 3.5 | | 3.3 | | 3.6 |
| Technical assumption of transfers | | — | | — | | — | | 1.3 | | 1.6 |
| Net lending after transfers | | 1.9 | | 3.4 | | 3.5 | | 2.0 | | 2.0 |
| Consolidated gross debt after transfers | | 65.6 | | 58.9 | | 53.2 | | 50.2 | | 48.2 |
Sources: Statistics Sweden and Ministry of Finance
The distribution of saving between central government and the old-age pension system will be affected during the period by the financial phasing-in of the reformed old-age pension system. When the phasing-in is complete in 2003, saving in the pension system, i.e. the National Pension Fund and the premium pension system, is estimated to be approximately 3 per cent of GDP, while central government net lending (after the technical transfer) will show a deficit of approximately 1 per cent of GDP. This is a result of the fact that the pension reform constitutes a very large redistribution of saving from central government to the old-age pension system. More than the total financial surplus target for the whole general government sector will be used to build up pension funds in anticipation of future strains on resources.
The consolidated gross debt of the general government sector, defined according to the Maastricht convergence criteria, amounted to just over 65 per cent of GDP at the end of 1999. The consolidated gross debt has declined since 1995 as a percentage of GDP. The consolidated gross debt will also decline in nominal terms by approximately SEK 75 billion this year, and is expected to be less than 60 per cent of GDP, which is the reference value in the EU. The sharp reduction is largely due to the sales proceeds from central government shareholdings being used to repay the central government debt.
Net debt, which is the net of the total financial assets and liabilities of the general government sector, will fall as a result of the financial surpluses and the changes in the value of assets and liabilities. Next year, net debt is estimated to become positive. This means that general government financial assets will exceed liabilities.
17
2 International developments
The global economy is expected to show a very positive development during the forecast period. In all, global GDP growth is expected to amount to 4.5 per cent this year and to approximately 4 per cent next year.
There have not been such favourable prospects for strong economic growth since the end of the 1980s. Furthermore, the global growth is expected to be distributed among almost all regions and countries in the world.
During the major part of the 1990s, the US economy has been an important driving force behind growth in the global economy. However, in the near future, the EU area, as well as Asia and Latin America, are expected to make a more tangible contribution to global growth. This is at the same time as growth in the US economy is expected to slow down slightly, compared with recent years. The development of the Japanese economy remains uncertain, however, and a powerful recovery is not expected.
Diagram 2.1 GDP growth in EU, United States and Japan
Important factors behind the bright prospects for the global economy include the positive macroeconomic conditions in the form of low inflation rates and low interest rates, as well as markedly improved public finances.
Other less visible but equally important explanations for the positive development are the changes in the functioning of the economy implemented in many countries over the past decade. These include increased free trade and better functioning of the markets for labour, goods, capital and services. The results of these changes have previously been most apparent in the United States, partly in the form of a strong growth in employment during the 1990s, but in later years also in the form of accelerating productivity growth. During the forecast period, the EU area is also expected to show a strong labour market development combined with continued low inflation.
As a result of the strong external demand, the demand for processed goods is expected to develop very strongly during the forecast period. In all, the world market growth for Swedish exports is expected to rise from 5.5 per cent last year to approximately 10 per cent this year, and to amount to around 8.5 per cent in 2001.
The uncertainty factors during the forecast period partly derive from the risk that a strong growth in several regions or countries could lead to an overly strong demand and thus rising inflation. Another risk factor is the continued development of oil prices, which have shown extreme fluctuations this year.
18
A more detailed discussion on oil prices and their effects is provided in the explanatory box at the end of this chapter. A further risk is the possible knock-on effects of a major slowdown in the US economy.
2.1 Developments in Europe
The euro zone
Growth prospects in the euro zone for the coming years are very good. GDP growth is predicted to become stronger than at any time during the past decade and is expected to be driven both by stable domestic demand and strong exports to the rest of the world. Unlike the economic upturn at the end of the 1980s and beginning of the 1990s, the macroeconomic conditions today are more favourable with low inflation rates, low interest rates and better balanced public finances. This, combined with reforms in the markets for labour, goods, capital and services, constitutes a good foundation for a more stable and sustainable economic growth in the future.
Industrial activity has developed very strongly during the first six months of this year. However, projective indicators indicate that the rate of increase in industrial output will slow down slightly in the near future. At the same time, consumer confidence is at historically high levels.
The favourable economic prospects mean that GDP growth is predicted to amount to 3.5 per cent this year and 3.3 per cent next year. Household consumption is estimated to develop strongly during the coming years as a result of rising employment and an increase in real disposable incomes. Similarly, investment is expected to comprise an important driving force behind growth, partly due to low interest rates. At the same time, net exports are anticipated to make a very positive contribution to GDP growth this year as a result of both the weak euro and the strong demand in the rest of the world.
The slightly lower growth rate next year can be explained by lagged effects from the ECB's interest rate increases, as well as the effects of rising oil prices on domestic demand. In addition, the positive contribution to growth from net exports is expected to decline next year as a result of slightly weaker demand from the rest of the world and an expected appreciation of the euro.
The differences in growth between the individual euro countries are also expected to decline during the forecast period, as a result of an acceleration in economic activity in Germany and Italy.
The key rate in the euro zone is assumed to amount to 5 per cent at the end of the forecast period. At the same time, the euro is expected to strengthen. In all, this involves a tightening of monetary conditions, which will have a dampening effect on growth, primarily next year. Fiscal policy is estimated to gradually become more expansionary as a result of planned tax cuts in several euro countries, including Germany and France.
A strong development is forecast for the labour market, with a high growth rate in employment of around 1.5 per cent, both this year and next year. At the same time, unemployment is forecast to fall to just over 9 per cent this year and just over 8 per cent next year. However, developments differ from one country to another. Employment growth in France is expected to reach historically high levels of 2-2.5 per cent in the coming years, while in Germany growth in employment is unlikely to rise beyond 1 per cent.
Inflation in the euro zone has increased during the first half of this year and the inflation rate amounted to 2.4 per cent in July. On the other hand, core inflation has been subdued so far. The rise in the inflation rate can be attributed mainly to the rise in oil prices, but also to delayed effects from the earlier weakening of the euro. The inflation rate is estimated to exceed 2 per cent this year, but then to decline to just under 2 per cent next year, partly as a result of the assumed appreciation of the euro and the effects of the implemented and expected interest rate hikes.
The risks in the forecast are balanced. A rapid improvement on the labour market, a relatively expansionary fiscal policy and continued high or rising oil prices could lead to rising inflation. This
19
could lead to the ECB tightening up monetary policy more than anticipated, which in turn would have a greater dampening effect on growth than currently predicted.
Table 2.1 GDP growth, inflation and unemployment
Percentage change
| | 1997
| | 1998
| | 1999
| | 2000
| | 2001
|
|---|
| Gross domestic product | | | | | | | | | | |
| World | | 4.3 | | 2.5 | | 3.2 | | 4.5 | | 4.1 |
| | United States | | 4.4 | | 4.4 | | 4.2 | | 5.0 | | 3.0 |
| | Japan | | 1.6 | | -2.5 | | 0.3 | | 1.2 | | 1.4 |
| EU | | 2.6 | | 2.7 | | 2.4 | | 3.4 | | 3.2 |
| | Euro zone | | 2.4 | | 2.8 | | 2.4 | | 3.5 | | 3.3 |
| | | Germany | | 1.4 | | 2.1 | | 1.6 | | 3.0 | | 3.0 |
| | | France | | 1.9 | | 3.2 | | 2.9 | | 3.7 | | 3.3 |
| | | Italy | | 1.8 | | 1.5 | | 1.4 | | 2.9 | | 3.0 |
| | United Kingdom | | 3.5 | | 2.2 | | 2.1 | | 3.0 | | 2.6 |
| Nordic countries | | 3.6 | | 3.1 | | 2.6 | | 3.4 | | 3.2 |
| | Denmark | | 3.1 | | 2.6 | | 1.6 | | 2.2 | | 2.4 |
| | Finland | | 6.3 | | 5.0 | | 3.5 | | 5.0 | | 4.3 |
| | Norway | | 4.3 | | 2.1 | | 0.9 | | 2.9 | | 2.9 |
| Consumer prices(1) | | | | | | | | | | |
| EU | | 1.7 | | 1.3 | | 1.2 | | 2.0 | | 1.8 |
| | Euro zone | | 1.6 | | 1.2 | | 1.2 | | 2.2 | | 1.8 |
| United States | | 2.3 | | 1.6 | | 2.2 | | 3.2 | | 2.8 |
| Unemployment as a percentage of labour force(2) | | | | | | | | | | |
| EU | | 10.6 | | 9.9 | | 9.3 | | 8.5 | | 7.9 |
| | Euro zone | | 11.5 | | 10.8 | | 10.1 | | 9.2 | | 8.6 |
| United States | | 4.9 | | 4.5 | | 4.2 | | 3.9 | | 4.2 |
| Market growth for Swedish exports | | 10.5 | | 7.8 | | 5.5 | | 10.1 | | 8.6 |
- (1)
- HICP for EU and CPI for United States.
- (2)
- LFS-definition for EU and national definition for United States.
Sources: OECD and Ministry of Finance
The United Kingdom
The UK economy has continued to expand and is now into its eighth year of high economic growth. Household consumption still comprises the most important driving force behind growth. However, rising inflationary pressure due to factors such as increasing wage costs caused by the tight situation on the labour market, in combination with a somewhat expansionary fiscal policy, is assumed to lead to a further tightening of monetary policy. This is assessed to dampen domestic demand. GDP growth is expected to amount to 3.0 per cent this year and to slow to approximately 2.5 per cent in 2001.
Norway
Following a clear slowdown last year, there are now signs that economic activity in Norway is picking up again. During this year and next year, the recovery is predicted to be driven mainly by an increase in household consumption. On the other hand, investments in the oil sector, which fell heavily
20
last year as a result of the low oil prices then, are expected to decline further this year and thereby have a dampening effect on economic developments. In all, GDP growth is expected to amount to just under 3 per cent both this year and next year.
Denmark
Domestic demand in Denmark is expected to continue to develop weakly over the year, due to both the effects of the tighter fiscal policy introduced in 1998 and a higher level of interest rates. The main contribution to GDP growth this year is expected to come from net exports, as a result of a weaker Danish currency and a stronger international economy. Next year, however, domestic demand is predicted to develop slightly more strongly. GDP growth is expected to amount to just over 2 per cent this year and just under 2.5 per cent next year.
2.2 The United States
The US economy is now in its ninth year of stable and strong economic growth. The growth in GDP has even accelerated during the first half of 2000 and is forecast to amount to 5.0 per cent this year, which is the highest growth rate in 15 years. As previously, household consumption has comprised the primary driving force behind growth. The high propensity to consume within the household sector is reflected in a low rate of private savnings and a large deficit in the current account balance, corresponding to just over 4 per cent of GDP. One important explanation of the strong development in household consumption is probably the rapid increase in employment.
Unemployment has fallen at the same time, fluctuating at around 4 per cent since October 1999, which is the lowest level for thirty years.
The strong development in the United States has increasingly been driven by a rapid increase in productivity in recent years. This has reinforced expectations of future profits and thus, together with the strong domestic and international demand, contributed to a continued high rate of investment, particularly in industries with IT-related business activities. The increased productivity has also had a dampening effect on price developments. Although the inflation rate has risen during the first half of 2000, the rise has been remarkably moderate in the light of the high level of economic activity. In recent months, however, there have been increasing signs of a general rise in inflationary pressure in the US economy, for instance in the labour market and in the early stages of production. Labour costs have also increased significantly during the first six months of this year.
Diagram 2.2 Employment cost index in the United States
21
Rising inflationary pressure has contributed to the US Federal Reserve gradually increasing the key interest rate to 6.5 per cent. There are now signs that the higher level of interest rates, together with the more moderate development in share prices, has begun to have a dampening effect on household consumption. In particular, consumption of durable goods has dampened considerably as the housing market has slowed down.
Higher market interest rates, a more subdued development in share prices and higher oil prices are expected to lead to a continued slowdown in household consumption in the near future. At the same time, investment is expected to develop more weakly. The slower investment rate can be explained, in addition to the tightening of monetary policy, by rising labour costs together with relatively low capacity utilisation in industry, and a general dampening of economic activity. At the same time, net exports are expected to provide a reduced, although still negative, contribution to growth next year. In all, the slowdown in domestic demand next year is forecast to lead to a "soft landing" for the US economy, which means that GDP growth is expected to drop to 3 per cent, at the same time as the inflation rate slows down. It is also assumed that this adaptation can be made without requiring any major raises in the key rate by the US Federal Reserve.
Most analysts have consistently underestimated the strength of the US economy in recent years and it is difficult to assess the extent of, and the point of time for, a possible economic slowdown. A permanent or persistent long-term change on the supply side of the economy could lead to a more favourable development than forecast. One of the most central issues in this context is whether or not the strong growth in productivity in recent years, which has contributed to such things as dampened inflationary pressure, constitutes a trend shift.
Diagram 2.3 Productivity growth in the United States
Although there is great uncertainty over the improved developments in the United States, the favourable developments in recent years indicate that the long-term growth in productivity has increased slightly. Diagram 2.3 shows how the growth in productivity has accelerated since 1995. Nevertheless, it is difficult to determine unequivocally how this will affect developments in the future and it cannot be ruled out that a continued strong productivity growth and a higher potential GDP growth would lead to the US economy growing at a faster rate than forecast, without the inflation rate accelerating.
On the other hand, if an economic slowdown is non-forthcoming, this would increase the risk of more significant rises in key interest rates than has been assumed, which could lead to weaker economic activity, particularly next year. In combination with the large deficit in the current account balance, the strong dollar and the highly valued share prices, this comprises a considerable uncertainty factor. However, the largest single risk in this context is probably significantly rising labour costs as a
22
result of the strained situation in the labour market. There is also a possibility that the favourable development in productivity, by driving profit expectations and share prices upwards, will in the short term contribute to a continued growth in domestic demand that would exceed the potential of the economy.
2.3 Developments in Asia and Latin America
Japan
Growth in Japan has been weak during the whole of the 1990s, which resulted in large budget deficits, a rapidly growing central government debt, record high unemployment and several years of deflation. The fiscal policy stimulus programmes presented so far have not yet succeeded in contributing to the creation of durable positive effects on growth.
However, there are now signs that a recovery is ahead. During the forecast period, GDP is expected to rise to higher levels than in recent years, although no major rise is forecast. The underlying problems are still assessed to be considerable, which is expected to hold back growth. In total, GDP is expected to rise by 1.2 per cent this year and 1.4 per cent in 2001.
The outcome for the first six months of the year confirms a continued positive development in the corporate sector, with strong industrial output, increased investment and rising profits. The driving force behind production is the strong growth in exports, particularly to the rest of Asia. This brighter picture is confirmed in the latest quarterly Tankan Report, which shows that firms' expectations for the future are continuing to improve.
However, the increased economic activity is not reflected as clearly in the domestic areas of the economy. There is as yet no sign of a durable recovery in household demand. The willingness to consume is dampened by the continued high unemployment rate and the subdued development of household incomes. The record high unemployment is partly the result of restructuring in the corporate sector. Unemployment is expected to remain high over the next few years, as Japanese firms are expected to continue their rationalisation process. According to the latest Tankan Report, a large percentage of company management claim they still have a large surplus of labour.
With regard to fiscal policy, the Japanese government has indicated that further stimulus programmes cannot be ruled out if the recovery does not appear to be self-supporting towards the end of the year. The Bank of Japan, which has pursued a zero interest rate policy since February 1999, with the aim of stimulating the economy, decided in August to raise the overnight call rate to 0.25 per cent. However, there are as yet no clear signs that deflation is about to come to an end. It is anticipated that deflation will continue during 2000, with a slight upswing in prices expected in 2001.
The recovery is thus still fragile and subject to a number of risks. These include the rapidly growing central government debt, which is estimated to be higher than that of any other OECD country this year, and a budget deficit of 6-7 per cent of GDP.
The rest of Asia
Following a strong recovery last year, growth is expected to strengthen further this year. The recovery has so far mainly been driven by exports, but is expected to become broader and more balanced. In most Asian countries, growth is expected to be driven by a strong domestic demand, while the contribution from net exports will decline slightly. It is assumed that inflation will develop moderately in the region over the next few years and thus leave scope for a continued looser monetary policy. The restructuring of the finance and corporate sector is continuing, but still comprises a downside risk. For the region as a whole, GDP growth is expected to amount to approximately 6.5 per cent this year and just over 6 per cent in 2001.
23
Latin America
The countries of Latin America are in different phases of economic activity. Domestic demand is expected to provide a greater contribution to growth, which has been export-driven until now. The risks concerning the forecast for Latin America are mainly connected to the US economy and possible consequences on the financial markets with ensuing higher interest rates. During 2000, all countries are expected to show a positive growth rate and for the region as a whole, growth this year is expected to amount to 4 per cent and to increase slightly next year.
2.4 Developments in Russia, Poland and the Baltic States
Russia
The Russian economy showed a recovery during 1999, growing by just over 3 per cent. Prospects for the next few years are bright, although there is still considerable uncertainty. The government's ambitious reform programme to promote growth through measures such as a tax reform, privatisation, deregulation and an improved climate for investment, supports continued expansion. It is anticipated that growth will amount to 6 per cent this year and 5 per cent next year. This outlook can change rapidly in the event of a heavy fall in energy prices.
Poland
Despite subdued economic activity following the crisis in Russia, the Polish economy grew by approximately 4 per cent in 1999. The decline was counteracted by stable domestic demand and a continued large inflow of foreign direct investment. With the support of the strong European economic activity and an ambitious reform policy, Polish GDP growth is estimated to amount to approximately 5 per cent both this year and next year. Risks include the large deficit in the current account balance.
The Baltic States
The economies of Estonia, Latvia and Lithuania are all in a phase of recovery, following the crisis in Russia. Although Latvia was the only Baltic State to show a positive growth in GDP in 1999, the economic recovery should be strongest in Estonia. In all, growth in the Baltic States is estimated to amount to approximately 3.5 per cent this year and around 4.5 per cent next year.
2.5 Swedish world market growth
The strong international economic activity means that the conditions for Swedish exports have improved. World market growth, which is a trade-weighted average of the import growth of processed goods in Sweden's export markets, is expected to increase from 5.5 per cent in 1999 to 10.1 per cent this year, thereafter slowing down to 8.6 per cent in 2001.
24
The development of oil prices
Following the significant fall in oil prices in the aftermath of the Asian crisis, oil prices have risen significantly—from approximately USD 10 per barrel at the beginning of 1999, to more than USD 30 per barrel.
There are several explanations for this price rise. Following the decline in demand for oil after the Asian crisis and the financial crisis at the end of 1998, the OPEC countries and other oil producers made significant production cutbacks. Despite the recovery in global growth during the second half of 1999 and during the first half of this year, which significantly increased the demand for oil, production was not completely adapted to the new conditions. It is only this year that production has exceeded the levels from 1998. This development can also be explained by the fact that the production capacity in most OPEC countries is currently insufficient. In practice, only Saudi Arabia has the capacity to increase its production significantly and rapidly. In addition, there is uncertainty over the capabilities of oil producers outside of OPEC to increase their production.
At the same time as the supply has been limited, almost all regions in the global economy are now showing a rapid growth concurrently, for the first time in more than a decade. The clear recovery in global growth has led to demand for oil increasing significantly. Demand has been particularly strong in the United States.
In all, the combination of a low supply of oil and a continued strong global demand has led to the world market price for oil rising to levels not seen since the end of 1990, in connection with the Iraq and Kuwait crisis.
The rapid rise in oil prices comprises an uncertainty factor for assessing the world economy in the future. The effects of the increase in oil prices cannot solely be attributed to the actual rise, but also to the great volatility in price developments.
To begin with, the effects of the rising oil prices were mainly observed in rapidly rising import prices. Oil price increases will make a gradual impact, with some time lag, in the form of higher prices on products in which oil is an important component. Rising oil prices have also had a more clear impact on, for instance, producer prices during the spring. In addition, the rise has had an effect on consumer prices during the spring. In the euro zone, for instance, the inflation rate (according to the harmonised CPI) amounted to 2.4 per cent in July. The underlying inflation rate, i.e. adjusted for the effects of changes in prices on energy and foods, amounted at the same time to approximately 1.3 per cent. The difference between these two measures is largely explained by the rate of energy price increases, which amounted to 14 per cent in July, measured on an annual basis. Despite the fact that energy prices have risen strongly, inflation expectations have remained low.
Rising oil prices can have several effects with differing time lags. The direct effect is an increase in price levels. If this increase is considerable, there is a risk in the short term that domestic demand will become subdued, in that real wages and company profits may develop more weakly. However, of equal importance for the effects on the economy is whether both inflation expectations and the inflation rate are affected in the long term. In this case, it may become necessary to tighten economic policy, particularly monetary policy.
The negative effects of the higher oil prices will be dampened, however, by the fact that dependence on oil has declined significantly since, for instance, the 1970s. Another factor that reduces the negative effects is that oil prices in real terms, despite the rise, are not at a high level from a historical perspective. In the United States, for instance, the real price is currently around one third of what it was during the oil crisis in 1979-80.
It is anticipated in the forecast that domestic demand will be subdued slightly as a result of the high oil prices. If oil prices remain high, or rise even further, with everything else remaining the same, they will lead to a weaker GDP growth and higher inflation rate in both Sweden and abroad than that currently forecast.
The forecast assumes that the world market price for crude oil (Brent oil from the North Sea) will amount to USD 26 per barrel at the end of this year and USD 24 at the end of 2001.
25
3 Capital markets
It has so far been possible to combine the strong global economic growth with a low international inflationary pressure. Increased international competition, deregulation on several markets, the clearer orientation of general economic policy towards price stability and a more balanced development of public finances are factors that have created conditions for historically low interest rates.
Global bond yields rose sharply in 1999, when the central banks in almost all of the industrial countries adopted a less expansionary monetary policy stance. The raises in key rates have continued this year, while there has been a decline in long-term interest rates. The ten-year government bond yield has fallen by approximately 0.75 percentage points since the beginning of the year, reflecting, for example, signs of an economic slowdown in the United States. The US Federal Reserve is expected to raise its key rate to 6.75 per cent at the end of this year and then to gradually ease its monetary policy. The European Central Bank, ECB, is expected to raise its key rate by a further 0.25 percentage points this year and by the same amount in 2001.
Share prices have developed more slowly this year, both in the United States and globally. The technology sector in particular experienced a clear price correction during the spring. Since then, developments have been relatively stable. The euro has weakened further against the US dollar and in trade-weighted terms. There has still been tremendous interest from international investors in US assets. The euro is assessed to have the potential to strengthen against the dollar. At the end of the year, the exchange rate is anticipated to be USD 0.95 per euro.
In Sweden, monetary policy has become less expansionary as the stronger economic growth has gradually led to increased utilisation of the available resources in the economy. The repo rate currently amounts to 3.75 per cent. Long-term interest rates have fallen over the year and in May and June the interest rate for ten-year Swedish government bonds was even lower than the German equivalent. The Riksbank is expected to raise its rate to 4.25 per cent this year and by a further 0.5 percentage points next year. The Swedish krona has strengthened against the euro over the past year, while it has weakened against the dollar and shown a relatively stable development against the trade-weighted TCW index. It is estimated that the Swedish krona can strengthen against the TCW, to 119 in the long term, and can develop in a relatively stable manner against the euro.
3.1 United States
The US economy has continued to develop very strongly. Rising real interest rates and increased inflation expectations contributed to a sharp rise in long-term market interest rates in 1999.
Diagram 3.1 Ten-year government bond yields
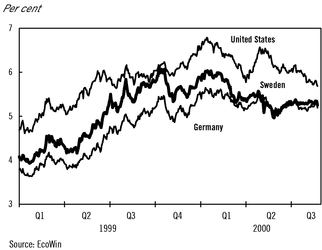
26
US statistics presented in recent months have indicated to some extent that economic growth is on the verge of slowing down, although it is still at a high rate. Inflationary risks, such as from the tight labour market, appear to be partially counteracted by a continued increase in productivity growth. The market has reappraised the risks inherent in the strong growth in demand. The conditions for a gradual slowing down of the US economy appear to be greater now than previously. The tighter monetary policy, together with a more subdued development on the stock exchanges, may have contributed to this development. The Federal Reserve has raised its key rate by a total of 1.75 percentage points during 1999 and 2000, most recently in May by 0.5 percentage points.
The view of monetary policy has clearly changed since the late spring. At that point, the US Federal Reserve was expected to raise the key rate relatively substantially to counteract inflationary risks in the economy. Now, market interest rates generally indicate an unchanged key rate for the coming year.
The signals indicating a slowdown and the reduced supply of Treasury bonds, connected with the strong public finances, have contributed to lower Treasury bond yields over the year. In May, the long-term trend in rising yields on corporate bonds was also broken. Since then the credit spread, i.e. the interest rate differential between, for instance, corporate and treasury bonds, has declined slightly. However, this reduction has taken place from historically high levels. There are sound reasons for assuming the credit spread to be a good indicator of how market players perceive the economic situation, partly as the private demand for credit can be expected to depend on the development of economic activity.
Diagram 3.2 US corporate yield spread, 30 years
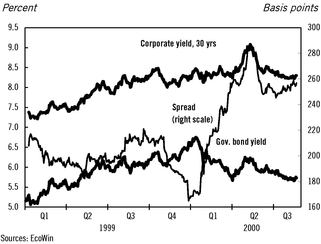
The willingness of the rest of the world to finance the record high and still growing deficit in the US current account balance has led to a strong appreciation of the dollar in recent years. In trade-weighted terms, the dollar has strengthened by just over 10 per cent since the beginning of the year. It appears that interest in investing in the "new economy' is still strong. This is indicated by current statistics showing a capital flow in the form of direct investments in and purchases of portfolio shares in the United States. Cyclical factors, such as the historically high growth rate in the United States and the tighter monetary policy, together with structural factors, such as the high US productivity growth, have contributed to the stronger dollar. The correction by the US technology-dominated NASDAQ Stock Market in the spring could not break the trend.
The NASDAQ Stock Market has experienced a dramatic development over the past year. Following a sharp rise beginning in the fourth quarter of 1999, there was a clear correction of the highly valued technology shares during spring 2000. This led to the NASDAQ Composite Index falling by approximately 35 per cent over the course of a few weeks. Since then, developments have stabilised. The New York Stock Exchange, according to indices such as the Dow Jones and Wilshire 5000, has
27
shown a more even development. The current levels on both the NASDAQ Composite Index and the Dow Jones Index are largely the same as they were at the beginning of the year.
Diagram 3.3 Stock exchange developments
3.2 Euro zone
Growth in the euro zone has gained a real impetus. Inflation has gradually risen over the past year and on several occasions has passed the ECB's ceiling of 2 per cent. Monetary conditions have been expansionary, with a high money supply and credit growth and a weakened euro, both in nominal terms and real terms. The money supply has continued to grow more rapidly than the ECB's reference value of 4.5 per cent. Against this background, the ECB has raised its key rate by a total of 2 percentage points over the past year—most of the increases have taken place during 2000. Market interest rates indicate that the central bank is expected to raise its key rate further in the near future. Long-term interest rates have fallen somewhat over the year. However, the decline has not been as obvious here as in the United States. The interest rate differential between the euro zone and the United States on ten-year government bonds has declined considerably. The current interest rate gap is approximately 0.5 percentage points.
The euro has continued to weaken over the year. Since the start of the year, the euro has lost approximately one-quarter of its value against the dollar and has lain at around USD 0.90 per euro during August and early September. In trade-weighted terms, the euro has weakened by almost 20 per cent in both nominal and real terms since its introduction. There are several fundamental explanations for the weakness of the euro, particularly against the dollar, some of which have been mentioned above. Statistics from the ECB indicate an extensive outflow of capital in the form of direct investment and portfolio investment during the first six months of this year. There is much to suggest a long-term appreciation of the euro in the future, but there is great uncertainty as to the extent of this appreciation.
28
Diagram 3.4 The US dollar against the Euro
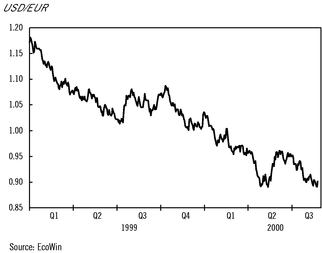
3.3 Japan
Monetary policy in Japan has been aimed at keeping short-term interest rates as low as possible, to counteract the risk of rising deflationary pressure and to prevent a deterioration in economic development. In August, the Bank of Japan decided to raise its key rate to 0.25 per cent, thus abandoning the 18-month old "zero interest rate policy'. Japanese monetary policy can still be designated as expansionary. Further moderate raises in the key rate have been discounted in the market interest rates. The Japanese yen has followed a trend of strengthening against both the euro and the dollar over the past two years. This appreciation amounts to approximately 40 per cent against the euro and 25 per cent against the dollar. The yen exchange rate against the dollar has stabilised somewhat over the past year, however, fluctuating between 100 and 110 yen per dollar.
3.4 Sweden
Sweden's economy is showing a high level of growth, with rising employment and falling unemployment. Household expectations regarding the development of their own private economy and of the Swedish economy are very positive. As yet there is no general shortage of capacity, although in some areas there are signs of a more strained utilisation of resources. Inflation is still low and inflation expectations, although they have risen, are in line with the Riksbank's inflation target for up to two years ahead. The favourable inflation prospects and the moderate interest rates reflect strong confidence in the price stability policy, the fact that there are still available resources in the economy, falling prices as a result of deregulation and increased international price competition. Despite the strong level of economic activity, Swedish long-term interest rates have fallen over the year.
29
Diagram 3.5 10 year interest rate differential against Germany
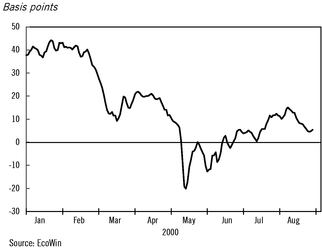
The monetary policy stance has become less expansionary over the past year. The Riksbank has raised the repo rate by a total of 0.85 percentage points to 3.75 per cent, with reference to, for example, the strong rise in economic activity and a gradual rise in price pressure. The most recent increase in the repo rate was in February this year. In its latest Inflation Report, the Riksbank estimated that underlying inflation would be below 2 per cent for the greater part of the forecast period and that the inflation target would be achieved over a two-year period.
Restructuring of public finances and confidence in the low inflation policy have contributed to the gap between Swedish and German bond yields, which was just over 4 percentage points five years ago, gradually being erased. Today there is no clear inflation premium or risk premium on Swedish interest-bearing assets. The partial privatization of Telia during the spring enabled the Swedish National Debt Office to implement extensive buybacks of bonds. In total, the Debt Office bought government bonds to a value of SEK 30 billion during May and June. During the buyback period, Swedish bond yields fell below German yields. The interest rate for ten-year Swedish government bonds has lain at scarcely a tenth of a percentage point above the German rate in August and September. There are good prospects for continued low long-term interest rates.
Diagram 3.6 The Krona against the Euro and a weighted average of currencies
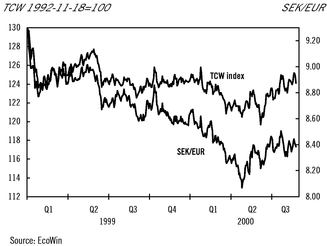
The Swedish krona has gradually strengthened against the euro since the beginning of 1999, while it has weakened against the dollar and shown a relatively stable development against the TCW. The strengthening of the Swedish krona against the euro has amounted to just over 10 per cent during this period. Over the past month one euro has cost around SEK 8.40 and the TCW index has fluctuated
30
around 124. In connection with the sale of Telia shares, the Swedish krona strengthened temporarily in the early summer to 8.10 against the euro and to 120 against the TCW index. The appreciation against the euro is probably due to a combination of relatively favourable growth prospects, low inflationary pressure, a surplus in the current account balance and an interest among international investors in buying Swedish assets, particularly in IT-related sectors. One expression of the latter has been the Swedish krona's sensitivity to fluctuations on the Stockholm Stock Exchange.
There is some correlation between developments on the Stockholm Stock Exchange and the technology-dominated US NASDAQ Stock Market. The Stockholm Stock Exchange rose sharply in autumn 1999 and fell in spring 2000. Following the spring price correction, developments have stabilised. The General Index has risen by approximately 5 per cent since the beginning of the year.
Table 3.1 Balance of payments
Flows, SEK billions
| | 1999
| | 2000(1)
|
|---|
| Current account | | 48.9 | | 19.0 |
| Capital transfers | | -18.0 | | 3.3 |
| Financial account | | -28.3 | | -36.2 |
| | Direct investments | | 336.4 | (2) | -61.7 |
| | Portfolio investments | | -295.0 | (2) | -65.0 |
| | | Debt securities | | -11.0 | | -195.8 |
| | | | Swedish | | 46.7 | | -108.4 |
| | | | Foreign | | -57.7 | | -87.4 |
| | | Equities | | -283.9 | | 130.7 |
| | | | Swedish | | -32.8 | | 136.7 |
| | | | Foreign | | -251.1 | | -6.0 |
| | Financial derivatives | | 0.5 | | 10.1 |
| | Other investments | | -53.5 | | 75.6 |
| | Reserve assets | | -16.7 | | 4.8 |
| Net errors and omissions | | -2.6 | | 13.9 |
- (1)
- Until June
- (2)
- The mergers between Astra and Zeneca and Ford and Volvo PV account for most part.
Source: Riksbank
The current account balance showed a surplus in both 1999 and the first six months of 2000. The balances from the current account and capital transfers correspond by definition to the balance of the financial accounts so that the balance of payments totals zero. Foreign exchange outflow as a result of direct investment and portfolio investment was relatively large during 1999. These flows are mainly due to the merger between Astra and Zeneca and Ford's acquisition of Volvo Personvagnar. Historically, the total of the current account balance, capital transfers, direct investment and portfolio shares has shown some correlation with the development of the Swedish krona. During 1999 and the first six months of 2000, this measure generated an inflow of SEK 83 billion and SEK 91 billion respectively.
3.5 Interest and exchange rate assumptions
It is assessed that the US Federal Reserve will be able to refrain from further sharp raises in the key interest rate. The bank is expected to raise its key rate by a further 0.25 percentage points to 6.75 per cent at the end of this year and thereafter to gradually ease its monetary policy in pace with the forecast slowdown in economic activity. The ten-year government bond rate is expected to amount to 6 per cent at the end of this year and then fall slightly next year.
31
The stronger economic growth in the euro zone, rising inflationary pressure and continuing expansionary monetary conditions are expected to contribute to interest rate rises in the euro zone. The ECB is assumed to raise its key rate by a further 0.25 percentage points this year and by the same amount next year. The long-term euro yields are expected to lie immediately above the current levels at the end of the year, when the ten-year government bond yield is assumed to be 5.3 per cent. The foreseen stabilisation of US interest rates is assumed to have a moderating effect on euro interest rates in the future.
The euro is judged to be undervalued and to have the potential to strengthen against the dollar in the light of the foreseen economic slowdown in the United States and a shrinking growth and interest rate gap between the regions. At the end of 2000, the euro exchange rate against the dollar is expected to be 0.95. After this, the euro is expected to continue to strengthen.
The strong confidence in the low inflation policy, restrained wage increases and the lower inflationary tendencies are expected to contribute to continued low interest rates in Sweden. The strong Swedish growth and a gradually increased utilisation of available resources motivate a less expansionary monetary policy in the future. The Riksbank is expected to raise its key rate by 0.5 percentage points in the autumn, to 4.25 per cent, and by a further 0.5 percentage points next year. In the medium-range perspective, the repo rate is expected to lie at 4.5 per cent. This is compatible with a short-term real interest rate of 2-3 per cent and inflation expectations in line with the Riksbank's inflation target. Long-term interest rates are expected to remain around the current level for the rest of the year. At the end of this year, the interest rate for ten-year Swedish government bonds is expected to be 5.4 per cent. The interest rate gap against Germany is expected to lie around 0.1 percentage points at the end of this year and 0.2 percentage points at the end of next year.
Confidence in the Swedish economy, together with a currently undervalued Swedish krona, are assumed to lead to a strengthening of the krona to 119 in terms of the TCW, in a medium-range perspective. It is assessed that the Swedish krona will show a relatively stable development against the euro over the next few years. At the end of this year, the exchange rate is expected to lie around 8.40 and in the longer term it is expected to be around 8.60. The appreciation against the TCW is expected to be mainly brought about by the depreciation of the dollar against the euro. However, given the underlying strength of the US economy, this depreciation is predicted to be slightly less than forecast in the Government Spring Bill.
Table 3.2 Interest and exchange rate assumptions
Final entry for each year
| | 1999
| | 2000
| | 2001
| | 2002
| | 2003
|
|---|
| Repo rate | | 3.25 | | 4.25 | | 4.75 | | 4.5 | | 4.5 |
| 6-mth interest rate | | 3.7 | | 4.5 | | 4.7 | | 4.6 | | 4.6 |
| 5-year interest rate | | 5.3 | | 5.3 | | 5.2 | | 5.0 | | 5.0 |
| 10-year interest rate | | 5.6 | | 5.4 | | 5.4 | | 5.2 | | 5.2 |
| Spread SEK-DEM, 10 yr | | 0.4 | | 0.1 | | 0.2 | | 0.2 | | 0.2 |
| 6-mth DEM EURIBOR | | 3.5 | | 5.0 | | 4.8 | | 4.6 | | 4.6 |
| TCW index | | 124 | | 123 | | 121 | | 120 | | 119 |
| SEK/USD | | 8.5 | | 8.8 | | 8.1 | | 7.8 | | 7.5 |
| SEK/EUR | | 8.6 | | 8.4 | | 8.5 | | 8.6 | | 8.6 |
Sources: Riksbank and Ministry of Finance
32
4 Foreign trade
The international demand for Swedish export goods is predicted to be very favourable during the entire forecast period. Last year's growth in exports of just over 5 per cent could mainly be attributed to a very expansionary development in the telecommunication equipment industry. In the near future, it is anticipated that traditional and more cyclically sensitive industries will also benefit from the strong global growth. The expedient product orientation and an initially favourable relative price situation will contribute to the export industry continuing to increase its share of the world market for processed goods. Total exports of goods are estimated to increase by 10.7 per cent this year and by 7.9 per cent next year. In the medium term, the assumption of a gradual appreciation of the krona will slightly impair competitiveness. Consequently, Swedish exports are anticipated to increase at a slower rate than international demand.
During 1999, the growth in imports slowed down, which may represent a return to a more long-range development following the strong increases in imports of goods in 1997 and 1998. Growth in imports of goods is expected to accelerate in the future since household consumption and exports are developing favourably. Imports of goods are expected to increase by 9 per cent this year and by 7.4 per cent next year.
Despite the relatively weak growth in exports, trade in goods provided a positive contribution to GDP growth last year. This year, the contribution will rise to 1.2 percentage points as a result of the strong international demand, and next year the contribution will amount to 0.8 percentage points. The total contribution from foreign trade will be lower, however, as trade in services will make a negative contribution to growth of 0.3 per cent and 0.2 per cent respectively for the forecast years.
The current account is estimated to show a surplus that will gradually rise from 2.6 per cent of GDP this year to 4.2 per cent in the year 2003. General government sector net lending will contribute considerably to the continued surplus, which is necessary to reduce the foreign debt.
4.1 Exports of goods
Last year, the demand for most Swedish export goods was considerably weaker than in 1998. Industrial activity was subdued in several countries in the important European market, which had a severe effect on traditional Swedish engineering and base industry. Exports of telecommunication equipment continued to develop very strongly, however, and contributed 4 percentage points of the total growth in exports of goods amounting to 5.2 per cent. Telecommunication equipment has expanded over the last ten years, with these products increasing from around 5 per cent of the total goods exported to around 15 per cent. The sector has expanded particularly rapidly during the latter half of the 1990s. As exports of telecommunication equipment mainly comprise large deliveries of mobile systems to individual countries, the industry's dominance last year meant that export growth differed between markets. For instance, exports to countries such as the United States, Spain and Japan increased, and there was a significant rise in deliveries of telecommunication equipment to these countries.
The prospects of a stronger and broader international growth in demand this year and next year are significantly brighter, with regard to both countries and categories of goods. In Europe, the differences in growth between the countries are expected to decline as economic activity becomes stronger in several of Sweden's larger trading partners, such as Germany. It is primarily a change in the level of industrial and export activity that will contribute to the upturn in the euro zone. In Asia and Latin America, the earlier export-driven growth is expected to instead be driven to a greater extent by domestic demand. Developments in the United States continue to be strong, although a slight slowdown is foreseen for the next few years. In Japan, there has been a rapid growth in imports, despite the fact that a clear recovery is not yet underway. Among Sweden's major trading partners, virtually only Norway and Denmark, which together account for just over 13 per cent of Swedish
33
exports of goods, are expected to show a weak increase in demand. In total, the world market, i.e. imports of processed goods on Swedish export markets, is expected to increase by 10.1 per cent this year and by 8.6 per cent next year. This is a significantly stronger development in demand than last year, when market growth was estimated at around 5.5 per cent.
Table 4.1 Exports and imports of goods and services
| | SEK,
billion
| | Percentage change in volume
| | Percentage change in price
|
|---|
| | 1999
| | 1999
| | 2000
| | 2001
| | 2002
| | 2003
| | 1999
| | 2000
| | 2001
| | 2002
| | 2003
|
|---|
| Exports of Goods | | 700 | | 5.2 | | 10.7 | | 7.9 | | 6.0 | | 5.8 | | -1.4 | | 1.8 | | 0.1 | | -0.1 | | 0.3 |
| | Processed goods(1) | | 613 | | 6.1 | | 11.6 | | 8.8 | | 6.3 | | 6.0 | | -1.9 | | -0.2 | | 0.2 | | 0.2 | | 0.5 |
| Exports of services | | 163 | | 5.3 | | 6.0 | | 6.8 | | 5.5 | | 5.3 | | 1.1 | | 3.5 | | 2.0 | | 0.8 | | 0.8 |
| Total exports | | 863 | | 5.2 | | 9.8 | | 7.7 | | 5.9 | | 5.7 | | -0.9 | | 2.1 | | 0.4 | | 0.0 | | 0.4 |
| Imports of goods | | 568 | | 4.4 | | 9.0 | | 7.4 | | 5.9 | | 5.7 | | 1.1 | | 4.0 | | -1.8 | | -0.4 | | 0.2 |
| | Processed goods(1) | | 468 | | 5.5 | | 10.2 | | 8.3 | | 6.0 | | 5.8 | | -0.3 | | 0.1 | | -0.4 | | 0.2 | | 0.4 |
| Imports of services | | 186 | | 6.8 | | 8.5 | | 8.1 | | 6.5 | | 6.3 | | 2.0 | | 2.2 | | 1.7 | | 0.6 | | 0.8 |
| Total imports | | 754 | | 5.0 | | 8.8 | | 7.5 | | 6.0 | | 5.9 | | 1.3 | | 3.6 | | -0.9 | | -0.2 | | 0.3 |
- (1)
- Exports and imports of processed goods are reported in accordance with SNI classifications
Sources: Statistics Sweden and Ministry of Finance
To a large extent, the high market growth is driven by a strong increase in demand for intermediate and investment goods in connection with the rise in industrial output and utilisation of resources in the rest of the world. As these goods comprise the majority of Swedish exports, the prospects of very strong Swedish industrial activity during the forecast years are good. It should also be added that Sweden's exports comprise a large percentage of telecommunication equipment, compared with other countries. Globally, growth in demand in this industry is expected to continue to be very strong.
The fact that Swedish industry benefits from the strong international demand and its composition is already clear from the latest statistics on exports of goods and the inflow of orders to industry. According to the preliminary National Accounts, exports of goods increased by an annual rate of 11.4 per cent during the first half of this year. Even though, according to the foreign trade statistics, the positive development largely applies to all categories of goods, the increase in exports has been most evident in telecommunication equipment, where exports increased by 28 per cent in current prices during the first five months of this year, compared with the same period last year. Growth in cyclically sensitive industries, such as the automotive, paper, pulp and steel industries, has lain at around 20 per cent. It may be worth noting that exports of pharmaceuticals, which made a significant contribution to export growth last year, actually fell. During the same period, export deliveries to Europe rose by 11 per cent in current prices, while they rose by 31 per cent to North America and by 40 per cent to Asia. The Asian market has thus begun to increase its percentage of Swedish exports again after a weak development in 1998 and at the beginning of 1999 (see Diagram 4.1). Processed goods, not including telecommunication equipment, was the category most affected by the fall in demand during the Asian crisis. Over the next few years, demand for these categories of goods is expected to strengthen once again, while the need to expand the infrastructure for telecommunications is assessed to remain considerable.
34
Diagram 4.1 Swedish exports to Asia
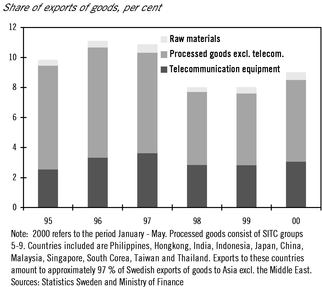
According to Statistics Sweden, the inflow of orders has increased considerably from most export markets during the spring. This indicates that exports of goods will continue to show a strong development over the next six months. This picture is confirmed in the National Institute of Economic Research's Business Tendency Survey for August, in which firms stated that they were satisfied with the size of their order books and that they expected to see the inflow of orders rise over the next few months.
The export industry has a favourable competitive position from the outset, as a result of the weak Swedish krona over the past years and a cost development in line with the rest of the world. International price pressure is currently moderate, but is assumed to rise as global economic activity strengthens. So far this year, Swedish export prices have shown a relatively strong recovery in prices for base industry products, while the development of prices on processed goods is considerably weaker. The telecommunication equipment industry is continuing to contribute to a subdued development in total export prices, as a result of the high growth in productivity and strong competition in the industry.
The Swedish krona is expected to appreciate during the forecast period. Nevertheless, Swedish prices on processed goods are expected to rise only slightly more rapidly than foreign prices, measured in a common currency. This assessment is based on both the restrained price expectations for the next few months expressed by firms in the Business Tendency Survey for Manufacturing, Construction and Retail Trade and on an anticipated weaker cost development than in competitor countries. The marginal increase in relative prices does not necessarily mean that competitiveness will deteriorate, as Sweden has a large percentage of base industry products among its exports, in relation to many other countries. The prices of these goods will rise significantly on the world market during the forecast period.
The favourable product orientation and the largely unchanged strong competitive position are expected to contribute to the export industry increasing its market shares with regard to processed goods, particularly this year, but also in 2001 (see Diagram 4.2). However, high order book levels and increasing delivery times in a number of industries may mean that prices will begin to rise more quickly than anticipated. A large part of the market share gains arise due to a continued strong expansion in the telecommunication equipment industry, which is expected to contribute almost half of the growth in exports of goods. Developments in this industry are thus a significant factor of uncertainty in the forecast. In all, exports of processed goods are estimated to rise by 11.6 per cent this year and by
35
8.8 per cent next year. After this, a continued appreciation of the krona is expected to contribute to exports of processed goods growing more slowly than international demand.
Diagram 4.2 Exports of processed goods
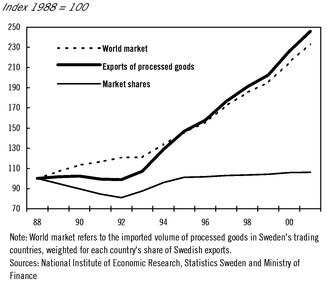
Exports of raw materials will benefit from the strong economic activity in the rest of the world during 2000 and 2001. However, capacity restrictions in certain base industries may limit the growth potential somewhat, particularly next year. Exports of raw materials are thus expected to increase by around 4 per cent this year and just under 2 per cent next year.
4.2 Imports of goods
During 1999, imports of goods increased by 4.4 per cent, which was a considerably weaker rate of increase than in 1997 and 1998. Historically, years with a low import growth have usually coincided with years when demand components with a high import content, such as exports, investment and household consumption, have developed weakly. This makes last year's relatively low outcome rather surprising, given the strong development in household consumption and investment, even though exports showed a weak development. The special tax regulations introduced in 1998, which enabled firms to offer employees very favourable deals on PCs, led to a strong increase in computer imports in 1998. During 1999, these imports fell considerably.
The slightly lower growth rate for imports of goods in 1999 probably means that it returned to a more long-range development trend following the strong years of 1997 and 1998. In a long-term perspective, the percentage of GDP constituted by imports of goods will show a continuous increase as a result of globalisation and trade specialisation.
The adaptation to the long-term development trend is estimated to be completed and at the beginning of this year, imports of goods have increased significantly in relation to the same period in last year. In addition, the rate of increase for the components of demand with a high import content has accelerated. Imports of engineering products have increased the most, with electronic goods and computers accounting for a large part of this increase. Import growth is expected to continue to develop strongly during the remainder of 2000 and in 2001, when the rate of increase for the import-intensive areas of demand will be high. Consumption of durable goods, which have a high import content, is expected to show strong growth this year and next year. During the forecast period, export growth is predicted to accelerate and broaden to cover most industries. Investment in machinery is expected to continue to increase at a good rate, which is a further indication of increased imports of
36
goods in the near future. In addition, the low import prices are expected to continue to favour imports of goods. It is estimated that imports of goods will rise by 9.0 per cent in 2000 and by 7.4 per cent in 2001. In a medium-range perspective, imports are expected to increase in accordance with the long-term rate of increase and imports of goods to grow by almost 6 per cent annually. This is in line with how exports, investment and household consumption expenditure develop.
Import prices on energy-related products rose significantly last year and have continued to increase this year. Large price rises on oil will cause an overall rise in import prices and it will become more expensive to import, at the same time as cost pressure will increase. A decline in prices is expected in the future, where the world market price of crude oil (Brent oil from the North Sea) is estimated to fall to USD 26 per barrel at the end of the year 2000 and to USD 24 per barrel at the end of 2001. As a result of the low price levels during the first six months of 1999, oil prices as an annual average are anticipated to rise substantially this year, and to fall next year. The expected fall in oil prices, together with a weakening of the Swedish krona against the US dollar this year and a strengthening next year, are expected to lead to import prices on energy-related products rising substantially this year and falling next year. However, there is considerable uncertainty as to how oil prices will develop in the near future and thus how import prices on energy-related products will change (see explanatory box in Chapter 2).
International prices on goods have risen during the beginning of this year and are expected to continue to rise as international economic activity strengthens. At the beginning of the year, the Swedish krona appreciated and import prices on goods, with the exception of energy-related goods, fell. During the remainder of this year, the krona is expected to appreciate. In all, import prices on goods are expected to increase slightly this year and to decline next year, when a stronger appreciation of the krona is expected to counteract the international price rises, which will stimulate growth in imports.
4.3 Trade in services
For several years now, trade in services with other countries has provided a negative contribution to GDP growth, which is also expected to be the case during the forecast years. The main factor behind this development is growing imports of travel currency, an item which not only includes Swedish travellers' expenditure abroad, but also direct imports of cars and post order purchases, e.g. via the Internet, by private persons. This increase can be attributed above all to the considerable strengthening of household finances, following the crisis in the early 1990s. Trade in services such as marketing, accounting, insurance and financial services is estimated to increase relatively rapidly on both the export and import side as economic activity strengthens in both Sweden and the rest of the world. Foreign trade in these services should also rise in connection with increased integration and technological developments. Transport services have shown a weak development for several years now. Exports of transport services are expected to remain largely unchanged over the next few years, while imports are expected to rise weakly. Transport prices are assumed to increase significantly in connection with the continued strengthening of economic activity. Price developments for travel currency and other services are associated with inflation, exchange rate fluctuations and wage increases in Sweden and the rest of the world.
4.4 Current account balance
For the sixth year in a row, net lending in Sweden was positive in 1999. The surplus amounted to 1.6 per cent of GDP. Factors contributing to the strong current account balance in recent years include the positive net lending in the general government sector and a strong growth in exports as a result of the weak krona and a successful telecommunication equipment sector. The strong purchasing power of households and rising gross capital formation have not yet resulted in an increase in imports sufficiently strong to dampen the surplus in the trade balance, which is expected to amount to almost 7 per cent of GDP this year.
37
Table 4.2 Current account balance
SEK billion, unless otherwise stated
| | 1999
| | 2000
| | 2001
| | 2002
| | 2003
|
|---|
| Trade balance | | 130 | | 142 | | 171 | | 184 | | 197 |
| % of GDP | | 6.6 | | 6.9 | | 7.8 | | 8.1 | | 8.3 |
| | Exports of goods | | 704 | | 793 | | 857 | | 908 | | 964 |
| | Imports of goods | | 574 | | 651 | | 687 | | 724 | | 767 |
| Services balance | | -22 | | -27 | | -31 | | -35 | | -40 |
| | Transportation | | 7 | | 7 | | 7 | | — | | — |
| | Travel | | -32 | | -34 | | -37 | | — | | — |
| | Other services | | 2 | | 0 | | 1 | | — | | — |
| Wages | | -2 | | -2 | | -2 | | -2 | | -2 |
| Investment income | | -27 | | -30 | | -27 | | -25 | | -23 |
| Interest | | -56 | | -61 | | -59 | | -58 | | -57 |
| Direct investment | | 29 | | 31 | | 32 | | 33 | | 34 |
| Income on equity | | 1 | | 0 | | 0 | | 0 | | 0 |
| Current transfers | | -30 | | -30 | | -32 | | -32 | | -33 |
| | |
| |
| |
| |
| |
|
| Current account | | 49 | | 54 | | 78 | | 90 | | 99 |
| | |
| |
| |
| |
| |
|
| Capital account | | -18.0 | | 0 | | 0 | | 0 | | 0 |
| Net lending(1) | | 1.6 | | 2.6 | | 3.6 | | 4.0 | | 4.2 |
Note: The current and capital accounts are reported in accordance with Riksbank definitions.
- (1)
- Per cent of GDP. Net lending amounts to the sum of the current account balance and the capital account balance.
Sources: Riksbank and Ministry of Finance
During the forecast period, the surplus in the current account is estimated to rise further as a percentage of GDP in connection with a continued positive development in the trade balance and in investment income, which will more than compensate for the rising deficit in trade in services and in transfers, which mainly consist of Sweden's EU contribution and aid to developing countries.
The development of trade in goods and services has been discussed in the respective sections above. The difference in level between the trade balance in 2000 and in 2001 is conditional upon oil prices developping as anticipated.
In connection with stronger economic activity both in Sweden and internationally, increased yields are anticipated for both Swedish firms with assets abroad and foreign companies with assets in Sweden. Assuming that these earnings will increase at the same rate in Sweden and abroad, the net yield on direct investments will rise during the forecast period, as Swedish assets abroad are greater than foreign assets in Sweden.
As a result of the positive development of the Stockholm Stock Exchange, foreign ownership of Swedish shares has risen and Sweden's net foreign debt has increased. This in turn has a negative effect on the component in the current account balance that concerns net dividends on portfolio shares. However, the continued positive net lending in Sweden is expected to come about partly in the form of increased ownership of portfolio shares abroad. One factor that may contribute to this development is the National Pension Fund's objective of increasing its exposure in foreign shares. Foreign investors' ownership of Swedish shares is not expected to increase to the same extent. This will lead to a marginal improvement in the yield on portfolio shares during the forecast period.
38
The deficit in net interest is expected to decline during the forecast period. One reason for this is that net lending and the sale of shares in Telia have enabled a reduction of the interest-bearing foreign debt. The anticipated appreciation of the krona also contributes to declining interest payments in the forecast, while the assessments made with regard to interest rate developments in Sweden and the rest of the world have the opposite effect.
Aid to developing countries and Sweden's net contribution to the EU, which are registered under current transfers and capital transfers, are connected to Sweden's gross national income (GNI). As a result of the rapid growth in the Swedish economy and the improvement in net investment income, GNI is expected to rise by 5.3 per cent in current prices this year and by 5.8 per cent next year. The size of Sweden's EU contribution is also affected by a number of other factors, such as the VAT base, which rises concurrently with consumption expenditure, and the expenditure level of the EU budget. Net payments to the EU are expected to amount to around SEK 12 billion this year and to around SEK 13 billion next year.
Table 4.3 Gross national income
SEK billion, current prices
| | 1999
| | 2000
| | 2001
| | 2002
| | 2003
|
|---|
| GDP | | 1972 | | 2067 | | 2183 | | 2271 | | 2365 |
| Primary income(1) | | -42 | | -36 | | -33 | | -28 | | -26 |
| | |
| |
| |
| |
| |
|
| GNI | | 1930 | | 2032 | | 2150 | | 2243 | | 2339 |
| | |
| |
| |
| |
| |
|
- (1)
- Investment income, wages, subsidies and taxes, net to the rest of the world.
Sources: Statistics Sweden and Ministry of Finance
39
5 Business sector output
Business sector output increased significantly during the first six months of this year. The increase corresponded to just over 5 per cent, when compared with the first six months of 1999. The rise in output was broad, comprising most business sectors.
Table 5.1 Business sector output
Percentage change in volume
| | 1998
| | 1999
| | 2000
| | 2001
| | 2002
| | 2003
|
|---|
| Agriculture, fisheries and forestry | | 0.7 | | -2.3 | | 1.5 | | 1.0 | | — | | — |
| Industry | | 4.3 | | 4.2 | | 6.6 | | 5.2 | | 3.0 | | 2.8 |
| Electricity, gas, thermal and hydropower | | 2.4 | | -0.5 | | -3.6 | | 0.0 | | — | | — |
| Construction | | 1.8 | | 5.9 | | 3.8 | | 6.5 | | — | | — |
| Business sector services | | 2.6 | | 4.9 | | 4.7 | | 3.5 | | — | | — |
| Total business sector | | 3.0 | | 4.4 | | 4.9 | | 4.0 | | 2.2 | | 2.3 |
Sources: Statistics Sweden and Ministry of Finance
The business sector is expected to show very strong economic activity up to the year 2001. As a result of certain capacity restrictions, however, the rate of increase will slow down somewhat next year. In spite of this, the growth in business sector output is estimated to amount to almost 5 per cent this year and next year.
An increase in demand from the European markets, as well as a continued strong expansion in the telecommunication equipment industry, will lead to a strong and widespread upturn in economic activity in the near future. Domestic demand is also expected to be considerable.
The economic situation in the private service sector is also assessed to be favourable during the greater part of the forecast period. The growth in output in the private service sector will be driven mainly by the rapid growth in household consumption. The growth of output in trade in goods will also be significant over the next few years. However, the strongest growth is expected to occur, as in previous years, in the corporate services sector, which will benefit from extensive investments in IT, as well as rising investment activity in the industrial sector. Next year, emerging bottlenecks are expected to dampen output growth in the service sector to some extent.
Construction activity is expected to develop strongly over the next few years, although the increase will mainly be concentrated to metropolitan areas. A strong increase in residential construction from a low starting level and a high rate of expansion in the business sector are expected to lead to considerable increases in output in this sector.
An assessment of the business cycle has not been made for the years 2002 and 2003. Output growth in the business sector is instead based on achieving a full utilisation of resources in the economy. The increase in output will therefore be slower, compared with the previous years and will follow a more normal rate of increase.
40
5.1 Industry
Table 5.2 Selected industrial statistics
Percentage change
| | 1998
| | 1999
| | 2000
| | 2001
|
|---|
| Industrial production | | 4.3 | | 4.2 | | 6.6 | | 5.2 |
| Hourly wage costs | | 4.0 | | 2.8 | | 3.5 | | 3.5 |
| Productivity | | 2.0 | | 2.9 | | 5.0 | | 4.5 |
| Unit labour costs (ULC) | | 2.0 | | -0.1 | | -1.4 | | -1.0 |
| ULC, 14 OECD-countries | | -0.1 | | -0.4 | | -0.7 | | 0.7 |
| ULC, 14 OECD-countries in SEK | | 2.3 | | 2.0 | | -2.2 | | -0.6 |
| Relative ULC, SEK | | -0.3 | | -2.1 | | 0.8 | | -0.3 |
| Profit margin, change | | -1.0 | | -0.6 | | 0.2 | | 0.6 |
| Gross operating surplus(1) | | 33.0 | | 31.8 | | 33.3 | | 35.0 |
- (1)
- Gross operating surplus refers to the share of value added at factor prices.
Sources: OECD, National Institute of Economic Research and Ministry of Finance
Despite the weak economic activity on some of Sweden's most important export markets, industrial output rose by just over 4 per cent last year, measured as an annual average. The main factor behind the rise was the continued expansion of the telecommunication equipment industry. Other industries that are by tradition more sensitive to cyclical fluctuations showed a weak development.
Production and productivity
Industrial activity has strengthened considerably this year. According to the National Accounts, industrial output rose by 6.5 per cent during the first half of this year. During the same period, the inflow of orders to industry rose by a good 15 per cent, compared with the corresponding six months in 1999. This rise is evident in both the export and domestic markets and the order situation has improved considerably in almost all parts of the industrial sector.
The improvement in economic activity is connected with a strengthening of the European economy, at the same time as growth in the Asian economies previously affected by the crisis has begun to gain strength. It is estimated that the industry-led rise in economic activity on the EU market will benefit Swedish industry, which is very specialised in investment goods. Rising domestic industrial investment will also contribute to a more rapid growth in output than last year. In addition, cyclical base industry is expected to develop favourably. In all, industrial output is expected to grow by almost 7 per cent this year. As during the latter part of the 1990s, the strong increase in output is dependent on the expansionary telecommunication equipment industry continuing to grow at a very rapid rate.
Next year, the growth in demand on the export markets is expected to subside somewhat in relation to the very high rate of increase this year. Taking into account the investment plans already known, production increases in base industry are expected to be limited by certain capacity restrictions. Production of export goods is therefore expected to increase at a slightly lower rate in 2001 than during 2000. At the same time, the growth in domestic consumption is also estimated to slow down slightly, which will mean that, in all, industrial output will rise by just over 5 per cent next year. The production increase in industry this year and next year will require much greater investment volumes in future in order to avoid bottlenecks.
According to the National Institute of Economic Research's Business Tendency Survey, capacity utilisation in industry has risen strongly from the end of last year up to the end of the second quarter this year. However, this statistic varies considerably, which makes it difficult to assess. An alternative measure of capacity utilisation is the capital ratio, which is estimated to fall further during the forecast
41
period, despite a strong expansion of the capital stock (see Chapter 10). This means that resource utilisation is expected to remain high for the entire forecast period.
During the years 2000 and 2001 a very rapid growth in productivity is forecast for industry. At the beginning of an economic upturn, labour productivity always rises when previously unutilised resources are put to use. In base industry, for instance, production may increase considerably without firms needing to recruit more employees. The most important explanation for the favourable development in productivity is, however, that the growth in both production and productivity in the telecommunication equipment industry is forecast to continue to be very rapid.
Diagram 5.1 shows that the extreme improvements in productivity in the telecommunication equipment industry constitute the most important explanation for the considerably more rapid growth in productivity in the industrial sector during the period 1993-1999 than during the 1980s. Growth in productivity in the telecommunication equipment industry amounted on average to just over 30 per cent per year between 1993 and 1999. Although this industry has now reached a certain level of maturity, the improvements to efficiency in the sector are expected to be considerable over the next few years. In addition, the very high level of productivity in the telecommunication equipment industry will contribute to the level of productivity in industry as a whole rising by almost 5 per cent per year during the forecast period.
Diagram 5.1 Growth in productivity
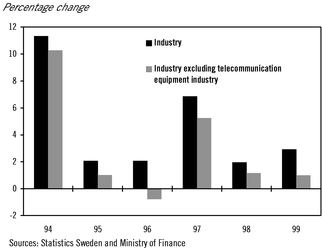
The ongoing structural transformation towards a more knowledge-intensive industry focused on telecommunication equipment, with the positive effects this has on growth in productivity, is the clearest sign of what is known as the 'new economy' in Sweden. A similar development has also occurred in the United States in recent years, with a rapid rise in productivity growth in industry as a result of a significant increase in production of IT-related goods.
With a rapid growth in productivity in industry, the increases in production are not expected to lead to any general shortage of labour during the forecast period. The total demand for recruitment within industry is therefore expected to remain moderate in the near future. However, there has been a discernible increase in the shortage of qualified labour over the past year. Increased recruitment problems are thus forecast for certain categories of personnel.
Competitiveness and profitability
Unit labour costs in industry have remained unchanged in recent years, both in Sweden and its competitor markets. The global overcapacity that arose in connection with the Asian crisis also gave rise to considerable pressure on prices, which led to extensive rationalisations. Historically low wage
42
increases and a good growth in productivity have also led to very modest price increases on industrial goods.
Diagram 5.2 Industry's labour costs per produced unit in Sweden compared with 14 OECD countries
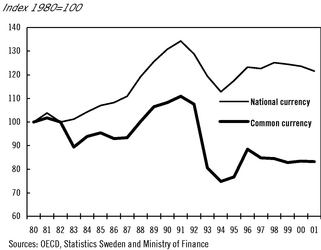
Swedish industry's favourable competitive position, which arose in connection with the depreciation of the krona in autumn 1992, is expected to be largely maintained until the year 2001, despite the fact that the krona is expected to strengthen by almost 3 per cent during the period. However, this development assumes that industrial wages in Sweden will increase by 3.5 per cent per year, which is the rate of increase in competitor countries, and that the growth in productivity will be slightly higher in Sweden than abroad. On this basis, the unit labour costs, i.e. labour costs per unit produced, are estimated to develop more favourably in Sweden than in competitor countries. However, there is considerable uncertainty regarding the development in productivity in other countries. The assessment that productivity can increase more rapidly in Sweden is largely based on the fact that Swedish industry is more oriented towards the production of new electrical equipment than the industrial sectors in other countries.
Industrial profitability, measured as operating surplus as a percentage of value added, fell further to just under 32 per cent last year. A low level of resource utilisation in most of the OECD countries led to the internationally defined prices falling in most industrial sectors. Base industry products showed a particularly weak price development, which had a negative effect on profitability in the Swedish industrial sector.
An international economic recovery began during the second half of last year and economic activity has increased so far this year. It has been possible to implement significant price increases on commodities over the past year, while prices on processed goods both in Sweden and abroad have shown a surprisingly weak development. As an increasing number of countries approach full utilisation of resources, international prices on processed goods are forecast to rise slightly more rapidly in the near future, although the rate of increase is still relatively low from a historical perspective. Next year, on the other hand, a more moderate rate of increase is anticipated for commodities prices. The currently very high prices for crude oil are expected to fall and thus approach a long-term equilibrium level towards the end of 2001.
According to the latest Business Tendency Survey from August, Swedish industrial firms are still announcing moderate price rises. For industry as a whole, product prices are estimated to rise on aggregate by just over 3 per cent this year, which means that Swedish industrial firms are keeping their prices in line with competitors' prices.
43
The cost of intermediate goods in industry is expected to increase by a good 4 per cent this year, which is due to considerable price rises on raw materials and, in particular, petroleum products. Limited wage increases and a favourable development in productivity could nevertheless lead to the increase in variable costs per unit produced being limited to just under 3 per cent. In all, profitability should thus improve slightly this year. Profitability in base industry will rise, while profit margins in other areas of the industrial sector will fall slightly.
Diagram 5.3 Industry's share of gross operating surplus
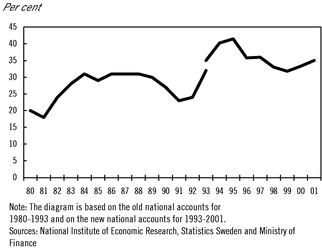
Next year, the Swedish krona is assumed to appreciate by a total of 1.5 per cent. Thanks to the stronger krona and falling oil prices, price rises on imports are expected to be very low. This, combined with a continued rapid growth in productivity and low wage increases, will mean that the variable unit costs will remain largely unchanged, compared with this year. It is anticipated that exporters of processed goods will raise their prices in foreign currency slightly more than competitors, as a result of the appreciation of the krona. Their profit margins will thus remain unchanged. However, in cyclical base industry, profitability is expected to improve further as prices on the world market will also develop favourably next year. The high level of resource utilisation in industry is expected to lead to domestic market companies improving their profit situation. Profitability in industry as a whole is therefore expected to increase to just under 35 per cent next year, measured as operating surplus as a percentage of value added.
5.2 Construction
Total construction rose sharply last year. This increase is mainly explained by a rise in residential construction. Business sector investment in construction fell, however, despite a strong level of economic activity. Infrastructure investment also fell. Construction activity is expected to strengthen in the near future, and the volume of construction will rise by approximately 4 per cent this year and just over 6 per cent next year.
44
Table 5.3 Construction
| | SEK billion
| | Percentage change
|
|---|
| | 1999
| | 1998
| | 1999
| | 2000
| | 2001
|
|---|
| Construction investment | | 112.3 | | 4.6 | | 3.8 | | 3.7 | | 8.3 |
| | Business sector | | 51.0 | | 4.6 | | -0.6 | | 7.0 | | 5.8 |
| | Authorities | | 29.3 | | 5.2 | | -2.1 | | -3.0 | | 6.5 |
| | Housing | | 32.0 | | 3.6 | | 18.8 | | 4.5 | | 13.7 |
| Repairs and maintenance | | 57.5 | | 1.4 | | 1.4 | | 4.0 | | 2.9 |
| | |
| |
| |
| |
| |
|
| Total | | 169.8 | | 3.4 | | 3.0 | | 3.8 | | 6.5 |
| | |
| |
| |
| |
| |
|
Sources: Statistics Sweden and Ministry of Finance
The rise in residential construction is estimated to continue over the next few years, as many demand factors are assessed as developing favourably. The situation on the labour market will improve over the next few years and household disposable incomes are estimated to increase by approximately 4 per cent this year and next year. Rising asset prices in recent years have considerably improved household wealth. Rapidly rising house prices on the second-hand market and a decline in the number of vacant apartments indicate that demand for housing is currently very high. Prices for single-family dwellings are now at levels at which new construction is often very profitable. In some parts of the metropolitan areas, the cost of new production is scarcely half the cost of buying an older house.
Despite the apparently strong demand and despite certain indicators, such as the National Institute of Economic Research's Business Tendency Survey, pointing to a strong development in the near future, there are still some signs that the recovery in residential construction is relatively slow. Residential investment is still at historically low levels and the inflow of orders to manufacturers of single-family dwellings has declined during the first half of this year, compared with the corresponding period in 1999. The dampened rise is probably due to supply restrictions. There is a great shortage of subdivided land for development, and the difficulty in recruiting construction workers to the metropolitan areas has increased. According to statistics from the Swedish Building Workers' Union, unemployment in Sweden as a whole amounted to 10.3 per cent in July this year, while it was only 3.6 per cent in the Stockholm region. It is assessed that certain supply restrictions will subdue development throughout the forecast period.
In the light of the strong growth in production, construction investment by the business sector was surprisingly weak last year. One contributory factor was the low level of construction of new industrial premises, which is partly explained by the structural change towards more knowledge-intensive production that is taking place in industry. Next year, industrial construction is expected to increase again in connection with base industry expanding its output capacity. The very strong economic growth in the private service sector is expected to lead to increased construction of both office and commercial premises. Vacancy figures have declined steadily in recent years and are now at the same levels as in the early 1990s. As a consequence of the reduced supply, rents for commercial premises have risen sharply in recent years, resulting in good profitability in the construction of new premises. It is also necessary that the construction of commercial premises should remain at a high level in future, to avoid bottlenecks in the very strong economic situation. The strong inflow of orders to architects and technical consultants indicates that the strong construction activity will continue for the next two years.
Central government construction investment is expected to fall this year, even though loan-financed construction investment (metropolitan motorways) will increase sharply. Increased grants will result in public sector road investment increasing slightly next year.
Repairs in the construction sector will increase both this year and next year, as a result of the very strong financial situation of households, although certain supply restrictions will hold back the increase. Road operation and maintenance initiatives are also expected to increase.
45
6 Labour market
Employment rose by approximately 70,000 persons during the first half of this year, compared with the first half of 1999. At the same time, open unemployment fell by approximately 0.5 percentage points to 5.1 per cent, in seasonally adjusted terms. Employment is expected to continue to develop favourably over the next few years. The regular employment ratio for persons between the ages of 20 and 64, which according to the government's employment target shall be 80 per cent in 2004, is estimated to rise to 77.7 per cent in 2001.
The supply of labour also increased during the first six months of the year and is expected to continue to increase as the situation on the labour market improves further. However, the planned expansion of the number of places in higher education will moderate the increase in supply somewhat. In all, the growth in employment and the supply of labour will result in open unemployment falling to 3.8 per cent in 2001.
Table 6.1 Selected labour market statistics
Percentage change unless otherwise stated
| | 1999
| | 2000
| | 2001
| | 2002
| | 2003
|
|---|
| GDP, producer prices | | 3.6 | | 3.9 | | 3.4 | | 2.0 | | 2.0 |
| Productivity | | 0.9 | | 1.9 | | 2.1 | | 1.6 | | 1.6 |
| Number of hours worked | | 2.7 | | 2.0 | | 1.3 | | 0.4 | | 0.4 |
| Average hours worked | | 0.5 | | 0.0 | | 0.0 | | -0.1 | | -0.1 |
| Number of employed | | 2.2 | | 2.0 | | 1.3 | | 0.5 | | 0.5 |
| Regular employment ratio(1) | | 75.9 | | 77.0 | | 77.7 | | 77.8 | | 78.0 |
| Labour force | | 1.2 | | 1.0 | | 0.4 | | 0.5 | | 0.6 |
| Open unemployment(2) | | 5.6 | | 4.6 | | 3.8 | | 3.9 | | 4.0 |
| Labour market policy programmes(3) | | 3.1 | | 2.6 | | 2.6 | | 2.3 | | 2.0 |
- (1)
- Number of employed in age group 20-64, excluding employed in labour market policy programmes, in per cent of the population in that age group
- (2)
- Per cent of labour force
- (3)
- People in labour market policy programmes in per cent of labour force. The programmes included in this term are those reported by the National Labour Market Board (AMS) as labour market policy programmes, excluding persons registered with Employment Institutes (AMI), and European inter practical scholarships.
Sources: Statistics Sweden, National Labour Market Board and Ministry of Finance
The number of places in the Adult Education Initiative will be scaled down between 2001 and 2003, as will the number of persons taking part in labour market policy programmes. This reduction will release resources in the economy, raising the potential output level and reducing the risk of overheating. Against this background, GDP is assumed to grow by 2.1 per cent per year in 2002 and 2003. Employment is thus expected to increase at a slightly faster rate than the working-age population. This means that the regular employment ratio will rise to 78 per cent in 2003.
The scaling down of the Adult Education Initiative and the labour market policy programmes implies that the supply of labour will increase rapidly over a relatively short period of time. Since not everyone who would otherwise have taken part in one of the above can be expected to find employment immediately, it is estimated that open unemployment will initially rise somewhat, from 3.8 per cent in 2001 to 4 per cent in 2003. The increase in the supply of labour will moderate to some
46
extent, however, due to the fact that the number of places in higher education will continue to increase in 2002 and 2003.
Labour market policy and education and training policy
Measured as an annual average, the number of participants in labour market policy programmes this year is expected to amount to 115,000 which is 20,000 fewer than was assumed in the 2000 Government Spring Bill. The assumed volume for the year 2001 has also been reduced to 115,000 persons. Since the average so far this year is significantly lower than 115,000, there is a risk that the volume will not reach 115,000. The grants for labour market policy programmes will be reduced gradually during the period 2001-2003 and the number of participants in such programmes is expected to amount to 90,000 persons in the year 2003.
The grants for the Adult Education Initiative will be reduced in stages between the years 2000 and 2003, by an amount corresponding to 55,000 places.
The number of permanent places in higher education will be further increased over the next few years. An increase of approximately 45,000 places is planned between 1999 and 2002. A further increase is estimated in 2003.
During the spring, the government presented a number of proposals to renew labour market policy. The Riksdag has passed resolutions on several of these proposals and on 1 August this year various changes to the labour market policy regulations came into force.
The changes include the introduction of a new labour market policy programme—the Activity Guarantee. The Activity Guarantee comprises individually adapted labour market policy activities for persons who are, or who risk becoming, long-term registered with the Swedish Employment Service. The aim is to emphasise the incentive to work and break the circle of going back and forth between labour market policy programmes and open unemployment.
New forms of recruitment incentives with different terms and conditions have been added. The amount of support, which is provided in the form of a tax reduction, varies depending on how long the person being hired has been unemployed, whether the person is above a certain age, etc.
As of 1 August, the basic qualifying condition for eligibility for unemployment benefit is that the applicant must be unemployed in spite of actively seeking suitable employment. The purpose is to clarify more precisely than before the requirements made on individual job seekers. During the autumn, the Riksdag will also decide on measures to reinforce the efficiency of unemployment insurance and to strengthen the legal rights of those dependent on it to support themselves between jobs, as well as some supplementary regulations concerning the Activity Guarantee.
Employment
The majority of indicators point to further strong employment growth over the next few years. Demand in the economy is expected to be strong both this year and next. The number of newly reported vacancies, which has historically been a good indicator of employment growth, implies that employment will continue to increase, albeit at a slightly slower rate than during the first six months of the year. The National Institute of Economic Research's (NIER) Business Tendency Surveys also indicate that firms foresee continued employment growth. When measured as an annual average, employment is therefore estimated to rise by a total of 2 per cent, corresponding to 81,000 persons, this year.
47
Diagram 6.1 Newly reported vacancies and number of employed
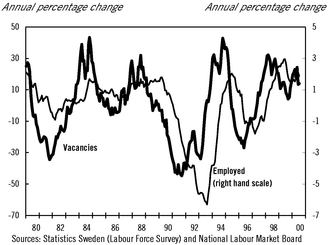
At the same time as firms are reporting plans to recruit personnel in the near future, they report that the shortage of labour has sharpened. The increase in the number of remaining vacancies in relation to the number of newly reported vacancies also indicates that it is becoming more difficult for firms to recruit personnel. Next year, therefore, the resource situation on the labour market is estimated to be slightly more strained and the rise in employment is therefore anticipated to be lower than this year. Measured as an annual average, employment is estimated to increase by 1.3 per cent next year, or by 53,000 persons.
In 2002 and 2003, there will be a gradual scaling down of the Adult Education Initiative and labour market policy programmes, which means that the labour supply will increase rapidly during a short period of time. Some of the persons who would otherwise have been included in the Adult Education Initiative or in labour market policy programmes are expected to become employed. Others are assumed, at least in the short term, to be openly unemployed or to be outside the labour force. The scaling down is estimated to lead to a slightly more rapid growth in employment for the years 2002 and 2003 than the growth in the working-age population, without leading to inflationary wage increases. In this scenario, GDP is expected to increase slightly more rapidly than the 2 per cent growth rate assessed to be sustainable in the long term.
Growth in different sectors(1)
- (1)
- Outcome and forecasts regarding the number of persons employed in various industries are based on employment statistics from Statistics Sweden's Labour Force Survey. These statistics sometimes deviate considerably from what is reported in Statistics Sweden's short-term employment statistics and the National Accounts with regard to developments in various sectors. Additionally, over the past year, developments in the economy as a whole have varied between the different sources of statistics. The Labour Fore Survey reports a weaker development than the other sources. With regard to the various sectors, the Labour Force Survey show a weaker development this year than the short-term employment statistics for all sectors, with the exception of central government authorities. It should be noted, however, that the short-term employment statistics do not include self-employed.
The greater part of the increase in employment this year has taken place in the business services sector. The largest increase among individual industries was noted in transport and storage, as well as other business services. Next year, a broader rise in employment is expected.
48
The number of persons employed in industry has increased only slightly during the first six months of the year, despite a very strong increase in industrial output. One explanation for this is that the telecommunication equipment industry, where growth in productivity has been very rapid, has accounted for a large share of the increase in industrial production. Another explanation is that the utilisation of resources in industry was relatively low at the start of the year. In the future, however, the rapidly growing industrial output is expected to cover a greater number of industries and to lead to a slight rise in the number of persons employed in industry.
In the construction sector, growth in employment has been moderate so far this year. However, a continued strong increase in construction is estimated to lead to stronger employment growth in the future.
Despite positive growth in income in the local government sector this year, the number of employed has fallen during the first six months of the year, compared with the same period in 1999. However, it is expected that the continued growth in income in the sector, as a result of raised central government grants and increased tax revenues, will lead to an increase in employment over the next few years. The number of central government employees is expected to remain unchanged this year and to show a slight increase next year.
Table 6.2 Employment by sector
Thousands
| | 1999
| | 2000
| | 2001
| | 2002
| | 2003
|
|---|
| Business sector | | 2805 | | 2886 | | 2929 | | 2936 | | 2945 |
| Agriculture and forestry | | 104 | | 102 | | 101 | | | | |
| Industry | | 797 | | 799 | | 802 | | | | |
| Construction | | 225 | | 227 | | 235 | | | | |
| Private services | | 1679 | | 1757 | | 1791 | | | | |
| Public authorities | | 1260 | | 1260 | | 1270 | | 1284 | | 1294 |
| Central government | | 186 | | 186 | | 187 | | | | |
| Local government | | 1074 | | 1074 | | 1082 | | | | |
| | |
| |
| |
| |
| |
|
| Total | | 4068 | | 4149 | | 4202 | | 4223 | | 4243 |
| | |
| |
| |
| |
| |
|
| Total labour force | | 4308 | | 4352 | | 4369 | | 4393 | | 4419 |
Sources: Statistics Sweden (Labour Force Survey) and Ministry of Finance
Number of hours worked and average hours worked
Overtime and the percentage of persons normally working more than 35 hours per week have continued to rise this year. Absence due to study leave has begun to decline, after increasing in recent years. On the other hand, sick leave has continued to increase. In total, however, the average hours worked(2) during the first half of this year remained unchanged, compared with the corresponding period last year. The figure is expected to remain unchanged when measured as an annual average, both this year and next year. After 2001, average hours worked are, however, assumed to fall slightly in connection with a possible reduction in working hours for individuals, as a result of agreements with
49
employers on shorter working days or more flexible working hours, better adjusted to the level of economic activity.
- (2)
- Measured as the number of hours worked according to the National Accounts, divided by the number of persons employed according to Statistics Sweden's Labour Force Survey.
Productivity
Last year, growth in productivity in the economy as a whole was weak. This was mainly due to an above average increase in output in sectors of the economy with low productivity, i.e. growth was labour intensive. This year and next, productivity is expected to rise more than last year, as demand is increasingly focusing on industries which are less labour intensive. During the period 2002-2003, productivity is assumed to rise in line with a more long-term normal rate of increase, which is currently estimated at between 1.5 and 2 per cent. This is a slightly stronger growth rate than the average for the period 1970-1999. One reason for assuming the long-term normal growth in productivity to be slightly higher over the next few years is that the growth in productivity in the expansionary telecommunication equipment industry is expected to remain very favourable. In addition, a number of structural changes have been implemented since the mid-1980s, which are expected overall to contribute to higher growth in productivity than the historical trend. These changes include deregulation of certain product markets, the expansion of higher education, more stringent competition legislation, deregulation of the capital markets and increased international competition.
Supply of labour and open unemployment
The supply of labour has increased in line with the rise in employment during the first six months of the year. Statistics indicate that it is mainly persons previously classified as students who have now entered the labour market. The number of persons working at home has also continued to decline.
Diagram 6.2 Number of employed and people in labour force
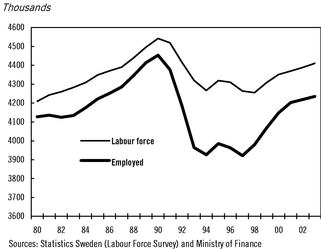
The improved labour market situation is expected to result in other people potentially looking for a job, i.e. persons who can and want to work but are not actively seeking work, also entering the labour market in the near future. These include persons who are currently living abroad, regard themselves as available or seeking work, but do not fulfil the criteria to be classed as openly unemployed, and those outside the labour force for an unspecified reason. The number of persons working at home is expected to continue to decline. On the other hand, the number of persons on long-term sick leave or in early retirement is expected to increase during the period as the percentage of persons between the ages of 55 and 64, where these groups are for natural reasons over-represented, will rise in the near future.
50
The number of students will fall during the period as a result of the decline in the number of places on the Adult Education Initiative and as the volume of labour market policy programmes is scaled down. This decline will be partly offset, however, by an increase in the number of places available in higher education.
All in all, the supply of labour is expected to increase by approximately 61,000 persons between 1999 and 2001. The labour force will thus increase at a slower rate than employment, which means that open unemployment will fall from 5.6 per cent in 1999 to 3.8 per cent in 2001. After the year 2001, on the other hand, the supply of labour will increase more rapidly than employment and open unemployment will thus rise to 4 per cent in 2003. The scaling down of the Adult Education Initiative and the labour market policy programmes will make a relatively large contribution to the supply of labour during these years and it is thus assumed that not all new job seekers will be employed immediately.
Diagram 6.3 Open unemployment and people in labour market policy programmes
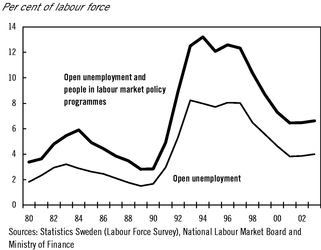
Uncertainties in the forecast
There are a number of uncertainties regarding future developments on the labour market. It is estimated that in the year 2003, a relatively large percentage of the working-age population will still be outside the labour market. However, it is very difficult to estimate the potential size of the labour force. The strong GDP growth and rapid increase in employment over the past year have been combined with continued low inflation and low inflationary expectations. There is a possibility that the labour market and wage formation will function better than has been assumed in the estimates. GDP growth could then be stronger over the next few years and the level of employment higher in 2003 than estimated, without inflationary wage increases arising. GDP growth could also be stronger than forecast if productivity growth in the telecommunication equipment industry, which has been very rapid in recent years, continues to provide a very strong contribution to growth in the medium-range perspective.
However, developments might also be quite the opposite. It is possible that the shortage situation and matching problems on the labour market have been underestimated. Although the situation on the labour market has improved in most counties, the employment ratio is still considerably lower and unemployment still considerably higher in some parts of the country than in others. Moreover, unemployment is higher among those with a low level of education than those with a high level of education. The availability of unemployed persons with higher education is very slight in many professions throughout the country and the problem thus cannot be solved through geographical mobility.
51
Table 6.3 Open unemployment and employment ratio in different regions
| | Open unemployment,
per cent of
labour force
| | Employment ratio,
per cent of
working-age population
|
|---|
| | 1999 q2
| | 2000 q2
| | 1999 q2
| | 2000 q2
|
|---|
| Stockholm | | 4.0 | | 3.3 | | 77.6 | | 79.5 |
| Eastern Central Sweden | | 5.9 | | 4.8 | | 72.1 | | 73.1 |
| Småland and the islands | | 5.0 | | 3.8 | | 76.0 | | 77.5 |
| Southern Sweden | | 6.2 | | 5.9 | | 70.3 | | 71.3 |
| Western Sweden | | 4.9 | | 4.4 | | 73.5 | | 74.7 |
| Norhtern Central Sweden | | 7.1 | | 6.1 | | 71.3 | | 71.8 |
| Central Norrland | | 6.0 | | 6.6 | | 71.5 | | 72.0 |
| Upper Norrland | | 7.8 | | 5.7 | | 68.5 | | 71.2 |
| The whole country | | 5.4 | | 4.7 | | 73.3 | | 74.6 |
Source: Statistics Sweden (Labour Force Survey)
According to the National Labour Market Board's survey this spring, the shortage of labour has increased since spring 1999. Almost all municipalities report recruitment problems with regard to nurses, doctors and teachers in this survey.
At the same time, NIER's Business Tendency Survey for Service Sectors indicates that the widespread shortage of personnel with industry specific competence is continuing to grow in several service sectors with high skills requirements. This applies to sectors such as other business services and advertising. Service sectors with relatively low skills requirements, such as trade and hauliers, also report a growing shortage of labour. The Business Tendency Survey for Manufacturing, Construction and Retail Trade also indicates that the personnel shortage has increased, both with regards to skilled workers and technicians. However, the percentage of firms in industry reporting a shortage is still considerably lower than at the end of the 1980s.
If more serious matching problems arise on the labour market than expected, or pure shortage situations, i.e. restrictions with regard to the supply of labour with the necessary skills and training, then wage increases could be considerably higher than assumed in the estimates. This would probably have a negative impact on both employment and growth.
52
7. Wages
Wage increases are currently relatively low in view of the significant rise in employment over the last two years. According to preliminary figures from Statistics Sweden, wages have increased on average by almost 3.5 per cent during the first six months of this year, compared with the corresponding period last year. Wage agreements have been calculated at just below 3 per cent and wage drift at approximately 0.5 per cent. The outcome will probably be revised as a result of retroactive wage payments.
Table 7.1 Hourly wages
Percentage change
| | 1998
| | 1999
| | 2000
| | 2001
| | 2002
| | 2003
|
|---|
| Industry | | 4.2 | | 2.5 | | 3.4 | | | | | | |
| | Agreement | | 2.9 | | 1.5 | | 2.4 | | | | | | |
| | Wage drift | | 1.3 | | 1.0 | | 1.0 | | | | | | |
Construction sector |
|
3.6 |
|
4.2 |
|
3.6 |
|
|
|
|
|
|
| | Agreement | | 3.1 | | 1.9 | | 2.6 | | | | | | |
| | Wage drift | | 0.5 | | 2.3 | | 1.0 | | | | | | |
Private service sector |
|
4.1 |
|
3.6 |
|
3.3 |
|
|
|
|
|
|
| | Agreement | | 3.1 | | 2.7 | | 2.5 | | | | | | |
| | Wage drift | | 1.0 | | 0.9 | | 0.8 | | | | | | |
Central government authorities |
|
2.9 |
|
3.7 |
|
3.5 |
|
|
|
|
|
|
| | Agreement | | 1.9 | | 2.5 | | 2.5 | | | | | | |
| | Wage drift | | 1.0 | | 1.2 | | 1.0 | | | | | | |
Local government authorities |
|
3.2 |
|
3.7 |
(1) |
4.1 |
|
|
|
|
|
|
| | Agreement | | 2.3 | | 2.7 | | 3.6 | | | | | | |
| | Wage drift | | 1.0 | | 1.0 | | 0.5 | | | | | | |
Total |
|
3.8 |
|
3.4 |
|
3.5 |
|
3.5 |
|
3.5 |
|
3.5 |
| | Agreement | | 2.8 | | 2.4 | | 2.7 | | | | | | |
| | Wage drift | | 1.0 | | 1.0 | | 0.8 | | | | | | |
- (1)
- In connection with the transfer of local government statistical compilation from the Swedish Association of Local Authorities and the Federation of Swedish County Councils to Statistics Sweden as of January 1999, some changes were made in the reporting method and population size. This complicates the reporting of wage developments within local government authorities between 1998 and 1999, and has caused delays in the compilation of statistics. The figure for local government authorities shown in the table is an estimate of the outcome based on available statistics and information from the Swedish Association of Local Authorities.
Sources: Statistics Sweden, National Institute of Economic Research and Ministry of Finance
The outcome for the first six months of this year also shows that the total wage increases and the wage drift vary slightly between the business sector and general government authorities. In the business sector, wages increased in total by slightly more than the average and the wage drift was estimated at approximately 1 per cent. Thereby, wages in general government authorities increased in total by slightly less than the average. Relatively low wage increases have been noted in municipalities. Wage drift in municipalities is negative for the first six months of this year. One reason for this could be that some wage agreement revisions included in the calculations have not yet been realised.
53
When measured as an annual average, wages are assumed to rise by 3.5 per cent this year compared with last year, which means that the wage drift is assumed to be limited to 0.8 per cent. Wages are also assumed to rise overall by 3.5 per cent per year during the period 2001-2003, for which there are no wage agreements as yet for most employees. After 2001, output is assumed to rise at a more normal and long-term sustainable rate of increase of approximately 2 per cent per year. It is assumed that the monetary policy pursued will bring inflation into line with the Riksbank's inflation target of 2 per cent. Nominal wage increases of 3.5 per cent per year are consistent with such a development. Real wages would then rise at about the same rate as productivity.
The wage agreements in virtually all of the labour market run until the end of March 2001. This means that the next round of wage negotiations will begin at a stage when resource utilisation in the economy is expected to have risen to a level that may mean competition for the available labour resulting in high wage increases in the wage agreements. There would then be a risk of overall wage increases being higher than assumed in the calculations.
However, a number of factors indicate that wage increases may be limited to 3.5 per cent per year. One factor is that price pressure is expected to remain low this year and next year. Real wages, which have increased rapidly in recent years, are estimated to rise on average by just under 2 per cent per year during the period 2000-2003, given the nominal wage increases and price development forecast in the estimates. This is a higher annual rate of wage increase than the average during the period 1970-1999.
Diagram 7.1 Development of nominal and real hourly wages
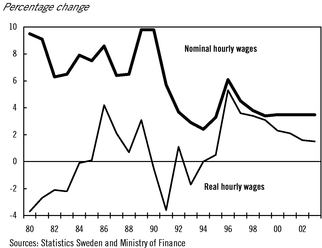
Another factor in favour of moderate wage increases is that a new authority has been established, the Mediation Institute, which has the task of mediating in labour disputes and promoting well-functioning wage formation. In addition, co-operation agreements have been signed in several wage agreement areas.
If the orientation towards more co-ordinated wage agreement negotiations, co-ordinated wage demands at industry level and freer wage setting at a local level continues during the next round of wage negotiations, this may also contribute to the improved functioning of wage formation in the future. The wage agreement for nurses signed in the spring involves greater decentralisation of wage negotiations. The proposed wage agreement for teachers presented last spring included no individual guaranteed wage increases and only a limited portion of the scope of the increase had been established as a guaranteed wage increase at the local government level. However, the members of the negotiating trade unions voted no to the proposal and it is thus unclear how the final agreement for teachers will be formulated.
54
8 Inflation
Inflationary pressure is still very low in Sweden. Low wage increases and a rising growth in productivity have dampened domestic price pressure so far this year, which has contributed to keeping down inflation. Price rises on imported goods, with the exception of oil products, have also been low.
Table 8.1 Consumer prices
Percentage change
| | 1999
| | 2000
| | 2001
| | 2002
| | 2003
|
|---|
| CPI, year-on-year | | 0.3 | | 1.2 | | 1.4 | | 1.9 | | 2.0 |
| CPI, Dec-Dec | | 1.2 | | 1.1 | | 1.7 | | 2.0 | | 2.0 |
| UND1X, year-on-year | | 1.4 | | 1.3 | | 1.1 | | — | | — |
| UND1X, Dec-Dec | | 1.9 | | 1.0 | | 1.3 | | — | | — |
| HICP, year-on-year | | 0.6 | | 1.1 | | 1.1 | | — | | — |
| HICP, Dec-Dec | | 1.2 | | 0.9 | | 1.3 | | — | | — |
| NPI, year-on-year | | -1.2 | | 2.5 | | 1.5 | | — | | — |
| NPI, Dec-Dec | | -0.5 | | 2.7 | | 1.9 | | — | | — |
| Base amount, thousand SEK | | 36.4 | | 36.6 | | 36.9 | | 37.4 | | 38.0 |
| HICP, EU, year-on-year | | 1.2 | | 2.0 | | 1.8 | | 1.8 | | 1.7 |
Sources: Statistics Sweden and Ministry of Finance
The forecast assumes that international prices will increase over the next few years, but at a relatively modest rate. As the krona is expected to appreciate at the same time as oil prices fall from their current high levels, import price developments will make a negative contribution to inflation. Moderate wage increases and a good growth in productivity will also limit cost increases in domestic output. Inflation, measured as the change in the Riksbank's UND1X(3) measure over 12 months, is estimated to amount to almost 1.5 per cent at the end of 2001. Inflation according to the consumer price index (CPI) will be slightly higher, mainly as a result of rising interest rate costs. The marginal rise in the inflation rate according to UND1X during next year is explained partly by delayed indirect effects of the high oil prices this year and partly by the strong growth in demand giving scope for trade and other service sectors to raise their profit margins. Inflation during 2002 and the following few years is assessed to be at 2 per cent, in line with the inflation target.
- (3)
- In UND1X, interest rate costs for homeowners and the direct effects of changes in indirect taxes and subsidies have been excluded from the CPI. The Riksbank stated last year that the framing of monetary policy is based on an estimate of UND1X for up to two years ahead.
The largest uncertainty factor in the forecast is potential shortages in the labour market. However, an interpretation of the currently available indicators implies that the risk of a very marked shortage in the labour market will not occur before 2002 and onwards, although some bottlenecks may gradually emerge before then. Increasing competitive pressure may lead to profit margins in the business sector remaining unchanged or rising only slowly, despite the strong growth in demand. Developments in oil prices also comprise a significant uncertainty factor in the forecast.
Import prices
A large part of the inflation in Sweden is determined by price developments on imported goods. Despite the fact that oil prices have doubled over the past year, the inflation rate has remained very low. The low inflation rate indicates that the indirect effects of the high oil prices have not yet had a full impact at consumer level, although low price increases on other import goods have to some extent
55
dampened the general price development. Both CPI and UND1X inflation amounted in July to 1.2 per cent, of which more than half is accounted for by higher prices on petrol and diesel. With some time lag, the oil price rises should make an impact in the form of higher prices on transport services and products in which oil comprises an important intermediate product.
Global growth has been very strong so far this year. As yet, international price increases have been surprisingly low and limited mainly to commodities. There are still considerable capacity reserves in the world market in most sectors, at the same time as the effects of trade integration are contributing to keeping down firms' profit margins.
It is assumed in the forecast that international prices on processed goods will increase more rapidly in the near future, but that the rise will remain fairly limited. World market prices on processed goods are expected to rise by 0.6 per cent this year and by 1.2 per cent in 2001, measured as an annual average. Although an increasing number of countries are expected to approach full resource utilisation next year, it is assessed that the impact on prices will be limited during the period up to the end of 2001. Very low inflation expectations have been established in the OECD countries during the 1990s, at the same time as the central banks have been given greater independence. This means that a joint boom will no longer lead to rapid increases in costs and prices on the world market.
The development of oil prices comprises a considerable uncertainty factor in the inflation forecast (see explanatory box in Chapter 2). To date, the price of crude oil (Brent oil from the North Sea) has been on average just below USD 28 per barrel. It is estimated in the forecast that the price will fall to USD 26 per barrel towards the end of this year and to USD 24 towards the end of 2001. This is a considerable upward revision compared with the estimate in the Government Spring Bill. The continued high oil prices can be explained by an unusually strong increase in global demand for oil products, which cannot be met in the short term by production increases in the oil countries.
Swedish import prices on processed goods have increased slowly over the past year, thanks to a slight appreciation of the krona. The krona is expected to appreciate further by almost 2 per cent next year, and this, together with falling oil prices could contribute to a fall in inflation of approximately 0.6 percentage points during the course of next year when full impact is achieved. As the business sector is expected to utilise the low import prices to some extent to raise profit margins, however, the overall effects on CPI inflation are estimated to be less than 0.6 percentage points.
Capacity utilisation and unit labour cost
Wage increases have been relatively low during the first six months of this year and there is no sign that wages are about to accelerate. The wage negotiations that will be held this year and next year will be a decisive factor in the future development of wages. It is assumed in the forecast that wages will increase by 3.5 per cent per year.
Shortage figures on the labour market indicate that the business sector may experience greater difficulties expanding next year. The percentage of industrial firms experiencing difficulty in finding personnel with industry-specific competence has increased, although the levels are still relatively low in a historical perspective. Within the service sector, the shortage of labour has also begun to increase in sectors with relatively low skills requirements, and shortage figures are still at high levels in industries with high skills requirements. It has also become more difficult to recruit construction workers, despite a continued high level of unemployment in Sweden as a whole. In the light of the continuing rapid rise in employment, the amount of available resources is thus expected to decline even further, which increases the risk of more rapid wage increases.
Productivity growth in the Swedish economy plays a significant role for the path of inflation. Productivity growth in the business sector has not changed significantly during the past decade, although the productivity increases have been greater than in the 1980s. However, productivity growth
56
in industry has markedly improved, mainly due to the very favourable development of the telecommunication equipment industry (see Chapter 5).
The large growth in output forecast for the period 2000-2001 is expected to lead to strong productivity growth. According to preliminary National Accounts, a considerable increase in productivity has already been noted during the first six months of this year. The rapid productivity growth in industry in the near future will be due to utilisation of previously unused capacity, at the same time as the telecommunication equipment industry is expected to develop very favourably. In addition, the increased use of IT should also contribute to the growth in productivity.
Minor changes in the growth of labour productivity can be noted in the rest of the business sector over the past 20 years. Labour productivity in these parts of the business sector is assessed to approach the long-term growth potential during the forecast period. This year it will still be held back slightly when sectors with a low labour productivity, such as trade in goods, grow rapidly while other sectors with a high labour productivity grow relatively slowly. Additional factors that may contribute to a higher growth in productivity are the regulatory reforms to promote competition in certain sectors (most recently in the electricity and telecommunication markets) and an increased use of IT in, for instance, the finance sector. The relatively rapid growth in productivity will contribute to domestic inflation remaining moderate during the forecast period.
Profit margins
In addition to the development of labour costs, the main factor determining domestically generated inflation is the way profit margins within the business sector change. In the short term, cost increases at producer level do not have a full impact at consumer level because of the competition at both producer level and retailer level. Normally, however, cost increases should lead to corresponding consumer price rises in the long term. In recent years, however, there has been a tendency where higher costs have not led to higher consumer prices, even in the longer term, and thus profit margins in the rest of the business sector have fallen (see Diagram 8.1).
Diagram 8.1 Gross operating surplus in other business sector excluding real estate and housing
Deregulation of previously protected sectors and new legislation on competition are important factors behind the falling profit margins. There are strong indications that profit margins, measured as percentage of gross profits, have reached a new, lower equilibrium level than previously. However, the assessment in the inflation forecast is that there is a need to restore profit margins to some extent. Transport firms and certain other domestic market firms are thus forecast to recover the earlier deterioration in profit margins as oil prices fall.
57
In addition, it is probable that retailers and wholesalers will make use of the strong demand situation to make certain adjustments to margins over the coming year. Inflation expectations have also risen among firms since the beginning of the year. According to the National Institute of Economic Research's Business Tendency Survey from July, inflation expectations in the business sector for one year ahead lie between 1 per cent and 2 per cent. However, the tough competitive situation may mean that these price changes are not realised during the forecast period. For instance, prices at consumer level will probably continue to fall in the telecommunication and energy markets over the coming year, as more and more consumers make an active choice of supplier. Profit margins in industry comprise a source of uncertainty and with the anticipated development in import prices, inflation may be very low during the forecast period. Recently, household inflation expectations for next year have also declined.
Housing costs
Rising housing costs will provide a total contribution to CPI inflation of 0.4 percentage points this year and 0.7 percentage points next year, which is mainly explained by rising interest rate costs for homeowners. Although the long-term market interest rates will only rise marginally during the forecast period, as households rewrite the loans taken up on very favourable terms during 1998 and 1999 when market interest rates were low, interest rate costs will increase. This will raise the CPI, but not inflation measured by UND1X, where these costs are excluded.
Rents are estimated to rise by a moderate 0.6 per cent this year. The proposed reduction in property tax will create the right conditions for restrained rent increases next year as well, despite other costs for property owners being expected to rise slightly more than this year. Interest rate costs are expected to be higher and maintenance costs are expected to rise as construction activity increases. In addition, the proposed increases in taxation on energy and carbon dioxide emissions will lead to higher heating costs. However, in some regions, where the housing stock still has high vacancy rates, rent increases should be very modest.
Diagram 8.2 Consumer price development
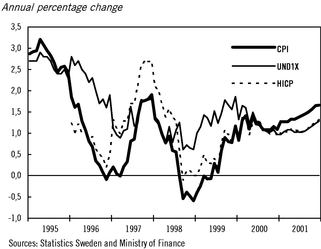
Changes in taxes and subsidies
The tax assessment values of both owner-occupied and multi-family dwellings are to be reassessed to reflect the price development for properties during the period July 1996 to June 2000. At the same time, however, property tax on multi-family dwellings will be reduced from 1.2 per cent to 0.7 per cent and property tax on owner-occupied dwellings will be reduced from 1.5 per cent to 1.2 per cent on 1 January 2001. The effects of these changes on the CPI will largely offset one another.
58
Other tax changes to be implemented on 1 January 2001, such as increased taxes on energy and carbon dioxide emissions, are expected to raise the CPI, while reduced VAT on passenger transport and the marginally lower employer contributions will lower the CPI. All in all, the tax changes to be made next year are expected to raise the CPI by almost 0.2 percentage points.
Table 8.2 below shows to what extent inflation, in terms of both the CPI and the Riksbank's UND1X measure, is affected by the proposed tax changes. UND1X excludes the direct effects of changes in indirect taxes and subsidies from the CPI.
Table 8.2 Effects on CPI and UND1X of tax changes in accordance with the Budget Bill for 2001
All measures come into force on 1 January 2001
Measures
| | CPI
| | UND1X
| | Difference(1)
|
|---|
| Raised tax assessment values, owner-occupied dwellings | | 0.5 | | 0.1 | | 0.4 |
| Lower tax rate, owner-occupied dwellings | | 0.4 | | 0.0 | | -0.4 |
| Taxes on energy and carbon dioxide emissions | | 0.3 | | 0.1 | | 0.2 |
| Raised tax assessment values and lower tax rate, multi-family dwellings | | -0.1 | | -0.1 | | 0.0 |
| Lower VAT on passenger transport | | -0.1 | | 0.0 | | -0.1 |
| | |
| |
| |
|
| Total | | 0.2 | | 0.1 | | 0.1 |
| | |
| |
| |
|
- (1)
- The adjustment of CPI (regarding changes in indirect taxes and subsidies) made to calculate UND1X. Additionally, in UND1X the interest rate costs for homeowners have been excluded from the CPI.
Source: Ministry of Finance
59
9 Household sector finances and consumption expenditure
Household real disposable incomes are estimated to increase significantly during the forecast period, thanks to the high employment growth, the low inflation rate and the decided and proposed tax cuts. Household consumption expenditure is also expected to grow strongly.
9.1 Household incomes
Household real incomes are currently developing very strongly. Last year, real disposable incomes increased by almost 3.5 per cent. After several years of declining real incomes, the income level is now for the first time in excess of the 1994 level.
This year, real incomes are expected to strengthen further. Employment is rising and the continued low inflation rate means that the wage bill will increase by almost 5 per cent in real terms. Income from transfers from the general government sector develops slightly more weakly than last year, despite the raise in child benefit and the large increase in payments from health insurance. The main cause is a fall in unemployment insurance payments, as a result of the improved labour market situation. Income tax was reduced by approximately SEK 12 billion this year as part of the compensation for earlier raises in individual contributions. In addition, the threshold for central government income tax has been raised.
All in all, it is estimated that real disposable income will rise by 4.4 per cent this year. However, the forecast is affected by the fact that, from this year onwards, the National Accounts report the Church of Sweden as part of the household sector. This reduces tax payments from the household sector by approximately SEK 10 billion according to the practice used in the National Accounts. The corresponding amount is added to household consumption expenditure. Actual household finances are unaffected by this transfer. Adjusted for the Church of Sweden's institutional reclassification, real disposable income increases by 3.4 per cent.
Real wages and employment are expected to continue to develop well in the year 2001, despite some slowdown in growth. The new study support system to be introduced on 1 July next year, as well as a further raise in child benefit, will lead to a rise in the contribution to household incomes from transfers. The proposed second stage in the compensation for individual contributions, together with a further raise of the threshold for central government income tax and an increase in the basic tax allowance, are estimated to correspond to a tax reduction of just over SEK 15 billion. All in all, the forecast is that household real income will increase by just over 4 per cent next year, a growth rate that has only been exceeded on a few single occasions over the past 30 years.
During 2002 and 2003, employment growth will slow down and the annual growth in real wages will amount to approximately 2 per cent. With the current and proposed regulations on taxes and transfers, household real income is estimated to increase on average by 2 per cent per year, i.e. at approximately the same rate as consumption expenditure.
60
Table 9.1 Household disposable income and consumption expenditure
| | SEK Billion
| | Percentage change
|
|---|
| | 1999
| | 1999
| | 2000
| |
| | 2001
| | 2002
| | 2003
|
|---|
| Wage bill including sick pay | | 849 | | 5.7 | | 4.8 | | | | 3.4 | | 2.0 | | 1.9 |
| General government transfers | | 392 | | 1.8 | | 0.4 | | | | 1.0 | | 0.7 | | 3.5 |
| Net interest and dividends | | 13 | | -11.4 | | -3.2 | | | | -3.7 | | 6.9 | | 3.3 |
| Net other income | | 200 | | 0.7 | | 1.7 | | | | 1.6 | | 1.3 | | 1.2 |
| Direct taxes and charges | | 469 | | 3.7 | | 1.6 | | | | -0.2 | | 1.2 | | 3.6 |
| Disposable income before technical transfer | | 986 | | 3.3 | | 4.4 | | (3.4 | ) | 4.2 | | 2.2 | | 1.8 |
| Disposable income after technical transfer | | | | | | | | | | | | 4.9 | | 2.3 |
| Household consumption expenditure | | 997 | | 4.1 | | 4.7 | | (3.7 | ) | 3.4 | | 2.1 | | 2.1 |
Note: The figures for 2000 are affected by the fact that the Church of Sweden is included in the household sector from 2000. The corresponding development excluding this effect is shown in parenthesis. Wage bill, income transfers, net interest and taxes are deflated by the consumer price index (CPI). The disposable income is deflated by the implicit price index for household consumption expenditure (IPI).
Sources: National Institute of Economic Research, Statistics Sweden and Ministry of Finance
This means that the relatively low level of household savings next year will remain the same during the following years. At the same time, a savings surplus will arise in the general government sector that significantly exceeds the budget target of 2 per cent of GDP. In the calculations, a technical assumption is made that this excess surplus is transferred to the household sector. This does not imply that any position has been reached as to how the anticipated excess surplus will be used. Furthermore, the estimates contain a considerable uncertainty factor. If the economic development differs considerably from the current estimates, the assessment of the size of the surplus will be affected.
Table 9.2 Household Savings
Per cent of disposable income
| | 1999
| | 2000
| | 2001
| | 2002
| | 2003
|
|---|
| Net savings before technical transfer: | | | | | | | | | | |
excluding savings in pension fund reserves |
|
- -1.1 |
|
- -1.4 |
|
- -0.6 |
|
- -0.4 |
|
- -0.8 |
including savings in pension fund reserves |
|
2.1 |
|
2.2 |
|
2.9 |
|
2.9 |
|
2.5 |
Net savings after technical transfer: |
|
|
|
|
|
|
|
|
|
|
excluding savings in pension fund reserves |
|
- -1.1 |
|
- -1.4 |
|
- -0.6 |
|
2.2 |
|
2.4 |
including savings in pension fund reserves |
|
2.1 |
|
2.2 |
|
2.9 |
|
5.6 |
|
5.7 |
Net lending after technical transfer |
|
2.6 |
|
..23 |
|
2.3 |
|
4.4 |
|
4.0 |
Sources: National Institute of Economic Research, Statistics Sweden and Ministry of Finance
9.2 Household consumption expenditure
Household consumption expenditure increased by 4.1 per cent last year, measured as an annual average. This is the largest increase since 1987. (See Diagram 9.1.) The growth in consumption was particularly strong during the last quarter of 1999, when household consumption increased by almost 5
61
per cent, expressed as an annual rate. Over the course of the first two quarters this year, the growth in consumption has remained strong, albeit slightly slower than at the end of last year. According to preliminary information, household consumption expenditure grew by an annual rate of almost 5 per cent during the first six months of the year. However, approximately one percentage point of this was a one-off effect of the Church of Sweden being transferred from the local government sector to the household sector in the National Accounts from this year onwards.
Diagram 9.1 Household disposable income and consumption expenditure
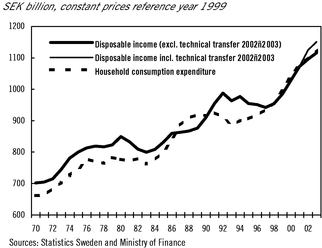
The positive labour market development, the increase in real disposable incomes and the strong growth in household wealth, particularly last year, have all contributed to the strong growth in consumption. Although not all of these factors are expected to develop as favourably this year and next year, the prospects for continued strong consumption are considered to be good. This year, household consumption expenditure is estimated to increase by just over 3.5 per cent (disregarding the effect of the transfer of the Church of Sweden to the household sector) and next year growth is expected to be just under 3.5 per cent.
According to Statistics Sweden's monthly survey of household purchasing plans, households are still very optimistic with regard to the near future. Households have been optimistic regarding their private finances since the start of 1999 and are showing no signs of becoming less optimistic. Confidence in declining unemployment and in an improved national economy remains at the high level reached last year. In addition to the favourable development in employment, household wealth and disposable income, it is likely that the strong public finances have also contributed to the growing optimism among households, and thus to the high level of consumption, in recent years.
The strong employment growth is expected to continue during the forecast period. The fact that employment prospects for 2001 have improved slightly compared with the assessment in the Government Spring Bill has contributed to an upward revision of the consumption forecast for next year.
Although the very strong growth in household wealth last year should have contributed to household optimism, the weaker development in wealth so far this year is not reflected in any deterioration in household confidence. It is reasonable to assume that households have to some extent already expected a slowdown in the development of asset prices, particularly with regard to those assets that have grown most quickly in value recently, and thus have not changed their basic positive outlook as a result of the more moderate stock exchange development during the first six months of this year. Furthermore, it is worth pointing out that the household wealth situation remains very strong. According to preliminary information from the savings surveys made by the Financial Supervisory Authority and Statistics Sweden, the household sector's total net financial wealth declined by 3.5 per
62
cent during the course of the second quarter, but it is still 3.7 per cent higher than at the beginning of the year and almost 30 per cent, or SEK 426 billion, higher than at the end of June 1999.
Household real wealth has continued to show a positive development during the first six months of this year. Prices of single-family dwellings sold fluctuated significantly at the beginning of the year, largely due to temporary effects, but during the spring the average prices have continued to develop at a good rate, although the number of dwellings sold has been relatively low. During the period May-July this year, average prices for single-family dwellings sold were approximately 8 per cent higher than during the corresponding period last year. However, there are considerable regional differences in price developments on single-family dwellings.
It is difficult to assess the effects on consumption of the large total increase in wealth, but it is reasonable to estimate that a certain part of the large increase in consumption in recent times is connected with the rapid increase in the prices of shares and single-family dwellings. The increase in wealth will probably still contribute to a growth in consumption, but this effect can be assumed to diminish gradually as wealth develops more slowly.
The household saving ratio is still low (see Diagram 9.2). The level of the saving ratio should be regarded not only in the light of households' positive expectations and the strong growth in wealth, but also with regard to the composition of consumption. The component of consumption that showed the strongest growth last year was durable goods, such as cars, furniture and white goods, which to some extent can be regarded as investments, i.e. a form of savings. Diagram 9.3 illustrates the development in household consumption of cars and other durable goods. The consumption of durable goods, excluding cars, grew by an annual rate of almost 20 per cent during the first quarter of this year. Consumption of cars, which last year increased by more than 30 per cent, grew by 7 per cent during the first quarter of this year, which is also a high rate of growth.(4) As shown in the diagram, there is a cyclical element in the development of both groups of durable goods. Following the low level of consumption during much of the 1990s, households have a need to replace worn capital goods. However, this need is likely to decline over the next few years.
- (4)
- When interpreting the information provided in the National Accounts on car consumption, it should be taken into account that the percentage of household registrations of private cars that covers directly imported vehicles has grown considerably since the middle of last year. These car purchases are not taken up under car consumption in the National Accounts, but are included in a collective item, together with other foreign consumption by Swedish households. During the first half of this year, private imports comprised approximately 23,000 (just over 25 per cent) of the almost 90,000 total new car registrations. As a comparison, it can be mentioned that of the almost 75,000 new car registrations made by households during the first half of last year, just under 13,000 (approximately 17 per cent) concerned privately imported vehicles.
63
Diagram 9.2 Household net saving ratio, excluding changes in pension fund reserves
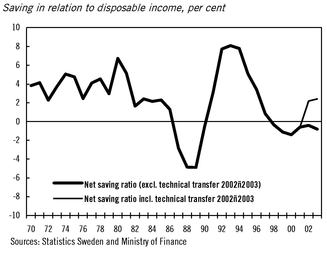
The low level of household saving is also reflected in the increase in indebtedness. Household debt, expressed as a percentage of disposable income, has increased over several years (see Diagram 9.4). However, the percentage is still considerably lower, and the current rise in consumption thus more stable, than was the case at the end of the 1980s.
As described in Section 9.1 above, household real disposable incomes are expected to rise sharply 2000-2001, partly thanks to the favourable employment growth and lower taxes. Given the strong household wealth position and households' optimistic outlook with regard to the near future, a relatively large part of the increase in income this year and next year is expected to be used for increased consumption. This means that the saving ratio is assumed to remain relatively low during these years.
Diagram 9.3 Household consumption expenditure: cars and other durables
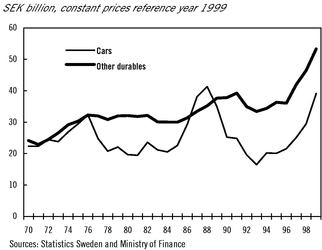
Further large surpluses in public finances are expected in 2002 and 2003. As mentioned in Section 9.1, a technical transfer to the household sector has been made of the entire expected surplus above the target level. The upper income curve in Diagram 9.1 shows that this leads to a very strong development in real disposable income during these years. (The lower curve illustrates the development excluding these technical transfers. Correspondingly, Diagram 9.2 shows the savings ratio for 2002 and 2003, both before and after the technical transfers.)
64
Diagram 9.4 Household debt ratio
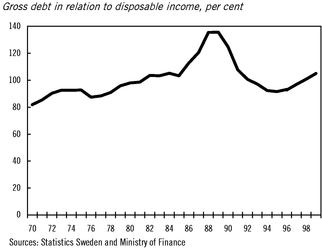
However, it must be emphasised that the management of these expected surpluses will not be determined for some time yet. The size of the transfers that can be made to the household sector will be assessed in the light of the prevailing economic situation. It is also reasonable to assume that households, which have shown a faster increase in consumption than in income, will in the long term want to increase the saving percentage of their income to a more long-term sustainable level. The medium range estimate describes a balanced development of the economy at a rate assessed as being sustainable in the long term and compatible with the inflation target. When a short-term forecast for the year 2002 is prepared for the first time next year, it is likely that the consumption prospects for this year will be revised upward if the whole of the excess surplus now being forecast were actually transferred to households, and revised downward if no transfer takes place.
Although it is thus not yet clear to what extent and in what form the expected surpluses in 2002 and 2003 will actually benefit households, it is still reasonable to assume that households are expecting to benefit from these surpluses and are to some extent planning their consumption for the period accordingly. As mentioned above, however, it is also reasonable to expect an increased saving ratio. This forecast is borne out by the fact that the need to invest in capital goods, as well as the direct effects of the rapid growth in wealth, are expected to gradually decline.
All in all, conditions are deemed to be favourable for a continued strong increase in household consumption in 2000-2001. The anticipated high level of growth in employment and disposable income, the solid household wealth position and households' optimistic expectations for the future all indicate that consumption will grow strongly both this year and next year. This year, household consumption expenditure is expected to grow by 4.7 per cent in total and by 3.7 per cent if an adjustment is made for the effects of the transfer of the Church of Sweden. Next year, a growth of 3.4 per cent is forecast.
The solid household wealth position, the development in real income and strong public finances provide support for forecasted further strong growth in household consumption in 2002 and 2003, even though a slowdown in employment is expected to contribute to a decline in the growth rate. Household consumption expenditure for 2002 and 2003 is anticipated to grow by just over 2 per cent per year.
65
10 Gross capital formation
The business sector is expected to gradually expand production capacity this year to meet increasing demand both from domestic and international markets. The strong economy has led to increased resource utilisation, and despite the fact that price rises have been moderate, profitability appears to be good in large parts of the business sector. Industrial firms have expansionary investment plans, and capacity is also estimated to expand considerably in other parts the business sector over the next few years. In total, business sector investment is estimated to increase by approximately 7 per cent this year and around 6 per cent next year, from an already high level.
According to the preliminary National Accounts, investment by general government fell sharply in the first six months of this year. Even though an upturn is expected towards the end of the year, it is estimated that general government investment will fall as an annual average. Increased investment in roads next year will cause investment to grow again as an annual average.
Table 10.1 Gross fixed capital formation by sector
| | SEK
billion
| | Percentage change in volume
|
|---|
| | 1999
| | 1999
| | 2000
| | 2001
| | 2002
| | 2003
|
|---|
| Business sector | | 246 | | 7.6 | | 6.9 | | 6.2 | | 1.2 | | 1.5 |
| | Industry | | 75 | | 0.6 | | 7.8 | | 8.4 | | 0.6 | | 1.5 |
| | Other business sector | | 171 | | 11.0 | | 6.5 | | 5.3 | | 1.5 | | 1.5 |
| Housing | | 32 | | 18.8 | | 4.5 | | 13.7 | | 12.0 | | 12.0 |
| | New construction | | 16 | | 21.8 | | 11.0 | | 17.0 | | — | | — |
| | Renovations | | 16 | | 16.1 | | -2.0 | | 10.0 | | — | | — |
| General government | | 49 | | 4.7 | | -3.2 | | 4.9 | | 2.3 | | 2.4 |
| | |
| |
| |
| |
| |
| |
|
| Total | | 327 | | 8.1 | | 5.1 | | 6.8 | | 2.5 | | 2.8 |
| | |
| |
| |
| |
| |
| |
|
| of which | | | | | | | | | | | | |
| | machinery | | 172 | | 11.5 | | 5.8 | | 6.2 | | 0.9 | | 1.3 |
| | building and construction | | 112 | | 3.8 | | 3.7 | | 8.3 | | 4.6 | | 4.9 |
| | other capital formation | | 43 | | 6.8 | | 6.2 | | 5.3 | | 3.1 | | 3.0 |
Sources: Statistics Sweden and Ministry of Finance
The number of new building starts for dwellings increased sharply during the first half of this year. However, the level is still low in historical terms. The improved situation on the labour market and the increasingly strong financial position of households point to an acceleration in residential construction over the next few years.
The uneven regional trends in construction will, however, create certain supply restrictions which will limit the increase. The number of apartment renovations and extensions commenced showed unexpectedly weak growth at the beginning of the year, which may partly be the result of an emerging shortage of construction workers.
In the medium term estimate, i.e. for the years 2002 and 2003, GDP is assumed to grow at the normal long-term sustainable growth rate. GDP growth rate is thereby expected to slow slightly in comparison with the years 2000 and 2001. Since investment is largely influenced by production growth, the upturn in investment will also slow down during 2002-2003. In the medium term, residential construction is expected to approach a level that is sustainable in the long term, and this implies a significant increase on the current low levels.
66
10.1 Business sector investment
Industry
Industrial activity is currently very strong. International growth is high, and Swedish export industry is benefiting from the fact that industrial production and demand for investment goods are increasing in countries which are important trading markets for Sweden. Swedish industrial output has also increased substantially at the beginning of the year. The inflow of orders to industry points to a continued rise in output during the second half of the year. The Business Tendency Survey for Manufacturing published by the National Institute of Economic Research (NIER) shows that capacity utilisation has increased over the past year, and that almost one third of the firms now consider that their production capacity is insufficient.(5)
- (5)
- As a result of delay in the publication of Statistic Sweden's statistics, there is a great deal of uncertainty regarding capacity utilisation.
The picture of a more strained resource situation tallies with the trend for the capital ratio, i.e. the capital stock in relation to the level of production, which has fallen sharply in recent years (see Diagram 10.1). A falling ratio implies that production is increasing in relation to the stock of real capital, which, in the short term, indicates an increase in resource utilisation. The Business Tendency Survey and estimates of profit shares show that industrial profitability is good, which is an important precondition for increased investment.
Consequently, there appears to be both a considerable need and favourable conditions for rising investment in industry this year. According to the preliminary National Accounts, the level of industrial investment was surprisingly low in the first half of this year, with an increase of barely 5 per cent in comparison with the corresponding period in 1999. Statistics Sweden's Investment Survey from May, however, shows that industrial firms' plans for the full year 2000 imply an increase of 12 per cent compared with 1999, which would mean a substantial growth in investment in the second half of this year. In previous phases of rapid growth, it has, however, proved difficult for firms to realise their expansionary investment plans fully in the short term. Therefore, it is estimated that industrial investment will rise by just under 8 per cent this year. Next year also, a relatively high rate of growth in production is expected. The increasing level of capacity utilisation and the fact that some delay in this year's investment suggest that investment will rise by approximately 8 per cent also in 2001.
Diagram 10.1 Capital ratio in industry
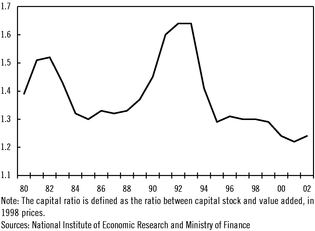
The uncertainty in the forecast for industrial investment is partly due to the difficult in assessing trends in cyclical base industry. Business activity in these sectors has improved markedly over the past year, with increased output, rising prices on such items as paper and paper pulp, as well as a high level
67
of capacity utilisation. High international demand for certain intermediate goods may mean that capital-intensive base industry will increase its output capacity to a greater extent than has been assumed in this forecast. At the same time, the difficulties in identifying the long-term trend in the capital ratio for industry should be pointed out. The ratio appears to have settled at a new and lower level during the second half of the 1990s, which is probably due to the ongoing structural transformation towards more knowledge-intensive production. The possibility that the ratio may fall more rapidly than has been assumed in this forecast cannot be ruled out, and this would result in an overestimation of investment growth.
Investment in other parts of the business sector
Last year, investment in the business sector excluding industry rose by a full 11 per cent. This very substantial rise can be explained by a temporarily high level of investment in ships and aircraft. If this factor is excluded, the increase is still a respectable 6 per cent. The economic situation has strengthened further in large parts of the business sector. During the first half of the year, output in the service sector increased by 5 per cent, and the number of employees by just over 80,000 persons in comparison with the corresponding period last year.
Most indicators point to continued strong investment growth in other parts of the business sector. Last year, commercial property prices rose by 3 per cent in Sweden as a whole at the same time as the vacancy ratio in metropolitan areas fell to its lowest level for ten years. Although property prices have initially fallen slightly this year, the price level remains high, which is an important prerequisite if investment in new properties is to be profitable. In addition, profitability in the service sector seems to have improved in recent years. According to NIER's Business Tendency Survey, firms in the trade sector, for example, report that profitability is now higher than at any time in the 1990s, while the number of bankruptcies is at its lowest level for a very long time. It should be noted that profit margins per unit produced have fallen in recent years in the service sector, and this has contributed to the low level of inflation (see Chapter 8). Consequently, the improvement in profitability can largely be explained by the substantial increases in sales volumes and by lower capital costs as a result of the decline in interest rates during the latter part of the 1990s.
NIER's Business Tendency Survey shows that there are expectations that the rise in construction of other buildings will continue. An increasing number of construction firms report that their profitability is currently good and that they anticipate an increase in production over the next few years. In addition, the inflow of orders to architects and to construction and other technical consulting is very high, and this normally points to an increase in investment over a one to two year time horizon.
Diagram 10.2 Real estate prices
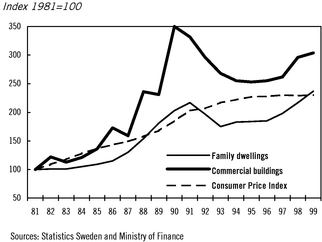
68
Statistics Sweden's Investment Survey confirms the picture of rising investment activity in other parts of the business sector this year. The picture is, however, varied to some extent. In the corporate services and post and telecommunications sectors, plans are expansionary. In telecommunications, the increase is partly explained by the continued expansion of mobile phone systems and the broadband network. In financial services and in trade, on the other hand, expansion plans are surprisingly modest. The limited investment plans within financial services are probably a consequence of structural changes resulting from mergers, and of the increased use of mail and banking services over the Internet, which is leading to a reduction in the number of bank branches and post offices. The Y2K conversion work is now over, a factor which is further dampening investment growth in the financial sector.
With respect to trade, it should be emphasised that, after the sharp increase in 1998, investment is already at a high level, and that last year's investment levels already involve a substantial expansion in capacity. According to the surveys, an important explanation for these restrained investment plans is that a decreasing number of firms within trade own properties, and so increased production in this sector is partly responsible for increased investment in the property sector. The anticipated sharp increase in household consumption is, however, expected to lead to greater and more widespread investment within trade both this year and next year than has been stated in the surveys.
Table 10.2 Gross fixed capital formation in the business sector excluding industry, real estate and housing
| | SEK
billion
| | Percentage change
|
|---|
| | 1999
| | 1998
| | 1999
| | 2000
| | 2001
|
|---|
| Agriculture and forestry | | 8 | | 1.6 | | -7.1 | | 4.0 | | 3.9 |
| Energy and hydropower | | 14 | | 3.0 | | -6.2 | | 4.0 | | 2.9 |
| Construction | | 10 | | 26.3 | | 22.7 | | 6.1 | | 5.8 |
| Retailing and wholesaling | | 26 | | 30.2 | | -0.9 | | 7.1 | | 6.2 |
| Financial services | | 8 | | 24.7 | | 13.5 | | -2.6 | | 5.1 |
| Corporate services | | 29 | | 25.7 | | 14.0 | | 6.5 | | 4.9 |
| Household services | | 10 | | 11.6 | | 9.7 | | 15.0 | | 3.8 |
| Property | | 15 | | 6.1 | | 1.6 | | 9.3 | | 6.9 |
| Other services | | 50 | | 4.3 | | 28.9 | | 6.2 | | 5.5 |
| | of which transport and communications | | 27 | | 1.7 | | 53.5 | | 1.6 | | 2.9 |
| | post, telecommunication | | 15 | | 4.5 | | 6.3 | | 15.6 | | 10.6 |
| | |
| |
| |
| |
| |
|
| Total | | 171 | | 13.6 | | 11.0 | | 6.5 | | 5.3 |
| | |
| |
| |
| |
| |
|
Sources: Statistics Sweden and Ministry of Finance
It should also be mentioned that, in the majority of sectors, investment in software, which constitutes 13 per cent of total investment, rose sharply during the first half of the year, according to the National Accounts. Over the next few years, this is expected to increase by about 6 per cent per year.
Overall, it is assessed that there is, in general, a considerable requirement to expand production capacity, and that investment in other parts of the business sector this year will exceed last year's level by approximately 6.5 per cent.
Diagram 10.3 shows that the capital ratio in other parts of the business sector excluding single family dwellings and real estate business has declined steadily since the beginning of the 1980s, disregarding the recession years of the early 1990s. The clear downward trend is partly due to reduced investment in the energy sector and to capital rationalisation in trade and in financial services. It is
69
difficult to identify the long-term trend of the capital ratio, but the substantial reduction last year is thought to be partly the result of increased capacity utilisation. It is calculated that this, in combination with the expectation that production will continue to increase strongly, will lead to an additional rise of about 5 per cent in investment in other parts of the business sector next year. The positive outlook for the construction sector supports such a forecast.
Diagram 10.3 Capital ratio in other parts of the business sector excluding real estate
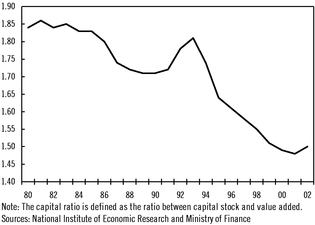
10.2 Residential investment
According to Statistics Sweden, construction began on about 14,000 dwellings last year, which is an increase of approximately 14 per cent on the preceding year. The increase has continued in the early part of this year, according to preliminary statistics from Statistics Sweden.
Fundamental factors suggest that residential construction will accelerate over the next few years. Rising property prices on the second-hand market and the declining vacancy ratio indicate that demand for housing is high at present (see Diagram 10.4). Even though the regional pattern is uneven, the ever-increasing price level means that, in many cases, new construction is highly profitable. The continued improvement in the labour market situation and the increasingly strong financial position of households are helping raise demand still further. In addition, interest rates have stabilised at a relatively low level.
NIER's Business Tendency Survey shows that expectations regarding residential construction are very positive for the second half of the year. Some disappointment was evident in the survey, in that the positive expectations of last year were not fulfilled. It can also be noted that despite many favourable circumstances and the current high demand, residential construction is still at a very low level. The increase in the number of apartments under construction last year and in the early part of this year was from the level of much of the 1990s, which was very low in a historical perspective. According to the forecasts made by the National Board of Housing, Building and Planning, annual construction of 25,000 - 30,000 dwellings would be necessary to meet long-term demand. Another indicator that residential construction is still restrained is that the inflow of orders to manufacturers of single-family dwellings has fallen somewhat in comparison with the first half of last year.
70
Diagram 10.4 Number of dwellings—vacant and new constructions
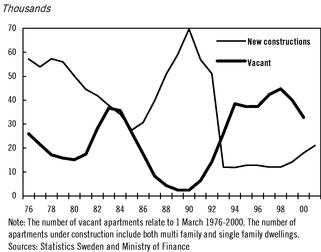
The likely explanations for the relatively low level of residential construction include the poor profitability of new construction of rental property, as well as some supply restrictions in the form of a shortage of construction workers and development land. These latter factors are partly due to the uneven regional development, with extremely high demand in the metropolitan areas. The supply restrictions mentioned above are expected to last to some extent for several years, and the number of dwellings under construction is, therefore, estimated at 18,000 this year and 21,000 next year, i.e. the same number as forecast in the Government Spring Bill.
Certain supply restrictions may explain the surprisingly low number of renovation and extension projects commenced so far this year. Another probable reason is the fact that profitability has previously been very poor among the public residential property companies. The fall in interest rates and the reduction in vacancy rates in recent years mean, however, that the financial situation has improved. This should mean that the number of commenced renovations and extensions over the next few years will exceed last year's level of 21,000 apartments. Due to the low outcome so far this year, and taking certain supply restrictions into account, the forecast for the number of renovations and extensions has been revised downward by approximately 1,000 dwellings per year compared to the Government Spring Bill, to 22,000 dwellings this year and to 25,000 next year.
On average, a new construction project takes about 12 months, and a renovation and extension project about 6 months. The sharp rise in new construction in progress which has taken place at the beginning of this year will therefore gradually affect volume growth this year and to some extent next year as well. The scope of various projects as well as the division between single-family dwellings and apartments in multi-family dwellings is also significant. Overall, it is estimated that residential investment will increase by approximately 5 per cent this year and 14 per cent next year.
10.3 Stocks
After a largely involuntary period of stock-building during 1998, stocks were gradually brought back to normal levels last year. Overall, the change in stocks made a negative contribution to GDP growth equivalent to 0.5 per cent of GDP in 1999. In contrast, during the first quarter of this year, the change in stocks made a positive contribution to growth of 0.7 per cent of GDP. The substantial increase in stocks is partly explained by the unexpectedly high level of stockbuilding in industry. Stock levels also rose sharply during the second quarter, which gave a positive contribution to GDP equivalent to 0.5 per cent. There is, however, a great deal of uncertainty about the outcome for the second quarter due to the fact that the version of the National Accounts that is published in August is, in many respects, a forecast.
71
The adjustment carried out last year is assessed to be more or less complete, and the increase in stocks in industry at the beginning of this year is assumed to have been mostly temporary. Over the next few years, it is expected that there will be voluntary stockbuilding in the business sector as a whole, as production levels gradually rise. Compared with the Government Spring Bill, in which stockbuilding was estimated to be growth-neutral up until the end of 2003, stock forecasts have been revised upward slightly this year, given that forecasts for both production and stockbuilding within trade are now higher. Overall, stockbuilding this year is expected to be somewhat higher that last year, and the GDP contribution is estimated at 0.2 per cent this year. Next year, the increase in production in both trade and industry will be lower, and this will result in slower growth in stocks. It is, therefore, estimated that the GDP contribution will be -0.1 per cent in 2001. For 2002 and 2003, it is assumed that stockbuilding will be in the same order of magnitude as next year, and will, therefore, be growth-neutral.
The substantial stockbuilding in industry at the beginning of this year is due to increased stocks in the pharmaceutical and telecommunication equipment industries. NIER's Business Tendency Survey shows that in the chemicals industry, in which pharmaceutical production is included, dissatisfaction with the stock situation increased during the first half of this year, and the figures from Statistics Sweden show that production in this sector fell in comparison with the early part of 1999. The worsened economic situation may result in an abnormally high level of stocks in the pharmaceutical industry during much of the current year. There seems to be no comparable dissatisfaction with stocks in the telecommunication equipment industry. For this reason, the growth in stocks in this sector is considered to be temporary, and these levels of stocks should adjust downward relatively quickly. NIER's Business Tendency Survey shows that, in general, industrial firms are satisfied with the stock situation, and, in the light of the high level of business activity in the majority of sectors, total stocks in industry are expected to grow in line with production.
Within trade, stock trends have been largely as expected in the early part of the year. The dissatisfaction with the stock situation which arose at the turn of the year in the automotive trade has not been dissipated, however, according to NIER's Business Tendency Survey. Consequently, there appears to be a need to reduce stocks in this sector. In the trade sector as a whole, stocks are, however, expected to increase somewhat in connection with rising domestic demand. Given that sales forecasts within trade are now higher, forecasts for stockbuilding have been raised in comparison to the figures in the Government Spring Bill.
72
11 General government sector
Net lending in the general government sector is estimated at approximately 3.5 per cent of GDP this year and next year. The positive lending figure contributes to the fall in central government debt and the fact that consolidated gross debt will fall below 60 per cent of GDP this year. Net debt will be replaced by a positive net financial position next year. Net lending for 2002 and 2003 is also forecast at approximately 3.5 per cent of GDP.
11.1 Consolidated general government sector
Net lending
General government sector net lending this year is expected to amount to approximately SEK 71 billion or 3.4 per cent of GDP. This is an improvement of 1.5 per cent of GDP compared with the figure for 1999. Lower interest expenditure accounts for almost 1 percentage point of this, which is partly the result of income from the sale of shares being used to repay central government debt. The direct receipt from the sale of shares is not, however, included in net lending. Both general government sector income and expenditure excluding interest are falling as a percentage of GDP. Part of the reduction is, however, due to the fact that both income and expenditure in the general government sector are being reduced with effect from this year by 0.5 per cent of GDP, as a consequence of the separation of the Church of Sweden from the State.
Net lending exceeded the targets of balance in 1998 and a surplus of 0.5 per cent of GDP in 1999. This year also, net lending is expected to exceed the target of 2 per cent of GDP. This is despite the tax cuts and other reforms implemented in recent years. Overall, it is estimated that the reforms implemented in the period 1998-2000 will charge the central government-budget by approximately 3.5 per cent of GDP in 2000. This implies that net lending in the general government sector would have amounted to approximately 7 per cent of GDP in the absence of the reforms, other things being equal. The scope for reform has been created through stable economic development with low inflation and low interest rates.
73
Table 11.1 General government finances
SEK billion, current prices
| | 1999
| | 2000
| | 2001
| | 2002
| | 2003
|
|---|
| Revenue | | 1187.8 | | 1218.7 | | 1248.1 | | 1281.2 | | 1335.4 |
| | | per cent of GDP | | 60.2 | | 58.9 | | 57.2 | | 56.4 | | 56.5 |
| | Taxes and charges | | 1043.2 | | 1074.9 | | 1110.4 | | 1141.8 | | 1190.7 |
| | | per cent of GDP | | 52.9 | | 52.0 | | 50.9 | | 50.3 | | 50.3 |
| | Capital income | | 70.2 | | 67.8 | | 59.2 | | 58.3 | | 61.1 |
| | Other revenue | | 74.3 | | 76.0 | | 78.5 | | 81.1 | | 83.5 |
| Expenditure | | 1150.8 | | 1147.4 | | 1172.4 | | 1206.3 | | 1251.2 |
| | | per cent of GDP | | 58.4 | | 55.5 | | 53.7 | | 53.1 | | 52.9 |
| | Transfers | | 463.8 | | 464.9 | | 475.7 | | 483.0 | | 506.2 |
| | Consumption and investment | | 581.6 | | 596.2 | | 619.9 | | 648.4 | | 674.5 |
| | Interest | | 105.4 | | 86.2 | | 76.8 | | 74.9 | | 70.6 |
| Net lending before technical transfer | | 36.9 | | 71.3 | | 75.7 | | 74.9 | | 84.1 |
| | | per cent of GDP | | 1.9 | | 3.4 | | 3.5 | | 3.3 | | 3.6 |
| Technical transfer | | — | | — | | — | | 29.5 | | 36.8 |
| | | per cent of GDP | | — | | — | | — | | 1.3 | | 1.6 |
| Net lending after technical transfer | | 36.9 | | 71.3 | | 75.7 | | 45.4 | | 47.3 |
| | | per cent of GDP | | 1.9 | | 3.4 | | 3.5 | | 2.0 | | 2.0 |
| Financial position | | | | | | | | | | |
| | Net debt | | 224.1 | | 10.1 | | -80.5 | | -134.4 | | -188.5 |
| | | per cent of GDP | | 11.4 | | 0.5 | | -3.7 | | -5.9 | | -8.0 |
| | Consolidated gross debt(1) | | 1294.4 | | 1218.5 | | 1162.6 | | 1140.4 | | 1141.5 |
| | | per cent of GDP | | 65.6 | | 58.9 | | 53.2 | | 50.2 | | 48.2 |
Note: The separation of the Church of Sweden from the State means that revenue and expenditure are reduced by 0.5% of GDP as from 2000.
- (1)
- The consolidated gross debt is defined according to the convergence criteria of the European Union (Maastricht).
Sources: National Institute of Economic Research, Statistics Sweden and Ministry of Finance
Next year, tax revenues will be reduced as a percentage of GDP to just under 51 per cent. There is a nominal decline in income from interest and dividends, as the National Pension Fund is transferring financial assets to a value of SEK 155 billion to central government. Since the majority of these assets are being used to reduce central government debt, the transfer will also contribute to a reduction in interest expenditure. Expenditure excluding interest will also fall as a percentage of GDP. Net lending for 2001 is estimated at approximately SEK 76 million or 3.5 per cent of GDP. Of this, SEK 8 billion, or 0.4 per cent of GDP, is a temporary effect of the tax on funds distributed to companies from the insurance company SPP.
Under the rules adopted and proposed to date, it is estimated that net lending as a percentage of GDP will amount to 3.3 per cent in 2002 and will strengthen to 3.6 per cent in 2003. Forecast net lending thus exceeds the budget target of a surplus of 2 per cent of GDP by SEK 30 billion and SEK 37 billion respectively. In the estimates for the period 2002-2003, a technical assumption is made that the additional surplus will be transferred to the household sector. In the estimates of central government interest expenditure, central government debt and general government sector financial position for the years 2002 and 2003, it is assumed that net lending will be in line with the budget target of 2 per cent of GDP.
74
Financial position
Net lending is the result of all transactions that affect financial net wealth. This means, for example, that sales of shares do not affect net lending. If the sales proceeds are used to amortise central government debt, then assets and liabilities are reduced equally, which means that the net financial position is unchanged. If the sales proceeds are, on the other hand, used for increased expenditure, net lending will fall. Since net lending is defined as the net of transactions, neither will changes in the value of assets and liabilities affect net lending.
General government debt, on the other hand, is affected by the acquisition and sale of financial assets, as well as by changes in value. General government consolidated gross debt, defined in accordance with the Maastricht criteria, was slightly more than 65 per cent of GDP at the end of 1999. With the financial surplus and the reduction in debt resulting from the sale of central government shareholdings, the debt is expected this year to be below the EU reference value of 60 per cent of GDP.
The general government financial net debt, i.e. debts minus total financial assets, is considerably lower than the consolidated gross debt. This is mainly due to the fact that the National Pension Fund has substantial financial assets in addition to government bonds. The central government and the local government sector also have financial assets in the form of, for example, shares and loans. The net debt will fall as a consequence of the financial surplus, and will also be affected by the changes in value which are taking place in the general government sector holdings of shares and bonds. The floatation of Telia AB will raise the book value of central government shares by approximately SEK 120 billion this year. This increase in value will reduce the net debt by a corresponding amount, over and above the reduction through net lending. A continued high level of net lending will cause the net debt to be replaced by a positive financial position as early as 2001. This means that, at that point, the value of the general government sector's financial assets will exceed the value of liabilities.
Comparison with the 2000 Government Spring Bill
General government net lending for 2000 is now estimated to be SEK 12 billion higher than was estimated in the Government Spring Bill. The improvement is largely due to higher tax revenues. Tax revenues will be raised further in 2001 due to the fact that GDP growth is now predicted to be higher than previously. In addition, compared to the Spring Bill, there will also be a temporary addition of SEK 8 billion from the tax on the funds distributed by the insurance company SPP. Notwithstanding the proposed tax changes, net lending has been revised upward since the Spring Bill by SEK 20 billion, or 1 per cent of GDP for 2001. Even after the tax changes, net lending will be SEK 5 billion higher in 2001 compared with the Spring Bill. For the years 2002 and 2003, net lending has been revised downward by SEK 7 billion and SEK 22 billion respectively, in comparison with the Spring Bill. This implies a corresponding reduction of the technical transfer for these years.
Consolidated gross debt has been adjusted upward by SEK 20 billion for 2000, since the sale of shares has not been as extensive as expected. For next year, this will be partly offset by higher net lending than in the Government Spring Bill. Overall, the forecast for gross debt in respect of 2001 has been revised upward by SEK 10 billion.
The net debt has been revised downward by approximately SEK 64 billion for 2000 in consequence of the fact that the full value of the central government's holding in Telia AB is now being recorded in financial assets. In the Spring Bill, a more conservative assessment was made of the market value because of the uncertainty then surrounding the sale of shares in Telia.
75
Taxes and charges
In the National Accounts, taxes are mainly recorded when the tax liability arises, and not as in the central government budget, when the tax is paid. The accounting practice with income taxes is, however, incomplete, since the taxes reported differ from the final tax assessment. Furthermore, the portion of value added tax and customs revenues which is included as part of the EU contribution is not accounted for as transactions in the general government sector but is treated as a tax for abroad. Total taxes are, consequently, greater than general government sector tax revenues.
Total tax revenues have risen sharply in recent years, and in 1999 amounted to 53.5 per cent of GDP (the tax ratio), see Table 11.2. This year, income taxes for households have been reduced by approximately SEK 12 billion, through a tax reduction of one quarter of the general pension contribution, and through raising the tax threshold for central government tax. Revenue from corporate taxation is being reduced during the forecast period through a previously decided extension of the opportunities for firms to defer taxes through appropriations to untaxed reserves and by extending the period for reversal to taxation from 5 to 6 years. This year, property tax on rented apartment buildings has been reduced to 1.2 per cent of the assessed value. Energy taxes have been raised to finance skills training in the corporate sector. Local government taxes have also been changed in certain municipalities and county councils, so that, on average, local government tax, including Church rates, increased from 31.48 per cent to 31.60 per cent. In addition, the separation of the Church of Sweden from the State means that, with effect from 1 January 2000, Church rates will no longer be treated as a tax, but as a membership fee, and this will reduce the reported tax ratio by 0.5 percentage points. Overall, the tax ratio will fall to 52.6 per cent of GDP this year.
For 2001, a further reduction in income tax for households is proposed, along the same lines as this year, as well as an increase of SEK 1,200 in the basic tax allowance. It is proposed to raise the car travel allowance by SEK 1 per 10 kilometres. In total, this means that income tax for households will fall by SEK 15 billion. In order to avoid an increased tax levy as a result of the expiry of the freeze on the assessed values of properties next year, changes in property tax and wealth tax are proposed.
Table 11.2 Taxes and charges
Per cent of GDP
| | 1999
| | 2000
| | 2001
|
|---|
| Household direct taxes and charges | | 22.4 | | 21.7 | | 20.8 |
| Company direct taxes | | 3.1 | | 2.9 | | 3.1 |
| Pay roll charges | | 14.9 | | 14.8 | | 14.6 |
| Value added tax | | 7.2 | | 7.5 | | 7.5 |
| Property tax | | 1.2 | | 1.1 | | 1.1 |
| Other production taxes | | 4.6 | | 4.6 | | 4.4 |
| | |
| |
| |
|
| Taxes and charges | | 53.5 | | 52.6 | | 51.5 |
| | of which to EU | | 0.6 | | 0.6 | | 0.6 |
| | |
| |
| |
|
Note: The transfer of the Church of Sweden from the local government sector to the household sector means that taxes are reduced by 0.5% of GDP as from 2000.
Sources: National Institute of Economic Research, Statistics Sweden and Ministry of Finance
It is proposed to adjust property taxes downward, from 1.5 per cent to 1.2 per cent of the assessed value for single-family dwellings, and from 1.2 per cent to 0.7 per cent for rented apartment buildings. It is also proposed to raise the exempted amount for wealth tax to SEK 1 million for single people, and to SEK 1.5 million for those taxed jointly. Taken together, the proposed changes to property tax and
76
wealth tax will lead to a tax reduction of approximately SEK 10 billion compared to the Government Spring Bill. It is proposed to raise the tax on capital gains on property from 15 per cent to 20 per cent, and to raise environmental taxes and energy taxes by just over SEK 3 billion. For value added tax on public transport, a cut is proposed from 12 per cent to 6 per cent, which is equivalent to just under SEK 1 billion. It is proposed to reduce employer contributions by 0.1 percentage points or SEK 1 billion. Overall, the proposed tax changes involve a tax reduction of SEK 15 billion in comparison with 2000. Together with previously adopted tax changes, periodised taxes will fall by SEK 23 billion next year. The tax on the funds distributed by SPP will temporarily raise tax revenues by SEK 8 billion, or 0.4 per cent of GDP next year. The tax changes, along with the slower growth of important tax bases in relation to GDP, will contribute to a fall in the tax ratio to 51.5 per cent next year.
Expenditure
In 1999, general government expenditure amounted to the equivalent of 58.4 per cent of GDP (the expenditure ratio). This is the same level as in 1990, the year before the economic crisis raised the expenditure ratio, peaking at 70 per cent in 1993. Table 11.1 shows that general government expenditure will fall as a percentage of GDP this year and next. The strong GDP growth both increases the denominator in the expenditure ratio and leads to lower expenditure on unemployment. The low inflation rate results in a correspondingly low nominal increase in pensions and other indexed expenditure. The reduced central government debt and low interest rates lead to lower interest expenditure.
Expenditure will also fall in real terms this year, see Table 11.3. However, 0.8 percentage points of the recorded real reduction of 2.8 per cent this year is the result of the separation of the Church of Sweden from the State. Excluding this effect and the sharp reduction in interest expenditure, expenditure in real terms will fall by 0.2 per cent. Next year, expenditure in real terms will increase by approximately 1 per cent excluding interest expenditure.
Transfers to households, which account for 34 per cent of general government expenditure, will increase in real terms by 0.3 per cent this year and by 1 per cent next year. Old-age pensions etc, which account for almost half of the transfer to households, will rise relatively slowly this year, partly since the base amount is indexed in accordance with the low inflation in 1999. Next year, the increase in supplementary pension payments and supplementary housing benefits will contribute to a sharper real increase. Payments from health insurance have risen substantially as a result of increased absence due to illness, and higher average compensation per day of illness. The rate of increase is expected to tail off this year, and then to stabilise. Personal assistant grants also increased sharply, and will continue to increase rapidly. The improved situation on the labour market will lead to lower costs for unemployment benefits. Social security benefits and housing benefits are also expected to fall as a result of the positive economic development. Child benefit has been raised this year and a further increase will take place next year. Study allowances paid and payments to people on the Adult Education Initiative fell sharply last year, and will continue to fall this year. This is due to a reduction in the number of recipients of study support. Next year, payments will rise as a result of the replacement of the present forms of study support by a new study support system on 1 July 2001. This reform involves, among other things, an increase in the general level of grant, and this will increase the payments recorded in the National Accounts, since the loan element in the study support system is not treated as expenditure.
77
Table 11.3 General government expenditure
| | Share of
total,
per cent
| | Percentage change,
constant prices
|
|---|
| | 1999
| | 1999
| | 2000
| | 2001
|
|---|
| Total expenditure | | 100.0 | | 0.5 | | -2.8 | | 0.1 |
| | exclusive of interest | | 90.9 | | 1.6 | | -1.2 | | 1.1 |
| Transfers to households | | 34.2 | | 1.9 | | 0.3 | | 1.1 |
| | Pensions | | 16.0 | | — | | 0.3 | | 1.4 |
| | Health related | | 6.8 | | — | | 9.8 | | 5.1 |
| | Labour market related | | 4.0 | | — | | -13.9 | | -11.3 |
| | Family related | | 3.4 | | — | | 3.6 | | 4.0 |
| | Study related | | 1.3 | | — | | -9.4 | | 3.9 |
| | Other | | 2.8 | | — | | -2.3 | | -1.3 |
| Other transfers | | 5.9 | | -1.5 | | -8.1 | | 0.5 |
| | Interest subsidies | | 0.6 | | -32.0 | | -48.1 | | -48.5 |
| | Contribution to EU, part based on GNI | | 0.8 | | 4.7 | | 6.3 | | 10.6 |
| | Foreign aid etc. | | 1.1 | | 5.6 | | 12.3 | | 4.7 |
| Interest expenditure | | 9.1 | | -9.9 | | -19.2 | | -12.1 |
| Consumption | | 46.1 | | 1.8 | | -1.4 | | 0.9 |
| Investment | | 4.7 | | 2.9 | | -2.0 | | 4.6 |
Note: Exclusive the transfer of the Church of Sweden from the local government sector to the household sector total expenditure is calculated to -2.0%, total expenditure excl. interest to - -0.2% and consumption to 0.6% year 2000.
Sources: National Institute of Economic Research, Statistics Sweden and Ministry of Finance
Other transfers account for 6 per cent of general government expenditure, and consist of subsidies and other allowances to the business sector and abroad. Transfers to the business sector include expenditure for areas such as labour market, regional and environmental policies, as well as central government and local government support for sectors such as housing and transport. Grants to the business sector will fall relatively sharply during the forecast period. This applies, for example, to interest subsidies for housing, which have fallen from over SEK 35 billion in 1993 to just over SEK 7 billion in 1999. In 2001, it is estimated that the subsidy will amount to only SEK 2 billion. This further reduction is largely due to the fact that the subsidy is granted on a gradually decreasing proportion of the interest costs.
The GNI-based EU contribution will amount to approximately SEK 10 billion this year, and the total EU contribution to just over SEK 22 billion. The difference is due to part of the contribution being financed by Customs funds and by Value Added Tax. As mentioned above, this part is entered in the National Accounts as a tax to the EU, and it is only the GNI contribution which is recorded as an expenditure item for the general government sector. This year and next, the GNI contribution will rise relatively sharply, partly as a result of the fact that the greater part of the contribution to the EU will be based on the GNI. The total contribution will also increase substantially this year, partly due to exchange rate effects resulting in a temporarily low contribution in 1999. Expenditure on aid will also rise considerably this year, after the expenditure limits which applied last year.
General government consumption accounts for 46 per cent of general government expenditure, and is equivalent to around 27 per cent of GDP. General government consumption declined in connection with the consolidation of public finances, but after increases in 1998 and 1999, general government consumption at constant prices is now slightly more than 2 per cent above the 1993 level.
78
Consumption will fall this year through the reclassification of the Church of Sweden from the general government sector to the household sector. Excluding this transfer, it is estimated that consumption by central and local government will show an overall increase in volume of 0.6 per cent this year. Next year, general government consumption is expected to increase by approximately 1 per cent, which is considerably lower than the GDP growth of 3.5 per cent. As a percentage of GDP, however, general government consumption will fall by only one half of a percentage point, since price trends for general government consumption are higher than for GDP.
Fiscal policy
The forecasts reported in previous sections imply that general government sector net lending will improve by 1.5 per cent this year to approximately 3.5 per cent of GDP. Next year also, the surplus is estimated to amount to 3.5 per cent of GDP. If the technical transfer is not taken into account, the surplus is estimated to remain at this level for the remainder of the period of the estimate. This means that public finances are estimated to have a tightening effect on the economy this year and a more or less neutral effect in subsequent years. In the event of growth in the economy exceeding the long-term trend, public finances will be strengthened in the absence of regulatory changes through what are known as automatic stabilisers. These restrain private sector demand. Discretionary fiscal policy measures strengthen or counteract the effects of the automatic stabilisers. Table 11.4 gives a rough indicator of discretionary fiscal policy, i.e. that part of the change in the general government surplus which is due to political decisions. After adjusting the surplus for economic developments and the accounting practice with tax revenue, etc, a residual item remains, which can be interpreted as a rough indicator of the fiscal stance. This indicator includes not only the effect of the measures proposed in this Bill, but also decisions which have been taken previously, but which will not come into force until during the reported years. In addition, allowance is made for the effects of volume factors in the transfer system, which are not directly affected by active decisions.
Table 11.4 Calculation of the direction of fiscal policy
Per cent of GDP
| | 1999
| | 2000
| | 2001
| | 2002
| | 2003
|
|---|
| Change of net lending before technical transfer | | 0.0 | | 1.5 | | 0.0 | | -0.2 | | 0.3 |
| of which | | | | | | | | | | |
| | Economic growth including tax base shifts | | 1.6 | | 1.4 | | 0.7 | | -0.2 | | 0.0 |
| | Timing of tax revenues | | -0.9 | | 0.4 | | 0.6 | | -0.6 | | -0.2 |
| | Net purchase of property and capital transfers | | -0.9 | | 0.0 | | 0.0 | | 0.0 | | 0.0 |
| | Capital income and interest expenditure, net | | 0.0 | | 0.9 | | 0.1 | | 0.1 | | 0.3 |
| Adjusted net lending before technical transfer | | 0.2 | | -1.1 | | -1.3 | | 0.5 | | 0.2 |
| Technical transfer | | — | | — | | — | | -1.3 | | -0.3 |
| Adjusted net lending after technical tansfer(1) | | 0.2 | | -1.1 | | -1.3 | | -0.8 | | -0.1 |
- (1)
- The adjusted net lending indicates the direction of fiscal policy. A negative sign means that the direction is expansive and a positive sign means that the direction is contractive.
Source: Ministry of Finance
The component that refers to the economic cycle takes into account both GDP growth and the development of the most important tax bases in relation to GDP. The part that affects the GDP development is measured as 75 per cent of the deviation in GDP growth from an assumed normal development of 2 per cent.
79
The way that general government net lending is affected by the economic cycle not only depends on GDP growth, but also on the composition of that growth. Export-led growth provides lower tax revenues than if the growth is driven by private consumption. Shifts between profits and wages also affect tax revenues as profits are, in the short term, taxed at a lower rate than wages. The substantial increase in employment last year meant that the wage bill rose more than GDP. This increased the effect of the level of economic activity on public finances over and above the effect following from a GDP growth higher than 2 per cent. Next year, the most important tax bases are expected to rise slightly more slowly than GDP, and this will moderate the effect of growth on public finances.
The incomplete accounting practice with tax revenue for firms and households in the National Accounts means that the taxes reported differ from the final tax assessment. For individual years, the effects of the accounting practice can be substantial, but over a period of several years, they should even out. Last year, the final tax assessment increased considerably more than the taxes reported in the National Accounts, which means that the improvement in "underlying" net lending was understated. This year and next, taxes reported in the National Accounts are expected to increase more than the final tax assessment.
The amounts registered in the National Accounts as purchases and sales of properties are often a result of incidental transactions. In 1998, general government net lending was raised by the transfer of the National Pension Fund's properties to a company. This affected the change in net lending between 1998 and 1999.
The financial surplus is causing a steady decrease in the indebtedness of the general government sector. This is reducing the interest burden, which makes a positive contribution to the improvement in public finances. With an unchanged surplus target, this generates scope for reform. The utilisation of such scope is recorded in Table 11.4 as a reduction in adjusted primary net lending, and accordingly as an expansionary fiscal stance. For 2000, a large proportion of the tax cuts will be financed through reduced interest expenditure on central government debt.
As shown in Table 11.4, adjusted primary net lending as a percentage of GDP rose marginally in 1999, which indicates that fiscal policy was slightly tight last year. This year and next year, the fiscal stance will be expansionary, according to the reported indicator. This must be seen in the light of the fact that there are assessed to be available resources in the economy and that the output gap, i.e. the difference between actual and potential output, is not expected to close until next year. The upward revision of GDP which is made in the forecast is, consequently, regarded as the result of a lasting recovery. It should also be noted that the household saving ratio has fallen, and is now very low. It is, therefore, reasonable to assume that part of households' increased incomes will be used for a gradual raising of the saving ratio. Inflation and inflation expectations also remain at a low level. The expansionary fiscal stance is not, therefore, assessed to increase the risk of overheating.
For the years 2002 and 2003, fiscal policy before the technical transfer is considered to be restrictive. After the assumption of the technical transfer, fiscal policy would be expansionary in 2002. The estimates for 2002 and 2003 are, however, very uncertain, and the technical transfer does not imply that any position has been adopted on how the extra surplus shall be used.
11.2 Central government
Central government net lending amounted to SEK 76.5 billion last year, and the budget balance showed a surplus of SEK 82 billion. Central government debt fell by SEK 75 billion, after a steady total increase between 1990 and 1998 of SEK 900 billion.
Central government net lending will vary significantly during the forecast period, as a result of the financial phasing-in of the reformed old-age pension system. The reform involves a considerable burden on central government finances. Central government old-age pension charges, transfers of funds to the
80
premium pension system, and the change of pension charges, etc. result in an annual net weakening in central government finances of SEK 60 billion. In addition, pension expenditure of SEK 7.5 billion will be transferred to central government from the old-age pension system with effect from 1 January 2003. As compensation for this weakening, funds equivalent to SEK 45 billion each year have been transferred from the National Pension Fund to the central government during the years 1999 and 2000, for amortising central government debt. In 2001, there will be an additional transfer of SEK 155 billion. This final transfer will constitute compensation for the subsequent period as well.
It is assumed that up to SEK 75 billion of the transfer will consist of treasury bonds, which do not affect the recorded budget balance, but are written off directly against central government debt. Part of the transfer in 2001 is assumed to comprise mortgage bonds, which will be managed by the Swedish National Debt Office until the bonds fall due for payment. That part of these bonds which falls due after 2001 will not, therefore, affect the central government budget balance and debt in that year. It has been assumed in the forecast that SEK 27 billion will fall due in 2002, and SEK 5 billion will fall due in 2003, which will improve the budget balance by a corresponding amount. In 2003, when the phasing-in of the pension reform has been completed, it is estimated that central government net lending will show a deficit of almost SEK 30 million, or 1.2 per cent of GDP, including the technical transfer. The surplus in general government sector net lending will arise instead in the old-age pension system, and to some extent in the local government sector. This is a result of the fact that the pension reform involves a very large redistribution of general government net lending from central government to the old-age pension system.
Through the sale of central government owned shares, the budget balance and the total amortisation of the central government debt will be slightly greater than the net surplus for the period 2000-2003. Central government debt is estimated to be reduced by just over SEK 200 billion between 1999 and 2003, to a level equivalent to approximately 49.3 per cent of GDP.
81
Table 11.5 Central government finances
SEK billion, current prices
| | 1999
| | 2000
| | 2001
| | 2002
| | 2003
|
|---|
| Revenue | | 738.5 | | 714.7 | | 835.9 | | 700.7 | | 720.5 |
| | Taxes and charges | | 631.7 | | 607.2 | | 620.7 | | 640.1 | | 659.0 |
| | Transfer from the pension fund | | 45.0 | | 45.0 | | 155.0 | | — | | — |
| | Other revenue | | 61.7 | | 62.5 | | 60.2 | | 60.6 | | 61.5 |
| Expenditure | | 662.0 | | 708.8 | | 678.3 | | 690.9 | | 711.1 |
| | Transfers to private sector and abroad | | 290.9 | | 288.6 | | 294.6 | | 295.4 | | 317.8 |
| | Contribution to local government | | 83.1 | | 81.6 | | 84.2 | | 86.9 | | 79.8 |
| | Old age pension charges to the pension fund | | 15.6 | | 19.9 | | 21.2 | | 22.9 | | 24.0 |
| | Transfer of premium reserve funds | | — | | 56.0 | | 17.3 | | 19.5 | | 20.4 |
| | Consumption and investment | | 175.2 | | 184.5 | | 191.9 | | 198.5 | | 205.3 |
| | Interest | | 97.3 | | 78.3 | | 69.1 | | 67.7 | | 63.8 |
| Net lending before technical transfer | | 76.5 | | 5.9 | | 157.6 | | 9.8 | | 9.4 |
| | per cent of GDP | | 3.9 | | 0.3 | | 7.2 | | 0.4 | | 0.4 |
| Technical transfer | | — | | — | | — | | 29.5 | | 36.8 |
| Net lending after technical transfer | | 76.5 | | 5.9 | | 157.6 | | -19.7 | | -27.4 |
| | per cent of GDP | | 3.9 | | 0.3 | | 7.2 | | -0.9 | | -1.2 |
| Budget balance | | 82.0 | | 76.2 | | 22.4 | | 1.4 | | -18.6 |
| | per cent of GDP | | 4.2 | | 3.7 | | 1.0 | | 0.1 | | -0.8 |
| Central government debt | | 1374.2 | | 1275.3 | | 1163.0 | | 1153.1 | | 1164.9 |
| | per cent of GDP | | 69.7 | | 61.7 | | 53.3 | | 50.8 | | 49.3 |
Sources: National Institute of Economic Research, Statistics Sweden and Ministry of Finance
Normally, however, the budget balance is somewhat lower than net lending, since the central government has a certain amount of lending, such as student loans. Adjusted for the temporary effects of the transfers from the National Pension Fund and the sale of government-owned shares, the budget balance for the years 2002 and 2003 will show a deficit of SEK 40 billion, after the technical transfer. Central government has, consequently, an underlying borrowing requirement, and central government debt will increase when the temporary factors are removed. The surplus in the general government sector will, instead, be used to build up the pension funds in preparation for the large number of retirements over the next decade.
Central government consumption accounts for one quarter of general government expenditure, and approximately 8 per cent of GDP. Central government consumption fell unexpectedly by approximately 3 per cent in volume during the first half of the year according to the preliminary results of the National Accounts. The preliminary results have shown to be uncertain and often undergo major revisions. The central government's budget outcome for the first six months does not indicate any decrease in central government consumption. Nor do the forecasts which can be made on the basis of the central government budget suggest any reduction for the full year 2000. Against this background, central government consumption is estimated to remain unchanged this year. For the period 2001-2003, an increase in volume of 0.5 per cent per year is forecast.
11.3 The old-age pension system
In 1999, revenue by way of charges for National Supplementary Pensions was approximately SEK 24 billion less than the pensions paid out. This deficit was financed by the direct yield from the National Pension Fund in the form of dividends and interest income, which, in total, amounted to SEK 37 billion. The transfer to central government of SEK 45 billion (see Chapter 11.2) led to net lending showing a deficit of SEK 36.7 billion. Despite this deficit, the value of the National Pension Fund's assets increased as result of the rise in value of shares.
82
Table 11.6 Old-age pension system
SEK billion, current prices
| | 1999
| | 2000
| | 2001
| | 2002
| | 2003
|
|---|
| Revenue | | 148.2 | | 237.5 | | 200.2 | | 208.9 | | 219.4 |
| | Contributions | | 111.0 | | 149.5 | | 156.4 | | 162.8 | | 169.3 |
| | Premium reserve funds | | — | | 56.0 | | 17.3 | | 19.5 | | 20.4 |
| | Interest, dividend etc. | | 37.1 | | 31.9 | | 26.4 | | 26.5 | | 29.7 |
| Expenditure | | 184.9 | | 185.1 | | 299.7 | | 150.8 | | 151.1 |
| | Pensions | | 135.0 | | 138.8 | | 143.4 | | 149.5 | | 149.7 |
| | Transfer to central government | | 45.0 | | 45.0 | | 155.0 | | — | | — |
| | Other | | 4.9 | | 1.3 | | 1.3 | | 1.3 | | 1.4 |
| Net lending | | -36.7 | | 52.4 | | -99.5 | | 58.1 | | 68.3 |
| | per cent of GDP | | -1.9 | | 2.5 | | -4.6 | | 2.6 | | 2.9 |
| Pension fund | | — | | -3.4 | | -119.4 | | 35.0 | | 43.1 |
| Premium pension system | | — | | 55.8 | | 19.9 | | 23.1 | | 25.1 |
Sources: National Institute of Economic Research, The National Debt Office, Statistics Sweden and Ministry of Finance
The old-age pension reform means that the National Pension Fund is taking on a partially new role as of 1999. The National Pension Fund is now financing income-based old-age pensions within the "distribution section" of the reformed system. The funding responsibility for disability and survivor pensions has been transferred to the central government budget. In addition, the reform means that the National Pension Fund's revenue by way of charges has been improved with the introduction of central government old-age pension charges on some transfers, etc., which are paid within the central government budget. The levels of the National Supplementary Pension charge and the old-age pension charge were increased from 2000 onwards to 7 per cent and 10.21 per cent respectively. The increase in the National Supplementary Pension charge by 3.81 percentage points is offset by correspondingly lower employer contributions to central government, so that the total charge withdrawal is largely unchanged. This involves an exchange of contributions between central government and the old-age pension system equivalent to SEK 30 billion.
Alongside the National Pension Fund, an asset base is being built up within the premium pension system. The funds allocated correspond to earned premium pension rights, and are invested initially with the Swedish National Debt Office, and subsequently with a fund manager chosen by the beneficiary. As the central government Premium Pension Authority is the formal owner of the mutual funds, savings in the premium pension system are included in the National Accounts as part of the general government sector. During the year 2000, retroactive premium pension funds totalling SEK 56 billion for the years 1995-1998 are transferred from the temporary management of the Swedish National Debt Office to the Premium Pension Authority. The balance in the premium pension system will, therefore, correspond to a reduced central government balance. Funds corresponding to the premium pension right will not be transferred to the Premium Pension Authority until the second year after the year of income. With effect from the income year 1999, the earned premium pension right has been raised from 2 per cent to 2.5 per cent of pension-based incomes and amounts.
As a result of the phasing in of the pension reform, the National Pension Fund's net lending will decline for the years 1999-2001. When the phasing-in has been completed in 2002, it is estimated that the balance in the pension system, i.e. the National Pension Fund and the premium pension system, will amount to 2.6 per cent of GDP. In 2003, the balance will rise to 2.9 per cent of GDP in consequence of the central government taking over expenditure of SEK 7.5 billion for residence-based old-age pension. This means that a sum in excess of the whole of the surplus target of 2 per cent of GDP for
83
the general government sector will be in the pension system, and will be used to build up the pension funds.
11.4 Local government
The favourable development in tax revenues and central government grants will create scope for continued growth in local government consumption this year and next. The local government sector as a whole is expected to meet the balanced budget requirement in and after the year 2000.
Under the Local Government Act, from the year 2000 onwards, municipalities and county councils will be obliged to balance their budgets. If the outcome shows that expenditure exceeds revenue, the deficit must be eliminated within two years. The forecast for the local government sector's consumption expenditure takes the balanced budget requirement into account, and assumes that local government tax rates remain unchanged.
Table 11.7 Local government finances
SEK billion, current prices
| | 1999
| | 2000
| | 2001
| | 2002
| | 2003
|
|---|
| Revenue | | 450.9 | | 471.0 | | 491.8 | | 503.1 | | 521.8 |
| | Taxes | | 316.0 | | 338.1 | | 354.5 | | 361.8 | | 386.5 |
| | Central government grant(1) | | 83.1 | | 81.5 | | 84.2 | | 86.9 | | 79.8 |
| | Tax and central government grant, % of GDP | | 20.2 | | 20.3 | (2) | 20.1 | | 19.8 | | 19.7 |
| | Other | | 51.8 | | 51.3 | | 53.0 | | 54.3 | | 55.5 |
| Expenditure | | 453.7 | | 458.0 | | 474.1 | | 496.0 | | 515.4 |
| | Consumption | | 378.3 | | 381.6 | | 396.2 | | 416.5 | | 434.1 |
| | percentage change in volume(3) | | 2.0 | | -1.9 | (4) | 1.0 | | 1.2 | | 1.1 |
| | Other | | 75.4 | | 76.4 | | 77.9 | | 79.5 | | 81.3 |
| Net lending | | -2.9 | | 13.0 | | 17.6 | | 7.1 | | 6.5 |
Note: Church parishes are note included in local government from year 2000.
- (1)
- Reported net after deductions for local government contributions to the value added tax repayment system.
- (2)
- After the separation of the Church of Sweden from the State. Including the Church of Sweden the share amounts to 20.8%.
- (3)
- Annual percentage change in fixed prices.
- (4)
- The effect of the transfer of the Church of Sweden from the local government sector to non-profit organisations serving households amounts to 2.7% of consumption expenditure. Excluding this transfer, the growth rate is 0.7%.
Sources: National Institute of Economic Research, Statistics Sweden and Ministry of Finance
Revenues in the local government sector will continue to grow strongly this year and next. The increase in tax revenues is expected to continue, as a result of the strong growth in employment. The average tax rate for municipalities and county councils for 2000 is 30.38 per cent, and is estimated to remain stable at this level throughout the period until the end of 2003. Since the sanctions on local authority tax increases ceased to apply at the end of 1999, municipalities have raised their tax rates on average by SEK 0.01, while county councils have raised their tax rates by an average of SEK 0.08. Tax revenues will increase sharply until the end of 2003. Part of this increase is due, however, to changes in the rules for the taxation of income, the overall effects of which are to increase the local government
84
sector's tax base. The standard central government grant has been adjusted to a corresponding degree. The reduction in the standard central government grant will be balanced by an equal rise in tax revenues as a result of the guaranteed pension becoming taxable.
The central government grant to municipalities and county councils has been raised in several stages, beginning in 1997. This year, the central government grant to municipalities and county councils will be SEK 20 billion higher than in 1996. This does not take account of the changes in the rules for the taxation of income. For 2001, the government is proposing to raise the central government grant by an additional SEK 4 billion. SEK 1 billion of these funds relates to the investment in health and care services which the government already announced in the Budget Bill for 2000.
The local government sector tax revenues and central government grants as a percentage of GDP, known as the local government tax ratio, will increase from 20.2 per cent in 1999 to 20.8 per cent in 2000, excluding the effect of the transfer of the Church of Sweden from the local government sector to non-profit organisations serving households.(6)
- (6)
- From 1 January this year, the Church of Sweden is separate from the State. In the National Accounts, the Church of Sweden was formerly included in the local government sector. In future, the Church of Sweden will be included under non-profit organisations serving households.
This year and next year, revenue received by municipalities and county councils will increase by a temporary transfer of central government income tax equivalent to SEK 1.3 billion per year. Investment in primary education in the form of an increased central government grant is estimated at SEK 0.5 billion for 2001, SEK 1.5 billion for 2002 and SEK 2.5 billion for 2003. The forecast also takes account of the family policy reforms announced by the government.
According to the National Accounts, the local government sector's consumption expenditure increased in the first half of this year by 0.1 per cent in volume, compared with the corresponding period last year.(7) In view of the outcome, the consumption forecast for this year has been revised downward in relation to the forecast in the Government Spring Bill. Measured as an annual average, consumption is estimated to rise by 0.7 per cent between 1999 and 2000, with municipalities growing by 0.3 per cent and county councils by 1.6 per cent. If the transfer of the Church of Sweden from the local government sector to non-profit organisations serving households is taken into account, the consumption volume this year will fall by 1.9 per cent.
- (7)
- Excluding the effect of the transfer of the Church of Sweden from the State to non-profit organisations serving households. If the transfer is taken into account, consumption volume falls by 2.5 per cent.
85
Table 11.8 Municipalities' and county councils' consumption
Percentage change
| | 2000
| | 2001
| | 2002
| | 2003
|
|---|
| Municipalities | | | | | | | | |
| Consumption | | 0.3 | | 1.1 | | 1.6 | | 1.0 |
| Production | | 0.4 | | 1.2 | | 1.6 | | 1.1 |
| Number of hours worked | | 0.5 | | 0.9 | | 1.4 | | 0.9 |
| County councils | | | | | | | | |
| Consumption | | 1.6 | | 0.9 | | 0.3 | | 1.2 |
| Production | | 1.3 | | 0.7 | | 0.8 | | 0.8 |
| Number of hours worked | | 0.8 | | 0.5 | | 0.5 | | 0.5 |
Sources: National Institute of Economic Research, Statistics Sweden and Ministry of Finance
Between 2000 and 2003, it is estimated that the financial scope in municipalities will permit an average increase in consumption volumes of 1.0 per cent per year. If the effects of the gradual scaling down of the Adult Education Initiative are removed from consumption expenditure, the average rate of growth becomes 1.4 per cent per year for the years 2002-2003. Spending on increasing the number of teachers in schools is expected to result in higher growth in consumption of two-tenths in 2002 and 2003. The county councils are expected to reduce consumption growth for the period 2001-2002, compared with 2000, to ensure that they meet the balanced budget requirement. Despite this, it is estimated that consumption volumes can increase by 0.8 per cent per year on average for the years 2001-2003.
It is estimated that net lending in the local government sector this year will amount to SEK 13 billion, and next year to SEK 18 billion. Of this, approximately SEK 10 and SEK 5 billion respectively are due to temporarily high income tax revenue as a result of the final settlement of taxes for the years 1999 and 2000.(8) Municipalities and county councils are not expected to increase their expenditure in view of the temporary increase in revenues, but instead to adjust their expenditure to their more permanent revenue level. Net lending is considered to be sufficiently high to permit municipalities to meet the balanced budget requirement from the year 2000 onwards, while county councils are not expected to fulfil the balanced budget requirement until the year 2001.
- (8)
- In the National Accounts, the difference between preliminary and final tax revenues is taken up in the year following the actual income year. Municipalities and county councils are then either liable for repayment or receive additional tax revenue. The payments are made in January the following year.
86
Central Government net lending and budget balance
Net lending is defined by an international framework of rules for national accounts. A detailed framework exists for the EU, ESA 1995, which all member states are obliged to follow. Net lending is the net of transactions which affect a sector's financial wealth. The change in financial wealth resulting from a revaluation of assets and liabilities is not included in net lending. This is due to the fact that the definition is based on transactions between two parties.
The central government budget balance is a national measure, which shows the central government borrowing requirement or the amortisation of central government debt. Similar national measures are found in other countries, but are not comparable due to differences in institutional circumstances.
The principal difference in Sweden between central government net lending and the central government budget balance is that net lending takes account of changes in both financial assets and liabilities, whereas the budget balance only reflects changes in central government debt. This difference means that amortisation of central government debt which is financed through the disposal of financial assets is not included in net lending, since financial wealth is not affected by this type of transaction. Nor does the increase in debt arising from central government lending, such as student loans, affect net lending, since the loan is balanced by a claim. Established losses on lending do, however, reduce net lending.
Apart from the principal difference between the concepts, there are also differences due to different accounting treatments of, in particular, tax and interest rates between the National Accounts and the budget accounts. With respect to central government interest expenditure, there is also a difference in the accounting procedure for realised changes in exchange rates and currencies. This affects the budget balance but not net lending, since realised changes in exchange rates are treated as changes in value in the National Accounts.
The difference between the concepts is not affected by whether an item of income or expenditure is temporary, but only by how it affects the financial position. For this reason, it is possible to speak of an underlying net lending and, similarly, of an underlying budget balance, in which temporary factors are excluded.
The table shows the difference between central government net lending and the budget balance. Central government debt is affected not only by the budget balance, but also by debt allocations, which consist largely of unrealised exchange rate changes on debts in foreign currencies. For 2001, debt allocations are particularly large. This is due to the fact that the transfer of government bonds from the National Pension Fund is being written off directly to central government debt rather than being recorded in the budget balance. This increases the difference between net lending and the budget balance, since the transfer from the National Pension Fund is counted in central government net lending.
Net lending and budget balance
SEK billion
| | 1999
| | 2000
| | 2001
| | 2002
| | 2003
|
|---|
| Net lending | | 76 | | 6 | | 158 | | -20 | | -27 |
| Effects of transf. fr. the National Pension Fund | | — | | — | | -127 | | 27 | | 5 |
| Student loans, net of amortising | | -8 | | -8 | | -9 | | -8 | | -8 |
| Sales of shares | | — | | 75 | | 15 | | 15 | | 15 |
| Realised value gains and losses, net | | -4 | | -9 | | -12 | | -9 | | -5 |
| Effects of timing differences | | 6 | | 3 | | -2 | | -3 | | 3 |
| Other | | 11 | | 11 | | 0 | | -1 | | -1 |
| Budget balance = Reduced borrowing | | 82 | | 76 | | 22 | | 1 | | -19 |
| Debt disposals = Increased borrowing | | 7 | �� | -23 | | -90 | | -9 | | -7 |
| Change of central government debt | | -75 | | -99 | | -112 | | -10 | | 12 |
| Central government debt, level | | 1374 | | 1275 | | 1163 | | 1153 | | 1165 |
Sources: Statistics Sweden and Ministry of Finance
87
12 Evaluation of short-term economic forecasts
The Ministry of Finance's economic assessments form the basis for decisions on the central government budget and the orientation of economic policy. The importance of a high degree of precision in the forecasts has grown as the economic policy targets have become more closely connected to the expected development of a number of macroeconomic variables. It is therefore important that the forecasts are evaluated continuously to improve their precision. Discussing the Ministry of Finance's forecasts in relation to the assessments made by other forecasters also provides important insight into whether there are common tendencies, whether different conditions for making forecasts can affect the result and how large forecast errors can be regarded as normal.
Below follows a discussion of how and why the Ministry of Finance's forecasts for 1999 were gradually revised with effect from spring 1998, and a description of the differences and similarities that can be distinguished between the Ministry of Finance and other forecasters during the 1990s.
All in all, it can be concluded that the economic analysts generally make similar errors in their forecasts. The Ministry of Finance's forecasts compare well with other analysts with regard to precision, although growth has been overestimated slightly more than by other forecasters. Both Statistics Sweden, which compiles the outcome, and forecasting institutes appear to have difficulty in estimating the strength of rises and falls in economic activity at an early stage, which mars the precision of the forecast. Further information on outcome contributes considerably to the precision of the assessments.
12.1 Ministry of Finance forecasts
Forecasts for 1999
The year 1999 was characterised by strong economic growth, favourable developments on the labour market and a very moderate price pressure. No forecaster envisaged that developments would be this favourable until the autumn of 1999, largely because of the uncertainty regarding the indirect effects of the Asian crisis and the financial crisis in Russia in autumn 1998. Diagram 12.1 and table 12.1 show the Ministry of Finance's errors in forecasting with regard to a number of variables in four forecasts for 1999.
Diagram 12.1 Ministry of Finance forecast errors for 1999
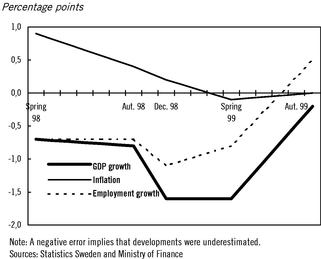
In spring 1998, the prospects for strong economic growth in Sweden were estimated to be bright. The effects of the Asian crisis on real global growth were expected to be relatively limited, partly due to the weakened price pressure, which was expected to lead to a looser monetary policy in both the United States and Europe. Swedish exports were thus expected to make a recovery as early as 1999.
88
Household consumption was estimated to continue to strengthen, partly as a result of a strong growth in employment, low inflation and low interest rates. The strong demand situation, together with the low interest rate level, was also expected to have a positive effect on gross capital formation. The overall economic picture painted in this situation agreed relatively well with the annual outcome for 1999, although the growth in domestic demand was underestimated and international developments were slightly poorer than expected. The underlying inflationary pressure in the economy, which is manifested in trade margins, was overestimated, despite an assumption that wage increases would be limited to 3 per cent per year, which was lower than the actual outcome.
The Government Budget Bill for 1999, which was compiled in autumn 1998, stated that international economic activity had been further dampened. At the same time, the conditions for domestic demand were assessed to have improved, partly as a result of the stronger household wealth position. GDP growth was adjusted marginally in the wrong direction, but the precision regarding its composition was improved. It had become clearer that the price pressure in the economy was very low and the inflation forecast was revised downward. No major corrections were made with regard to the labour market.
The picture changed substantially after this. In connection with the convergence programme in December, a forecast was presented where concern over the economic slowdown in important trading countries, and thus weaker Swedish industrial activity, had grown. Swedish GDP growth was revised downward considerably for 1999. The slowdown in Europe was accurately forecast, but developments in other regions were considerably better than foreseen. Despite a strong increase in the number of newly reported vacancies, the growth in employment was estimated to be lower than in earlier forecasts, as a result of the weaker economic climate. Consumption expenditure was assessed, as before, to have good prospects for rapid growth, although the growth rate was revised downward as a result of the expected indirect effects of the international slowdown. Developments were thus underestimated more than in earlier forecasts.
In spring 1999, industrial activity continued to deteriorate as expected. The inflow of orders and exports showed a weak development. There was a marked division in household and industry surveys, between negative firms and optimistic consumers (see Diagram 12.1).
Diagram 12.2 Confidence indicators
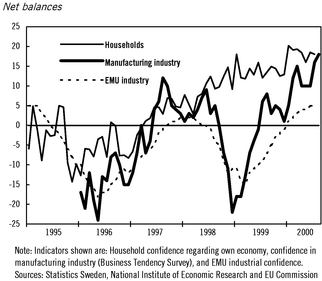
A decline in the demand for labour was forecast for the second six months of 1999. The expectation that employment growth would weaken was supported by the fact that there was some decline in the number of newly reported vacancies. However, this decline proved to be short lived. The inflation forecast was on the whole well in line with the outcome for the year, but domestic price
89
pressure was still overestimated. The December forecast was thus largely unchanged, although the differences in outlook between households and industry were further emphasised.
Table 12.1 Ministry of Finance forecast errors for 1999
| Annual percentage change | | Percentage points |
| | | |
| |
| | Forecast error
|
|---|
| | Outcome
| | Spring
budget
1998
| | Aut.
budget
1998
| | Spring
budget
1999
| | Aut.
budget
1999
|
|---|
| GDP | | 3.8 | | -0.7 | | -0.8 | | -1.6 | | -0.2 |
| Household cons. | | 4.1 | | -1.6 | | -1.2 | | -1.5 | | -1.0 |
| Gen. govt. cons. | | 1.8 | | -1.2 | | -1.0 | | -0.8 | | -0.2 |
| Gross fixed capital formation | | 8.1 | | -0.5 | | -0.1 | | -3.3 | | -1.7 |
| Change in stocks(1) | | -0.5 | | 0.5 | | 0.5 | | -0.2 | | 0.1 |
| Exports | | 5.2 | | 1.5 | | 0.6 | | -1.6 | | -0.2 |
| Imports | | 5.0 | | 2.0 | | 2.1 | | -2.1 | | -1.8 |
| Employment | | 2.2 | | -0.7 | | -0.7 | | -0.8 | | 0.5 |
| Open unemployment(2) | | 5.6 | | 0.1 | | 0.1 | | 0.2 | | -0.2 |
| Labour market programmes(2) | | 3.1 | | 0.9 | | 0.8 | | 0.5 | | 0.2 |
| CPI(3) | | 0.3 | | 0.9 | | 0.4 | | -0.1 | | 0.0 |
| CPI (Dec-Dec) | | 1.2 | | 0.3 | | -0.1 | | -0.7 | | -0.3 |
| World market growth(4) | | 5.5 | | 1.8 | | 0.7 | | -1.7 | | -1.3 |
| TCW index(3) | | 125 | | -5.3 | | -4.4 | | -2.1 | | -0.2 |
| Swedish short-term interest rate, 6mth(3) | | 3.2 | | 1.4 | | 1.1 | | -0.1 | | -0.1 |
Note: In May 1999 the national accounts were adapted to the European System of Accounts from 1995. Forecasts made before May 1999 are based on United Nations' System of National Accounts from 1968. Forecasts for 1999 can only be evaluated in the new system as outcome for 1999 has only been calculated according to this. It is difficult to determine the magnitude of the effects on growth rates from the adaptation to the new definitions, but they are assessed to be relatively small.
- (1)
- The change in volume is calculated as percent of GDP last year.
- (2)
- Per cent of labour force
- (3)
- Annual average
- (4)
- Increase in total imports of processed goods in Sweden's trading countries, weighted by their share of Swedish exports
Sources: Statistics Sweden and Ministry of Finance
During the period following the Government Spring Bill 1999, there were increasingly clear signs that the labour market, the inflow of orders to industry and exports were developing more favourably than expected, while household expectations were becoming ever more positive. The Government Budget Bill for 2000 finally sketched a picture of the Swedish economy being in a rapid phase of expansion, partly as a result of a very strong development in household consumption expenditure, a global dampening of price pressure and a successful telecommunication equipment sector. The favourable development in employment and disposable incomes contributed to a continued underestimation of household consumption, as did the strong growth in household wealth over the course of 1999. This latter had not been anticipated in the forecasts and its effects may have been underestimated.
90
Comparison with previous forecasts
Looking back at the Ministry of Finance's forecasts over the past 10 years, it can be seen that the forecast for 1999 was slightly poorer than the average for the earlier period with regard to GDP growth, but better with regard to inflation and employment (see Diagram 12.3). The fact that the CPI forecast has improved is likely to be largely due to the increase in price stability.
Diagram 12.3 Ministry of Finance average absolute forecast errors regarding three variables

As shown in Diagram 12.4, gross capital formation, for which the growth rate fluctuates considerably in different phases of the economic cycle, appears to be the most difficult component of demand and output to forecast. Foreign trade is also difficult to predict, but as forecast errors for exports and imports often cancel each other out, the error with regard to the net contribution to GDP growth is limited. Consumption expenditure shows a more stable development over time, but the very large rise in private consumption in 1999 was underestimated as late as in the Government Budget Bill for 2000. Interestingly, the forecasts for the variables that have traditionally shown the greatest forecast errors were generally better for 1999 than at any other time in the 1990s.
91
Diagram 12.4 Ministry of Finance average absolute forecast errors regarding demand and output
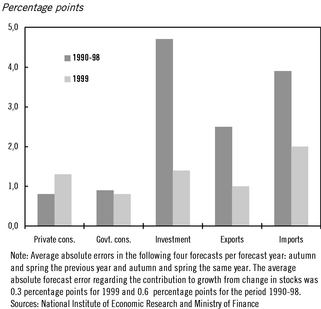
The importance of information for precision
An important starting point in forecasting is the available information on outcome and indicators. The diagram below (12.5) shows how the Ministry of Finance's average forecast precision with regard to GDP growth has improved as the forecast horizon becomes shorter. There have often been two quarterly national accounts published between forecasts, which leads to a considerable reduction in the average errors in the forecasts.
Diagram 12.5 Ministry of Finance average absolute forecast errors with regard to GDP growth with different forecast horizons 1990-99
12.2 Comparison with other forecasters
When evaluating forecasts, there is a temptation to compare the result with the achievements of other analysts. This is expected to give an idea of which economic analyst is more reliable, and also of how large errors can be regarded as normal.
92
Comparing forecasters has its problems, however. One reason why forecasts are rarely directly comparable is that they are not prepared at the same point in time. As data is published continuously, the analysts have access to differing amounts of information. Certain individual events may also have a deciding influence, for instance the decision that Sweden should go over to a floating exchange rate in November 1992. In addition, the objectives and methods of the forecast institutes may differ. One example is that the Ministry of Finance's forecasts are based on decided and proposed fiscal policy, while many other forecasters base their estimates on their own assessments of, for instance, coming tax changes. The National Institute of Economic Research, which bases its forecasts on decisions already made, has an information disadvantage in the forecasts it publishes before the Government Spring Bill and the Government Budget Bill.
A comparison of different forecasters is thus never completely fair. This does not prevent a discussion on outcome, conditions and common tendencies providing important insights. For this purpose, a comparison is included below of the precision of a number of forecasters with regard to GDP growth, inflation and open unemployment in Sweden, both in 1999 and over the last ten years. With regard to the budget, forecasts on the composition of demand are also of interest. A survey of forecasts on the components of demand and output falls outside the scope of this comparison, but is mentioned briefly below.
The evaluation applies to both autumn and spring forecasts for both the current year and the following year. In order to avoid any forecaster having a particular advantage or disadvantage with regard to information, a similar average time of publication has been sought as far as possible.
Analysts of economic activity often meet with considerable scepticism regarding the reliability of their forecasts. For the purpose of investigating the usefulness of making assessments of economic activity, a "naïve forecast" is included in the comparison. This has been constructed so that growth in one year's time is assumed to be the same as during the previous year.(9)
- (9)
- As there is no outcome for the current year when forecasts for the following year are made, the Ministry of Finance's forecast for the current year has been used.
The forecasts are compared with the first provisional National Accounts outcome presented in March of the following year, as the evaluation is made with regard to how well the forecasters interpret available information. Revisions to the outcome are made as new information is received or definitions are changed, something that is rarely or never known in advance by the forecasters. The forecasts and results have been taken from the National Institute of Economic Research's forecast database.(10)
- 10
- Some amendments to the database have been made by the Ministry of Finance. Some information is missing, particularly with regard to open unemployment and inflation. Thus, the number of observations for certain forecasters is marginally less.
In order to avoid a forecast institute that greatly overestimates or underestimates developments during different years appearing to be accurate, average absolute deviations from outcome have been used in the evaluation. There is also some discussion of whether the forecasters have a tendency to make overly positive or negative forecasts. This type of tendency is called a bias here and is measured with average deviation.
93
Table 12.2 Evaluated forecasters and average week for publication of selected forecasts 1990-99
| |
| | Average publication week
|
|---|
Forecaster
| |
|
|---|
| |
| | Spring
| | Autumn
|
|---|
| Ministry of Finance | | MoF | | 16 | | 46 |
| National Institute of Economic Research | | NIER | | 14 | | 46 |
| Federation of Swedish Industries | | IF | | 16 | | 44 |
| Swedish Research Institute of Trade | | HUI | | 12 | | 41 |
| Swedish Trade Union Confederation | | LO | | 20 | | 46 |
| Merita-Nordbanken | | MNB | | 14 | | 45 |
| SEB | | SEB | | 16 | | 40 |
| Svenska Handelsbanken | | SHB | | 15 | | 43 |
| FöreningsSparbanken | | FSB | | 16 | | 43 |
| Swedish Confederation of Professional Employees | | TCO | | 21 | | 46 |
| OECD | | OECD | | 23 | | 49 |
Note: National account release dates have varied during the 1990s. In 1999, outcome was published during the following weeks: fourth quarter 1998 week 10, first quarter 1999 week 24, preliminary version for the second quarter 1999 week 32 and second quarter 1999 week 39.
Sources: National Institute of Economic Research and Ministry of Finance
Forecasts for 1999
All of the economic analysts maintained an overly pessimistic view of economic developments for 1999 for a long time. These assessments were largely governed by the expected effects on Swedish export markets of the Asian crisis and the financial crisis in Russia in autumn 1998. There was considerable uncertainty over how this would affect domestic demand. The forecasts for GDP growth were gradually revised over the course of 1998 and 1999 according to a pattern similar to all analysts, as shown in Diagram 12.6. Similar revisions are natural, given that the forecasters have access to the same information. However, a type of "Simon says" behaviour can arise, in that forecasters are influenced by one another and by the general debate in the mass media and within trade associations.
Diagram 12.6 Revisions from previous forecast of GDP growth in 1999
94
During 1998 and prior to the 1999 Government Spring Bill, most forecasters were more pessimistic than the Ministry of Finance with regard to GDP growth. The Federation of Swedish Industries and Svenska Handelsbanken made particularly cautious assessments of economic growth. Merita-Nordbanken was the first to revise its forecast upward in April, while SEB was the first to present a GDP forecast above 3 per cent in May. At this point in time, the National Institute of Economic Research's Business Tendency Survey was indicating a recovery in industrial activity and the labour market had continued to develop strongly. This further information should have been of great significance in spring 1999. The largest upward adjustment was made by the Federation of Swedish Industries, which changed its growth forecast from 1.5 per cent in February to 3.5 per cent in September. During the autumn and prior to the preliminary outcome in March 2000, these revisions meant that growth was in several cases overestimated—by FöreningsSparbanken as recently as in February 2000, by 0.4 percentage points.
The differences in forecast errors with regard to GDP growth are on the whole minor. All forecasters underestimated the rise in economic activity. At the same time, inflation was overestimated, particularly in spring 1998. After this, inflation expectations were gradually adjusted downward. Open unemployment was also estimated right up until autumn 1999 to be higher than it actually became, probably as a result of the employment-intensive domestic demand being underestimated. The Ministry of Finance's relatively good forecasts on open unemployment in 1998 were based on an overly high assumption with regard to the number of participants in labour market policy programmes and an overly weak employment growth. Given the above forecast errors, it is clear that the Swedish economy functioned much better during 1999 than the forecasters had anticipated.
To provide a simple overview of the precision of the various forecasters with regard to GDP, inflation and unemployment in 1999, the absolute average forecast errors for these variables are shown in one and the same diagram below (despite the fact that it is not possible to total the different variables).
Diagram 12.7 Average absolute forecast errors for 1999
It should be pointed out that the most important breakpoint for precision-improving information for 1999 was in April/May of the same year. The banks, in particular, may have benefited from this in the comparison, as they presented their spring forecasts later than other forecasters.
95
Forecasts during the period 1990-99
A comparison of forecasts made during the past ten years indicates that the turbulent international developments and the exceptionally strong development in domestic demand during 1999 made the conditions for forecasting more difficult, at least with regard to GDP. On the other hand, the inflation forecasts were better, probably because price stability has increased considerably in recent years. Table 12.3 below shows the average forecast errors made by analysts during the whole ten-year period with regard to GDP, unemployment and inflation.
Table 12.3 Average absolute error and average error (bias) for 1990-1999
Percentage points
| | GDP
| | Inflation
| | Unemployment
|
|---|
| | Average
absol.
error
| | Average
error
(bias)
| | Average
absol.
error
| | Average
error
(bias)
| | Average
absol.
error
| | Average
error
(bias)
|
|---|
| MoF | | 0.8 | | 0.5 | | 0.8 | | 0.1 | | 0.8 | | -0.6 |
| NIER | | 0.8 | | 0.4 | | 0.7 | | 0.2 | | 0.6 | | -0.2 |
| IF | | 0.7 | | -0.6 | | 0.8 | | 0.4 | | 0.5 | | 0.2 |
| HUI | | 1.0 | | 0.5 | | 1.0 | | 0.3 | | 0.7 | | -0.5 |
| LO | | 0.8 | | 0.5 | | 0.9 | | 0.4 | | 0.7 | | -0.3 |
| MNB | | 0.7 | | 0.4 | | 0.7 | | 0.2 | | 0.5 | | -0.2 |
| SEB | | 0.7 | | 0.3 | | 1.0 | | 0.3 | | 0.5 | | -0.1 |
| SHB | | 0.7 | | 0.3 | | 0.8 | | 0.2 | | 0.6 | | -0.2 |
| FSB | | 0.7 | | 0.3 | | 0.9 | | 0.4 | | 0.7 | | -0.2 |
| TCO | | 0.8 | | 0.4 | | 0.9 | | 0.4 | | 0.5 | | -0.3 |
| OECD | | 0.8 | | 0.3 | | — | | — | | — | | — |
| Naïve | | 1.4 | | 0.0 | | 2.1 | | 0.7 | | 1.2 | | -0.5 |
Note: OECD forecasts for inflation and labour market developments are not comparable with the others as they are based on different definitions. Averages refer to the absolute errors made in the following four forecasts per forecast year between 1990 and 1999: autumn and spring the previous year and autumn and spring the same year.
Sources: National Institute of Economic Research and Ministry of Finance
The average forecast precision is very similar from one forecast institute to another. The difference between the highest and lowest average error regarding GDP growth is 0.3 percentage points for the period as a whole. However, with regard to individual years, the average forecast errors vary more. The crisis years at the beginning of the 1990s and the year 1999 appear to have caused the most problems for forecasters.
One reason for the similarities being greater when the entire 1990s are studied, is that individually poor forecasts make less of an impact over a longer period of time. In addition, some forecast institutes benefit to a lesser extent from a better information situation, as the times of publication selected are on average more similar.
One reason why the result of a comparison of GDP forecasts should be interpreted with caution is that what is studied here is the aggregate. It is quite possible that a forecaster has made incorrect assessments of the composition of demand, but still manages to make a "good" GDP forecast. As with GDP, the forecast institutes make very similar errors with regard to the components of demand and output.
96
As well as illustrating how well a forecaster has succeeded over a period as a whole, it is interesting to see whether the forecaster's average precision improves or deteriorates over time. Diagram 12.8 and table 12.4 below show the five-year moving averages for errors on GDP growth.
Table 12.4 Average absolute error for GDP growth
Five year moving average, percentage points
| | 1995
| | 1996
| | 1997
| | 1998
| | 1999
|
|---|
| MoF | | 0.9 | | 0.9 | | 0.7 | | 0.5 | | 0.6 |
| NIER | | 1.0 | | 0.9 | | 0.7 | | 0.5 | | 0.5 |
| IF | | 0.6 | | 0.6 | | 0.6 | | 0.7 | | 0.8 |
| HUI | | 1.2 | | 1.2 | | 0.9 | | 0.6 | | 0.7 |
| LO | | 1.1 | | 0.9 | | 0.7 | | 0.5 | | 0.5 |
| MNB | | 0.9 | | 0.9 | | 0.6 | | 0.4 | | 0.5 |
| SEB | | 0.9 | | 0.8 | | 0.6 | | 0.5 | | 0.5 |
| SHB | | 0.8 | | 0.8 | | 0.6 | | 0.4 | | 0.6 |
| FSB | | 0.8 | | 0.8 | | 0.7 | | 0.6 | | 0.6 |
| TCO | | 1.0 | | 0.9 | | 0.7 | | 0.5 | | 0.6 |
| Naïve | | 1.7 | | 1.7 | | 1.7 | | 1.7 | | 1.0 |
Note: Four forecasts per forecast year. Thus, the 1995 five year moving average includes 20 forecasts, showing the average absolute forecast error made between 1991 and 1995 in the spring and autumn regarding growth the following year and in the spring and autumn regarding growth the same year. For the Federation of Swedish Industries some observations are missing.
Sources: National Institute of Economic Research and Ministry of Finance
It should be pointed out that as the average forecast errors are so similar in size, individual forecasts that are less accurate can lead to a heavy fall in the ranking. The Ministry of Finance, which misjudged developments in 1996, has improved its relative position somewhat in recent years.
Diagram 12.8 Average absolute error for GDP growth
97
It was concluded above that all of the forecasters during a long period made an overly pessimistic assessment of the development for 1999. This picture is reversed with regard to the 1990s as a whole. All of the forecasters except the Federation of Swedish Industries have had a tendency to overestimate GDP growth. The Federation did not overestimate growth as much as other analysts during the crisis years at the beginning of the 1990s, but missed to a greater extent the growth in economic activity during 1994 and 1995. The same pattern was repeated in 1996 and 1997. The Ministry of Finance's positive bias is slightly higher than that of the other forecasters (see Table 12.3 and Diagram 12.9).
Diagram 12.9 Ministry of Finance average error (bias) regarding GDP growth 1970-99
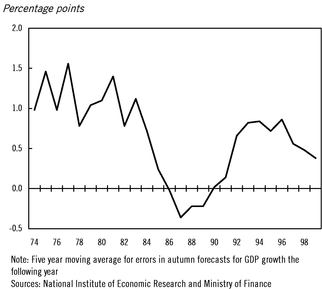
During the 1990s, the forecasters have in general overestimated developments in periods of slowdown and underestimated them in phases of recovery. This may be connected with a certain degree of caution in interpreting new information and a tendency to avoid large revisions to forecasts. These tendencies also contribute to turning points being perceived too late. The deep crisis at the beginning of the 1990s is therefore probably the reason for most forecasters showing a positive bias for the decade as a whole.
It is worth noting that the compilers of the National Accounts also have difficulty in estimating the strength of fluctuations in economic activity. As a result of the primary statistics not being fully comprehensive and the existence of severe reconciliation problems, the quarterly accounts to some extent take on the nature of assessment and forecast. The more thorough annual estimates, which are partly based on other sources and methods, often contain revisions. Diagram 12.10 below shows that the revised outcome shows greater fluctuations in the economic climate than the provisional outcome. The forecast evaluation in this chapter is based, as mentioned above, on the first provisional outcome.
98
Diagram 12.10 Provisional and revised outcome for GDP growth
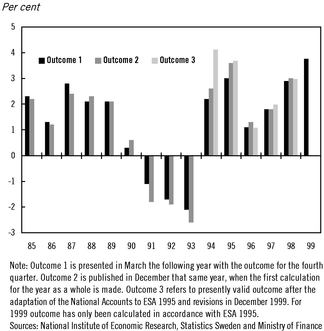
To summarise, it can be concluded that the forecasters on average make very similar errors in forecasting, which could indicate that, as well as having access to the same information, they are influenced by one another. However, all of the forecasters provide better assessments than the "naïve forecast", which means that economic forecasts are of value. The Ministry of Finance's forecasts compare well with the others in terms of precision, but have a tendency to overestimate growth to a slightly higher degree. The precision of the forecasts increases as the forecast horizon shortens and more information, in the form of results and indicators, becomes available. All forecasters appear to have difficulty in perceiving changes in economic activity at an early stage.
99
QuickLinks
1 The revised Budget StatementAppendix 2 Sweden's Economy