Exhibit 99.c
Appendix 1
Sweden’s Economy

Appendix 1
Sweden’s Economy
Contents
3
Diagrams
1.1 Investment and goods exports | |
1.2 Contributions to GDP growth | |
1.3 Industry’s unit labour cost in Sweden compared with 11 OECD countries, common currency (SEK) | |
1.4 Current account and terms of trade | |
1.5 Current account, general government net lending and household savings ratio | |
2.1 Employment growth in the euro area, the United States and Japan | |
2.2 Budget balance and current account balance in the United States | |
3.1 Key interest rates in the United States, the euro area and Sweden | |
3.2 10-year government bond yields in the United States, Germany and Sweden | |
3.3 The US dollar against the yen and euro | |
3.4 Stock market developments in the United States, the euro area and Sweden | |
3.5 The differential between 10-year government bond yields in Sweden and Germany | |
3.6 TCW index | |
5.1 Industry’s unit labour costs in Sweden compared with 11 OECD countries | |
6.1 Temporary employment and total employment | |
6.2 Hours worked and GDP | |
6.3 Supply of labour and employment | |
6.4 Unemployment | |
8.1 Inflation (CPI), underlying inflation (UND1X) and domestic underlying inflation (UNDINHX) excl. energy | |
8.2 Energy consumer price indexes and total contribution from energy prices to inflation | |
8.3 Contributions to CPI inflation from certain goods and services, excluding electricity, oil, petrol, fruit and vegetables | |
8.4 Clothing and footwear. Consumer and import prices (year-on-year change) and retailers’ consumer price expectations | |
8.5 Domestic underlying inflation (UNDINHX) and labour shortage reported in the wholesale, retail and motor vehicle trades | |
8.6 Inflation expectations, 12 month horizon | |
8.7 Consumer prices | |
9.1 Household real disposable income | |
9.2 Household consumption of goods and services | |
9.3 Household expectations about the economy 12 months ahead | |
9.4 Liabilities in relation to disposable income and total assets | |
9.5 Household own saving | |
10.1 Investment | |
10.2 Investment share of GDP | |
10.3 Capacity utilisation in industry | |
10.4 New building starts | |
11.1 General government net financial position | |
7
Sweden’s Economy
Foreword
This appendix to the 2005 Spring Fiscal Policy Bill contains the Ministry of Finance’s forecast of the development of the international and Swedish economies in 2005 and 2006. In addition, it contains an estimate of the development in 2007.
The forecast is based on data from Statistics Sweden (SCB), the European Commission and the National Institute of Economic Research (NIER). The Ministry of Finance is, however, wholly responsible for the assessments presented here. Henrik Braconier, Director at the Ministry of Finance, is responsible for the forecast. This appendix takes account of information available on 4 April.
1 Overview
The global economy is expected to continue to grow rapidly and growth is estimated at approximately 4 per cent both this year and in 2006. Low interest rates, high corporate profits and stronger developments in the labour market result in both investment and household consumption driving global growth. Inflationary pressure is expected to continue to be subdued in the near future. The international risk assessment is, however, not balanced and the probability of weaker growth than expected is greater than the probability of stronger growth.
The Swedish economy is estimated to grow by 3.2 per cent this year. Export growth is slowing, but exports are expected to make a large contribution to GDP growth this year as well. Domestic demand will, however, play an increasingly important role for growth in 2005 and 2006. Investment, which began growing rapidly in 2004, is expected to grow at a high rate this year. Growth in household consumption is expected to increase in the near future, partly as a result of expansionary monetary and fiscal policies as well as a brightening labour market. GDP growth in 2006 is estimated at 2.7 per cent.
The labour market situation is gradually improving and employment is estimated to rise by 0.8 per cent this year and by 1.1 per cent in 2006. Unemployment is expected to fall gradually as a result of increased volumes of labour market policy programmes and increasingly strong economic activity. Measured as an annual average, unemployment is estimated to fall to 5.0 per cent this year and to 4.4 per cent in 2006.
Inflationary pressure in the Swedish economy continues to be low, which is partly a result of low resource utilisation. CPI inflation is estimated at an average of 0.5 per cent this year and 1.5 per cent in 2006.
Public finances continue to show a surplus. General government net lending is estimated at 0.7 per cent of GDP this year and 0.6 per cent in 2006.
1.1 International conditions
The global economy grew very rapidly in 2004 and growth is estimated to have been 4.9 per cent (see Table 1.1). Growth was strong in the majority of regions. However, growth was slow in the euro area. During the second half of 2004, growth in the global economy slowed, partly as a result of rising oil prices and a gradually less expansionary economic policy. Both underlying structural factors and forward-looking indicators, however, indicate that growth will be somewhat higher in 2005 than the second half of 2004. Overall, the global economy is estimated
9
to grow by 4.1 per cent in 2005 and 3.9 per cent in 2006.
Further oil price rises and the large current account deficit in the United States still constitute the largest threats to growth in the global economy. The risk factors are, however, considerably different in nature. The probability of higher oil prices is relatively high, while the consequences for the global economy are not likely to be too serious. The probability of financial turbulence as a result of the US current account deficit is considered to be lower, but the economic consequences may be both considerable and difficult to predict. The possible consequences for the Swedish economy of such a development are illustrated in an alternative scenario in Chapter 12. The risk of higher oil prices or financial disruption in the United States is likely to persist throughout the forecast period.
The US economy continued to grow strongly throughout 2004 and early 2005, despite the gradually less expansionary economic policy stance. Despite systematic and repeated rises, the Federal Reserve’s key rate is still at a low level, and is not expected to reach neutral levels until 2006. The reduced demand stimulus from economic policy has been balanced by increasing employment, strong growth in household wealth and continued low long-term interest rates. Consequently, the deceleration from last year’s high GDP growth of 4.4 per cent in the United States is expected to be relatively mild. Growth is estimated at 3.7 per cent this year and 3.4 per cent in 2006. The favourable growth rate has so far only led to a moderate increase in inflation. The reason for this is that productivity has continued to develop strongly and resource utilisation has therefore not risen alarmingly fast. Prices are expected to continue to rise at a balanced rate in the near future.
The export-led economic upturn, which began in the euro area during the summer of 2003, was weakened considerably during the second half of 2004. Weaker global growth – combined with the appreciation of the euro – contributed to exports slowing, and GDP grew by only 2.0 per cent. In 2005, increasing domestic demand is expected to gradually lead to stronger growth, but the growth rate is estimated at only 1.6 per cent this year, rising to 2.1 per cent in 2006. At the same time, stable high unemployment and an inflation rate that is permanently above the European Central Bank’s (ECB) target indicate that the euro area as a whole is struggling with structural problems. However, developments differ markedly between different member states, as described in Chapter 2. Growth in the neighbouring Nordic countries and the UK is expected to be favourable in the near future, which will have a favourable impact on Swedish exports. Japanese growth is also expected to accelerate gradually in 2005 and 2006.
Table 1.1 Assumptions for the forecast
| | 2003 | | 2004 | | 2005 | | 2006 | | 2007 | |
GDP, world(1) | | 3.6 | | 4.9 | | 4.1 | | 3.9 | | 3.6 | |
Brent oil, USD(2) | | 28.9 | | 39.0 | | 45.1 | | 40.6 | | 39.8 | |
TCW index(2) | | 128 | | 126 | | 122 | | 121 | | 121 | |
German long-term interest rate(3) | | 4.1 | | 4.1 | | 3.8 | | 4.1 | | 4.2 | |
Swedish long-term interest rate(3) | | 4.6 | | 4.4 | | 4.0 | | 4.3 | | 4.4 | |
Repo rate(4) | | 2.75 | | 2.00 | | 2.00 | | 2.75 | | 3.25 | |
Refi rate(5) | | 2.00 | | 2.00 | | 2.00 | | 2.50 | | 3.00 | |
Fed Funds rate(6) | | 1.00 | | 2.25 | | 3.50 | | 4.00 | | 4.50 | |
(1) Percentage change.
(2) Annual average.
(3) 10-year government bond, annual average.
(4) Final entry.
(5) Euro area key policy rate, final entry.
(6) US policy key rate, final entry.
Sources: Riksbank, Statistics Sweden and Ministry of Finance.
1.2 Capital markets
Over the past five years, both nominal and real market rates have fallen sharply globally. Long rates are now at historically low levels and reflect the fact that global saving has increased more rapidly than investment requirements. The relatively high saving is also reflected in a low interest rate spread between borrowers with different degrees of creditworthiness. A rise in bond rates is probable in the near future and has already begun in the United States. However, the rise is expected to be dampened by demographically determined continued high saving, and by changes in investment regulations for insurance companies and pension funds.
The central banks’ key rates are also at low levels. Monetary policy thus has an expansionary stance in both the United States and the euro area. In 2004 and early 2005, monetary policy was gradually tightened in the United States.
10
This trend is expected to continue in the near future, with the aim of restraining the inflation that arises as resource utilisation increases. In the euro area, key interest rates have been held at 2.00 per cent for quite some time now. Subdued economic development in the euro area indicates that interest rate rises are not to be expected in 2005. However, the ECB is expected to raise key rates gradually in 2006 as resource utilisation slowly increases.
During the period January 2002 to January 2005, the US dollar weakened by 34 per cent against the euro. In early 2005, the dollar stabilised, partly supported by a rising interest-rate spread against the euro area. The large current account deficit – and to a lesser extent the budget deficit – indicates, however, that a continued weakening of the dollar is to be expected. In the forecast, some weakening of the dollar is expected in 2005 and 2006.
The same factors that indicate a continued weakening of the dollar point to a stronger Swedish krona. Large current account surpluses and sound public finances result in a gradual improvement in the net position in relation to the rest of the world. Over the past four years, the krona has also strengthened markedly in terms of the TCW index. In 2005, a continued strengthening is anticipated, albeit at a considerably slower rate. The TCW index is estimated at 121 at the end of 2005.
1.3 Economic policy
Between November 2002 and April 2004, the Riksbank lowered the repo rate by a total of 2.25 percentage points, and then held it at a low level of 2.00 per cent. The Riksbank’s monetary policy has thus had an expansionary stance since 2003 and made a positive contribution to demand in the Swedish economy in 2004 and early 2005. Since monetary policy impacts on domestic demand with a considerable time lag, it is probable, however, that the full impact of the low repo rate will not make itself felt until this year.
As a consequence of low inflationary pressure and low resource utilisation in the economy, the Riksbank is expected to hold the repo rate at 2.00 per cent throughout 2005, and then gradually raise the level to 2.75 per cent by the end of 2006. In 2007, it is expected to raise the repo rate further towards neutral levels.
Fiscal policy, measured as the change in the structural balance, was tightened equivalent to 1.0 per cent of GDP in 2004. The discretionary fiscal policy in the central government budget was weakly expansionary. However, this was more than offset by other tightening items, including raised local government taxes. Moreover, tax revenues increased as a result of some firms reversing the whole or parts of their tax allocation reserves for taxation. This year, fiscal policy is expected to have an expansionary stance equivalent to 0.9 per cent of GDP. The expansion is driven to a large extent by the discretionary policy in the central government budget. Fiscal policy is expected to have a weakly expansionary stance equivalent to 0.2 per cent of GDP in 2006, followed by a weakly contractionary stance in 2007.
Overall, economic policy is expected to have a strongly stimulating effect on demand both this year and in 2006. The effect is anticipated to decline in 2007.
1.4 Demand and output
Sweden’s GDP grew by 3.5 per cent in 2004 (see Table 1.2). The high growth was partly a result of the unusually large number of working days in 2004 compared with 2003. This calendar effect is estimated by Statistics Sweden (SCB) to have contributed 0.5 percentage points to growth in 2004. In 2005, both actual GDP growth and calendar adjusted GDP growth are estimated at 3.2 per cent. In 2006, growth is estimated at 2.7 per cent, but since there are fewer working days
Table 1.2 Selected statistics
Percentage change unless otherwise stated
| | 2003 | | 2004 | | 2005 | | 2006 | | 2007 | |
GDP | | 1.5 | | 3.5 | | 3.2 | | 2.7 | | 2.4 | |
GDP, calendar adjusted | | 1.6 | | 3.0 | | 3.2 | | 3.0 | | 2.4 | |
Open unemployment(1) | | 4.9 | | 5.5 | | 5.0 | | 4.4 | | 4.2 | |
Number of hours worked | | -1.2 | | 0.9 | | 0.6 | | 0.7 | | 0.4 | |
CPI, Dec–Dec | | 1.3 | | 0.3 | | 0.6 | | 2.0 | | 2.0 | |
General government net lending, per cent of GDP | | -0.1 | | 1.1 | | 0.7 | | 0.6 | | 1.1 | |
TCW index(2) | | 128 | | 126 | | 122 | | 121 | | 121 | |
(1) Per cent of labour force.
(2) Annual average.
Sources: Riksbank, Statistics Sweden and Ministry of Finance.
11
Table 1.3 Demand and output
| | SEK,
billion(1) | | Percentage change in volume | |
| | 2004 | | 2001 | | 2002 | | 2003 | | 2004 | | 2005 | | 2006 | | 2007 | |
Household consumption expenditure | | 1,224 | | 0.4 | | 1.4 | | 1.5 | | 1.8 | | 2.2 | | 2.7 | | 2.6 | |
General government consumption expenditure | | 706 | | 0.9 | | 2.3 | | 0.8 | | 0.3 | | 1.2 | | 0.7 | | 0.5 | |
Central government | | 197 | | -1.6 | | 3.0 | | 0.8 | | -0.5 | | 0.5 | | 0.0 | | 0.5 | |
Local government | | 509 | | 1.9 | | 2.0 | | 0.7 | | 0.5 | | 1.5 | | 1.0 | | 0.5 | |
Gross fixed capital formation | | 405 | | -1.0 | | -2.6 | | -1.5 | | 5.1 | | 7.1 | | 5.2 | | 5.1 | |
Business sector, excluding housing | | 270 | | -2.9 | | -7.1 | | -2.9 | | 4.7 | | 7.3 | | 5.6 | | 5.4 | |
Housing | | 64 | | 4.2 | | 5.7 | | 5.5 | | 16.1 | | 10.7 | | 4.7 | | 8.0 | |
Authorities | | 71 | | 4.5 | | 9.7 | | -1.3 | | -2.0 | | 2.9 | | 3.7 | | 0.8 | |
Change in stocks(2) | | 4 | | -0.5 | | -0.2 | | 0.4 | | -0.3 | | 0.4 | | -0.1 | | 0.0 | |
Exports | | 1,176 | | 0.5 | | 1.2 | | 5.0 | | 10.2 | | 6.9 | | 5.8 | | 5.7 | |
Imports | | 972 | | -2.5 | | -1.9 | | 4.9 | | 6.7 | | 7.9 | | 6.2 | | 6.4 | |
GDP | | 2,543 | | 1.0 | | 2.0 | | 1.5 | | 3.5 | (3) | 3.2 | | 2.7 | (3) | 2.4 | |
(1) Current prices.
(2) Volume change, per cent of last year’s GDP.
(3) Underlying (i.e. calendar adjusted) GDP growth is estimated at 3.0% both 2004 and 2006. The fact that actual GDP growth in 2004 was higher than the underlying growth is due to the larger number of working weekdays in 2004 compared to 2003. The fact that actual GDP growth in 2006 is lower than the underlying growth is due to the smaller number of working weekdays in 2006 compared to 2005.
Sources: Statistics Sweden and Ministry of Finance.
in 2006 than in 2005, calendar adjusted growth is estimated at 3.0 per cent. In 2007, GDP is estimated to increase by 2.4 per cent.
Export-driven growth in 2004
An important reason for the high GDP growth in 2004 was that Swedish exports grew by over 10 per cent, partly as a result of strong global growth (see Table 1.3). The composition of export demand was also favourable for Swedish export firms since global demand for investment goods in particular grew rapidly (see Diagram 1.1). Moreover, the telecommunication equipment industry benefited from the strong recovery in investment by telecoms operators. Exports of services also grew substantially in 2004, partly as a result of increased exports of corporate services.
One item that attracted considerable attention in 2004 was merchanting, i.e. the trade margin that arises when Swedish parent companies handle the invoicing of sales by foreign subsidiaries to a third country. According to SCB, merchanting contributed 0.4 percentage points to GDP growth in 2004.
Strong export growth contributed to a gradual broadening of the economic recovery in 2004. Fast-growing exports – combined with rising capacity utilisation in industry and low interest rates – also led to an upturn in investment, which grew by 5.1 per cent in 2004. A contributory cause of the rise in investment was the sharp increase in housing investment. The relatively subdued investment rise followed a relatively mild fall in investment during the period 2001–2003.
Diagram 1.1 Investment and goods exports
Percentage change in volume
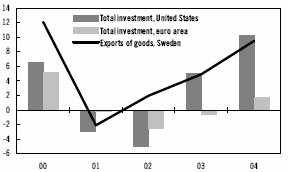
Sources: Statistics Sweden, Eurostat och US Department of Commerce.
Export industry successes and gradually increasing investment in the business sector are reflected in increasing industrial output, which grew by 9.1 per cent in 2004. Even though output growth as a whole was low in the service sector in 2004, output of corporate services developed strongly and grew by 3.8 per cent. Output in the construction industry also
12
increased relatively strongly as a result of the sharp increase in housing investment.
Domestic demand becomes increasingly important
In 2005 and 2006, domestic demand is expected to increasingly drive growth. Investment, which grew rapidly in 2004, is expected to grow more rapidly in 2005. Statistics Sweden’s Investment Survey indicates that industrial investment will continue to increase in 2005. Investment plans show considerable breadth, with the pulp and paper industry, the mining industry, the chemical industry and the transport industry planning new investment. The energy sector also has major investment plans, comprising both the modernisation and upgrading of the electricity supply system, and increased output capacity. For example, Vattenfall has announced investment of just over SEK 40 billion in the energy sector in Sweden over the next few years. Housing investment is also expected to continue to grow at a good rate over the next few years. Overall, investment is expected to increase by 7.1 per cent this year and 5.2 per cent in 2006. In 2007, investment is estimated to increase by 5.1 per cent.
The destocking that took place in 2004 is considered to have led to a situation with undesirably small stocks. Consequently, increased stockbuilding is expected in 2005, which is estimated to make a contribution to GDP growth of 0.4 percentage points. However, the estimate of the contribution from stocks is highly uncertain, as it is not yet clear how the effects of the severe storm in southern Sweden in January will affect the development of stocks in the forestry sector.
Weak developments in the labour market over the past few years have created uncertainty among households, which has dampened household consumption. In 2004, consumption grew by 1.8 per cent, which was slightly more than in 2003. The NIER’s Consumer Survey showed a considerable deterioration in household expectations regarding the labour market situation in 2000 and 2001. Expectations of positive developments in the labour market did not begin strengthening until 2004, but households continue to have a pessimistic view of the labour market. Household expectations are not expected to strengthen markedly until the anticipated improvement in the labour market in 2005 is realised.
The effects of households’ negative expectations regarding the labour market are, however, balanced by the strong increase in household wealth and real income. The underlying conditions for high consumption growth have thus improved over the past few years. The financial wealth position of households has strengthened, partly as a result of the Stockholm stock exchange rising over the past two years. At the same time, households’ real assets in the form of single-family dwellings have increased sharply in value. Overall, this means that household consumption in relation to households’ net wealth is at a very low level. Moreover, household real disposable income is expected to grow in the near future and interest rates are at historically low levels.
Table 1.4 Contributions to GDP growth
Percentage points
| | 2004 | | 2005 | | 2006 | | 2007 | |
Household consumption expenditure | | 0.9 | | 1.1 | | 1.3 | | 1.2 | |
General government consumption expenditure | | 0.1 | | 0.3 | | 0.2 | | 0.1 | |
Gross fixed capital formation | | 0.8 | | 1.1 | | 0.9 | | 0.9 | |
Change in stocks | | -0.3 | | 0.4 | | -0.1 | | 0.0 | |
Net foreign trade | | 2.0 | | 0.2 | | 0.3 | | 0.2 | |
Exports | | 4.5 | | 3.2 | | 2.8 | | 2.8 | |
Imports | | -2.5 | | -3.0 | | -2.5 | | -2.6 | |
GDP | | 3.5 | | 3.2 | | 2.7 | | 2.4 | |
Sources: Statistics Sweden and Ministry of Finance.
Overall, the conditions for increasing household consumption are expected to improve in 2005 and 2006. The NIER’s Consumer Confidence Indicator (CCI) and various retail indicators also point to a rise in consumption in 2005. In pace with the gradual improvement in the labour market situation, the increase in consumption is expected to accelerate in 2006. Overall, household consumption is expected to increase by 2.2 per cent this year and 2.7 per cent in 2006. In 2007, household consumption is estimated to grow by 2.6 per cent.
General government consumption grew by only 0.3 per cent in 2004. Cost-saving programmes in many municipalities and county councils resulted in local government consumption growing by a moderate 0.5 per cent in 2004. In 2005 and 2006, local
13
government revenue is, however, expected to develop favourably, partly as a result of employment support and increasing tax revenues. Local government consumption is therefore expected to grow by 1.5 per cent this year and 1.0 per cent in 2006. Central government consumption fell by 0.5 per cent in 2004. The decline was to a great extent a consequence of the reduction in purchases of defence materiel. In 2005, central government consumption is expected to grow by 0.5 per cent and then remain unchanged in 2006. Overall, general government consumption is expected to grow by 1.2 per cent in 2005 and 0.7 per cent in 2006. In 2007, general government consumption is estimated to grow by 0.5 per cent.
Overall, the contribution to GDP growth from total domestic demand will increase sharply in 2005 (see Diagram 1.2).
Diagram 1.2 Contributions to GDP growth
Percentage points
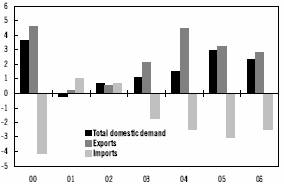
Sources: Statistics Sweden and Ministry of Finance.
At the same time as domestic demand gradually accelerates, growth in exports, however, will slow. The strong export growth in 2004 began slowing at the end of the year. In 2005, the inflow of orders to the export industry has slowed markedly, indicating slower export growth in 2005 than 2004. Both weaker global growth and the fact that Swedish exports tend to be early in the international business cycle indicate lower export growth in the near future. While export demand is expected to develop more weakly, the conditions for continued strong export growth nevertheless seem to be favourable. Industry’s unit labour costs relative to important competing countries have – despite the krona’s appreciation in the past few years – developed favourably as a result of high productivity growth and subdued wage increases (see Diagram 1.3). In both 2005 and 2006, exports are also expected to make a larger contribution to GDP growth than total domestic demand. Overall, export growth is expected to be 6.9 per cent this year and 5.8 per cent in 2006. In 2007, exports are estimated to grow by 5.7 per cent.
Diagram 1.3 Industry’s unit labour cost in Sweden compared with 11 OECD countries, common currency (SEK)
Index (1980=100)
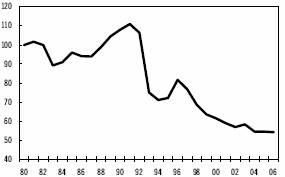
Sources: Statistics Sweden, National Institute of Economic Research and Ministry of Finance.
High growth drives rise in imports
In 2004, imports rose by 6.7 per cent, which is the most rapid increase since 2000. The large increase in imports was a consequence of the high growth in demand in the economy. The strong growth in import-dependent exports had a particular impact. In the near future, it is probable that the import content of exports will continue to grow as a result of the stronger krona and the continued globalisation of production.
Even though export growth is expected to slow in 2005 and 2006, imports are expected to continue developing strongly as a result of the relatively rapid growth in both investment and consumption. Among other things, Swedes’ foreign travel is expected to increase in 2005. The strong increase, which could be observed during the second half of 2004, is considered to have been interrupted only temporarily as a result of the tsunami disaster in Asia. Overall, imports are expected to rise by 7.9 per cent this year and 6.2 per cent in 2006. In 2007, imports are estimated to grow by 6.4 per cent.
The terms of trade, i.e. export prices in relation to import prices, have developed weakly since 1995 (see Diagram 1.4). Strong Swedish productivity growth and the considerable
14
improvement in the trade balance and the current account that has taken place since the early 1990s are important reasons for this development. In 2004, the terms of trade deteriorated by 1.0 per cent, which was mainly a result of rising oil prices. In 2005 and 2006, the terms of trade are expected to strengthen somewhat, partly due to the krona appreciation being expected to have a greater impact on import prices than on export prices. Another reason is the anticipated fall in oil prices in 2005 and 2006.
Diagram 1.4 Current account and terms of trade
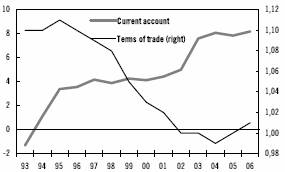
Note: The current account is expressed as per cent of GDP.
Sources: Riksbank, Statistics Sweden and Ministry of Finance.
The current account surplus was SEK 206 billion in 2004, which is equivalent to 8.1 per cent of GDP. The surplus has gradually increased since the early 1990s. The demographic structure of the population has a positive impact on household saving. In addition, a number of reforms in the 1990s, such as the tax reform, the pension reform and the restructuring of public finances, have contributed to higher saving (see Diagram 1.5). At the same time, the increase in
Diagram 1.5 Current account, general government net lending and household savings ratio
Per cent
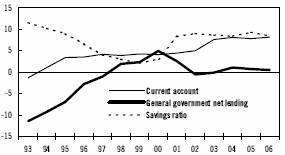
Note: Current account and general government net lending are expressed as per cent of GDP. The savings ratio is defined as household savings, including savings in supplementary pension schemes, in relation to disposable income.
Sources: Riksbank, Statistics Sweden and Ministry of Finance.
the surplus in the last few years has been driven by high export demand, subdued consumption growth and strong productivity. In 2005 and 2006, the impact of these factors is expected to decline and the current account surplus is expected to stabilise at approximately 8 per cent of GDP.
Domestic risk picture
In addition to the global risks mentioned in section 1.1, the domestic risk picture mainly comprises two alternative scenarios. On one hand, the deceleration in export growth may be stronger than expected. This risk is partly related to global growth, but the high capacity utilisation in industry may also constitute an obstacle to continued rapid export expansion. Weaker export growth means that growth is dependent on domestic demand to a greater extent. On the other hand, productivity growth may be higher than expected and the deceleration in productivity anticipated in the forecast will then take place later. Such a development involves even lower inflationary pressure and weaker developments in the labour market, leaving scope for the Riksbank to lower the repo rate.
1.5 Labour market, resource utilisation and inflation
Labour market situation beginning to improve this year
The labour market has developed weakly since 2001, with a decline in the number of hours worked. At the same time, the increase in sickness absence up to 2003 dampened the fall in employment.(1) In 2004, output in the Swedish economy rose rapidly, but unemployment nevertheless continued to rise and employment to fall. There are several reasons for the weak development in employment relative to output. Firstly, the large calendar effect in 2004 meant
(1) Sickness absence is normally included in employment as measured in the Labour Force Survey.
15
that output and the number of hours worked could increase rapidly without employment needing to rise. In addition, sickness absence began to decline, which meant that the number of hours worked could increase, without more people being employed. Finally, the continued strong productivity growth helped to dampen employment growth. Overall, employment fell by 0.5 per cent in 2004, while unemployment rose to 5.5 per cent.
In 2005, developments in the labour market are, however, expected to reverse and employment is estimated to rise by 0.8 per cent (see Table 1.5). Since the autumn of 2004, several labour market indicators have developed in an increasingly positive direction. Among other things, the number of newly reported vacancies to the National Labour Market Board has risen since November. Other factors also indicate that employment may be expected to rise in 2005. Increased domestic demand is for example expected to lead to more rapid growth in services output in the near future. In the service sector, the prospects for increasing output without employment rising are considered to be poorer than in industry as a result of weaker productivity growth.
Weak developments in the labour market have led to the government gradually increasing the volumes of labour market policy programmes. In 2003, there were 92,000 places, which increased to 106,000 places in 2004.
Table 1.5 Selected labour market statistics
| | 2003 | | 2004 | | 2005 | | 2006 | | 2007 | |
GDP(1) | | 1.5 | | 3.5 | | 3.2 | | 2.7 | | 2.4 | |
GDP, calendar adjusted(1) | | 1.6 | | 3.0 | | 3.2 | | 3.0 | | 2.4 | |
Productivity(1) | | 2.8 | | 2.8 | | 2.5 | | 1.9 | | 2.2 | |
Number of hours worked(1) | | -1.2 | | 0.9 | | 0.6 | | 0.7 | | 0.4 | |
Number of employed(1) | | -0.3 | | -0.5 | | 0.8 | | 1.1 | | 0.4 | |
Open unemployment(2) | | 4.9 | | 5.5 | | 5.0 | | 4.4 | | 4.2 | |
Labour market policy programmes(3) | | 2.1 | | 2.4 | | 2.7 | | 2.7 | | 2.4 | |
Regular employment rate(4) | | 77.6 | | 77.0 | | 76.8 | | 77.1 | | 77.3 | |
(1) Percentage change.
(2) Per cent of labour force.
(3) Number of people in labour market policy programmes, per cent of labour force.
(4) Number of employed in the age group 20-64, excluding those employed in labour market policy programmes, per cent of population 20-64.
Sources: Statistics Sweden, Arbetsmarknadsstyrelsen, Riksbank and Ministry of Finance.
The continued rising unemployment resulted in the government deciding on further measures to counteract open unemployment in the Budget Bill for 2005. An education initiative with 6,000 places for local government employees is being introduced this year. At the same time, the sabbatical year has been introduced, which is estimated to comprise 10,000 yearly places in 2005. Moreover, there is additional recruitment support comprising 10,000 places, which is announced in the Spring Fiscal Policy Bill. Overall, the number of participants in labour market policy programmes is assumed to be 121,000 this year and in 2006. The measures implemented in 2004 resulted in open unemployment starting to fall in 2004. However, the total number of unemployed people, i.e. openly unemployed people and participants in programmes, continued to rise in 2004 and amounted to 7.9 per cent of the labour force. Open unemployment was 5.5 per cent in 2004 and is expected to fall to 5.0 per cent this year and 4.4 per cent in 2006 as a result of the improved situation in the labour market and the measures announced. In 2007, unemployment is estimated to fall further to 4.2 per cent.
Resource utilisation continues to be low
Currently, there are available resources in the Swedish economy. Low resource utilisation is reflected in high unemployment, a low labour shortage and low wage and price pressure. Low resource utilisation is illustrated by the negative GDP gap, which means that the actual GDP level is less than the potential level. The GDP gap for 2004 is estimated to have been 0.9 per cent (see Table 1.6). In 2005 and 2006, the gap is expected to narrow gradually as actual GDP grows more rapidly than potential GDP. However, the GDP gap is not expected to close until 2007. The GDP gap can be broken down into a productivity gap, an average hours worked gap and an employment gap. The GDP gap for 2005 consists of an employment gap that is clearly more negative than the GDP gap, a positive productivity gap and an average hours worked gap that is close to zero. Consequently, there are estimated to be more available resources in the labour market than the GDP gap indicates for 2005, while productivity is higher than is considered sustainable in the long term. The employment gap is expected to close gradually in 2005 and 2006 as a result of employment rising more rapidly than is sustainable in the long term. At the same time,
16
actual productivity is expected to develop more slowly than potential productivity.
However, the assessment of productivity growth in the near future constitutes uncertainty in the forecast. The government has therefore commissioned the NIER to analyse in more detail the potential productivity growth in the Swedish economy.
Table 1.6 Resource situation
Per cent
| | 2004 | | 2005 | | 2006 | | 2007 | |
GDP gap | | -0.9 | | -0.3 | | -0.1 | | 0.0 | |
Employment gap | | -1.3 | | -0.9 | | -0.2 | | 0.0 | |
Productivity gap | | 0.4 | | 0.6 | | 0.1 | | 0.1 | |
Average hours worked gap | | -0.2 | | 0.0 | | -0.1 | | 0.0 | |
Note: Gaps are defined as (actual-potential)/potential.
Source: Ministry of Finance.
The downturn in 2001 made it increasingly easy for employers to recruit suitable labour. At the same time, unemployment rose and the underlying inflation rate began to fall. This trend has resulted in increasingly slow growth in wages. The wage agreements reached in 2004 were considerably lower than during previous agreement periods, which guarantees a continued weak nominal rate of wage increase. The agreements reached in early 2005 were also at levels indicating continued subdued wage growth. At the same time, real wages are growing strongly as a result of low inflation. Wages are expected to rise by 3.5 per cent in 2005 and are then assumed to rise by 3.5 per cent per year.
Continued low inflation
Inflation is currently very low. In 2004, consumer price inflation (CPI) was an average of 0.4 per cent, while underlying inflation (UND1X) was 0.8 per cent (see Table 1.7). The low inflationary pressure in the economy is caused by several factors. Unit labour costs have developed slowly for several years as a result of low wage increases and high productivity growth. Moreover, the weak development of demand and increased competition in, among other things, non-durables, have reduced profit margins. In addition, the contribution to inflation from imports, excluding energy, has been negative since 2003. However, the oil price rise in 2004 made a positive contribution to inflation. In 2005, changes in clothing import quotas and a further strengthening of the krona are expected to contribute to continued low imported inflation. The oil price development entails uncertainty in the inflation forecast.
Falling inflation expectations were measured in early 2005 and inflation expectations are now low. Low resource utilisation and subdued wage growth result in domestic inflationary pressure only rising slowly in the near future. Combined with low imported inflation, this results in underlying inflation (UND1X) amounting to only 0.7 per cent this year and 1.3 per cent in 2006. Consumer price inflation – which will be affected by rising interest rates on home loans in the near future – is estimated at 0.5 per cent this year and 1.5 per cent in 2006. Inflation is not expected to reach the Riksbank’s target of 2 per cent until 2007.
Table 1.7 Hourly wage, CPI and UND1X
Percentage change
| | 2003 | | 2004 | | 2005 | | 2006 | | 2007 | |
Hourly wages | | 3.5 | | 3.3 | | 3.5 | | 3.5 | | 3.5 | |
CPI, Dec-Dec | | 1.3 | | 0.3 | | 0.6 | | 2.0 | | 2.0 | |
CPI, annual average | | 1.9 | | 0.4 | | 0.5 | | 1.5 | | 2.0 | |
UND1X, Dec-Dec | | 1.6 | | 0.7 | | 0.7 | | 1.5 | | — | |
UND1X, annual average | | 2.2 | | 0.8 | | 0.7 | | 1.3 | | — | |
Sources: National Mediation Office, Statistics Sweden and Ministry of Finance.
1.6 Public finances
Public finances improved considerably in 2004 for several reasons. Both local government and central government consumption developed weakly, while central government expenditure on transfer payments was lower than expected. Central government interest expenditure also declined by SEK 7 billion between 2003 and 2004. General government net lending amounted to 1.1 per cent of GDP in 2004 (see Table 1.8). The government’s target is that net lending should amount to an average of 2 per cent of GDP over an economic cycle.
Net lending is expected to decline somewhat and is estimated at 0.7 per cent of GDP in 2005 and 0.6 per cent in 2006. In 2007, net lending is estimated at 1.1 per cent of GDP. Consequently, average net lending is estimated at 1.3 per cent of GDP during the period 2000–2007. The structural balance, in which the effects of cyclical fluctuations on net lending have been eliminated,
17
is estimated at 0.9 per cent of GDP this year. In 2006 and 2007, the structural balance is estimated at 0.7 per cent and 1.1 per cent of GDP respectively.
During the forecast period, both taxes (including charges) and expenditure are expected to decline as a percentage of GDP. Overall, both the tax ratio and the expenditure ratio are expected to fall by 1.5 percentage points between 2004 and 2007.
Table 1.8 General government finances
Per cent of GDP
| | 2003 | | 2004 | | 2005 | | 2006 | | 2007 | |
Revenue | | 55.8 | | 55.6 | | 54.9 | | 54.5 | | 54.2 | |
Taxes(1) | | 50.8 | | 50.6 | | 49.7 | | 49.4 | | 49.1 | |
Expenditure | | 55.9 | | 54.5 | | 54.2 | | 53.9 | | 53.1 | |
Net lending | | -0.1 | | 1.1 | | 0.7 | | 0.6 | | 1.1 | |
Structural balance | | 0.8 | | 1.8 | | 0.9 | | 0.7 | | 1.1 | |
Consolidated gross debt | | 52.0 | | 51.2 | | 49.9 | | 48.6 | | 47.3 | |
Net debt | | -1.5 | | -5.8 | | -6.0 | | -6.4 | | -7.1 | |
(1) Including taxes to EU.
Sources: Statistics Sweden and Ministry of Finance.
General government consolidated gross debt is also expected to decline as a percentage of GDP during the forecast period, from 51.2 per cent in 2004 to 47.3 per cent in 2007.
18
2 International developments
Global GDP growth slowed in 2004. This was partially a result of high commodity prices. Despite the slowdown, the global economy is estimated to have grown by 4.9 per cent last year, which is the highest rate of growth since the 1970s. Global GDP growth is expected to enter a somewhat calmer phase this year and next. However, growth rates of around 4 per cent in both 2005 and 2006 mean that the international climate for strong Swedish exports is believed to be good.
Strong but slowing growth in 2004
The rate of growth in the global economy was very high in late 2003 and early 2004. Low interest rates (in both real and nominal terms), rising property prices and a very strong performance by many growth economies contributed to global growth of 4.9 per cent in 2004. The economic recovery spread to more regions during the year, and Asia (excluding Japan) and the United States further strengthened their positions. Latin America, the Middle East, Africa and Eastern Europe also performed well, while the euro area lagged behind and the Japanese economy stagnated. However, growth rates slowed in most regions during the course of the year as a result of high commodity prices and a return to more long-term sustainable levels of growth. Rising oil prices and strong growth have yet to trigger any appreciable increase in global inflation. Key interest rates have been raised in several countries, including the United States, Canada, Australia and the United Kingdom. This has probably kept inflation expectations in check. However, the return towards more normal interest rates is from very low levels, and so monetary policy can still be viewed as expansionary in a global perspective.
Investment growing fast
Business sector investment has been growing strongly in the biggest economic regions. This is a result of firms having consolidated their balance sheets and recorded good earnings growth, while at the same time real interest rates have remained low. The upswing in investment has been under way since 2003 in the United States and Japan, and has now spread to the euro area. Private investment is expected to be one of the main economic drivers in the United States, the euro area and Japan during the forecast period.
Gradually brighter labour market
Although the economic performance of the three biggest regions – the United States, the euro area and Japan – has been relatively synchronised in recent years, developments in the labour market have differed markedly. The differences can be explained by both cyclical and structural factors.
Economic recovery began earlier in the United States than in the other regions, which explains why a recovery in employment was first seen in the United States. The more marked ups and downs in employment in the United States relative to the euro area and Japan reflect the more flexible US labour market (see Diagram 2.1 below). Compared with the euro area and Japan, US firms are probably quicker to cut back their workforce when demand falls, and therefore also to recruit again when demand picks up.
Employment growth slowed sharply at the end of 2000 in both the United States and the euro area. In the United States the number of people in employment fell for three quarters in a row, and the downturn was almost as severe as during the recession of the early 1990s. In the euro area the downturn in employment was less steep than in the United States and less severe than during the recession of the early 1990s. Employment in the United States began to pick up at the end of 2003, while the recovery in the euro area was less appreciable and arrived six months later. In Japan the labour market situation has been difficult for a long time, but it did improve last year. Employment growth was slightly positive, and unemployment fell to its lowest level for six years.
Last year unemployment amounted to 5.5 per cent in the United States and 4.7 per cent in Japan. Unemployment is expected to fall in both of these countries during the forecast period. In the euro area unemployment has held at around 8.8 per cent since mid-2003, and only a moderate decrease is anticipated in the coming years.
19
Diagram 2.1 Employment growth in the euro area, the United States and Japan
Percentage change
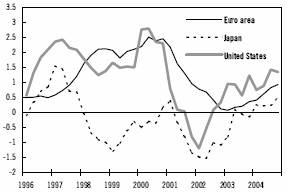
Source: OECD
The global risk picture
The average price of crude oil (Brent) rose by just over 30 per cent in 2004. This contributed to the slight slowdown in economic growth during the year. Higher oil prices are expected to result in slightly lower global growth during the forecast period as well. Oil prices are also a source of uncertainty in the forecast. Strong demand growth and continued geopolitical unrest, together with the associated supply disturbances, could lead to rising oil prices with negative effects on the global economy.
Besides oil prices, global imbalances present a risk in our assessment. The US current account deficit has been growing for many years, and amounted to around 6 per cent of GDP at the beginning of 2005. To date this growing deficit has been financed through strong foreign interest in investing in US assets. However, the possibility cannot be ruled out that the country’s very depressed long-term interest rates might start to rise if, for example, the Asian central banks – which have a high proportion of dollars in their currency reserves – decide to reallocate their assets in favour of other currencies. The US current account deficit has also been a contributing factor in the depreciation of the dollar in recent years. Some improvement in the US current account balance could be achieved in the short term if key Asian nations introduce more flexible exchange rates, or if public finances are tightened in the United States. In the longer term, structural reforms to boost growth in the rest of the world would have a positive impact on the US current account deficit. However, no appreciable improvement in global imbalances is anticipated during the forecast period, which means that the underlying problems remain. Should there nevertheless be a change, there is much to suggest that it would involve a sharp drop in the value of the dollar. The implications of this for the global economy are difficult to gauge (see section 12.2).
Table 2.1 GDP growth, inflation and unemployment
Percentage change
| | 2003 | | 2004 | | 2005 | | 2006 | | 2007 | |
Gross domestic product | | | | | | | | | | | |
World | | 3.6 | | 4.9 | | 4.1 | | 3.9 | | 3.6 | |
United States | | 3.0 | | 4.4 | | 3.7 | | 3.4 | | 3.3 | |
Japan | | 1.3 | | 2.6 | | 1.0 | | 1.7 | | 1.4 | |
Euro area | | 0.5 | | 2.0 | | 1.6 | | 2.1 | | 2.3 | |
Germany | | -0.1 | | 1.6 | | 1.0 | | 1.7 | | 2.2 | |
France | | 0.6 | | 2.5 | | 2.1 | | 2.0 | | 2.3 | |
Italy | | 0.4 | | 1.2 | | 1.0 | | 1.7 | | 1.9 | |
UK | | 2.2 | | 3.1 | | 2.6 | | 2.5 | | 2.7 | |
Nordic countries | | 1.0 | | 2.7 | | 2.8 | | 2.6 | | 2.4 | |
Denmark | | 0.5 | | 2.0 | | 2.3 | | 2.3 | | 2.2 | |
Finland | | 2.1 | | 3.4 | | 3.1 | | 2.7 | | 1.8 | |
Norway | | 0.4 | | 2.9 | | 3.0 | | 2.7 | | 3.3 | |
Consumer prices(1) | | | | | | | | | | | |
Euro area | | 2.1 | | 2.1 | | 1.9 | | 1.8 | | 1.8 | |
United States | | 2.3 | | 2.7 | | 2.6 | | 2.3 | | 2.3 | |
Japan | | -0.3 | | 0.0 | | 0.0 | | 0.2 | | 0.3 | |
Unemployment, per cent of labour force(2) | | | | | | | | | | | |
Euro area | | 8.9 | | 8.9 | | 9.0 | | 8.7 | | 8.6 | |
United states | | 6.0 | | 5.5 | | 5.1 | | 4.9 | | 4.7 | |
Japan | | 5.3 | | 4.7 | | 4.5 | | 4.3 | | 4.3 | |
Market growth for Swedish exports | | 4.4 | | 8.3 | | 8.1 | | 7.9 | | 7.6 | |
(1) HICP for the euro area and CPI for the United States and Japan.
(2) Eurostat definition for euro area and national definition for United States and Japan.
Sources: National sources, Eurostat and Ministry of Finance.
Continued strong demand for Swedish exports
Growth in world trade probably peaked in 2004. As the global economic cycle matures and the economic policy stimulus gradually subsides, the economy is expected to enter a calmer phase. Global growth is forecast to be around 4 per cent both this year and next, which can be compared with average global growth of around 3.5 per cent over the last 20 years. Global growth of 3.6 per cent is projected for 2007. Thus the climate for continued strong Swedish export growth is expected to remain good over the next
20
few years. Swedish world market growth – growth in the trade-weighted demand for processed goods encountered by Swedish exporters – is forecast to be 8.1 per cent in 2005 and 7.9 per cent in 2006, which is slightly above the historical average. World market growth of 7.6 per cent is projected for 2007.
2.1 The euro area
Short-lived economic upswing in the euro area
During the second half of 2004 the euro area economy slowed once again. The recovery that began in mid-2003 lasted for just four quarters. The upswing was driven primarily by strong export growth. When global demand weakened in mid-2004 and the euro continued to appreciate, the export climate deteriorated significantly. GDP growth is estimated to have been 2.0 per cent last year. Looking ahead, growth is expected to be driven increasingly by rising domestic demand, and GDP is forecast to grow by 1.6 per cent this year and 2.1 per cent next year. In 2007 growth is projected to rise further to 2.3 per cent.
The euro has strengthened considerably since the beginning of 2002, above all against the dollar but also in trade-weighted terms. Since 2002 the euro has gained more than 30 per cent against the dollar and more than 15 per cent against the currencies of the euro area’s most important trading partners. The euro’s appreciation in 2004 was moderate compared with previous years. However, the overall impact of the euro’s appreciation on the export industry is probably significant, and is expected to be felt after a certain time lag. At the same time the stronger euro has resulted in considerable pressure for change, which may lead to increased competitiveness relative to the rest of the world in the longer term.
There was a clear downturn in export growth during the second half of last year as the global economy entered a calmer growth phase. The euro area therefore lost the helping hand previously lent by strong external demand. The expected transition from an export-led economic upswing to increasingly domestically generated growth did not materialise last year. Growth in household consumption remained weak, and the upswing in investment was moderate compared with previous economic recoveries.
Domestic demand to strengthen
Domestic demand is predicted to strengthen this year, above all as a result of continued recovery in investment. The situation in the labour market is expected to improve somewhat this year in the form of increased employment growth. The upswing in the number of people in employment is expected to lead to stronger consumer confidence and thus increased household consumption. Low interest rates and subdued inflation will also support a recovery in household consumption. Recent years’ marked growth in the savings ratio has also given households scope to step up consumption.
Several factors suggest a continued upswing in investment in both 2005 and 2006. Firms’ profitability has grown significantly, and firms’ financial position is believed to be very good. The previous lengthy period of dwindling investment has led to a growing need for replacement investment, and at the end of last year capacity utilisation passed the historical average.
Altogether, the euro area is expected to grow in line with its potential growth rate over the next two-year period, and thus the GDP gap will narrow only marginally by 2007.
Major growth differentials in the euro area
GDP growth in the euro area as a whole amounted to 2.0 per cent last year. If we look instead at the average rate of growth when each country is weighted equally, this figure rises to 2.7 per cent. This reflects the fact that it is mainly some of the biggest economies in the euro area that are growing slowly. The growth differentials in the euro area widened during the year, especially between the four biggest economies: Germany, France, Italy and Spain (see explanatory box at the end of this chapter).
High inflation and high unemployment
In 2004 inflation in the euro area exceeded the ECB’s inflation target for the fifth year in a row. Despite low GDP growth and high unemployment over the last four years, inflation has held
21
around a level of just over 2 per cent. To some extent the high inflation last year can be explained by temporary effects, such as rising oil prices, higher indirect taxes and increased health expenditure. Underlying inflation has also exceeded the inflation target in recent years, with the exception of the odd month here and there. This relatively high inflation suggests that there are major structural problems in the economy. However, inflation is expected to fall slightly as the effects of previous price increases drop out of the calculations. The more restrained wage settlements in most of the euro economies are also expected to help to curb inflation.
Unemployment has kept surprisingly still over the last economic cycle, and employment growth has been very depressed. Unemployment in the euro area was 8.8 per cent last year and is expected to rise to 9.0 per cent this year. Falling labour costs in most of the euro economies combined with increased domestic consumption are expected to underpin accelerating employment growth this year and lead to reduced unemployment, primarily next year.
2.2 The United Kingdom
The UK economy peaked last year with a GDP growth of 3.1 per cent. GDP is forecast to grow by 2.6 per cent this year and 2.5 per cent next year. Strong domestic demand has been the driving force behind the economic upswing, while foreign trade has made a negative contribution to growth. Household consumption is expected to slow slightly, partly as a result of the Bank of England having increased its base rate. Rising interest rates have caused the previous strong growth in property prices to slow. The accumulation of household wealth resulting from the boom in property prices is therefore slowing as well. Sluggish wage growth is also contributing to lower consumption growth.
High capacity utilisation and an improved financial position are expected to lead to continued growth in business sector investment this year and next. The UK export industry has lost market share recently, partly due to the appreciation of sterling. Sterling weakened during the second half of 2004, which is expected to strengthen the export industry somewhat, but the contribution to economic growth from foreign trade is nevertheless predicted to be negative over the next few years. CPI inflation has risen slightly since autumn 2004 and is expected to approach the 2 per cent target in 2006–2007.
2.3 The Nordic countries
In the other Nordic countries, domestic demand was the main driver behind economic growth in 2004. The contribution to GDP growth from foreign trade was modest. Household consumption was stimulated by expansionary monetary and fiscal policy. In 2005 domestic demand will continue to be the main driver behind relatively strong GDP growth in the Nordic countries.
In Finland, household consumption and investment accounted for the bulk of GDP growth in 2004. Export growth was relatively weak given the strong global economic growth. Exports picked up towards the end of 2004, and foreign trade is expected to contribute more to GDP growth this year. The relatively strong growth in investment last year, which can be explained mainly by increased investment in housing, is expected to continue in 2005. Higher interest rates will contribute to the slowing of investment growth in 2006. Household consumption is predicted to grow at a good rate during the forecast period as a result of continued expansionary fiscal policy. GDP growth is forecast to be 3.1 per cent in 2005, 2.7 per cent in 2006 and 1.8 per cent in 2007.
In Denmark too, household consumption and investment were the main drivers behind GDP growth in 2004. As a result of this strong domestic demand, imports grew very fast during the last three quarters of 2004. Meanwhile export growth was modest due to relatively weak demand from the euro area. The contribution from foreign trade was therefore negative last year, and it is expected to remain negative in 2005. The strong growth in household consumption is forecast to continue this year, but higher interest rates and neutral fiscal policy are expected to slow consumption growth in 2006. GDP growth is forecast to be 2.3 per cent in 2005, 2006 and 2007.
As a result of high real wage growth and low interest rates, household consumption in Norway increased at a relatively rapid rate in 2004. Expectations of permanently higher oil prices have led to a major increase in investment
22
in the oil sector. Growth in investment is expected to accelerate in 2005, while household consumption growth will slow slightly relative to 2004. Imports grew strongly in 2004, and export growth was moderate. The contribution to GDP growth from foreign trade is expected to remain negative throughout the forecast period. GDP is forecast to grow by 3.0 per cent this year and 2.7 per cent in 2006. Continued favourable GDP growth is also projected for 2007.
2.4 The United States
Continued strong growth
The US economy continued to perform well in 2004. GDP growth was 4.4 per cent, the highest rate seen since the late 1990s. It was primarily household consumption and business sector investment which contributed to the high rate of growth, while net exports made a negative contribution. Domestic demand had previously been stimulated by highly expansionary economic policy, but continued to grow at a good rate in 2004 despite the fiscal policy stimulus largely ebbing out. Corporate earnings are historically high, and continued good earnings expectations have contributed to strong growth in private investment. Household consumption has increased as a result of rising disposable incomes and employment. Continued low interest rates have also stimulated growth in consumption and investment.
This positive economic performance is expected to continue this year, although economic policy will gradually be tightened and the economy will enter a slightly calmer phase. GDP is expected to grow by 3.7 per cent this year and 3.4 per cent in 2006. Growth of 3.3 per cent is projected for 2007.
Domestic demand the driver
Domestic demand is expected to remain the principal driver behind the economy during the forecast period. Employment grew steadily in 2004, and the slowdown in productivity growth during the second half of the year suggests continued robust employment growth in the economy. Unemployment has fallen, and wages are expected to grow more quickly as the situation in the labour market improves further. At the same time as developments in the labour market boost disposable incomes, a move towards a more neutral monetary policy suggests increased household saving. Household wealth has improved as a result of rising equity and property prices. After weakening slightly in the autumn, consumer confidence has rallied in recent months and is now at a very high level. Altogether, the outlook is bright for continued strong growth in private consumption both this year and next.
Private investment is also expected to continue to grow at a good rate as a result of firms’ strong balance sheets and continued good earnings prospects. At the same time firms are believed to have a continuing need to invest. Rising capacity utilisation, combined with still favourable financing conditions, will contribute to strong investment growth during the forecast period. Business sector confidence is high, especially in the service sector but also in the manufacturing industry. Exports are also expected to grow more quickly as a result of the competitive edge afforded by the weaker dollar. Since import volumes are substantially higher than export volumes, net exports are nevertheless expected to continue to contribute negatively to growth.
Inflation has risen at a moderate rate despite lower productivity growth and higher energy prices. However, productivity growth slowed from very high levels and remains good. This, combined with the Federal Reserve continuing to gradually tighten monetary policy, is expected to lead to continued moderate growth in prices.
Double deficits still a risk factor
The principal risks associated with the performance of the US economy remain high oil prices and the country’s large current account and budget deficits (see Diagram 2.2). The current account deficit has been growing for many years and is expected to continue to widen during the forecast period. Should there be a decrease in the deficit, this could lead to a sharp drop in the value of the dollar and rising bond yields (see alternative scenario in Chapter 12). Further deterioration in public finances could also have negative effects on confidence, resulting in rising
23
bond yields. However, the budget deficit is expected to narrow, which will put a damper on long-term interest rates. There are also risks pulling in the opposite direction: for example, the possibility cannot be ruled out that US GDP growth might be higher than anticipated given the good state of both the household and business sectors.
Diagram 2.2 Budget balance and current account balance in the United States
Percentage change
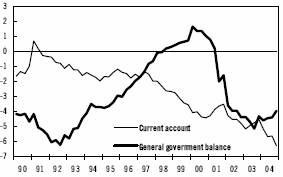
Note: Per cent of GDP.
Source: US Department of Commerce.
2.5 Japan
Economy stagnated in 2004
Having grown strongly in late 2003 and early 2004, the Japanese economy then stagnated during the remainder of the year. The global economic slowdown undermined export growth, and the contribution from foreign trade was negative for the first time in two years. Household consumption and private investment also slowed during the year. Furthermore a change in methodology – GDP is now calculated using a chain index – resulted in lower growth both in 2004 and historically. According to the revised figures, GDP growth in 2004 was 2.6 per cent, which is 1.5 percentage points lower than estimated in the Budget Bill last autumn.
Signs of recovery in the economy
Rising oil prices and a stronger yen mean that the contributions from foreign trade and household consumption are expected to be slightly smaller this year and next than predicted in the Budget Bill.
New statistics also paint a relatively optimistic picture of developments at the beginning of 2005. The strong growth in important export markets in Asia and the United States would suggest a recovery in the manufacturing industry. Besides stronger export growth, this is expected to result in growth in private investment picking up again after slowing at the end of last year. Fundamental factors in the form of rising capacity utilisation, favourable financing options and strong earnings growth would suggest a recovery in business sector investment. Export orders have been robust in recent months, and industrial output improved at the beginning of the year after slowing during the autumn. The purchasing managers index has also strengthened in recent months after gradually weakening since the middle of last year.
Household consumption stagnated during the second half of 2004. Falling real wages and an unusually warm winter served to dampen household demand. Statistics for the start of 2005 suggest a recovery in the household sector. Household consumption expenditure, the retail trade and disposable incomes performed well at the beginning of the year. The labour market has also improved through more full-time jobs and rising bonuses. Together with continued strong confidence indicators, the latest statistics would therefore suggest a recovery in household consumption growth in the time ahead.
Consumer prices were unchanged in 2004 after more than five years of deflation. As deflation expectations have also subsided, weak growth in prices is anticipated in the coming years. However, prices are not expected to increase to an extent that any change in the country’s extremely expansionary monetary policy can be expected.
Japan’s GDP is forecast to grow by 1.0 per cent in 2005 and 1.7 per cent in 2006. Growth of 1.4 per cent is predicted for 2007, which is in line with the potential growth rate.
2.6 The rest of Asia
Strong growth in the rest of Asia
Growth in Asia excluding Japan was almost 8 per cent in 2004, the strongest rate since 1996. In China growth slowed during the second quarter
24
before picking up again during the second half of the year. Elsewhere in Asia growth slowed gradually during the course of the year, which partly reflected a return to long-term sustainable rates of growth. Meanwhile oil prices rose sharply during the autumn. Domestic demand therefore slowed in most countries in the region. In China the authorities took a number of steps to cool the investment boom, as a result of which GDP growth slowed temporarily during the second quarter of last year. Thanks to a larger relative contribution from household consumption, the economy then grew strongly again during the second half of the year. Growth over the year as a whole was 9.5 per cent.
The latest statistics for China suggest that economic activity remained high at the beginning of 2005. After slowing gradually since last spring, growth in Chinese industrial output rose in January and remained strong in February. Household consumption and, in particular, net exports also grew strongly during the first few months of this year. The larger relative contribution from household consumption, combined with the slowdown in bottleneck sectors (such as steel, cement and aluminium), means that the composition of GDP growth looks set to be somewhat more balanced this year.
Prospective indicators such as the purchasing managers index have also picked up, which suggests that the Chinese economy will continue to stimulate demand in the region.
The tsunami disaster that hit Asia at the end of 2004 is primarily an enormous human tragedy. The economic consequences for the region as a whole are probably limited. Some countries’ tourist, agricultural and fisheries industries have been hit hard, but the affected areas’ share of GDP is small.
Aggregate GDP growth for Asia excluding Japan is forecast to be 7.0 per cent in 2005 before slowing to 6.5 per cent in 2006. In 2007 growth in the region is projected to slow further to 5.5 per cent.
2.7 Oil prices
Since the beginning of the year the price of Brent crude has grown strongly again from around USD 40 per barrel to around USD 55 in mid-March. Unlike previous price surges over the last year, there has been no specific event behind the upswing in 2005. Continued strong demand growth has probably led to a renewed focus on the limits of existing production capacity and the risk of global shortages.
Since January the International Energy Agency has revised its forecast for global oil demand upwards, and its forecast for oil supply from non-OPEC producers slightly downwards. This means that OPEC’s importance in meeting demand has grown, at the same time as the margins between supply and demand have narrowed. Existing global capacity is probably sufficient to meet demand in the coming years, but spare capacity is in relatively short supply, and so production disturbances can be expected to have a significant impact on oil prices.
The high oil prices will probably slightly reduce demand for oil already this year, which should contribute to oil prices gradually falling back during the year. In 2006 the margin between supply and demand is expected to grow as new capacity is taken into use and growth in demand for oil is further eroded by slightly lower global economic growth, conversion to alternative energy sources and greater energy efficiency. The forecast for the price of Brent crude is USD 44 per barrel in December 2005 and USD 40 in December 2006.
25
Large growth differentials in the euro area
The economy in the euro area began to slow again in mid-2004. It was the second time in less than two years that a recovery in the euro area had run out of steam before really getting going. The strong appreciation of the euro in recent years has to some extent helped to put a damper on growth in the euro area, but the main reasons for the low growth are weak domestic demand and, in particular, weak household consumption. Growth is being hampered more by domestic structural problems than by unfavourable exchange rate movements.
However, growth has not been weak in all of the euro economies in recent years. Some of the smaller economies – including Greece, Luxembourg, Finland and, above all, Ireland – have seen high rates of growth. Growth differentials in the euro area have narrowed since 1999. Between 1995 and 1999 the average maximum differential was just over 8 percentage points, whereas in recent years it has been around 6 percentage points (see Diagram). The decreased differentials in the euro area can to a great extent be explained by growth in Ireland having slowed significantly in recent years.
However, last year the growth differentials between the four biggest euro economies widened. Of these four, Germany and Italy have had the weakest GDP growth in recent years, while France and Spain have reported relatively high growth rates. Germany and Italy account for almost 50 per cent of the overall euro area economy, while France and Spain make up 30 per cent and the other eight countries just 20 per cent. Developments in the four largest euro economies therefore have a major impact on the euro area’s overall economic performance and so the design of monetary policy.
Average GDP growth in the euro area as a whole between 2001 and 2004 was 1.3 per cent. The average rate of growth during the same period when each country is weighted equally was 2.0 per cent. The slow-growing economies of Germany and Italy grew by an average of 0.8 per cent, while the fast-growing large economies of France and Spain grew by an average of 2.1 per cent. The other eight countries grew even more quickly: the average rate of growth in the small euro economies between 2001 and 2004 was 2.3 per cent.
This means that in recent years half of the euro area economy has grown by an average of 0.8 per cent a year while the other half has grown by an average of 2.2 per cent. The low growth in the euro area in recent years can therefore be explained to a great extent by two of the biggest economies – Germany and Italy – lagging behind the others.
The relatively large growth differentials in the euro area are also resulting in differentials in other key measures, such as inflation. Between 2001 and 2004 inflation averaged 2.0 per cent in Germany and Italy, but 2.6 per cent in France and Spain, and 2.7 per cent in the other eight euro economies. In other words, half of the euro area has had inflation rates virtually in line with the European Central Bank’s inflation target in recent years but also very low growth, while the other half has had relatively high growth but inflation well above the target rate.
Large growth differentials and inflation differentials in a currency area make it more difficult to pursue a monetary policy which is appropriate to conditions throughout the region. Few euro economies have been able to combine high growth with low inflation. Last year growth in the eight small euro economies was 3.1 per cent and inflation was 2.1 per cent. In Germany and Italy growth was 1.4 per cent and inflation 2.1 per cent, and in France and Spain growth was 2.6 per cent and inflation 2.7 per cent.
Growth differentials in the euro area
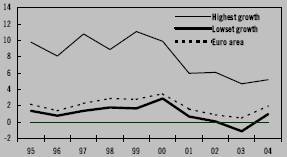
Note: The graph shows the highest and the lowest rate of growth in an individual member state for each year and the growth rate in the euro area as a whole.
Source: Eurostat.
26
3 Capital markets
Low interest rates contribute to continued expansive global financial conditions. In the currency market, the dollar weakened to its lowest level to date in relation to the euro in late 2004 and early 2005. Even if the rising interest rate differential between the United States and the euro area temporarily buoys the dollar, factors such as the US current account deficit are expected to contribute to the continued weakening of the dollar. A general depreciation of the dollar is forecast to contribute to a stronger trade-weighted krona exchange rate. In Sweden, the Riksbank is expected to leave the key interest rate unchanged during 2005 because of low inflation and relatively weak labour market growth.
3.1 International developments
Interest rates continue to be low in the financial markets. Global financial conditions are still expansive, at the same time that the global economy is expected to enter a calmer growth phase. All factors considered, economic conditions continue to be favourable. Increased global competition and relatively high productivity growth have contributed to low inflation and low inflation expectations; consequently, central banks have been able to keep key interest rates at low levels for some time. In the future, central banks are expected to be relatively restrictive, with tightening monetary policy both in the short term and somewhat longer term.
International bond yields are still at historically low levels. Bond yields are expected to rise in the future, but many factors suggest that yields will remain relatively low from a historical perspective. Structural factors such as changed investment regulations for insurance companies and pension funds are expected to further contribute to dampening the upswing for longer bond yields in Europe.
Stock markets have climbed during the beginning of 2005 in the wake of sharply rising corporate profits. Continued expansive financial conditions, growing activity in the business sector and increased dividends are expected to contribute to favourable financial conditions for firms.
The credit market has continued to move in the right direction and the differential between corporate bonds and bonds in emerging markets in relation to treasury bonds has dropped to low levels in recent years. The low interest rate differential is probably an expression of the low demand for capital. In part, firms’ indebtedness is lower because of rising corporate profits due to efficiency measures and increased income. Low yields on treasury bonds have probably also contributed to increased interest among investors for alternative investments, such as bonds in emerging markets and corporate bonds.
Rising key interest rate in the United States
The Federal Reserve began to tighten monetary policy in June 2004 and key interest rates are now at 2.75 per cent. The key interest rate is still low and monetary policy continues to be expansionary. Growth in the United States is still good, at the same time that inflation is low and demand for labour has increased. The tightening of monetary policy is expected to continue during the year as the recovery in the labour market continues and capacity utilisation increases in the US economy. Underlying inflation is expected to remain relatively low during the forecast period. The forecast for the key US interest rate is 3.50 per cent in December 2005 and 4.00 per cent in December 2006. A further tightening of monetary policy is expected during 2007.
Diagram 3.1 Key interest rates in the United States, the euro area and Sweden
Per cent
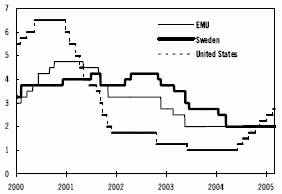
Source: EcoWin.
27
US bond yields have risen since the beginning of the year, but both nominal and real bond yields are low despite good growth in the US economy. The development is similar in several other countries and can in part be an expression of global financial integration. Stable growth in the United States and increased capacity utilisation are expected to continue boosting bond yields. However, a large borrowing requirement to finance the US budget deficit could help government bond yields to rise more than what had been assumed during the forecast period. This risk is especially large if the Asian central banks should all reduce their purchases of US treasury bonds at one time. Moreover, rising inflation expectations, following the continued depreciation of the dollar, could contribute to a sharper upswing in interest rates than assumed in the forecast, which would also impact on bond yields globally. Possible consequences of such a development are illustrated in Chapter 12.
Diagram 3.2 10-year government bond yields in the United States, Germany and Sweden
Per cent
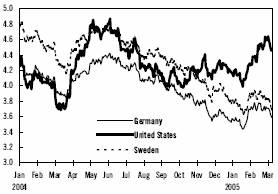
Source: EcoWin.
Interest rates in the euro area
Growth in the euro area continues to be low. The rate of wage increase has been dampened and household consumption has been restrained in recent years. All factors considered, this has helped the European Central Bank (ECB) to keep the key interest rate (refi rate) at 2.00 per cent since spring 2003, even though inflation has been over the central bank’s inflation target. However, the appreciation of the euro has caused financial conditions to tighten somewhat. Because of continued subdued growth and a decline in underlying inflation, the ECB is expected to leave the key interest rate unchanged at 2.00 per cent during 2005. A tightening of monetary policy will begin next year and in December 2006 the refi rate is expected to reach 2.50 per cent. Interest rates are expected to continue to climb during subsequent years.
European bond yields are expected to follow international movements and rise as resource utilisation increases within the euro area. However, yields in the euro area are not expected to rise as much as US yields. Structural changes in areas such as the insurance market are expected to help increase demand for long-term bonds, which will hold back interest rates somewhat.
Weaker dollar
The US dollar weakened to its lowest level to date in relation to the euro in late 2004 and early 2005. In the beginning of 2005 the dollar strengthened significantly, but this bounce is expected to be temporary. Favourable signals about the ability to handle the US budget deficit and focus on the increased interest rate differential in relation to the euro area are contributing factors to the appreciation of the dollar. Nonetheless, the global imbalances remain as the prevailing underlying factors that will probably continue to control the development of the dollar over the next few years. The current account deficit is growing and was the equivalent of about 6 per cent of GDP at the beginning of 2005. Consequently, foreign capital is needed to finance the savings deficit in the economy. Asian central banks are major buyers of US Treasury bonds, which supports the dollar. Despite considerably higher growth in the United States than in the euro area in recent years, the net inflow of private capital in the form of direct investments and portfolio investments has continued to be low. In the long term, capital inflow from Asian central banks is not expected to be enough to finance the existing deficit in the US current account balance. Therefore a reduction in the current account deficit may be achieved through a weaker dollar exchange rate. It is difficult to say when such a correction might take place, but some adjustment of exchange policy in Asia is expected during the forecast period. All factors considered, a continued weakening of the dollar can be expected in the future. The forecast for
28
the dollar is 1.37 to the euro in December 2005 and 1.40 in December 2006.
Diagram 3.3 The US dollar against the yen and euro
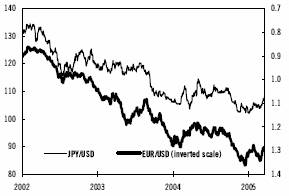
Source: EcoWin.
International stock exchange developments
The international stock exchanges have started the year with rising share prices. Firms continue to report earnings that exceed market expectations. In general, corporate profits are high due to rising sales and continued efficiency gains. In 2004 profits for firms in the US S&P 500 index climbed 20.3 per cent, which means that profits are greater now than they were during the record year of 2000. Profit growth has probably peaked and over the next few years, firms’ profits are expected to grow at a slower pace than in 2003 and 2004. The expansive financial conditions are expected to continue to contribute to favourable conditions for firms in the future. At the same time, there is great interest in the US central bank’s monetary policy.
Diagram 3.4 Stock market developments in the United States, the euro area and Sweden
Index 2002-01-01
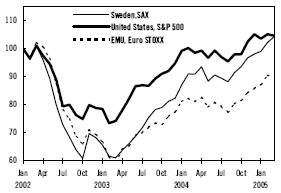
Source: EcoWin.
If surprising signs of growing inflation or rising labour costs should occur, entailing faster interest rate increases than what is expected today, the stock market could react negatively. However, the current valuation of the stock markets would allow relatively extensive rate hikes before the stock market can be viewed as overvalued in relation to the bond market.
3.2 Developments in Sweden
Monetary policy continues to be expansionary
The Riksbank has kept the current key interest rate level since spring 2004. Expectations of an increase in the key interest rate have been postponed in the wake of continued low inflation and weak developments in the labour market. Inflation is significantly below the Riksbank’s inflation target and the Riksbank has announced that interest rates will remain at the current level for some time. The Riksbank has stressed that the substantial credit growth in households poses a risk, contributing to the assessment that interest rates should not be lowered any more. In this context, the Riksbank is expected to leave the key interest rate unchanged this year. However, if inflation is lower than expected and the situation in the labour market worsens, an interest rate cut cannot be ruled out. In 2006 the Riksbank is expected to tighten monetary policy as resource utilisation rises, the labour market situation improves and inflation increases. The forecast for the repo rate is 2.00 per cent in December 2005 and 2.75 per cent in December 2006. The Riksbank is expected to continue tightening monetary policy in 2007.
Bond yields expected to climb
New regulations for how pension capital should be managed have had a damping effect on interest rates in the second half of 2004 and the beginning of 2005. The new regulations involve changes in the guidelines for how insurance companies and pension funds should manage and invest policyholders’ assets and how to assess the value of insurance companies’ undertakings. The regulations are expected to
29
come into effect over the next few years. The changes are likely to contribute to increased demand for long-term bonds, which will reduce yields. All factors considered, Swedish long-term interest rates are still expected to climb in the future.
The differential between Sweden and Germany for ten-year government bond yields has narrowed recently and in early April was about 0.10 percentage points. Contributing factors include the low inflation in Sweden and the postponement of expected Swedish key interest rate increases. The differential in relation to Germany is expected to be about 15 points during the forecast period.
Diagram 3.5 The differential between 10-year government bond yields in Sweden and Germany
Basis points
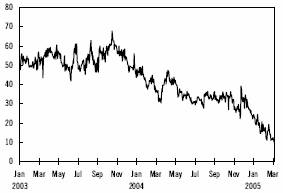
Source: EcoWin.
Krona continuing to appreciate
Sweden has a substantial current account surplus that affects the krona. In addition, growth is high in relation to the euro area. The trade-weighted TCW index was noted in early April at about 125. The performance of the krona in the future is expected to be favourable and pricing in the market suggests that a further strengthening in relation to the euro is expected. However, estimates of the krona’s long-term equilibrium, based on real factors, suggest that the krona is no longer undervalued. This means that the scope for further appreciation in relation to the euro is probably limited. The fluctuations of the dollar greatly influences the fluctuations of the krona, since the krona tends to follow the euro against the dollar. A continued general depreciation of the dollar will probably result in a stronger trade-weighted krona exchange rate, expressed as the TCW index. All factors considered, the krona is expected to continue to appreciate this year and the forecast for the TCW index is 121 in December 2005, after which the krona is expected to remain stable.
Diagram 3.6 TCW index
Index
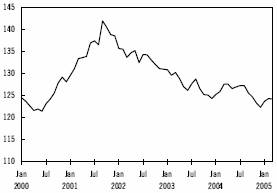
Source: EcoWin.
Balance of payments financial account
The Riksbank’s balance of payments statistics reveal that Swedish and foreign investors’ purchases and sales of shares and interest-bearing securities resulted in a net outflow of SEK 177.6 billion in 2004 (see Table 3.1). Net outflow included shares and interest-bearing securities. These flows may have an impact on the krona; to what extent depends on what proportion of these portfolio investments is hedged against exchange rate fluctuations.
30
Table 3.1 Balance of payments
Flows, SEK billion
| | 2003* | | 2004* | |
A. Current account | | 185.5 | | 205.6 | |
B. Capital transfers | | 0.0 | | 0.6 | |
C. Financial balance | | -227.5 | | -211.2 | |
Direct investment | | -161.3 | | -101.4 | |
Portfolio investment | | -73.4 | | -177.6 | |
Debt securities | | -39.6 | | -134.2 | |
Swedish | | -71.4 | | -135.0 | |
Foreign | | 31.8 | | 0.7 | |
Equities | | -33.9 | | -43.2 | |
Swedish | | -37.0 | | -44.9 | |
Foreign | | 3.1 | | 1.8 | |
Financial derivatives | | 8.9 | | -1.6 | |
Other investment | | 14.7 | | 61.1 | |
Reserve assets | | -16.3 | | 8.4 | |
D. Net errors and omissions | | 42.0 | | 5.0 | |
* January to December.
Source: Riksbank.
Performance of the stock market
The favourable share price developments in Stockholmsbörsen (the Stockholm stock exchange) in 2004 were extensive and essentially all industry indices have risen, with the exception of health care. The positive trend continued into the beginning of 2005 in the wake of strong corporate reports and high profits. Swedish firms reported strong earnings and rising sales, which should have a favourable impact on stock market performance.
Table 3.2 Interest and exchange rate assumptions
Final entry for each year
| | 2003 | | 2004 | | 2005 | | 2006 | | 2007 | |
Repo rate | | 2.75 | | 2.00 | | 2.00 | | 2.75 | | 3.25 | |
6-mth interest rate | | 2.70 | | 2.05 | | 2.30 | | 2.95 | | 3.40 | |
5-year interest rate | | 4.30 | | 3.33 | | 3.70 | | 4.00 | | 4.10 | |
10-year interest rate | | 4.86 | | 3.90 | | 4.20 | | 4.30 | | 4.40 | |
Spread | | | | | | | | | | | |
Swe-Ger 10 yr | | 0.51 | | 0.25 | | 0.15 | | 0.15 | | 0.15 | |
6-mth EURIBOR | | 2.14 | | 2.16 | | 2.3 | | 2.65 | | 3.10 | |
TCW index | | 124 | | 121 | | 121 | | 121 | | 121 | |
EUR/SEK | | 9.02 | | 8.98 | | 8.90 | | 8.90 | | 8.90 | |
USD/SEK | | 7.36 | | 6.70 | | 6.50 | | 6.36 | | 6.36 | |
EUR/USD | | 1.22 | | 1.34 | | 1.37 | | 1.40 | | 1.40 | |
Source: Ministry of Finance.
31
4 Foreign trade
Last year Swedish exports benefited from a strong global economy. Foreign trade contributed 2.0 percentage points to Sweden’s GDP growth in 2004. The global economy is expected to grow at a more restrained pace in the next three years and the exchange rate will be further strengthening. This will slow export growth to an estimated 6.9 per cent this year, 5.8 per cent in 2006 and 5.7 per cent in 2007. At the same time imports are projected to grow faster than exports as a result of increased domestic demand. Imports are expected to grow by 7.9 per cent this year, 6.2 per cent in 2006 and 6.4 per cent in 2007. This means an overall reduction in the contribution of foreign trade to GDP growth to approximately 0.2 percentage points for each year in the period 2005–2007.
Table 4.1 Exports and imports of goods and services
| | SEK billion | | Percentage change in volume | |
| | 2004 | | 2004 | | 2005 | | 2006 | | 2007 | |
| | | | | | | | | | | |
Exports of goods | | 896 | | 9.5 | | 6.2 | | 5.6 | | 5.7 | |
Processed goods(1) | | 763 | | 9.4 | | 6.7 | | 5.8 | | 5.7 | |
Exports of services | | 280 | | 12.6 | | 9.2 | | 6.7 | | 5.7 | |
Total exports | | 1176 | | 10.2 | | 6.9 | | 5.8 | | 5.7 | |
Imports of goods | | 719 | | 7.2 | | 7.3 | | 6.3 | | 6.4 | |
Processed goods(1) | | 554 | | 8.7 | | 8.0 | | 6.5 | | 6.4 | |
Imports of services | | 253 | | 5.3 | | 9.8 | | 6.1 | | 6.4 | |
Total imports | | 972 | | 6.7 | | 7.9 | | 6.2 | | 6.4 | |
(1) Classification according to SNI.
Sources: Statistics Sweden and Ministry of Finance.
4.1 Exports of goods
Strong demand for Swedish goods in 2004
The strong global economic growth in 2004 had a very beneficial effect on Swedish export goods. In addition, global demand was strongly weighted towards products of which Sweden is a relatively large producer. The Swedish export industries have continued to be highly competitive, despite the strengthening of the krona, as a result of significant productivity growth and a low level of wage increases. According to the National Accounts, export of Swedish goods grew by 9.5 per cent last year (see Table 4.1).
Growth has been particularly strong in the telecommunication equipment industry, which can be partly explained by a pent up need of investment by telecommunication operators. The strong global demand for raw materials has moreover been to the advantage of the Swedish raw material industries with a resulting increase in both volumes and prices of exports. Rising global commodity prices had the effect of increasing intermediate goods prices for companies in Swedish manufacturing industry. Price increases measured in terms of the Swedish krona were nevertheless adversely affected by the strengthening of the krona against the dollar.
Continued strong growth in exports in 2005–2007
Growth in exports of goods in the second half of 2004 slowed in comparison with the first. The quarterly Business Tendency Survey from the National Institute of Economic Research (NIER) indicates a slackening of the rate of increase in export orders in comparison with the strong increase at the beginning of 2004. The weakening in the value of the dollar against the krona this year will contribute to a reduction in exports to the United States and countries with currencies tied to the dollar. Some reduction in global market growth, that is, the demand for imports of processed goods encountered by Swedish exporters, will also be a factor in slowing export growth this and next year.
Despite some decline in global market growth during the period 2005–2007, it is nevertheless forecast to continue to be relatively strong. Swedish exports largely consist of goods, which are in demand early on in a business cycle, for example telecommunication equipment. This has the result that demand for Swedish export goods slows at an earlier stage than the global market growth.
This year the strong growth in telecommunication equipment exports will be more moderate as operators reduce investment to levels which are more sustainable in the long term. Nevertheless, export of telecommunication equipment is expected to show good growth during both 2005 and 2006. The outlook for the engineering, steel and metal industries remains good with a continuing high growth rate both this year and in 2006.
The violent storm experienced during January this year is expected to lead to an increase in the export of timber goods, primarily this year but continuing in 2006 as well. Despite the increased exports of timber goods, the effects of the storm
32
on total exports of goods are expected to be only marginal.
Exports of goods are forecast to increase by 6.2 per cent this year and by 5.6 per cent in 2006. Fewer working days in 2006 compared with 2005 will have the effect of reducing export growth by 0.5 percentage points. Calendar adjusted export growth is expected to be 6.1 per cent in 2006. Exports of goods are forecast to grow by 5.7 per cent in 2007.
Dearer Swedish export goods
Substantial improvements in productivity within the Swedish export industry last year enabled firms to reduce prices valued in terms of the krona with a continuation in profit growth.
Swedish export prices measured in a common currency rose following the strengthening of the krona. However at the same time international market prices rose still more. Overall the competitiveness of Swedish export firms was very satisfactory last year, see section 5.1.
International prices for processed goods are expected to continue to rise next year. This also applies to Swedish export prices for processed goods valued in terms of the krona, albeit at a lower rate than international prices. The forecast strengthening of the krona means that Swedish export prices will increase more than global prices measured in a common currency. The relative prices(2) of Swedish export firms will therefore show a rise during 2005 and 2006.
4.2 Imports of goods
Strong growth in imports in 2004
The strong growth in imports into Sweden continued during 2004 with an increase of 7.3 per cent in imported goods compared with the preceding year. Processed goods constitute about three quarters of total imports. Imports of processed goods have gradually increased since the end of 2002 but rose more steeply at the beginning of 2004, leading to imports of processed goods rising by just over 10 per cent in the second half of the year compared with the corresponding period of the preceding year. For the whole year of 2004, imports of processed goods rose by 8.7 per cent. This strong growth was attributed to a number of sectors, including imports of telecommunication equipment and office machinery and computers, which showed a rise of 36 per cent and 39 per cent respectively. Furthermore, a large increase in imports of textile goods, clothing and shoes was seen towards the end of 2004.
Raw material imports increased by 3 per cent during 2004, representing a decrease compared with 7.5 per cent in 2003. Just over 40 per cent of the imports of raw materials comprise the crude oil and petroleum group of products,. These showed an increase of 4.4 per cent compared with the preceding year.
Strong growth in imports to continue in 2005 and 2006
The demand for imported processed goods is expected to continue to be strong during 2005 and 2006. The import content of exported goods is considerable. Imports of processed goods are thus boosted by strong export growth. Growing domestic demand will also be a contributory factor to a continuing rise in imports. Growing household consumption and investment in machinery and a need to rebuild stocks are among the factors affecting an increased demand for imports.
A continuing high level of processed goods imports is thus very likely. It is projected that imports of processed goods are set to rise by 8.5 per cent and 6.5 per cent in 2005 and 2006, respectively.
Rising raw material imports are also expected against the background of a strong industrial outlook and lower commodity prices. Imports of goods are forecast to grow overall by 7.3 per cent this year and 6.3 per cent next year.
Import prices continue to be low
The slight rise in import prices seen in recent years continued in 2004 with an increase of only 0.8 per cent. However a large difference was seen between the price trends for processed goods on
(2) Swedish export prices divided by international prices measured in common currency terms.
33
one hand and raw materials on the other. Prices of processed goods showed a decrease of 1.1 per cent while commodity prices went up by 7.8 per cent. The upturn in commodity prices was supported by strong global demand in combination with supply problems at some metal producers and the sharply rising price of oil. Prices for processed goods were held down by falling prices for (for example) telecommunication equipment, food, textile goods and office machinery and computers.
Further strengthening of the krona is expected during 2005 and 2006 which will contribute to moderating import prices. However international prices for processed goods are forecast to rise somewhat faster which will have a contrary effect. Altogether, import prices of processed goods are estimated to rise by just over 0.5 per cent during 2005 and 2006.
Prices of imported raw materials are forecast to rise by around 1.0 per cent this year. The upturn is primarily due to the rising price of oil early this year. The prices of the majority of other commodities are expected to fall to more normal levels after the recently seen increases. This takes account of the fact that the supply of metals will improve following fewer supply problems and increased production capacity. 2006 is expected to see a combination of lower crude oil and metal prices contribute to a fall in commodity prices.
The overall price of imported goods is forecast to rise approximately 0.5 per cent this year with a reduction of approximately 1 per cent next year.
The forecast assumes that the prices of domestically-produced goods will rise faster than prices of imported goods. As a consequence replacement of domestically-produced goods by imports will be favoured.
4.3 Trade in services
Exports of services grew by 12.6 per cent in 2004 while corresponding imports went up by 5.3 per cent. The contribution to GDP growth of the trade in services amounted to 0.8 percentage points. A significant proportion of the increase in exports of services is attributable to the sharp rise in other business services which includes consultant services, licences and patents, and banking services. Merchanting (see explanatory box at the end of the chapter) constituted a fifth of these services overall and grew by just over 30 per cent last year. Imports of services also grew sharply during 2004, mostly in the second half of the year.
The growth in exports of services will moderate both this year and next as the global demand for Swedish corporate services slows. Exports of services largely follow the trend in exports of goods. The rate of increase in the export of freight services and of foreign travel within Sweden will slow during the forecast period. Despite this, the rate of increase in exports of services is considered to continue strongly during the forecast period.
The tsunami disaster in Asia had an adverse effect on foreign travel by Swedes, which is classified under imports of services. The strengthening of the krona and increasing disposable income during 2005 and 2006 is nevertheless expected to lead to a sharper increase in foreign travel during the forecast period. Increasing imports of goods this year are expected to lead to stronger demand for imported corporate services. Imports of services will grow faster this year than in 2004.
There will therefore be a significant reduction in the contribution to GDP growth made by trade in services this year compared with 2004. Exports of services are expected to grow by 9.2 per cent this year and 6.7 per cent in 2006 while corresponding imports are forecast to grow by 9.8 per cent this year and by 6.1 per cent in 2006.
4.4 Current account balance
The surplus on the current account represented 8.1 per cent of GDP in 2004, an increase of 0.5 percentage points compared with 2003. This is partly attributable to a further surplus in the trade balance in 2004, which amounted to 6.8 per cent of the GDP for the year. Trade in services and investment income also made a positive contribution to the increase in the surplus on the current account. Substantial growth in productivity, healthy public finances, strong demand for exports and an ageing population are contributing factors to the large current account surplus.
This year the positive contribution from foreign trade to GDP growth is expected to fall significantly compared with last year while the
34
contribution from investment income will grow. A somewhat larger contribution from foreign trade than this year and a continued increase in investment income is expected in 2006.
Prices for Swedish exports are forecast to rise more than import prices during 2005 and 2006. Sweden’s terms of trade, that is, the ratio of export prices compared with import prices, is increasing and is forecast to make a positive contribution to the current account surplus. Overall the current account surplus is estimated to be 7.8 per cent in 2005 and 8.2 per cent in 2006 and 2007 as a proportion of GDP.
Table 4.2 Current account balance
SEK billion, current prices unless otherwise stated
| | 2004 | | 2005 | | 2006 | | 2007 | |
Trade balance | | 172 | | 180 | | 198 | | 206 | |
% of GDP | | 6.8 | | 6.8 | | 7.1 | | 7.0 | |
Service balance | | 40 | | 34 | | 38 | | 39 | |
Factor income | | 28 | | 31 | | 33 | | 35 | |
Current transfers | | -35 | | -36 | | -40 | | -41 | |
Current account | | 206 | | 209 | | 229 | | 239 | |
% of GDP | | 8.1 | | 7.8 | | 8.2 | | 8.2 | |
Capital transfers | | 1 | | -2 | | -3 | | -3 | |
Net lending | | 206 | | 207 | | 226 | | 236 | |
% of GDP | | 8.1 | | 7.8 | | 8.1 | | 8.1 | |
Sources: The Riksbank and Ministry of Finance.
4.5 Gross national income
Gross national income (GNI) is obtained by adding Swedes’ income from abroad to GDP and subtracting the income of non-residents in Sweden measured in current prices. GNI is for example used as the basis for calculating aid to developing countries and Sweden’s contribution to the EU. Historically GNI has been lower than GDP. However, following the Riksbank’s latest quarterly report there has been an upward revision of the figure for investment income for both 2003 and 2004. This means that GNI is now calculated as being higher than GDP both in 2003 and 2004. This situation is expected to continue in the future when Sweden’s net position vis-à-vis the rest of the world improves as a result of the large current account surplus.
Table 4.3 Gross national income (GNI)
SEK billion, current prices
| | 2004 | | 2005 | | 2006 | | 2007 | |
GDP | | 2543 | | 2664 | | 2796 | | 2927 | |
Primary income(1) | | 30 | | 32 | | 34 | | 35 | |
GNI | | 2573 | | 2697 | | 2830 | | 2962 | |
(1)Wages, investment income, subsidies and taxes net to the rest of the world.
Sources: Statistics Sweden and Ministry of Finance.
Merchanting
Merchanting is defined as the trade in goods of Swedish firms abroad which does not cross Swedish borders. The type of merchanting, which is currently most extensive, occurs when a Swedish parent company is responsible for the invoicing of sales of goods which are produced by a subsidiary in another country and delivered to the buyer in a third country.
In transactions of this type there is a margin between the value invoiced by the parent company to the buyer in the third country and the amount paid by the parent company to its producing subsidiary. This margin is termed merchanting and represents an item in the National Accounts as a Swedish services export and Swedish production.
The reason for this is because the margin can be regarded as cover for the costs incurred by the parent company in product development, research, marketing, corporate management, etc.
The statistics for merchanting are not regularly published in the National Accounts. However there is published information for 2004. In current prices, merchanting amounted to SEK 33 billion, the equivalent of over 10 per cent of total services exports of SEK 280 billion. Merchanting grew by 30 per cent compared with 2003 and contributed 0.4 percentage points to GDP growth in 2004. This sharp increase in merchanting is seen as primarily being due to the buoyant economic situation. The rate of increase is forecast to moderate in line with a slowing in export growth and the positive contribution made to GDP growth by merchanting is likely to decline.
35
5 Business sector output
In 2005, the economic recovery will broaden and domestic demand will contribute increasingly to growth. This will result in higher production growth in the service sectors and the construction industry. Industrial activity, on the other hand, is expected to enter a calmer phase, partly due to a slowing global economy. This is likely to result in production growth in the overall business sector slowing in 2005. In 2006, growth in the service sectors is also expected to subside, which will generally put a damper on growth in the business sector. Business sector output is estimated to rise by 3.8 per cent in 2005 and 3.2 per cent in 2006.
Production growth forecast to slow
Business sector output(3) rose sharply in the late 1990s but this growth decelerated during the 2001–2003 period. Many improvements were seen in 2004, however. Output rose by 4.0 per cent compared with 2003. The higher growth of 2004 can mainly be explained by the fact that industrial activity improved significantly during the year. The main drivers were export firms in industry.
Table 5.1 Business sector output
| | SEK billion | | Percentage change in volume | |
| | 2004 | | 2004 | | 2005 | | 2006 | | 2007 | |
Agriculture, forestry, fisheries | | 41 | | 1.2 | | 1.8 | | 1.9 | | — | |
Industry | | 472 | | 9.1 | | 6.0 | | 5.0 | | — | |
Electricity, gas, heating | | 64 | | 3.2 | | 2.3 | | 1.8 | | — | |
Construction | | 102 | | 3.6 | | 4.5 | | 4.4 | | — | |
Services | | 1,081 | | 2.0 | | 2.9 | | 2.4 | | — | |
Total business sector(1) | | 1,760 | | 4.0 | | 3.8 | | 3.2 | | 2.9 | |
(1)Excluding FISIM.
Sources: Statistics Sweden and Ministry of Finance.
Industrial activity is very likely to continue showing favourable growth, but as the global economy enters a somewhat calmer phase, industrial growth will also slow. Output in the investment goods industry in particular will grow more slowly in the near future. Output in other sectors, with the exception of the consumer goods industry, will continue to rise at a satisfactory rate during the forecast period. In 2005, the economic recovery will broaden and domestic demand will rise, boosting the service sectors. Industrial demand for services will grow at the same time as the retail trade strengthens in pace with rising consumption. For this reason, growth in the service sectors is likely to accelerate. However, the slowdown in industry will undermine production growth in the business sector this year. In 2006, the growth rate in the private service sectors will also slow, which combined with somewhat slower growth in industry as a whole will check business sector growth.
Production growth in the business sector will be boosted by increased production in the construction industry. Construction activity began recovering as early as 2004. This change was largely due to increased housing investment. The low interest rates suggest a continued high level of housing investment this year and next (see section 10.3). Repairs are also expected to contribute to rising output in the construction industry. Construction investment in the manufacturing industry, on the other hand, is likely to show modest growth as a result of a surplus of vacant premises.
Altogether, business sector output is forecast to rise by 3.8 per cent in 2005 and 3.2 per cent in 2006 (see Table 5.1). Business sector output is thus expected to grow faster than the potential growth in both 2005 and 2006. Gradually, available resources will decline and output will approach the estimated potential level. In 2007, output is forecast to rise by 2.9 per cent.
Business sector productivity last year rose by 3.2 per cent. This was mainly an effect of high productivity growth in industry. Recruitment plans in industry were cautious at the same time as output picked up significantly. The productivity growth of the service sectors was lower. Business sector productivity in 2005 will grow at a similar rate as in 2004, but productivity growth in 2006 is likely to be slower as firms’ ability to raise the level of output through efficiency measures decreases. This means an increase in employment and average hours worked. Business sector productivity is estimated to increase by 3.3 per cent in 2005 and 2.4 per cent in 2006.
(3) Output refers to value added, i.e. the value of gross output less intermediate consumption.
36
5.1 Industry
Increase in production to slow in the future
In 2004, industrial output increased 9.1 per cent. This was much higher than the year before and was the highest growth rate since 1995. The automotive and telecommunication equipment industries showed the most favourable growth. Capacity utilisation rose gradually in 2004 and reached a historic high at the end of the year (see Diagram 10.3).
The prospects for Swedish industry improved as the global economy recovered in 2003. The inflow of orders from the export market rose and output subsequently increased. The favourable developments continued throughout much of 2004. Industrial activity slowed in late 2004, however, largely in pace with the global economic slowdown. Production mainly slowed in the investment goods industry, which includes motor vehicles and telecommunication equipment.
The situation for the telecommunication equipment industry improved considerably in 2004. The demand for telecommunication equipment increased sharply last year, as reflected by the inflow of orders and higher output. This situation is, among other things, an effect of the low level of investment in the telecoms sector during the crisis years of 2001 and 2002, when value added for the telecommunication equipment industry was negative according to the National Accounts. In 2005, output in the telecommunication equipment industry will continue to pick up, but not at the same high rate as in 2004. In 2005, investment growth in this industry is likely to return to more normal levels, which is in turn expected to slow production growth in the industry this year and next.
Growth in the automotive industry is also expected to slow. The inflow of orders dropped toward the end of 2004 and car sales on the most crucial markets are expected to slow in the future.
According to several leading indicators, for example the National Institute of Economic Research (NIER) Business Tendency Survey, industrial activity slowed further in early 2005. Output is nevertheless still rising according to the indicators, but at a slower rate. Also, the future global economic situation still appears to be favourable, meaning good prospects for Swedish exports. The outlook for the engineering industry appears brighter this year compared with 2004 due to forecast investment growth on the crucial European market. A slight slowdown in the global economy, however, would mean somewhat of a slowdown in overall industrial activity compared with 2004. Output would also decline as a result of lower demand in certain industries in the domestic market. All in all, industrial output is forecast to rise by 6.0 per cent in 2005 and 5.0 per cent in 2006.
A substantial increase in production combined with a slight increase in average hours worked meant that industrial productivity rose by 9.0 per cent last year. This year and in 2006, output will continue to increase, but at a slower rate, which will limit productivity growth. Productivity is likely to rise by 6.6 per cent in 2005 and 4.8 per cent in 2006 (see Table 5.2).
Table 5.2 Selected industrial statistics
Percentage change, unless otherwise stated
| | 2003 | | 2004 | | 2005 | | 2006 | |
Industrial output | | 2.6 | | 9.1 | | 6.0 | | 5.0 | |
Productivity | | 6.4 | | 9.0 | | 6.6 | | 4.8 | |
Unit labour costs (ULC) | | -2.3 | | -6.1 | | -2.9 | | -1.0 | |
ULC, 11 OECD countries(1),(2) | | 0.7 | | 0.8 | | 1.1 | | 1.0 | |
Relative ULC(2) | | -2.9 | | -6.9 | | -4.0 | | -2.0 | |
Relative ULC, SEK | | 2.4 | | -5.3 | | -1.0 | | -0.7 | |
Profit share(3) | | 34.4 | | 37.7 | | 38.8 | | 39.8 | |
(1) 11 OECD countries refer to Canada, United states, Japan, Belgium, France, Italy, Netherlands, United kingdom, Germany, Denmark and Norway.
(2) ULC (unit labour cost) is the labour cost to produce one unit of a commodity in national currency. Relative ULC is the relative labour cost to produce one unit of a commodity in Sweden compared to competing countries.
(3) Profit chare refers to gross operating surplus as share of value added at factor prices.
Sources: Statistics Sweden, NIER and Ministry of Finance.
Good competitiveness in Swedish industry
Industry’s relative unit labour cost, measured in national currency, rose sharply in the 1980s. The devaluations during the decade, however, meant that the competitiveness of Swedish industry as measured in terms of the relative unit labour cost in a common currency continued to be satisfactory (see Diagram 5.1).
Swedish industry’s relative unit labour cost in national currency has gradually declined since the early 1990s and was in 2004 lower than compared with the first years of the 1980s. The reason for this is relatively high productivity growth, which counteracts the rising cost of labour. With few exceptions, the unit labour cost
37
has risen more in Sweden’s main competitor countries. In the coming years, the climate for continued Swedish industrial competitiveness is expected to remain favourable since productivity is likely to rise faster than wages.
Diagram 5.1 Industry’s unit labour costs in Sweden compared with 11 OECD countries
Index 1980=100
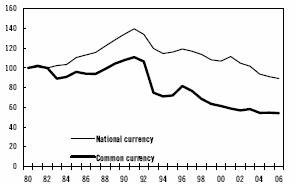
Sources: NIER, Statistics Sweden and Ministry of Finance.
The relative unit labour cost has dropped more in competitor-weighted, common currency terms than in national currency due to the depreciation of the krona in the 1990s. Due to the anticipated appreciation of the krona, however, the fall in relative unit labour cost in a common currency will be moderated this year and next. Despite this, Swedish industry appears to remain competitive from a historical perspective.
High profits for industry
Last year, industrial firms’ profit shares(4) rose relatively sharply despite the fact that Swedish export prices for processed goods fell. Firms’ profit shares rose mainly because of the strong productivity growth which more than offset the rising costs for wages and raw materials.
This year and next, firms’ profit shares will improve further but not at the same favourable rate seen in 2004. Productivity growth will fall, resulting in lower margins in relation to wages and the cost of intermediate goods. The economic situation is still considered to be relatively favourable, which combined with rising world market prices is likely to give Swedish firms an opportunity to raise prices.
5.2 Construction industry
The brunt of total construction output consists of construction volume, which in turn consists of construction investment and repairs. (5) For this reason, the forecast for construction output is based on the assessment of construction volume. To date, construction activity has been mixed, with sharply rising housing investment and a decline in other construction investment. The rise in housing investment helped boost total construction investment growth to 2.9 per cent last year (see Table 5.3). Repairs rose 5.1 per cent last year, which together with the rising construction investment meant total construction volume growth of 3.7 per cent.
The strong growth in housing construction has led to unusual optimism in the construction industry. According to the NIER’s Business Tendency Survey, firms in this industry expect continued strong growth this year. The overall picture painted by construction activity suggests that the number of new housing starts will continue to grow. In terms of the National Accounts, housing investment growth is estimated at 10.7 per cent in 2005 and 4.7 per cent in 2006 (see section 10.3).
Construction investment in industry has been subdued in recent years; last year it dropped sharply. Statistics Sweden’s investment survey suggests that this trend will continue. Construction investment in other parts of the business sector was also subdued. This year, on the other hand, construction investment in certain parts of the goods-producing sector and service sectors is expected to rise, contributing to a slight boost in overall construction investment by the business sector. The rate of increase is estimated at 0.8 per cent in 2005 and 3.8 per cent in 2006.
General government investment in construction dropped last year, which was a consequence of weak development in the local government sector. The local government sector’s financial situation is forecast to improve in the near future, leading to a slight rise in construction investment. Central government construction investment continues to grow as a result of infrastructure investment. Altogether, general
(4) Profit chare refers to gross surplus as a proportion of value added at factor price, i.e. gross operating surplus.
(5) The total value of construction output includes construction volume and the value of some output of services, such as building and computer consultant services.
38
government construction investment is estimated to rise by 3.4 per cent in 2005 and 4.6 per cent in 2006.
The forecast growth for construction investment and repairs will lead to total construction volume growth of 5.5 per cent in 2005 and 4.7 per cent in 2006.
Table 5.3 Construction volume
| | SEK billion | | Percentage change in volume | |
| | 2004(1) | | 2003 | | 2004 | | 2005 | | 2006 | |
Construction investment | | 174 | | -1.2 | | 2.9 | | 5.2 | | 4.4 | |
Business sector | | 63 | | -5.9 | | -5.3 | | 0.8 | | 3.8 | |
Authorities | | 48 | | -2.0 | | -1.4 | | 3.4 | | 4.6 | |
Housing | | 64 | | 5.5 | | 16.1 | | 10.7 | | 4.7 | |
Repairs and maintenance | | 99 | | 3.6 | | 5.1 | | 6.0 | | 5.3 | |
Total | | 273 | | 0.5 | | 3.7 | | 5.5 | | 4.7 | |
(1) Current prices.
Sources: Statistics Sweden and Ministry of Finance.
5.3 Service sectors
Demand rising
Service sector output rose 2.0 per cent last year, which was lower than compared with 2003. Both this year and next, however, production growth in the service sectors is likely to be higher than in 2004. The favourable level of industrial activity and rising investment means that the demand for computer, business, technical and organisational consultants should rise, boosting corporate services. Household demand for services is expected to pick up in the near future as retail sales are boosted by rising household consumption. The hotel and restaurant sectors are forecast to show better growth than earlier due to rising consumption and favourable industrial activity. The NIER’s Business Tendency Survey also indicates that the outlook for the service sectors is relatively promising. The sales outlook is also brighter than before. Computer consultants and other business services are particularly optimistic about the future. Generally, output in the service sectors is forecast to rise by 2.9 per cent in 2005 and 2.4 per cent in 2006.
Last year productivity growth in the service sectors slowed to 1.3 per cent. This year, however, productivity growth should pick up again as a result of rising output whereas average hours worked are not likely to rise by a corresponding degree. Next year, the scope for higher productivity is expected to be smaller. For this reason, employment and average hours worked are expected to pick up and productivity growth slow. Productivity in the service sectors is forecast to rise by 2.4 per cent in 2005 and 1.0 per cent in 2006.
39
6 Labour market
The labour market remained subdued in 2004 but is forecast to pick up in the period 2005-2006. Employment will begin to rise this year, primarily in the local government sector. The rollout of the sabbatical year programme across the country and of education initiatives in the local government sector will contribute to increased employment as measured by the number of people employed, but not in the number of hours worked. Next year the good economic climate will result in stronger employment growth, not least in the private service sector. Open unemployment will fall gradually to 4.4 per cent in 2006. The number of participants in labour market policy programmes will be higher than last year, and is assumed to be 121,000 both this year and next.
Demand for labour fell further in 2004
Employment growth has been weak since the beginning of 2001, and employment continued to fall in 2004. According to Statistics Sweden’s Labour Force Survey, employment was 0.5 per cent or just over 20,000 down on 2003.
Table 6.1 Selected labour market statistics
Percentage change unless otherwise stated
| | 2003 | | 2004 | | 2005 | | 2006 | | 2007 | |
GDP | | 1.5 | | 3.5 | | 3.2 | | 2.7 | | 2.4 | |
Productivity | | 2.8 | | 2.8 | | 2.5 | | 1.9 | | 2.2 | |
Hours worked | | -1.2 | | 0.9 | | 0.6 | | 0.7 | | 0.4 | |
Hours worked, calendar adjusted | | -1.2 | | -0.2 | | 0.6 | | 1.2 | | 0.4 | |
Average hours worked | | -1.0 | | 1.3 | | -0.2 | | -0.4 | | 0.0 | |
Number of employed | | -0.3 | | -0.5 | | 0.8 | | 1.1 | | 0.4 | |
Regular employment rate(1) | | 77.6 | | 77.0 | | 76.8 | | 77.1 | | 77.3 | |
Labour force | | 0.7 | | 0.2 | | 0.2 | | 0.6 | | 0.2 | |
Open unemployment(2) | | 4.9 | | 5.5 | | 5.0 | | 4.4 | | 4.2 | |
Labour market policy programmes(2),(3) | | 2.1 | | 2.4 | | 2.7 | | 2.7 | | 2.4 | |
(1) Number of employed in age group 20-64, excluding those employed in labour market policy programmes, as a percentage of the population in that age group.
(2) Percentage of labour force.
(3) People in labour market policy programmes as a percentage of the labour force. The programmes included in this term are those reported by the National Labour Market Board (AMS) as labour market policy programmes.
Sources: Statistics Sweden, National Labour Market Board and Ministry of Finance.
Indicators for the labour market warrant certain optimism
The indicators of developments in the labour market paint a rather mixed picture but have generally strengthened since autumn 2004. The National Institute of Economic Research (NIER) Business Tendency Survey reveals less negative recruitment plans in most industries, but still only a few industries anticipate an increase in employee numbers. Likewise the number of firms stating that they have a shortage of personnel has risen, although the proportion is still relatively low.
The number of vacancies newly reported to the National Labour Market Board is higher than a year ago. Historically this indicator has been relatively closely correlated with employment growth, subject to a certain time lag. The number of redundancy notices at the beginning of 2005 was below the average for 2003 and 2004, but still relatively high.
Last year temporary employment increased, which may indicate an impending sea change in the labour market. In previous economic recoveries, a broader upswing in employment has often been preceded by growth in the number of temporary jobs (see Diagram 6.1).
Diagram 6.1 Temporary employment and total employment
Annual percentage change, 3-months moving averages
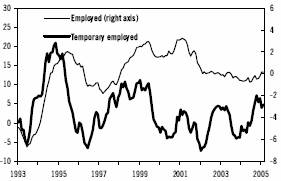
Sources: Statistics Sweden (LFS) and Ministry of Finance.
Employment to rise in 2005 and 2006
Employment is expected to rise by around 32,000 this year. Around half of this increase will be in the local government sector. Employment is also forecast to rise in the construction industry and the private service sector. Next year the labour market is predicted to improve further. Rising domestic demand will contribute
40
to growing output of services and higher demand for labour. Much of the employment growth next year is therefore expected to be in the private service sector. Employment in the economy as a whole is forecast to grow by around 48,000 in 2006.
Sick leave has fallen gradually since autumn 2003. The statistics count both those on sick leave and their temporary replacements as being in employment. Lower sick leave reduces the need for temporary replacements and may therefore have had a negative impact on employment growth. Sick leave is expected to continue to fall in the time ahead, which will slow employment growth somewhat.
Around a third of the increase in employment this year is explained by the 10,000 places on the sabbatical year programme introduced at the beginning of 2005. As with other forms of leave, both those on sabbatical leave and their temporary replacements are counted as being in employment. Those on sabbatical leave are therefore included in employment but not in regular employment. Participants in labour market policy programmes with employment support are classified in the same way. The number of people with employment support is estimated to increase by around 13,000 this year. Altogether, regular employment will grow by just 9,000 this year. However, all of the growth in employment next year will be down to increased regular employment.
The government’s employment target of a regular employment rate of 80 per cent for those aged 20-64 will not be achieved during the forecast period. The regular employment rate will be an estimated 77.1 per cent in 2006. Chapter 12 presents an alternative scenario where this employment target is reached in 2008.
Employment in different sectors
Continued negative employment growth in manufacturing
Despite high capacity utilisation and strong growth in both output and orders, industrial firms continued to downsize in 2004. According to the National Accounts, employment in the manufacturing industry was around 700,000, which corresponds to around 16 per cent of total employment and is over 50,000 down on 2001 (see Table 6.2).
According to the NIER’s Business Tendency Survey, firms’ recruitment plans in the manufacturing industry are still subdued. The survey also found few firms reporting shortages of personnel. Against this background, employment in the manufacturing industry is expected to drop somewhat further this year despite continued high output, and to be largely unchanged in 2006.
Table 6.2 Employment in different sectors
Thousands
| | 2000 | | 2001 | | 2002 | | 2003 | | 2004 | |
Business sector(1) | | 2,868 | | 2,934 | | 2,924 | | 2,902 | | 2,881 | |
Construction | | 222 | | 236 | | 238 | | 239 | | 238 | |
Manufacturing | | 753 | | 761 | | 741 | | 720 | | 706 | |
Services | | 1,745 | | 1,799 | | 1,810 | | 1,810 | | 1,804 | |
General government | | 1,291 | | 1,305 | | 1,321 | | 1,333 | | 1,331 | |
Central govern. | | 237 | | 236 | | 240 | | 245 | | 245 | |
Local govern. | | 1,054 | | 1,069 | | 1,081 | | 1,088 | | 1,086 | |
Total(2) | | 4,264 | | 4,345 | | 4,352 | | 4,343 | | 4,321 | |
(1) Includes also employed in agriculture, forest, electricity and gas.
(2) Totally number of employed also includes employment in non-profit institutions serving households.
Sources: Statistics Sweden (National accounts) and Ministry of Finance.
Growing employment in construction
Employment has been favoured by the strong growth in residential construction, and probably also by the tax allowance for housing repairs introduced in spring 2004. This allowance will only be available until 30 June this year, but a still strong construction market means that employment will continue to grow at a good rate both this year and next. Employment in the construction industry is forecast to grow by 2 per cent this year and just over 1 per cent next year.
Employment in service sector to accelerate in 2006
The private service sector accounts for just over 40 per cent of employment in Sweden. After a strong upswing in the second half of the 1990s, employment in the private service sector has been largely unchanged in recent years. In 2004 private service sector employment fell by just over 6,000 due to the deprivatisation of Huddinge Hospital, among others; county council employment increased by a corresponding amount.
Service companies’ recruitment plans are still subdued according to the NIER’s Business Tendency Survey. However, things are looking
41
up in some sub-sectors, such as computer consulting and other business services.
Employment in business services began to grow last year, which is probably related to the higher industrial output. In 2005 and 2006 service output is also expected to grow at a good rate, which is in turn expected to lead to employment growth. Employment in the private service sector is forecast to grow by 0.6 per cent this year and 1.3 per cent next year.
Markedly higher employment in the public sector
Employment in the local government sector grew at a relatively good rate during the 2001-2003 period. The growth was primarily at the municipalities, while employment at the county councils was largely unchanged. However, since the second half of 2003 employment at the municipalities has fallen. Employment at the county councils increased in 2004 as a result of the deprivatisation of Huddinge Hospital.
The local government sector’s relatively good financial position, coupled with a major recruitment need, is expected to lead to growth in recruitment already this year. At the same time it is assumed that many of the places on the sabbatical year scheme will be allocated to the local government sector. A special education initiative with 6,000 places for employees of municipalities and county councils will also contribute to increased employment. An estimated 9,000 temporary replacements will be required to take the place of those on sabbatical leave and education programmes.
Altogether, employment in the local government sector is forecast to grow by 1.5 per cent this year – equivalent to around 16,000 people – and just over 1 per cent next year.
Thus the local government sector will account for half of the total growth of around 32,000 in employment in the economy as a whole. Should the local government sector postpone the recruitment of new staff despite the favourable climate, for example to the end of 2005, there is a risk that this would result in a less favourable labour market than forecast here.
Employment in the central government sector in 2004 was unchanged from that of 2003, and is expected to remain largely unchanged during the forecast period.
Hours worked set to rise
The number of hours worked in the economy as a whole decreased in 2002 and 2003 but increased by 0.9 per cent in 2004. The increase was due to an unusually high number of working days last year. Allowing for this effect, the number of hours worked fell slightly (see Table 6.1). The decrease was particularly evident during the second half of 2004.
Productivity growth remained high in 2004. Productivity in the economy as a whole is estimated to have grown by just over 3 per cent. Diagram 6.2 shows the number of hours worked and GDP since 1981. Since the mid-1990s Sweden has seen high productivity growth, which is reflected in the gap between the two curves in the diagram. This means that a large proportion of GDP growth has been achieved without requiring any increase in employment as measured by the number of hours worked.
Diagram 6.2 Hours worked and GDP
Annual percentage change, quarterly data
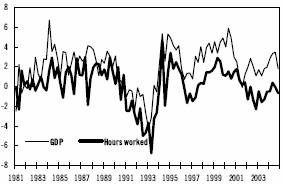
Sources: National Institute of Economic Research and Statistics Sweden.
The explanatory box at the end of this chapter looks at the links between GDP growth and various labour market indicators in different economic cycles. It shows that it is difficult to demonstrate unambiguously that the time lag between output growth and employment growth during the current economic recovery is longer than has been normal in the past, especially given that the downturn in the labour market this time around was less severe than in previous economic downturns.
42
Average hours worked expected to fall in 2005 and 2006
The average number of hours worked each year per employee fell gradually during the period 2000–2003, but the trend was reversed in 2004 when average hours worked increased. Largely the significantly higher number of working weekdays can explain this increase, but reduced sick leave also played a part. Continued growth in the proportion of part-time workers pulled in the opposite direction. According to Statistics Sweden’s Labour Force Survey, the use of overtime was still very limited.
The number of hours worked is expected to rise somewhat more slowly than employment in 2005 and 2006, which means that average hours worked will fall. The number of hours worked is expected to grow by 0.6 per cent this year and 0.7 per cent next year.
Average hours worked this year and next will be lower because the upswing in employment is due partly to there being more people who are on a year’s sabbatical leave but still counted as being in employment. The number of people actually in work will not increase as a result of the sabbatical year scheme, nor will the number of hours worked. The number of hours worked per person in work is expected to continue to increase slightly as a result of the good economic climate.
In 2006 growth in hours worked will be checked by a lower number of working weekdays than in 2005. Once this calendar effect is taken into account, hours worked will grow by 1.2 per cent, which means that the underlying average number of hours worked will rise slightly.
Weak growth in labour supply in 2005
Last year the supply of labour increased by just 0.2 per cent despite the working-age population growing by 0.6 per cent. One partial explanation for this limited growth in the labour force is that the population increased in age groups with low participation rates. Even ignoring this demographic effect, the supply of labour was still relatively low. This can be explained partly by a marked increase in the number of participants in labour market policy education programmes, and partly by continued growth in the number of sick people outside the labour force.
Although the population is expected to continue to increase at a good rate during the forecast period, the supply of labour will continue to grow relatively weakly (see Diagram 6.3). In the first instance this is because the population increase during the forecast period will again be mainly in age groups with low participation rates (the young and the old).
Diagram 6.3 Supply of labour and employment
Thousands
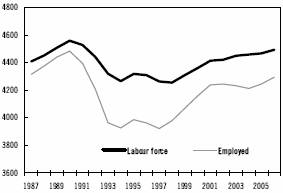
Sources: Statistics Sweden and Ministry of Finance.
In 2004 just over three-quarters of participants in labour market policy programmes were in education and so not part of the labour force. The total number of participants in these programmes is assumed to increase during the forecast period. However, the increase is expected to cover only those counted as being in employment. Thus people will move from open unemployment to being registered as employed, and so the supply of labour will not be affected to any great extent by changes in the size of the programmes.
Unemployment to fall in 2005 and 2006
Last year open unemployment averaged around 246,000 people or 5.5 per cent of the labour force. Open unemployment fell during the course of the year as a result of more people taking part in labour market policy programmes. Total unemployment including participants in these programmes continued to rise during the year and averaged 7.9 per cent in 2004.
As a result of good employment growth and relatively weak growth in the supply of labour, unemployment is set to fall (see Diagram 6.4). Measured as an annual average, open
43
unemployment is forecast to be 5.0 per cent this year and 4.4 per cent next year.
The number of participants in labour market policy programmes is assumed to be 121,000 both this year and next. This means 10,000 more people with employment support in 2005 and 2006 than assumed in the Budget Bill for 2005. The increased size of these programmes will contribute to falling open unemployment during the forecast period.
Diagram 6.4 Unemployment
Percentage of labour force
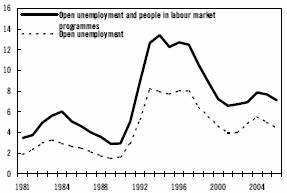
Sources: Statistics Sweden and Ministry of Finance.
Lower unemployment in 2007
There are expected to be available resources in the economy at the end of 2006 (see also section 1.5). GDP growth in 2007 may therefore be somewhat above the long-term sustainable growth rate even if more moderate than in the period 2004-2006.
Continued growth in employment is projected despite weak growth in the supply of labour. Supply will be held back by unfavourable demographic developments. The number of participants in cyclical labour market policy programmes is assumed to fall to 107,000. Open unemployment will therefore continue to fall. In 2007 open unemployment will be 4.2 per cent, and the regular employment rate for those aged 20-64 will be 77.3 per cent.
44
The links between economic growth and the labour market
A typical Swedish economic recovery begins with an upswing in exports. Swedish export firms generally generate high value added per employee. This normally means that higher export growth also leads to markedly increased GDP. Meanwhile the number of hours worked and the number of people employed in the economy grow only marginally to begin with, as only a small proportion of those in work are employed by the export industry and its suppliers. However, as domestic demand gradually takes over as the driver behind the economy, hours worked and employment begin to pick up.
During the initial phase, firms meet the increased demand by producing more with the same number of employees working the same number of hours. In the next phase, output grows as a result of employees working more hours, for example through increased overtime. Then firms begin to recruit new employees.(6)
Comparing developments in the labour market during the present economic recovery with those during previous recoveries is difficult. Comparisons of economic developments over long periods of time are complicated by variations in a number of factors over time, such as the institutional framework. Nor is it entirely clear how business cycles should be dated.
Despite these limitations, an attempt is made here to analyse developments in the labour market before and after various cyclical troughs. The comparison is based on the National Institute of Economic Research (NIER) definition of the GDP gap, i.e. the difference between actual and potential output. A cyclical trough is defined as the quarter during a given business cycle when the GDP gap is at its most negative. Since 1980 four such troughs can be identified: in 1983, 1993, 1996 and 2003. The first two differ so greatly from the present business cycle that they cannot be used for comparison. The latter two cycles are more reminiscent of each other and can therefore be compared more usefully.
During these two latest business cycles, the number of hours worked has moved in a similar way (see Diagram below). The most tangible difference is the decline in the number of hours worked during the second half of 2004, around five to six quarters after the cyclical trough. At the equivalent point in the previous recovery, the number of hours worked increased slightly. One reason for this discrepancy may be the lower GDP growth during the fourth quarter of 2004: in the equivalent quarter during the recovery in 1997, GDP grew sharply. Another explanation for the discrepancy may be that the GDP gap is smaller now than during the initial phase of previous recoveries. This means that in the present recovery there are fewer available resources than during the recoveries after 1993 and 1996.(7) This also means less potential for recovery. In 2005 and 2006 the number of hours worked is forecast to rise, but not at the same rate as during the last recovery.
Developments in the number of hours worked during different business cycles
Index=100 at trough in the business cycle
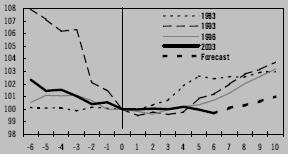
Note: The graph shows the seasonally adjusted quarterly development in relation to the trough in the following business cycles: 1983:q1, 1993:q1, 1996:q4 and 2003:q3. The quarter with the largest output gap in each business cycle is regarded as the trough.
Sources: Statistics Sweden, NIER and Ministry of Finance.
Employment growth has also slowed slightly during the present recovery compared with the previous recovery (see Diagram below). The period immediately preceding the cyclical trough was also different, as employment increased slightly during the latest economic downturn. One explanation for this is probably the changes in the number of people on sick leave. Since both they and their temporary replacements are counted as being in employment, there are
(6) According to the National Institute of Economic Research (see The Swedish Economy, March 2005), the time lag between growth in GDP and growth in hours worked has historically been around one quarter. The time lag between hours worked and employment has also been around one quarter.
(7) For example, unemployment including participants in labour market policy programmes was 12.7 per cent in both 1993 and 1996, but 6.9 per cent in 2003. These different levels of unemployment illustrate the differences in available resources.
45
grounds to assume that the high level of sick leave during the latest downturn helped to prop up employment. Similarly, there are grounds to assume that employment growth was slowed by the reduction in the number of people on sick leave in 2004.
The more subdued growth in employment can probably also be explained by the relatively small GDP gap. Employment is forecast to grow in the years ahead, but not at the same rate as during the previous recovery.
Altogether, the time lag seems to be slightly longer now than in previous recoveries. However, it is important to take account of developments before cyclical troughs. The labour market fared better during the latest economic downturn than in previous downturns. Experience suggests that the labour market will recover if GDP continues to grow at a high rate for a sufficient period.
Development in the number of employed during different business cycles
Index=100 at trough in the business cycle
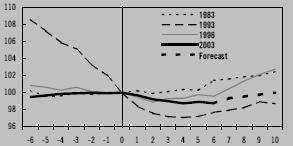
Note: The graph shows the seasonally adjusted quarterly development in relation to the trough in the following business cycles: 1983:q1, 1993:q1, 1996:q4 and 2003:q3. The quarter with the largest output gap in each business cycle is regarded as the trough.
Sources: Statistics Sweden, NIER and Ministry of Finance.
46
7 Wages
In 2004, the rate of wage increase slowed slightly. A moderate increase in the demand for labour combined with low inflation and more modest wage increases than during the previous agreement period suggests a modest rate of wage increase in coming years. Wages are likely to rise by 3.5 per cent this year. In 2006 and 2007 wages are assumed to increase by 3.5 per cent.
Rate of wage increase slowed in 2004
The rate of wage increase slowed somewhat in 2004. According to preliminary statistics from the National Mediation Office, the average rate of wage increase was 3.2 per cent in 2004. This outcome will be revised this year as a result of retroactive wage payments. The final outcome is estimated at 3.3 per cent.
For the fourth year in a row, wages in the general government sector rose more quickly than in the private sector. Wages rose the fastest in county councils, where the increase once again exceeded 4 per cent. This can be compared with wage growth in industry, which has remained relatively stable at just over 3 per cent in the past two years. In the construction industry, the rate of wage increase slowed to 2.6 per cent. In the private service sectors, the rate of wage increase dropped for the third consecutive year, to below 3 per cent.
Lower negotiated wage increases between 2004 and 2006
The wage negotiations of 2004 affected more than 1.9 million employees, encompassing the entire central government sector and much of the private sector.
More or less all of the agreements reached in 2004 correspond to the 7.3 per cent increase over a three-year period as agreed in industry negotiations. All agreements at central government level are for three years with the possibility of termination during the third year.(8) Most agreements in the private sector consist of three-year agreements.(9) Nearly 50 per cent of private sector employees are covered by agreements that can be terminated by notice during the final year of the agreement.
Business sector agreements for the next three-year period are approximately 0.5 percentage points lower per year than during the 2001–2003 period. The wage increases are lower, primarily because the costs for the cuts in working hours covered by the agreements are now lower.
In central government, agreements for the next three-year period cover wage increases that are approximately 0.2 percentage points lower per year than during the 2001–2003 period. These agreements do not entail any cuts in working hours.
The wage negotiations of 2005 will not be as comprehensive as in 2004. All in all, 1.3 million employees are affected. Applicable areas include the local government and county council sectors, parts of the construction industry as well as the banking and insurance sectors.
In the local government sector, new agreements or agreements in principle were entered into affecting some 600,000 employees. The negotiated wage agreements are relatively similar. In most cases, the agreements give 2 per cent per year during a three-year period, but in some cases no specific figures for 2007 have been stipulated.(10) The Swedish Municipal Workers’ Union agreements expired on 31 March.
The Swedish Building Workers’ Union agreements expire on 31 October and banking and insurance sector agreements expire at the end of the year.
Modest rate of wage increase in the near future
Several factors suggest a relatively modest rate of wage increase in the near future: the negotiated wage increases are lower than earlier, the demand for labour is assessed to increase moderately, and inflation and inflation expectations are both low.
For the economy as a whole, wages are forecast to rise by 3.5 per cent this year. In 2006 and 2007 wages are assumed to increase by 3.5 per cent.
(8) Agreements in the central government sector expire on 30 September 2007.
(9) Most private sector agreements expire on 31 March 2007.
(10) Agreements in the local government sector expire on 30 June 2007.
47
Table 7.1 Wages
Annual percentage change
| | 2002 | | 2003 | | 2004 | | 2005-2007 | |
Industry | | 4.2 | | 3.2 | | 3.1 | | — | |
Construction | | 3.7 | | 3.8 | | 2.6 | | — | |
Private service sector | | 3.8 | | 3.2 | | 2.9 | | — | |
Central government | | 4.3 | | 4.2 | | 3.1 | | — | |
Local government | | 4.5 | | 3.8 | | 4.1 | | — | |
Total | | 4.1 | | 3.5 | | 3.3 | | 3.5 | |
Note: The figures for 2004 are estimates.
Sources: National Mediation Office and Ministry of Finance.
48
8 Inflation
The rate of inflation has been lower than expected during the recent period and is forecast to continue to be lower than 1 per cent during 2005. It is expected to increase gradually during 2006 with a slackening of import prices’ moderating effect on inflation and as domestic price pressure increases in line with rising resource utilisation and demand in the Swedish economy. Underlying inflation (UND1X) is forecast to be 1.5 per cent in December 2006. Rising interest rates will cause CPI inflation to rise faster than UND1X during next year and amount to 2 per cent in December 2006.
Inflation stabilised at a low level in 2004
During the greater part of 2001, the rate of inflation, measured by the Consumer Price Index (CPI), exceeded the Riksbank’s target of 2 per cent. Diagram 8.1 shows the rate of inflation, measured by the CPI, by the Riksbank’s measure of underlying inflation (UND1X) and by the measure of principally domestically generated underlying inflation (UNDINHX, in this case excluding electricity).(11) As can be seen in the diagram, inflation has been characterised by sharp fluctuations and a downward trend since the turn of the year 2001/2002.
Diagram 8.1 Inflation (CPI), underlying inflation (UND1X) and domestic underlying inflation (UNDINHX) excl. energy
Inflation, per cent
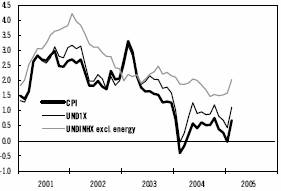
Sources: Statistics Sweden and Ministry of Finance.
These large variations in the rate of inflation have primarily been due to fluctuating energy prices (see Diagram 8.2). Discounting energy price effects, underlying inflation has generally fallen substantially during the whole period from the beginning of 2002.
Diagram 8.2 Energy consumer price indexes and total contribution from energy prices to inflation
Contribution to inflation, percentage points Price index (1980=100)
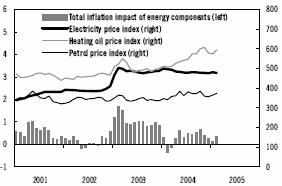
Sources: Statistics Sweden and Ministry of Finance.
At the beginning of 2004 the rate of inflation was negative. This was partly because the energy price increases in early 2003 no longer affected the inflation rate. Following this, inflation rose somewhat but nevertheless remained at a low rate during the whole of last year.
The sudden rise in inflation from the very low levels at the beginning of 2004 was largely due to price increases for petrol and heating oil. Overall energy prices contributed to the increase in inflation during most of last year (see Diagram 8.2).
Other groups of goods and services also contributed to the rise in inflation during the greater part of 2004. Diagram 8.3 shows the contributions made by various groups of goods and services (excluding energy, fruit and vegetables) to overall CPI inflation.
The contribution made by imported goods (excluding energy) continued to be substantially negative during the whole of 2004 although less so as the year progressed. The contribution made by the prices of domestic services has, as with imports, fallen since the beginning of 2002, but stabilised in 2004. Administratively priced
(11) Diagram 8.1 shows inflation for the whole period in accordance with the definition used by Statistics Sweden from January 2005. The changes in the calculation method for the CPI and the definition of inflation are described in an explanatory box in the Budget Bill for 2005 (prop. 2004/05:1, Appendix 2, Chapter 8).
49
services(12) showed an increase in their contribution to the rate of inflation.
Diagram 8.3 Contributions to CPI inflation from certain goods and services, excluding electricity, oil, petrol, fruit and vegetables
Percentage points
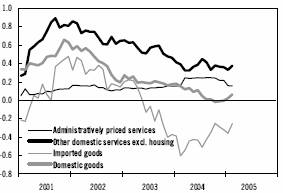
Sources: Statistics Sweden and Ministry of Finance.
On the other hand there was a continuing fall in the contribution from prices of domestically-produced goods during the greater part of the year. In addition falling mortgage rates pulled down inflation as measured by the CPI for each month of 2004. The effect of mortgage rates fluctuated between –0.4 and –0.8 percentage points.
CPI inflation did not exceed 1 per cent in any month of 2004. The Riksbank’s measure of underlying inflation (UND1X) exceeded 1 per cent for only three months of the year.
Unexpectedly low inflation during the winter of 2004–2005
The rate of inflation was unexpectedly low during the end of 2004 and the beginning of 2005. The rate of CPI inflation during the period November – February has been under the Budget Bill’s forecast by between 0.5 and 0.8 percentage points each month.
It is primarily inflation on imported goods (excluding energy) that has fallen more than forecast in the prices to consumers during recent months. Lower import prices and domestic factors such as lower wholesale and retail margins are influential in this trend. After a rate of inflation of 0.0 per cent during January, inflation rose again in February, partly due to higher food prices. Approximately half of the effect of increases in food prices relates to the prices of some vegetables going up temporarily due to the cold weather in southern Europe.
Import prices still low
According to producer and import price statistics, import prices for the processed goods group rose during most of 2004, falling back somewhat towards the end of the year. A large part of the increase was due to rising prices for intermediate goods. In terms of product groups more in the consumer area, import prices showed a sharper downward trend during most of the year. This applied to food as well as to clothing and other durable consumer goods such as domestic electronic appliances.
Prices of imported processed goods are expected to go up in 2005 and 2006. This is partly due to last year’s increased commodity prices impacting on processed goods. The upturn in import prices will however be moderated by the expected strengthening of the krona (see further in section 4.2). The impact on consumers from import price increases is difficult to assess, both in terms of magnitude and time lag, and recent forecast deviations point to uncertainty being greater than normal for the time being. Heightened competition may have made it difficult for distributors close to consumers to raise prices.
As mentioned earlier, recent overestimation of the consumer price trend in terms of imported goods is partly due to falling import prices of groups of goods of considerable importance in terms of household consumption and partly due to pressure on wholesale and retail margins. These factors are also considered to apply to the forecast period, pointing to a lower consumer price trend for imported goods than had previously been expected. The abolition of textile quotas in international trade at the turn of the year 2004/2005 is an example of the former type of effects.
Consumer prices for shoes and clothing have steadily fallen since mid-2004 (apart from seasonal variations). Prices fell at an annual rate of 3–4 per cent during the greater part of last year. At the end of the year the fall in prices slackened to some extent but prices are nevertheless about one per cent lower than a
(12) This group includes domestic water tariffs, public transport and medical care.
50
year ago. The change in clothing quotas and increasing competition are expected to lead to further price cutting.
Diagram 8.4 shows consumer prices, import prices (6 months earlier) and the trade’s expectations of the consumer price (one quarter earlier). The indicators support the judgement that clothing prices will continue to fall during 2005, probably at an increasing rate once more.
Diagram 8.4 Clothing and footwear. Consumer and import prices (year-on-year change) and retailers’ consumer price expectations
Prices, annual percentage change | | Net balance |
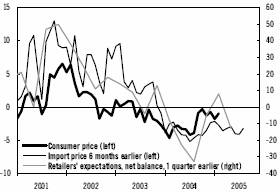
Sources: Statistics Sweden and Ministry of Finance.
The food price reductions seen last year, and which are set to continue in 2005, may be an example of the other type of effects, namely that increasing domestic competition impacts both on domestically-produced and imported goods.
Fluctuations in the price of oil affect consumer prices both directly and indirectly. The direct effect is in the form of changed petrol and home heating oil prices. Indirect effects arise through changed producer costs for heating, transportation and production which are then passed on to the consumer. The extent to which costs are passed on to consumers, and the time lag involved, can vary.
The prices for petrol and home heating oil pushed up inflation appreciably at the beginning of 2005. Assumptions for the trend in oil prices (see section 2.5), however, mean that the direct effects of oil prices towards the end of the forecast period will be limited. Home heating oil and petrol prices are estimated to reduce inflation (CPI) by between 0.1 and 0.2 percentage points in December 2006. A delayed indirect impact on consumer prices arising from high oil prices in 2004 is foreseen during the forecast period. The effect will however be absorbed to some extent in firms’ profit margins. The trend in oil prices represents an element of uncertainty in forecasting inflation.
Domestic inflationary pressure slowly rising
The rate of domestically generated inflation was low during 2004. The Riksbank’s measure of principally domestically generated inflation, UNDINHX (see Diagram 8.1 where it is shown excluding electricity prices), continued to be low during 2004 and the beginning of 2005.(13)
The present situation is significantly different from the position some years ago. Inflation in domestically-produced goods and services increased sharply during 2000 and 2001. That was partly a result of resource utilisation having become strained in the Swedish economy at that time. Employment had risen quickly during a number of years, resulting in wages and labour costs rising at a relatively high rate. This made a clear impact in consumer-related service sectors where staff shortages had become very marked (see Diagram 8.5). The contributions to inflation made by domestic goods and services grew quickly (see Diagram 8.3).
Diagram 8.5 Domestic underlying inflation (UNDINHX) and labour shortage reported in the wholesale, retail and motor vehicle trades
Inflation, per cent | | Net balance |
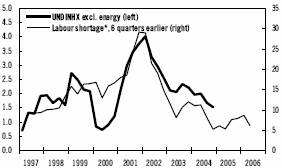
* Net balances for NIER Business Tendency Survey questions on labour shortage in the wholesale, retail and motor vehicle trades. Average, weighted by no. of employed.
Sources: Statistics Sweden, Nat. Inst. of Economic Research and Ministry of Finance.
Resource utilisation in the Swedish economy is currently considerably lower (see section 1.5). The significantly slower rate of wage increases and higher productivity growth in recent years have contributed to the presently low domestic inflationary pressure. Ongoing structural
(13) UNDINHX was also pushed up, due to its construction, by the prices of imported vegetables in February this year.
51
changes in the retail trade (see discussion on import prices above) have also probably been of significance.
The general expectations for future inflation have decreased during the last two years but they have stayed within the Riksbank’s tolerance interval of ±1 percentage point from the inflation target. According to a survey by the National Institute of Economic Research (NIER) on households’ expectations of inflation, the inflation expected has however fallen on a one year term to 0.5 per cent in February this year, having been between 1 per cent and 2 per cent during the last quarter of 2004. See Diagram 8.6. Individual monthly results from a random sampling survey must of course be treated with care but the February figure points to the very low inflation recently having had a larger effect on expectations than the negative inflation at the beginning of 2004 had.
Diagram 8.6 Inflation expectations, 12 month horizon
Expected inflation, per cent
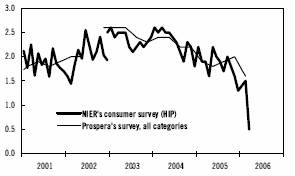
Note: Expectations are shown at the expectation horizon.
Sources: National Institute of Economic Research and Prospera.
Prospera’s measurements within the labour and money markets (undertaken on behalf of the Riksbank) indicate that the expectation for inflation in one year’s time is around 1.5 per cent. On a two-year basis, the expectation is 1.9 per cent according to the Prospera survey.
As discussed in Chapter 6, employment is expected to rise during 2005 but there will nevertheless be a significant level of available resources in the labour market. Employment will rise further during 2006. The forecast for wage increases is 3.5 per cent in 2005 with a similar level assumed for 2006 (see Chapter 7).
The good productivity growth in the business sector during 2004 has in the main been concentrated in industry. The productivity growth in the service sector is expected to be higher this year with a slowing next year when employment levels in the service sector will rise significantly faster. This partly relates to a more domestically-driven demand next year leading to production in the service sector focusing on more consumer-oriented and labour intensive services.
Overall domestic price pressure is considered to remain low this year, rising gradually next year in line with higher domestic demand and rising resource utilisation in the labour market. Structural change-related price reductions in certain groups of goods, for example food and clothing, are expected to also contribute to holding inflation in check, primarily in 2005.
Rising mortgage rates to boost CPI inflation in 2006
Housing costs are an important component of household consumption and changes in rent levels and interest expenses for owner-occupied housing therefore have a major impact on inflation.
Rent levels, which have been hit by increases in heating costs, rose by 3 per cent in 2004. Rent level increases in the same order are expected in the forecast period.
The lower mortgage interest costs for owner-occupied housing since April 2003 helped keep down CPI inflation by about 0.5 percentage points during the second half of 2004 and early 2005. The forecast for interest rates discussed in section 3.2 implies that the average mortgage interest rate will begin to rise in 2006 with the effect of pushing up inflation (CPI) by the end of the year by about 0.5 percentage points.
Inflation gradually approaching the target
To summarise, the underlying inflationary pressure will continue to be low in 2005 and rise gradually in 2006. In December 2006, when it is considered that there will still be available resources in the labour market, it is estimated that the underlying inflation (UND1X) will be 1.5 per cent and CPI inflation 2.0 per cent (see Table 8.1).
52
Table 8.1 Consumer prices
Percentage change unless otherwise stated
| | 2003 | | 2004 | | 2005 | | 2006 | | 2007 | |
CPI, year-on-year | | 1.9 | | 0.4 | | 0.5 | | 1.5 | | 2.0 | |
CPI, Dec–Dec | | 1.3 | | 0.3 | | 0.6 | | 2.0 | | 2.0 | |
UND1X, year-on-year | | 2.2 | | 0.8 | | 0.7 | | 1.3 | | — | |
UND1X, Dec–Dec | | 1.6 | | 0.7 | | 0.7 | | 1.5 | | — | |
HICP, year-on-year | | 2.3 | | 1.0 | | 0.9 | | 1.5 | | — | |
HICP, Dec–Dec | | 1.8 | | 0.9 | | 0.9 | | 1.6 | | — | |
NPI, year-on-year | | 1.5 | | 0.1 | | 0.4 | | 1.6 | | — | |
NPI, Dec–Dec | | 0.8 | | 0.1 | | 0.4 | | 2.2 | | — | |
Price base amount, SEK, thousand | | 38.6 | | 39.3 | | 39.4 | | 39.7 | | 40.3 | |
HICP, euro area, year-on-year | | 2.1 | | 2.1 | | 1.9 | | 1.8 | | 1.8 | |
Sources: Statistics Sweden and Ministry of Finance.
CPI inflation will grow faster than the underlying inflation measured by UND1X due to rising mortgage rates in 2006 (see Diagram 8.7). It is assumed that monetary policy will be adjusted so that the Riksbank’s inflation target is met during 2007.
Diagram 8.7 Consumer prices
Annual percentage change
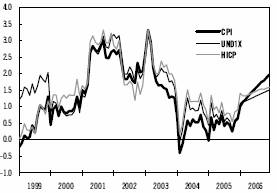
Sources: Statistics Sweden and Ministry of Finance.
53
9 Household sector finances and consumption expenditure
Real income increased by 1.5 per cent last year and is expected to increase by 3.3 per cent this year. The strong growth this year is principally due to the improvement in the labour market and implemented tax cuts. Next year, the rate of increase is expected to decline to 1.8 per cent.
Household consumption expenditure is also expected to increase somewhat more strongly this year than last year. In addition to favourable income growth, consumption growth will be supported in the near future by continued low interest rates and the stable wealth position of households.
Household saving is estimated to increase to 5.6 per cent of disposable income in 2005, compared with 4.5 per cent the previous year.
9.1 Household income
Subdued upturn in 2003 and 2004
During the five-year period 1998–2002, real household income rose by an average of 4.2 per cent per year (see Diagram 9.1). The number of hours worked rose and wages made a substantial contribution to the increase in disposable income. At the same time, reforms and tax cuts were implemented, which made a further contribution to income growth. The last time that households enjoyed a similar increase over a five-year period was in the 1960s.
In 2003, real disposable income increased by only 0.5 per cent. A weak labour market and an increase in the local government tax levy contributed to this development.
In 2004, real disposable income increased by 1.5 per cent. Real wage income rose by 1.5 per cent, resulting in a contribution to real income of 1.2 percentage points (see Table 9.2).
The contribution from general government transfer payments was relatively large in 2004, which partly reflects the weak labour market. Household taxes reduced real income by 1.1 percentage point.
Diagram 9.1 Household real disposable income
Annual percentage change

Sources: Statistics Sweden and Ministry of Finance.
Increased real income during the forecast period
In 2005 and 2006, real household income is expected to increase by 3.3 per cent and 1.8 per cent respectively. This may be compared with the average for the period 1990–2004 of 1.8 per cent per year.
Table 9.1 Real household disposable income
| | SEK billion | | Real percentage change (1) | |
| | 2004 | | 2004 | | 2005 | | 2006 | | 2007 | |
Wages | | 1,042 | | 1.5 | | 3.1 | | 3.1 | | 1.9 | |
General government transfer payments | | 481 | | 2.0 | | 1.0 | | 1.3 | | 1.1 | |
Other income | | 266 | | 3.3 | | 4.2 | | -0.1 | | -0.6 | |
Taxes and charges | | 506 | | 2.8 | | 1.1 | | 3.0 | | 2.1 | |
Real disposable income | | | | 1.5 | | 3.3 | | 1.8 | | 1.0 | |
Price index | | | | 1.2 | | 0.8 | | 1.6 | | 2.0 | |
Nominal disposable income | | 1,282 | | 2.7 | | 4.2 | | 3.4 | | 3.0 | |
(1) Household real income is calculated by deflating the nominal income with an implicit price index for household consumption expenditure (IPI).
Sources: Statistics Sweden and Ministry of Finance.
In 2005, the low price trend is expected to help strengthen real income. The number of hours worked is forecast to increase by 0.6 per cent, while hourly wages are assumed to rise by 3.5 per cent. In real terms, wage income is expected to increase by 3.1 per cent, making an estimated contribution to growth in disposable income of 2.5 percentage points (see Table 9.2).
54
Table 9.2 Contribution to growth in real disposable income
Percentage points
| | 2004 | | 2005 | | 2006 | | 2007 | |
Wages | | 1.2 | | 2.5 | | 2.5 | | 1.6 | |
Other factor income | | 0.2 | | 0.6 | | 0.5 | | 0.3 | |
Interest and dividends, net | | 0.4 | | 0.4 | | -0.4 | | -0.3 | |
General government transfers | | 0.8 | | 0.4 | | 0.5 | | 0.4 | |
Private transfers | | 0.1 | | -0.1 | | -0.1 | | -0.1 | |
Taxes and charges | | -1.1 | | -0.4 | | -1.2 | | -0.8 | |
Real disposable income | | 1.5 | | 3.3 | | 1.8 | | 1.0 | |
Sources: Statistics Sweden and Ministry of Finance.
Interest and dividends are expected to continue to make a positive net contribution to household income growth this year, despite increased household debt. Rising interest rates and continued high household debt are expected to contribute to interest and dividends making a negative net contribution to income growth in 2006 and 2007.
General government transfer payments are expected to rise in real terms by approximately 1 per cent per year during the period 2005–2007, making a contribution of approximately 0.5 percentage points to real income growth. A more detailed account of household income from transfer payments can be found below.
In 2005, tax changes have been implemented, which result in reduced income taxes of just over SEK 10 billion. The tax changes mainly consist of two parts: the tax exchange scheme and the continued compensation for individual social security contributions. In addition, there is a further nearly SEK 3 billion from the abolition of inheritance and gift tax for private individuals.
The tax exchange scheme has continued, with an increase in taxes on electricity, petrol, diesel, etc. and an increase in the basic tax allowance for low-income earners. A total of nearly SEK 4 billion is exchanged, and the impact on real household income is neutral. The continued compensation for individual social security contributions is equivalent to a tax cut of nearly SEK 7 billion. Moreover, the wealth tax levy is reduced, as the allowance for couples is raised from SEK 2 million to SEK 3 million. These tax cuts are, however, offset to some extent by a limited upward adjustment of the tax bands in the income tax scale.(14)
The main reasons that real income growth is expected to slow to 1.8 per cent in 2006 (compared with 3.3 per cent in 2005) are the reversal in the contribution from net interest to income growth of 0.8 percentage points and the assumption that tax regulations will be unchanged.
Income growth is expected to slow further in 2007, which is mainly due to the fact that the contribution from wages is expected to be lower as a result of more subdued employment growth.
Stable development of total transfer payments
General government transfer payments to households are expected to increase in real terms by approximately 1 per cent per year during the forecast period. The Income Index is only expected to increase slightly in 2005, which means that pension income will decline somewhat in real terms this year. However, household real pension income is expected to rise in 2006 and 2007, as the Income Index is estimated to increase by 2.9 per cent and 3.3 per cent respectively.
Despite falling sick leave, household income from sickness-related transfer payments is expected to rise overall during the period 2005–2007. The increase in 2005 is mainly due to the expected increase in the number of individuals receiving sickness and activity(15) benefits. The increase in qualifying income from 77.6 per cent to 80.0 per cent of wages below the ceiling is also a contributory factor. This year, central government will take over the brunt of the cost for the third week of sick leave. However, the abolition of the third week of sick pay will not have an impact on household disposable income, since income from wages is replaced by income from sickness benefit.
(14) For the income years 2004 and 2005, the upward adjustment of the tax bands in central government income tax was limited. Normally, these are adjusted by the annual percentage change in the CPI in June the year before the income year plus two percentage points. For 2004 and 2005, the tax bands are adjusted by the change in the CPI plus one percentage point.
(15) Previously called disability pension.
55
Assistance benefit for people with disabilities is another transfer payment which has increased sharply over the past few years and is expected to continue increasing by just over 10 per cent per year during the forecast period. In 2004, assistance benefits amounted to nearly SEK 13 billion and are forecast to rise to just over SEK 18 billion in 2007.
Table 9.3 Real transfer income
| | SEK Billion | | Real percentage change(1) | |
| | 2004 | | 2004 | | 2005 | | 2006 | | 2007 | |
Old age | | 230 | | 2.1 | | -0.3 | | 1.3 | | 1.8 | |
Illness | | 114 | | -0.1 | | 6.8 | | 1.6 | | 2.6 | |
Labour market | | 44 | | 10.4 | | -4.2 | | -8.7 | | -6.5 | |
Families and children | | 48 | | -0.1 | | 1.9 | | 9.9 | | 1.5 | |
Education | | 12 | | -0.2 | | -5.2 | | 5.3 | | 1.4 | |
Other | | 34 | | 2.1 | | -1.7 | | -1.8 | | -1.5 | |
Total | | 481 | | 2.0 | | 1.0 | | 1.2 | | 1.1 | |
(1) Real income from transfers are calculated by deflating nominal income by the price index for household consumption expenditure.
Sources: Statistics Sweden and Ministry of Finance.
Unemployment is expected to decline during the forecast period. At the same time, the number of participants in labour market policy programmes is expected to rise in 2005 and 2006, and fall in 2007. The overall effect is a decline in household income from labour market-related transfer payments during the period.
Several reforms will be implemented in 2006 and which will have an impact on household income from family and child-related transfer payments. Child benefit will be raised by SEK 100 per child per month as from 1 January 2006. At the same time, supplementary child benefit of SEK 100 will be introduced for the second child, and supplementary child benefit for the third child will be raised by the same amount. As from 1 July 2006, the ceiling for parental insurance will be raised from 7.5 to 10 times the base amount. Moreover, the minimum parental benefit will be raised from SEK 60 to SEK 180 per day. Since these reforms will be implemented in mid-2006, they will also have a positive effect on household income growth in 2007, measured as an annual average. In addition, certain changes in maintenance support and housing benefit will have a positive impact on household income.
9.2 Household consumption
Household consumption expenditure rose by 1.8 per cent last year. Growth was strong in the first half of the year. During the second half of the year, consumption rose at a lower rate while household confidence fell according to the National Institute of Economic Research’s (NIER) weighted Consumer Confidence Indicator. The slowdown is expected to be of a temporary nature, and consumer confidence, which has already recovered, is expected to strengthen as the labour market situation improves. Household real disposable income rose by 1.5 per cent in 2004, and household saving as a percentage of disposable income therefore fell marginally to 4.5 per cent. This year and next year, household income is expected to increase by approximately 3 per cent and 2 per cent respectively, and consumption expenditure is also expected to rise more rapidly in the near future. Continued low interest rates and a favourable wealth position contribute to estimated consumption growth of 2.2 per cent this year and 2.7 per cent next year. In the medium-term estimate for 2007, consumption expenditure is forecast to grow by 2.6 per cent.
Continued restrained consumption of services
After having increased by approximately 1.5 per cent per year in both 2002 and 2003, consumption grew somewhat more rapidly last year. According to the preliminary National Accounts, consumption growth was 1.8 per cent in 2004, measured as an annual average. Consumption of goods increased by 2.5 per cent, while consumption of services, excluding housing, rose by just under 1 per cent (see Diagram 9.2). Particularly the consumption of durable goods, which rose by over 6 per cent, contributed to the relatively strong growth in the consumption of goods. However, household purchases of new private cars slowed last year after having shown substantial growth the previous year. Statistics on the registration of new private cars indicate weak consumption of cars in early 2005 as well. Consumption of services levelled off in late 2000 and has since
56
developed very weakly. One factor that has probably had an impact is that consumption of goods has become relatively cheaper over the past few years as a result of stronger global price pressure. This price pressure does not affect the service sector to the same extent.
Diagram 9.2 Household consumption of goods and services
SEK billion, constant prices, seasonally adjusted
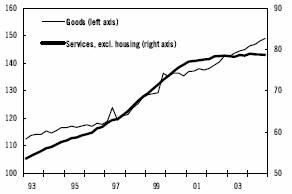
Sources: Statistics Sweden, NIER and Ministry of Finance.
A broadening of consumption is expected in the near future, and households are expected to increase their demand for services as employment rises and consumer confidence strengthens. Consumption of goods is expected to continue growing strongly. A further contribution to the increase in consumption in 2004 came from tourist expenditure, i.e. Swedish households’ consumption abroad, which rose by 12 per cent last year despite a slowdown during the second half of the year. Foreign travel is expected to continue increasing at around the same rate this year, and then increase somewhat more slowly in 2006. Apart from the very subdued consumption of services, excluding housing, the subdued rate of growth in tourist expenditure and unusually low energy consumption mainly contributed to the weak consumption growth during the second half of 2004.
Indicators pointing in positive direction
The Statistics Sweden and Swedish Research Institute of Trade Retail Index shows continued good growth in early 2005, particularly for sales in the durable goods trade. Growth in the nondurable goods trade is considerably more subdued and has been so throughout the past year. According to the NIER’s quarterly Business Tendency Survey, firms in the durable goods trade report a continued favourable sales situation despite weaker than expected results for the past few quarters. The outlook for the next six months is very positive. According to the NIER’s Consumer Survey, confidence in the economy improved somewhat at the beginning of the year, following a small dip in the fourth quarter of last year. However, there is still some uncertainty regarding developments in the labour market. In March, only one in five households expected falling unemployment over the next 12 months (see Diagram 9.3). Developments in the labour market will probably be a decisive factor for consumption growth in the near future. Apart from impacting on household income, employment probably also has a major influence on confidence in the future, and consequently on households’ choice between consumption and saving.
Diagram 9.3 Household expectations about the economy 12 months ahead
Net balances, per cent
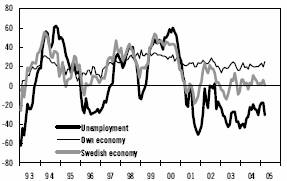
Note: Net balances before Jan. 2002 have been level adjusted.
Sources: Statistics Sweden and NIER.
Strengthening household wealth position
The rally on the Stockholm stock exchange, which began in the spring of 2003, continues and the value of households’ holdings of shares and mutual funds rose by nearly 17 per cent last year (see Table 9.4). Household saving in bank and insurance assets also continued to increase last year. Households’ total financial assets consequently increased to SEK 2,755 billion, exceeding the previous highest level in 2001. At the same time, households’ liabilities rose by nearly 10 per cent, which means that household financial net wealth increased more moderately and was still lower than around the year 2000, when the Stockholm stock exchange peaked.
57
Table 9.4 Household financial wealth
Market value at the end of the year, SEK billion, current prices
| | 2000 | | 2001 | | 2002 | | 2003 | | 2004 | |
Financial assets(1) | | 2,557 | | 2,564 | | 2,270 | | 2,546 | | 2,755 | |
Equities and mutual funds | | 956 | | 831 | | 570 | | 716 | | 836 | |
Deposits in banks | | 414 | | 471 | | 505 | | 531 | | 549 | |
Insurance | | 577 | | 639 | | 576 | | 597 | | 644 | |
Other equity | | 418 | | 430 | | 426 | | 497 | | 522 | |
Financial liabilities | | 1,123 | | 1,228 | | 1,324 | | 1,451 | | 1,590 | |
Financial net wealth | | 1,434 | | 1,336 | | 946 | | 1,095 | | 1,165 | |
(1) Excluding collective insurance and “other financial assets” included in the Financial Accounts.
Source: Financial Supervisory Authority Savings Survey.
Apart from financial assets, households hold large real assets, mainly in the form of single-family dwellings. The increasing borrowing is very closely linked to the rising prices of such dwellings, i.e. increased real wealth and the rising prices of tenant-owned apartments.(16) The prices of both single-family dwellings and tenant-owned apartments were just over 10 per cent higher in 2004 than the year before. Diagram 9.4 shows that household debt in relation to households’ total gross assets is historically low.
Diagram 9.4 Liabilities in relation to disposable income and total assets
Per cent

Note: Assets excluding collective insurance.
Sources: Statistics Sweden, NIER and Ministry of Finance.
However, liabilities in relation to household disposable income have risen over the past few years despite relatively strong income growth. Liabilities in relation to income are today close to the levels in the early 1990s, and households have therefore become more sensitive to changes in interest rates. However, households benefit from the fact that total interest expenditure is currently kept down by low nominal interest rates. Despite households having increased their liabilities by nearly SEK 140 billion last year, their interest expenditure declined by SEK 3.5 billion. Interest expenditure (after tax) as a percentage of disposable income is historically low despite increased debt.(17)
High consumption growth in 2005 and 2006
The somewhat cautious increase in consumption during the second half of last year is considered to be of a temporary nature and the conditions are favourable for a more rapid rate of increase in the near future. Low inflation expectations indicate that households anticipate continued low interest rates. Low interest rates, combined with a forecast increase in real disposable income of 3 per cent this year and 2 per cent next year, provide a good basis for increased consumption.
Households’ wealth position is initially very good, partly as a result of the saving surplus built up over the past few years, and partly as a result of rising asset prices. This contributes to strong household confidence in the economic situation. In pace with a brighter outlook in the labour market, confidence will strengthen further, which is expected to lead to households choosing increased consumption rather than further increased saving.
Overall, consumption, measured as an annual average, is expected to increase by 2.2 per cent this year and 2.7 per cent next year. Consumption growth is forecast at 2.6 per cent in the estimate year 2007.
(16) Home loans account for approximately 60 per cent of households’ liabilities. In addition, a certain proportion of households’ bank loans is also linked to housing finance in the form of top-tier loans.
(17) Interest expenditure after tax accounted for less than 4 per cent of disposable income in both 2003 and 2004. During the period 1981–2002, annual interest expenditure accounted for an average of 6.5 per cent of disposable income.
58
9.3 Household saving
In 2004, households saved SEK 58 billion, or 4.5 per cent of disposable income (own saving(18)). Statistics Sweden’s definition of households’ net saving includes not only their own saving, but also saving in funded pension schemes under collective agreements. The latter includes contributions and yield less pensions paid out. Both defined-benefit and defined-contribution schemes are included.
Table 9.5 Household savings
Nominal prices, billion SEK, unless stated
| | 2004 | | 2005 | | 2006 | | 2007 | |
Billion SEK | | | | | | | | | |
Disposable income | | 1,282 | | 1,336 | | 1,382 | | 1,424 | |
Consumption expenditure | | 1,224 | | 1,262 | | 1,317 | | 1,379 | |
Own savings(1) | | 58 | | 74 | | 64 | | 45 | |
Net saving in supplementary pensions schemes | | 54 | | 55 | | 58 | | 60 | |
Net savings(2) | | 112 | | 129 | | 122 | | 105 | |
Net lending(3) | | 93 | | 110 | | 104 | | 84 | |
Per cent of disposable income | | | | | | | | | |
Own savings(1) | | 4.5 | | 5.6 | | 4.7 | | 3.2 | |
Net savings(2) | | 8.4 | | 9.3 | | 8.5 | | 7.1 | |
Net lending(3) | | 7.2 | | 8.2 | | 7.5 | | 5.9 | |
Per cent of GDP | | | | | | | | | |
Net lending | | 3.7 | | 4.1 | | 3.7 | | 2.9 | |
(1) Own savings = disposable income — consumption expenditure.
(2) Net savings = own saving + net saving in supplementary pensions schemes.
(3) Net lending = own net lending + net saving in supplementary pensions schemes.
The difference between the terms “net savings” and “net lending” is mainly that capital depreciation on households’ capital stock is deducted when calculating net savings, while investment expenditures are deducted when calculating net lending. If household net investments are larger than the depreciation of capital, i.e. capital stock is growing, then net lending will be lower than net savings. Sources: Statistics Sweden and Ministry of Finance.
In the 1990s and the early 2000s, there was a gradual shift in several areas away from defined-benefit schemes in favour of defined-contribution schemes. Saving in unfunded supplementary pension schemes, which was previously common in the general government sector, is not included in household saving. Pension benefits accrued in the national pension system (income and premium pensions) are not included in household saving either, but in general government net lending. Net saving in supplementary pension schemes increased sharply in the 1990s and amounted to over SEK 54 billion or 1.8 per cent of GDP in 2004.
During the forecast period, consumption expenditure is expected to increase more rapidly than income. Households’ own saving is forecast to decline but remain positive. Total net saving and net lending are expected to decline during the period, both as a percentage of disposable income and as a percentage of GDP.
Diagram 9.5 Household own saving
Per cent of disposable income

Note: Own savings is household net savings excluding savings in supplementary pension schemes.
Sources: Statistics Sweden and Ministry of Finance.
(18) Household saving as defined in the National Accounts includes household saving in supplementary pension schemes. In some cases, it may be interesting to analyse household saving net of saving in supplementary pension schemes - referred to here as “own saving” - partly because household saving in supplementary pension schemes is locked in and cannot be accessed by households for consumption, real investment, etc.
59
10 Investment
Investment increased 5.1 per cent last year. High capacity utilisation in industry, continued good demand for Swedish products and favourable financial conditions suggest that the upswing in investment will continue. Taken together, total investment is estimated to grow 7.1 per cent this year and 5.2 per cent in 2006.
Total investment fell slightly between 2001 and 2003 (see Diagram 10.1). Last year an upswing began and investment increased 5.1 per cent compared with 2003. The upswing in the domestic business cycle and the strong international business cycle have resulted in high capacity utilisation in industry and improved profitability for many Swedish firms. Combined with continued good demand and low interest rates, this situation suggests that the upswing in investment will continue.
Diagram 10.1 Investment
Annual percentage change
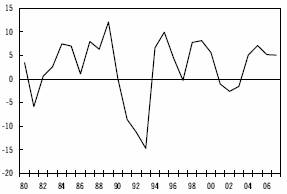
Sources: Statistics Sweden and Ministry of Finance.
Investment in the goods-producing sector is expected to grow at a brisk pace during the forecast period. Service sector investment will also increase in the future, though at a somewhat slower pace because of the weaker development expected in real estate (excluding housing) and trade. Housing investment, which was extremely strong last year, continues to grow at a good rate. General government investment is increasing, mainly because of central government investment in infrastructure.
In summary, total investment is expected to rise 7.1 per cent this year and 5.2 per cent in 2006. During 2007, GDP growth is expected to be in line with the long-term trend, which makes a continued good investment trend possible. Investment will then grow at a rate of 5.1 per cent.
Housing investment fell sharply in the early 1990s and has remained at historically low levels since then, causing the total investment share of GDP to fall to relatively low levels (see Diagram 10.2). During the forecast years, total investment in current prices is expected to grow somewhat faster than GDP. The investment share of GDP is therefore expected to increase by about 1 percentage point, and towards the end of 2007 it will reach about 17 per cent.
Diagram 10.2 Investment share of GDP
Per cent
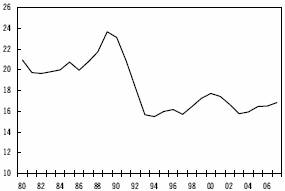
Sources: Statistics Sweden and Ministry of Finance.
10.1 Business sector
Investment in the goods-producing sector continues to increase
Domestic industrial production, led by motor vehicles and telecommunication equipment, increased sharply last year mainly due to strong demand from abroad. Capacity utilisation in industry continued to rise and levelled out at a very high level of 91.0 per cent toward the end of 2004 (see Diagram 10.3). The high capacity utilisation and continued good demand expected for Swedish output, combined with favourable financial conditions, suggest continued investment growth in industry.
According to Statistics Sweden’s investment survey, the upswing in industrial investment that began last year will grow stronger this year, especially in the pulp, paper and paper products industry and in mining and quarrying, which plan to boost production capacity. Firms in the
60
chemical industry and the transport equipment industry also have expansive plans.
Diagram 10.3 Capacity utilisation in industry
Per cent
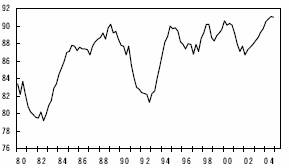
Note: Capacity utilisation is defined as the ratio of actual production to total production capacity.
Source: Statistics Sweden.
Investment in the energy sector is expected to increase substantially in the future as part of refurbishing programmes for the power grid and the modernisation of electricity and heat production. For example, Vattenfall has initiated extensive investment projects, and the company plans to invest SEK 42 billion in the energy sector in Sweden over the next few years.
The construction industry’s own investment fell somewhat last year. The substantial increase in residential construction (see section 10.3) is expected to lead to a recovery and investment will grow this year.
Table 10.1 Investment
Percentage change in volume
| | 2004 | | 2005 | | 2006 | | 2007 | |
Business sector(1) | | 4.7 | | 7.3 | | 5.6 | | 5.4 | |
Producers of goods | | 0.5 | | 9.1 | | 7.6 | | — | |
Producers of services | | 7.7 | | 6.1 | | 4.3 | | — | |
Housing | | 16.1 | | 10.7 | | 4.7 | | 8.0 | |
General government | | -2.0 | | 2.9 | | 3.7 | | 0.8 | |
Central government | | 1.3 | | 4.0 | | 5.3 | | 0.5 | |
Local government | | -5.6 | | 1.7 | | 1.9 | | 1.2 | |
Total | | 5.1 | | 7.1 | | 5.2 | | 5.1 | |
Building and construction | | 2.9 | | 5.2 | | 4.4 | | 5.2 | |
Machinery | | 6.7 | | 8.9 | | 6.6 | | 5.1 | |
Other | | 6.9 | | 7.2 | | 3.4 | | 4.5 | |
(1)Housing excluded.
Sources: Statistics Sweden and Ministry of Finance.
In summary, investment by the goods-producing sector will grow on a relatively broad front. Total investment in the goods-producing sector is expected to increase 9.1 per cent this year and 7.6 per cent in 2006.
Mixed picture of service sector in the future
Service sector investment increased by 7.7 per cent last year. The main factor underpinning this increase is the recovery of investment in post and telecommunications and in corporate services, though investment in the transport industry also grew at a good clip. These industries are expected to continue to show good investment growth during the forecast period.
Weaker than expected investment growth in trade and real estate excluding housing, however, means a somewhat mixed picture for the service sector as a whole. Trade investment, which increased at a good rate in 2004, is expected to remain essentially unchanged this year. The investment level is relatively high, and Statistics Sweden’s survey suggests restrictive investment plans. The forecasted increase in household consumption is expected to contribute to a slight increase in trade investment next year. In the property sector excluding housing, vacancy figures for commercial premises have been high for some time and there are few new applications for building permits. This suggests continued weak investment growth in real estate excluding housing during the forecast period.
All factors considered, investment in the service sector is expected to grow somewhat slower than in the goods-producing sector. Service sector investment is expected to increase 6.1 per cent this year and 4.3 per cent in 2006.
10.2 General government sector
The strained financial situation of recent years in many municipalities has entailed falling investment levels for the local government sector as a whole. This year local government finances are being strengthened (see Chapter 11), and the announced investment grant and incentive package is expected to lead to an upswing in investment.
Central government investment increased somewhat last year. In the future, the growth rate is expected to pick up because of the National Rail Administration and National Road
61
Administration’s infrastructure initiatives. Taken together, general government investment is expected to increase 2.9 per cent this year and 3.7 per cent in 2006.
10.3 Housing
New construction of housing demonstrated extremely strong growth last year. According to Statistics Sweden, the number of new building starts of dwellings reached about 27,300, corresponding with an increase of a full 23 per cent compared with 2003.(19) Seen from a long-term perspective, the increases in recent years have occurred from low levels, which is related to the large drop in residential construction in the early 1990s (see Diagram 10.4).
For multi-dwelling buildings the increase in new building starts reached 33 per cent last year, and for single-family dwellings the increase was 10 per cent. Stockholm recorded the biggest increase in multi-dwelling buildings, with 1,000 new dwellings started in 2003 and over 3,500 dwellings in 2004. According to Statistics Sweden, most counties reported increases and the counties of Dalarna, Västerbotten and Kronoberg were especially noteworthy. For all of Sweden the number of new building starts of multi-dwelling buildings and single-family homes reached 16,900 and 10,400 dwellings respectively. The number of commenced renovations of apartments in multi-dwelling buildings last year was 24,650, a 6 per cent decrease compared with 2003.
According to the National Accounts, investment in new homes increased 25.1 per cent last year while renovation investment increased 3.3 per cent. All factors considered, this meant that total housing investment increased 16.1 per cent.
New construction of housing is expected to continue to increase this year, albeit at a slower pace than in 2004. According to the National Institute of Economic Research’s (NIER) Business Tendency Survey, the confidence indicator for the construction industry rose for over one year and is now at a historically high level despite weak growth in other construction investment. The total backlog of orders increased and the outcome has exceeded expectations. The NIER business tendency survey also suggests continued strong construction activity. The balance for prospects in the construction market in one year’s time, in other words, the net percentage of responding construction firms that expect improved prospects, is at a very high level.
All factors considered, the number of new building starts of dwellings is expected to reach over 29,600 this year. Somewhat higher interest rates will contribute to a marginal slowdown in 2006, and the number of new building starts is expected to be over 28,700 dwellings.
The need for renovations is also expected to grow in the future. A large proportion of existing housing in Sweden was built in the 1960s and 1970s as part of the Million Homes Programme. According to calculations from the Swedish National Board of Housing, Building and Planning, close to 1.2 million apartments will need to replace plumbing pipes over the next twenty years. This year the tax allowance for repairs to housing is also expected to contribute to an increase in renovations.
The number of new building starts and commenced renovations is expected to entail housing investment, expressed in terms of the National Accounts, to increase 10.7 per cent this year. Next year the growth rate in housing investment is expected to reach 4.7 per cent.
Diagram 10.4 New building starts
Thousands

Sources: Statistics Sweden and Ministry of Finance.
(19) Figures in this section for housing starts in 2004 are preliminary and calculated with Statistics Sweden’s development rate for the average lag in reporting statistics.
62
10.4 Stocks
Total stockbuilding fell last year, which pulled GDP growth down 0.3 percentage points.
The NIER business tendency survey shows that the balance for the assessment of the current situation on the industries’ stocks of input goods is at a historically low level. At the same time, the outcome from the National Accounts shows that relatively large withdrawals of input goods from stocks have been made for a long time. This suggests that stockbuilding in input goods will increase in the future. As global demand enters a somewhat calmer phase, some increase in investment in industry’s stocks of finished goods is also expected.
In trade, NIER’s business tendency survey shows differing assessments of stocks. The percentage of firms selling motor vehicles and which are dissatisfied because stocks are too large has decreased somewhat, but is still high. However, for firms in wholesale trade (excluding motor vehicles), the stock assessments suggest that firms have become increasingly satisfied with the size of their stocks. In certain parts of wholesale trade there appears to be a need to increase stockbuilding. Other industries in trade show no clear trend in their opinions of stocks. For trade as a whole, this means that stockbuilding is expected to increase this year.
In summary, stockbuilding in both industry and trade should increase this year, which is expected to raise GDP growth by 0.4 percentage points. Next year stockbuilding is expected to make an essentially neutral contribution to GDP growth.
The severe storm that hit southern Sweden in January will influence stockbuilding in growing and cut forest as well as industry stocks of input goods. It is difficult to determine exactly what effects the storm will have on stockbuilding during the forecast years. The effects depend in part on how much timber it will be possible to take care of and how quickly the stocks that arise because of the storm can be sold. Other than the real economic circumstances, the effects of the storm on stockbuilding also depend on purely accounting-related factors in the National Accounts, which makes the stocks forecast less reliable than usual.
63
11 General government sector
General government net lending is expected to show a surplus throughout the forecast period and debt will decrease as a percentage of GDP. This year the surplus will be 0.7 per cent and in 2006 it will be 0.6 per cent of GDP. Both income and expenditures will decrease as a percentage of GDP.
11.1 Consolidated general government sector
Budget policy targets
Fiscal policy is governed by two medium-term targets. Net lending in the general government sector is to average 2 per cent of GDP over a business cycle (surplus target). In addition, the central government and pension system’s expenditures may not exceed the established expenditure ceiling, normally decided three years in advance.
The primary purpose of the surplus target is to strengthen the general government’s financial position to be able to handle future demographic strains on the public welfare system. At the same time the target creates a buffer to avoid overly large deficits in a recession.
The expenditure ceiling, an important instrument in the central government’s budgetary process, prevents the use of temporarily higher income to finance permanently higher expenditures. The expenditure ceiling is also an important instrument for achieving the surplus target.
Expenditures included in the expenditure ceiling deviate in scope and definition from the expenditures in the surplus target in several regards. General government net lending is defined by the EU’s regulations for National Accounts, ESA-95. This means that the surplus target encompasses the central government, the old-age pension system and the local government sector. The expenditure ceiling encompasses all expenditures in the central government budget except national debt interest payments, expenditures for the old-age pension system and a budgeting margin. Local government sector expenditures are not included in the expenditure ceiling. However, central government grants that partially finance local government expenditures are included. The local government sector must satisfy the balanced budget requirement.
Besides the fact that the expenditure ceiling does not cover the local government sector’s expenditures, other expenditures that are not covered by the expenditure ceiling also affect general government net lending. Certain central government expenditures are financed on the income side of the central government budget and in the National Debt Office. There are also differences in the reporting of revenues and expenditures between the National Accounts and the central government budget that do not affect the balances.
The surplus target of an average of 2 per cent of GDP over a business cycle has been in effect since 2000. Table 11.1 shows how net lending has developed since 2000 and how it is allocated among the three sub sectors of general government.
Table 11.1 General government net lending
| | 2000 | | 2001 | | 2002 | | 2003 | | 2004 | | 2005 | | 2006 | | 2007 | |
Billion SEK | | | | | | | | | | | | | | | | | |
Central government | | 56 | | 167 | | -44 | | -43 | | -21 | | -43 | | -47 | | -28 | |
Old-age pension system | | 48 | | -104 | | 45 | | 47 | | 48 | | 54 | | 56 | | 55 | |
Local government sector | | 5 | | -4 | | -13 | | -7 | | 2 | | 8 | | 8 | | 5 | |
General government | | 109 | | 59 | | -12 | | -2 | | 28 | | 19 | | 17 | | 32 | |
Per cent of GDP | | | | | | | | | | | | | | | | | |
Central government | | 2.6 | | 7.4 | | -1.9 | | -1.7 | | -0.8 | | -1.6 | | -1.7 | | -1.0 | |
Old-age pension system | | 2.2 | | -4.6 | | 1.9 | | 1.9 | | 1.9 | | 2.0 | | 2.0 | | 1.9 | |
Local government sector | | 0.2 | | -0.2 | | -0.5 | | -0.3 | | 0.1 | | 0.3 | | 0.3 | | 0.2 | |
General government | | 5.0 | | 2.6 | | -0.5 | | -0.1 | | 1.1 | | 0.7 | | 0.6 | | 1.1 | |
Average as from 2000 | | 5.0 | | 3.8 | | 2.4 | | 1.8 | | 1.6 | | 1.5 | | 1.3 | | 1.3 | |
Sources: Statistics Sweden and Ministry of Finance.
64
Table 11.2 Expenditure ceiling and government expenditure
Billion SEK
| | 2000 | | 2001 | | 2002 | | 2003 | | 2004 | | 2005 | | 2006 | | 2007 | |
Budgeting margin | | 5.0 | | 4.7 | | 0.4 | | 2.9 | | 2.4 | | 1.1 | | 1.5 | | 10.4 | |
Expenditure under the ceiling | | 715 | | 741 | | 773 | | 800 | | 834 | | 869 | | 906 | | 933 | |
Per cent of GDP | | 32.6 | | 32.7 | | 32.8 | | 32.8 | | 32.8 | | 32.6 | | 32.4 | | 31.9 | |
Central government and the pension system primary expenditure | | 720 | | 735 | | 774 | | 829 | | 849 | | 892 | | 930 | | 948 | |
Per cent of GDP | | 32.8 | | 32.4 | | 32.9 | | 34.0 | | 33.4 | | 33.5 | | 33.2 | | 32.4 | |
Note: The budgeting margin in 2007 is based on a technically calculated expenditure ceiling. The expenditure under the ceiling is adjusted for technical changes. Central government and the pension system primary expenditure are according to the National Accounts, adjusted for value added tax included in central government consumption, central government investment and in the grants to the local government sector, and for transfers to the premium pension system.
Sources: Statistics Sweden and Ministry of Finance.
Surplus less than 2 per cent of GDP
In 2000 net lending reached 5 per cent of GDP. The large surplus allowed room for an expansionary fiscal policy during the following years with a weak economic development. In 2002 and 2003 net lending showed a minor deficit. Last year net lending improved to a surplus of SEK 28 billion or 1.1 per cent of GDP. During the forecast period net lending is not expected to reach 2 per cent of GDP during any year, which means that the average surplus from 2000 will decrease to 1.3 per cent of GDP at the end of the forecast period.
All sub sectors of general government showed a surplus in net lending for 2000. In 2001 the distribution of net lending between the central government and the old-age pension system was affected by transfers of SEK 155 billion, equivalent to 6.8 per cent of GDP, from the National Pension Funds to the central government as a result of the pension reform. Excluding this transfer, the old-age pension system has a stable surplus of about 2 per cent of GDP for the entire period between 2000 and 2007. The local government sector’s net lending was positive in 2004 and is expected to be so during the forecast period. Variations in the general government’s net lending are mainly found in the central government, which has had negative net lending since 2002.
Narrow budgeting margin
The expenditure ceiling has been met every year since the ceiling was implemented in 1997. Between 2000 and 2004, however, the budgeting margin was relatively small and it is expected to be narrow between 2005 and 2006 (see Table 11.2). The expenditure ceiling for 2007 will not be approved until the 2006 Budget Bill. The Budget Bill for 2005 reported an expenditure ceiling for calculation purposes by raising the expenditure ceiling for 2006 with the growth trend in nominal GDP, which is expected to be 4 per cent. This means that the expenditure ceiling as a percentage of potential GDP was expected to be unchanged between 2006 and 2007. With this technically calculated expenditure ceiling, the budgeting margin in 2007 will be just over SEK 10 billion.
The accounting principles for the central government budget vary over time. The expenditure ceilings for 2000–2004 in Table 11.2 have therefore been corrected to reflect the principles in effect beginning in 2005 in order to achieve comparability. Corrected for technical changes, the expenditure ceiling as a percentage of GDP has been relatively stable since 2000, but it will decrease somewhat in relation to GDP during the forecast period.
Expenditures as reported in the National Accounts deviate in several regards from the Budget Accounts. However, after adjustments for the most important differences (see note under Table 11.2) a level is obtained that is relatively close to the Budget Accounts. Remaining differences in level and development are due in part to the fact that certain expenditures in the National Accounts are reported as income in the budget, through a credit against the tax account, or through debt with the National Debt Office instead of as a grant.
During the forecast period the expenditure ceiling as a percentage of GDP will gradually decrease. According to the National Accounts, however, expenditures will first rise somewhat in 2005 after which they will decline. Development is varied in 2005 because the financing on the budget’s income side is increasing, in part through temporary employment support to the local government sector.
65
Income and expenditures to decrease as a percentage of GDP
In 2004 the two preceding years’ deficit in the general government’s net lending was reversed to a surplus of SEK 28 billion, or 1.1 per cent of GDP. The improvement was caused by a decrease in expenditures, while income remained essentially unchanged as a percentage of GDP.
During the forecast period, both income and expenditures will decrease as a percentage of GDP. For 2005 and 2006 the general government’s net lending will decrease to 0.7 and 0.6 per cent of GDP respectively, despite an increase in resource utilisation in the economy and a decrease in unemployment. The decreased net lending is mainly the result of an expansionary fiscal policy, which is also reflected in a reduction of the structural balance. In 2007 expenditures will decrease relatively sharply as a percentage of GDP and net lending will therefore be strengthened to just over 1 per cent of GDP (see Table 11.3).
Table 11.3 General government finances
Billion SEK
| | 2004 | | 2005 | | 2006 | | 2007 | |
Revenue | | 1,414 | | 1,463 | | 1,523 | | 1,586 | |
per cent of GDP | | 55.6 | | 54.9 | | 54.5 | | 54.2 | |
Taxes and charges | | 1,280 | | 1,315 | | 1,372 | | 1,430 | |
per cent of GDP | | 50.3 | | 49.4 | | 49.1 | | 48.9 | |
Capital income | | 53 | | 61 | | 61 | | 63 | |
Other income | | 82 | | 86 | | 89 | | 93 | |
Expenditure | | 1,386 | | 1,444 | | 1,506 | | 1,554 | |
per cent of GDP | | 54.5 | | 54.2 | | 53.9 | | 53.1 | |
Primary expenditure | | 1,335 | | 1,386 | | 1,446 | | 1,489 | |
per cent of GDP | | 52.5 | | 52.0 | | 51.7 | | 50.9 | |
Interest | | 51 | | 58 | | 60 | | 65 | |
per cent of GDP | | 2.0 | | 2.2 | | 2.2 | | 2.2 | |
Net lending | | 28 | | 19 | | 17 | | 32 | |
per cent of GDP | | 1.1 | | 0.7 | | 0.6 | | 1.1 | |
Financial position | | | | | | | | | |
Net debt | | -147 | | -161 | | -179 | | -209 | |
per cent of GDP | | -5.8 | | -6.0 | | -6.4 | | -7.1 | |
Consolidated gross debt | | 1,301 | | 1,331 | | 1,358 | | 1,385 | |
per cent of GDP | | 51.2 | | 49.9 | | 48.6 | | 47.3 | |
Sources: Statistics Sweden and Ministry of Finance.
Stronger financial position
The general government sector’s financial assets and liabilities are reported in Statistics Sweden’s Financial Accounts. Under current EU regulations (ESA-95), assets and liabilities are valued at market price. This means that changes in the net financial position are not just determined by net lending, but are also affected by changes in the value of financial assets and liabilities. This applies to both realised and unrealised changes in value.
In 1990, the general government sector’s financial wealth amounted to over SEK 100 billion, or 8 per cent of GDP (see Diagram 11.1). During the severe crisis of the early 1990s, the financial position deteriorated rapidly. Wealth was replaced by net debt, which in 1996 was SEK 467 billion, or 27 per cent of GDP. The financial position has improved since 1996, and net debt was replaced by positive wealth in 2001. During 2002 and 2003, the net financial position was heavily impacted by the substantial changes in value in the stock market since the bulk of pension system assets is invested in shares. The 2002 stock market decline once again entailed a net debt, which in 2003 was reversed to a net wealth of SEK 37 billion, or 1.5 per cent of GDP as a result of the rising values of shares.
The 2004 net lending surplus and the continued upswing in the stock market caused the net financial position to improve to an estimated 6 per cent of GDP last year. The forecast makes no assumptions about future changes in value, with the exception of the effects on central government debt from changes in foreign exchange rates. This means that the trend in financial position will follow net lending. Because of this positive net lending, the financial position will improve during the forecast period and in 2007 the general government’s financial assets are expected to exceed liabilities by over SEK 200 billion.
66
Diagram 11.1 General government net financial position
Per cent of GDP
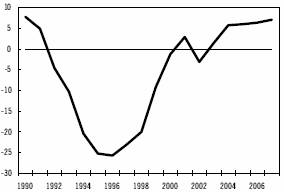
Sources: Statistics Sweden and Ministry of finance
Consolidated gross debt is defined by EU rules (the Maastricht criteria). According to this definition, the general government sector’s gross debt is reduced by the general government sector’s holdings of own liabilities. For Sweden, the definition means that consolidated gross debt consists of central government debt at par value plus the local government sector’s liabilities in the credit market, with a deduction for the National Pension Funds’ holdings of treasury bonds. At the end of 2004, consolidated debt amounted to 51.2 per cent of GDP, which was well below the EU reference value of 60 per cent of GDP.
The financial position will strengthen during the forecast period through increased assets in the pension system. At the same time, the deficit in the central government’s net lending means an increase in the liability column of the general government’s balance sheet. However, both central government debt and consolidated gross debt will decrease as a percentage of GDP.
Taxes and charges
The taxes reported in the National Accounts for the general government sector are somewhat lower than total taxes paid. In the National Accounts, the portion of value added tax and customs revenues included as part of the EU contribution is classified as a foreign payment rather than as a tax in the general government sector. Total taxes as a percentage of GDP (tax ratio) fell in the early 1990s, mainly as a result of the economic crisis and because the 1991 tax reform was underfinanced in the short run. Tax increases in the consolidation programme and extraordinarily high corporate profits and capital gains in 1999 and 2000 resulted in a substantial increase in the tax ratio during the second half of the 1990s. Tax cuts and reduced corporate profits and capital gains contributed to a decrease in the tax ratio once again in the early 2000s (see Diagram 11.2).
Diagram 11.2 Taxes and charges
Per cent of GDP
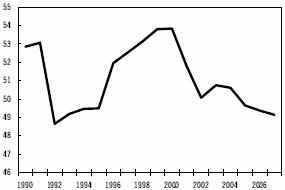
Sources: Statistics Sweden and Ministry of finance
In 2004 the tax ratio was 50.6 per cent of GDP (see Table 11.4). The most important tax base is wages, which together with taxable transfer payments, account for 65 per cent of tax revenues. The central government receives 54 per cent of tax revenues, the old-age pension system receives 13 per cent and 32 per cent goes to the local government sector. The EU receives 1 per cent of taxes via customs duties and the part of the EU contribution that is based on the value added tax.
Table 11.4 Taxes and charges
Per cent of GDP
| | 2004 | | 2005 | | 2006 | | 2007 | |
Household taxes and charges | | 19.4 | | 18.8 | | 18.8 | | 18.7 | |
Company direct taxes | | 2.8 | | 2.7 | | 2.7 | | 2.8 | |
Payroll charges | | 14.1 | | 13.9 | | 13.9 | | 13.7 | |
Value added tax | | 9.2 | | 9.1 | | 9.0 | | 9.0 | |
Property tax | | 1.0 | | 0.9 | | 0.9 | | 1.0 | |
Other production taxes | | 4.2 | | 4.2 | | 4.1 | | 4.0 | |
Total | | 50.6 | | 49.7 | | 49.4 | | 49.1 | |
of which to EU | | 0.3 | | 0.3 | | 0.3 | | 0.3 | |
Sources: Statistics Sweden and Ministry of Finance.
This year the tax ratio is expected to fall to 49.7 per cent. The reduction of almost 1 percentage point corresponds with about SEK 24 billion, of which almost SEK 10 billion is the result of changes in regulations. Lower income and wealth tax, as well as the abolition of gift and
67
inheritance taxes, have reduced households’ direct taxes by about SEK 15 billion this year. Energy taxes have been raised and regulations for firms’ provisions to tax allocation reserves have been changed to help finance these tax cuts.
The decision to charge interest on firms’ tax allocation reserves beginning in 2005 has had the consequence that certain firms have reversed all or parts of their tax allocation reserves in 2004. Consequently corporate tax revenues were temporarily high in 2004.
During subsequent years the most important tax bases will develop more slowly than GDP, which means that the tax ratio will continue to fall.
Capital and other income
Alongside taxes, the general government sector receives capital and other income, which in 2004 amounted to SEK 135 billion, or 5.3 per cent of GDP. Around 40 per cent of this income consists of capital income in the form of interest and dividends, and approximately half of this is the yield on the pension funds. Capital income will rise relatively sharply this year as a result of increased dividend income.
Other income consists mainly of imputed pension charges and consumption of fixed capital. These incomes are imputed and are matched on the expenditure side by equally large costs, which are included in general government consumption expenditure. The general government sector also receives income from certain transfers from households, firms and from abroad.
Expenditure
General government expenditure as a percentage of GDP (expenditure ratio) rose sharply during the economic crisis in the early 1990s. The savings in the consolidation programme contributed to a decrease in the expenditure ratio during the second half of the 1990s. The expenditure ratio increased in 2002 and 2003 because of reforms and the recession. In 2004, however, the expenditure ratio decreased 1.4 percentage points to 54.5 per cent (see Diagram 11.3).
Diagram 11.3 General government expenditure
Per cent of GDP
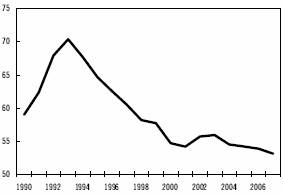
Sources: Statistics Sweden and Ministry of finance
During the forecast period the expenditure ratio is expected to continue to decline (see Table 11.5). Transfer payments to households will decrease as a percentage of GDP, in part because of the relatively weak development of old-age pensions. The reduction in 2005 and 2006 is partially a consequence of low wage and price increases, to which pensions are index-linked. Next year the improvement in the labour market will contribute to a reduction of transfer payments to households as a percentage of GDP. The sharply rising trend in expenditure for health insurance in recent years will be broken, but disability pensions will continue to rise. Transfer payments to households are described in greater detail in section 9.1.
Table 11.5 General government expenditure
Per cent of GDP
| | 2004 | | 2005 | | 2006 | | 2007 | |
Transfers to households | | 18.9 | | 18.4 | | 18.0 | | 17.8 | |
Pensions | | 9.1 | | 8.7 | | 8.5 | | 8.5 | |
Illness | | 4.5 | | 4.6 | | 4.5 | | 4.5 | |
Labour market | | 1.7 | | 1.6 | | 1.4 | | 1.3 | |
Family and children | | 1.9 | | 1.8 | | 1.9 | | 1.9 | |
Studies | | 0.5 | | 0.4 | | 0.4 | | 0.4 | |
Social assistance etc. | | 0.4 | | 0.4 | | 0.4 | | 0.3 | |
Other | | 0.9 | | 0.8 | | 0.8 | | 0.8 | |
Other transfers | | 3.0 | | 3.2 | | 3.5 | | 3.3 | |
Consumption | | 27.8 | | 27.5 | | 27.3 | | 27.1 | |
Central government and old-age pension system | | 7.7 | | 7.5 | | 7.3 | | 7.2 | |
Local government | | 20.0 | | 20.0 | | 20.0 | | 19.8 | |
Investment | | 2.8 | | 2.8 | | 2.8 | | 2.7 | |
Interest | | 2.0 | | 2.2 | | 2.2 | | 2.2 | |
Total expenditure | | 54.5 | | 54.2 | | 53.9 | | 53.1 | |
exclusive of interest | | 52.5 | | 52.0 | | 51.7 | | 50.9 | |
Sources: Statistics Sweden and Ministry of Finance
68
Other transfers are expected to increase during the forecast period, including an increase in foreign aid and the EU contribution.
Last year both the central and local government consumption volume decreased in calendar-adjusted terms (after correction for the number of working days). This development is expected to reverse to an increase during the forecast period. This year central government consumption is expected to increase 0.5 per cent and local government consumption will increase 1.5 per cent in volume. Next year a continued increase in local government consumption of almost 1.5 per cent (calendar adjusted) is expected, while central government consumption will remain unchanged. For 2007, both central government and local government consumption are estimated to rise 0.5 per cent. Despite this increase in volume, public consumption will decrease as a percentage of GDP during the forecast period. Increased investment in infrastructure will contribute to an increase in the volume of general government investments over the next few years and will therefore remain unchanged as a percentage of GDP.
Interest expenditure has decreased SEK 40 billion or 2 per cent of GDP since 2000. The decreased interest expenditure means that the net of capital income and interest expenditure was positive in 2004. This year interest expenditure will rise somewhat as a result of rising central government debt.
11.2 Central government
As reported in the National Accounts
The central government’s net lending has been negative since 2002, after maintaining a surplus between 1998 and 2001. In 2004 the deficit reached SEK 21 billion or 0.8 per cent of GDP, or half of the deficit in 2003. This year central government income is expected to increase SEK 27 billion, while expenditure will increase SEK 49 billion. Consequently, the deficit in net lending will increase to SEK 43 billion or 1.6 per cent of GDP. Next year’s deficit is expected to increase to SEK 47 billion. Central government finances will grow stronger in 2007 mainly from a relatively restrictive growth of expenditure and the deficit will decrease to SEK 28 billion, or 1 per cent of GDP (see Table 11.6).
Table 11.6 Central government finances
Billion SEK
| | 2004 | | 2005 | | 2006 | | 2007 | |
Revenue | | 779 | | 806 | | 838 | | 872 | |
Taxes and charges | | 712 | | 730 | | 761 | | 794 | |
Other income | | 67 | | 76 | | 76 | | 78 | |
Expenditure | | 800 | | 849 | | 884 | | 900 | |
Primary expenditure | | 757 | | 797 | | 830 | | 842 | |
Interest | | 43 | | 52 | | 54 | | 58 | |
Net lending | | -21 | | -43 | | -47 | | -28 | |
per cent of GDP | | -0.8 | | -1.6 | | -1.7 | | -1.0 | |
Sources: Statistics Sweden and Ministry of Finance.
Central government budget
The central government’s net lending/borrowing shows the changes in financial wealth caused by transactions. The budget balance shows the central government’s borrowing requirements and therefore reflects the change of central government debt. The difference is that net lending is not affected by the fact that the central government is selling financial assets, such as shares, or increasing lending, such as study support, since this does not change wealth. However, the budget balance and central government debt are affected by such transactions.
In addition to this principal difference, accounting principles for the central government budget differ in several regards from reporting in the National Accounts. The budget balance is reported on a cash basis while the National Accounts apply the accrual method of accounting. This difference mainly affects reporting of taxes and interest expenditure.
The differences in accounting principles referred to above affect the balance and therefore involve differences between the budget balance and net lending. There are also major differences between the central government budget and the National Accounts when reporting revenues and expenditures that do not affect the balance (see above on the expenditure ceiling).
The 2004 budget deficit was SEK 53 billion and this year the deficit is estimated to amount to SEK 39 billion. Thus the budget balance will improve by SEK 14 billion between 2004 and 2005, while net lending will deteriorate by SEK 21 billion. The difference in trend is due in part
69
to the reversal of periodic allocations of interest expenditure and taxes, and because the budget balance, unlike net lending, is strengthened by assumed sales of shares amounting to SEK 15 billion. Other financial transactions have a negative effect on the budget balance, but do not affect net lending. This year the budget balance will decrease because the National Debt Office will take over loans of SEK 12 billion previously reported by the Swedish National Road Administration for financing of investments in the urban regions of Stockholm and Gothenburg. Even for 2006 and 2007 it is assumed that shares will be sold for SEK 15 billion each year (see Table 11.7).
Table 11.7 Central government net lending and budget balance
Billion SEK
| | 2004 | | 2005 | | 2006 | | 2007 | |
Net lending | | -21 | | -43 | | -47 | | -28 | |
Difference between interest accrued and paid | | -16 | | 9 | | 2 | | 3 | |
Effect of timing difference of tax revenue | | -23 | | -3 | | 6 | | -9 | |
Sales of shares | | 0 | | 15 | | 15 | | 15 | |
Other financial transactions | | -3 | | -18 | | -7 | | -6 | |
Other | | 9 | | 1 | | 1 | | 1 | |
Budget balance | | -53 | | -39 | | -30 | | -26 | |
Sources: Statistics Sweden and Ministry of Finance.
Central government debt amounted to SEK 1,213 billion or 47.7 per cent of GDP at the end of 2004. During the forecast period central government debt will increase at the same rate as the budget deficit, but the debt will decrease as a percentage of GDP.
Table 11.8 Budget balance and central government debt
Billion SEK
| | 2004 | | 2005 | | 2006 | | 2007 | |
Revenue | | 694 | | 721 | | 756 | | 779 | |
Expenditure under the ceiling | | 688 | | 697 | | 726 | | 743 | |
Interest expenditure | | 53 | | 35 | | 45 | | 48 | |
Net borrowing etc. | | 7 | | 28 | | 15 | | 13 | |
Budget balance | | -53 | | -39 | | -30 | | -26 | |
per cent of GDP | | -2.1 | | -1.5 | | -1.1 | | -0.9 | |
Debt disposals etc. | | -26 | | 2 | | -2 | | 1 | |
Central government debt | | 1,213 | | 1,254 | | 1,283 | | 1,309 | |
per cent of GDP | | 47.7 | | 47.1 | | 45.9 | | 44.7 | |
Sources: National Debt Office and Ministry of Finance.
11.3 The old-age pension system
The old-age pension system consists of an income-related part and a prefunded part. During the build-up phase of the reformed pension system, income exceeds pensions paid, resulting in savings for both the income-related and the prefunded components of the pension system. In the income-related portion the National Pension Funds serve as a buffer. Alongside the income-related system, an asset base is being built up within a prefunded section of the pension system. The funds allocated since 1995 correspond to earned premium pension rights and are invested initially with the Swedish National Debt Office. During temporary management by the National Debt Office, provisions in the prefunded pension system are included in central government net lending/borrowing, thereby reducing central government debt. Since 2000 funds corresponding to the premium pension rights have been transferred to the Premium Pension Authority (PPM) in the second year after the year of income and invested by the fund manager selected by the individual.
Table 11.9 The old-age pension system
Billion SEK
| | 2004 | | 2005 | | 2006 | | 2007 | |
Revenue | | 216 | | 227 | | 236 | | 245 | |
Contributions | | 173 | | 179 | | 186 | | 192 | |
Premium reserve funds | | 22 | | 23 | | 24 | | 25 | |
Interest and dividends | | 21 | | 24 | | 26 | | 27 | |
Expenditure | | 168 | | 173 | | 180 | | 190 | |
Pensions | | 163 | | 169 | | 177 | | 186 | |
Other | | 5 | | 3 | | 3 | | 4 | |
Net lending | | 48 | | 54 | | 56 | | 55 | |
per cent of GDP | | 1.9 | | 2.0 | | 2.0 | | 1.9 | |
of which | | | | | | | | | |
Pension funds(1) | | 23 | | 26 | | 26 | | 23 | |
Premium pension authority | | 25 | | 28 | | 30 | | 32 | |
(1) The pension funds noted here comprise the distribution part of the old-age pension system
Sources: Statistics Sweden and Ministry of Finance.
In 2004, the balance in the pension system, i.e. the National Pension Funds and the Premium Pension Authority, amounted to SEK 48 billion or 1.9 per cent of GDP. In addition, investment assets in the pension system increased as a result of the rising value of shares, which account for the bulk of assets in both the National Pension
70
Funds and in those funds managed by PPM. Changes in value do not affect net lending, which only includes yields in the form of interest and dividends.
Net lending is expected to remain around 2 per cent of GDP during the forecast period. National Pension Fund net lending will decrease somewhat toward the end of the forecast period, while net lending will continue to increase in the prefunded pension system.
Eurostat decided in 1997 that the entire reformed Swedish pension system would be assigned to the general government sector. The main reasons for the decision were that participation is obligatory and that the central government controls the regulations for both fees and benefits. Eurostat has now changed this decision so defined contribution funded pension systems will not be assigned to the public sector in the National Accounts. Eurostat has granted member countries that currently classify such general pension systems to the public sector a transition period until March 2007 to change the accounting method. For Sweden, this means that general government net lending will be reduced by about 1 per cent of GDP in the National Accounts.
The pension reform involved a redistribution of payment responsibility between the central government budget and the National Pension Fund. Overall, central government budget costs increased as a result of the reform. The pension agreement therefore included reimbursement to the central government budget for the total cost increase. This amount was calculated to SEK 300–350 billion as of 1 January 1999.
In order not to jeopardise the pension system’s financial position, this amount was initially limited to SEK 245 billion, which was transferred between 1999 and 2001 from the National Pension Funds to the central government.
The issue of a possible additional transfer will be investigated during the spring, and the government therefore intends to revisit the issue in the 2006 Budget Bill.
11.4 Local government sector
Local government consumption increased by about 2 per cent annually between 1998 and 2002. This relatively high growth rate contributed to the deficit in net lending and financial result. Consequently the growth rate slowed in 2003 and 2004. Last year consumption increased by only 0.5 per cent in volume. Taking into account that there were more working days than in 2003, calendar-adjusted consumption decreased 0.5 per cent. This development contributed to a considerable improvement in net lending and financial result. Temporary effects explain some of the improvement, but above all, the county councils succeeded in slowing the pace of rapidly increasing expenditures.
The substantial increase in central government grants to the local government sector this year, partly in the form of general employment support together with a good development of the tax base, suggests continued strengthening of local government finances. The average local government tax rate was raised for 2005 by 0.09 percentage points to 31.60 per cent, which is equivalent to about SEK 1 billion in increased income. Because of the strong income growth, local government consumption volume is expected to increase 1.5 per cent this year.
Table 11.10 Local government finances
Billion SEK
| | 2003 | | 2004 | | 2005 | | 2006 | | 2007 | |
Revenue | | 574 | | 593 | | 629 | | 656 | | 677 | |
Taxes and central government grants | | 493 | | 510 | | 545 | | 568 | | 585 | |
per cent of GDP | | 20.2 | | 20.1 | | 20.5 | | 20.3 | | 20.0 | |
Other revenues | | 82 | | 83 | | 84 | | 88 | | 92 | |
Expenditure | | 581 | | 592 | | 621 | | 648 | | 671 | |
Consumption | | 495 | | 509 | | 533 | | 558 | | 580 | |
percentage change in volume | | 0.7 | | 0.5 | | 1.5 | | 1.0 | | 0.5 | |
Other expenditure | | 86 | | 82 | | 88 | | 89 | | 91 | |
Net lending | | -7 | | 2 | | 8 | | 8 | | 5 | |
per cent of GDP | | -0.3 | | 0.1 | | 0.3 | | 0.3 | | 0.2 | |
Financial result | | -1 | | 2 | | 6 | | 6 | | 4 | |
Note: Central government grants and taxes have been combined in the table since the impact of reforms affecting the tax base are neutralized through adjustments in central government grants.
Sources: Statistics Sweden and Ministry of Finance.
71
Income is expected to continue to show good growth in 2006. The average local government tax rate is assumed to remain unchanged, but a good development of the tax base is expected to result in increased tax revenues. Central government grants will increase by SEK 4 billion. In 2006 local government consumption volume is expected to increase by 1.0 per cent. There are fewer working days than the previous year and calendar-adjusted consumption volume is estimated to be almost 0.5 per cent higher. Net lending and the financial result are expected to remain unchanged in relation to 2005.
Even though net lending and the financial result in 2005 and 2006 are expected to be at a significantly higher level than previous years, the financial result in the local government sector is unlikely to reach a level that is consistent with Swedish Local Government Act requirements for good financial management.
Diagram 11.4 Local government finances
Percentage change Billion SEK
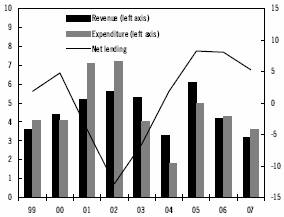
Note: Church parishes have been excluded throughout the period.
Sources: Statistics Sweden and Ministry of Finance.
In 2007 consumption volume is expected to increase by 0.5 per cent, which is somewhat higher than the demographically determined development of demand for local government services.(20)
Price trend for local government consumption
Consumption expenditure accounts for about 85 per cent of expenditures in the local government sector. Local government consumption expenditure, reported net after deductions for charges etc., is largely wage-related, either as direct wages or as purchases of labour-intensive services. Between 2001 and 2003 local government consumption expenditure rose relatively sharply due to comparatively high salary increases within local government operations. Moreover, the implementation of the maximum charge for childcare contributed to a high price trend in 2002 since revenues from fees decreased. Even though salary increases continued to be higher in the local government sector than in the business sector in 2004, the price trend was relatively low last year (see Diagram 11.5). In the local government sector, where many people receive monthly pay, a year with more working days means that a specific production volume can be produced at a lower cost.
Diagram 11.5 Local government consumption expenditure
Percentage change
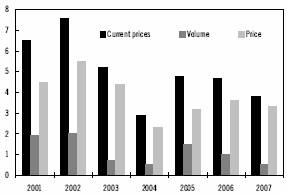
Sources: Statistics Sweden and Ministry of Finance.
This year wages in the local government sector are expected to increase somewhat faster than in the business sector. In the future, local government sector salaries are assumed to develop in line with salaries in the business sector, which will dampen the price trend. In 2006 the price trend is expected to be somewhat higher because there are fewer working days.
(20) The demographically determined increase in demand for local government services is estimated to amount to an average of 0.3 per cent annually during the period up to 2010. During the 2020s the annual growth rate will exceed 1 per cent. This estimate assumes unchanged quality of services expressed as number of working hours per user in each age group.
72
Developments in municipalities and county councils
Net lending in municipalities improved in 2004 by SEK 3 billion to a deficit of SEK 2 billion. The improvement of net lending can largely be explained by substantial sales of real estate. In 2004 municipalities raised taxes by an average of 0.10 percentage points, equivalent to about SEK 1 billion in higher income. Consumption volume increased 1.0 per cent. Adjusted for the number of working days, consumption volume was unchanged in relation to 2003.
The financial result before extraordinary items in municipalities in 2004 is preliminarily estimated at SEK 2.4 billion, which is an improvement of about SEK 1 billion.
The county councils’ net lending strengthened in 2004 with just over SEK 5 billion to SEK 4 billion. The county councils raised the average tax rate by 0.24 percentage points, equivalent to about SEK 3 billion in higher income. Consumption decreased 0.3 per cent, which in calendar-adjusted terms corresponds with a decrease of about 1.3 per cent. Earnings before extraordinary items improved by about SEK 2 billion to almost reach break-even. Compared with 2002, the financial result improved by about SEK 7 billion.
Local government employment
In 2004 employment in the local government sector decreased as a whole by about 2,000 people. The number of jobs in municipalities decreased by about 8,000, while county council jobs increased by about 6,000. Adjusted for de-privatisation(21) in the county councils, however, about 9,000 jobs were lost. The good growth of tax revenues and central government grants this year and next are expected to lead to increased employment in the local government sector. This year the number of jobs are expected to increase by 16,000, including implementation of the sabbatical year programme and a temporary education initiative that account for 9,000 people. In 2006 and 2007, employment is expected to increase by 12,000 and 6,000 jobs, respectively.
11.5 Fiscal policy indicators
An indicator for the surplus target
According to the surplus target, net lending in the general government sector is to amount to 2 per cent of GDP on average over a business cycle. It is difficult to assess whether this target is achieved because it is difficult to establish the length of an economic cycle. This section presents an indicator that helps determine whether the target is met.
Public finances are affected by automatic variation in tax revenues and expenditures over the business cycle. The surplus for any individual year may therefore deviate from 2 per cent of GDP without putting the medium-term target at risk. When there are available resources in the economy, the surplus can be permitted to fall below 2 per cent, and when resource utilisation is above the long-term sustainable level, the surplus should be greater than 2 per cent. This is the reason that the surplus target is stated as an average over a business cycle.
To determine the extent to which net lending during an individual year is in line with the target, net lending can be adjusted for cyclical variations in general government income and expenditures as well as for other types of temporary effects. The adjusted net lending reflects the underlying or “structural” level of net lending.
The structural balance in the general government sector should normally be close to 2 per cent of GDP. When there is a risk of high unemployment or overheating in the economy with high inflation as a result, the automatic stabilisers may need reinforcement through active intervention. A higher or lower structural balance may be necessary in a particular year if net lending for the preceding year deviates substantially from 2 per cent of GDP. A rapid adjustment of public finances towards the target may have an excessively strong impact on demand.
The cyclical adjustment of net lending is based on an assessment of the economic situation as well as on the effects of the economic situation
(21) Huddinge Universitetssjukhus AB was deprivatised on 1 January 2004 and returned to county council administration.
73
Table 11.11 Structural balance in the government sector
Per cent of GDP
| | 2000 | | 2001 | | 2002 | | 2003 | | 2004 | | 2005 | | 2006 | | 2007 | |
Net lending | | 5.0 | | 2.6 | | -0.5 | | -0.1 | | 1.1 | | 0.7 | | 0.6 | | 1.1 | |
Cyclical adjustment | | -1.1 | | 0.3 | | 0.8 | | 0.9 | | 0.6 | | 0.2 | | 0.1 | | 0.0 | |
Structural balance | | 3.9 | | 2.9 | | 0.2 | | 0.8 | | 1.8(1 | ) | 0.9 | | 0.7 | | 1.1 | |
GDP gap | | 0.9 | | -0.5 | | -1.1 | | -1.3 | | -0.9 | | -0.3 | | -0.1 | | 0.0 | |
(1) Partly, the improvement in the structural balance in 2004 is due to that certain firms have reversed all or part of their reserve allocation for taxation.
Sources: Statistic Sweden and Ministry of Finance
on public finances. The economic situation is described by the GDP gap, which constitutes the difference in per cent between actual and potential GDP. The size of the GDP gap is based on an overall assessment of a number of indicators for output, the labour market and for price and wage formation.
Calculations of the cyclical sensitivity of public finances show that a 1 percentage point change in the GDP gap affects net lending by between 0.65 and 0.90 per cent of GDP. Values in the lower part of the range emerge when only the automatic stabilisers are measured. Higher values are obtained when labour market policy is also taken into account. Labour market policy can be regarded as a “semi-automatic” stabiliser, which as a rule is used to stabilise unemployment, even though this presupposes formal decisions.
The Ministry of Finance’s assessment is that, on average, a change in the GDP gap of 1 percentage point affects the surplus in public finances by 0.7 per cent of GDP. Sensitivity varies from year to year depending on how the components of GDP develop in relation to each other. For example, public finances are more sensitive to a change in household consumption, which constitutes an important tax base, than if the business cycle is being affected by international trade. The structural balance is an indicator of the situation in relation to the surplus target for an individual year. It is also the indicator that the Commission uses in its assessments of member states’ public finances within the framework of the EU’s Stability and Growth Pact. However, it should be emphasised that structural balance calculations are uncertain because the estimate of the GDP gap is uncertain, as is the estimate of public finances’ sensitivity to changes in the GDP gap.
Structural balance 2004–2007
General government net lending amounted to 1.1 per cent of GDP in 2004. At the same time the GDP gap is estimated at –0.9 per cent (see Table 11.11), which means that the economy had available resources. Using the rule of thumb described above, the structural surplus is estimated to be 1.8 per cent of GDP. The structural surplus in 2004 was larger than in 2002 and 2003. This year resource utilisation in the economy is expected to increase and the GDP gap is likely to decrease. With net lending somewhat lower the structural balance will therefore be substantially weaker than in 2004. The structural balance is also expected to be less than 2 per cent of GDP in 2006 and 2007.
An indicator for the effects of public finances on demand
Demand in the private sector is affected by changes in public finances. A worsening of net lending in public finances means that taxes and charges are increasing more slowly than public expenditure, which normally strengthens income growth in the private sector. For a variety of reasons, however, the effects on demand are difficult to assess. Households with different propensities to consume react differently to fiscal stimuli. Households with good access to credit are able to smooth out their consumption expenditure in the event of changes in income. For other households, consumption expenditure is affected more directly. There is also some uncertainty as to when the effects arise.
In addition to taxes and transfer payments, which directly affect household income, other public sector activities also have an impact on demand. General government consumption and public investments have a direct impact on demand. Changes in corporate taxation can
74
influence firms’ desire to hire and invest, and changes in capital gains and interest expenditure affect the income flows of households and firms. In contrast, changes in net lending due to changes in transfers abroad, such as foreign aid and the EU contribution, do not affect demand in the Swedish economy.
For fiscal policy to have the desired effects, there must be confidence in the long-term sustainability of public finances. Households become more cautious in their expenditure decisions if the general government deficit is large since the deficit must be financed sooner or later by increases in taxes or cuts in expenditure. On the other hand, consumer confidence may be affected positively when public finances show a substantial surplus. For these reasons, the annual change in net lending constitutes only a rough indicator of the effects of public finances on demand.
The change in general government net lending from year to year can be described using three components that affect the balance:
1. Automatic stabilisers
The automatic stabilisers in public finances make an important contribution to stabilisation policy. High GDP growth means that public finances are strengthened and income growth is slowed in the private sector. This helps limit domestic demand in the economy and reduces the risk of overheating. Conversely, the economy is stimulated when growth is low. The high tax and expenditure ratios in Sweden mean that the effects of the automatic stabilisers are considerable compared with most other countries and that public finances have a comparatively strong moderating effect on swings in the business cycle.
2. Discretionary fiscal policy in the central government budget
The discretionary component of fiscal policy consists of active reform decisions and savings in the central government budget. A summary of previously decided and now proposed or announced reforms is given in Chapter 4 of the Spring Budget Bill. The budget effect relates to the year in which the decisions are implemented, irrespective of when they are taken.
3. Other factors affecting the balance
In addition to discretionary fiscal policy and the automatic stabilisers, public finances are affected by a number of other factors. The composition of growth can have significant effects on general government net lending for individual years. In addition, capital income and interest expenditure are affected by changes in the general government sector’s assets and liabilities, as well as by the level of interest rates. Transfer expenditure is also affected by changes in volume without any direct correlation to the economic situation, such as demographic trends or changes in behaviour. Finally, public finances are affected by developments within the local government sector. An increase in taxes with the aim of restoring balance in local government finances will have a tightening effect on the economy.
The change in general government net lending serves as a rough indicator for the effect of public finances on demand. The change in the structural balance, i.e. the change in net lending that is not due to the automatic stabilisers, is an indicator of fiscal stance. Consequently, this indicator covers not only decisions about reforms and savings in the central government budget, but also factors that affect the balance other than the economic situation that are not the direct result of the business cycle.
Fiscal stance 2004–2007
Table 11.12 shows the change in general government net lending for the years 2004–2007. Fiscal policy, measured as the change in the structural balance, was tightening in 2004. Although the discretionary policy in the central government budget was weakly expansionary, other factors affecting the balance more than offset the budget policy stimulus. Local government finances strengthened in part because of increased taxes. The improvement in net interest also helped strengthen general government finances. Some of this improvement can also be explained by increased tax revenue because some firms reversed all or part of their reserve allocations for taxation. In addition the automatic stabilisers contributed to the tightening, since resource utilisation increased somewhat between 2003 and 2004. All factors considered, general government finances had a tightening effect on the economy despite the
75
expansionary discretionary policy in the central government budget.
This year fiscal policy is expansionary. The weakening of the structural balance is mainly due to the discretionary policy in the central government budget. However, the strongly expansionary budget effect is offset in part by the automatic stabilisers since resource utilisation is continuing to rise. Overall, general government finances are expected to weaken somewhat, which will serve as a stimulus to the economy.
Table 11.12 Fiscal impact
Change in per cent of GDP
| | 2004 | | 2005 | | 2006 | | 2007 | |
Net lending | | 1.2 | | -0.4 | | -0.1 | | 0.5 | |
of which | | | | | | | | | |
Automatic stabilizers | | 0.2 | | 0.5 | | 0.1 | | 0.1 | |
Structural balance | | 1.0 | | -0.9 | | -0.2 | | 0.4 | |
of which | | | | | | | | | |
Discretionary fiscal policy | | -0.4 | | -1.2 | | -0.3 | | 0.0 | |
Net capital income | | 0.4 | | 0.0 | | -0.1 | | -0.1 | |
Other | | 1.0 | | 0.3 | | 0.2 | | 0.5 | |
GDP gap, in percentage point | | 0.4 | | 0.6 | | 0.2 | | 0.1 | |
Sources: Statistic Sweden and Ministry of Finance
Next year resource utilisation in the economy will continue to rise. Employment will increase and unemployment will decrease. The automatic stabilisers will strengthen public finances somewhat during the economic upswing. Meanwhile, the automatic tightening measures will be more than offset by a continued expansionary fiscal policy. Net lending will therefore be somewhat weakened compared with 2005 and the impact on demand in the economy will be weakly expansionary.
In 2007 net lending will improve by 0.5 per cent of GDP. In part, this strengthening is due to the gradual improvement of the economy, but mainly to the strengthening of the structural balance.
76
12 Alternative scenarios
To illustrate the uncertainty associated with the projections underlying the base scenario presented in Chapters 1–11, this chapter presents two alternative scenarios.
In the low-growth scenario, demand for US government bonds is assumed to fall. This could be a result of Asian central banks becoming less willing to buy US assets. This leads to a substantial drop in the value of the dollar, and US interest rates rise. The consequence for Sweden is lower economic growth than in the base scenario due to exports slowing as a result of slower global growth and a stronger krona.
In the high-growth scenario, the labour market and wage formation are assumed to function much better than in the base scenario. This means that there are more available resources in the economy, and so growth can be higher without pushing up inflation.
12.1 The base scenario
In the base scenario, GDP growth averages 2.6 per cent during the period 2005–2008. The GDP gap – the difference between actual and potential GDP – closes in 2007, and unemployment falls gradually to 4.2 per cent. The projections for 2008 in the base scenario can be viewed as an illustration where the economy develops in line with the long-term trend. The regular employment rate in 2008 is 77.4 per cent.
Table 12.1 Selected statistics, base scenario
Percentage change unless otherwise stated
| | 2004 | | 2005 | | 2006 | | 2007 | | 2008 | |
GDP | | 3.5 | | 3.2 | | 2.7 | | 2.4 | | 2.2 | |
Market growth for Swedish exports(1) | | 8.3 | | 8.1 | | 7.9 | | 7.6 | | 7.4 | |
CPI, annual average | | 0.4 | | 0.5 | | 1.5 | | 2.0 | | 2.0 | |
TCW index, | | 122 | | 121 | | 121 | | 121 | | 121 | |
Regular employment rate(2) | | 77.0 | | 76.8 | | 77.1 | | 77.3 | | 77.4 | |
Open unemployment(3) | | 5.5 | | 5.0 | | 4.4 | | 4.2 | | 4.2 | |
General government net lending(4) | | 1.1 | | 0.7 | | 0.6 | | 1.1 | | 1.4 | |
Central government debt(4) | | 47.7 | | 47.1 | | 45.9 | | 44.7 | | 43.3 | |
(1) Market growth for Swedish exports, i.e. growth in the trade-weighted demand for processed goods encountered by Swedish exporters.
(2) Number of employed in the age group 20-64, excluding those employed in labour market policy programmes, per cent of population 20-64.
(3) Per cent of labour force.
(4) Per cent of GDP.
Sources: Statistics Sweden and Ministry of Finance.
The general government sector’s revenue and expenditure have been projected through to 2008 using the same principles as the calculations for 2006 and 2007. This means that the projections are based on current rules and the consequences of decisions taken and measures announced. The projections suggest that both revenue and expenditure continue to fall relative to GDP, and that the net lending rises to 1.4 per cent of GDP in 2008.
12.2 The low-growth scenario
The large US current account deficit – around 6 per cent of GDP at the beginning of 2005 – is a risk factor in the forecast. In this alternative scenario it is assumed that foreign demand for US government bonds falls off at the end of 2005. The reason why demand slackens may, for example, be that Asian central banks – the largest buyers of US government bonds – want to reduce their exposure to the dollar by reducing the proportion of dollar assets in their reserves.
The decreased demand for US assets means that both long-term and short-term interest rates rise in the US money market. The dollar also depreciates as a result of the lower demand for bonds, although this is offset to some extent by the higher US interest rates. Altogether, it is assumed that the dollar falls by around 25 per cent against other currencies. The weakening of the dollar also entails a certain inflationary impulse, which means that US interest rates are pushed up further by mounting inflation expectations.
The high interest rates dampen household consumption and investment in the United States, but also contribute to an increase in domestic saving and the beginnings of an improvement in the current account.
The depreciation of the dollar has an expansionary effect on US exports and so also on economic growth. However, this positive effect is less than the negative impulse from the higher interest rates. US GDP growth therefore slows relatively sharply. Inflation rises initially as a result of higher import prices but is then checked by the lower level of activity.
For Sweden, the depreciation of the dollar results in the appreciation of the krona, which dampens economic growth. The krona, which is
77
assumed to rise in line with the euro, gains around 7 per cent in TCW trade-weighted terms in 2006 relative to the base scenario before falling back somewhat. At the same time export demand falls as a result of lower growth in the rest of the world – for example, growth in the euro area falls on account of the weaker dollar. Altogether, world market growth for Swedish exports is 1.7 percentage points lower than in the base scenario in 2006 and remains relatively weak in 2007 and 2008.
Investment in bonds is to some extent steered away from the United States, which tends to push down interest rates in Sweden and elsewhere. The reduced inflationary pressure resulting from lower import prices and lower resource utilisation also provides scope for the Riksbank to lower its repo rate. Despite reductions in the repo rate, inflation is low throughout the period.
Table 12.2 Selected statistics, low-growth scenario
Percentage change unless otherwise stated
| | 2004 | | 2005 | | 2006 | | 2007 | | 2008 | |
GDP | | 3.5 | | 3.2 | | 1.5 | | 2.0 | | 2.0 | |
Market growth for Swedish exports(1) | | 8.3 | | 8.1 | | 6.5 | | 6.1 | | 6.6 | |
CPI, annual average | | 0.4 | | 0.5 | | 0.1 | | 0.6 | | 1.2 | |
TCW index, | | 122 | | 113 | | 114 | | 115 | | 116 | |
Regular employment rate(2) | | 77.0 | | 76.8 | | 76.4 | | 76.5 | | 76.5 | |
Open unemployment(3) | | 5.5 | | 5.0 | | 5.1 | | 5.0 | | 5.0 | |
General government net lending(4) | | 1.1 | | 0.7 | | 0.1 | | 0.4 | | 0.4 | |
Central government debt(4) | | 47.7 | | 47.1 | | 46.8 | | 46.9 | | 47.0 | |
(1) Market growth for Swedish exports, i.e. growth in the trade-weighted demand for processed goods encountered by Swedish exporters.
(2) Number of employed in the age group 20-64, excluding those employed in labour market policy programmes, per cent of population 20-64.
(3) Per cent of labour force.
(4) Per cent of GDP.
Sources: Statistics Sweden and Ministry of Finance.
The effects of weaker global economic growth and the appreciating krona take the form of sharply reduced export growth. This in turn leads to lower investment, a weaker labour market and lower real disposable incomes. Household consumption is therefore lower than in the base scenario. However, the consequences for investment and household consumption are alleviated by the lower interest rates. Altogether, GDP growth falls to 1.5 per cent in 2006 and remains lower than in the base scenario in 2007 and 2008 (see Table 12.2). The labour market performs less well, and the regular employment rate is 0.9 percentage points lower than in the base scenario in 2008.
Public finances
The weaker economic climate undermines public finances. Reduced tax bases in the form of wages and household consumption erode the general government sector’s revenue from taxes and charges. Higher unemployment pushes up expenditure in real terms relative to the base scenario. The general government sector’s net lending is much lower than in the base scenario. Despite higher unemployment, expenditure covered by the expenditure ceiling is lower than in the base scenario after a couple of years once the effects of lower wages and prices have their full impact. However, expenditure is higher as a proportion of GDP.
In the base scenario, central government debt continues to fall as a proportion of GDP. In the low-growth scenario, the debt ratio stabilises at a level unchanged from 2005. This less favourable outcome is due to both an increased central government borrowing requirement and a lower level of GDP.
Local government sector finances also come under pressure. However, the negative effects on the tax base are limited due to the fact that the reduction in wage income is partly offset by increased unemployment benefit payments. Moreover, the local government tax base includes stabilising factors such as old-age pensions and other forms of transfer income which are not directly affected by lower growth in the economy. In addition, the lower rate of growth in wages in the low-growth scenario is assumed to apply to local government employees’ as well. Together with lower prices for consumable goods, this means that growth in expenditure will slow substantially. The sector’s financial surplus will therefore be roughly the same as in the base scenario without local government having to cut back on volumes of activity.
78
12.3 The high-growth scenario
The high-growth scenario assumes that the labour market and wage formation function better than in the base scenario. Open unemployment is assumed to hold permanently at a lower level without the labour market overheating. Employment and output can then grow faster than in the base scenario without prices and wages rising at an unsustainable rate. GDP grows at an average of around 3.4 per cent in the period 2005–2008, and GDP is just over 3 per cent higher than in the base scenario in 2008. Employment is higher by more than 140,000 people, and the government’s employment target is reached in 2008. Productivity and average hours worked are assumed to be slightly lower because the additional labour is not expected to show the same levels of productivity and average hours worked as the average in the base scenario. Unemployment falls to 3.5 per cent in 2008.
For employment to be able to grow as rapidly as assumed in the high-growth scenario, the supply of labour must be substantially greater than in the base scenario. The number of people in various types of education is therefore assumed to be lower in the years ahead. The proportion of people on long-term sick leave and in early retirement is also assumed to be lower than in the base scenario. There is also a need for other groups outside the labour force, such as those not actively seeking employment despite being both able and willing to work, to increasingly enter the labour market.
Table 12.3 Selected statistics, high-growth scenario
Percentage change unless otherwise stated
| | 2004 | | 2005 | | 2006 | | 2007 | | 2008 | |
GDP | | 3.5 | | 3.7 | | 3.6 | | 3.2 | | 3.2 | |
CPI, annual average | | 0.4 | | 0.5 | | 1.5 | | 2.0 | | 2.0 | |
Regular employment rate(1) | | 77.0 | | 77.1 | | 78.2 | | 79.1 | | 80.0 | |
Open unemployment(2) | | 5.5 | | 4.8 | | 4.0 | | 3.5 | | 3.5 | |
General government net lending(3) | | 1.1 | | 1.0 | | 1.5 | | 2.5 | | 3.5 | |
Central government debt(3) | | 47.7 | | 46.7 | | 44.4 | | 42.0 | | 38.9 | |
(1) Number of employed in the age group 20-64, excluding those employed in labour market policy programmes, per cent of population 20-64.
(2) Per cent of labour force.
(3) Per cent of GDP.
Sources: Statistics Sweden and Ministry of Finance.
The higher economic growth is driven above all by stronger domestic demand. Stronger employment growth leads to better growth in household income and so faster growth in household consumption. The strong domestic demand also means that firms step up investment to handle rapidly rising output.
Public finances
The higher economic growth and employment in the private sector strengthen public finances. Tax bases grow and public transfer payments to households in the form of unemployment benefits, sickness benefits, disability pensions and so on fall as more people enter employment. Since the increase in GDP is permanent due to a better functioning labour market, the strengthening of public finances is also permanent. Structural net lending is therefore also higher than in the base scenario.
These projections assume that the improvement in public finances is not utilised for reforms at either central or local government level. The financial performance of the local government sector will therefore be substantially better than in the base scenario. The sector’s financial surplus averages just over SEK 10 billion during the period 2006-2008, which corresponds to around 2 per cent of net expenditure.
Central government finances also strengthen substantially in the high-growth scenario. The fact that the economic growth is to some extent consumption-led means that central government revenue from indirect taxation grows strongly. Central government debt in 2008 is SEK 100 billion lower than in the base scenario, corresponding to just over 3 per cent of GDP. The higher GDP itself also means that the debt ratio will fall. The debt ratio in 2008 is 4.5 percentage points lower than in the base scenario, and well below 40 per cent of GDP.
Altogether, public finances strengthen to a surplus of 3.5 per cent of GDP at the end of the forecast period.
79
13 Evaluation of forecasts
The Ministry of Finance’s forecasts serve as a basis for the central government budget and for the formulation of the government’s economic policy. Economic policy is to a great extent target-driven, and several of the government’s stated targets – such as the employment target and the target of a surplus in general government net lending – are related to macroeconomic developments. The accuracy of these forecasts is therefore of great importance. One key element in improving the accuracy of the forecasts is the evaluation of previous forecasts. This chapter discusses how the four forecasts for 2004 published by the Ministry of Finance in 2003 and 2004 compare with the preliminary outcome published by Statistics Sweden on 8 March 2005. In line with previous forecast evaluations, the Ministry of Finance’s forecasts are also compared with those of other economic analysts. Unlike previous forecast evaluations, there is also an analysis of forecast revisions compared to the previous forecast. The aim of this comparison is to justify these forecast revisions to the reader.
13.1 The Ministry of Finance’s forecasts
The National Accounts have published a preliminary outcome for GDP in 2004 which may subsequently be revised. According to this preliminary outcome, GDP grew by 3.5 per cent in 2004. With certain exceptions, the forecast errors for demand, output and other key figures have decreased as the forecast horizon has grown shorter and more information has become available (see Table 13.1). GDP growth was underestimated in the forecasts made in 2003 and spring 2004, but the forecast made in autumn 2004 was in line with the preliminary outcome. Unemployment in 2004 was underestimated in the forecasts made in 2003, but the forecasts made in 2004 were in line with the outcome. Inflation measured as the change in the CPI was overestimated in the forecasts made in 2003, but the forecasts made in 2004 were relatively accurate.
GDP forecasts made in 2003
The first signs of recovery in the global economy were seen back in 2002, but the strength of the recovery was underestimated in the forecasts made in 2003. Note, however, the uncertainty then associated with the economic outlook in the light of the outbreak of the SARS epidemic and the war in Iraq. Indicators also suggested that order and output growth in Sweden were slowing, which explains the downward revision of the forecast for industrial output in autumn 2003. However, no appreciable deterioration in the investment climate was anticipated relative to the forecast made five months earlier. The growing international demand was expected to lead to the expansion of production capacity. With hindsight it can be seen that the turning point in investment was correctly predicted. The underestimation of the strength of the upswing in investment was due primarily to unexpectedly strong growth in housing investment.
Table 13.1 Ministry of Finance’s forecasts and outcome for 2004
Percentage change unless otherwise stated
| | Spring
2003 | | Autumn
2003 | | Spring
2004 | | Autumn
2004 | | Outcome
2004 | |
GDP | | 2.4 | | 2.0 | | 2.5 | | 3.5 | | 3.5 | |
| | | | | | | | | | | |
Household cons. | | 2.2 | | 2.1 | | 2.0 | | 2.4 | | 1.8 | |
Gen. gov. cons. | | 0.2 | | 0.4 | | 1.3 | | 0.9 | | 0.3 | |
Gr. fixed cap. f. | | 2.9 | | 2.8 | | 1.5 | | 3.2 | | 5.1 | |
Change in stocks(1) | | 0.0 | | 0.1 | | -0.2 | | -0.1 | | -0.3 | |
Exports | | 7.0 | | 5.4 | | 7.4 | | 8.8 | | 10.2 | |
Imports | | 6.0 | | 5.4 | | 5.7 | | 5.9 | | 6.7 | |
| | | | | | | | | | | |
Ind. Production | | 5.0 | | 3.5 | | 4.3 | | 9.0 | | 9.1 | |
Number of empl. | | 0.3 | | 0.1 | | -0.6 | | -0.6 | | -0.5 | |
Productivity | | 1.9 | | 1.5 | | 1.9 | | 2.5 | | 2.8 | |
Number of empl. | | 0.2 | | 0.4 | | 1.1 | | 1.6 | | 1.3 | |
Op. unempl.(2) | | 4.3 | | 4.7 | | 5.5 | | 5.6 | | 5.5 | |
CPI | | 1.8 | | 1.3 | | 0.4 | | 0.6 | | 0.5 | |
Repo rate(3) | | 4.00 | | 3.25 | | 2.00 | | 2.00 | | 2.00 | |
GDP, world | | 4.0 | | 4.0 | | 4.4 | | 4.7 | | 4.9 | (4) |
(1) The change in volume is calculated as per cent of last year’s GDP.
(2) Per cent of the labour force.
(3) Repo rate at year-end.
(4) For some countries the outcome is forecast.
At the time the Government Budget Bill for 2004 was published in autumn 2003, uncertainty about the future, combined with an actual slowdown in international demand, resulted in the downward revision of the forecast for export growth. The outlook for exports of telecommunication equipment in particular had deteriorated. This expectation of weaker export growth was also the single most important
80
reason why Swedish GDP growth was underestimated to a greater degree in the autumn 2003 forecast than in the Spring Fiscal Policy Bill earlier that year (see Table 13.1). However, the downturn was to prove short-lived. During the latter part of 2003 a number of confidence indicators began to rally and industrial activity improved. However, this came too late to be picked up in the calculations behind the autumn 2003 forecast.
GDP forecasts made in 2004
At the time of the 2004 Spring Fiscal Policy Bill, global GDP growth was expected to be high. The export outlook therefore seemed brighter, and the contribution from foreign trade to GDP growth was expected to be higher than in the forecasts made in 2003. The Spring Fiscal Policy Bill also drew attention to the significant calendar effects in 2004. This meant that the general government sector’s contribution to economic growth was estimated to be 0.3 percentage points, compared with 0.1 percentage points in the two previous forecasts. Mainly on the strength of these factors, GDP growth for 2004 was revised upwards to 2.5 per cent in the Spring Fiscal Policy Bill.
At the time of the Government Budget Bill for 2005 the following autumn, new outcomes had revealed surprisingly good economic performance in 2004. Industrial activity had grown strongly, and the export outlook was revised further upwards. It was also noted that recent years’ downward trend in investment had been reversed. GDP was forecast to grow by 3.5 per cent in 2004, which is in line with the preliminary outcome.
Labour market forecasts
At the time of the 2003 Spring Fiscal Policy Bill, indicators suggested relatively subdued demand for labour. However, a stronger economic climate was expected to lead to rising employment in 2004. In autumn 2003 both outcomes and indicators were still weak, and a significant increase in output was expected to arrive later than previously assumed. The turning point in the labour market was not expected until the second half of 2004. Measured as an annual average, employment was forecast to be largely unchanged in 2004, and open unemployment to hold at 4.7 per cent.
At the time of the 2004 Spring Fiscal Policy Bill, the weak labour market situation had become increasingly clear. Employment was continuing to fall. The downturn encompassed not only industry but also several other sectors, including the public sector. In the economy as a whole, employment was expected to fall by 0.6 per cent and unemployment was forecast to be 5.5 per cent.
By autumn 2004 increasingly clear signs of a strong general economic recovery could be seen. Activity in the economy was higher than anticipated, and the GDP forecast was revised upwards. However, the increased output had been achieved through higher average hours worked and productivity but the demand for labour was still subdued. The forecast for the labour market in the Government Budget Bill was therefore not revised significantly from the forecast the previous spring.
The outcome turned out to be closely in line with the forecasts made in 2004, although unemployment including participants in labour market policy programmes was slightly higher than predicted in 2004.
Inflation forecasts
Year-on-year inflation in 2004 was overestimated by 0.8 and 1.3 percentage points respectively in the two forecasts made in 2003. These forecasts also assumed that underlying inflation would grow at a relatively rapid rate in 2004. These forecast errors can be attributed mainly to the utilisation of resources being overestimated. The stronger economic growth anticipated in 2004 was expected to lead to rising employment in the 2003 forecasts.
The forecasts made in 2004 were much more accurate. At the time of the 2004 Spring Fiscal Policy Bill, inflation was underestimated by just 0.1 percentage points. However, in the Budget Bill for 2005 that autumn the forecast was revised upwards due to various temporary effects at the end of 2004 being overestimated. Overall, the forecast errors in the two forecasts of 2004 were due mainly to two related factors: the overestimation of domestic price pressure and the underestimation of the impact of falling prices for many imported goods.
81
13.2 Comparison with other forecasters
One way of evaluating the Ministry of Finance’s forecasts is to compare the forecast errors made by various forecasters for a number of key variables. This kind of comparison does have its limitations, and can easily be misleading. For example, forecasts are published at different times, which means that forecasters do not have access to the same information. This is particularly obvious when high-frequency variables such as inflation and unemployment are analysed, and when forecasters have access to particularly important information, such as new outcomes from the National Accounts. However, an attempt has been made to minimise this problem in the present comparison by basing it on forecasts published at more or less the same time.
In several cases, the forecast assumptions also vary between forecasters. For example, the Ministry of Finance bases its forecasts on economic policy measures already decided on or proposed in the bill itself. Other forecasters make explicit assumptions about future economic policy. These differences are not taken into account when comparing the forecasts. Despite these difficulties, a comparative analysis can still provide an indication of the accuracy of the various economic analysts, and perhaps also of the margin of error that can be considered normal. Ranking the various forecasters is not the aim.
Diagram 13.1 presents the forecast errors for GDP growth, inflation and unemployment for 2004 for a selection of forecasters. Compared with previous years, the forecast errors for GDP growth appear to be relatively large. On average, GDP growth in 2004 was underestimated by around 0.9 percentage points. By way of comparison, the average margin of error for 2003 was 0.5 percentage points. However, viewed over a slightly longer period, the forecast errors for GDP growth in 2004 are not particularly remarkable: during the period 1990-2003 the average margin of error was around 0.8 percentage points in absolute terms. GDP growth was generally underestimated in the forecasts made in 2003 and in those made in spring 2004.
Diagram 13.1 Average absolute forecast errors for 2004
Percentage points
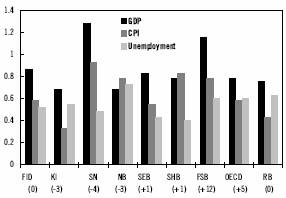
Note: The average errors are based on four forecasts for 2004, i.e. spring and autumn 2003 and spring and autumn 2004. Figures within parenthesis show the timing of respective forecasters publication in relation to Ministry of Finance. Forecasters: Ministry of Finance (FiD), Föreningssparbanken (FSB), Swedish Research Institute of Trade (HUI), National Institute of Economic Research (KI), Swedish Trade Union Confederation (LO), Nordea (NB), the Riksbank (RB), SEB Bank (SEB), Handelsbanken (SHB) and Confederation of Swedish Enterprises (SN).
Sources: NIER, Statistics Sweden and Ministry of Finance.
All forecasters underestimated unemployment in 2004 in the forecasts made in 2003. In the forecasts made in 2004, the picture was more mixed. Overall, the forecast errors for unemployment can be viewed as relatively large by historical standards.
Inflation in 2004 was generally overestimated in the forecasts made in 2003, but the accuracy of the inflation forecasts made in 2004 was good. However, the substantial forecast errors in the forecasts made in 2003 push up the average forecast errors for inflation in 2004. Absolute forecast error for 2004 averaged 0.7 percentage points. During the period 1999-2003 absolute forecast errors averaged 0.4 percentage points.
Comparing forecasters on the basis of just one outcome year is naturally unreliable. Table 13.2 therefore shows developments in forecast errors for GDP growth in recent years in the form of a five-year moving average. In the latest five-year period, GDP growth was misjudged by an average of 0.8 percentage points. The major forecast errors for 2001 have significantly inflated the average.
82
Table 13.2 Average absolute forecast error for GDP growth
Percentage points, five year moving average
| | 1999 | | 2000 | | 2001 | | 2002 | | 2003 | | 2004 | |
FID | | 0.6 | | 0.6 | | 0.7 | | 0.7 | | 0.8 | | 0.8 | |
KI | | 0.5 | | 0.5 | | 0.7 | | 0.7 | | 0.8 | | 0.8 | |
SN | | 0.7 | | 0.7 | | 0.9 | | 0.9 | | 1.0 | | 1.0 | |
Nordea | | 0.5 | | 0.5 | | 0.7 | | 0.8 | | 0.8 | | 0.8 | |
SEB | | 0.5 | | 0.5 | | 0.6 | | 0.7 | | 0.7 | | 0.7 | |
SHB | | 0.6 | | 0.6 | | 0.9 | | 0.9 | | 1.0 | | 1.0 | |
FSB | | 0.6 | | 0.6 | | 0.8 | | 0.7 | | 0.7 | | 0.8 | |
Average | | 0.6 | | 0.6 | | 0.8 | | 0.8 | | 0.8 | | 0.8 | |
Naive | | 1.0 | | 0.9 | | 1.0 | | 1.1 | | 0.9 | | 1.2 | |
Potential | | 1.0 | | 1.1 | | 1.1 | | 1.0 | | 0.9 | | 0.9 | |
Note: Four forecasts per forecast year. Thus the 2003 moving average includes 20 forecasts, showing the absolute forecast error made between 1999 and 2003 in spring and autumn regarding the same year.
Sources: NIER, Statistics Sweden, Ministry of Finance.
All forecasters are substantially more accurate than a “naive” forecast where the forecast for year t is simply the same as the outcome for the previous year t-1.
The forecasters generally also produce better predictions than a forecast where the economy simply mirrors its potential growth, defined in this case as GDP growth of 2 per cent for all years. Nevertheless, in periods with relatively small cyclical fluctuations (such as 2002 and 2003), forecast errors would have been smaller if the forecasters had assumed that the economy would mirror its potential growth. However, their forecasts for 2004 were substantially more accurate than this type of forecast.
With the exception of the Confederation of Swedish Enterprise, most forecasters seem to have a tendency to systematically overestimate GDP growth (see Diagram 13.2). This applies to both forecasts since the turn of the millennium and those over the slightly longer term. It can also be noted that the differences between the forecasters are small. One reason for this is that forecasters have access to the same information and interpret this information similarly. However, the tendency to systematically overestimate GDP growth is believed to have diminished somewhat over time, as can be seen in Diagram 13.2.
Diagram 13.2 Average error
Percentage points
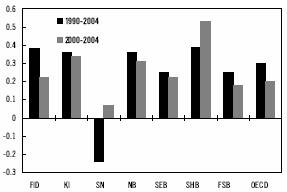
Note: The average includes the errors made for each year in the two periods (1990-2004 and 2000-2004).
Source: NIER, Statistics Sweden and Ministry of Finance
13.3 Comparison with previous forecast
Since the Government Budget Bill for 2005 was published last autumn, the forecast for Swedish GDP growth in 2005 has been revised upwards from 3.0 per cent to 3.2 per cent. This upward revision is due above all to the expectation that investment growth will be stronger than previously anticipated.
Due to an unexpectedly weak second half of 2004, the forecast for household consumption in 2005 has been revised downwards from 2.7 per cent to 2.2 per cent. This downward revision is due to consumption volumes at the beginning of 2005 being lower than predicted in the previous forecast. The forecast for unemployment and participants in labour market policy programmes is also now slightly higher, thus contributing to weaker consumption growth.
General government consumption is forecast to grow by 1.2 per cent this year, compared with 0.8 per cent in the Government Budget Bill for 2005. A slower price trend than assumed in the previous forecast has contributed to a higher rate of growth in central government consumption expenditure in fixed prices now being anticipated.
Continued high capacity utilisation in industry, continued good demand for Swedish products and favourable financial conditions mean that investment growth this year is expected to be stronger than forecast in the Government Budget Bill. Industrial investment in machinery, investment in energy and housing
83
investment are among the areas expected to grow more strongly in 2005.
The outlook for export growth in 2005 has been revised downwards from 7.5 per cent in the previous forecast to 6.9 per cent. Growth in exports of goods has been revised downwards by 1.4 percentage points, while growth in exports of services has been revised upwards by 2.4 percentage points. Exports of goods are not expected to grow as strongly as assumed in the previous forecast, mainly as a result of the weaker outcomes for exports during the second half of 2004 and lower world market growth than assumed in the Government Budget Bill. The upward revision of growth in exports of services is due to the surprisingly strong outcomes for the second half of 2004.
The outlook for import growth in 2005 has been revised upwards somewhat from 7.4 per cent in the Government Budget Bill to 7.9 per cent in the Spring Fiscal Policy Bill. This upward revision is the result of very strong import growth at the end of 2004, which meant that levels at the beginning of 2005 were higher than previously forecast.
The labour market forecast in the Government Budget Bill has stood up relatively well in relation to the additional information becoming available since then, and so only marginal revisions have been made. Open unemployment is forecast to be slightly lower this year than predicted in the Government Budget Bill. At the same time the number of participants in labour market policy programmes is assumed to be 121.000, which means 10.000 more people with employment support than previously anticipated.
Hours worked grew surprisingly slowly towards the end of 2004, and so the forecast for hours worked has been revised slightly downwards. Average hours worked is therefore also assumed to be lower this year than previously forecast.
The forecast for wage growth in 2005 is unchanged from the Government Budget Bill at 3.5 per cent.
Inflation during the period November-February was lower than predicted in the previous forecast. Although this can to some extent be explained by temporary factors, the outcomes suggest that the forecast in the Government Budget Bill overestimated the underlying price trend in the Swedish economy. The inflation forecast for 2005 has therefore been revised downwards relatively sharply. The forecast for CPI inflation has been revised further downwards than the UND1X forecast on account of the change in the interest rate forecast.
The low inflationary pressure in the coming years means that the Riksbank is currently not expected to raise its interest rates in 2005, as was assumed in the Government Budget Bill.
Table 13.3 Ministry of Finance’s forecasts for 2005 in the Government Budget Bill for 2005 and the Spring Fiscal Policy Bill for 2005
Percentage change unless otherwise stated
| | BP05 | | VÅP05 | |
Sweden | | | | | |
GDP | | 3.0 | | 3.2 | |
Household consum. | | 2.7 | | 2.2 | |
Gen. gov. consum. | | 0.8 | | 1.2 | |
Gr. fixed capital | | 4.0 | | 7.1 | |
Exports | | 7.5 | | 6.9 | |
Imports | | 7.4 | | 7.9 | |
Number of employed | | 0.8 | | 0.8 | |
Av. hours worked | | 1.0 | | 0.6 | |
Op. unemployment(1) | | 5.1 | | 5.0 | |
Wages | | 3.5 | | 3.5 | |
Net lending in general government,% of GDP(2) | | 0.6 | | 0.7 | |
CPI, annual average | | 1.4 | | 0.5 | |
Repo rate(3) | | 3.00 | | 2.00 | |
TCW-index(4) | | 123 | | 121 | |
United States | | | | | |
GDP | | 3.5 | | 3.7 | |
Unemployment | | 5.1 | | 5.1 | |
Euro area | | | | | |
GDP | | 2.2 | | 1.6 | |
Unemployment | | 8.8 | | 9.0 | |
(1) Per cent of labour force.
(2) Per cent of GDP.
(3) Repo rate at year-end.
(4) TCW-index at year-end.
The TCW index is currently forecast to be 121 at the end of 2005, compared with 123 in the Government Budget Bill. This expectation of a stronger krona in trade-weighted terms is partly because the krona is now expected to strengthen slightly more against the euro, to 8.90 rather than 9.00. The dollar is also expected to depreciate further against the krona, to 6.50 rather than 6.92.
In the forecast for general government net lending, both revenue and expenditure have been
84
revised downwards, partly as a result of lower inflation and lower interest rates. Net lending in 2005 has been revised upwards by SEK 2 billion.
The forecast for US GDP growth in 2005 has been revised upwards, mainly as a result of stronger growth in household consumption. The forecast for unemployment in the United States is unchanged from the Government Budget Bill.
The Government Budget Bill assumed stable GDP growth in the euro area during the second half of last year. The weak growth seen towards the end of the year means that the growth forecast for 2005 has been revised downwards, and unemployment is expected to be higher than in the previous forecast.
85
Appendix 2
Sweden’s Economy

Appendix 2
Sweden’s Economy
Contents
3
Sweden’s Economy
Foreword
This appendix to the Government Budget Bill for 2006 presents the Ministry of Finance’s forecast of global and Swedish economic developments in 2005 and 2006. It also contains estimates of developments in 2007 and 2008.
The forecast is based on data from Statistics Sweden, the European Commission and the National Institute of Economic Research (NIER), among others. The Ministry of Finance is, however, wholly responsible for the assessments presented here. Henrik Braconier, Director at the Ministry of Finance, is responsible for the forecast. This appendix takes account of information available on 13 September 2005.
1 Overview
The global economy is expected to grow by just over 4 per cent both this year and in 2006. Low interest rates, high corporate earnings and a stronger labour market mean that both investment and household consumption are driving growth globally. Inflationary pressure is expected to remain subdued. However, the global risk picture is not balanced and there is a significant risk of slower growth if oil prices do not fall back as expected.
The Swedish economy is forecast to grow by 2.4 per cent this year. Export growth has slowed sharply but is still expected to make a relatively large contribution to GDP growth again this year. However, domestic demand will play an increasing role in growth in 2005 and 2006. Investment, which began to grow strongly in 2004, is expected to continue to grow at a rapid rate this year. Growth in household consumption will increase somewhat this year, partly as a result of expansionary monetary policy and gradual improvement in the labour market. GDP growth is forecast to be 3.1 per cent in 2006, due in part to rapidly growing household consumption.
The situation in the labour market is set to improve. Employment is forecast to increase by 0.1 per cent this year and 1.3 per cent in 2006. Unemployment will fall gradually as a result of increasingly strong domestic demand and expanded labour market policy programmes. Measured as an annual average, unemployment will be 5.9 per cent this year before falling to 4.8 per cent in 2006.
Inflationary pressure in the Swedish economy remains low, due partly to low resource utilisation. CPI inflation is forecast to average 0.3 per cent this year and 1.5 per cent in 2006.
Public finances continue to show a surplus. General government net lending is expected to be 1.4 per cent of GDP this year and 0.7 per cent in 2006.
1.1 International conditions
Having been very strong during the first half of 2004, world economic growth began to slow during the second half of the year. The reasons for the slowdown included rising oil prices and gradually less expansionary economic policy. However, low inflation, still expansionary monetary policy, continued low bond yields and rising asset prices suggest strong growth in demand in the time ahead. Rising employment in the United States and Japan, among others, is also contributing to favourable growth in real income and, as a result, household demand.
9
Altogether the global economy is forecast to grow by just over 4 per cent in both 2005 and 2006.
High oil prices are slowing global growth, but the global economy still appears to be able to continue to grow rapidly, and without clear inflationary tendencies. There are several differences to previous oil spikes. For example, today’s high oil prices are largely a result of rapid growth in the global economy rather than a reduction in the supply of oil. In addition the OECD countries are substantially less oil-dependent than 25 years ago. Furthermore productivity growth is rapid and confidence in monetary policy is strong. However, if oil prices do not fall back as expected from the high levels seen this summer, there is an immediate risk of weaker growth in the global economy. Supply disturbances in the oil market also present a considerable risk for global and Swedish economic developments in the time ahead.
The US economy has continued to grow strongly this year. Although a decreasingly expansionary economic policy and high oil prices have put a damper on the economy, these negative demand-side factors are being offset by rising employment, growing household wealth and continued low long-term interest rates. The slowdown from last year’s high GDP growth of 4.2 per cent in the United States is therefore expected to be relatively modest. Growth is forecast to be 3.6 per cent this year and 3.4 per cent in 2006. So far the favourable rate of growth has led to only a moderate increase in inflation. The reasons for this include productivity continuing to grow relatively strongly and, as a result, resource utilisation not having risen worryingly fast. Prices are expected to continue to rise at a balanced rate.
The euro area economy has performed weakly since 2001, but the summer brought several signs of a tentative recovery; for example, industrial output has improved in recent months. Growing domestic demand is expected to lead gradually to stronger growth. However, the upswing will be weak as household consumption is growing only moderately. This is due partly to weak income growth and subdued employment growth. Investment and exports are nevertheless expected to grow fairly strongly. Growth in the euro area is forecast to be just 1.3 per cent this year before rising to 1.8 per cent in 2006. Persistently high unemployment and a rate of inflation persistently above the European Central Bank’s target suggest that the euro area as a whole is battling with structural problems.
Growth for Sweden’s Nordic neighbours and in the UK is expected to remain favourable, due primarily to strong growth in domestic demand. Japanese growth seemed to pick up in the first half of 2005. A stronger labour market and gradually evaporating deflation are expected to result in relatively strong growth in household consumption. Investment is also growing, and so GDP growth is forecast to be 1.8 per cent in 2005 and 1.7 per cent in 2006.
Table 1.1 Assumptions for the forecast
| | 2004 | | 2005 | | 2006 | | 2007 | | 2008 | |
GDP, world(1) | | 4.9 | | 4.1 | | 4.1 | | 3.8 | | 3.8 | |
Brent oil, USD(2) | | 39 | | 53 | | 47 | | 42 | | 40 | |
TCW index(2) | | 122 | | 127 | | 124 | | 121 | | 121 | |
German long-term interest rate(3) | | 3.65 | | 3.85 | | 4.15 | | 4.25 | | 4.30 | |
Swedish long-term interest rate (3) | | 3.90 | | 3.75 | | 4.15 | | 4.35 | | 4.35 | |
Repo rate(4) | | 2.00 | | 1.50 | | 2.50 | | 4.00 | | 4.00 | |
Refi rate(5) | | 2.00 | | 2.00 | | 2.50 | | 3.25 | | 4.00 | |
Fed Funds rate(6) | | 2.25 | | 4.00 | | 4.50 | | 4.50 | | 4.50 | |
(1) Percentage change.
(2) Annual average.
(3) 10 year government bond, annual average.
(4) Final entry.
(5) Euro area key policy rate, final entry.
(6) US key policy rate, final entry.
Sources: Riksbank, Statistics Sweden, IMF and Ministry of Finance.
1.2 The financial markets
In the last five years both nominal and real market interest rates globally have fallen sharply. Long-term interest rates are now at historically low levels, which reflects how global saving has increased relative to investment demand. An upswing in bond yields is likely as resource utilisation and the rate of inflation increase in the global economy. Growing differentials between bond yields in the United States and the euro area, among others, reflect the stronger performance of the US economy. However, the global upswing in long-term interest rates is expected to be held back by continued high, demographically-linked saving and by changes in investment rules for insurers and pension funds.
Although the Federal Reserve has raised the key interest rate by 2.50 percentage points since last summer, monetary policy is still believed to
10
be having a stimulatory effect on the US economy. Further increases in the US key interest rate are anticipated in order to curb inflation as resource utilisation increases. In the euro area the key interest rate has been 2.00 per cent for a long period, which means that monetary policy still has an expansionary bias. The subdued economic upswing in the euro area suggests that interest rate increases cannot be expected before 2006 when resource utilisation slowly increases.
Since the beginning of 2005 the dollar has appreciated against other currencies, including the euro. This has been driven largely by a growing interest rate differential relative to the euro area. However, the large US current account deficit suggests that the dollar will weaken in 2005 and 2006.
The same factors that indicate a weakening of the dollar also point towards a stronger krona. Large current account surpluses and healthy public finances mean that Sweden’s net position relative to the rest of the world has gradually strengthened. The appreciation of the krona seen since 2002 was interrupted in the first half of 2005 as a result of weaker economic growth and the Riksbank’s interest rate cut in June. However, the krona is expected to begin to appreciate again as the economy returns to stronger growth. The TCW index is forecast to be 127 at the end of 2005 and 124 at the end of 2006.
1.3 Economic policy
In June the Riksbank lowered the repo rate to 1.50 per cent, having held it at 2.00 per cent since April 2004. The background to the cut was continued very low inflationary pressure and clear signals of weak economic growth at the beginning of 2005.
The low key interest rate has meant that the Riksbank’s monetary policy has been expansionary since 2003, and in 2004 and 2005 it has made a positive contribution to demand in the Swedish economy. The latest reduction in the repo rate is not expected to have its full impact on the economy until next year.
As a result of weak inflationary pressure and low resource utilisation in the economy, the Riksbank is expected to leave the repo rate at 1.50 per cent for the rest of 2005 before gradually raising it to 2.50 per cent at the end of 2006. In 2007 the repo rate will be raised further towards a neutral level.
Fiscal policy, measured as the change in the structural balance, was tightened in 2004 and is expected to be neutral this year. The discretionary component of fiscal policy in the central government budget is highly expansionary, but the expansionary effect is being offset by the strengthening of local government finances and falling sickness absence. The proposals put forward by the government in this Budget Bill mean that fiscal policy will have an expansionary effect in 2006 equivalent to around 1 per cent of GDP. Fiscal policy is expected to be neutral in 2007.
Altogether economic policy will have a strong stimulatory effect on demand in 2006. This effect is expected to lessen significantly in 2007.
Table 1.2 Selected statistics
Percentage change unless otherwise stated
| | 2004 | | 2005 | | 2006 | | 2007 | | 2008 | |
GDP | | 3.6 | | 2.4 | | 3.1 | | 2.8 | (1) | 2.3 | (1) |
GDP, calendar adjusted | | 3.1 | | 2.4 | | 3.4 | | 2.8 | | 2.3 | |
Open unemployment(2) | | 5.9 | | 5.9 | | 4.8 | | 4.4 | | 4.4 | |
Number of hours worked | | 0.9 | | 0.4 | | 1.1 | | 0.7 | | 0.2 | |
Number of hours worked, calendar adjusted | | -0.2 | | 0.4 | | 1.6 | | 0.7 | (1) | 0.2 | (1) |
CPI, Dec–Dec | | 0.3 | | 0.7 | | 2.0 | | 3.1 | | 2.3 | |
General government net lending(3) | | 1.0 | | 1.4 | | 0.7 | | 1.1 | | 1.6 | |
(1) For the medium term (2007–2008), no assessment is made of the calendar effects.
(2) Per cent of labour force. According to the new labour force survey.
(3) Per cent of GDP.
Sources: Riksbank, Statistics Sweden and Ministry of Finance.
1.4 Demand and output
Sweden’s GDP grew by 3.6 per cent in 2004 despite a sharp slowdown late in the year. This high growth was due partly to temporary factors; for example, 2004 had significantly more working days than 2003. Adjusted for the effect of the number of working days, growth is estimated to have been 3.1 per cent. The slowdown towards the end of 2004 has also affected growth in 2005. Although growth has picked up again in recent months, GDP growth is forecast to be just 2.4 per cent this year. The strong growth predicted for the end of 2005 is expected to continue into 2006, when growth is forecast to be 3.1 per cent. Since the number of working
11
days will be smaller in 2006 than in 2005, calendar-adjusted growth will be 3.4 per cent in 2006. The GDP gap is estimated to close in 2007, after which GDP will grow in line with potential GDP. GDP is estimated to grow by 2.8 per cent in 2007 and 2.3 per cent in 2008.
Sharp slowdown during the winter of 2004/05
The economic upswing which began in mid-2003 has to a great extent been driven by rapidly growing exports. In late 2004 export growth slowed, due partly to lower growth in the global economy. The slowdown had a particular impact on the demand for Swedish exports because growth was especially subdued in many of Sweden’s most important export markets. The slowdown in export growth continued into early 2005 and will therefore have a significant impact on average GDP growth this year. Although a clear recovery is anticipated during the rest of 2005, exports will grow by just 4.2 per cent this year, which can be compared with last year’s exceptionally high growth rate of 10.5 per cent. The slowdown in the export sector can be seen clearly in industrial output, which grew by 9.4 per cent in 2004 and is expected to grow by just 3.2 per cent this year.
Diagram 1.1 GDP
Percentage change on a quarter earlier, calendar and seasonally adjusted data, constant prices
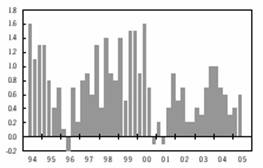
Source: Statistics Sweden.
The slowdown in the export sector in late 2004 and early 2005 is to some extent believed to be of a temporary nature. Several factors suggest stronger export growth in the time ahead. Industry’s unit labour costs have developed favourably relative to important competitor countries as a result of high productivity growth, subdued wage increases and, more recently, a weaker krona. Demand growth is also set to accelerate as a result of the recovery in the euro area. Altogether export growth is forecast to be 4.2 per cent this year and 6.1 per cent in 2006.
The strong export growth in 2004 contributed to a gradual broadening of the economic recovery. First off was investment, which grew by 5.5 per cent in 2004 and is expected to grow by 7.9 per cent this year. The main drivers behind the increase this year are sharp growth in industrial investment in machinery and continued favourable growth in housing investment. In 2006 total investment is forecast to grow by 5.0 per cent from an already high level.
Growing investment is an important reason why domestic demand began to grow more strongly during the course of 2004. However, household and general government consumption continued to grow slowly in 2004 and early 2005, which meant that the upswing in domestic demand did not fully compensate for the weak export growth during the winter of 2004/05. Hence GDP growth slowed in late 2004 and early 2005 (see Diagram 1.1).
Domestic demand to pick up
The hiatus in the economic recovery is believed to have been temporary. During the spring and summer there have been more and more indications that growth has picked up. Besides continued strong investment growth, growing household consumption is also now contributing to economic growth.
Diagram 1.2 Household disposable income and consumption expenditure
Annual percentage change, constant prices, reference year 2004
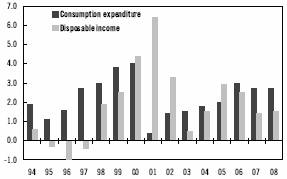
Note: Excluding the Church of Sweden.
Sources: Statistics Sweden, NIER and Ministry of Finance.
12
Table 1.3 Demand and output
| | SEK
billion(1) | | Percentage change in volume | |
| | 2004 | | 2002 | | 2003 | | 2004 | | 2005 | | 2006 | | 2007 | | 2008 | |
Household consumption expenditure | | 1 224 | | 1.4 | | 1.5 | | 1.8 | | 2.0 | | 3.0 | | 2.7 | | 2.7 | |
General government consumption expenditure | | 706 | | 2.3 | | 0.8 | | 0.3 | | 0.0 | | 1.8 | | 0.9 | | 0.2 | |
Central government | | 197 | | 3.0 | | 0.8 | | -0.3 | | -0.5 | | 1.9 | | 0.6 | | 0.0 | |
Local government | | 509 | | 2.0 | | 0.7 | | 0.5 | | 0.2 | | 1.8 | | 1.0 | | 0.3 | |
Gross fixed capital formation | | 407 | | -2.6 | | -1.5 | | 5.5 | | 7.9 | | 5.0 | | 5.2 | | 4.8 | |
Business sector excluding housing | | 270 | | -7.1 | | -2.9 | | 4.7 | | 7.7 | | 4.2 | | 5.6 | | 5.5 | |
Housing | | 64 | | 10.5 | | 5.5 | | 16.1 | | 14.5 | | 9.7 | | 7.5 | | 6.0 | |
Authorities | | 73 | | 8.7 | | -1.3 | | 0.3 | | 2.8 | | 3.8 | | 1.0 | | 0.6 | |
Change in stocks(2) | | 4 | | -0.2 | | 0.4 | | -0.3 | | 0.1 | | 0.0 | | 0.0 | | 0.0 | |
Exports | | 1 178 | | 1.2 | | 5.0 | | 10.5 | | 4.2 | | 6.1 | | 6.2 | | 5.3 | |
Imports | | 974 | | -1.9 | | 4.9 | | 6.9 | | 4.8 | | 6.7 | | 6.5 | | 6.0 | |
GDP | | 2 546 | | 2.0 | | 1.5 | | 3.6 | (3) | 2.4 | | 3.1 | (3) | 2.8 | | 2.3 | |
(1) Current prices.
(2) Volume change, per cent of last year’s GDP.
(3) Underlying GDP growth is estimated at 3.1 per cent 2004 and 3.4 per cent 2006. The fact that actual GDP growth in 2004 was higher than the underlying growth is due to the larger number of working weekdays in 2004 compared to 2003. The fact that actual GDP growth in 2006 is lower than the underlying growth is due to the smaller number of working weekdays in 2006 compared to 2005.
Sources: Statistics Sweden and Ministry of Finance.
Some of the fundamentals for strong consumption growth have been in place for several years now, such as a strong household wealth position and low interest rates. Households’ financial wealth position has also been further strengthened in 2005 as a result of the gains on the Stockholm stock exchange. At the same time households’ assets in the form of property have continued to grow sharply in value. In 2005 and 2006 households’ real disposable income is also expected to grow by more than 2.5 per cent on average (see Diagram 1.2).
Nevertheless households have been showing considerable caution, which can be attributed partly to the weak performance of the labour market. However, growing retail sales so far this year and strong consumption growth during the second quarter suggest a gradual improvement. Households’ confidence has also strengthened. As the situation in the labour market gradually improves, household consumption is expected to grow even more quickly. Household consumption is forecast to grow by 2.0 per cent this year and 3.0 per cent in 2006.
General government consumption stagnated in 2004 and has grown weakly in 2005. Consumption growth was weak in both the central and local government sectors. Local government finances deteriorated sharply at the beginning of the new millennium, but a combination of tax increases, higher central government grants and restrained growth in expenditure has brought about a substantial improvement in local government net lending (see Diagram 1.3). Combined with the initiatives proposed by the government in this Budget Bill, this is expected to mean that local government consumption will grow by 0.2 per cent this year and 1.8 per cent in 2006. Central government consumption is forecast to fall by 0.5 per cent this year and then grow by 1.9 per cent in 2006. Thus general government consumption is expected to be unchanged this year and grow by 1.8 per cent in 2006.
Diagram 1.3 Local government finances
Percentage change
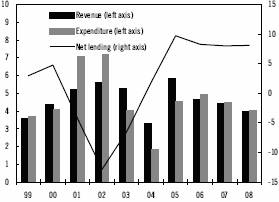
Note: Church parishes have been excluded throughout the period.
Sources: Statistics Sweden and Ministry of Finance.
13
Taken together the slowdown in the export sector and acceleration in domestic demand mean that the latter will make the greater contribution to growth in 2005 (see Diagram 1.4).
Diagram 1.4 Contribution to GDP growth
Percentage points

Sources: Statistics Sweden and Ministry of Finance.
Strong demand to push up imports
In 2004 imports grew by 6.9 per cent, which is the fastest rate of growth since 2000. This rapid upswing in imports was a result of the exceptional growth in import-dependent exports. The weaker export growth in 2005 means that imports too will grow more slowly than in 2004. However, the slowdown in imports is milder than that in exports because both investment and household consumption are growing relatively strongly. The import content of exports is expected to continue to grow as a result of the stronger krona and the continued globalisation of production. Altogether imports are forecast to grow by 4.8 per cent this year and 6.7 per cent in 2006.
Table 1.4 Contribution to GDP growth
Percentage points
| | 2005 | | 2006 | | 2007 | | 2008 | |
| | | | | | | | | |
Household consumption expenditure | | 1.0 | | 1.4 | | 1.3 | | 1.3 | |
General government | | | | | | | | | |
consumption expenditure | | 0.0 | | 0.5 | | 0.2 | | 0.0 | |
Gross fixed capital formation | | 1.3 | | 0.8 | | 0.9 | | 0.8 | |
Change in stocks | | 0.1 | | 0.0 | | 0.0 | | 0.0 | |
Net foreign trade | | 0.1 | | 0.3 | | 0.3 | | 0.1 | |
Exports | | 1.9 | | 2.9 | | 3.0 | | 2.7 | |
Imports | | -1.8 | | -2.6 | | -2.6 | | -2.5 | |
GDP | | 2.4 | | 3.1 | | 2.8 | | 2.3 | |
Sources: Statistics Sweden and Ministry of Finance.
The terms of trade, i.e. export prices relative to import prices, have deteriorated over the last decade (see Diagram 1.5). Strong Swedish productivity growth and the sharp improvement in the current account balance since the early 1990s are among the reasons for this trend. In 2005 the terms of trade are expected to deteriorate by a further 2.0 per cent, due primarily to rising oil prices. In 2006 the terms of trade are expected to improve somewhat, due partly to falling oil prices. The strengthening of the krona is also expected to have a greater impact on import prices than on export prices.
Diagram 1.5 Current account and terms of trade
Per cent
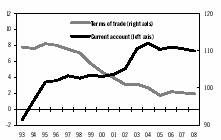
Note: The current account is expressed as per cent of GDP.
Sources: Riksbanken, Statistic Sweden and Ministry of Finance.
2004 brought a current account surplus of SEK 211 billion, equivalent to 8.3 per cent of GDP. The surplus has grown gradually since the early 1990s. The demographical composition of the population has a positive impact on household saving. There was also a series of reforms during the 1990s (such as the tax reform, the pension reform and the restructuring of public finances) which contributed to higher saving in the economy as a whole. Since 2002 the growth in the current account surplus has also been driven by high export demand, subdued consumption growth and strong productivity. In 2005 and 2006 the impact of these factors is expected to decrease and the current account surplus will fall slowly to 7.3 per cent of GDP in 2008.
Domestic risks
The domestic risks are believed to be balanced. On the one hand, household consumption may grow even faster in 2005 and 2006. On the other hand, continued high oil and petrol prices may
14
slow global and domestic economic growth. One factor which is difficult to gauge in the short term is productivity growth. A more moderate slowdown than anticipated could delay recovery in the labour market somewhat. At the same time a very sharp slowdown in productivity growth would undermine profitability in the business sector in the longer term.
1.5 Labour market, resource utilisation and inflation
Strong improvement in the labour market in 2006
The Swedish labour market has performed weakly since the economy began to recover in the second half of 2003. Employment fell in 2003 and 2004 and has been unchanged so far in 2005. Open unemployment rose in 2004 and is expected to hold at 5.9 per cent in 2005.(1) The weak performance of the labour market has led the government to expand its labour market policy programmes. In 2003 the programmes had 92,000 places, and this figure has gradually been increased to 121,000 places in 2005. In this Budget Bill the government is proposing further expansion of the programmes, and the number of participants in labour market policy programmes next year is forecast to be 162,000.
Diagram 1.6 Hours worked and GDP
Annual percentage change, calendar adjusted quarterly data
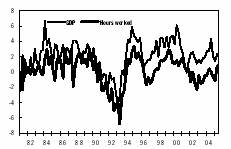
Sources: Statistics Sweden and Ministry of Finance.
(1) As a result of changes to Statistics Sweden’s Labour Force Survey, the figures reported here are not directly comparable with those reported in previous bills. However, historical data presented in this appendix have been adjusted to make them comparable over time. See the explanatory box “Harmonisation of the Labour Force Survey” in Chapter 6 for a more in-depth review of the consequences of the changes made.
The weak performance of the labour market has several explanations. One is that productivity growth in the Swedish economy has been strong in recent years. This strong productivity growth means that the labour market lags behind GDP growth as firms are able to step up output without needing to increase the number of hours worked (see Diagram 1.6).
However, productivity in the business sector is now expected to grow more weakly than in recent years. The potential for rationalisation in the business sector is believed to be smaller, and demand is set to focus increasingly on employment-intensive sectors such as construction, the private service sector and the public sector. However, productivity is expected to continue to grow relatively strongly (see Table 1.5).
Table 1.5 Selected labour market statistics
Percentage change unless otherwise stated
| | 2004 | | 2005 | | 2006 | | 2007 | | 2008 | |
GDP | | 3.6 | | 2.4 | | 3.1 | | 2.8 | | 2.3 | |
Productivity | | 2.8 | | 2.0 | | 2.0 | | 2.0 | | 2.1 | |
Hours worked | | 0.9 | | 0.4 | | 1.1 | | 0.7 | | 0.2 | |
Employed | | -0.5 | | 0.1 | | 1.3 | | 0.7 | | 0.2 | |
Open employment(1),(2) | | 5.9 | | 5.9 | | 4.8 | | 4.4 | | 4.4 | |
Labour market programmes(1),(3) | | 2.4 | | 2.7 | | 3.6 | | 3.3 | | 2.7 | |
Regular employment rate(4) | | 77.2 | | 76.6 | | 76.6 | | 77.0 | | 77.2 | |
(1) Per cent of labour force.
(2) According to the new Swedish labour force survey.
(3) People in labour market programmes as a percentage of the labour force.
(4) Number of people employed in age group 20-64, excluding employed in labour market programmes, as a percentage of the population in that age group.
Sources: Statistics Sweden, National Labour Market Board and Ministry of Finance.
Another contributing factor to the sluggish developments in the labour market is that average hours worked increased in 2004 and are forecast to continue to do so in both 2005 and 2006. In an economic recovery it is natural for average hours worked to increase as firms initially choose to get more hours out of their existing employees. Sickness absence also began to fall in 2004, which meant that the number of hours worked could increase without more people being taken on.(2) Just as growing sickness absence propped up employment in 2000-03,
(2) Those on sick leave are counted as employed in Statistics Sweden’s Labour Force Survey.
15
falling sickness absence will now drag down employment during the forecast period.
The labour market is expected to turn around during the second half of 2005. Since autumn 2004 several labour market indicators have been moving in an increasingly positive direction. For example, the number of vacancies newly reported to the National Labour Market Board has increased since mid-2004. In addition, according to the latest NIER Business Tendency Survey, firms in both the construction and private service sectors are planning to recruit. Adjusted for seasonal variations and the number of working days, the number of hours worked was 0.4 per cent higher in the second quarter this year than in the first quarter. The number of hours worked is expected to grow on average by 0.4 per cent this year and 1.1 per cent in 2006. Employment is expected to grow weakly this year by 0.1 per cent and then by 1.3 per cent in 2006. Employment is then expected to grow by 0.7 per cent in 2007 and 0.2 per cent in 2008. Open unemployment is expected to be 5.9 per cent this year before falling to 4.8 per cent next year. This is the result of a stronger economy and the expansion of the labour market policy programmes. Open unemployment is estimated at 4.4 per cent in both 2007 and 2008.
Resource utilisation still low
There are available resources in the Swedish economy at present. Low resource utilisation is evident in, for example, high unemployment and low labour shortages in most sectors. Both wage pressure and price pressure are also low. The low resource utilisation can be illustrated by the fact that the GDP gap is assessed to be negative, which means that actual GDP is below potential GDP. The GDP gap is estimated to have been 1.1 per cent in 2004 and be 1.0 per cent this year. This means that actual GDP is growing in line with potential GDP this year. Potential GDP is forecast to grow by just under 2.5 per cent per annum in the coming years. One basis for this view is the analysis of productivity growth over the next decade carried out by the NIER for the government. The NIER concludes that labour productivity, i.e. output per hour worked, can be expected to grow by an average of 2.2 per cent per annum through to 2015.
Table 1.6 Resource situation
Per cent of potential level
| | 2005 | | 2006 | | 2007 | | 2008 | |
GDP gap(1) | | -1.0 | | -0.4 | | 0.0 | | 0.0 | |
Employment gap | | -1.2 | | -0.4 | | 0.0 | | 0.0 | |
Productivity gap | | 0.7 | | 0.3 | | 0.1 | | 0.0 | |
Average hours worked gap | | -0.7 | | -0.3 | | -0.1 | | 0.0 | |
Note: The parts may not add to the GDP gap due to rounding.
(1) Defined as ((actual-potential)/potential).
Source: Ministry of Finance.
The GDP gap is forecast to narrow gradually in 2006 as actual GDP grows faster than potential GDP (see Table 1.6). The GDP gap can be divided into a productivity gap, an average-working-hours gap and an employment gap. In 2005 the GDP gap consists of an employment gap which is more negative than the GDP gap, a negative average-working-hours gap and a positive productivity gap. It is therefore believed that there are more available resources in the labour market than the GDP gap would indicate for 2005, and that productivity is above the level considered to be sustainable in the long term. The employment gap will close gradually in 2005 and 2006 as employment grows faster than the long-term sustainable rate. The average-working-hours gap will also narrow gradually. At the same time actual productivity will grow more slowly than potential productivity. The GDP gap is predicted to close in 2007.
Wage growth and inflation still subdued
In recent years it has been relatively easy for employers to recruit suitable labour. Unemployment is high and the underlying rate of inflation is very low. This has meant that nominal wages have grown increasingly slowly in the last three years. The wage settlements reached in 2004 and 2005 are believed to have been reached at a lower level than in previous periods, which would indicate continued low nominal wage growth. At the same time real wages are growing strongly as a result of the low inflation. Wages are forecast to grow by 3.3 per cent in 2005 and 3.4 per cent in 2006. When the government commissioned the NIER to analyse future productivity growth, it was also asked to assess what rate of long-term wage growth is compatible with balanced macro economic development. The NIER’s conclusion is that wages can grow at 4.0 per cent per annum in the long term without jeopardising
16
macroeconomic balance. Wages are therefore assumed to grow by 4.0 per cent per annum in the medium-term estimates for 2007 and 2008.
Inflation is currently very low. In 2004 inflation as measured by the consumer price index (CPI) was 0.4 per cent, while underlying inflation (UND1X) was 0.8 per cent. So far this year underlying inflation has averaged 0.6 per cent. The low inflationary pressure in the economy is due to a number of factors. Unit labour costs have grown slowly for several years as a result of low wage increases and high productivity growth. Weak demand growth and increased competition in consumer non-durables, for example, have also squeezed profit margins. Furthermore the contribution to inflation from import prices excluding energy has been negative since 2003. However, the increase in the price of heating oils and petrol in 2004 and 2005 has made a tangible positive contribution to inflation. In 2006 falling oil prices and a stronger krona are expected to contribute to inflation rising at only a moderate rate.
Table 1.7 Hourly wages, CPI and UND1X
Percentage change
| | 2004 | | 2005 | | 2006 | | 2007 | | 2008 | |
| | | | | | | | | | | |
Hourly wages(1) | | 3.3 | | 3.3 | | 3.4 | | 4.0 | | 4.0 | |
CPI, Dec-Dec | | 0.3 | | 0.7 | | 2.0 | | 3.1 | | 2.3 | |
CPI, annual average | | 0.4 | | 0.3 | | 1.5 | | 2.6 | | 2.7 | |
UND1X, Dec-Dec | | 0.7 | | 1.1 | | 1.5 | | 2.0 | | 2.0 | |
UND1X, annual average | | 0.8 | | 0.7 | | 1.4 | | — | | — | |
(1) According to the short-term statistics on wages and salaries.
Sources: National Mediation Office, Statistics Sweden and Ministry of Finance.
Inflation expectations have gradually declined since 2003 and are now well below the Riks-bank’s target inflation on both a one-year and a two-year view. The low resource utilisation and subdued wage growth mean that domestic inflationary pressure will rise only slowly despite productivity growth slowing. Combined with low imported inflation, this means that underlying inflation will be just 0.7 per cent this year and 1.4 per cent in 2006. CPI inflation – which will be affected by rising mortgage interest rates – is expected to be 0.3 per cent this year and 1.5 per cent in 2006. Only in 2007 will inflation reach the Riksbank’s target of 2.0 per cent in UND1X terms. CPI inflation will be pushed up temporarily by rising interest rates in 2007 and 2008.
1.6 Public finances
General government net lending amounted to 1.0 per cent of GDP in 2004 according to the preliminary National Accounts, which was a substantial improvement relative to the deficits of the two previous years.(3) Behind this improvement were weak growth in general government consumption and reduced interest expenditure.
The government’s target is for net lending to average 2 per cent over a business cycle. In 2000-04 net lending averaged 1.6 per cent of GDP.
Table 1.8 General government finances
Per cent of GDP
| | 2004 | | 2005 | | 2006 | | 2007 | | 2008 | |
Revenue | | 55.6 | | 55.9 | | 54.9 | | 54.7 | | 54.7 | |
Taxes(1) | | 50.6 | | 50.7 | | 49.9 | | 49.8 | | 49.8 | |
Expenditure | | 54.5 | | 54.5 | | 54.2 | | 53.6 | | 53.1 | |
Net lending | | 1.0 | | 1.4 | | 0.7 | | 1.1 | | 1.6 | |
Structural balance | | 1.8 | | 2.1 | | 1.0 | | 1.1 | | 1.6 | |
Consolidated gross debt | | 51.1 | | 50.7 | | 49.2 | | 47.6 | | 45.8 | |
Net debt | | -5.2 | | -6.1 | | -6.8 | | -7.6 | | -8.9 | |
(1) Including taxes to EU.
Sources: Statistics Sweden and Ministry of Finance.
This year general government net lending is forecast to be 1.4 per cent of GDP. This is an increase of 0.7 percentage points from the forecast in the 2005 Spring Fiscal Policy Bill. The improvement is due primarily to lower local government consumption, lower interest rates and higher revenues from corporate taxes than anticipated. The measures being proposed by the government to reduce unemployment, together with the tax cuts now being announced, will contribute to net lending falling to 0.7 per cent of GDP in 2006. Net lending is estimated to be 1.1 per cent of GDP in 2007 and 1.6 per cent in 2008. This means that net lending will average 1.4 per cent of GDP in 2000-08. The structural balance, where the effects of cyclical fluctuations on net lending are eliminated, is forecast to be 2.1 per cent of GDP this year and 1.0 per cent in 2006, and is estimated to be 1.1 per cent in 2007 and 1.6 per cent in 2008.
This year both total revenue and taxes are expected to increase slightly as a proportion of
(3) However, more recent information suggests that tax revenues may have been underestimated by around SEK 8 billion in the preliminary outcome.
17
GDP before stabilising at a lower level. Expenditure as a proportion of GDP is expected to fall throughout the forecast period.
General government consolidated gross debt is expected to fall as a proportion of GDP during the forecast period, from 51.1 per cent in 2004 to 45.8 per cent in 2008. Net debt as a proportion of GDP will fall by almost 4 percentage points from 2004 to 2008.
18
2 International developments
Growth in the global economy last year was the highest for almost 30 years. The global economy is now entering a calmer phase and is forecast to grow by 4.1 per cent both this year and next, which is above the historical average. Persistently high oil prices and negative effects from the growing US current account deficit are the main risks in the forecast.
Global economy growing more slowly
The high rate of growth last year can be attributed to simultaneous economic upswings in most regions. In the middle of last year global growth slowed and world trade slackened significantly. The slowdown in the global economy can be explained partly by changes to economic policy and sharply rising oil prices.
Nevertheless global growth is expected to remain robust throughout the forecast period. Strong investment activity is expected to remain the principal driver in the economy. There are still available resources in the global economy, which, combined with low interest rates and a subdued inflation outlook, will support continued favourable growth.
Upswing in investment less strong
Investment will remain the main driver in the economy. Investment is being stimulated by low financing costs, healthy balance sheets and growing earnings. However, investment growth has slowed in the United States and Japan. It is expected to accelerate somewhat in the euro area after a prolonged period of weak investment growth, but the upswing in the euro area is expected to be moderate. Capacity utilisation is relatively low, and the recovery in domestic consumption is expected to be restrained.
Increased growth stimulus from labour market
Household consumption has grown very strongly in the United States and, more recently, Japan. In the United States consumption has been stimulated by a brighter labour market situation and strong income growth. Rising prices for housing and reduced saving have also increased the scope for consumption. Continued tightening of monetary policy and an anticipated increase in the household savings ratio are expected to put a damper on household consumption in the time ahead.
In Japan it is primarily a brighter labour market situation and rising real wage increases that have stimulated consumption, a trend which is expected to continue. In the euro area there are still no signs of a recovery in household consumption, but an improved labour market situation combined with reductions in income taxes in most countries is expected to support an upswing in consumption.
High oil prices cap global growth
A brief period of high oil prices will probably have only a limited impact on the global economy. However, if oil prices hold at high levels for a longer period, this will have a negative impact on global growth (see explanatory box at the end of this chapter).
Unlike previous oil spikes, oil prices have been pushed up primarily by strong demand pressure and not by a supply shock. The effect of the increase in oil prices is therefore expected to be limited to capping the high rate of growth in the global economy. The forecast assumes that oil prices will fall back towards the end of this year, but uncertainty about movements in oil prices has grown considerably in recent times.
The dollar’s depreciation against the euro has softened the impact of the increase in oil prices in the euro area. Since the beginning of 2003 oil prices have risen by around 120 per cent in dollar terms and around 90 per cent in euro terms. The inflationary impulse from high oil prices is therefore greater in the United States than in the euro area. The United States has also been hit harder due to its higher dependence on oil and much faster-growing economy.
Besides oil prices, the US current account deficit is a risk factor in the forecast. A rapid correction of this deficit would have a major effect on the global economy. A clear drop in the rest of the world’s demand for US government bonds would be associated with a sharp fall in the dollar and a knock-on effect on both short-term and long-term interest rates. Overall this scenario would reduce global growth significantly.
19
Table 2.1 GDP growth, inflation and unemployment
Percentage change
| | 2004 | | 2005 | | 2006 | | 2007 | | 2008 | |
Gross domestic product | | | | | | | | | | | |
World | | 4.9 | | 4.1 | | 4.1 | | 3.8 | | 3.8 | |
United States | | 4.2 | | 3.6 | | 3.4 | | 3.3 | | 3.2 | |
Japan | | 2.6 | | 1.8 | | 1.7 | | 1.5 | | 1.5 | |
Euro area | | 2.1 | | 1.3 | | 1.8 | | 2.1 | | 2.3 | |
Germany | | 1.6 | | 0.9 | | 1.4 | | 1.9 | | 2.2 | |
France | | 2.3 | | 1.6 | | 1.9 | | 1.9 | | 2.2 | |
Italy | | 1.2 | | -0.2 | | 1.2 | | 1.8 | | 2.0 | |
UK | | 3.2 | | 1.9 | | 2.3 | | 2.7 | | 2.7 | |
Nordic countries, excl. | | | | | | | | | | | |
Sweden | | 2.9 | | 2.5 | | 2.6 | | 2.3 | | 2.1 | |
Norway | | 2.9 | | 3.1 | | 2.9 | | 3.0 | | 3.0 | |
Denmark | | 2.4 | | 2.3 | | 2.2 | | 2.0 | | 1.9 | |
Finland | | 3.6 | | 2.2 | | 2.7 | | 2.0 | | 1.3 | |
| | | | | | | | | | | |
Consumer prices(1) | | | | | | | | | | | |
United States | | 2.7 | | 2.9 | | 2.5 | | 2.3 | | 2.3 | |
Euro area | | 2.1 | | 2.0 | | 1.9 | | 1.9 | | 1.8 | |
Japan | | 0.0 | | -0.3 | | 0.3 | | 0.5 | | 0.6 | |
| | | | | | | | | | | |
Unemployment, per cent of labour force(2) | | | | | | | | | | | |
United States | | 5.5 | | 5.1 | | 4.9 | | 4.8 | | 4.8 | |
Euro area | | 8.9 | | 8.9 | | 8.7 | | 8.6 | | 8.6 | |
Japan | | 4.7 | | 4.4 | | 4.3 | | 4.2 | | 4.1 | |
| | | | | | | | | | | |
Market growth for Swedish exports | | 9.2 | | 5.7 | | 7.4 | | 7.1 | | 6.9 | |
(1) HICP for the euro area and CPI for the United States and Japan.
(2) Eurostat definition for euro area and national definition for the United States and Japan.
Sources: National sources, Eurostat and Ministry of Finance.
World market growth slackens slightly
Both global GDP growth and growth in world trade peaked in 2004. Due to high energy prices and weaker global demand, industrial activity slowed considerably at the beginning of 2005. This led to a clear drop in Swedish world market growth (WMG) – growth in the trade-weighted demand for goods and services encountered by Swedish exporters – during the first half of this year.
However, this decrease in world market growth is believed to be temporary and relatively limited. Global industrial activity appears to have picked up during the summer. The growth outlook has improved in both the United States and Japan. Industrial activity has also improved somewhat in the euro area, which is Sweden’s most important export market, and the labour market in the euro area is also gradually improving. The long-awaited recovery in the euro area is one contributing factor to world market growth being expected to be higher in 2006 than this year. Slightly stronger domestic demand in the region will boost demand for Swedish export goods. Together with continued robust demand from countries outside the OECD, this means that the outlook for Swedish exports is bright for the next few years.
Swedish world market growth is forecast to be 5.7 per cent this year and 7.4 per cent next year. It is then projected to be 7.1 per cent in 2007 and 6.9 per cent in 2008, which is close to the historical average.
2.1 The euro area
Temporary downturn after temporary upswing
After a temporary recovery during the latter part of 2003 and through to the middle of last year, the euro area economy slowed again. The anticipated transition from export-led recovery to domestically-driven growth failed to materialise. However, the slowdown in the economy was relatively moderate, and several indicators suggest that a tentative recovery has begun during the second half of 2005. The recovery is being driven primarily by stronger industrial activity. The forecast assumes that GDP in the euro area will grow by 1.3 per cent this year and 1.8 per cent next year. The medium-term estimates for 2007 and 2008 assume that growth in the euro area will exceed potential growth given the high levels of available resources.
Domestic demand still weak
The weak growth in the euro area in recent years can be attributed largely to limited domestic demand. Growth in household consumption has fallen sharply since the years around the millennium. Households’ increased restraint can be explained by lower growth in real disposable income and by a less favourable labour market situation. However, other factors, such as the weakening of public finances and the reform of the pension and health care systems in the majority of member states, may also have led to uncertainty among households which has undermined consumption. In 2005 rising oil prices have also reduced the scope for consumption.
20
The subdued consumption growth is reflected in low consumer confidence and a relatively high savings ratio.
Investment growth in the euro area has been relatively weak since 2003 compared to the OECD area as a whole. The appreciation of the euro and increased competition from low-wage countries have combined with rising commodity prices to inhibit investment. It is above all in Germany that investment growth has been negative. A correction of the overinvestment made in the construction sector in connection with reunification, together with higher real interest rates than in other euro countries, has served to erode the propensity to invest in Germany.
Industry leading economic upswing
Several signs suggest a tentative recovery in the economy towards the end of 2005. Confidence in industry began to grow in mid-2005 after gradually deteriorating since mid-2004. Orders and industrial output also improved during the summer.
Historically low real interest rates and firms’ improved financial situation, combined with continued favourable demand from the rest of the world, are expected to lead to accelerating investment growth. In recent years firms have also undertaken cost-cutting and rationalisation programmes which have led to reduced unit labour costs. An upswing in investment in machinery and equipment has already begun in most euro countries. The upswing in investment is expected to broaden during the autumn and strengthen further next year. However, increasingly stiff competition from low-wage countries and high oil prices are expected to limit investment in the euro area.
Since the middle of last year exports have been held back by dwindling global demand, while imports have been held back by weak domestic demand. Taken together this led to a weak positive contribution to growth from net exports last year. The appreciation of the euro has been a hindrance to exports. The anticipated stabilisation of the currency is expected to improve the export outlook, while imports are expected to grow as consumption picks up. Foreign trade is forecast to make a neutral contribution to growth this year and next.
Altogether the recovery in the economy is expected to be slow, and the GDP gap will widen further this year.
Higher employment and lower unemployment
The weak growth in the euro area in recent years has had a limited impact on the labour market. The increase in the number of unemployed has been moderate, and employment has continued to rise. The economic slowdown’s relatively mild effect on the labour market is down to several factors. Firms have probably misjudged the delay in economic recovery and, despite demand pressure easing, chosen largely to retain an unchanged workforce in anticipation of the economy picking up again. The majority of euro countries have also introduced a series of labour market reforms which have led to improvements in the functioning of the labour market in the euro area as a whole.
Although unemployment has grown relatively little in recent years and has even fallen slightly this year, households have taken a pessimistic view of the labour market situation. This has probably hampered consumption.
Employment growth has accelerated since the middle of last year, and the number of unemployed has fallen since spring this year. The improvement in the labour market is expected to continue during the rest of this year and next year. As the situation in the labour market improves, consumer confidence is expected to strengthen and the rate of wage growth to accelerate, which will support a moderate recovery in household consumption, above all next year.
High oil prices push up inflation
High oil prices continue to push up inflation, which was 2.0 per cent during the first half of 2005 despite weak economic growth. Underlying inflationary pressure, on the other hand, has decreased since last autumn. Core inflation (CPI excluding energy and fresh foods) was a moderate 1.6 per cent during the same period. The reform of the health insurance system in the Netherlands is expected to reduce inflation in the euro area as a whole by 0.2 percentage points next year. Combined with the anticipated return of oil prices to more normal levels, this is
21
expected to result in inflation dropping below 2 per cent next year.
2.2 The United Kingdom
Having been high during the first half of 2004, growth in the UK economy slowed towards the end of the year. The slowdown followed a series of increases in the key interest rate in 2003-04 to cool strong domestic demand. The UK economy has to some extent been a two-speed economy for a number of years, with good growth in the service sector but weaker growth in the manufacturing industry. The interest rate hikes and still strong pound hit industry hard, sending it into recession at the beginning of 2005.
Domestic demand is the main driver for growth in the United Kingdom, and this too slackened late last year. Consumption growth fell due to lower growth in house prices and, as a result, household wealth, but also due to a slight drop in employment growth and a lower rate of wage growth.
However, domestic demand remains relatively strong and is expected to remain the principal driver for the economy. Retail sales have strengthened, which indicates continued good consumption growth. Private investment is being stimulated by firms’ healthy financial situation and high capacity utilisation. The anticipated improvement in the euro area economy, which is the United Kingdom’s most important export market, is also good news for the UK economy. GDP growth amounted to 3.2 per cent last year and is forecast to slow to 1.9 per cent this year before rallying slightly to 2.3 per cent in 2006. Growth of just over 2.5 per cent is projected for both 2007 and 2008.
2.3 The Nordic countries
GDP growth in Sweden’s Nordic neighbours was high last year due to strong domestic demand. Growth is expected to be robust both this year and next, and will continue to be driven mainly by strong domestic demand.
Finland
Private consumption and investment accounted for the bulk of Finland’s GDP growth in 2004. GDP figures for the first half of this year were weak, due primarily to flagging investment growth. The dispute in the Finnish paper industry had a negative effect on Finnish industrial output in the second quarter this year, and industrial output was lower during the first half of this year than during the first half of last year. However, industrial confidence indicators picked up during the summer after having indicated falling industrial output early in the year. The drop in GDP growth during the first half of the year is believed to have been temporary. Except for a temporary dip in export growth in the paper industry due to the strike, relatively strong export growth is forecast for this year and next. After two years of negative contributions to GDP growth, net exports are forecast to make a positive contribution in 2005 and 2006. Household consumption is expected to grow at a good rate during the forecast period as a result of continued tax cuts and increased employment. However, fiscal policy is expected to provide less support for household consumption than in 2003 and 2004. GDP growth is forecast to be 2.2 per cent this year and 2.7 per cent in 2006. In 2007 and 2008 GDP growth is projected to fall to slightly below the long-term sustainable trend.
Denmark
Private consumption and investment were also the strongest drivers for GDP growth in Denmark last year. The contribution from foreign trade was negative. As in Finland, GDP figures at the beginning of this year were weaker than anticipated. The slowdown in GDP growth can be attributed to weaker domestic demand. However, retail sales statistics and consumer confidence indicators suggest that the slowdown in private consumption was temporary. Households’ propensity to consume was stimulated by expansionary fiscal policy in 2003 and 2004 (see explanatory box at the end of Chapter 6). Falling unemployment and the continuation of the tax freeze introduced four years ago will contribute to continued strong consumption growth this year. Investment growth also fell at the beginning of this year, but continued low interest
22
rates and high corporate earnings are expected to support good investment growth in the time ahead. Export growth, which recovered last year, is expected to remain favourable as a result of increased demand from the euro area. GDP is forecast to grow by 2.3 per cent this year and 2.2 per cent in 2006. It is then projected to grow in line with the potential growth rate in 2007 and 2008, which is slightly lower than the levels forecast for 2005 and 2006.
Norway
The Norwegian economy has profited from high oil prices, which have led to very strong investment growth in the oil sector. Meanwhile private consumption has been stimulated by expansionary fiscal and monetary policy. Continued strong growth in disposable income and good investment growth in both the oil and housing sectors are anticipated during the forecast period. Thus domestic demand is again expected to make a dominant contribution to continued good GDP growth during the forecast period. Export growth has been modest, and strong domestic demand has led to very high import growth. The contribution from net exports to GDP growth was negative last year and is expected to remain so this year. GDP is forecast to grow by 3.1 per cent this year and 2.9 per cent in 2006, and is then projected to grow in line with the long-term sustainable trend in 2007 and 2008, which is around 3 per cent.
2.4 The United States
Stable growth in the US economy
The US economy grew at a rapid rate last year, with GDP growth of 4.2 per cent. This good growth continued during the first half of this year, and forward-looking indicators suggest stable growth in the time ahead. US GDP is expected to grow slightly more quickly than potential growth this year. The rate of growth will then drop gradually towards potential GDP through to 2007 and 2008. GDP is forecast to grow by 3.6 per cent this year and 3.4 per cent next year.
Continued strong domestic demand
It has long been domestic demand – above all household consumption – that has driven growth in the United States. Consumption is being boosted by the improvement seen in the labour market, with good employment growth and strong income growth. Low interest rates have also stimulated consumption and contributed to rising asset prices, in particular house prices. Consumption is expected to continue to grow at a good rate during the forecast period but to slow slightly as monetary policy is tightened and households choose to step up their saving. High energy prices are also expected to put a slight damper on households’ propensity to consume. However, wages are expected to grow more quickly as the labour market tightens, which will boost consumption.
Private investment is another important driver for growth in the US economy. Investment has grown rapidly in the last two years, and the positive trend continued in the first half of this year. Investment too has been stimulated by the low interest rate situation, but above all by firms’ healthy finances and good earnings growth. Continued positive earnings growth, combined with rising capacity utilisation, is expected to lead to investment growth remaining favourable in the time ahead. The Federal Reserve’s gradual tightening of monetary policy is expected to slow investment growth slightly, but overall continued positive growth in domestic demand is anticipated in the United States during the forecast period.
Diagram 2.1 Industrial production and PMI in manufacturing industry
Index Percentage change
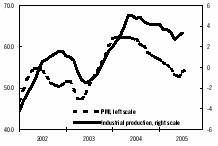
Sources: Institute for Supply Management and Federal Reserve.
23
The destruction in the wake of Hurricane Katrina at the end of August and its effects on energy prices have increased uncertainty about economic developments in the near future. At the same time the underlying trend is mainly positive. For example, there are clear signs of stronger industrial activity. Growth in industrial output slowed in the last year but has now picked up. The same applies to confidence in the manufacturing industry (see Diagram 2.1 above).
Inflation was very subdued in 2003 but rose steadily last year, partly in line with the slower productivity growth. Inflation continued to rise at the beginning of this year but has slowed slightly in recent months despite record-high oil prices. However, inflationary pressure is expected to remain relatively high this year as a result of high energy prices, rising resource utilisation and increased unit labour costs due to the increasingly tight labour market. In 2006 inflation is expected to fall as monetary policy is tightened further and oil prices fall back.
Activity in the property market
Besides the global risks mentioned at the start, such as high energy prices, falling property prices pose a threat to economic developments in the United States. House prices have grown considerably in much of the country, and a sharp drop in property prices – as a result of higher interest rates, for example – could have a negative effect on, above all, household consumption. However, property prices will probably slow in a controlled manner as monetary policy is tightened and mortgage interest rates rise.
2.5 Japan
Strong growth after three weak quarters
While the Japanese economy stagnated in 2004, GDP grew by an average of 0.8 per cent quarter-on-quarter during the first half of this year. The recovery was stronger than anticipated, even though the basis for more sustained growth has gradually improved. The outlook for both the business sector and the labour market is brighter.
GDP growth is forecast to be 1.8 per cent this year and 1.7 per cent next year. In 2007 and 2008 the economy is projected to grow by 1.5 per cent, which is slightly above the potential level. Thus the GDP gap will close in 2008.
Domestic demand drives growth
The recovery in the economy is being driven by strong domestic demand. Household consumption grew by an average of 1 per cent quarter-on-quarter in the first half of this year after stagnating in 2004. This is probably due to improvements in the labour market situation. Unemployment began to fall in January 2003, and employment increased in 2004. Initially it was part-time jobs which contributed to the employment growth. Since the average part-time wage is roughly half the average full-time wage, income did not increase. Since the beginning of this year employment growth has been driven by an increase in full-time jobs. This in turn resulted in rising real income and robust private consumption growth during the first half of the year.
Business sector investment grew by 2.2 per cent quarter-on-quarter in the second quarter after growing by 2.7 per cent during the first three months of the year. At the same time new statistics paint an optimistic picture of investment growth in the time ahead. Business confidence has continued to strengthen, and firms have stepped up their investment plans. Other indicators too, such as the purchasing managers index and machinery orders, have improved. Firms’ now healthy financial position, the restructuring of bad loans in the bank sector and rising capacity utilisation are also paving the way for investment growth in the slightly longer term. Business sector investment growth is expected to be stable, albeit at a slightly lower level than during the first half of 2005.
Recovery in foreign trade
Dwindling demand from the rest of the world, destocking in China and reduced demand for information and communication technology (ICT) products led to a negative contribution to growth from foreign trade from mid-2004. Thanks to strong export growth, however, the contribution to growth from net exports was
24
positive again during the second quarter of this year. Foreign trade is expected to continue to stimulate growth. Since the beginning of this year the yen has depreciated by around 8 per cent against the dollar. Demand from the United States and China is expected to continue to grow strongly, and there are also signs that demand for ICT products has picked up again. All of these factors are expected to favour Japan’s export industry.
Deflationary pressure may be easing
Consumer prices were unchanged in 2004 after more than five years of deflation. Due partly to temporary effects (reduced prices for public services), prices as measured by the CPI have fallen again this year. However, fewer available resources in the economy, rising unit labour costs and decreasing inflation expectations mean that prices are forecast to rise weakly in the time ahead.
According to statements from the Bank of Japan, quantitative easing may be reduced as early as this autumn. Thus the central bank too is expecting prices to begin to rise. According to pricing in the market, the key interest rate will be raised slightly next year.
Economy faces major challenges
Japan’s primary budget deficit (i.e. excluding interest payments on central government debt) is just over 5 per cent of GDP and the highest in the OECD area. An ageing population also means increased pressure on expenditure going forward. However, the authorities have presented a plan whereby the deficit will be brought down by around 0.5 percentage points a year. Increased revenue (e.g. by broadening the tax base) and continued cuts in public expenditure will cause fiscal policy to tighten. This budgetary restructuring must be finely balanced so as not to jeopardise economic recovery. The aim is to generate a primary budget surplus by the early 2010s.
2.6 The rest of Asia
Strong but slowing growth in the rest of Asia
Growth in Asia excluding Japan was 7.9 per cent in 2004. This was the strongest rate of growth since 1996 despite growth slowing during the course of the year. The slightly lower growth has continued this year. Demand from many industrialised countries has dropped off, and demand for ICT products, so important to this region, has gradually slackened.
However, there are significant regional variations. Chinese GDP growth in particular has been a pleasant surprise at 9.5 per cent year-on-year in both the first and second quarters. Malaysia and Indonesia have also continued to grow strongly, while growth in other parts of the region has slowed. Weak export growth, combined with dwindling domestic demand, meant that growth in South Korea was around 3 per cent during the first half of this year, which is well below the authorities’ growth target of around 5 per cent. There has also been a marked slowdown in Singapore and Thailand relative to last year.
However, new statistics suggest that activity in the region is picking up again. Indicators and monthly statistics also indicate that both output and trade strengthened during the summer. This suggests that GDP growth will speed up slightly during the second half of this year.
The continued strong growth in China during the first half of the year is due primarily to a significant contribution from net exports. Favourable income growth has also led to household consumption contributing more to GDP growth. Investment growth has slowed, not least in overheating sectors like steel, cement and aluminium. At the same time investment growth has accelerated in tight sectors like energy and transport. Despite high commodity costs, inflationary pressure is low. Inflation was 1.8 per cent in July, which can be compared with just over 5 per cent a year ago. Producer prices are also rising more slowly.
Aggregate GDP growth for Asia excluding Japan is forecast to be 7.3 per cent in 2005 before slowing slightly to 7.1 per cent in 2006. In 2007 and 2008 GDP growth in the region is projected to hold around 7 per cent.
25
2.7 Oil prices
Concern about global capacity shortages in oil production and refining, interruptions in oil production and geopolitical unrest have led to sharply rising oil prices in 2005. Recently an unusually active start to the hurricane season in the south eastern United States and Hurricane Katrina’s devastating progress have pushed up already high crude oil prices. At the beginning of September the price of Brent crude for immediate delivery was around USD 65 per barrel.
Diagram 2.3 Price of Brent crude
USD/barrel SEK/barrel
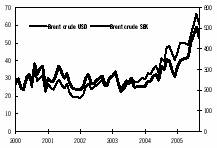
Source: International Petroleum Exchange.
The balance between global production and demand has improved in 2005, leading to rapid stockpiling of crude oil in the OECD. According to the latest forecasts from the International Energy Agency (IEA), this improvement is expected to continue, assuming no unforeseen disturbances. However, the margin between supply and demand is still small, which makes crude oil prices sensitive to supply disturbances. This has helped to drive up the risk premium for oil.
However, there are signs that demand is growing more moderately in China, among others, and the IEA has revised its forecast for global demand growth in 2005 downwards since the beginning of the year. Meanwhile the expansion of production capacity is predicted to begin to have an impact in autumn 2005. Together this is expected to lead to the global supply situation continuing to improve during the forecast period, resulting in a falling risk premium.
The price of Brent crude is forecast to fall back to USD 50 per barrel in December 2005 and USD 45 per barrel at the end of 2006.
However, there is considerable uncertainty about future movements in oil prices. For example, it is still too early to assess the full consequences of Hurricane Katrina’s impact on US oil production and refinery capacity. Further large supply disturbances could push oil prices above the forecast levels.
26
The effects of high energy prices on the global economy
High oil prices have been a source of uncertainty about global economic developments for some time. Although they have put a damper on the global economy, the economy has proved relatively resilient to date. One reason is that today’s oil prices are largely the result of strong economic growth and, as a result, strong demand for oil. Dependence on oil in the OECD area is also much lower now than, for example, at the time of the oil shocks of the 1970s.
In the main scenario the price of crude oil is assumed to fall back during the autumn (see section 2.7), but the risk of oil prices holding at a high level has increased. Should oil prices remain at today’s high levels for a long period (as indicated, for example, by pricing in the forward market), this could have significant effects on the global economy.
High energy prices impact on the economy in several ways. Households cut back consumption volumes when the scope for consumption is limited by higher petrol and heating oil prices. Firms’ transport and other production costs increase. Where producers of goods are able to pass on these costs to consumers, this fuels inflation. Where firms are unable to pass on these costs in the form of higher prices, their margins decrease instead, which can lead to lower investment and reduced recruitment.
Higher energy prices probably result in higher inflation, but no immediate increases in key interest rates are to be expected as central banks do not generally react to temporary changes in energy prices. Instead a slowdown in growth due to higher energy prices may lead to monetary policy being more expansionary than otherwise. However, if the high energy prices persist, they will eventually contribute to rising core inflation, e.g. through higher transport costs and higher producer prices.
High energy prices and increased uncertainty about future movements in oil prices can also have psychological effects. Households and firms may postpone consumption and investment decisions, which can have negative effects on economic activity.
Normally world market prices of refined petroleum products correlate closely with crude oil prices. However, the price of petrol, for example, has risen faster than crude oil prices in 2005 due to a global shortage of refinery capacity. The world market price of petrol soared after Hurricane Katrina, which illustrates how sensitive petrol prices are to supply disturbances. Petrol price margins are an additional risk factor over and above the effects of continued high oil prices.
Crude oil and petrol prices in New York 2005
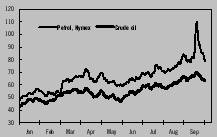
Note: 1 month forward prices.
Source: Nymex.
27
3 The financial markets
Continued low global inflationary pressure has resulted in global bond yields remaining at very low levels. Bond yields are forecast to rise as available resources in the economy decline. The Swedish 10-year government bond yield is estimated to be 4.15 per cent at the end of 2006. Both rising interest rates and higher growth in the United States relative to the euro area, among others, explain why the dollar appreciated against several important currencies during the first half of this year. Looking ahead the dollar is expected to depreciate again to 1.35 against the euro in December 2006. In Sweden very low inflation and weak first-quarter growth figures prompted the Riksbank to lower the key interest rate in June. The Riksbank is now expected to leave the key interest rate unchanged in 2005 before raising it to 2.50 per cent by the end of 2006. The negative interest rate differential relative to the euro area is one reason why the krona has depreciated against other currencies. The krona is expected to strengthen, and the forecast for the trade-weighted TCW index in December 2006 is 124.
3.1 International developments
Continued low interest rates
Low inflation, subdued inflation expectations and few signs of rising inflation globally have resulted in global bond yields remaining at very low levels. Low bond yields and continued expansionary monetary policy mean that financial conditions will continue to stimulate global economic growth for a time.
Since June 2004 the Federal Reserve has raised the US key interest rate by 0.25 percentage points at each monetary policy meeting held. These hikes, which add up to a total increase of 2.50 percentage points, have been made from a very low initial level in the light of the US economy growing faster than potential GDP. At the same time US employment is still growing. Despite the high rate of growth, inflation appears to be under control. The key US interest rate is currently 3.50 per cent, and further hikes are to be expected as available resources in the US economy decline and contribute to higher inflation in the longer term. Signals and statements from the Federal Reserve also suggest that its monetary policy is still believed to be stimulating the US economy. The forecast for the US key interest rate is 4.0 per cent at the end of 2005 and 4.5 per cent at the end of 2006, after which it is expected to be stable.
Following weak growth in 2005 the euro area is expected to grow more quickly in the coming years, due partly to rising domestic demand. Despite relatively subdued growth in recent years, inflation in the euro area has nevertheless been at or above the European Central Bank (ECB) inflation target at times. This has prevented further cuts in the key interest rate. Since June 2003 the refi rate has been 2.0 per cent. As the labour market improves and available resources in the economy decline, the ECB is expected to begin a cautious tightening of monetary policy from the end of 2006 to counter rising inflation in the longer term. The forecast for the refi rate is 2.0 per cent at the end of 2005 and 2.5 per cent in December 2006, and further hikes are anticipated in the ensuing years.
Diagram 3.1 Key interest rates in the United States, the euro area and Sweden
Percent
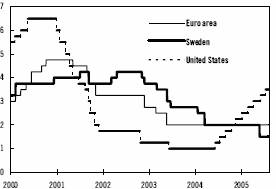
Sources: ECB, Riksbank and Federal Reserve.
Despite strong global growth in 2004, inflationary pressure remains low. One important explanation for this low inflationary pressure is the acceleration in productivity growth in recent years, due partly to new technology, greater competition and the increased importance of growth economies for global trade. Low inflation, low key interest rates and increased global integration of the capital markets seem to have had a major impact on pricing in the bond markets. Despite a relatively bright growth outlook, global bond yields remain at historically very low levels. However, there was a certain upswing in long bond yields in both the United States and Germany during the summer.
28
Although the prospects for continued low inflation are good, the combination of tighter monetary policy and a decline in available resources should mean that long global bond yields will rise during the forecast period. Although bond yields are expected to rise, there is a great deal to suggest that interest rates will remain moderate, including in the longer term. Although lower US budget deficits will reduce the risk of a sharp increase in interest rates, low private savings remain a risk factor. Nor is it possible to rule out a faster and more far-reaching reform of Chinese foreign exchange policy, with drastically reduced demand for US government bonds as a result, causing US bond yields to climb higher than anticipated. The forecast assumes that German and US 10-year government bond yields will rise to 3.85 and 4.60 per cent respectively in December 2005, and 4.15 and 4.90 per cent respectively in December 2006.
Diagram 3.2 10-year government bond yields in the United States, Germany and Sweden
Percent

Dollar to weaken again
In 2005 the US dollar has appreciated against other currencies, including the euro and the yen. Important reasons for the dollar’s appreciation are a growing interest rate differential between the United States and the euro area, and continued stable US growth. US short-term interest rates have risen as the Federal Reserve has gradually raised the key interest rate. At the same time continued falls in European bond yields have meant that the interest rate differential between Europe and the United States has grown for both short and long maturities. The relatively higher growth in the United States appears to have helped the inflow of capital from foreign investors into US portfolio assets and direct investments to grow again after falling in recent years. Together these factors seem to have contributed to the dollar strengthening this year.
This strengthening is believed to be temporary, and the dollar is expected to weaken again during the forecast period. The US current account deficit continues to grow relative to GDP, and so the need for foreign capital to finance these deficits also continues to grow. To date Asian central banks, among others, have contributed to this financing by investing substantial proportions of their growing currency reserves in US Treasury bonds.
However, in July the Chinese central bank announced that the previous pegging of the yuan to the dollar would be abandoned in favour of a more flexible link to a basket of currencies. This is a step towards a more market-based valuation of the yuan, and it may mean that current account surpluses in China and other Asian countries will be invested increasingly in currencies other than the dollar.
Diagram 3.3 The US dollar against the yen and euro
JPY/USD EUR/USD
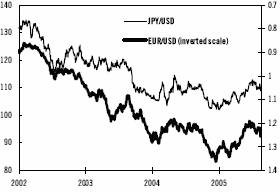
Source: Reuters.
With falling official capital inflows, there is a need for increased private capital inflows into the United States to offset the current account deficit and counter a substantial weakening of the dollar. As interest rate and growth differentials relative to the rest of the world narrow during the forecast period, private capital flows will probably not be enough. A correction of the US current account deficit may therefore be necessitated by insufficient access to foreign savings, with a weaker dollar as a result.
The forecast assumes that the dollar will weaken to 1.25 against the euro and 105 against
29
the yen at the end of 2005, and 1.35 against the euro and 97 against the yen in December 2006.
Mixed performance by global stock markets
At the beginning of September most major global stock market indices were up on the beginning of the year. Thus the positive trend seen since the first half of 2003 is continuing on the back of sharply improved earnings in the business sector. However, stock market performance has been more mixed in 2005. European shares have done best, with indices rising by between 10 and 15 per cent, while broad indices in the United States and Japan, for example, have fared less well, gaining around 2-3 per cent since the beginning of the year. Although the broad stock market indices have risen by between 50 and 80 per cent in recent years, these gains are believed to be motivated partly by firms’ strong earnings growth. Given the low returns in the bond market, the stock markets would appear to be reasonably valued at present.
Diagram 3.4 Stock market developments in the United States, the euro area and Sweden
Index 2002-01-01=100
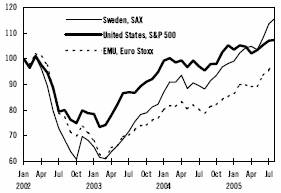
Sources: OM Stockholmsbörsen, Standard & Poor´s and Stoxx.
3.2 Developments in Sweden
Expansionary monetary policy
In June the Riksbank lowered the Swedish key interest rate by 0.5 percentage points to a historically low 1.5 per cent. This cut made it one of the lowest in the world, and is a result of the Riksbank expecting inflationary pressure over the next two years to be subdued.
Although inflation has been surprisingly low and the outlook is still subdued, an increase in resource utilisation in the next few years suggests that the Riksbank will begin to tighten monetary policy during the second half of 2006. Despite this tightening, the Swedish key interest rate is forecast to be below that of the euro area for much of the forecast period. The forecast for the repo rate is 1.50 per cent in December 2005 and 2.50 per cent at the end of 2006. Further tightening of monetary policy is anticipated in 2007.
Low Swedish bond yields
Bond yields have continued to fall this year in several euro countries, and they have fallen even further in Sweden. At the beginning of September the Swedish 10-year government bond yield dropped below 3 per cent, which means that it has fallen by more than a percentage point since the beginning of the year.
The sharp fall in Swedish bond yields is due partly to very low Swedish inflation. Swedish bond yields have also been affected by the weak Swedish GDP figures for the first quarter and the subdued labour market. Speculation about growing demand for long nominal bonds has played a role as well. This is a result of coming new investment rules for occupational pension and life insurance companies. The new rules involve changes in the guidelines for how insurers and pension funds are to manage and invest policyholders’ assets, and how their obligations to customers are to be valued. The new investment rules are likely to lead to increased demand for domestic bonds with long maturities.
Diagram 3.5 The difference between 10-year government bond yields in Sweden and Germany
Basis points
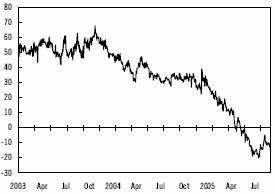
Source: Reuters.
30
However, the forecast assumes that Swedish bond yields will rise during the second half of this year and next year as available resources in the economy decline and monetary policy is tightened. Swedish bond yields are expected to climb slightly more than German yields as the key interest rate differential relative to the euro area gradually narrows. The differential between Swedish and German bond yields is therefore expected to decrease during the forecast period. The forecast for the Swedish 10-year bond yield is 3.75 per cent in December 2005 and 4.15 per cent in December 2006.
Undervalued krona to strengthen
Having hit its strongest level since 2000 at the end of last year, the krona weakened during the spring and early summer. The currencies against which the krona depreciated include the dollar and the euro. This weakening of the krona is probably related to both Swedish bond yields and the Swedish key interest rate now being lower than those in the euro area.
The krona is expected to strengthen. Contributing factors include the Swedish current account continuing to run a large surplus, and growth being expected to be higher in Sweden than in the euro area as a whole. In the longer term the negative interest rate differentials relative to the euro area are also expected to disappear.
Diagram 3.6 TCW index
Index
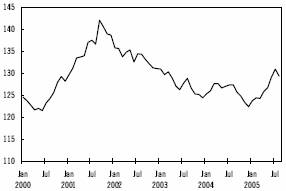
Source: Reuters.
The strength of the dollar will impact on the strength of the krona in the longer term. A weaker dollar has contributed to the strengthening of the krona in recent years, and is expected to do so in the future as well. The forecast for the trade-weighted TCW index is 127 in December 2005 and 124 at the end of 2006. The krona is then expected to strengthen further in 2007.
Strong first half for Stockholm stock exchange
At the beginning of September the Stockholm stock exchange had gained almost 20 per cent since the beginning of the year, so outperforming the majority of exchanges in comparable countries. Strong growth in the prices of several of the largest listed firms has contributed to the upswing. The upswing has been underpinned by continued good earnings growth at many firms, which has led to the upward adjustment of earnings expectations for this year and 2006. The valuation of the Stockholm exchange as a whole does not therefore appear to be worryingly high.
Continued low bond yields and a weaker krona have contributed to the positive performance of the Stockholm stock exchange. Although the krona is forecast to strengthen and bond yields to climb, this is expected to coincide with rising growth, especially in the euro area and Sweden. At the same time the growth outlook for the United States and countries in Asia remains bright. As a result, the anticipated movements in interest and exchange rates should not have any major impact on pricing on the Stockholm stock exchange; rather the prospects of continued positive growth in share prices appear to be good.
Balance of payments financial account
The Riksbank’s balance of payments statistics reveal that Swedish and foreign investors’ purchases and sales of shares and interest-bearing securities resulted in a net inflow of SEK 112.7 billion in the first half of 2005 (see Table 3.1). The net inflow consisted solely of investments in interest-bearing securities, whereas shares generated a net outflow. To some extent these flows impacted on the krona; to what extent depends on what proportion of these portfolio investments has been hedged against exchange rate fluctuations, i.e. what proportion does not entail the purchase and sale of Swedish kronor.
31
Table 3.1 Balance of payments
| | 2004(1) | | 2005(1) | |
A. Current account | | 110.8 | | 100.3 | |
B. Capital transfers | | -0.5 | | 0.7 | |
C. Financial balance | | -57.7 | | 47.5 | |
Direct investment | | -44.2 | | -103.5 | |
Portfolio investment | | -71.8 | | 112.7 | |
Debt securities | | -43.8 | | 113.0 | |
Swedish | | -70.0 | | -38.7 | |
Foreign | | 26.1 | | 151.7 | |
Equities | | -28.0 | | -0.3 | |
Swedish | | -24.9 | | -12.3 | |
Foreign | | -3.0 | | 12.1 | |
Financial derivatives | | 0.6 | | 0.4 | |
Other investment | | 62.5 | | 38.1 | |
Reserve assets | | -4.6 | | -0.4 | |
D. Net errors and omissions | | -52.8 | | -148.5 | |
(1) January to June.
Source: Riksbank.
Table 3.2 Interest and exchange rate assumptions
Final entry for each year
| | 2004 | | 2005 | | 2006 | | 2007 | | 2008 | |
Repo rate | | 2.00 | | 1.50 | | 2.50 | | 4.00 | | 4.00 | |
6-mth interest rate | | 2.05 | | 2.00 | | 2.70 | | 4.00 | | 4.00 | |
5-year interest rate | | 3.33 | | 3.15 | | 3.65 | | 4.15 | | 4.15 | |
10-year interest rate | | 3.90 | | 3.75 | | 4.15 | | 4.35 | | 4.35 | |
Spread Swe-Ger 10 yr | | 0.25 | | -0.10 | | 0.00 | | 0.10 | | 0.05 | |
6-mth EURIBOR | | 2.16 | | 2.00 | | 2.75 | | 3.40 | | 4.00 | |
TCW index | | 122 | | 127 | | 124 | | 121 | | 121 | |
EUR/SEK | | 8.98 | | 9.20 | | 9.10 | | 8.90 | | 8.90 | |
USD/SEK | | 6.70 | | 7.36 | | 6.74 | | 6.36 | | 6.36 | |
EUR/USD | | 1.34 | | 1.25 | | 1.35 | | 1.40 | | 1.40 | |
Source: Ministry of Finance.
32
Low interest rates benefit households
Household mortgage interest rates are at historically low levels. Generally falling key and market interest rates are the most important explanation, but lower risk premiums, greater competition and increased interest in lending to households have also contributed.
Nominal Swedish bond yields have been trending downwards since the early 1990s. For example, since 1995 the Swedish 5-year government bond yield has fallen from around 11 per cent to less than 3 per cent. Today’s low interest rates in Sweden and abroad are due to several factors, including low and stable inflation, strong confidence in monetary policy and high global savings due to demographical factors. At the same time global capital markets have become increasingly integrated. New international capital adequacy rules for credit institutions due to be introduced in the next few years, together with new risk assessments which paint a brighter picture of households as a credit risk, have also led to growing interest in lending to households. Swedish credit institutions’ interest margins have been squeezed as a result of growing competition in the Swedish private market. Taken together, these factors have resulted in interest rates on loans to Swedish households and firms falling even further than global interest rates during the same period.
Mortgage rate and difference against government bond yield, 5 year
Percent & #160; Percentage points
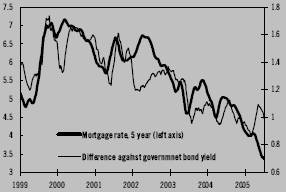
Source: Reuters.
Sharply falling nominal credit interest rates have contributed to lending to Swedish households more than doubling in volume in the last decade to SEK 1,464 billion(4) in June 2005. Despite this strong credit expansion, with year-on-year growth of around 10 per cent in recent years, the cost of interest payments has fallen. At the same time households’ disposable income has increased, with the result that households’ interest expenditure relative to disposable income has halved since 1995 to less than 4 per cent. Meanwhile rising property prices and favourable growth in the prices of financial assets have meant that households’ net wealth position remains at historically high levels.
(4) Source: Riksbank.
33
4 Foreign trade
Last year Swedish exports benefited from a flourishing global economy. However demand for Swedish exports slowed at the end of 2004 and during the beginning of the current year. A relatively strong demand for Swedish export goods during the period 2006–2008 is however expected to lead to strong future growth in exports. Imports are growing somewhat faster than exports as a result of strong domestic demand. Overall this means a reduction in the contribution of foreign trade to GDP growth of approximately 0.1 percentage points this year and 0.3 percentage points next year.
Table 4.1 Exports and imports of goods and services
| | SEK | | | | | | | | | | | |
| | billion | | Percentage change in volume | |
| | 2004 | | 2004 | | 2005 | | 2006 | | 2007 | | 2008 | |
| | | | | | | | | | | | | |
Exports of goods | | 899 | | 9.8 | | 4.2 | | 6.3 | | — | | — | |
Processed goods(1) | | 764 | | 9.7 | | 4.1 | | 6.5 | | — | | — | |
Exports of services | | 279 | | 13.0 | | 4.0 | | 5.5 | | — | | — | |
| | | | | | | | | | | | | |
Total exports | | 1 178 | | 10.5 | | 4.2 | | 6.1 | | 6.2 | | 5.3 | |
| | | | | | | | | | | | | |
Imports of goods | | 722 | | 7.7 | | 5.6 | | 7.0 | | — | | — | |
Processed goods(1) | | 557 | | 9.4 | | 6.2 | | 7.9 | | — | | — | |
Imports of services | | 251 | | 4.9 | | 2.5 | | 5.6 | | — | | — | |
| | | | | | | | | | | | | |
Total imports | | 974 | | 6.9 | | 4.8 | | 6.7 | | 6.5 | | 6.0 | |
(1)Classifications according to SNI.
Sources: Statistics Sweden and Ministry of Finance.
4.1 Exports of goods
Strong growth in 2004 followed by temporary slowdown
The very strong global economic growth last year contributed to a growth in Swedish exports of goods of nearly 10 per cent. The demand was strongly weighted towards products of which Sweden is a relatively large producer, such as telecommunication equipment and commodities. Swedish export industries have continued to be highly competitive, despite the strengthening of the krona, as a result of significant improvement in productivity and a lower level of wage increases.
During the last quarter of 2004 and the first quarter this year the growth in export goods came to a halt. This was partly due to a temporary slowing of the demand in Swedish export markets. As shown in Diagram 4.1, world market growth slowed at the same time. It was primarily exports of processed goods that showed a marked weakening during the first quarter this year while growth in commodities continued strongly.
The strong growth in exports during the second quarter this year, which was reported in the preliminary National Accounts, points to a recovery. During the first half of the year, growth in exports of goods rose by almost 4 per cent compared with the second half of last year, measured after seasonal adjustment. However, during the second half of 2005, goods exports are expected to increase at a somewhat slower rate. The slowing of the growth in exports of goods in the second half of the year is also evident in indicators regarding the level of export orders. According to the Business Tendency Survey of the National Institute of Economic Research (NIER), the growth in export orders reduced significantly during the second half of 2004 and in the beginning of 2005. It is primarily within the investment goods industry that the export order level has slowed from the very high rate during the beginning of 2004. Orders for input goods indicate a slowing but nevertheless a continuing strong growth level for input goods during the second half of the year. Exports of goods are expected to grow by 4.2 per cent this year.
Diagram 4.1 World market growth and growth in exports
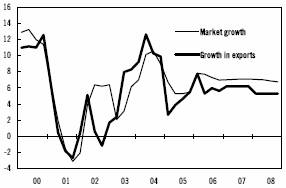
Sources: Statistics Sweden and Ministry of Finance.
34
Strong demand for Swedish export goods during 2006–2008
World market growth is expected to pick up in 2006. As described in section 5.1, Swedish export firms are expected to continue to be highly competitive during 2006. The conditions for Swedish exports next year are consequently favourable. Exports of goods are forecast to grow by 6.3 per cent during 2006. Fewer working days in 2006 compared with 2005 will reduce export growth by 0.5 percentage points. Calendar adjusted growth in exports will consequently increase to 6.8 per cent in 2006. World market growth is even expected to be strong during 2007 and 2008 as well, providing conditions for relatively strong export growth. Total exports are forecast to grow by 6.2 per cent in 2007 and 5.3 per cent in 2008.
Future slowdown in export price increases
Last year the prices of commodity exports increased significantly as a result of the high price of oil and the strong demand from, for example, China and the United States. Export prices of processed goods fell, however, partly due to a generally strong competitive situation and a significant improvement in productivity in the telecommunication equipment industry. Overall export goods prices fell somewhat last year compared with 2003.
Swedish export firms in the investment goods industry increased their export prices during the first half of 2005. Rising prices for raw materials, boosted by the weakening of the krona, have been recovered through higher prices. Moreover the strongly competitive situation in some sectors of industry makes price increases possible for Swedish export firms. Export prices of processed goods are expected to rise at a somewhat slower pace during the second half of this year and during 2006 as a result of, for example, lower costs for input goods arising from falling commodity prices. Commodity prices are expected to fall this year and next year in line with slower growth in demand and a lower oil price.
After three years of falling prices for export goods, Swedish export prices are expected to increase by 1.2 per cent this year. Despite the prices of Swedish export goods measured in krona terms increasing, the weakening of the krona means that prices measured in a common currency are more competitive than was the case last year.
Export price increases are expected to slow in 2006. At the same time a strengthening of the krona is expected, leading to prices measured in a common currency in the export markets rising at a faster rate. Compared with 2005 the prices are expected to contribute to a somewhat worsened competitive situation for Swedish export firms.
4.2 Imports of goods
Slightly weaker increase in imports during the beginning of 2005
Last year imports of goods rose by just over 7 per cent. Imports of processed goods increased by slightly over 9 per cent while imports of commodities showed an increase of just under 3 per cent. The relative slowdown in the Swedish economy resulted in a somewhat weaker trend in imports during the first half of 2005. According to preliminary statistics from the National Accounts, imports of goods were 5.3 per cent higher than during the corresponding period of 2004. The more modest growth in imports is probably largely attributable to the fact that Swedish exports, which have a high import content, showed weaker growth.
The trend slowed particularly during the first quarter of 2005 when imports of goods increased by only 3.8 per cent compared with the corresponding quarter of 2004. The low level of imports of goods is largely explained by the marked fall in imports of crude oil in comparison with the high level of last year. Imports of crude oil, which comprise approximately 5 per cent of total imports of goods, declined by nearly 24 per cent. Imports of processed goods also showed a more modest increase during the first quarter. Compared with the first quarter of 2004, imports of processed goods rose by 5.7 per cent.
There is only a preliminary report from the National Accounts for the second quarter of 2005. According to this, imports of goods increased by nearly 7 per cent compared with the second quarter last year.
35
Strong increase in imports of processed goods in 2005 and 2006
The demand for imported goods is expected to increase in the near future. Following a pause in growth, exports are now increasing at a favourable rate and which is believed will increase the need for imports. Domestic demand will also contribute to increased imports in 2005 and 2006. Substantial growth in investment is expected this year, particularly in machinery, and partly realised through increased imports. Next year will also see a marked increase in household consumption. In addition, it is expected that the destocking of input goods in industry seen in recent years will have finished, and instead stock levels will be rebuilt in the near future, contributing to increased imports.
It is considered therefore that there are sound conditions for a strong increase in the growth in imports during the forecast period. Imports of processed goods are forecast to increase by 6.2 per cent in 2005 and 7.9 per cent in 2006. Imports of commodities, which comprise nearly a fourth of the total imports of goods, are expected to increase somewhat slower. Overall this means that imports of goods will rise by 5.6 per cent this year and by 7.0 per cent next year. During the years 2007 and 2008 imports will continue to rise at a somewhat faster rate than exports as a result of a relatively strong growth in household consumption expenditures. Total imports of goods and services are calculated to increase by 6.5 per cent in 2007 and 6.0 per cent in 2008.
Rising import prices during 2005
According to Statistics Sweden’s producer price index, the prices of Swedish imports of goods increased by as much as 5.5 per cent during the first half of this year in comparison with the corresponding period of last year. The price increase is largely due to rising international market prices but also probably due to the fall in the value of the krona during the first half of the year. The prices of imported processed goods increased during the period by 2.5 per cent after a number of years when prices went down. The increase in prices for processed goods was fairly widely spread and affected a number of goods, but the rise in price was relatively modest for consumer goods.
Commodity prices rose sharply during 2004 and the price increases continued during the first half of 2005. Imports of crude oil and petroleum products, which together comprise approximately 10 per cent of total imports of goods, saw price increases of nearly 30 per cent. Prices of steel and metals also continued to rise.
The krona is expected to strengthen somewhat in the near future. At the same time, world prices of goods are expected to rise. Against this background, prices of imports of processed goods are forecast to go up by just over one per cent per year during 2005 and 2006.
The prices of imported commodities are forecast to rise by just over 12 per cent this year, which is mostly due to the recent high price of oil. The world market price for crude oil is however expected to fall in the near future. The price at the end of the 2005 is assumed to reach 50 dollars per barrel and 45 dollars per barrel at the end of 2006. The lower world market price for oil in combination with a somewhat stronger krona will result in commodity prices falling by nearly 6 per cent in 2006.
Overall this means that prices of imported goods will rise by nearly 4 per cent in 2005 followed by some reduction in 2006.
The high price of crude oil results in Swedish import prices being forecast to rise more than export prices this year (See Table 4.2). This will lead to a worsening of Sweden’s terms of trade, that is, the ratio of export prices to import prices. The price of oil is assumed to go down next year resulting in lower import prices and improved terms of trade.
Table 4.2 Terms of trade
Percentage change
| | 2004 | | 2005 | | 2006 | | 2007 | | 2008 | |
Export prices | | -0.2 | | 1.2 | | 0.6 | | 1.2 | | 1.2 | |
Import prices | | 0.8 | | 3.2 | | -0.4 | | 1.5 | | 1.5 | |
Terms of trade | | -1.0 | | -2.0 | | 1.0 | | -0.3 | | -0.3 | |
Sources: Statistics Sweden and Ministry of Finance.
It is difficult to assess to what extent higher import prices will affect the volume of imported goods during the forecast period. Import prices should be related to the prices of domestically produced goods. The latter have risen somewhat since the end of 2001 while prices of imports have gone down, which has contributed to the sharp fall in the relative price of imported goods. Even if the relative price rises during the forecast
36
period, the level will not be high in a historical perspective. Moreover it is difficult to substitute some imported goods by domestic production, particularly in the short term. Since both firms and consumers can to some extent bring forward or delay imports, the volume can be affected by price changes. Overall it is not assumed that the volume of imports during the forecast period will be affected by the rise in prices to any significant extent.
4.3 Trade in services
Exports of services grew by 13.0 per cent in 2004. Merchanting, that is, the trade in goods of Swedish firms abroad which does not cross Swedish borders, contributed as much as 0.4 percentage points to GDP growth. Merchanting is classified as Swedish exports of services. Imports of services grew by 4.9 per cent last year compared with 2003. The rate of increase is largely attributable to foreign travel by Swedes (classified under imports of services in the National Accounts), which increased sharply. Trade in services contributed as much as 0.8 percentage points to GDP growth.
According to the preliminary National Accounts, there was a substantial reduction in the growth of both imports and exports of services during the first half of this year compared with last year. The big increase in merchanting seen in 2004 declined at the beginning of this year.
Exports of services are expected to grow at a slower rate both this and next year than during 2004. It is primarily exports of “other business services”, including consultancy, licensing, patent and banking services, which are expected to decline in comparison with last year. To a large extent, exports of these services follow the trend in exports of goods. The declining global demand during the beginning of the year also provides an explanation of a weaker trend in other business services this year. Consumption by foreigners in Sweden, which is classified under exports of services, is on the other hand expected to grow at a good and increasing rate in comparison with 2004. Growth in exports of services is forecast to be 4.0 per cent this year and 5.5 per cent next year.
Imports of services are also expected to grow more slowly this year compared with last year. Foreign travel by Swedes declined during the beginning of the present year, which is probably a result of the tsunami disaster in Asia at the turn of the year. Foreign travel by Swedes is expected to rise at a favourable rate in the second half of this year and in 2006. The accelerated growth forecast for imports of goods in 2006 is expected to contribute to a higher demand for imports of corporate services. Imports of services are estimated to grow by 2.5 per cent this year and by 5.6 per cent next year.
The contribution to GDP growth from trade in services is estimated at 0.2 percentage points this year and 0.1 percentage points in 2006.
4.4 Current account balance
The current account surplus represented 8.3 per cent of GDP in 2004, an increase of 0.7 percentage points compared with 2003. This is partly attributable to further growth in the trade balance surplus. The services balance and net investment income also made a positive contribution to the current account surplus. A substantial improvement in productivity, strong public finances, a high demand for exports and an ageing population contribute to the large current account surplus.
Table 4.3 Current account balance
SEK billion, current prices unless otherwise stated
| | 2004 | | 2005 | | 2006 | | 2007 | | 2008 | |
| | | | | | | | | | | |
Trade balance | | 173 | | 152 | | 167 | | 173 | | 175 | |
per cent of GDP | | 6.8 | | 5.8 | | 6.0 | | 6.0 | | 5.8 | |
Service balance | | 42 | | 45 | | 48 | | 49 | | 49 | |
Factor income | | 32 | | 38 | | 40 | | 42 | | 43 | |
Current transfers | | -36 | | -36 | | -40 | | -42 | | -44 | |
| | | | | | | | | | | |
Current account | | 211 | | 198 | | 215 | | 222 | | 223 | |
per cent of GDP | | 8.3 | | 7.5 | | 7.8 | | 7.6 | | 7.3 | |
Capital transfers | | 1 | | -3 | | -3 | | -4 | | -4 | |
| | | | | | | | | | | |
Net lending | | 212 | | 195 | | 212 | | 218 | | 219 | |
per cent of GDP | | 8.3 | | 7.4 | | 7.6 | | 7.5 | | 7.2 | |
Sources: Statistics Sweden and Ministry of Finance.
Foreign trade’s positive contribution will decrease this year in comparison with last year while the contribution from net investment income is estimated to rise. A larger contribution from foreign trade is expected in 2006 than compared with this year in addition to a continuing rise in net investment income.
37
Overall the current account surplus is forecast to represent 7.5 per cent of GDP this year and 7.8 per cent in 2006.
4.5 Gross National Income
Gross National Income (GNI) is obtained by adding the income of Swedes abroad (measured in current prices) to GDP and subtracting the income of non-residents in Sweden. GNI is used, for example, as the basis for calculating aid to developing countries and Sweden’s contribution to the EU. Since 2003 Sweden’s GNI has been higher than GDP. This is expected to continue in the future when Sweden’s net financial position relative to the rest of the world improves as a result of the large current account surplus.
Table 4.4 Gross national income (GNI)
SEK billion, current prices
| | 2004 | | 2005 | | 2006 | | 2007 | | 2008 | |
| | | | | | | | | | | |
GDP | | 2 546 | | 2 622 | | 2 768 | | 2 906 | | 3 039 | |
Primary income(1) | | 30 | | 39 | | 41 | | 42 | | 43 | |
| | | | | | | | | | | |
GNI | | 2 575 | | 2 661 | | 2 809 | | 2 948 | | 3 082 | |
(1) Wages, investment income, subsidies and taxes net to the rest of the world.
Sources: Statistics Sweden and Ministry of Finance.
38
World market growth and its link to Swedish export growth
Sweden has a small, open economy which is highly influenced by global economic trends. This influence is felt through a number of channels, of which trade in goods and services (the sum of exports and imports) is one of the more important. The purpose of this explanatory box is to describe the link between global growth and Swedish exports, which the concept “World Market Growth” (WMG) encapsulates.
Trade in goods and services currently amounts to just over 85 per cent of GDP in Sweden, compared with approximately 25 per cent of GDP in the United States and Japan. Foreign trade’s importance has moreover increased significantly during the last 20 years. In 1980 trade in goods and services in Sweden amounted to approximately 60 per cent of GDP. Growth in the rest of the world is consequently very important for economic growth in Sweden in real economic terms.
WMG reflects the demand for imports which Swedish exporters encounter in world markets and it is consequently an important link between international and Swedish growth. Good growth in the countries to which Sweden is a large exporter means an increasing demand for Swedish goods and services. The majority of Swedish exports end up in a relatively small number of countries. Just over 70 per cent of Swedish exports go to Europe. The two most important individual export markets are Germany and the US which represent approximately 11 per cent each of total exports. The total for the three Nordic countries amounts to just over 20 per cent of total exports. Exports to countries outside of Europe or the US only represent 18 per cent. From the perspective of Swedish exports, it is consequently more important, in the short run at any rate, that the euro area, the US and the Nordic countries show good growth as opposed to fast growth in Asia and Latin America. In the longer term however, the growth economies are expected to become of increasing importance. The geographical distribution of exports explains why the Ministry of Finance focuses mostly on growth in Europe and the United States in terms of international forecasts.
WMG at a given moment in time is estimated in the following way: for each country (or region) which imports goods from Sweden, the country’s (or region’s) total growth in imports in fixed price terms is multiplied by the share of Swedish exports which go to the country or region in question. The total of these two products is WMG. Since a relatively large share of Swedish exports goes to the United States, for example, WMG is affected more by strong import growth there than by strong import growth in Australia, for example.
In order to improve the value of WMG in forecasting, the Ministry of Finance has developed import forecast models for the most important export countries (the United States, Germany, France, Italy, Great Britain, Denmark, Norway and Finland) as support information in the analysis. The models are based on growth forecasts which the Ministry of Finance makes on these countries in real economic terms.
At the moment the import models cover just over 60 per cent of the total export market. For the remaining 40 per cent, external forecasts are used in combination with internal estimates.
Diagram B.1 WMG and Swedish exports 1994–2005
Per cent
Sources: Statistics Sweden and Ministry of Finance.
The above diagram shows WMG and Swedish export growth over a ten-year period and illustrates the significance of WMG in the export forecasts. There is good agreement between the two and there is a clear, long-term relationship between the variables. There are periodic deviations: exchange rate effects, changed market shares and the composition of exports (in relation to demand) are three factors which can explain why WMG and Swedish exports can show different trends in the short term. In addition, growth in exports is usually higher than WMG during an economic upturn but lower in a downturn. That aside, WMG is one of the most important determinants for Swedish exports.
39
5 Business sector output
This year, production growth in the business sector will slow. Growth in industry will slow as a consequence of the weaker global economy. In the near future, domestic demand is expected to increasingly fuel growth, resulting in a higher level of production growth in the service sector and construction industry. Next year, industrial activity is forecast to pick up slightly compared with 2005 thanks to a more favourable global economy. Production growth in the service sector is also likely to be higher in 2005 as domestic demand continues to strengthen. Overall business sector output is estimated to increase by 3.0 per cent in 2005 and 3.4 per cent in 2006.
Output expected to slow
Industry accounted for the strongest growth in the business sector last year. The global economy was healthy, which improved the situation for export firms. This year and next, however, production growth in industry is expected to fall off compared with 2004 as a consequence of a lower level of demand in important export markets.
For the service sector, the outlook is relatively bright. Rising private consumption is contributing to growing trade and the private service sector is benefiting from industrial firms’ profit growth and high level of investment. Therefore, production growth in the service sector is forecast to grow this year and next.
In the construction industry, the future looks bright, particularly for firms in residential construction. Residential construction growth is expected to continue this year and in 2006, which will substantially boost overall output in the construction industry.
The lower level of growth in industry will check overall growth in the business sector but will be offset by a favourable rate of growth in the service sector and the construction industry. Total business sector output is estimated to rise by 3.0 per cent in 2005 and 3.4 per cent in 2006. Subsequently, growth in the business sector will level off as the GDP gap gradually closes. In 2007 and 2008, production growth is forecast at 3.3 per cent and 2.9 per cent respectively.
This year and next, productivity growth will slow in industry and the service sector. Business sector productivity should rise overall by 2.2 per cent in 2005 and 2.6 per cent in 2006.
Table 5.1 Business sector output
| | SEK billion | | Percentage change in volume | |
| | 2004(1) | | 2004 | | 2005 | | 2006 | |
| | | | | | | | | |
Agriculture, forestry, fisheries | | 41 | | 1.2 | | -0.4 | | 1.0 | |
Industry | | 474 | | 9.4 | | 3.2 | | 4.6 | |
Electricity, gas, heating | | 64 | | 3.2 | | 2.1 | | 1.4 | |
Construction | | 102 | | 3.6 | | 7.5 | | 6.0 | |
Services | | 1 083 | | 2.2 | | 2.6 | | 2.8 | |
Total business sector(2) | | 1 764 | | 4.1 | | 3.0 | | 3.4 | |
(1) Current prices.
(2) Excluding FISIM.
Sources: Statistics Sweden and Ministry of Finance.
5.1 Industry
High production growth last year
Last year, industrial output picked up by 9.4 per cent, which was the strongest rate of growth since 1995. The very strong growth of last year can be largely explained by the production growth of export-oriented industrial firms. The inflow of new orders from export markets was very promising in early 2004 because of the strong global economy.
The increase in output in the investment goods industry was particularly marked, including motor vehicles and telecommunication equipment, where the growth approached 22 per cent last year. The investment goods industry accounts for some 35 per cent of industry’s value added. In the intermediate goods industry, which accounts for around 39 per cent of industry’s value added, output rose by more than 5 per cent.
Output slowed in late 2004
In late 2004, demand dropped for many export-oriented industrial firms. The growth in orders received from export markets slowed as the global economy entered a calmer phase. In early 2005, this slowing trend in orders received continued. As a consequence, industrial output levelled off considerably during the first six months of 2005 compared with the same period last year.
40
The fact that the outlook for industrial firms has deteriorated and that output slowed in early 2005 compared with 2004 is confirmed by the National Institute of Economic Research’s Business Tendency Survey.
The Business Tendency Survey is an important indicator of economic developments. On the other hand, it is difficult to use the forward-looking indicators in the Business Tendency Survey to accurately estimate the inflow of new orders and production growth, etc. According to the confidence indicator in the Survey, industrial activity stabilised during the summer. Also, output is still rising but at a lower rate in relation to late 2004 (see Diagram 5.1), and according to the forward-looking indicator, output is increasingly expected to pick up rather than drop in the third quarter.
Diagram 5.1 Production volume according to the Business Tendency Survey
Net balance
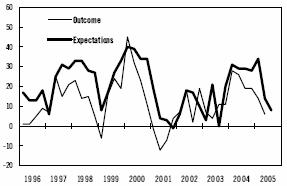
Source: NIER.
Favourable prospects for production growth
One important prerequisite if Swedish industry is to be able to boost output in pace with demand is its competitiveness. Industry’s relative unit labour cost, measured in a national and common currency, is one tool for analysing industry competitiveness in relation to competitor countries.
Industry’s relative unit labour cost measured in national currency, i.e. the cost of labour to produce one unit of a good in Sweden in relation to competitor countries without adjusting for exchange rate effects, rose sharply in the 1980s. Since the early 1990s, the relative unit labour cost in national currency has gradually declined, and was in 2004 lower than in the early 1980s. The reason for this is the relatively high productivity growth in relation to Sweden’s competitor countries, which has offset the rising cost of labour.
The relative unit labour cost in a common currency, i.e. the cost of labour to produce one unit of a good in Sweden in relation to competitor countries while adjusting for exchange rate effects, has dropped even more. This is because the Swedish krona depreciated gradually in the 1980s and 1990s.
Diagram 5.2 Industry’s unit labour costs in Sweden compared with 11 OECD countries
Index 1980=100
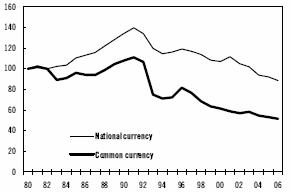
Sources: NIER, Statistics Sweden and Ministry of Finance.
This year and next, the development of the relative unit labour cost in a common currency will be favourable. In other words, Swedish industry appears to remain competitive from a historical perspective.
Production growth to slow
Developments in industry in the next few years will be largely dependent on the inflow of new orders from export markets. Sweden has a small and open economy that is dependent on developments in the rest of the world.
The prospects for an increased number of orders from export markets appear to be relatively favourable. The economies of Sweden’s most crucial export countries are likely to recover from late 2005 through 2006, giving export firms good opportunities to boost output in the near future. The global economy is, however, less healthy than it was in 2004. Also, the demand from Sweden’s most important export countries is not expected to be as high as during 2004, thus restraining an increase in production.
Growth in the crucial Swedish motor vehicle and telecommunication equipment industries
41
will be slower in relation to 2004. In 2004, the demand for telecommunication equipment rose significantly as a result of a low level of investment in the telecommunications sector in 2001 and 2002. In 2005, investment growth in the telecommunications sector is forecast to return to more normal levels, which will also have an impact on output. Production growth will also slow in the automotive industry in 2005 and 2006 as a consequence of weaker demand from the euro area.
All in all, industrial output is estimated to rise by 3.2 per cent in 2005 and by 4.6 per cent in 2006.
Productivity growth remains high
Industrial productivity increased by 9.3 per cent in 2004. The scope for higher industrial productivity is expected to remain considerable for the time being. Average hours worked are therefore expected to continue their downward trend. This year and next, however, industrial productivity growth will slow as a result of lower production growth compared with last year. Industrial productivity is estimated to rise by 4.7 per cent in 2005 and 6.2 per cent in 2006.
Diagram 5.3 Productivity growth in industry
Percent

Sources: Statistics Sweden and Ministry of Finance.
Rising profit shares
Last year, productivity growth in industry was at a very high level. This boosted industry profit shares despite the fact that Swedish export prices for processed goods fell and the cost of raw materials rose.
This year and in 2006, profit shares are expected to continue rising. Productivity growth will remain high, giving continued favourable margins in relation to firms’ costs for wages and input goods. Wage growth will remain subdued. The demand for industrial goods is also assessed as relatively strong, enabling Swedish industrial firms to adjust prices without losing market shares.
5.2 The construction industry
Residential construction boosting construction activity
Swedish construction activity picked up last year and overall building and construction investment rose by 3.8 per cent. This growth was underpinned by a sharp increase in housing investment amounting to 16.1 per cent (see Table 5.2).
The construction industry’s optimism is unusually marked. The NIER’s Business Tendency Survey indicates a large inflow of new orders and expectations in the construction market for the year ahead are high. The number of new housing starts is expected to rise both this year and in 2006 (see section 10.3). Building and construction investment in the manufacturing industry has, however, dropped in the past few years, and Statistics Sweden’s investment survey suggests that this trend will continue. Generally in the business sector, this is offset to some extent by the level of building and construction investment in the energy sector, which is forecast to pick up this year and next (see section 10.1). According to preliminary outcomes from Statistics Sweden, municipal building and construction investment showed substantial growth during the first six months of 2005. Strengthened local government finances will help sustain the favourable developments during the forecast period. Central government building and construction investment dropped between January and June this year compared with the corresponding period last year. The infrastructure investments are expected to soon lead to a recovery, and in 2006, central government building and construction investment is expected to pick up considerably.
Taken together, total building and construction investment is estimated to increase by 6.1 per cent this year and 6.4 per cent in 2006. This growth will lead to output in the construction industry rising by 7.5 per cent in 2005 and 6.0 per cent in 2006.
42
Table 5.2 Construction volume
| | SEK billion | | Percentage change in volume | |
| | 2004(1) | | 2003 | | 2004 | | 2005 | | 2006 | |
| | | | | | | | | | | |
Business sector | | 63 | | -5.9 | | -5.3 | | -0.6 | | 4.2 | |
Authorities | | 50 | | -2.0 | | 2.1 | | 3.6 | | 4.3 | |
Housing | | 64 | | 5.5 | | 16.1 | | 14.5 | | 9.7 | |
| | | | | | | | | | | |
Total | | 176 | | -1.2 | | 3.8 | | 6.1 | | 6.4 | |
(1) Current prices.
Sources: Statistics Sweden and Ministry of Finance.
5.3 The service sector
Growth modest last year
The strongest production growth was seen in the service sector last year at 4.1 per cent. The growth was also relatively high compared with 2003 in corporate services (rental firms, computer consultants, other business services) and other services (hotels and restaurants, transport, storage and communication firms). Weak growth in other parts of the service sector meant that production growth in the sector as a whole amounted to only 2.2 per cent in 2004. The growth last year was thus on a par with that of 2003, but significantly lower than average growth in the late 1990s.
The largest sector of private services is trade, followed by corporate and other services (see Table 5.3). Much of the output of the service sector is related to one- and two-family houses and real estate services. In these areas, production growth has been weak for many years now, whereas the growth in trade and corporate and other services has been higher.
Table 5.3 Value added and share of the service sector in 2004
| | Value added output | | Percentage share | |
| | 2004, SEK billion | | 2004 | |
| | | | | |
Trade | | 234 | | 21.6 | |
Corporate services | | 218 | | 20.1 | |
Other services | | 200 | | 18.4 | |
Real estate | | 127 | | 11.8 | |
One- and two-family | | | | | |
houses | | 116 | | 10.7 | |
Personal service | | 107 | | 9.9 | |
Financial intermediation | | 81 | | 7.5 | |
| | | | | |
Total service sector | | 1083 | | 100 | |
Sources: Statistics Sweden.
Higher growth this year and next
Also in 2005 and 2006, the main contributions to the higher level of growth in the service sector will come from trade and corporate and other services. The retail trade will continue to benefit from the rising level of consumption growth from households. As in 2004, the demand in the durable goods trade will show the strongest growth. Industry demand for consultants in corporate services is likely to continue rising due to good industry profitability and rising investment. Other types of services will benefit from rising household consumption and industrial firms’ favourable financial situation.
The fact that the demand situation is relatively satisfactory in certain areas of the service sector has also been confirmed by the NIER’s Business Tendency Survey. In the retail trade, firms are looking forward to continued sales growth. In corporate services, most of the firms surveyed stated that the volume of assignments would increase. The Business Tendency Survey nevertheless indicates that the growth in the volume of assignments will drop in the near future. This is also indicated by the slowing production growth in industry. Overall production growth in the service sector is forecast at 2.6 per cent in 2005 and 2.8 per cent in 2006.
Productivity growth to slow
In 2004, productivity growth in the service sector came to 1.5 per cent, which can be compared with 2003, when the figure was 3.5 per cent. The service sector is labour-intensive, so when output rises, there is not the same scope for improved productivity as there is in industry. Average hours worked are thus forecast to rise, slowing productivity growth somewhat. Productivity growth in the service sector is estimated at 1.4 per cent in 2005 and 1.2 per cent in 2006.
43
6 Labour market
The labour market remained subdued during the first half of 2005, but is expected to pick up gradually during the second half of the year and next year. In 2006, employment and the number of hours worked are forecast to increase in both the business sector and the general government sector. Open unemployment is estimated at 4.8 per cent next year.
Continued weak employment growth during first half of 2005
During the first half of 2005, the labour market remained weak. Employment was largely unchanged compared with the previous half year and open unemployment rose. However, the outcome for the second quarter should be interpreted with caution, due to the harmonisation of the Labour Force Survey implemented in April (see the explanatory box on the next page).
Table 6.1 Selected labour market statistics
Percentage change unless otherwise stated
| | 2004 | | 2005 | | 2006 | | 2007 | | 2008 | |
| | | | | | | | | | | |
GDP | | 3.6 | | 2.4 | | 3.1 | | | | | |
Productivity | | 2.8 | | 2.0 | | 2.0 | | | | | |
Hours worked | | 0.9 | | 0.4 | | 1.1 | | | | | |
Average hours worked | | 1.3 | | 0.3 | | -0.2 | | | | | |
Calendar-adjusted | | | | | | | | | | | |
GDP | | 3.1 | | 2.4 | | 3.4 | | 2.8 | | 2.2 | |
Productivity | | 2.9 | | 2.0 | | 1.8 | | 2.0 | | 2.1 | |
Hours worked | | -0.2 | | 0.4 | | 1.6 | | 0.7 | | 0.2 | |
Average hours worked | | 0.3 | | 0.3 | | 0.3 | | 0.0 | | 0.0 | |
Employed | | -0.5 | | 0.1 | | 1.3 | | 0.7 | | 0.2 | |
Regular employment rate(1),(3) | | 77.2 | | 76.6 | | 76.6 | | 77.0 | | 77.2 | |
Labour force | | 0.2 | | 0.1 | | 0.1 | | 0.3 | | 0.2 | |
Open unemployment(2),(3) | | 5.9 | | 5.9 | | 4.8 | | 4.4 | | 4.4 | |
Labour market policy programmes(2),(4) | | 2.4 | | 2.7 | | 3.6 | | 3.3 | | 2.7 | |
(1) The number of employed aged 20-64, excluding those employed in labour market policy programmes, as a percentage of the population.
(2) Percentage of labour force.
(3) According to the Labour Force Survey after the harmonisation of statistics in 2005.
(4) The programmes included in this term are those reported by the National Labour Market Board as labour market policy programmes.
Sources: Statistics Sweden, National Labour Market Board and Ministry of Finance.
Employment growth differed relatively substantially between sectors. Employment rose sharply in the construction sector as a result of stronger construction activity, while employment continued to decline in industry. Employment rose in the private service sector. Employment also rose in the central government sector, while it declined slightly in the local government sector.
Number of hours worked rose during second quarter
Following a continuous decline over a three-year period, the number of hours worked rose during the second quarter of 2005 according to the preliminary National Accounts.(5) The number of hours worked rose in the construction and service sectors, while it declined in industry and the general government sector.
GDP growth and growth in the number of hours worked tend to be correlated over time (see Diagram 6.1). The high productivity growth of the past 10 years is reflected in the larger gap between the two curves in the diagram during this period.
Diagram 6.1 Hours worked and GDP
Percentage change, calendar-adjusted

Sources: Statistics Sweden and Ministry of Finance.
During the second quarter of 2005, the rate of productivity growth slowed, which meant that the increase in the number of hours worked accounted for much of the increase in GDP. The increase in the number of hours worked is explained by a substantial increase in average hours worked in the majority of sectors, while employment remained largely unchanged.
(5) The figures in this section refers to calendar-adjusted data.
44
Harmonisation of the Labour Force Survey
The Labour Force Survey (LFS) is carried out each month by Statistics Sweden in order to gather information on developments in the labour market. The survey is based on telephone interviews with approximately 20,000 people of working age.
To improve harmonisation with labour force surveys in other EU countries, the Swedish LFS has undergone major changes. The changes include a new interview form, a new coding procedure and changes in definitions. The new survey came into effect in April 2005. All the changes may be expected to have an impact on the outcome for several central variables in the LFS, including the number of people in the labour force and the number of people in employment.
Important changes in definitions
The two most important changes in definitions concern employment and unemployment.
Unlike previously, people registered in Sweden but working abroad are now counted as employed. According to the LFS, this category totalled 29,000 people in 2004. This group was not counted as part of the labour force before.
Unemployed refers to people without work but who could work and have actively searched for work during the reference week. Previously there was also an explicitly requirement that the person wanted to work.(6)
Uncertain effects from harmonisation
Estimates by Statistics Sweden based on parallel surveys in the fourth quarter of 2004 and the first quarter of 2005(7) indicate few statistically significant differences between the new and old LFS. One significant result of the estimates is, however, that the number of people in the labour force is higher in the new survey. At the same time, no effects on the number of people in employment were measured. As a result, unemployment is larger in the new LFS. Unemployment is estimated by Statistics Sweden to be 0.3 to 0.5 percentage points higher. Further, the measured number of overtime hours worked has risen as a result of the harmonisation.
When the LFS figures for June and July were published, it became apparent that the changed survey had resulted in a relatively large effect on the unemployment level. The reason was that the number of unemployed young people rose sharply compared with previous years. The cause of the higher youth unemployment measured is that in accordance with the new LFS, someone who has found a job to be taken up within three months, but who can work on the survey date, is to be reported as unemployed.(8) Since Statistics Sweden only carried out parallel surveys for the fourth and first quarters, this means that the differences between the old and new LFS may be larger than previous estimates have shown. Statistics Sweden does not intend to publish linked series for certain central variables, which aim to facilitate comparisons over time, until late 2005. Overall, the harmonisation involves continued considerable uncertainty with regard to comparability between outcomes as from April 2005 and previous outcomes.
LFS not fully harmonised with other EU surveys
Even after the harmonisation, certain differences remain between Sweden’s unemployment figures and those of other countries, making international comparisons difficult. The Swedish measure of unemployment does not include, for example, full-time students who have looked for work, unlike that of the majority of other countries. If this category is included, unemployment was 6.6 per cent last year, which may be compared with the official national definition before the harmonisation of 5.5 per cent. Another difference is that the statistics published by the EU refer to the 15–74 age group, while Swedish national statistics refer to the 16–64 age group. In accordance with the EU’s measure, unemployment in Sweden was 6.3 per cent last year.
(6) The requirement of wanting to work was introduced in 1987. Statistics Sweden’s assessment is that the introduction of this condition led to a 16 per cent reduction in the number of unemployed, which was equivalent to 0.5 per cent of the labour force.
(7) In the fourth quarter of 2004, 80 per cent of the sample responded to the old form and 20 per cent to the new one. In the first quarter of 2005, 70 per cent responded to the old form and 30 per cent to the new one.
(8) This limit was previously one month. Individuals who have found a job to be taken up after this time limit are not included in the labour force.
45
Indicators have strengthened over past year
Short-term labour market indicators improved, on the whole, during the first half of 2005. However, the indicators suggest that the difference in employment growth between sectors during the first half of the year is likely to continue for some time.
The total number of newly reported vacancies has risen since the middle of last year and the number of redundancy notices has declined (see Diagram 6.2). Historically, employment is relatively closely correlated with newly reported vacancies, subject to a time lag of approximately three quarters.
Both the number of newly reported vacancies and expectations regarding the number of employed are increasing in the construction and service sectors, while expectations in industry remain subdued according to the National Institute of Economic Research (NIER) Business Tendency Survey. The proportion of firms reporting a manpower shortage is still low, although the proportion has increased in the construction sector and business services.
Diagram 6.2 Vacancies and redundancy notices
Thousands
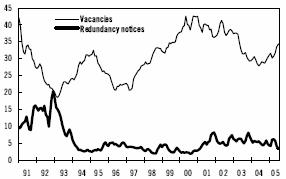
Note: Three-months moving average.
Source: National Labour Market Board.
Number of programme participants to rise sharply in 2006
The number of participants in labour market policy programmes is estimated at 121,000 this year, measured as an annual average. Sabbatical year places are estimated to account for around two-thirds of the increase of 15,000 people, compared with the previous year. Just over 40 per cent of the sabbatical year places have so far been allocated to people in prioritised groups (those registered as unemployed for more than two years, those with occupational disabilities and those born abroad).
In 2006, the number of programme participants is forecast to increase by a further 40,500 as a result of the measures announced by the government in this Government Budget Bill.(9) Approximately three-quarters of these are counted as being in employment, while the remainder are counted as undergoing schooling and training, i.e. outside the labour force (see Table 6.2).
Table 6.2 Participants in labour market policy programmes
Thousands, yearly average
| | 2004 | | 2005 | | 2006 | |
| | | | | | | |
Employed | | 26 | | 44 | | 75 | |
Employment support | | 20 | | 28 | | 34 | |
Business start-up grant | | 6 | | 6 | | 7 | |
Sabbatical year initiative | | — | | 10 | | 14 | |
“Bonus jobs” | | — | | — | | 15 | |
Education initiative | | — | | — | | 5 | |
In education and training | | 80 | | 77 | | 87 | |
Labour market training | | 22 | | 20 | | 19 | |
Work experience | | 14 | | 14 | | 19 | |
Youth apprenticeships | | — | | — | | 3 | |
Graduate work experience in small businesses | | — | | — | | 4 | |
Other(1) | | 44 | | 43 | | 42 | |
| | | | | | | |
Total | | 106 | | 121 | | 162 | |
(1) Vocational guidance and employment service activities, municipal youth programme, development guarantee for young people, vocational rehabilitation etc.
Source: National Labour Market Board and Ministry of Finance.
Employment to rise in the near future
The increase in the number of hours worked during the second quarter of the year and the positive development of several indicators suggest that employment will begin to rise during the second half of 2005.
In 2006, strong growth in domestic demand and a lower rate of productivity growth are expected to contribute to a rise in the demand for labour. Moreover the measures announced by the government will result in an increase in employment (see the section above). As a result of the suppression of regular employment, the number of people in employment is, however,
(9) In addition, there is a proposal to take on over 3,000 people in the central government sector.
46
estimated to be less than the number of people covered by these measures.
Employees on sabbatical leave or with bonus jobs, or replacing someone on training leave, and those receiving employment support or a business start-up grant are counted as being in employment, but not in regular employment.
The expansion of these programmes in 2005 and 2006 means that the number of people in regular employment will develop more slowly than the number of people in employment. In 2006, the regular employment rate is estimated at 76.6 per cent.
Historically, there is a clear positive correlation between sickness absence and employment (see Diagram 6.3). Periods of rising sickness absence coincide with increasing employment and vice versa. Despite rising employment, sickness absence is, however, expected to continue declining during the forecast period. This is expected to restrain the increase in employment somewhat, since both those on sick leave and their temporary replacements are counted as being in employment in the statistics. A decline in sickness absence can consequently have a negative impact on employment growth in the short term since the need for temporary replacements declines.
Overall, employment is estimated to rise by 0.1 per cent in 2005 and 1.3 per cent in 2006. The number of people in employment will consequently rise by approximately 60,000 during the forecast period.
Diagram 6.3 Employed and on sick leave
Thousands
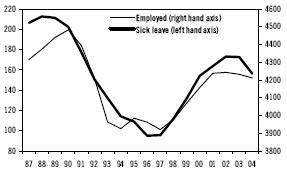
Note: People on sick leave refers to those who have been on sick leave the whole reference week.
Source: Statistics Sweden.
Business sector
Around 35 per cent of the increase in employment in 2006 is forecast to be in the business sector. The construction and service sectors are expected to boost employment, while employment will continue declining in industry.
Continued favourable construction activity is forecast to lead to employment in the construction sector rising by approximately 3 per cent per year during the forecast period. According to NIER’s Business Tendency Survey for the second quarter of 2005, the inflow of orders and expectations are on a par with the favourable construction activity around the millennium. Employment is, however, expected to grow somewhat more slowly than during those years. This is partly due to the sector already having started to show signs of the beginnings of a labour shortage during the first half of 2005.
Employment growth in the service sector is not expected to be quite as strong as in the construction sector (measured as a percentage), but its contribution, measured by the number of people in employment, is expected to be larger due to the size of the service sector. However, employment growth differs relatively substantially between different service sectors. According to the NIER’s Business Tendency Survey, transport and business services, hotels and restaurants show positive growth and confidence in the future, while large sections of trade continue to reduce the number of employees. However, the proportion of firms in trade stating that they intend to reduce staff has declined during the year.
The very favourable industrial activity in 2004 did not lead to any increased employment in industry. During the first half of 2005, industrial output slowed and employment is expected to decline during the forecast period despite continued high capacity utilisation and high investment.
General government sector
Employment in the local government sector fell by approximately 9,000 people in 2004.(10) The preliminary outcome for the first half of 2005 shows largely unchanged employment. During the second half of 2005, employment in the local
(10) Excluding the effect of the deprivatisation of Huddinge Hospital.
47
government sector is forecast to accelerate and is estimated to rise by approximately 5,000 people as an annual average. Good local government finances together with the government’s proposed employment measures are estimated to result in 27,000 more employees in the local government sector next year (see also section 11.4).
Employment in the central government sector rose marginally in 2004 compared with the previous year. Employment is also forecast to rise somewhat this year and by almost 3 per cent in 2006 as a result of the measures announced by the government.
Average hours worked to rise in 2005 and 2006
Average hours worked per employee declined continuously during the period 2000–2003.(11) The decline can probably be largely explained by increased sick leave and falling average hours worked per person actually in work as a result of weak developments in the labour market.
In 2004, reduced sickness absence contributed to a rise in average hours worked per employee, while an increased proportion of part-time employees had the opposite effect. Average hours worked per person in work were unchanged. During the first half of 2005, average hours worked rose sharply as a result of stronger growth in the number of hours worked than in employment.
Positive developments in the labour market during the forecast period are expected to result in an increase in average hours worked, both per employee and per person in work. Reduced sickness absence contributes to increasing average hours worked per employee, while the sabbatical year makes a negative contribution, since those on sabbatical leave are counted as being in employment. In 2005 and 2006, average hours worked per employee are forecast to rise by 0.3 per cent per year.
Diagram 6.4 Hours worked per employed and person in work
Hours per year
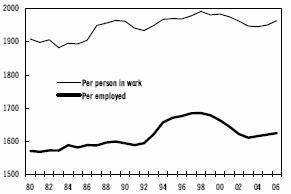
Sources: Statistics Sweden and Ministry of Finance.
Weak growth in labour supply
In 2004, the labour supply increased considerably more slowly than the working-age population. The weak growth in the labour supply is explained by the population increasing in age groups with low participation rates, as well as by an increase in the number of sick people outside the labour force and the number of participants in labour market policy training programmes. Around three-quarters of the programme participants took part in some form of education or training and were therefore not included in the labour force.
During the forecast period, the labour supply is expected to continue growing more slowly than the working-age population. However, the influx into sickness and activity benefits is forecast to decline. At the same time, the increased programme volume in 2006 will result in a lower labour supply (see Diagram 6.5).
Diagram 6.5 Labour force and employed
Thousands
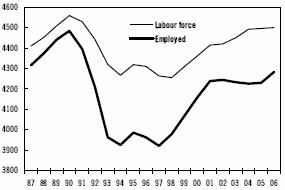
Sources: Statistics Sweden and Mnistry of Finance.
(11) The figures in this section refers to calendar-adjusted data.
48
Open unemployment to fall in 2006
Open unemployment rose in 2004 and averaged 5.9 per cent of the labour force. Total unemployment(12) averaged 8.3 per cent in 2004.
In 2005, both employment and the labour supply are forecast to show slow growth, which means that open unemployment will not change compared with the previous year. Total unemployment is forecast to rise as a result of the increase in the proportion of the labour force taking part in labour market policy programmes.
As a result of good employment growth and a slight increase in the labour supply, open unemployment is forecast to fall in 2006 (see Diagram 6.6). Measured as an annual average, open unemployment is estimated at 5.9 per cent in 2005 and 4.8 per cent in 2006. Total unemployment is estimated at 8.6 per cent in 2005 and 8.4 per cent in 2006.
Diagram 6.6 Unemployment
Percentage of labour force
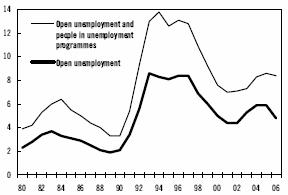
Sources: Statistics Sweden and Ministry of Finance.
Unemployment to continue falling in 2007 and 2008
The economy is expected to grow at a more rapid rate than potential GDP in the estimate year 2007. Employment will continue rising at a good rate, although not as strongly as in 2006. The labour supply will be restrained by relatively weak demographic growth, but will increase as a result of the reduced number of participants in cyclical programmes. Open unemployment is estimated to fall to 4.4 per cent, while the regular employment rate for those aged 20–64 is estimated to rise to 77.0 per cent.
In 2008, GDP is forecast to grow largely at the same rate as potential GDP. Employment is expected to pick up only slightly while the number of participants in cyclical programmes will fall sharply. Open unemployment is estimated at 4.4 per cent, while the regular employment rate for those aged 20–64 is estimated to rise somewhat to 77.2 per cent.
(12) Open unemployment and participants in labour market policy programmes as a proportion of the labour force.
49
Danish package to stimulate employment
The Danish economy experienced weak growth between 2001 and 2003, with average GDP growth of 0.6 per cent per year. Household consumption rose on average by only 0.8 per cent per year. The slowdown in the economy led to rising unemployment and subdued employment growth.
The negative trend in the Danish economy was, however, broken in mid-2003. The strengthening of the global economy led to an increase in Danish exports. Household consumption was stimulated by rising prices in the housing market and historically low interest rates. Moreover the housing loan regulations were changed, making it cheaper for households to borrow.
Despite several signs indicating that economic activity would turn upwards in the second half of 2003, the Danish government decided in the spring of 2003 to implement income tax relief to stimulate employment and the labour supply. Although the decision on reduced income tax did not come into force until 2004, consumer confidence and consumption turned upwards in mid-2003. However, the economic upturn in the Danish economy had not led to increased employment by the end of 2003 and unemployment continued to rise. In order to strengthen the economic upturn and thus improve the situation in the labour market, the government presented a stimulus package at the beginning of 2004. The package consisted of further income tax cuts in addition to the tax relief previously decided on, as well as increased training initiatives for the unemployed. The measures were in line with the government’s previous policy of focusing on reduced taxes, reduced general government expenditure and healthy public finances.
Consumption stimulus contributed to job creation
The stimulus package mainly aimed to encourage household consumption through reduced income tax. The package meant that the income tax cuts, which the government had previously intended to phase in over a four-year period, were implemented already in 2004. The compulsory pension contribution(13), which amounts to 1 per cent of gross wages, was abolished during the period 2004–2005. Moreover general government sector investment and initiatives in the care sector were brought forward. In addition, subsidies for residential construction were increased. The package also included measures to improve matching in the labour market, such as training and retraining initiatives.
Overall, the stimulus package resulted in household disposable income rising by DKK 9 billion, which is equivalent to an increase of just over 1 per cent. The package contributed to a sharp increase in household consumption. The effect was probably strengthened by pent-up consumption demand among households following several years of very restrained consumption. In 2004, Danish households’ real disposable income increased by 3.2 per cent, while consumption rose by a full 3.9 per cent.
Unemployment was 5.6 per cent in 2003, but has gradually fallen since the beginning of 2004. Unemployment was 5.4 per cent last year and is forecast to fall further over the next two years according to the Danish Ministry of Finance. In 2006, unemployment is estimated at 4.4 per cent, which is considered to be in line with equilibrium unemployment. Employment has risen particularly in the service sector, which has benefited from the strong consumption growth. New jobs have also been created in the construction sector as a result of low interest rates and rising property prices.
According to the Danish Ministry of Finance’s assessment, the package contributed to unemployment falling by around 12,000 people in 2004, which is equivalent to 0.5 per cent of the labour force. Employment had risen by 6,000 people towards the end of 2004, while 6,000 more people took part in training initiatives. This year, the stimulus package is estimated to contribute to unemployment falling by a further 12,500 people and employment rising by 8,000 people. The number of participants in training initiatives is forecast to rise by just over 4,500 people in 2005. The package is estimated to have contributed 0.3 percentage points to GDP growth in 2004 and is
(13) A special pension fund was created in the late 1990s to reduce consumption and increase saving.
50
forecast to contribute 0.1 percentage points in 2005. GDP increased by 2.1 per cent in 2004 and is forecast to rise by 2.4 per cent this year according to the Danish Ministry of Finance.
The Swedish employment package
In Sweden, economic activity picked up in the second half of 2003, driven by strong export growth. However, the stronger economic activity has not had a clear impact on the labour market. Unemployment has continued to rise and employment growth has been weak. The government therefore proposes measures to combat unemployment in this Government Budget Bill. The Swedish package is focused on reducing unemployment through job creation measures and training places. Initiatives targeted at groups with a weak foothold in the labour market are expected to counteract long-term unemployment.
The improvement in the labour market combined with the proposed tax cuts are expected to strengthen consumer confidence and increase household consumption. Increasing household demand is expected in its turn to lead to employment growth strengthening further in the service sector in particular.
Differences and similarities between Denmark and Sweden
The Danish and Swedish stimulus packages have the same purpose, but the approach and the timing of the initiatives differ to some extent. The stimulus packages were proposed in different economic phases. The Danish package was implemented at the beginning of the economic upturn to accelerate a consumption-driven economic recovery. The Swedish employment package aims to strengthen the conditions so that the ongoing economic recovery will have a clearer and more rapid impact on the labour market.
The Danish experience suggests that the combination of initiatives targeted at increasing the demand for and the supply of labour is effective and leads to a sustained improvement in the labour market.
Household consumption in Denmark and Sweden
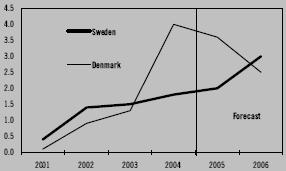
Sources: Statistics Sweden, Statistics Denmark, Ministry of Finance and Danish Ministry of Finance.
Unemployment in Denmark and Sweden

Sources: Statistics Sweden, Eurostat, Ministry of Finance and Danish Ministry of Finance.
51
7 Wages
A slight increase in the demand for labour combined with low inflation and more modest wage increases than during the previous agreement period suggests a subdued rate of wage increase in coming years. Wages are estimated to rise by 3.3 per cent this year and 3.4 per cent next year.
The rate of wage increase slowed in 2004
The nominal rate of wage increase slowed somewhat in 2004. According to preliminary statistics from the National Mediation Office, the average rate of wage increase was just under 3.3 per cent in 2004.
For the fourth year in a row, wages in the general government sector rose more quickly than in the private sector. Wages rose the fastest in county councils, where the increase exceeded 4 per cent. This can be compared with industry and the private service sector, where wage growth has remained steady at an annual rate of just over 3 per cent in the past two years. In the construction industry, the rate of wage increase slowed to 2.6 per cent.
Accelerating rate of wage increase in construction industry this year
So far this year, the rate of wage increase in industry and the service sector has followed the same trend as last year. In the construction industry, wages have risen nearly one percentage point faster thanks to a high level of activity.
In the local and central government sectors, wages have shown very weak growth so far this year. However, these statistics are far from complete as local negotiations are still in progress. The statistics will provide a more accurate impression of the situation later this year, when the agreed wages are to be paid retroactively.
The wage negotiations of 2004
The wage negotiations of 2004 affected more than 1.9 million employees, encompassing the entire central government sector and much of the private sector. More or less all of the agreements concluded in 2004 correspond to the 7.3 per cent increase over a three-year period agreed in industry negotiations. All agreements at central government level are for three years with the possibility of termination during the third year.(14) Most agreements in the private sector consist of three-year agreements.(15) Nearly 50 per cent of private sector employees are covered by agreements that can be terminated during their final year.
Business sector agreements are approximately 0.5 percentage points lower per year than during the 2001–2003 period. This is largely because the costs for the agreed reductions in working hours are now lower than previously. In central government, the agreements cover wage increases that are approximately 0.2 percentage points lower per year than between 2001 and 2003. Central government agreements do not entail any reductions in working hours.
The wage negotiations of 2005
This year’s wage negotiations encompass a total of 1.3 million employees. On a national level, agreements have been concluded for 1.1 million employees in the local government and county council sectors.(16) The Swedish Construction Federation’s agreements for construction and road and civil works expire on 31 October and banking and insurance sector agreements expire at the end of the year.
The agreements concluded in the local government and county council sectors are relatively similar, with most of them giving 2 per cent per year. Swedish Municipal Workers’ Union agreements give the most at an estimated 2.9 per cent per year. Overall, the estimated rate of wage increase from the agreements averages 2.4 per cent. Comparisons between old and new agreements are difficult since the agreements are formulated differently. Generally, however, the agreements are expected to entail slightly lower wage increases compared with preceding agreements.
(14) Agreements in the central government sector expire in September 2007.
(15) The majority expire in March 2007.
(16) Agreements in the local government sector expire in June 2007.
52
Modest rate of wage increase in the near future
Several factors suggest a relatively modest rate of wage increase during the forecast period. First of all, the wage increases agreed upon are at a lower level than before. The transition to more decentralised wage formation in the 1990s also means that it is increasingly difficult to accurately classify wage increases by type of agreement and as a consequence of wage drift. This is because public statistics concerning such agreements encompass national and not local agreements. The lower wage increases granted nationally are nevertheless expected to slow the rate of wage increase.
Secondly, the low level of resource utilisation this year means that the rate of wage increase will slow during the forecast period. This is particularly the case this year, but will also apply to a certain extent next year as a result of wages being affected after a slight time lag.
Finally, the low rate of inflation means that nominal wages need not rise at the same rate as previously to realise favourable growth in real wages.
Wages in the public sector rising faster than in the private sector
For the economy as a whole, nominal wages are estimated to rise by 3.3 per cent this year and 3.4 per cent in 2006. In a historical perspective, this is a low rate of growth. However, the low inflation means that real wages during 2005 will rise faster than the average for the past ten years. In 2006, when the rate of inflation is forecast to be higher, the real wage growth will then be checked (see Diagram 7.1).
Diagram 7.1 Nominal and real wage
Percentage change

Sources: Statistics Sweden, National Mediation Office and Ministry of Finance.
As in the past four years, wage growth will be stronger in the general government sector than in the private sector during the forecast period (see Table 7.1). Wages in the private service sector are rising more slowly than in industry this year. In 2006, the reverse is expected as a result of higher demand for labour in the service sector. In the private sector, wages will rise the fastest in the construction industry due to the building boom. The good performance in the construction industry during the first six months of 2005 has already boosted the rate of wage increase because the time lag between changes in business cycles and wage growth is relatively short in the construction industry compared with other industries.
In 2007 and 2008, wages are likely to rise by an average of 4.0 per cent, which is equivalent to the rate seen as being in line with productivity growth and inflation in the long term.
Table 7.1 Nominal wages
Annual percentage change
| | 2004 | | 2005 | | 2006 | | 2007-2008 | |
| | | | | | | | | |
Industry | | 3.1 | | 3.2 | | 3.1 | | — | |
Construction | | 2.6 | | 3.8 | | 4.2 | | — | |
Private service sector | | 3.0 | | 3.1 | | 3.3 | | — | |
Central government | | 3.3 | | 3.3 | | 3.4 | | — | |
Local government | | 4.2 | | 3.7 | | 3.8 | | — | |
| | | | | | | | | |
Total | | 3.3 | | 3.3 | | 3.4 | | 4.0 | |
Note: The wage growth refers to hourly wages according to short-term wage statistics. According to the National Accounts, whose definition differs from that of Statistics Sweden’s short-term wage statistics, wages are expected to rise by 4.3 per cent in 2007 and 2008.
Sources: National Mediation Office and Ministry of Finance.
53
8 Inflation
Inflation is expected to remain low during 2005. Inflation is forecast to start to increase gradually during 2006, when domestic inflationary pressure will begin to rise in line with rising resource utilisation and demand, and a slackening of import prices’ moderating effect on inflation. In December 2006 underlying inflation (UND1X) is expected to be 1.5 per cent. The CPI will rise faster than UND1X next year because of rising interest rates for owner-occupied dwellings. CPI inflation is expected to amount to 2.0 per cent in December 2006. Underlying inflation is forecast to reach the inflation target at the end of 2007.
Inflation remains low despite the high price of oil
Inflation remains low. Underlying inflation was 0.6 per cent on average during the first eight months of 2005 according to the Riksbank’s UND1X measure. UND1X inflation only exceeded 1.0 per cent in February (see Diagram 8.1). The principally domestically-generated underlying inflation, measured by the Riksbank’s UNDINHX index, has continued to fall. Inflation measured by the Consumer Price Index (CPI) has not exceeded 1.0 per cent since the end of 2003.(17)
Diagram 8.1 Inflation (CPI) and underlying inflation
Per cent
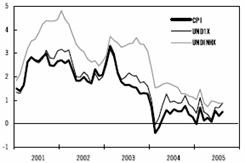
Sources: Statistics Sweden and Ministry of Finance.
Inflation was somewhat lower during the spring and summer than the Spring Fiscal Policy Bill’s forecast, despite petrol and home heating oil prices being higher than expected. Price increases for the majority of goods and services have consequently been somewhat lower than foreseen.
(17) UND1X excludes mortgage costs for owner-occupied dwellings and the direct effects on consumer prices of net changes in indirect taxes and subsidies. In addition, UNDINHX excludes goods which are mainly imported.
Diagram 8.2 Contributions to CPI inflation from selected groups of goods and services
Percentage points

Note: Electricity, oil, petrol, fruit and vegetables are excluded.
Sources: Statistics Sweden and Ministry of Finance.
Diagram 8.2 shows the approximate contribution, in percentage points, of a number of different goods and services groups to overall CPI inflation (excluding energy, housing costs and fruit and vegetables). The diagram shows that the trend in prices for import goods has made a negative contribution to inflation since the first half of 2003. During 2005 the prices of principally domestically-produced goods have also made a negative contribution to inflation. The contribution from services has been inflationary but only moderately so compared with the situation a few years ago.
Diagram 8.3 Contributions to CPI inflation from petrol and heating oil
Percentage points
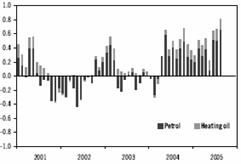
Sources: Statistics Sweden and Ministry of Finance.
The component having the greatest inflationary effect at the present is petrol and oil prices.
54
Diagram 8.3 shows that the prices of petrol and home heating oil have added more than half a percentage point to inflation during most months so far in 2005.
Rising import prices having limited impact
According to producer and import price statistics, import prices for the processed goods group rose during much of 2004 before falling back somewhat towards the end of the year. During the first half of 2005 import prices began to rise again. Much of the increase was due to rising prices for input goods. For groups of goods more in the consumer area, the trend in import prices continued to be moderate. This applied to food as well as clothing and durable consumer goods, such as domestic electronic appliances.
Prices of imported processed goods are expected to go up in 2005 and 2006. This is partly due to commodity prices – which have been rising since the start of 2004 – having more impact on the prices of imported processed goods. The upturn in import prices will however be moderated somewhat by the expected strengthening of the krona in the near future (see further in section 4.2).
The impact on consumer prices from import price increases is difficult to assess, both in terms of magnitude and time lag. Heightened competition may have made it difficult recently for distributors close to consumers to raise prices. Continued stronger domestic competition is expected to moderate the domestic consumer price trend for imported goods.
The effect on clothing prices has been the subject of attention in terms of the changed import quotas for these goods. The abolition of the EU quotas is considered to be a large contributory factor in consumer prices for clothing and shoes continuing to fall in 2005, apart from seasonal variations. During the first half of the year, prices were between 1 and 3 per cent lower than the price level one year previously. As shown in Diagram 8.4 the import price trend and the trade’s own price expectations point to further price cutting in clothing in the near future.
Oil is an import good whose price fluctuations affect consumer prices, both directly and indirectly. The direct effect arises through changed petrol and home heating oil prices. Indirect effects arise through changed producer costs for heating, transport and the production of goods, which are then passed on to consumers. The extent to which the costs are passed on, and the time lag involved, can vary.
Diagram 8.4 Clothing and footwear. Consumer and import prices and retailers’ consumer price expectations
Prices, annual percentage change Net balance

Sources: Statistics Sweden and National Institute of Economic Research.
The oil price forecast (see section 2.7) implies that the prices of home heating oil and petrol are estimated to boost CPI inflation by approximately 0.5 percentage points in December 2005 and reduce inflation in December 2006 by approximately 0.4 percentage points. The high oil prices are also expected to have an indirect impact on consumer prices during the forecast period. The impact will however be absorbed to some extent in firms’ profit margins. The trend in oil prices represents an element of uncertainty in forecasting inflation.
In summary, consumer prices for imported goods (excluding oil and petrol) will continue to hold down inflation in 2005 and 2006, but the restraining effect will gradually diminish next year.
Domestic inflationary pressure slowly rising
Domestic inflationary pressure continues to be low. The Riksbank’s measure of principally domestically-generated inflation, UNDINHX, has dropped since the beginning of 2002, apart from a temporary rise due to electricity prices in 2003 (see Diagram 8.1).
The low domestic inflationary pressure in recent years is largely attributable to relatively low resource utilisation in the labour market. Neither industry nor service sectors nearer the consumer have reported any significant shortage
55
of labour. Industrial productivity has at the same time risen sharply, holding down unit labour costs. In the trade and service sectors, pressure due to demand was limited. Employment has only increased slightly and wage increases have been slight.
Increased competition in the Swedish retail trade may also have contributed to pressure on profit margins of both domestically-produced and imported goods. The food price reductions seen in 2004 and 2005 are partly attributable to this trend. Low producer and import prices have also had an effect (see Diagram 8.5). Price reductions due to increased competition hold down the rate of inflation but only during the time they apply. There has been a slowdown in the fall in prices of imported foods. However average consumer food prices are forecast to continue to go down, or be subject to little increase in the remainder of 2005 and in 2006. As seen in Diagram 8.5, the trade’s own price expectations support this view.
Diagram 8.5 Food and non-alcoholic beverages. Consumer and import prices and retailers’ consumer price expectations
Prices, annual percentage change Net balance
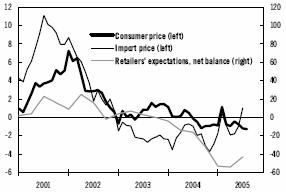
Sources: Statistics Sweden and National Institute of Economic Research.
The general expectations regarding future inflation have progressively decreased since 2003 (see Diagram 8.6). They have however generally stayed within the Riksbank’s tolerance interval of ±1 percentage point from the inflation target. According to the National Institute of Economic Research’s Consumer Survey, households’ inflation expectations for the year ahead have increased somewhat (probably due to the high oil prices) and are now at 1.5 to 2.0 per cent.
Prospera’s surveys within the labour and money markets (undertaken on behalf of the Riksbank) indicate that the expectation for inflation in one year’s time is around 1.5 per cent. On a two-year basis, the expectation is an inflation level of 1.7 per cent according to the Prospera survey.
Diagram 8.6 Inflation expectations, 12 months horizon
Per cent
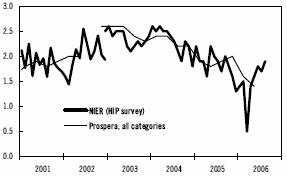
Note: Expectations are shown at the expectation horizon.
Sources: National Institute of Economic Research and Prospera.
As discussed in Chapter 6, employment is expected to rise during 2005 but not at a significant rate until 2006. The forecast for wages is an increase of 3.3 per cent in 2005 and 3.4 per cent in 2006. Growth in industrial productivity is expected to be slower in the forecast period than in recent years, while a slight reduction is expected in the already moderate growth rate in the service sector.
Overall the assumptions imply that domestic inflationary pressure will continue to be very low in 2005 and then begin to rise gradually in 2006 in line with stronger domestic demand growth, less available resources in the labour market and increasing unit labour costs. This trend is forecast to continue in 2007 and 2008. Structural changes in the retail trade are expected to continue to restrain domestic inflation, particularly during 2005.
Rising mortgage rates and taxes to boost CPI inflation in 2006
Housing costs are an important component of household consumption. Rent trends and mortgage rate costs for owner-occupied dwellings therefore have a major impact on inflation.
Rent levels, which have been hit by increases in heating costs, etc., rose by 3.0 per cent in 2004. Rent level increases of approximately 2.5 per cent per year are foreseen during the forecast period.
56
The low mortgage interest costs since April 2003 for owner-occupied dwellings have helped keep down CPI inflation. The forecast for interest rates discussed in section 3.2 implies that the interest rates are expected to hold down CPI inflation by approximately 0.5 percentage points during the second half of 2005. The average mortgage interest rate is expected to begin to rise in 2006 and to have pushed up CPI inflation by approximately 0.5 percentage points by the end of the year.
Increased indirect taxes are forecast to raise CPI inflation by approximately 0.2 percentage points in 2006.
Inflation gradually approaching the target
To summarise, the inflationary pressure will continue to be low in 2005 and rise gradually in 2006. In December 2006, when it is considered that there will still be available resources in the labour market, it is estimated that the underlying inflation measured by UND1X will be 1.5 per cent and CPI inflation 2.0 per cent (see Table 8.1).
Table 8.1 Consumer prices
Percentage change unless otherwise stated
| | 2004 | | 2005 | | 2006 | | 2007 | | 2008 | |
| | | | | | | | | | | |
CPI, Dec-Dec | | 0.3 | | 0.7 | | 2.0 | | 3.1 | | 2.3 | |
CPI, year-on-year | | 0.4 | | 0.3 | | 1.5 | | 2.6 | | 2.7 | |
UND1X, Dec-Dec | | 0.7 | | 1.1 | | 1.5 | | 2.0 | | 2.0 | |
UND1X, year-on-year | | 0.8 | | 0.7 | | 1.4 | | | | | |
HICP, Dec-Dec | | 0.9 | | 1.5 | | 1.5 | | | | | |
HICP, year-on-year | | 1.0 | | 0.8 | | 1.7 | | | | | |
NPI, Dec-Dec | | 0.1 | | 0.2 | | 2.2 | | | | | |
NPI, year-on-year | | 0.1 | | 0.0 | | 1.4 | | | | | |
Price base amount, SEK, thousand | | 39.3 | | 39.4 | | 39.7 | | 40.2 | | 41.2 | |
HICP, euro area, year-on-year | | 2.1 | | 2.0 | | 1.9 | | 1.9 | | 1.8 | |
Sources: Statics Sweden and Ministry of Finance.
Rising mortgage rates in 2006 will mean that CPI inflation will increase faster than the underlying inflation measured by UND1X (see Diagram 8.7). According to the forecast, inflation in Sweden will continue to be lower both this and next year than in the euro area, as measured by the EU’s harmonised index for consumer prices.
It is assumed that monetary policy will be adapted so that underlying inflation (UND1X) will achieve the Riksbank’s inflation target by the end of 2007 and hold at this level in 2008. Estimated developments in mortgage rates during 2007 mean that CPI inflation in late 2007 is forecast to substantially exceed inflation measured by UND1X.
Diagram 8.7 Consumer prices
Annual percentage change
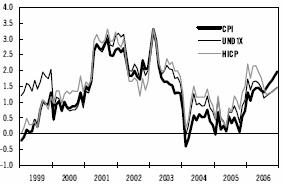
Sources: Statistics Sweden and Ministry of Finance.
57
9 Household sector finances and consumption expenditure
Real household income increased by 1.5 per cent last year and is expected to increase by 2.9 per cent this year. The stronger development this year is mainly due to faster development of nominal wages as well as implemented tax cuts. Next year the rate of increase is expected to reach 2.5 per cent.
Household consumption expenditure is expected to increase 2 per cent in 2005 and 3 per cent in 2006. In addition to favourable income growth, consumption growth will be underpinned in the near future by a stable wealth position and an increasingly upbeat situation in the labour market.
Household saving (excluding saving in pension funds reserves) is estimated in 2005 to increase to 5.4 per cent of disposable income, compared with 4.5 per cent the previous year. Household saving in 2006 is expected to amount to 4.9 per cent.
9.1 Household income
Subdued upturn in 2003 and 2004
Between 1998 and 2002, real household disposable income climbed an average of 4.2 per cent per year. The number of hours worked rose and wages made a substantial contribution to the increase in disposable income. At the same time, increased transfer payments and tax cuts made a further contribution to income growth. Between 1970 and 2004, real disposable income increased an average of 1.6 per cent annually (see Diagram 9.1).
Diagram 9.1 Household real disposable income
Annual percentage change
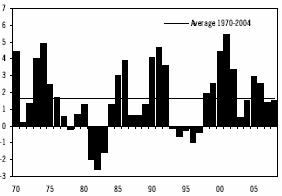
Note: Household real income is calculated by deflating the nominal income with an implicit price index for household consumption expenditure (IPI).
Sources: Statistics Sweden and Ministry of Finance.
In 2003, a weak labour market and increased local government tax rates caused real disposable income to increase by only 0.5 per cent.
In 2004, wage growth remained weak while rising taxes and charges pulled down income growth. However, general government transfer payments made a positive contribution and real disposable income growth rose 1.5 per cent (see Table 9.1).
Increased real income 2005-2006
During 2005 and 2006, real household income will increase once again at a higher rate than during the immediately preceding years due to a favourable nominal increase in income and a subdued price trend.
Table 9.1 Household disposable income
| | SEK billion | | Percentage change | |
| | 2004 | | 2004 | | 2005 | | 2006 | | 2007 | | 2008 | |
| | | | | | | | | | | | | |
Nominal disposable income | | 1 282 | | 2.7 | | 3.9 | | 4.2 | | 3.4 | | 3.8 | |
Price index | | | | 1.2 | | 0.9 | | 1.6 | | 2.0 | | 2.2 | |
Real disposable income(1) of which | | 1 282 | | 1.5 | | 2.9 | | 2.5 | | 1.4 | | 1.5 | |
Wages | | 1 042 | | 1.5 | | 2.6 | | 3.4 | | 3.0 | | 2.3 | |
Other factor income | | 239 | | 1.2 | | 2.5 | | 1.8 | | 2.0 | | 1.4 | |
Interest and dividends, net(2) | | -19 | | -19.4 | | -30.5 | | 41.1 | | 46.5 | | 21.0 | |
General government transfer payments | | 481 | | 2.0 | | 0.8 | | 0.9 | | 0.8 | | 1.8 | |
Private transfer payments | | 46 | | 2.4 | | 1.3 | | 1.0 | | 1.1 | | 2.0 | |
Taxes and charges | | 506 | | 2.8 | | 1.2 | | 1.4 | | 2.9 | | 2.3 | |
(1) Household real income is calculated by deflating the nominal income with an implicit price index for household consumption expenditure (IPI).
(2) Net of interest and dividends consists mainly of interest received, dividends and interest received on individual insurances, minus interest paid.
Sources: Statistics Sweden and Ministry of Finance.
The number of hours worked is expected to increase 0.4 per cent this year. In real terms, wage income is expected to increase by 2.6 per cent, making an estimated contribution to growth in disposable income of 2.1 percentage points.
Nominal disposable income will continue to increase at about the same pace in 2006 as the previous year, but a higher price index will cause real growth to be somewhat subdued. The stronger labour market in 2006 will cause the number of hours worked to increase 1.6 per cent in calendar-adjusted terms (see Table 6.1). The relatively strong trend can be explained in part by an underlying improvement in the economy and in part by the measures to boost employment proposed in this government bill. Wages
58
contribute 2.7 percentage points to real disposable income growth, which is much stronger than in both 2004 and 2005 (see Table 9.2).
Interest and dividends are expected to continue to make a positive net contribution to household income growth this year, despite increased debt. This trend can be explained mainly by historically low interest rates and high dividend income. Rising interest rates contribute to interest and dividends making a negative net contribution to income growth in 2006, which will make a major contribution to slow the growth of disposable income in 2006.
General government transfer payments are expected to rise in real terms by almost 1 per cent between 2005 and 2006, making a contribution of approximately 0.3 percentage points to real income growth. A more detailed account of household income from transfer payments is provided below.
Tax changes were implemented in 2005 that reduced income taxes by just over SEK 10 billion. The tax changes mainly consist of two parts: the tax exchange scheme and the continued compensation for individual social security contributions. Other changes include the abolition of gift and inheritance taxes for private individuals, as well as the lower wealth tax.
The Government Budget Bill proposes that compensation for individual social security contributions be completed in 2006, which would mean a tax cut for households of almost SEK 7 billion. Compensation for individual social security contributions, which began in 2000, is proposed in this government bill to be completed next year. Overall, compensation for individual social security contributions has meant that income tax has been lowered by about SEK 47 billion for households.
The Government Budget Bill also proposes other tax cuts, such as increasing the deduction for travel to and from work and raising the basic tax allowance for low-income earners.(18)
Growth in real disposable income will slow down in 2007 and 2008 to 1.4 and 1.5 per cent, respectively, mainly because of a higher price index combined with a slower increase in employment.
(18) A comprehensive account of tax revenues is to be found in Chapter 6 of the Budget Bill.
Table 9.2 Contribution to growth in real disposable income
Percentage points
| | 2004 | | 2005 | | 2006 | | 2007 | | 2008 | |
Wages | | 1.2 | | 2.1 | | 2.7 | | 2.5 | | 1.9 | |
Other factor income | | 0.2 | | 0.5 | | 0.3 | | 0.4 | | 0.3 | |
Interest and dividends, net(1) | | 0.4 | | 0.4 | | -0.4 | | -0.6 | | -0.4 | |
General government transfers | | 0.8 | | 0.3 | | 0.3 | | 0.3 | | 0.6 | |
Private transfers | | 0.1 | | 0.0 | | 0.0 | | 0.0 | | 0.1 | |
Taxes and charges | | -1.1 | | -0.5 | | -0.5 | | -1.1 | | -0.9 | |
Real disposable income | | 1.5 | | 2.9 | | 2.5 | | 1.4 | | 1.5 | |
(1) Net of interest and dividends consists mainly of interest received, dividends and interest received on individual insurances, minus interest paid.
Sources: Statistics Sweden and Ministry of Finance.
Stable development of total transfer payments
General government transfer payments to households will increase in real terms by less than 1 per cent per year during the forecast period. In 2008 real pensions are expected to rise 3.2 per cent, largely because the Income Index is expected to increase substantially, in part because of higher CPI inflation in 2007. This explains why total real transfer income this year will increase 1.8 per cent.
The Income Index is only expected to increase slightly in 2005, which means that pension income will decline somewhat in real terms this year. However, household real pension income is expected to rise between 2006 and 2008, as the Income Index is estimated to increase somewhat faster than prices.
Table 9.3 Transfer income
| | SEK billion | | Real percentage change(1) | |
| | 2004 | | 2004 | | 2005 | | 2006 | | 2007 | | 2008 | |
| | | | | | | | | | | | | |
Old age | | 230 | | 2.1 | | -0.4 | | 1.3 | | 1.7 | | 3.2 | |
Illness | | 114 | | -0.2 | | 4.7 | | 0.4 | | 2.2 | | 2.2 | |
Labour market | | 44 | | 10.4 | | -1.9 | | -6.1 | | -8.8 | | -3.4 | |
Families and children | | 48 | | -0.2 | | 2.8 | | 7.5 | | 1.6 | | 0.6 | |
Education | | 12 | | -0.2 | | -5.7 | | 7.1 | | 2.6 | | -1.0 | |
Other | | 34 | | 2.1 | | -1.0 | | -1.9 | | -0.9 | | -1.0 | |
| | | | | | | | | | | | | |
Total | | 481 | | 2.0 | | 0.8 | | 0.9 | | 0.8 | | 1.8 | |
(1) Real income from transfers is calculated by deflating nominal income by the price index for household consumption expenditure.
Sources: Statistics Sweden and Ministry of Finance.
Despite falling sick leave, household income from illness-related transfer payments is expected to rise overall during the period 2005–2008. The increase in 2005 is mainly due to an increase in the number of individuals receiving
59
sickness and activity benefits. The increase in qualifying income from 77.6 per cent to 80.0 per cent of wages below the ceiling is also a contributory factor.
Assistance benefit for people with disabilities is another transfer payment that has increased sharply over the past few years and is expected to increase from almost SEK 13 billion in 2005 to just over SEK 20 billion in 2008.
Between 2006 and 2008, unemployment-related income is expected to decrease because fewer people will be unemployed.
Several reforms will be implemented in 2006 and which will have an impact on household income from family and child-related transfer payments. Child benefit will be raised by SEK 100 per child per month as from 1 October 2005. At the same time, a supplementary child benefit of SEK 100 will be introduced for the second child, and supplementary child benefit for the third child will be raised by the same amount. As from 1 July 2006 the ceiling on parental insurance will be raised from 7.5 to 10 price base amounts. Moreover, the minimum parental benefit will be raised from SEK 60 to SEK 180 per day. Since these reforms will be implemented in mid-2006, they will also have a positive effect on household income growth in 2007, measured as an annual average. In addition, certain changes in maintenance support and housing benefit will have a positive impact on household income.
9.2 Household consumption expenditure
In the late 1990s household consumption expenditure rose sharply. In 2001, however, household consumption expenditure only climbed 0.4 per cent, although disposable income improved substantially. In 2001 employment growth came to a halt and the downturn in the stock exchange caused household financial assets to decrease in value. Household confidence deteriorated considerably and they chose to save to a greater extent than during previous years.
Between 2002 and 2004, household disposable income increased at a good rate, which gave households greater capacity for consumption (see Diagram 9.2). In addition, households’ real and financial assets have climbed in value and interest rates have been low. Despite these good conditions, household consumption has increased by a modest 1.4 to 1.8 per cent per year. The weak growth in the labour market during this period may have been accompanied by increased caution in households, which continued to save a larger share of income than during previous years.
Diagram 9.2 Household disposable income and consumption expenditure
SEK billion, constant prices reference year 2004

Note: Excluding the Church of Sweden.
Sources: Statistics Sweden, NIER and Ministry of Finance.
During the first quarter of 2005, household consumption expenditure increased by only 0.7 per cent compared with the first quarter of 2004 according to the preliminary National Accounts from Statistics Sweden. Consumption of goods during the first quarter was about 2 per cent greater than during the same period the previous year, while consumption of services remained essentially unchanged. In late 2000 the increase in consumption of services levelled off, and since then has shown weak growth (see Diagram 9.3). One factor that probably played a role is that consumption of goods was stimulated by global pressure on the price of goods, while equivalent price cuts did not occur in the service sector.
Diagram 9.3 Household consumption of goods and services
SEK billion, constant prices, reference year 2004, seasonally adjusted
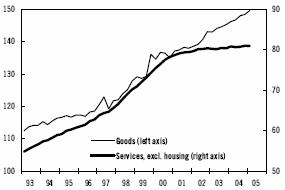
Sources: Statistics Sweden, NIER and Ministry of Finance.
60
Only extremely preliminary calculations from the National Accounts are available at this time for the second quarter. Household consumption appears to have strengthened after weak growth during the first quarter. Household consumption expenditure increased a total of 2.7 per cent during the second quarter of 2005 compared with the same period the previous year.
Indicators suggest continued increase in consumption
Statistics Sweden and the Swedish Research Institute of Trade’s index for retail sales shows relatively high growth in volume in recent months, suggesting good consumption growth during the third quarter of 2005.
NIER’s Business Tendency Survey for August reveals higher sales of durable goods. Expectations for the next few months are extremely optimistic and a considerable increase in sales is predicted.
Meanwhile, NIER’s Consumer Survey (HIP) paints a somewhat ambiguous picture (see Diagram 9.4). Households are relatively optimistic about personal finances, suggesting a continued increase in consumption. However, they have a more cautious view of the Swedish economy and the labour market. Almost half of the survey respondents believe that the labour market situation will deteriorate over the next twelve months.
Diagram 9.4 Household expectations about the economy 12 months ahead
Net balances, per cent
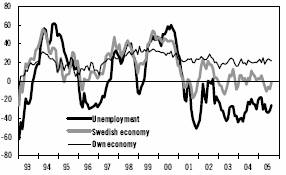
Note: Net balances before 2002 have been level adjusted.
Sources: NIER.
Prospects for consumption still favourable
Real disposable income is expected to increase 2.9 per cent this year and 2.6 per cent next year due to rising real wages, tax cuts and increased benefits, resulting in favourable conditions for household consumption.
Household financial wealth has been growing since 2003 (see Table 9.4). The upturn on the Stockholm stock exchange, which began in early 2003, has continued during 2005 and household holdings of equities and mutual funds have risen further in value. The value of household bank and insurance assets has also continued to increase. Meanwhile, households’ liabilities have also continued to rise, which means that household financial net wealth (financial assets less liabilities) has grown more slowly.
Table 9.4 Household financial wealth
Value at the end of the year/quarter, SEK billion, current prices
| | 2001 | | 2002 | | 2003 | | 2004 | | 2005 Q2 | |
Financial assets(1) | | 2572 | | 2273 | | 2556 | | 2890 | | 3063 | |
deposits in banks | | 471 | | 505 | | 531 | | 548 | | 589 | |
shares and mutual | | | | | | | | | | | |
fund shares | | 831 | | 570 | | 716 | | 836 | | 962 | |
tenant ownership | | | | | | | | | | | |
rights | | 430 | | 426 | | 497 | | 659 | | 650 | |
individual insurance | | 639 | | 576 | | 597 | | 645 | | 651 | |
other(2) | | 201 | | 196 | | 215 | | 202 | | 210 | |
Financial liabilities | | 1228 | | 1324 | | 1451 | | 1591 | | 1671 | |
Financial net wealth | | 1344 | | 949 | | 1105 | | 1300 | | 1392 | |
Note: Excluding NPISH.
(1) Excluding collective insurance technical reserves.
(2) Currency, National debt savings, National savings accounts, bonds, loans to the financial sector and other accounts receivable.
Source: Statistics Sweden (Savings Survey).
In addition to financial assets, households also have real assets, mainly in the form of single-family dwellings. Prices of single-family dwellings have risen continuously over the past ten years. Prices were just over 8 per cent higher between January and August this year than during the corresponding period in 2004. The value of households’ real assets has therefore also increased substantially.
A comparison of household debt with total gross assets appears to show that liabilities are relatively low (see Diagram 9.5). Household debt in relation to disposable income, however, has climbed in recent years despite strong income growth. Liabilities as a percentage of income today are close to the levels seen in the late 1980s and early 1990s.
61
For now, households are benefiting from the fact that total interest expenditure is being kept down by low nominal interest rates. However, households’ sensitivity to changes in interest rates should have increased as a result of greater indebtedness and a larger percentage of households choosing variable loans. Interest rates are expected to climb slightly during the forecast period, though they will remain historically low.
Diagram 9.5 Household liabilities
Per cent
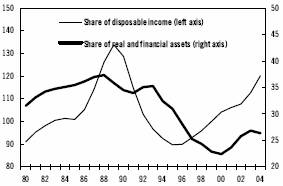
Sources: Statistics Sweden and Ministry of Finance.
Relatively high consumption growth during the forecast period
The basic conditions for households to continue increasing consumption expenditure are favourable. Household income is rising, the household wealth position is stable and interest rates are low.
The slowdown in consumption late last year and early this year appears to be over, as indicated by the stronger growth in household consumption during the second quarter.
The available indicators also suggest a continued increase in household consumption expenditure during the remainder of 2005.
Developments in the labour market are crucial for future increases in consumption. Rising employment naturally affects household income, but it also has great significance for household confidence about the future and therefore for households’ inclination to consume rather than to save. The slack labour market is expected to continue to have a subduing effect on consumption during the current year. In 2006, unemployment is forecast to fall and employment to rise, which is expected to lead to strengthened household confidence and a greater tendency to spend rather than to save.
In summary, household consumption expenditure is expected to increase 2 per cent in 2005 and 3 per cent in 2006.
Conditions for continued strong consumption growth are considered to be favourable even in the long run. In the medium-term calculations for 2007 and 2008, consumption expenditure is expected to rise 2.7 per cent per year.
9.3 Household saving
In 2004 households saved SEK 58 billion, or 4.5 per cent of disposable income. For the current year household net saving is estimated to increase to SEK 72 billion because disposable income is expected to increase faster than household consumption expenditure (see Table 9.5).
Table 9.5 Household savings
Current prices, billion SEK, unless otherwise stated
| | 2004 | | 2005 | | 2006 | | 2007 | | 2008 | |
Disposable income | | 1 282 | | 1 332 | | 1 388 | | 1 435 | | 1 490 | |
Consumption expenditure | | 1 224 | | 1 260 | | 1 319 | | 1 382 | | 1 450 | |
Own savings(1) | | 58 | | 72 | | 68 | | 53 | | 39 | |
Net saving in supplementary pension schemes | | 54 | | 54 | | 57 | | 60 | | 63 | |
Net savings(2) | | 112 | | 126 | | 125 | | 113 | | 103 | |
Net lending(3) | | 93 | | 106 | | 105 | | 92 | | 81 | |
Per cent of disposable income | | | | | | | | | | | |
Own savings | | 4.5 | | 5.4 | | 4.9 | | 3.7 | | 2.6 | |
Net savings | | 8.4 | | 9.1 | | 8.7 | | 7.6 | | 6.6 | |
Net lending | | 7.2 | | 7.9 | | 7.6 | | 6.4 | | 5.4 | |
Per cent of GDP | | | | | | | | | | | |
Net lending | | 3.6 | | 4.0 | | 3.8 | | 3.2 | | 2.7 | |
(1) Own savings = disposable income - - consumption expenditure.
(2) Net savings = own saving + net saving in supplementary pensions schemes.
(3) Net lending = own net lending + net saving in supplementary pensions schemes.
Note: The difference between the terms “net savings” and “net lending” is mainly that capital depreciation on households’ capital stock is deducted when calculating net savings, while investment expenditures are deducted when calculating net lending. If household net investments are larger than the depreciation of capital, i.e. capital stock is growing, then net lending will be lower than net savings.
Sources: Statistics Sweden and Ministry of Finance.
Statistics Sweden’s definition of households’ net saving includes both personal saving and saving in funded pension schemes under collective agreements. The latter includes contributions and yield less pensions paid out. Both defined-benefit and defined-contribution schemes are included.
62
Household saving does not include either pension benefits accrued in the national pension system or saving in unfunded supplementary pension schemes. Net saving in supplementary pension schemes increased sharply in the 1990s and amounted to over SEK 54 billion, equivalent to 2 per cent of GDP in 2004.
Between 2005 and 2008 consumption expenditure is expected to increase faster than income. Although household saving will decrease, it is expected to remain positive (see Diagram 9.6). Total net savings and net lending as a percentage of disposable income will decrease during the period.
Diagram 9.6 Household savings
Per cent of disposable income
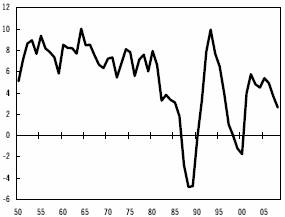
Note: Own savings is household net savings excluding savings in supplementary pension schemes.
Sources: Statistics Sweden and Ministry of Finance.
Household net lending suffers from major measurement problems, causing uncertainty about the level and growth of lending. The definition of household net lending in the National Accounts differs from how the Financial Accounts calculate net lending, leading to considerable discrepancies in the amounts involved (see Table 9.6).
Table 9.6 Household net lending
SEK billion
| | 2002 | | 2003 | | 2004 | |
National accounts | | 102 | | 97 | | 93 | |
Per cent of disposable income | | 8.4 | | 7.8 | | 7.2 | |
Financial accounts | | 45 | | 52 | | 8 | |
Per cent of disposable income | | 3.7 | | 4.1 | | 0.6 | |
Difference | | 57 | | 45 | | 85 | |
Per cent of disposable income | | 4.7 | | 3.6 | | 6.6 | |
Source: Statistics Sweden.
In the National Accounts, net lending is the difference between income and expenditure, while the Financial Accounts calculate transactions in financial assets less liabilities.
Statistics Sweden has analysed the difference between net lending in the National Accounts and the Financial Accounts.(19) The effect of timing differences of tax revenue and inadequate information pertaining to certain investment assets in the Financial Accounts, as well as the National Accounts’ assessment of the size of the black market, are noted as possible explanations.
(19) Net lending in the Swedish economy, from Bakgrundsfakta till Ekonomisk statistik [Background information for economic statistics], 2004:4, Statistics Sweden.
63
10 Investment
The upswing in investment that began last year will continue throughout the forecast period. Continued high capacity utilisation in industry and favourable corporate financial conditions are driving investment growth. Low interest rates contribute to continued strong development of residential investment. All factors considered, total investment in the Swedish economy is estimated to increase 7.9 per cent this year and 5.0 per cent in 2006.
After a relatively shallow decline in total investment between 2001 and 2003, an upswing began last year (see Diagram 10.1). In 2004 the business sector’s producers of services contributed most to investment growth. This year goods producers are taking over as the motor in the business sector, while investment by service producers is growing at a calmer rate than in 2004. Residential investment will continue to develop strongly, mainly because of the low interest rates. The general government sector’s investment will also grow during the forecast period due to infrastructure initiatives and increased investment in municipalities.
Diagram 10.1 Investment
Annual percentage change
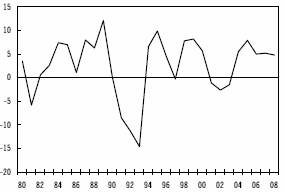
Source: Statistics Sweden and Ministry of Finance.
All factors considered, total investment is estimated to grow 7.9 per cent this year and 5.0 per cent in 2006 (see Table 10.1). Since the total investment level in the 2004 National Accounts was very high, there will be a substantial gross addition to the aggregate production capacity (capital stock) during the forecast period from a historical perspective.
In the medium-term estimate, resource utilisation in the Swedish economy is expected to increase gradually since actual GDP growth is estimated to be higher than potential GDP growth, suggesting continued robust growth in investment between 2007 and 2008.
Total investment’s share of GDP fell substantially in the early 1990s (see Diagram 10.2), mainly due to a sharp drop in residential construction. Over the next few years, total investment in current prices is expected to grow faster than GDP, causing an increase in investment as a percentage of GDP; by the end of 2008 it should reach about 18 per cent of GDP.
Diagram 10.2 Investment share of GDP
Per cent
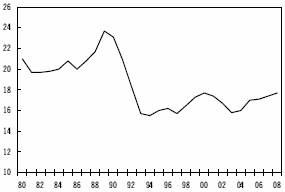
Source: Statistics Sweden and Ministry of Finance.
10.1 Business sector
Sharp increase in investment by goods producers
According to Statistics Sweden’s preliminary figures, industrial investment in machinery grew robustly during the first half of the year. In addition, the inflow of orders has slowed, followed by a slowdown in production during the same period, causing a drop-off in capacity utilisation. Nevertheless, capacity utilisation is holding at a historically high level (see Diagram 10.3), and combined with low interest rates and firms reporting good profitability, these factors suggest that investment in machinery will continue to grow.
Statistics Sweden’s investment survey also suggests that the upswing in industry will continue for the rest of the year. The survey shows that heavyweight investment in machinery is growing robustly while investment in construction is falling somewhat. Broken down by sector, investment is expected to grow most in the
64
mining and quarrying industry. Firms in the pulp, paper and paper products industry are also increasing investment substantially this year, as is the transport equipment industry.
Diagram 10.3 Capacity utilisation in industry
Per cent
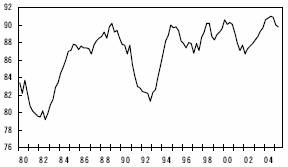
Note: Capacity utilisation is defined as the ratio of actual production to total production capacity.
Source: Statistics Sweden.
After the recent slowdown in industrial activity, demand for Swedish goods is expected to pick up in the future (see section 2). Combined with continued low interest rates and good profitability of firms, these factors are estimated to contribute to an additional increase in total investment in industry in 2006.
Table 10.1 Investment
Percentage change
| | 2004 | | 2005 | | 2006 | | 2007 | | 2008 | |
Business sector(1) | | 4.7 | | 7.7 | | 4.2 | | 5.6 | | 5.5 | |
Producers of goods | | 0.5 | | 14.4 | | 5.3 | | — | | — | |
Producers of services | | 7.7 | | 3.1 | | 3.4 | | — | | — | |
Housing | | 16.1 | | 14.5 | | 9.7 | | 7.5 | | 6.0 | |
General government | | 0.3 | | 2.8 | | 3.8 | | 1.0 | | 0.6 | |
Central government | | 5.7 | | 0.2 | | 5.2 | | 0.6 | | 0.0 | |
Local government | | -5.6 | | 5.9 | | 2.2 | | 1.5 | | 1.4 | |
Total | | 5.5 | | 7.9 | | 5.0 | | 5.2 | | 4.8 | |
Building and construction | | 3.8 | | 6.1 | | 6.4 | | 5.1 | | 4.4 | |
Machinery | | 6.7 | | 12.6 | | 4.6 | | 5.4 | | 5.4 | |
Other | | 6.9 | | 0.5 | | 2.4 | | 4.6 | | 4.3 | |
(1) Housing excluded.
Sources: Statistics Sweden and Ministry of Finance.
The strong upswing in residential construction (see Section 10.3) has contributed to a huge increase in the construction industry’s own investment during the first six months of the year. Prospects for the future within the construction sector are bright and the good investment trend is therefore expected to continue during 2006.
In summary, investment by goods producers will grow robustly during the forecast period. Total investment growth in the goods-producing sector is estimated at 14.4 per cent this year and 5.3 per cent in 2006.
Calmer phase for service producers
Service producers contributed heavily to the total upswing in investment in the economy last year. Service producer investment is growing at a slower pace this year and will continue to do so in 2006, mainly because of a calmer investment phase in corporate services and in post and telecommunications. Excluding residential investment, these two sectors represent almost one third of total investment volume in the service sector.
Investment in trade continued to grow during the first six months of the year. This trend is expected to hold for the rest of the year, and in 2006 increasing household consumption is expected to help the total investment level in trade to continue to grow.
The decline in investment seen in recent years in real estate excluding housing appears to have levelled off this year. This trend is also reflected in Statistics Sweden’s survey, indicating a weak recovery of investment in commercial real estate. At the same time vacancy figures are high, which also suggests a restrictive rate of investment in the future.
Investment in other industries in the service sector is expected to grow at a relatively good pace during the forecast period. All factors considered, this means that total investment in the service sector is estimated to increase 3.1 per cent this year and 3.4 per cent in 2006.
10.2 General government sector
Preliminary figures from Statistics Sweden for the first six months of the year show an upturn in municipalities’ investment after the decline of recent years. Stronger local government finances (see Chapter 11) are expected to contribute to continued investment growth during the forecast period. Central government investment decreased somewhat during the first six months of the year compared with the corresponding period last year. In the future the National Rail
65
Administration and the National Road Administration’s infrastructure initiatives are expected to lead to a recovery, and next year investment is expected to grow at a good rate. Taken together, general government sector investment is expected to increase 2.8 per cent this year and 3.8 per cent in 2006.
10.3 Housing
Construction of new housing increased considerably last year. According to preliminary information from Statistics Sweden, there were just over 27,500 housing starts, corresponding with an increase of a full 24 per cent compared with 2003. Seen from a long-term perspective, the increases in recent years have occurred from low levels, which is related to the large drop in residential construction in the early 1990s (see Diagram 10.4).
Statistics Sweden’s preliminary statistics for the first half of the year show that construction will continue to show robust growth. This trend is also reflected in the Business Tendency Survey published by the National Institute of Economic Research (NIER), which shows that both orders and construction are at a historically high level. The same situation applies for the overall confidence indicator and for the outlook for the construction market in one year’s time. Optimism in the construction sector is greater than it has been for a long time.
New building starts are forecast to continue to increase during the rest of the year as well as next year, mainly due to low interest rates. Another stimulating factor for new production is the current housing shortage, which is largely found in densely populated areas. According to the National Board of Housing, Building and Planning’s housing market survey, just over 60 per cent of the Swedish population live in the 111 municipalities where there is a housing shortage this year. At the same time, more municipalities are shifting from having a surplus to having a balanced supply of housing in relation to demand this year.
Overall, the number of new building starts is estimated to amount to just over 31,000 dwellings this year; next year this figure will increase to just over 32,000 dwellings.
Investment in refurbishing increased at a strong pace during the first six months of the year. This trend can probably be explained to some extent by the tax allowance for repairs to housing. The upturn is expected to continue in the future, due to a strong underlying need for renovations. A large proportion of existing housing in Sweden was built in the 1960s and 1970s as part of the Million Homes Programme. According to calculations from the Swedish National Board of Housing, Building and Planning, close to 1.2 million apartments will need to replace plumbing pipes over the next twenty years.
In summary, in terms of the National Accounts, the increased new construction and renovations mean that total residential investment is estimated to grow 14.5 per cent this year and 9.7 per cent in 2006.
Diagram 10.4 New building starts
Thousands
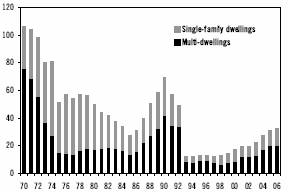
Sources: Statistics Sweden and Ministry of Finance.
10.4 Stocks
The strong demand during 2004 helped to hold stocks down in both industry and trade. All factors considered, total stockbuilding dropped, which pulled down GDP growth by 0.3 percentage points.
Statistics Sweden figures suggest that industries’ stocks of input goods are relatively small because of net withdrawals during the past three years. This is also reflected in NIER’s Business Tendency Survey, where the balance for stock assessments of input goods has been at extremely low levels at times, especially during
66
2004.(20) Firms are expected to begin to rebuild these stocks this year in order to avoid production bottlenecks. This stockbuilding will continue to some extent next year. Investment in industries’ stocks of finished goods is estimated to remain essentially unchanged this year and in 2006.
Dissatisfaction with overly large stocks in the motor vehicle trade continues. Although the balance for assessments of stocks has declined somewhat according to NIER’s Business Tendency Survey, it is still above the historical average. For firms in wholesale trade (excluding motor vehicles), the balance for stock assessments indicates minor variations from the historical average. The durable goods trade reports a decreasing balance, while the food industry’s balance has been essentially unchanged over the past year.
Relatively minor variations are expected in total trade stockbuilding in the near future. Relatively heavy stockbuilding during the first quarter contributes to an overall positive impact on GDP growth from trade this year. In 2006 stockbuilding in trade is expected to have a growth-neutral impact on GDP growth.
The severe storm that hit southern Sweden last January entailed a substantial drop in stockbuilding in standing timber during the first quarter. This decrease was offset by a sharp increase in stockbuilding in cut forest. The net impact on stockbuilding in forestry in the National Accounts during the first quarter was therefore limited. During the remainder of the current year, stockbuilding in standing timber is estimated to return to positive levels, in part because the storm reduced the need to cut timber, and in part because Swedish forests are relatively young and therefore not mature for cutting. The large stocks of cut forest are not expected to normalise until the longer term.
In summary, total stockbuilding is estimated to increase somewhat this year and have an impact on GDP growth of 0.1 percentage points. Next year the impact on GDP growth from stockbuilding in the economy is expected to be essentially neutral.
(20) This balance comprises the balance between the percentage of firms that state that stocks are too large or too small, respectively.
67
11 General government sector
General government net lending is expected to show a surplus throughout the forecast period and both net debt and gross debt continue to decrease as a percentage of GDP. This year the surplus will be 1.4 per cent and in 2006 it will be 0.7 per cent of GDP.
11.1 Consolidated general government sector
Budget policy targets
Fiscal policy is governed by two medium-term targets. First, net lending in the general government sector is to average 2 per cent of GDP over a business cycle (surplus target). Second, the central government and old age pension system’s expenditures may not exceed the established expenditure ceiling, normally decided three years in advance. The local government sector must satisfy the balanced budget requirement.
The primary purpose of the surplus target is to strengthen the general government’s financial position to be able to handle future demographic strains on the public welfare system (see section 12). At the same time the target creates a buffer to avoid overly large deficits in a recession.
General government net lending is defined by the EU’s regulations for national accounts, ESA-95. This means that the surplus target encompasses the central government, the old-age pension system and the local government sector. The expenditure ceiling, an important tool in the central government’s budgetary process, prevents temporarily higher income from leading to permanently higher expenditure. The expenditure ceiling is also an important instrument for achieving the surplus target.
Expenditures included in the expenditure ceiling deviate in scope and definition from the expenditures in the surplus target in several regards and encompass the expenditures in the central government budget except national debt interest payments, expenditures for the old-age pension system and a budgeting margin. Local government sector expenditures are not included in the expenditure ceiling. Besides the fact that the expenditure ceiling does not cover the local government sector’s expenditures, other expenditures that are not covered by the expenditure ceiling also affect general government net lending. Certain central government expenditures are financed on the income side of the central government budget and through the National Debt Office. There are also accounting differences between the National Accounts and the central government budget that affect the size of revenues and expenditures, but not the balance.
Surplus target
The surplus target of net lending of an average of 2 per cent of GDP over a business cycle has been in effect since 2000.
Table 11.1 shows how net lending has developed since 2000 and how it is allocated among the three sub-sectors of general government. In
Table 11.1 General government net lending
| | 2000 | | 2001 | | 2002 | | 2003 | | 2004 | | 2005 | | 2006 | | 2007 | | 2008 | |
Billion SEK | | | | | | | | | | | | | | | | | | | |
Central government | | 58 | | 167 | | –44 | | –43 | | –23 | | –24 | | –41 | | –29 | | –9 | |
Old-age pension system | | 48 | | –104 | | 45 | | 47 | | 48 | | 52 | | 53 | | 53 | | 50 | |
Local government sector | | 5 | | –4 | | –13 | | –7 | | 2 | | 10 | | 8 | | 8 | | 8 | |
General government | | 110 | | 59 | | –12 | | –2 | | 26 | | 37 | | 21 | | 32 | | 49 | |
Per cent of GDP | | | | | | | | | | | | | | | | | | | |
Central government | | 2.6 | | 7.4 | | –1.9 | | –1.7 | | –0.9 | | –0.9 | | –1.5 | | –1.0 | | –0.3 | |
Old-age pension system | | 2.2 | | –4.6 | | 1.9 | | 1.9 | | 1.9 | | 2.0 | | 1.9 | | 1.8 | | 1.7 | |
Local government sector | | 0.2 | | –0.2 | | –0.5 | | –0.3 | | 0.1 | | 0.4 | | 0.3 | | 0.3 | | 0.3 | |
General government | | 5.0 | | 2.6 | | –0.5 | | –0.1 | | 1.0 | | 1.4 | | 0.7 | | 1.1 | | 1.6 | |
Average as from 2000 | | 5.0 | | 3.8 | | 2.4 | | 1.8 | | 1.6 | | 1.6 | | 1.5 | | 1.4 | | 1.4 | |
Sources: Statistics Sweden and Ministry of Finance.
68
Table 11.2 Expenditure ceiling and government expenditure
Billion SEK
| | 2000 | | 2001 | | 2002 | | 2003 | | 2004 | | 2005 | | 2006 | | 2007 | | 2008 | |
Expenditure ceiling | | 720 | | 746 | | 773 | | 803 | | 836 | | 870 | | 907 | | 949 | | 982 | |
| | | | | | | | | | | | | | | | | | | |
Per cent of GDP | | 32.8 | | 32.9 | | 32.9 | | 32.9 | | 32.8 | | 33.2 | | 32.8 | | 32.7 | | 32.3 | |
| | | | | | | | | | | | | | | | | | | |
Budget margin | | 5.0 | | 4.7 | | 0.4 | | 2.9 | | 2.4 | | 1.6 | | 2.2 | | 11.9 | | 17.9 | |
| | | | | | | | | | | | | | | | | | | |
Expenditure under the ceiling | | 715 | | 741 | | 773 | | 800 | | 834 | | 868 | | 905 | | 937 | | 964 | |
| | | | | | | | | | | | | | | | | | | |
Per cent of GDP | | 32.6 | | 32.7 | | 32.8 | | 32.8 | | 32.7 | | 33.1 | | 32.7 | | 32.2 | | 31.7 | |
| | | | | | | | | | | | | | | | | | | |
Central government and the pension system, primary expenditure | | 719 | | 734 | | 775 | | 828 | | 852 | | 890 | | 932 | | 959 | | 982 | |
| | | | | | | | | | | | | | | | | | | |
Per cent of GDP | | 32.8 | | 32.4 | | 32.9 | | 33.9 | | 33.5 | | 33.9 | | 33.7 | | 33.0 | | 32.3 | |
Note: The budgeting margin 2008 is based on an expenditure ceiling according to the government’s judgement. The expenditure under the ceiling is adjusted for technical changes. Central government and the pension system primary expenditure are according to the National Accounts, adjusted for value added tax included in central government consumption, central government investment and in the grants to the local government sector, and for transfers to the premium pension system.
Sources: Statistics Sweden and Ministry of Finance.
2000 net lending reached 5 per cent of GDP. The large surplus allowed room for an expansionary fiscal policy during the following years with weak economic development.
In 2002 and 2003 net lending showed a minor deficit. Last year net lending improved to a surplus of SEK 26 billion or 1.1 per cent of GDP and this year it is estimated to be 1.4 per cent of GDP. The average surplus calculated from 2000 amounts to about 1.5 per cent of GDP per year during the forecast period.
All sub-sectors of general government showed a surplus in net lending for 2000. In 2001 the distribution of net lending between the central government and the old-age pension system was affected by transfers of SEK 155 billion, equivalent to 6.8 per cent of GDP, from the National Pension Funds to the central government as a result of the pension reform. Excluding this transfer, the old-age pension system has a stable surplus of about 2 per cent of GDP for the entire period between 2000 and 2008. The local government sector’s net lending was positive in 2004 and is expected to remain so during the forecast period. Variations in general government net lending are mainly found in the central government, which has had negative net lending since 2002.
Expenditure ceiling
The expenditure ceiling has been met every year since the ceiling was implemented in 1997. Between 2000 and 2004, however, the budgeting margin was relatively small and it is expected to be narrow for 2005 and 2006 as well. With the currently proposed expenditure ceiling for 2007 the budgeting margin will be SEK 11.9 billion (see Table 11.2). The expenditure ceiling for 2008 will not be approved until the 2007 Budget Bill, but according to the government, SEK 982 billion is a well balanced level for the scope for central government expenditures in 2008.
The accounting principles for the central government budget vary over time. The expenditure ceilings for 2000–2005 in Table 11.2 have therefore been corrected to reflect the principles in effect beginning in 2006 in order to achieve comparability. Corrected for technical changes, the expenditure ceiling as a percentage of GDP has been relatively stable since 2000. Expenditures as reported in the National Accounts deviate in several regards from the Budget Accounts. However, after adjustments for the most important differences (see note under Table 11.2) a level is obtained that is relatively close to the Budget Accounts. Remaining differences in level and development are due in part to the fact that certain expenditures in the National Accounts are reported as income in the budget, through a credit against the tax account, or through debt with the National Debt Office instead of as a grant.
During the forecast period the central government budget and the National Accounts show a similar development of expenditures as a percentage of GDP. After an increase in 2005, expenditures will decrease as a percentage of GDP.
Net lending
In 2004 general government net lending amounted to SEK 26 billion, or 1 per cent of GDP, according to preliminary National Accounts. In the preliminary outcome, certain tax revenues are forecasts for the final outcome,
69
since the tax assessment for 2004 income was not completed when the preliminary National Accounts were published in March. The tax assessment is still not ready but more recent information suggests that tax revenues are underestimated by about SEK 8 billion in the preliminary National Accounts. With the higher tax revenues, net lending should amount to 1.4 per cent of GDP in 2004.
Table 11.3 General government finances
| | 2004 | | 2005 | | 2006 | | 2007 | | 2008 | |
Revenue | | 1 414 | | 1 466 | | 1 521 | | 1 591 | | 1 663 | |
per cent of GDP | | 55.6 | | 55.9 | | 54.9 | | 54.7 | | 54.7 | |
Taxes and charges | | 1 280 | | 1 321 | | 1 373 | | 1 438 | | 1 505 | |
per cent of GDP | | 50.3 | | 50.4 | | 49.6 | | 49.5 | | 49.5 | |
Capital income | | 53 | | 60 | | 59 | | 60 | | 62 | |
Other income | | 82 | | 85 | | 88 | | 93 | | 96 | |
Expenditure | | 1 388 | | 1 429 | | 1 500 | | 1 559 | | 1 614 | |
per cent of GDP | | 54.5 | | 54.5 | | 54.2 | | 53.6 | | 53.1 | |
Primary expenditure | | 1 337 | | 1 377 | | 1 447 | | 1 500 | | 1 549 | |
per cent of GDP | | 52.5 | | 52.5 | | 52.3 | | 51.6 | | 51.0 | |
Interest | | 51 | | 52 | | 53 | | 59 | | 65 | |
per cent of GDP | | 2.0 | | 2.0 | | 1.9 | | 2.0 | | 2.1 | |
Net lending | | 26 | | 37 | | 21 | | 32 | | 49 | |
per cent of GDP | | 1.0 | | 1.4 | | 0.7 | | 1.1 | | 1.6 | |
Financial position | | | | | | | | | | | |
Net debt | | –131 | | –161 | | –188 | | –221 | | –270 | |
per cent of GDP | | –5.2 | | –6.1 | | –6.8 | | –7.6 | | –8.9 | |
Consolidated gross debt | | 1 300 | | 1 330 | | 1 361 | | 1 383 | | 1 393 | |
per cent of GDP | | 51.1 | | 50.7 | | 49.2 | | 47.6 | | 45.8 | |
Note: Consolidated gross debt is defined by EU rules (the Maastricht criteria).
Sources: Statistics Sweden and Ministry of Finance.
At the end of 2004 financial assets exceeded liabilities by SEK 131 billion or 5.2 per cent of GDP. Consolidated gross debt totalled 51.1 per cent of GDP.
For 2005 general government net lending is estimated at SEK 37 billion or 1.4 per cent of GDP. This is an improvement of SEK 19 billion compared with what was calculated in the 2005 Spring Fiscal Policy Bill, even though economic growth is lower than what was predicted last spring. The improvement is mainly due to lower local government consumption, lower interest rates and unexpectedly high revenues from corporate taxes.
The measures now proposed to reduce unemployment and lower taxes contribute to a reduction in net lending to 0.7 per cent of GDP in 2006.
In 2007 and 2008 expenditures as a percentage of GDP will decrease and net lending will therefore gradually strengthen to 1.6 per cent of GDP at the end of the forecast period, with a budgeting margin of 0.6 per cent of GDP (see Table 11.3).
The surplus in the pension system’s net lending means continued strengthening of the general government’s net financial position. The deficit in central government finances, however, means an increase in central government debt and consolidated gross debt. However, the increase in debt will not be large enough to prevent consolidated debt from continuing to fall as a percentage of GDP (see Diagram 11.1).
Diagram 11.1 Consolidated gross debt
Per cent of GDP
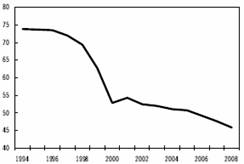
Sources: Statistics Sweden and Ministry of Finance.
Taxes and charges
The taxes reported in the National Accounts for the general government sector are somewhat lower than total taxes paid. The portion of value added tax and customs revenues included as part of the EU contribution is not classified as a tax in the general government sector, but as a foreign payment. Total taxes as a percentage of GDP (tax ratio) fell in the early 1990s, mainly as a result of the economic crisis and because the 1991 tax reform was underfinanced. Tax increases in the consolidation programme and extraordinarily high corporate profits and capital gains in 1999 and 2000 resulted in a substantial increase in the tax ratio during the second half of the 1990s. Tax cuts and reduced corporate profits and capital gains contributed to a decrease in
70
the tax ratio once again in the early 2000s (see Diagram 11.2).
In 2004 the tax ratio was 50.6 per cent of GDP according to the preliminary National Accounts (see Table 11.4). More recent data from preliminary tax assessments pertaining to 2004 revenues suggest that tax revenues are underestimated in the preliminary National Accounts by about SEK 8 billion or 0.4 per cent of GDP.
Diagram 11.2 Tax ratio including EU contribution
Per cent of GDP
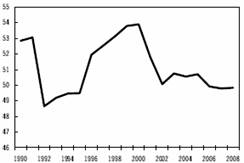
Sources: Statistics Sweden and Ministry of Finance.
In 2005 the tax ratio is estimated to amount to 50.7 per cent of GDP, which means a decrease compared with last year after taking into account the underestimation in the 2004 National Accounts. Changes in regulations entail a tax loss of almost SEK 10 billion this year. Lower income and wealth tax, as well as the abolition of gift and inheritance taxes, have reduced households’ direct taxes by about SEK 15 billion this year. Energy taxes have been raised and regulations for firms’ provisions to tax allocation reserves have been changed to help finance these tax cuts.
As a result of the decision to charge interest on firms’ tax allocation reserves beginning in 2005, some firms reversed all or parts of their tax allocation reserves in 2004.
The forecast assumes that those firms that dissolved their tax allocation reserves are leaving the system, which means that no provisions will be made in 2005 or in the future. This increases revenues from corporate taxes.
The Government Budget Bill for 2006 and special government bills propose several changes in regulations, which taken together entail a tax loss of about SEK 4 billion. Household income tax has been reduced by about SEK 9 billion through the gradual compensation for the individual contribution to the pension system, which began in 2000 and will be in full force next year and through the raised basic tax allowance. These tax reductions are financed in part, as in previous years, by increased energy and environmental taxes. The changed regulations contribute to a reduction of the tax ratio to 49.9 per cent in 2006. During subsequent years the tax ratio will remain essentially unchanged.
Table 11.4 Taxes and charges
Per cent of GDP
| | 2004 | | 2005 | | 2006 | | 2007 | | 2008 | |
Household taxes and charges | | 19.4 | | 19.2 | | 18.7 | | 18.7 | | 18.7 | |
Company direct taxes | | 2.7 | | 3.0 | | 2.9 | | 2.9 | | 2.9 | |
Payroll charges | | 14.1 | | 14.0 | | 13.9 | | 13.9 | | 13.9 | |
Value added tax | | 9.2 | | 9.3 | | 9.2 | | 9.2 | | 9.3 | |
Property tax | | 1.0 | | 1.0 | | 1.0 | | 1.0 | | 1.0 | |
Other production taxes | | 4.2 | | 4.2 | | 4.2 | | 4.1 | | 4.0 | |
Total | | 50.6 | | 50.7 | | 49.9 | | 49.8 | | 49.8 | |
of which to | | | | | | | | | | | |
General government | | 50.3 | | 50.4 | | 49.6 | | 49.5 | | 49.5 | |
EU | | 0.3 | | 0.3 | | 0.3 | | 0.3 | | 0.3 | |
Sources: Statistics Sweden and Ministry of Finance.
Capital and other income
Alongside taxes, the general government sector receives capital and other income, which in 2004 amounted to SEK 135 billion, or 5.3 per cent of GDP. Around 40 per cent of this income consists of capital income in the form of interest and dividends, and approximately half of this is the yield on the pension funds. In 2004 capital income exceeded interest expenditure, reflecting favourable financial wealth. Capital income will rise relatively sharply this year as a result of increased dividend income.
Other income consists mainly of imputed pension charges and consumption of fixed capital. This income is imputed and is matched on the expenditure side by equally large costs, which are included in general government consumption expenditure.
Expenditure
General government expenditure as a percentage of GDP (expenditure ratio) rose sharply during the economic crisis in the early 1990s. Savings in
71
the consolidation programme together with rapid economic growth contributed to a reduction in the expenditure ratio during the second half of the 1990s. The expenditure ratio increased in 2002 and 2003 because of reforms and the recession. In 2004, however, the expenditure ratio decreased 1.4 percentage points to 54.5 per cent (see Diagram 11.3).
Diagram 11.3 Expenditure ratio
Per cent of GDP
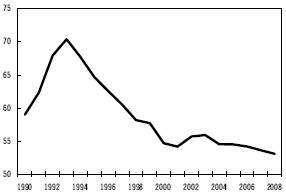
Sources: Statistics Sweden and Ministry of Finance.
The expenditure ratio is estimated to hold this year, after which it will decrease during the forecast period (see Table 11.5). Transfer payments to households have decreased as a percentage of GDP. Next year the improvement in the labour market will contribute to a reduction of transfer payments to households as a percentage of GDP.
The sharply rising trend in expenditure for health insurance in recent years will be broken, but disability pensions will continue to rise. Transfer payments to households are described in greater detail in section 9.1. Other transfer payments are expected to increase as a percentage of GDP in 2005 and 2006, in part due to a sharp increase in developmental support.
Last year public consumption volume increased slightly; it even decreased in calendar adjusted terms. This year general government consumption is expected to remain unchanged in volume. Next year the currently proposed labour market policy measures are expected to help general government consumption to increase 1.8 per cent. The increase for calendar-adjusted consumption will be even greater. In 2007 and 2008 general government consumption is expected to increase by 0.9 per cent and 0.2 per cent, respectively. Central government consumption will decrease as a percentage of GDP, while local government consumption will hold at about 20 per cent of GDP during the forecast period. General government investment will increase in volume over the next few years, amounting to about 3 per cent of GDP during the forecast period.
Interest expenditure has decreased by SEK 40 billion since 2000 and will total about 2 per cent of GDP throughout the forecast period.
Table 11.5 General government expenditure
Per cent of GDP
| | 2004 | | 2005 | | 2006 | | 2007 | | 2008 | |
Transfers to households | | 18.9 | | 18.7 | | 18.1 | | 17.8 | | 17.7 | |
Other transfers | | 3.0 | | 3.2 | | 3.5 | | 3.4 | | 3.0 | |
Consumption | | 27.7 | | 27.6 | | 27.6 | | 27.5 | | 27.3 | |
Central government and old-age pension system | | 7.7 | | 7.5 | | 7.4 | | 7.4 | | 7.3 | |
Local government | | 20.0 | | 20.1 | | 20.1 | | 20.1 | | 20.0 | |
Investment | | 2.8 | | 3.0 | | 3.0 | | 3.0 | | 2.9 | |
Interest | | 2.0 | | 2.0 | | 1.9 | | 2.0 | | 2.1 | |
Total expenditure | | 54.5 | | 54.5 | | 54.2 | | 53.6 | | 53.1 | |
exclusive of interest | | 52.5 | | 52.5 | | 52.3 | | 51.6 | | 51.0 | |
Sources: Statistics Sweden and Ministry of Finance.
11.2 Central government
In the National Accounts, the central government encompasses all activities that are mainly financed by taxes and controlled by the central government, regardless of type of organisation. Business activities in state-owned enterprises are not included in the central government, but in the business sector. The central government budget covers all activities that affect the central government’s borrowing requirement.
National Accounts
The central government’s net lending has been negative since 2002, after having maintained a surplus between 1998 and 2001. In 2004 the deficit reached SEK 23 billion or 0.9 per cent of GDP, or half of the deficit in 2003. This year income is expected to increase SEK 36 billion and expenditures somewhat more, which means a slight increase in the deficit. In 2006 expenditures will increase at the same rate as this year, while income will only increase by SEK 23 billion. Consequently, the deficit in net lending will increase to SEK 41 billion or 1.5 per cent of
72
GDP. In 2007 and 2008 income will increase relatively substantially, while expenditures will show slower growth in the absence of additional reforms. This means that the deficit will be reduced to SEK 9 billion in 2008 (see Table 11.6).
Table 11.6 Central government finances
Billion SEK
| | 2004 | | 2005 | | 2006 | | 2007 | | 2008 | |
Revenue | | 779 | | 815 | | 838 | | 876 | | 914 | |
Taxes and charges | | 712 | | 738 | | 764 | | 800 | | 837 | |
Other income | | 67 | | 77 | | 74 | | 75 | | 77 | |
Expenditure | | 802 | | 839 | | 879 | | 905 | | 923 | |
Primary | | | | | | | | | | | |
expenditure | | 760 | | 794 | | 832 | | 852 | | 865 | |
Interest | | 43 | | 46 | | 48 | | 53 | | 58 | |
Net lending | | -23 | | -24 | | -41 | | -29 | | -9 | |
per cent of GDP | | -0.9 | | -0.9 | | -1.5 | | -1.0 | | -0.3 | |
Sources: Statistics Sweden and Ministry of Finance.
Central government budget
The central government’s net lending shows the change in financial wealth excluding changes in value. The budget balance shows the central government’s borrowing requirements and therefore reflects the change in central government debt. Net lending is not affected by the central government selling or buying financial assets, such as shares, or increasing lending, such as study support, since this does not change wealth. However, the budget balance and central government debt are affected by such financial transactions.
Table 11.7 Central government net lending and budget balance
Billion SEK
| | 2004 | | 2005 | | 2006 | | 2007 | | 2008 | |
Net lending | | -23 | | -24 | | -41 | | -29 | | -9 | |
Difference between interest accrued and paid | | -16 | | 3 | | -3 | | 2 | | -1 | |
Effect of timing difference of tax revenue | | -22 | | -3 | | -1 | | -2 | | -9 | |
Sales of shares | | 0 | | 7 | | 15 | | 15 | | 15 | |
Other financial transactions | | 11 | | -11 | | -7 | | -9 | | -8 | |
Budget balance | | -51 | | -28 | | -37 | | -22 | | -12 | |
Sources: National Debt Office, Statistics Sweden and Ministry of Finance.
In addition to this principal difference, accounting for the central government budget differs in several regards from reporting in the National Accounts. The budget balance is reported on a cash basis while the National Accounts apply the accrual method of accounting. This difference mainly affects reporting of taxes and interest expenditure.
The differences in accounting principles referred to above result in differences between the budget balance and net lending. There are also major differences between the central government budget and the National Accounts when reporting revenues and expenditures that do not affect the balance (see section 11.1 on the expenditure ceiling).
Table 11.8 Budget balance and central government debt
Billion SEK
| | 2004 | | 2005 | | 2006 | | 2007 | | 2008 | |
Revenue | | 694 | | 718 | | 747 | | 786 | | 815 | |
Expenditure under the ceiling | | 688 | | 696 | | 725 | | 748 | | 761 | |
Interest expenditure | | 53 | | 35 | | 43 | | 43 | | 51 | |
Net borrowing etc. | | 4 | | 15 | | 15 | | 17 | | 14 | |
Budget balance | | -51 | | -28 | | -37 | | -22 | | -12 | |
per cent of GDP | | -2.0 | | -1.1 | | -1.3 | | -0.8 | | -0.4 | |
Debt disposals etc. | | -23 | | 16 | | -7 | | -2 | | -2 | |
Central government debt | | 1 208 | | 1 252 | | 1 281 | | 1 302 | | 1 311 | |
per cent of GDP | | 47.5 | | 47.8 | | 46.3 | | 44.8 | | 43.1 | |
Sources: National Debt Office, Statistics Sweden and Ministry of Finance.
The 2004 budget deficit was SEK 51 billion and this year the deficit is estimated to amount to SEK 28 billion. Thus the budget balance will improve by SEK 23 billion between 2004 and 2005, while net lending will deteriorate by SEK 1 billion. The difference in trend is due in part to the periodic allocation of interest expenditure and taxes, and because the budget balance, unlike net lending, is strengthened by assumed sales of shares amounting to SEK 7 billion. Other financial transactions have a negative effect on the budget balance, but do not affect net lending. This year the budget balance has worsened because the National Debt Office has taken over loans of SEK 7 billion previously reported by the Swedish National Road Administration for financing investments in urban Stockholm and Gothenburg.
For 2006 and 2007 it is assumed that shares will be sold for SEK 15 billion each year (see Table 11.7).
Consolidated central government debt amounted to SEK 1,208 billion or 47.5 per cent of GDP at the end of 2004. During the forecast period central government debt will increase in
73
line with the budget deficit. In addition, debt in foreign currencies will be affected by exchange rate fluctuations. Central government debt as a percentage of GDP will increase temporarily this year because of the weakening of the krona.
11.3 The old-age pension system
The old-age pension system consists of an income-related part and a prefunded part. During the build-up phase of the reformed pension system, income exceeds pensions paid, resulting in savings for both the income-related and the prefunded components of the pension system. The National Pension Funds serve as a buffer in the income-related portion. Alongside the income-related system, an asset base is being built up within a prefunded section of the pension system. The funds allocated since 1995 correspond to earned premium pension rights and are invested initially with the Swedish National Debt Office. During temporary management by the National Debt Office, provisions in the prefunded pension system are included in central government net lending/borrowing, thereby reducing central government debt. Since 2000 funds corresponding to the premium pension rights have been transferred to the Premium Pension Authority (PPM) in the second year after the year of income and invested by the fund manager selected by the individual.
Table 11.9 The old-age pension system
Billion SEK
| | 2004 | | 2005 | | 2006 | | 2007 | | 2008 | |
Revenue | | 216 | | 224 | | 233 | | 243 | | 254 | |
Contributions | | 173 | | 178 | | 185 | | 192 | | 200 | |
Premium reserve funds | | 22 | | 23 | | 24 | | 25 | | 26 | |
Interest and dividends | | 21 | | 23 | | 25 | | 26 | | 28 | |
Expenditure | | 168 | | 173 | | 180 | | 190 | | 203 | |
Pensions | | 163 | | 169 | | 177 | | 187 | | 200 | |
Other | | 5 | | 3 | | 3 | | 4 | | 4 | |
Net lending | | 48 | | 52 | | 53 | | 53 | | 50 | |
per cent of GDP | | 1.9 | | 2.0 | | 1.9 | | 1.8 | | 1.7 | |
of which | | | | | | | | | | | |
Pension funds(1) | | 23 | | 24 | | 23 | | 21 | | 17 | |
Premium pension authority | | 25 | | 28 | | 30 | | 32 | | 34 | |
(1) The pension funds noted here comprise the distribution part of the old-age pension system.
Sources: National Debt Office, Statistics Sweden and Ministry of Finance.
In 2004, the balance in the pension system, i.e. the National Pension Funds and the Premium Pension Authority, amounted to SEK 48 billion or 1.9 per cent of GDP.
In addition, investment assets in the pension system increased as a result of the rising value of shares, which account for the bulk of assets in both the National Pension Funds and in those funds managed by PPM. Changes in value do not affect net lending, which only includes yields in the form of interest and dividends.
Net lending is expected to remain at or just under 2 per cent of GDP during the forecast period. National Pension Fund net lending will decrease somewhat toward the end of the forecast period, while net lending will continue to increase in the prefunded pension system.
Eurostat decided in 1997 that the entire reformed Swedish pension system would be assigned to the general government sector. The main reasons for the decision were that participation is obligatory and that the central government controls the regulations for both fees and benefits. Eurostat has now changed this decision so defined contribution funded pension systems will not be assigned to the public sector in the National Accounts. Eurostat has granted member countries that currently classify such public pension systems in the public sector a transition period until March 2007 to change the accounting method. For Sweden, this means that general government net lending will be reduced by about 1 per cent of GDP and that general government consolidated debt will rise by about 0.5 per cent of GDP.
The pension reform involved a redistribution of payment responsibility between the central government budget and the National Pension Fund. Overall, central government budget costs increased as a result of the reform. The pension agreement therefore included reimbursement to the central government budget for the total cost increase. This amount was calculated to SEK 300–350 billion as of 1 January 1999.
In order not to jeopardise the pension system’s financial position, this amount was initially limited to SEK 245 billion, which was transferred between 1999 and 2001 from the National Pension Funds to the central government.
The question of a possible additional transfer was investigated during the spring, and the government intends to present a government bill
74
pertaining to this issue during the 2006/07 parliamentary year.
11.4 Local government sector
Over the past ten years the local government sector has had problems with recurrent deficits. Local government consumption increased by about 2 per cent annually between 1998 and 2002. During the past two years, however, this increase in expenditure slowed down, mainly because county councils halted the rising level of expenditure. Together with tax hikes and increased central government grants, these factors contributed to a sharp improvement of net lending and the financial result for 2004(21).
Strong growth in income
The local government sector’s revenues mainly consist of taxes and central government grants. Tax revenues are estimated to rise by 3.7 per cent this year. The average local government tax rate was raised 0.09 percentage points to 31.6 per cent. The tax base is increasing 3.4 per cent and tax hikes are contributing an additional 0.3 percentage points (see Table 11.10).
Table 11.10 Local government tax revenues and central government grants
Percentage change
| | 2004 | | 2005 | | 2006 | | 2007 | | 2008 | |
Taxes and central government grants excl. VAT | | 3.6 | | 6.5 | | 4.7 | | 4.4 | | 3.9 | |
Tax excl. regulation changes | | 4.0 | | 3.8 | | 4.5 | | 4.9 | | 4.8 | |
of which | | | | | | | | | | | |
Tax base | | 2.9 | | 3.5 | | 4.5 | | 4.9 | | 4.8 | |
Tax rate changes, contribution | | 1.1 | | 0.3 | | — | | — | | — | |
Central government grants, excl. regulation changes | | –0.2 | | 21.0 | | 5.7 | | 2.5 | | 0.4 | |
Note: Central government grants and taxes are adjusted for regulation changes which affect the local government tax base in order to clarify the underlying development.
(1) Taxes 2004 according to Ministry of Finance, which differ slightly from National Accounts.
Sources: Statistics Sweden and Ministry of Finance.
According to the National Accounts, central government grants are increasing by SEK 19 billion this year.(22) This increase can be attributed to initiatives such as extra staff for schools, health care and social services, as well as enhanced employment support. The total increase in local government taxes and central government grants this year is 6.5 per cent.
The proposed increases in resources, combined with measures to increase employment and reduce unemployment, will raise central government grants by SEK 2–5 billion between 2006 and 2008 (see Table 11.11).
In 2007 general contributions will be raised, mainly because of the employment support will be incorporated in these contributions. In addition, it has been announced that general central government grants will increase SEK 1 billion in 2007 and SEK 6 billion in 2008, which will compensate for the gradual phasing out of bonus jobs and certain education initiatives in 2008. Moreover, general grants will increase in 2008, as an effect of the initiatives involving increased staff in schools, health care and social services, which will gradually be transferred from other grants.
Table 11.11 Central government grants according to National Accounts
Billion SEK
| | 2004 | | 2005 | | 2006 | | 2007 | | 2008 | |
General grants | | 41 | | 55 | | 58 | | 67 | | 74 | |
Employment support | | 4 | | 9 | | 7 | | – | | – | |
Bonus jobs and educational | | | | | | | | | | | |
initiative replacement | | – | | – | | 4 | | 5 | | 2 | |
Other grants (1) | | 44 | | 46 | | 47 | | 47 | | 44 | |
Central government grants excl. VAT | | 90 | | 111 | | 117 | | 120 | | 120 | |
Yearly change | | | | 21 | | 6 | | 3 | | 1 | |
Regulations | | | | –2 | | 0 | | 0 | | 0 | |
Yearly change, adjusted for regulations | | | | 19 | | 6 | | 3 | | 1 | |
Note: The amounts refer to all grants distributed over a number of expenditure areas, and are shown according to National Accounts, which may differ from accounting principles in the budget. In the National Accounts grants on the income side of the budget are shown as expenditure. Furthermore, the timing of expenditures is different.
(1) Other grants are almost exclusively special purpose grants. Subsidies for drugs account for almost half of the special purpose grants.
Sources: Statistics Sweden and Ministry of Finance.
(21) In this case, “financial result” refers to earnings before extraordinary items.
(22) Central government grants excluding VAT and adjusted for regulations. Central government grants are adjusted in response to changes in the local government tax base.
75
After the substantial increase in central government grants in 2005, these grants will increase at a more modest rate over the next few years (see Table 11.11). Next year the increased resources will contribute to an increase in grants of SEK 6 billion compared with 2005. This increase will contribute to an increase in local government revenues from taxes and central government grants of 4.7 per cent, while tax revenues will increase 4.5 per cent (see Table 11.10). A relatively strong increase in the tax base of almost 5 per cent is forecast for 2007 and 2008. Since the central government grants increase more slowly, total income growth will be weaker.
Local government employment picking up
After a period of strong consumption growth, local government consumption volume decreased last year by 0.5 per cent in calendar adjusted terms. More working days in 2004 than 2003 meant that the change in actual terms corresponds with an increase of 0.5 per cent (see Table 11.13). Measured as an annual average, the number of people employed in the local government sector decreased by about 2,000 people. Adjusted for the deprivatisation of Huddinge Hospital, the number of people employed decreased by about 9,000. According to preliminary outcomes from the National Accounts, local government consumption volume and the number of people employed fell slightly during the first half year of this year compared with the first half year of 2004.
Local government consumption and employment are expected to pick up during the second half of the year. Measured as an annual average, the number of employees in 2005 is expected to increase by about 5,000 (see Table 11.12), while consumption volume will be marginally higher than last year.
The labour market programmes proposed in this government bill focus on the local government sector. People replacing employees on certain education initiatives and bonus jobs are expected to increase the number of people employed in the local government sector by 17,000 next year. At the same time, these labour market programmes are expected to displace certain ordinary jobs, which means that the net contribution these measures make to the increased number of people employed will be less than 17,000. Continued favourable income growth together with labour market programmes will result in a total of almost 27,000 more people employed (see Table 11.12). The bonus jobs will also contribute to a higher number of hours worked and therefore a higher local government consumption volume. In calendar-adjusted terms, consumption volume is expected to increase 2.3 per cent. Because 2006 has fewer working days than 2005, the actual increase is estimated to amount to 1.8 per cent.
Table 11.12 Local government employment
Number of people, thousands
| | 2005 | | 2006 | | 2007 | | 2008 | |
Employment measures, in level | | | | | | | | | |
Sabbatical year initiative(1) | | 6 | | 8 | | 7 | | 7 | |
Bonus jobs(2) | | | | 12 | | 16 | | 8 | |
Educational initiative replacement | | | | 5 | | 5 | | 0 | |
Sum of measures | | 6 | | 25 | | 28 | | 15 | |
Change | | 6 | | 19 | | 3 | | –13 | |
Change of the total amount of employed | | 5 | | 27 | | 10 | | –4 | |
(1) 60 per cent of total number of sabbatical initiatives are assumed to apply to local government employees.
(2) 80 per cent of all bonus jobs are assumed to be in local government, and the rest in central government.
Sources: Statistics Sweden and Ministry of Finance.
The programmes will also contribute to good growth in local government consumption and employment in 2007. The number of employed is expected to increase by an additional 10,000 people, including 4,000 bonus jobs. Local government consumption will increase by 1.0 per cent.
The phasing out of the labour market programmes in 2008 will have a negative effect on local government sector employment. The number of people employed will decrease by 4,000. Nevertheless, the number of people actually in work will increase by 1,000 and consumption volume will increase 0.3 per cent.
The change in the local government consumption volume must be seen in relation to the demographically determined demand for local government sector services, which is estimated at an average of 0.3 per cent per year until 2010 (see Chapter 12).
Net lending and financial result
Positive income growth and subdued expenditure growth mean that local government
76
finances will be substantially strengthened this year.
The expected surpluses during the forecast period are at a level consistent with Swedish Local Government Act requirements for good financial management.
Table 11.13 Local government finances
Billion SEK
| | 2004 | | 2005 | | 2006 | | 2007 | | 2008 | |
Revenue | | 593 | | 628 | | 657 | | 686 | | 714 | |
Taxes and central government grants | | 510 | | 544 | | 569 | | 594 | | 617 | |
per cent of GDP | | 20.0 | | 20.6 | | 20.5 | | 20.4 | | 20.3 | |
Other revenues | | 83 | | 85 | | 88 | | 92 | | 97 | |
Expenditure | | 592 | | 618 | | 649 | | 678 | | 706 | |
Consumption | | 509 | | 527 | | 557 | | 585 | | 609 | |
percentage change in volume | | 0.5 | | 0.2 | | 1.8 | | 1.0 | | 0.3 | |
Other expenditure | | 82 | | 91 | | 92 | | 94 | | 96 | |
Net lending | | 2 | | 10 | | 8 | | 8 | | 8 | |
per cent of GDP | | 0.1 | | 0.4 | | 0.3 | | 0.3 | | 0.3 | |
Financial result | | 2 | | 9 | | 9 | | 8 | | 8 | |
Sources: Statistics Sweden and Ministry of Finance.
Diagram 11.4 Local government finances
Percentage change Billion SEK
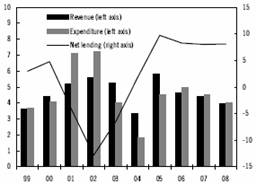
Note: Church parishes have been excluded throughout the period.
Sources: Statistics Sweden and Ministry of Finance.
11.5 Fiscal policy indicators
An indicator for the surplus target
According to the surplus target, net lending in the general government sector is to amount to 2 per cent of GDP over a business cycle. It is difficult to assess whether this target is achieved because it is difficult to establish the length of an economic cycle. This section discusses an indicator that helps determine whether the target is met.
Public finances are affected by automatic variations in tax revenues and expenditures over the business cycle. The surplus for any individual year may therefore deviate from 2 per cent of GDP without putting the medium-term target at risk. This is the reason why the surplus target is stated as an average over a business cycle.
To determine the extent to which net lending during an individual year is in line with the target, net lending can be adjusted for cyclical variations in general government income and expenditures as well as for other types of temporary effects. The adjusted net lending reflects the underlying or “structural” level of net lending. The structural balance is also the indicator that the European Commission uses in its assessments of member states’ public finances within the framework of the EU’s Stability and Growth Pact.
The structural balance in the general government sector should normally be close to 2 per cent of GDP, which can serve as a guideline for fiscal policy. When there is a risk of high unemployment or overheating in the economy with high inflation as a result, the automatic stabilisers may need reinforcement through active intervention. In such a situation the structural balance may be permitted to deviate from 2 per cent of GDP. A higher or lower structural balance may be necessary in a particular year if net lending for the preceding year deviates substantially from 2 per cent. A rapid adjustment of public finances towards the target may have an excessively strong impact on demand.
The cyclical adjustment of net lending is based on an assessment of the economic situation as well as on its effects on public finances. The economic situation is described by the GDP gap, which constitutes the difference in per cent between actual and potential GDP. The size of the GDP gap is based on an overall assessment of a number of indicators for output, the labour market and for price trends and wage formation.
The Ministry of Finance’s assessment is that a change in the GDP gap of 1 percentage point affects net lending in the general government sector by 0.7 per cent of GDP on average. Sensitivity varies from year to year depending on how the components of GDP develop in relation to each other. For example, public finances
77
are more sensitive to a change in household consumption, which constitutes an important tax base, than if the business cycle is being affected by international trade. However, it should be emphasised that structural balance calculations are uncertain because the estimate of the GDP gap and the estimate of public finances’ sensitivity to changes in the GDP gap are uncertain.
Structural balance 2004–2008
General government net lending amounted to 1.0 per cent of GDP in 2004 according to the preliminary outcome from the National Accounts. At the same time the GDP gap is estimated at 1.1 per cent (see Table 11.14), which means that the economy had resources available. Using the rule of thumb described above, the structural surplus is estimated to be 1.8 per cent of GDP. As was mentioned in section 11.1, the preliminary taxation settlement for 2004 income suggests that general government revenues were underestimated by about SEK 8 billion in 2004 in the preliminary National Accounts. After correcting this underestimate, the 2004 surplus should be revised to 1.4 per cent of GDP and structural net lending estimated at about 2 per cent of GDP, which is in line with the guideline for the surplus target.
Resource utilization in the economy, measured as the GDP gap, is estimated to be unchanged between 2004 and 2005. With net lending of 1.4 per cent of GDP in 2005, the structural balance is estimated at about 2 per cent of GDP and therefore even this year should be in line with the guideline for the surplus target. As a result of the expansionary fiscal policy to reduce unemployment and increase employment, the structural balance will be reduced to 1 per cent in 2006.
Up until 2008 general government finances will once again improve at the same time that the GDP gap closes
An indicator for the effects of public finances on demand
General government finances affect demand directly via general government consumption expenditure and indirectly via the effects of the tax and transfer systems on household consumption. Changes in corporate taxation can influence firms’ desire to hire and invest, and changes in general government’s capital gains and interest expenditure affect the income flows of households and firms. Decreased saving in the general government sector normally entails a strengthening of private sector revenues.
However, the effects on demand are difficult to evaluate. Households with different propensities to consume react differently to fiscal stimuli. Households with good access to credit are able to smooth out their consumption expenditure in the event of changes in income. For other households, consumption expenditure is affected more directly. There is also some uncertainty as to when the effects arise. It should therefore be emphasised that the indicator used for the fiscal policy “stimulus” (the change in general government net lending) can only be viewed as a rough measure of the effect on private sector demand.
For fiscal policy to have the desired effects, there must be confidence in the long-term sustainability of public finances. Households become more cautious in their expenditure decisions if the general government deficit is large since the deficit must be financed sooner or later by increases in taxes or cuts in expenditure. On the other hand, consumer confidence may be affected positively when public finances show a substantial surplus.
Table 11.14 Structural balance in general government sector
Per cent of GDP
| | 2000 | | 2001 | | 2002 | | 2003 | | 2004 | | 2005 | | 2006 | | 2007 | | 2008 | |
Net lending | | 5.0 | | 2.6 | | –0.5 | | –0.1 | | 1.0(1 | ) | 1.4 | | 0.7 | | 1.1 | | 1.6 | |
Adjusted for GDP gap | | –0.9 | | 0.6 | | 1.0 | | 1.1 | | 0.8 | | 0.7 | | 0.3 | | 0.0 | | 0.0 | |
| | | | | | | | | | | | | | | | | | | |
Structural balance | | 4.1 | | 3.1 | | 0.4 | | 1.0 | | 1.8 | | 2.1 | | 1.0 | | 1.1 | | 1.6 | |
Average from 2000 | | 4.1 | | 3.6 | | 2.6 | | 2.2 | | 2.1 | | 2.1 | | 2.0 | | 1.8 | | 1.8 | |
GDP gap | | 0.6 | | –0.8 | | –1.4 | | –1.6 | | –1.1 | | –1.0 | | –0.4 | | 0.0 | | 0.0 | |
(1) The preliminary taxation settlement for 2004 income suggests that general government’s revenues is underestimated by about 0,4 per cent of GDP in the preliminary National Accounts for 2004.
Sources: Statistics Sweden and Ministry of Finance.
78
Changes in general government consumption expenditure can have a clear impact on demand. However, changes in interest expenditure, international developmental aid or EU contributions probably have minor or non-existent effects.
For these reasons, the annual change in net lending constitutes only a rough indicator of the effects of public finances on demand.
The change in general government net lending from year to year can be described using three components that affect the balance:
1. Automatic stabilisers
The automatic stabilisers in public finances make an important contribution to stabilisation policy. High GDP growth means that public finances are strengthened and income growth is slowed in the private sector. The stabilisers help to limit domestic demand in the economy and reduce the risk of overheating. Conversely, the economy is stimulated when growth is low. The high tax and expenditure ratios in Sweden mean that the effects of the automatic stabilisers are greater than in most other countries and that public finances have a comparatively strong moderating effect on swings in the business cycle.
2. Discretionary fiscal policy in the central government budget
The discretionary component of fiscal policy consists of active reform decisions and savings in the central government budget. A summary of previously decided and now proposed or announced reforms is given in Chapter 4 of the Government Budget Bill. The budget effect relates to the year in which the decisions are implemented, irrespective of when they are taken.
3. Other factors affecting the balance
In addition to discretionary fiscal policy and the automatic stabilisers, public finances are affected by a number of other factors. The composition of growth can have significant effects on general government net lending for individual years. In addition, capital income and interest expenditure are affected by changes in the general government sector’s assets and liabilities, as well as by interest rates. Transfer expenditure is also affected by changes in volume without any direct correlation to the economic situation, such as demographic trends or changes in behaviour. Finally, public finances are affected by developments within the local government sector. An increase in taxes with the aim of restoring balance in local government finances will have a tightening effect on the economy.
The change in general government net lending serves as a rough indicator for the effect of public finances on demand. The change in the structural balance, i.e. the change in net lending that is not due to the automatic stabilisers, is an indicator of fiscal stance. However, this indicator covers not only decisions about reforms and savings in the central government budget, but also factors that affect the balance other than the business cycle; in other words, those factors that affect the balance described by items 2 and 3 above.
Fiscal stance 2004–2008
Table 11.15 shows the change in general government net lending for the years 2004–2008. Fiscal policy, measured as the change in the structural balance, was tightening in 2004. The discretionary policy in the central government budget was expansionary, but the expansionary measures were offset by stronger net lending in the local government sector and by substantially lower interest expenditure. The tightening was reinforced by the automatic stabilisers since resource utilization in the economy, measured as the GDP gap, increased between 2003 and 2004. Overall, the strengthening of net lending meant a contractionary impact to the private sector.
Table 11.15 Fiscal impact
Change in per cent of GDP
| | 2004 | | 2005 | | 2006 | | 2007 | | 2008 | |
Net lending of which | | 1.1 | | 0.4 | | –0.7 | | 0.4 | | 0.5 | |
Automatic stabilizers | | 0.4 | | 0.0 | | 0.5 | | 0.3 | | 0.0 | |
Structural balance of which | | 0.8 | | 0.4 | | -1.1 | | 0.1 | | 0.5 | |
Discretionary fiscal policy | | -0.4 | | -1.3 | | -1.0 | | -0.2 | | 0.1 | |
Net lending, local government | | 0.3 | | 0.3 | | -0.1 | | 0.0 | | 0.0 | |
Net capital income | | 0.4 | | 0.2 | | -0.1 | | -0.2 | | -0.1 | |
Other | | 0.4 | | 1.1 | | 0.0 | | 0.5 | | 0.6 | |
GDP gap, percentage points | | 0.5 | | 0.0 | | 0.7 | | 0.4 | | 0.0 | |
Sources: Statistics Sweden and Ministry of Finance.
The structural balance was strengthened between 2004 and 2005 according to preliminary National Accounts. However, if the preliminary
79
taxation settlement for 2004 revenues is taken into account, which could not be done in the preliminary outcome from the National Accounts, the structural balance is unchanged between 2004 and 2005.
Consequently, fiscal policy this year would be characterized as neutral even though the discretionary policy in the central government budget is strongly expansionary.
The expansionary budget policy is also offset this year by the strengthening of local government net lending, as well as fewer people on sick leave, which reduces transfer expenditure. Increased capital income also contributes to a strengthening of general government net lending.
In 2006 fiscal policy will be expansionary due to a continued expansionary budgetary policy aimed at increasing employment and reducing unemployment. The upswing in the economy means that the GDP gap will be reduced to less than one half of its current state, which means that the expansionary budget policy will be offset in part by the automatic stabilisers. All factors considered, general government finances are expected to weaken by 0.7 per cent of GDP.
During 2007 and 2008 net lending will improve by a total of almost 1 per cent of GDP. A smaller portion of this improvement can be attributed to the automatic stabilisers, which strengthen net lending as the GDP gap narrows. In addition the measures approved or announced in the central government budget to date will mean that expenditures will decrease as a percentage of GDP, while income will essentially increase at the same rate as GDP.
80
Employment in welfare services
The welfare services education, health care and social services are mainly provided by municipalities and county councils and financed by taxes. Production of welfare services largely occurs under the auspices of local government, but since the early 1990s municipalities and county councils have increasingly outsourced operations, used staffing agencies and privatised or corporatised day care centres, hospitals, etc. As a result more and more of the people employed in previously traditional local government activities are now registered by Statistics Sweden as employed in the private sector (business sector). In the figure below the broken line shows the number of people employed within the local government sector, while the solid line also includes those employed in the business sector industries education, health care and social services.
Number of people employed in local government operations and the business sector’s industries education, health care and social services
Thousands
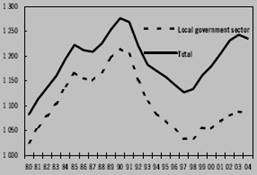
Source: Statistics Sweden.
The periods 1980–1990, 1990–2000 and 2000–2004 show considerable differences in growth in employment between the municipal employees and employees in the business sector within education, health care and social services.
The number of people employed in the local government sector and the business sector’s industries education, health care and social services increased by about 190,000 between 1980 and 1990; of this figure, the increase in the business sector only comprised about 5,000 people. Between 1990 and 2000 employment in these industries in the business sector increased, however, by about 65,000 while municipal employees decreased by a total of about 160,000. Between 2000 and 2004 the total increase was about 55,000, of which about 24,000 occurred in the business sector and about 31,000 in the local government sector. The number of people employed within the above mentioned industries increased by 160 per cent between 1980 and 2004.
Number of people employed in the business sector’s industries education, health care and social services
Thousands
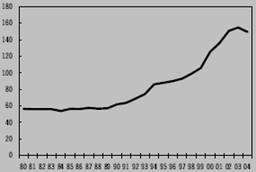
Source: Statistics Sweden.
Virtually the entire increase in employment among local government employees that occurred during the 1980s is therefore equal to the decrease during the 1990s. At the same time the number of people employed in the private sector within these industries increased substantially. In terms of numbers, employment during the early 2000s increased about the same amount in both groups. Overall, between 1980 and 2004, the increase in the number of people employed in the business sector’s industries education, health care and social services clearly exceeded the increase in the number of municipal employees although the former group encompasses considerably fewer people.
Change in number of people employed in local government operations and the business sector’s industries education, health care and social services
Thousands
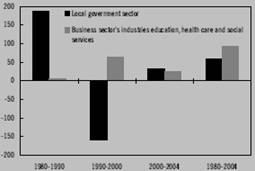
Source: Statistics Sweden.
81
12 Demographic trends and public finances
In Sweden, as in most other western developed countries, the proportion of older people in the population will increase markedly over the next few decades. More people of non-working age relative to those of working age will put pressure on tax-funded welfare systems. This trend makes demands on economic policy today. In order to be able to maintain well-developed tax-funded welfare systems in the future, high net lending is required in the general government sector over the next few years, while efforts must be made to increase the number of people in employment.
High net lending today is basically justified by a more even distribution of income between different generations and means that the large generations needing care in the future can contribute to financing it themselves. Solely relying on those economically active tomorrow to finance these services is likely to entail a more unfavourable income distribution between different age groups. This chapter describes a scenario for how the population trend in Sweden may be thought to impact on public finances.
Demographic trends
Sweden’s population passed the nine million mark last year. According to the population forecast presented by Statistics Sweden in the spring of 2005, the population will continue growing to just over 10.5 million in 2050. Primarily the number of people aged 65 and older is forecast to increase rapidly over the next 30 years.
Diagram 12.1 Population change
Change compared to 2005, thousands

Source: Statistics Sweden.
In 2035, there will be nearly 2.4 million people in this age group, just over 800,000 more than today. The number of people aged 20-64 is forecast to increase by just over 110,000 by 2015 and is then expected to increase only marginally over the following 20-year period. In other words, the greater part of the population increase consists of people of non-working age (see Diagram 12.1).
The demographic development may be summarised in dependency ratios, which express the relationship between the non-working age population and the working-age population. The elderly dependency ratio, defined as the number of people aged 65 and older per hundred people aged 20–64, is estimated to rise from approximately 29 people in 2005 to approximately 42 people by 2030. The youth dependency ratio, defined as the number of people under 20 per hundred people aged 20–64, is more stable and fluctuates around 41 people (see Diagram 12.2).
Diagram 12.2 Dependency ratios
Per cent
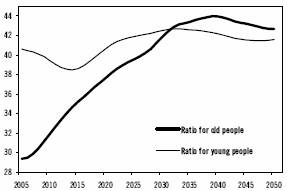
Source: Statistics Sweden.
Immigration accounts for the greater part of the population growth in Statistics Sweden’s population forecast. Immigration is of crucial importance not least for growth in the working-age population. Without immigration the number of people in the 20–64 age group would decline (see Diagram 12.3). By far the majority of immigrants consist of people born outside the EU. This group currently has a considerably lower employment rate than the average. It is therefore important that these immigrants are better integrated into the labour market. If this is unsuccessful, the population increase forecast in the 20–64 age group will result in a considerably more modest increase in the number of people in employment. Such a trend would seriously
82
impair the prerequisites for maintaining the quality and scope of welfare systems.
Diagram 12.3 Population aged 20-64 years
Change compared to 2005, thousands
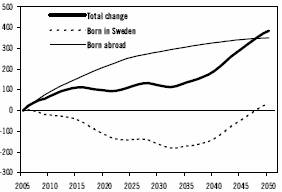
Sources: Statistics Sweden and Ministry of Finance.
Real economic development after 2008
The long-term projection of economic development is based on the estimate for the Swedish economy up to 2008 described in chapters 1–11. Employment growth after 2008 is based on the forecast population trend and on assumptions about how the employment rate and the number of working hours for different population groups will develop. In the short term, the change in the age structure plays a major role. The number of people aged 20–29, with a relatively low labour supply, accounts for the whole population growth in the 20–64 age group over the next few years, while the number of people in other age groups is forecast to decline. In the somewhat longer term, the changes in structure in terms of origin will be more important. The proportion of immigrants and particularly those born outside the EU in the 20 64 age group will grow rapidly, according to the population forecast.
In the calculation, Swedish-born individuals are assumed to work to the same extent as today, while the position of immigrants in the labour market gradually strengthens. The difference in employment rate between Swedish-born and foreign-born individuals is assumed to decline by one-third by 2020. The remaining differences are assumed to remain after 2020. Such a trend results in the proportion of people in employment among foreign-born individuals aged 20-64 increasing to just over 65 per cent. However, the total employment rate will be less than the target of 80 per cent throughout the period.
GDP growth is also affected by average working hours per employee. The scenario assumes that average hours worked will decline somewhat in the long term. Such a decline may be justified by the probable increase in the demand for leisure when household income and consumption opportunities in general grow. However, households mainly choose to increase their consumption of goods and services. Working hours are assumed to decline by only 0.2 per cent per year, which is equivalent to a reduction in weekly working hours of approximately 3.5 hours by 2050. The number of hours worked consequently declines by approximately 2 per cent between 2007 and 2050, despite the population in the 20–64 age group increasing by approximately 7 per cent. By comparison it may be mentioned that the number of working hours in 2005 is more or less unchanged compared with 1970, while the number of people aged 20 64 has risen by approximately 12.5 per cent.
Productivity in the business sector is forecast to increase by an average of 2.6 per cent per year during the period up to 2015. This is in line with the relatively rapid productivity growth of the past few years, but is considerably more rapid than the rate of increase in the 1970s and 1980s(23). After 2015 the rate of productivity growth in the business sector is assumed to gradually fall to an average of 2.3 per cent per year. Productivity growth in the general government sector is assumed to be zero, in accordance with the calculation methods used in the National Accounts. Overall, this leads to a productivity increase in the whole economy of approximately 2.2 per cent per year during the initial period and 1.9 per cent per year after that. Productivity growth fluctuates somewhat over time due to changes in the composition of private sector and public sector goods and services output.
The productivity increase combined with the labour trend results in GDP growing by an average of 1.9 per cent per year during the period 2005–2050. Per capita GDP grows by an average of 1.6 per cent per year. As a result, GDP will be approximately 60 per cent higher in 2030 than in
(23) For a more in-depth discussion of the assumptions underlying the productivity development, see “Productivity and Wages Through 2015”, Occasional Study No. 6, National Institute of Economic Research, May 2005.
83
Table 12.1 Macroeconomic assumptions
| | 2005 | | 2010 | | 2015 | | 2020 | | 2030 | | 2040 | | 2050 | |
| | Level | | Index, 2005=100 | | | | | | | | | |
Population aged 20-64 years, thousands | | 5 323 | | 101 | | 102 | | 102 | | 102 | | 104 | | 107 | |
Number of employed, thousands | | 4 230 | | 102 | | 103 | | 104 | | 104 | | 106 | | 109 | |
Hours worked, millions | | 6 874 | | 102 | | 102 | | 102 | | 99 | | 99 | | 100 | |
Business sector productivity | | 100 | | 114 | | 129 | | 146 | | 184 | | 231 | | 290 | |
GDP productivity | | 100 | | 111 | | 123 | | 135 | | 159 | | 191 | | 231 | |
GDP per capita, thousands of SEK | | 288 | | 110 | | 120 | | 129 | | 145 | | 170 | | 201 | |
GDP | | 100 | | 113 | | 126 | | 138 | | 160 | | 192 | | 234 | |
GDP deflator | | 100 | | 112 | | 124 | | 138 | | 173 | | 213 | | 259 | |
CPI | | 100 | | 111 | | 123 | | 136 | | 165 | | 201 | | 246 | |
Real hourly wage | | 100 | | 110 | | 124 | | 139 | | 171 | | 209 | | 253 | |
| | Per cent | | | | | | | | | | | | | |
Labour force participation rate in 20-64 age group | | 76.6 | | 77.1 | | 77.1 | | 78.0 | | 77.6 | | 78.0 | | 77.6 | |
Open unemployment | | 5.9 | | 4.5 | | 4.4 | | 4.4 | | 4.5 | | 4.5 | | 4.5 | |
Sources: Statistics Sweden and Ministry of Finance.
2005 and approximately 135 per cent higher in 2050, while per capita GDP will be approximately 45 per cent higher in 2030 and will double by 2050. The most important calculation assumptions are summarised in Table 12.1.
General government revenue
The long-term development of tax revenue is largely dependent on employment growth. The majority of taxes are a direct or indirect taxation of employment. Most household income taxes and social security contributions are charged to the wage bill. These taxes account for more than half of general government revenue. Developments in the labour market are also of great importance for revenue from taxes on household consumption expenditure, such as VAT and selective purchase taxes. Even if tax rates are held unchanged relative to the respective tax base, the total tax ratio, i.e. taxes and charges in relation to GDP, will increase somewhat over the next few decades. The reason is that a number of important tax bases may be expected to grow more rapidly than GDP. This applies, for example, to household consumption expenditure and taxed transfer payments, which grow as the number of pensioners increases.
A small part of the costs of welfare services is funded through user charges. The calculations assume that the charges for childcare etc. increase in pace with the production costs. This means that revenue from charges increases at a considerably more rapid rate than if today’s maximum charges were to continue, but at a slower rate than household disposable income.
General government expenditure
The change in the population structure has major effects on general government expenditure. An increasing number of older people in the population has an impact on expenditure on pensions, healthcare and geriatric care. The calculation of pension expenditure is based on the demographic trend, the macroeconomic conditions and current rules and regulations. Pension expenditure as a percentage of GDP is estimated to increase from 8.8 per cent in 2005 to almost 10.9 per cent in the mid-2030s and then decline somewhat. Expenditure on healthcare and geriatric care is estimated to increase from 10.4 per cent in 2005 to 14.9 per cent of GDP in 2050. Overall, expenditure on pensions, healthcare and geriatric care as a percentage of GDP is forecast to increase by just over 6 percentage points during the estimate period.
The estimates assume a guaranteed standard for general government transfer systems. A number of transfer payments are subject to rules and regulations that automatically increase the benefits in pace with the wage trend. This applies to pensions, which are adjusted upwards in line
84
Table 12.2 Public finances
Per cent of GDP
| | 2005 | | 2010 | | 2015 | | 2020 | | 2030 | | 2040 | | 2050 | |
Primary revenue | | 53.6 | | 53.2 | | 53.4 | | 53.5 | | 54.1 | | 54.2 | | 53.7 | |
Taxes and charges | | 50.4 | | 50.2 | | 50.6 | | 51.09 | | 51.8 | | 52.1 | | 51.9 | |
Other revenue | | 3.2 | | 3.1 | | 2.8 | | 2.6 | | 2.3 | | 2.0 | | 1.8 | |
Primary expenditure | | 52.5 | | 51.2 | | 51.6 | | 52.5 | | 55.4 | | 55.7 | | 55.0 | |
Transfer payments | | 21.9 | | 21.1 | | 21.9 | | 22.3 | | 23.2 | | 23.5 | | 23.0 | |
Consumption | | 27.6 | | 27.3 | | 27.3 | | 28.1 | | 30.5 | | 30.9 | | 30.9 | |
Investment | | 3.1 | | 2.8 | | 2.5 | | 2.2 | | 1.8 | | 1.4 | | 1.1 | |
Primary net lending | | 1.1 | | 2.0 | | 1.7 | | 1.1 | | -1.3 | | -1.6 | | -1.3 | |
Net capital income | | 0.3 | | 0.0 | | 0.3 | | 0.7 | | 0.9 | | 0.3 | | -0.2 | |
Net lending | | 1.4 | | 2.0 | | 2.0 | | 1.8 | | -0.4 | | -1.3 | | -1.4 | |
Financial position | | | | | | | | | | | | | | | |
Central government debt | | 47.8 | | 40.6 | | 32.6 | | 25.5 | | 26.8 | | 38.4 | | 49.5 | |
Consolidated gross debt | | 50.7 | | 43.4 | | 36.1 | | 29.7 | | 29.0 | | 38.8 | | 48.4 | |
Net debt | | -3.6 | | -11.3 | | -22.0 | | -30.8 | | -32.8 | | -20.0 | | -10.1 | |
Sources: Statistics Sweden and Ministry of Finance.
with the income index, and partly to transfer payments compensating for loss of income, e.g. health and parental insurance. Transfer payments lacking this type of automatic guaranteed standard, e.g. child benefits and study grants, increase in the calculation in pace with the nominal wage trend. Such a guaranteed standard offsets the erosion that would otherwise take place in the longer term if the estimates were based on strictly unchanged rules. The guaranteed standard consequently assumes that certain reforms are implemented as the economy grows.
Staff density, e.g. the number of teacher hours per student, may be regarded as a standard indicator of general government services output. The calculations assume that these services are carried out with the same staff density as today. This means that the number of employees in the general government sector needs to increase by approximately 160,000 between 2005 and 2020 to expand services in pace with the demographic requirements. Since the average age of staff in many activities today is relatively high, the recruitment requirements will be considerably greater. The number of public sector employees needs to increase by an additional 375,000 net between 2020 and 2050, if the welfare standard is to be maintained and tax-funded welfare services are produced in the same way as today. The large recruitment requirements are likely to contribute to wages being driven upwards relative to other areas of the economy. The calculations assume that hourly wages in the local government sector will increase on average 0.5 per cent more rapidly per year than in other areas of the economy during the period up to 2020.
Between 2005 and 2020, primary general government expenditure, i.e. expenditure excluding interest, is estimated to decline marginally as a percentage of GDP (see Table 12.2). The total demographic pressure on expenditure is still limited. Fewer children and young people of school age mean that expenditure on primary and secondary education declines as a percentage of GDP, while the demand for healthcare and geriatric care only increases weakly. Up to around 2015, local government consumption only needs to grow by an average of approximately 0.3 per cent per year for the volume of services produced to grow in pace with demographic demand. During the following 15-year period, demand for tax-funded welfare services is forecast to increase by an average of more than 1 per cent per year. One condition for such a development is that municipalities can contract activities in areas in which demand declines. Transfer payments linked to people under 20 are also forecast to fall as a percentage of GDP over the next few years. On the other hand, pension expenditure is forecast to rise, leading to a weak increase in total household transfer payments as a percentage of GDP up to 2020.
Primary expenditure as a percentage of GDP is estimated to increase by a further 3 percentage
85
points between 2020 and 2030. The expenditure ratio peaks in the second half of the 2030s. Principally general government consumption of healthcare and geriatric care increases, but household transfer payments in the form of pensions also grow. On the other hand, general government investment expenditure falls as a percentage of GDP throughout the period. The investment volume certainly increases in pace with general government consumption volume, but the price of investment goods is assumed to increase more slowly than the average price trend in the economy.
The surplus target and sustainable public finances
Sustainable public finances may be defined in various ways. Strictly speaking public finances are sustainable, if the present value of all future revenue and expenditure, excluding interest, is the same as the total amount of debt at the beginning of the period. If this requirement is met, future revenue not only covers future expenditure, but is also sufficiently large to eliminate debt in the long term. The problem with this definition is that revenue and expenditure have to be projected over very long time periods with all the uncertainty entailed.
An alternative sustainability criterion is that the debt situation should not deteriorate over a more foreseeable period, which is nevertheless sufficiently long to include the demographic structural change. If general government debt as a percentage of GDP is no larger at the end of the period than at the beginning, fiscal policy may be considered to be sustainable.
Diagram 12.4 illustrates the development of central government debt as a percentage of GDP up to 2050. The calculation assumes that the tax regulations are adapted so that the public finances show a surplus of 2 per cent of GDP up to 2015. The estimate results in a debt ratio in 2050, which is clearly lower than in 2000. Consequently the development of public finances may be considered sustainable over the period up to 2050. At the same time, the increase in the debt ratio during the latter part of the period shows that sustainability problems may arise after 2050.
The scenario illustrates the importance of the surplus target for the ability to maintain the standard of tax-funded welfare systems. In order that central government debt as a percentage of GDP should not approach unsustainable levels in the long term and necessitate cutbacks, the debt ratio must decline rapidly over the next few years and be more or less halved by the mid-2020s.
Diagram 12.4 Central government debt
Per cent of GDP
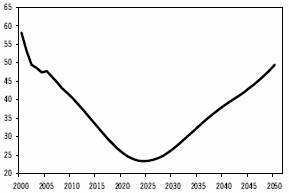
Sources: Statistics Sweden and Ministry of Finance.
86
13 Comparison of forecasts
13.1 Comparison with previous forecast for 2005
Since the 2005 Spring Fiscal Policy Bill, the forecast for Swedish GDP growth for 2005 has been revised downwards from 3.2 per cent to 2.4 per cent. Exports, general government consumption expenditure and the contribution from stocks are all expected to weaken more than previously anticipated. Household consumption is also forecast to grow at a somewhat slower pace.
A slowdown in foreign trade during 2005 was expected already in the Spring Budget Bill. In early 2005, however, declining global demand and the unexpectedly sharp downturn in global trade caused exports to slacken even more than expected. The forecast for export growth was therefore revised downwards from 6.9 per cent to 4.2 per cent. Growth in imports is now also expected to weaken compared with last spring as a result of new import figures and the revised outlook for exports. The net contribution from foreign trade is expected to be 0.1 percentage points in the Budget Bill this year, compared with 0.2 percentage points in the Spring Fiscal Policy Bill.
The increase in general government consumption expenditure expected in the Spring Fiscal Policy Bill did not materialise during the first six months of the year, nor is general government activity expected to pick up in the second half of the year, which is why general government consumption expenditure is expected to remain unchanged compared with last year. General government consumption was expected to increase 1.2 per cent in the Spring Fiscal Policy Bill.
Household consumption was revised downwards because of continued low consumer confidence combined with somewhat weaker than expected statistics. In addition, both the labour market and wages showed weaker growth. Household consumption is expected to increase by 2.0 per cent, which is a downward revision of 0.2 percentage points compared with the Spring Fiscal Policy Bill.
As a result of the strong performance during the first half of the year, investment volume was revised upwards somewhat. Particularly noteworthy were residential investments and machinery investments in industry, which exceeded expectations and caused an upward revision of the forecast for gross capital formation, now expected to grow 7.9 per cent, compared with 7.1 per cent in the Spring Fiscal Policy Bill. The effect of last January’s storm on timber stocks and relatively small investments in industries’ stocks of finished goods have meant that the contribution from stockbuilding to GDP growth is expected to be less than previously anticipated.
Table 13.1 Ministry of Finance forecasts for 2005 in the 2005 Spring Fiscal Policy Bill and the Budget Bill for 2006
Percentage change unless otherwise stated
| | 2005 Spring
Fiscal Policy Bill | | Budget Bill
for 2006 | |
Sweden | | | | | |
GDP | | 3.2 | | 2.4 | |
Household consumption | | 2.2 | | 2.0 | |
General government consumption | | 1.2 | | 0.0 | |
Gross fixed capital formation | | 7.1 | | 7.9 | |
Change in stocks(1) | | 0.4 | | 0.1 | |
Exports | | 6.9 | | 4.2 | |
Imports | | 7.9 | | 4.8 | |
Number of employed(2) | | 0.8 | | 0.1 | |
Hours worked | | 0.6 | | 0.4 | |
Open unemployment(2),(3) | | 5.0 | | 5.9 | |
Wages | | 3.5 | | 3.3 | |
General government net lending(4) | | 0.7 | | 1.4 | |
CPI | | 0.5 | | 0.3 | |
Repo rate(5) | | 2.00 | | 1.50 | |
TCW index(5) | | 121 | | 127 | |
United States | | | | | |
GDP | | 3.6 | | 3.7 | |
Unemployment | | 5.1 | | 5.1 | |
Euro area | | | | | |
GDP | | 1.6 | | 1.3 | |
Unemployment | | 9.0 | | 8.9 | |
(1) As per cent of last year’s GDP.
(2) The numbers are not directly comparable.
(3) Per cent of the labour force.
(4) Per cent of GDP.
(5) At year-end.
Several factors explain the revisions of the labour market forecast since last spring. First of all, both employment and unemployment figures were weaker than expected during the first half of the year, especially in local government, where the predicted upswing in employment never materialised. Second of all, the general development of the economy has been weaker than expected. In addition, the measures proposed in this government bill are expected to have a strong influence on labour market developments, though mainly during 2006. Lastly, Statistics
87
Sweden revised its LFS statistics, which meant important changes in both measured employment and unemployment. The effects of this change that are currently known have been taken into account in the forecast. Taken together, the figures for unemployment, employment and the number of hours worked are expected to be weaker in 2005 than was previously anticipated.
Inflation figures during the spring and summer have indicated that domestic inflationary pressure is somewhat lower than was expected in the Spring Fiscal Policy Bill, while oil prices are expected to remain higher. Taken together, this means that the forecast for year-on-year underlying inflation (UND1X) is unchanged. Because of lower mortgage rates, the forecast for CPI inflation has been revised downward somewhat, measured year-on-year.
The Riksbank lowered interest rates last spring in part because of low inflationary pressure. The repo rate is expected to hold at 1.50 per cent for the rest of the year. The interest rate cut also contributed to a weakening of the krona both in trade-weighted terms and against major currencies. In the Government Budget Bill the TCW index is now expected to amount to 127 at the end of 2005, compared with 121 in the Spring Fiscal Policy Bill. Moreover, the krona is expected to hit 9.20 in relation to the euro at year end compared with 8.90 in the previous forecast. Finally, the krona is expected to appreciate less against the dollar compared with the assessment last spring. At the end of the year the krona is expected to be 7.36 against the dollar (6.50 in the Spring Fiscal Policy Bill).
General government net lending has been revised upwards to 1.4 per cent of GDP, even though economic growth is expected to be lower than previously anticipated. This improvement is due to lower local government consumption, lower interest rates and higher revenue from corporate taxes.
The outlook for growth in the euro area has deteriorated, mainly as a result of a worsening of the investment climate. GDP growth in the region is expected to reach 1.3 per cent this year, which is a downward revision of 0.3 percentage points compared with the Spring Fiscal Policy Bill.
13.2 Comparison with previous forecast for 2006
Since the 2005 Spring Fiscal Policy Bill, the forecast for Swedish GDP growth for 2006 has been revised upwards from 2.7 per cent to 3.1 per cent. A more expansionary monetary and fiscal policy as well as a somewhat improved situation in the labour market are expected to cause private and general government consumption expenditure to grow stronger in 2006 compared with the assessment in the Spring Fiscal Policy Bill.
Table 13.2 Ministry of Finance forecasts for 2006 in the 2005 Spring Fiscal Policy Bill and the Budget Bill for 2006
Percentage change unless otherwise stated
| | 2005 Spring
Fiscal Policy Bill | | Budget Bill
for 2006 | |
Sweden | | | | | |
GDP | | 2.7 | | 3.1 | |
Household consumption | | 2.7 | | 3.0 | |
General government consumption | | 0.7 | | 1.8 | |
Gross fixed capital formation | | 5.2 | | 5.0 | |
Change in stocks(1) | | –0.1 | | 0.0 | |
Exports | | 5.8 | | 6.1 | |
Imports | | 6.2 | | 6.7 | |
Number of employed(2) | | 1.1 | | 1.3 | |
Hours worked | | 0.7 | | 1.1 | |
Open unemployment(2),(3) | | 4.4 | | 4.8 | |
Wages | | 3.5 | | 3.4 | |
General government net lending(4) | | 0.6 | | 0.7 | |
CPI | | 1.5 | | 1.5 | |
Repo rate(5) | | 2.75 | | 2.50 | |
TCW index(5) | | 121 | | 124 | |
United States | | | | | |
GDP | | 3.4 | | 3.4 | |
Unemployment | | 4.9 | | 4.9 | |
Euro area | | | | | |
GDP | | 2.1 | | 1.8 | |
Unemployment | | 8.7 | | 8.7 | |
(1) As per cent of last year’s GDP.
(2) The numbers are not directly comparable.
(3) Per cent of the labour force.
(4) Per cent of GDP.
(5) At year-end.
Measures announced in this government bill will influence the labour market next year and should lead to higher general government employment. Combined with good local government finances, general government consumption expenditure is expected to increase 1.8 per cent next year, compared
88
with 0.7 per cent in the Spring Fiscal Policy Bill.
Stronger growth in household consumption means that import growth is expected to be somewhat stronger next year compared with the earlier assessment.
The TCW index is now expected to reach 124 at the end of 2006, which is a weakening compared with the assessment last spring. The TCW index was expected to reach 121 in the Spring Fiscal Policy Bill.
General government net lending is essentially unchanged despite the employment package and tax cuts proposed in the Government Budget Bill because of an upward revision of net lending for 2005.
89