Exhibit 99.c
Appendix 1
Sweden’s Economy

Appendix 1
Sweden’s Economy
Contents
Preface | | 9 |
| | | | |
Summary | | 9 |
| | | | |
1 | The global economy | | 11 |
| 1.1 | United States | | 12 |
| 1.2 | Euro area | | 14 |
| 1.3 | Asia | | 16 |
| 1.4 | Oil prices | | 18 |
| | | | |
2 | Financial markets | | 19 |
| 2.1 | Outside Sweden | | 19 |
| 2.2 | Sweden | | 21 |
| | | | |
3 | Swedish demand and output | | 24 |
| 3.1 | Exports | | 25 |
| 3.2 | Investment | | 27 |
| 3.3 | Stockbuilding | | 30 |
| 3.4 | Household consumption | | 31 |
| 3.5 | General government consumption | | 34 |
| 3.6 | Imports | | 35 |
| 3.7 | Output | | 37 |
| 3.8 | Current account | | 39 |
| 3.9 | GNI | | 39 |
| | | | |
4 | Labour market, wages, inflation and resource utilisation | | 43 |
| 4.1 | Labour market | | 47 |
| 4.2 | Wages | | 57 |
| 4.3 | Inflation | | 61 |
| | | | |
5 | General government sector | | 65 |
| 5.1 | General government finances | | 65 |
| 5.2 | Fiscal policy targets | | 70 |
| 5.3 | Fiscal policy | | 74 |
| 5.4 | Central government sector | | 76 |
| 5.5 | Pension system | | 78 |
| 5.6 | Local government | | 79 |
3
6 | Alternative scenarios | | 82 |
| 6.1 | Base scenario | | 82 |
| 6.2 | High-growth scenario | | 82 |
| 6.3 | Low-growth scenario | | 83 |
| | | | |
7 | Forecast evaluation | | 85 |
| 7.1 | Ministry of Finance forecasts | | 85 |
| 7.2 | Comparison with other forecasters | | 87 |
| 7.3 | Comparison with the preceding forecast | | 89 |
| | | | |
Tables Appendix | | 91 |
| Tables Chapter 1 The global economy | | 91 |
| Tables Chapter 2 Financial markets | | 92 |
| Tables Chapter 3 Swedish demand and output | | 93 |
| Tables Chapter 4 Labour market, wages, inflation and resource utilisation | | 97 |
| Tables Chapter 5 General government sector | | 99 |
| | | | |
Explanatory boxes | | |
| Revised method for calculating the wallet version of household disposable income | | 32 |
| Long-term impact of the government’s policies | | 40 |
| Potential GDP and the output gap | | 46 |
| Labour supply and employment | | 54 |
| 2007 wage round | | 58 |
4
Tables
Selected statistics | | 10 |
Table 1.1 GDP, inflation, unemployment and world market demand | | 11 |
Table 2.1 Interest and exchange rate assumptions | | 23 |
Table 3.1 Demand and output | | 24 |
Table 3.2 Exports of goods and services and change in export prices | | 26 |
Table 3.3 Investment | | 28 |
Table 3.4 Household disposable income | | 31 |
Table 3.5 Imports of goods and services and change in import prices | | 36 |
Table 3.6 Business sector output | | 37 |
Long-term impact of the government’s economic policies | | 42 |
Table 4.1 Selected statistics | | 43 |
Table 4.2 Employment trends by sector and contributions to total employment change in 2006 | | 47 |
Table 4.3 Participants in labour market policy programmes | | 48 |
Table 4.4 New start jobs | | 49 |
Central agreements and wage outcomes 2001–2006 | | 59 |
Table 4.5 Consumer prices | | 64 |
Table 5.1 General government net lending | | 65 |
Table 5.2 General government finances | | 65 |
Table 5.3 Taxes and charges | | 67 |
Table 5.4 Regulatory changes in the tax system; gross effects compared to preceding year | | 69 |
Table 5.5 General government expenditure | | 70 |
Table 5.6 Net lending in general governmnet | | 71 |
Table 5.7 Net lending: moving average for seven years excluding premium pension system | | 73 |
Table 5.8 Central government expenditure ceiling | | 74 |
Table 5.9 Indicators of stimulus to demand | | 75 |
Table 5.10 Central government finances | | 76 |
Table 5.11 Central government net lending and budget balance | | 76 |
Table 5.12 Budget balance and central government debt | | 78 |
Table 5.13 The old-age pension system | | 79 |
Table 5.14 Taxes and central government grants | | 79 |
Table 5.15 Central government grants according to the National Accounts | | 80 |
Table 5.16 Local government sector finances | | 80 |
Table 6.1 Selected statistics, base scenario | | 82 |
Table 6.2 Selected statistics, high-growth scenario | | 83 |
Table 6.3 Selected statistics, low-growth scenario | | 84 |
Table 7.1 Ministry of Finance forecasts and outcome for 2006 | | 85 |
Table 7.2 Average absolute forecast error for GDP-growth | | 88 |
Table 7.3 Ministry of Finance forecasts for 2007 in the Budget Bill for 2007 and the 2007 Spring Fiscal Policy Bill | | 90 |
GDP | | 91 |
Unemployment | | 91 |
Inflation | | 91 |
Interest and exchange rate assumptions, year-end | | 92 |
Interest and exchange rate assumptions, annual average | | 92 |
Demand and output | | 93 |
Contribution to GDP growth | | 93 |
5
Exports and imports of goods and services and change in prices | | 94 |
Gross fixed capital formation | | 94 |
Household income and savings | | 95 |
Business sector output | | 95 |
General government output | | 96 |
Current account balance | | 96 |
Components of saving | | 96 |
Gross national income (GNI) | | 96 |
General government finances | | 99 |
Central government finances | | 100 |
The old-age pension system | | 100 |
Local government finances | | 101 |
6
Figures
Figure 1.1 GDP-growth in key countries | | 12 |
Figure 1.2 Housing starts and Housing Market Index (HMI) | | 12 |
Figure 1.3 Housing investment as a percentage of GDP | | 13 |
Figure 1.4 Industrial output and capacity utilisation | | 14 |
Figure 1.5 Inflation in the euro area | | 15 |
Figure 1.6 Unemployment and unit labour costs | | 16 |
Figure 1.7 Chinese GDP growth by quarter | | 17 |
Figure 1.8 Inflation in Japan | | 18 |
Figure 1.9 Price of Brent crude | | 18 |
Figure 2.1 Ten-year bond yields in Germany, the United States, Japan and Sweden | | 19 |
Figure 2.2 Key interest rates in the euro area, Sweden and the United States | | 20 |
Figure 2.3 U.S. dollar against the yen and euro | | 20 |
Figure 2.4 Equity market performance in the euro area, the United States, Japan and Sweden | | 21 |
Figure 2.5 Spread between ten-year bond yields in Sweden and Germany | | 21 |
Figure 2.6 Repo rate and uncertainty range | | 22 |
Figure 2.7 TCW exchange-rate index | | 22 |
Figure 3.1 GDP | | 24 |
Figure 3.2 World market growth and growth in Swedish exports | | 25 |
Figure 3.3 Unit labour cost in Swedish industry compared to 14 OECD countries | | 26 |
Figure 3.4 Investment | | 27 |
Figure 3.5 Investment as a percentage of GDP | | 27 |
Figure 3.6 Capacity utilisation in the industrial sector | | 27 |
Figure 3.7 Housing starts | | 29 |
Real disposable income – National Accounts vs. the wallet version | | 32 |
Figure 3.8 Household disposable income and consumption | | 33 |
Figure 3.9 Household debt | | 33 |
Figure 3.10 Household interest expenditure | | 33 |
Figure 3.11 Employment and household consumption | | 34 |
Figure 3.12 Household saving | | 34 |
Figure 3.13 Industrial output and exports of goods | | 37 |
Figure 3.14 Inflow of new orders from the export market to the manufacturing industry | | 37 |
Figure 3.15 Demand for private services | | 38 |
Figure 4.1 Output gap and employment gap | | 44 |
Figure 4.2 Employment gap, wage growth, inflation and repo rate | | 45 |
Figure 4.3 Participants in labour market policy programmes | | 48 |
Figure 4.4 Newly reported vacancies and employment | | 49 |
Figure 4.5 Employment and people in the labour force | | 50 |
Figure 4.6 Absence and employment | | 51 |
Figure 4.7 Labour participation by age group | | 52 |
Figure 4.8 Open and total unemployment | | 53 |
Demographic dependency ratio | | 54 |
Contributions to employment rate variations among selected OECD countries compared to Sweden, 2005 | | 54 |
Figure 4.9 Employment gap and wage growth | | 57 |
Figure 4.10 Nominal and real wage growth | | 57 |
7
Figure 4.11 Consumer prices | | 61 |
Figure 4.12 Effects on CPI inflation of prices for various goods and services | | 61 |
Figure 4.13 Hourly wage and inflation | | 62 |
Figure 4.14 Exchange rate and imported inflation | | 62 |
Figure 4.15 Oil price in USD and SEK and petrol in the CPI | | 63 |
Figure 5.1 Net lending, revenue and expenditure | | 65 |
Figure 5.2 Consolidated gross debt | | 67 |
Figure 5.3 Central government debt 2000—2050, excluding proceeds from sales | | 71 |
Figure 5.4 Local government sector finances | | 81 |
Figure 7.1 Average absolute forecast errors for 2006 | | 87 |
Figure 7.2 Average absolute forecast errors related to GDP | | 88 |
Figure 7.3 Average absolute errors and average errors for unemployment 1997–2006 | | 89 |
8
Preface
This appendix to the 2007 Spring Fiscal Policy Bill presents the Ministry of Finance’s global and Swedish economic forecast for 2007 and 2008, as well as an estimate for 2009 and 2010 based on the assessed level of resource utilisation and potential economic growth.
The forecast is based on data from institutions such as Statistics Sweden (SCB), the European Commission and the Swedish National Institute of Economic Research (NIER). The Ministry of Finance has full responsibility for the assessments presented here. Henrik Braconier, director at the Ministry of Finance, is responsible for the calculations. The appendix proceeds from information available on 29 March 2007. The announced inquiry concerning repeal of the property tax has not been taken into consideration.
Summary
Fuelled by several years of expansionary monetary policy in the OECD area and historically low long-term interest rates, the global economy has grown rapidly in recent years. Although monetary policy has gradually tightened, the low rates are still contributing to rising demand. Global economic growth is expected to slow down in 2007 and 2008 but remain brisk. Continued labour market strength is setting the stage for rapid increases in household consumption. But global investment growth is likely to decelerate. Despite a long period of strong economic growth, global inflation has been modest and is expected to remain so in the next few years.
Rapidly rising demand in the United States over the past three years has accounted for a considerable share of global economic growth. While U.S. economic growth is set to taper off in 2007, steady ongoing growth in Asia and Europe should cushion the impact. But if the U.S. housing market declines further and has ripple effects, global economic growth may be less vigorous than anticipated by this forecast. The alternative scenario presented in Chapter 6 illustrates how a steeper economic downturn in the United States would affect the Swedish economy.
The Swedish economy is growing rapidly for the fourth consecutive year. Economic conditions are favourable, while both domestic and foreign demand for Swedish goods and services is rising steadily. In 2007 and 2008, the business cycle is expected to enter a more mature phase and exports are likely to increase more gradually. Owing partly to rapid expansion of output capacity over the past few years, investment growth is also set to slow down somewhat. Housing investment is projected to level out at a high plateau in the next few years.
Meanwhile, household consumption is set to increase very rapidly in the next few years as the result of a solid wealth position, rising real wages and robust employment growth, as well as the significant tax cuts that have been adopted and announced. Partly due to the fact that local government finances are sounder than they have been for a long time, general government consumption should also increase substantially in 2007 and 2008.
Given brisk demand growth and a stronger Swedish krona, imports are likely to increase at a steady pace in 2007 and 2008. GDP is forecast to rise by 3.7 per cent this year and 3.3 per cent next year. Calendar-adjusted GDP growth, which excludes the impact of the number of working days, is expected to be 3.9 per cent in 2007 and 3.2 per cent in 2008. Due to a high level of resource utilisation, actual GDP growth is projected to slow to 2.1 per cent in 2009 and 2.3 per cent in 2010.
Employment has been recovering steadily since Sweden’s robust economic growth caused a turnaround in the labour market in 2005. Continuation of rapid demand growth in Sweden will pave the way for rising employment in 2007 and 2008 as well. The cyclical labour market recovery has boosted labour supply. The measures that the government has already adopted to stimulate labour supply, combined with the reforms announced in this bill, should contribute to a steady expansion of supply during the period 2007–2008. Expanding labour supply is essential in order achieve a sustainable increase in the level of regular employment. The alternative scenario presented in Chapter 6 assumes that the reforms to increase labour supply will have a considerably greater impact than anticipated by this forecast. The scenario illustrates how structural reforms can generate economic growth, employment and stronger public finances.
9
Notwithstanding the forecast expansion of labour supply, brisk employment growth should lead to rapid resource utilisation increases in the total economy. Particularly in view of considerable uncertainty about the economic impact of the government’s supply-stimulating policies, projecting resource utilisation is a difficult task. If labour supply does not expand faster than this forecast anticipates and demand continues to exhibit strong growth, the economy may be in danger of overheating during the next few years. A number of indicators suggest that the Swedish business cycle is in a phase at which wage and price increases will begin to accelerate. The incipient manpower shortage makes it even more important to stimulate labour supply.
Despite the rapid expansion of labour supply, strong employment growth in 2006 led to lower unemployment. Open unemployment is expected to decline further in 2007 and 2008. Total unemployment, which also includes people participating in labour market policy programmes, is set to decrease substantially in both 2007 and 2008. Employment is expected to grow slower in 2009 and 2010 in the wake of a high level of resource utilisation, while open unemployment remains at just above 4 per cent. The regular employment rate is projected to rise throughout the forecast period and reach 75.6 per cent for the 16–64 age group in 2010.
General government finances have strengthened in the past few years. Excluding premium pension savings, general government net lending was 2.1 per cent of GDP in 2006. Steady economic growth provides the fiscal latitude to adopt tax cuts and other reforms without leaving public finances weaker than 2006. Tax cuts previously adopted and currently proposed will substantially reduce tax receipts as a percentage of GDP. Because expenditures will decrease by the same approximate percentage, general government net lending will remain virtually unchanged at just over 2 per cent of GDP in 2007–2008. In 2009–2010 general government net lending will strengthen gradually. The surpluses should continue to bolster the general government sector’s financial position. Moreover, gross debt will shrink as a result of the planned divestments of state shareholdings. Consolidated gross debt is projected at 27.0 per cent of GDP in 2010.
Selected statistics
Percentage change, unless otherwise stated
| | 2006 | | 2007 | | 2008 | | 2009 | | 2010 | |
GDP | | 4.4 | | 3.7 | | 3.3 | | 2.1 | | 2.3 | |
GDP, calendar adjusted | | 4.7 | | 3.9 | | 3.2 | | 2.1 | | 2.0 | |
Number of employed | | 1.8 | | 2.3 | | 0.9 | | 0.1 | | -0.1 | |
Regular employment rate, 16-64 years(1) | | 73.5 | | 75.0 | | 75.6 | | 75.7 | | 75.6 | |
Regular employment rate, 20-64 years(1) | | 77.7 | | 79.4 | | 80.2 | | 80.3 | | 80.1 | |
Open unemployment(2) | | 5.4 | | 4.7 | | 4.1 | | 4.2 | | 4.2 | |
Total unemployment(2),(3) | | 8.4 | | 6.7 | | 6.2 | | 6.1 | | 6.2 | |
Labour market policy programmes(4) | | 138 | | 95 | | 95 | | 90 | | 90 | |
Wage growth(5) | | 3.1 | | 4.0 | | 4.3 | | 4.5 | | 4.4 | |
UND1X, yearly average | | 1.2 | | 0.8 | | 1.5 | | 2.2 | | 2.2 | |
CPI, yearly average | | 1.4 | | 1.8 | | 2.3 | | 2.7 | | 2.5 | |
General government net lending(6),(7) | | 2.1 | | 2.3 | | 2.2 | | 2.5 | | 3.2 | |
Taxes and charges(6),(8) | | 49.8 | | 47.7 | | 47.2 | | 47.3 | | 47.3 | |
General government expenditure(6) | | 52.7 | | 50.9 | | 50.3 | | 49.9 | | 49.1 | |
Consolidated gross debt(6) | | 46.9 | | 40.9 | | 36.6 | | 32.2 | | 27.0 | |
(1) Number of employed in the age group, excluding employed in labour market policy programmes, as per cent of population in the age group.
(2) Per cent of labour force.
(3) Number of people in open unemployment and in labour market policy programmes.
(4) Number of people in labour market policy programmes, thousands.
(5) Short-term wage statistics.
(6) Per cent of GDP.
(7) Excluding premium pension savings.
(8) Including taxes to EU.
Sources: Statistics Sweden, National Labour Market Board, National Mediation Office and Ministry of Finance.
10
1 The global economy
Robust global growth
World GDP grew by an estimated 5.2 per cent in 2006. From an historical perspective, the global economy has grown very quickly for four consecutive years. While global growth is expected to weaken somewhat in the next two years, a number of indicators point to only a modest slowdown to 4.6 per cent in 2007 and 4.5 per cent in 2008. Due primarily to a recovery in the United States, global growth is likely to accelerate somewhat to 4.7 per cent in 2009, followed by 4.5 per cent in 2010.
Investment activity will taper off
The global economy is still exhibiting moderate inflation, high corporate profits and historically low bond yields. Modest inflation expectations and low interest rates are paving the way for investment activity to remain brisk. However, investment activity is expected to taper off somewhat after several years at a high level.
Table 1.1 GDP, inflation, unemployment and world market demand
Percentage change, unless otherwise stated
| | 2006 | | 2007 | | 2008 | | 2009 | | 2010 | |
GDP | | | | | | | | | | | |
World | | 5.2 | | 4.6 | | 4.5 | | 4.7 | | 4.5 | |
United States | | 3.3 | | 2.2 | | 2.6 | | 3.3 | | 3.0 | |
Japan | | 2.2 | | 1.8 | | 1.9 | | 2.0 | | 2.0 | |
Euro area | | 2.6 | | 2.2 | | 2.1 | | 2.0 | | 2.0 | |
CPI(1) | | | | | | | | | | | |
United States | | 3.2 | | 1.8 | | 2.6 | | 2.8 | | 2.9 | |
Japan | | 0.2 | | 0.6 | | 0.9 | | 1.2 | | 1.5 | |
Euro area | | 2.2 | | 2.0 | | 2.0 | | 1.9 | | 1.9 | |
Unemployment, percentage of labour force(2) | | | | | | | | | | | |
United States | | 4.6 | | 4.8 | | 5.3 | | 5.2 | | 5.1 | |
Japan | | 4.1 | | 3.9 | | 3.7 | | 3.7 | | 3.7 | |
Euro area | | 7.9 | | 7.4 | | 7.4 | | 7.5 | | 7.5 | |
World market demand(3) | | 9.8 | | 6.3 | | 6.4 | | 7.0 | | 6.9 | |
(1) HICP for the euro area and CPI for the United States and Japan.
(2) Eurostat definition for euro area and national definition for the United States and Japan.
(3) World market demand measures the weighted import demand in all countries to which Sweden exports.
Sources: National sources, Eurostat and Ministry of Finance.
Buoyed by a brighter outlook for the labour market, consumption is expected to grow steadily in 2007 and 2008. Unemployment in both the United States and the euro area is as low as it was around 2000. The oil price decline in autumn 2006 has provided additional latitude for household consumption.
Soft landing in the United States
The cooling U.S. housing market in autumn 2006 led to rapidly falling housing investments, significantly restraining GDP growth in the latter half of the year. But spurred by favourable labour market trends and falling oil prices, household consumption remains solid. Ripple effects from the housing market to other economic sectors have been limited so far.
As unemployment rises in the wake of lower gross fixed capital formation, the weaker housing market is likely to have a greater impact on household consumption. But the economic slowdown is forecast to be temporary. Most of the correction in the housing market should be over sometime in 2008. As the impact of lower gross capital formation in housing subsides in 2008, the U.S. economy is expected to recover.
Growth in the euro area and Asia will decelerate
The slowdown of the U.S. economy is likely to have relatively few repercussions on the rest of the world. As opposed to the global economic downturn around 2000, more modest growth in the United States is the result of specific domestic factors that have relatively little impact on imports. The danger of ripple effects in terms of reduced lending and rising risk premiums appears to be limited.
Both the euro area and Asia have been resistant so far – they are expected to grow above trend in both 2007 and 2008. But the slowdown in the United States and weaker investment activity are forecast to moderate growth, which will be fuelled more by domestic consumption, in those two regions. Lower household saving and a significantly better labour market are set to stimulate euro area consumption in both 2007 and 2008. While Asian growth has been largely driven by rapidly increasing exports, the trend
11
toward greater dependence on domestic demand is likely to continue in 2007 and 2008.
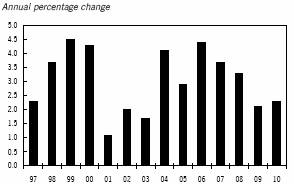
Figure 1.1 GDP-growth in key countries
Annual percentage charge
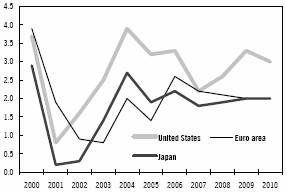
Sources: National sources, Eurostat and Ministry of Finance.
Global risk outlook
Although the base scenario is for a soft landing of the global economy, the downside risks are considerable. Among the primary risks in this forecast is the slowdown in the United States. If the correction in the housing market is more pronounced than anticipated, the ripple effects on the rest of the economy will be more evident as well. The result would be substantially slower growth in the United States and thereby the possibility of a palpable impact on the global economy.
Other risks are associated more with financial markets. Low nominal interest rates have led to a significant upswing in capital asset prices and rapidly expanding credit. A quick correction could have major repercussions on the real economy of every region.
Particularly in combination with rising oil prices, mounting labour costs in the wake of a tighter labour market and a higher level of resource utilisation could substantially increase inflationary pressure. A poorer economic growth outlook and the need for tighter monetary policies would result.
While the risk is small, an abrupt correction in the international trade and current account imbalances would significantly affect the global economy.
1.1 United States
Declining housing investment restraining economic growth
Thanks to strong ongoing consumption growth and solid increases in the machinery investment, U.S. GDP rose by 3.3 per cent in 2006. But the slowdown in the housing market gradually moderated GDP growth during the year. Housing investment made a negative contribution to GDP growth in 2006. The weak housing market and its ripple effects on other economic sectors are expected to persist throughout 2007 and early 2008. As a result, U.S. GDP growth is likely to be considerably less vigorous than 2006 in both 2007 and 2008.
Housing investment decelerated throughout 2006 and was 13 per cent lower in the fourth quarter than 12 months earlier. Demand for new housing has fallen considerably since mid-2005, while the number of completed, unsold units has risen. In February 2007, fewer new units were sold than at any time since 1997 and housing starts sank to their lowest level since 1991.
Figure 1.2 Housing starts and Housing Market Index (HMI)
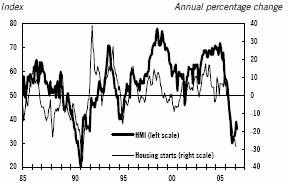
Source: National Association of Home Builders.
The Housing Market Index (HMI) fell sharply in 2006. But more stable HMI trends in late 2006 and early 2007 suggest that the housing market has already started to adjust. The fact that the index is still far below 50 indicates that the residential construction market remains weak.
The number of completed, unsold units is expected to decrease as housing starts taper off. But the housing investment as a percentage of GDP is far above the historical average, and it will take at least a year for the housing surplus to
12
be offset. Thus, housing investment is forecast to decline by almost 14 per cent in 2007 and not start recovering until early 2008.
Figure 1.3 Housing investment as a percentage of GDP
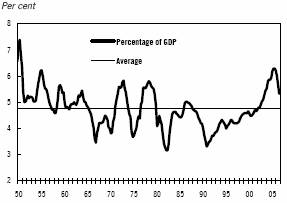
Source: US Department of Commerce.
Recent, widely discussed problems in the sub-prime mortgage market have led to greater uncertainty about the magnitude of the U.S. economic slowdown in 2007. Because more and more people with subprime mortgages are having trouble making payments, many lenders have declared bankruptcy. Falling house prices and rising mortgage rates have probably caused these problems. It is not inconceivable that the impact on house prices will thereby increase and detrimentally affect household consumption even more than anticipated by the base scenario of this forecast.
Changes in the housing market will depress consumption
Given that household consumption accounts for approximately 70 per cent of U.S. GDP, it has a major impact on economic growth. Rising house prices, along with steady income and employment growth, have helped boost household consumption by an annual average of 3.5 per cent in the past three years. But partly due to the impact of the weak housing market, household consumption is expected to grow a good deal slower in 2007 and 2008.
The housing surplus has begun to moderate price increases for existing units, and house prices are even falling in some regions. Because household net worth and the latitude for debt-financed consumption decrease along with house values, household consumption is likely to taper off as well. The decrease in housing construction is also likely to weaken employment, thereby detrimentally affecting consumption in 2007 and 2008. As much as one third of employment growth over the past three years is estimated to have been associated with changes in the real estate market. Lower household saving could offset lower real net worth. But the saving ratio of U.S. households is already negative, and declining net worth points to higher saving instead. Weaker income trends as the result of slower employment and economic growth should also restrain increases in household consumption.
Lower industrial activity
The U.S. industrial sector is in a more fragile position than many other major industrialised nations. Sales have been low in relation to inventories since late 2006, and new orders have tapered off. Industrial output has slowed down as a result. Industrial activity is being squeezed by weak demand in sectors that are dependent on the housing market, competition problems in the auto industry and other developments. Thus, industrial activity is expected to remain less vigorous in 2007. But strong global demand and the cheaper dollar, factors that favour U.S. exporters, are set to counteract weak domestic demand. As a result, exports are expected to grow at a healthy pace in both 2007 and 2008, albeit not as fast as 2006. Meanwhile, import growth is likely to decelerate in the wake of poorer domestic demand. Thus, the contribution of net exports to GDP growth is forecast to be slightly positive in 2007.
As the economic outlook for the industrial sector dims, lower profits and decreasing capacity utilisation are likely to ensue. Thus, the machinery investment in the industrial sector is also expected to grow slower than 2006 in both 2007 and 2008.
13
Figure 1.4 Industrial output and capacity utilisation
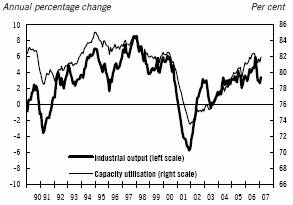
Sources: Federal Reserve och Federal Reserve Board.
The weak housing market and industrial activity have already restrained service sub-sectors that depend on orders from them. Taking slower consumption growth into consideration as well, the result is likely to be persistence of the dimmer outlook for the service sector in 2007.
GDP growth below potential growth in both 2007 and 2008
The downturn in the U.S. housing market and the ripple effects it is expected to have on consumption and other factors are likely to considerably depress GDP growth in 2007 to well below the potential growth estimate of approximately 3 per cent. The correction in the housing market is projected to be over sometime in 2008, at which point housing investment should begin to gradually recover. Other economic sectors, including household consumption, would benefit. Monetary policy is also likely to stimulate the U.S. economy in 2008. Owing to the accelerating economic downturn, the Federal Reserve is expected to start lowering the federal funds rate in the latter half of the year. While GDP growth is thereby forecast to be somewhat stronger in 2008 than 2007, it is unlikely to match potential growth until 2009.
As employment growth wanes and demand rises slower, inflationary pressure is expected to ease in 2007. But given somewhat stronger economic growth, inflation should pick up speed in 2008.
1.2 Euro area
Growth finally increasing
Euro area GDP grew in 2006 by 2.6 per cent, the highest in six years. A large percentage of the improvement can be traced to the considerably stronger German economy.
Economic growth is expected to lose some momentum in 2007 and 2008 in the wake of weaker global demand, fiscal austerity and a less expansionary monetary policy. But the slowdown is forecast to be modest, leaving GDP growth at 2.2 per cent in 2007 and 2.1 per cent in 2008.
Germany strongest of the EU big three
Euro area GDP growth accelerated considerably in the fourth quarter of 2006. GDP was 0.9 per cent above the third quarter and 3.3 per cent above the fourth quarter of 2005. The increase was propelled in equal measure by rapid export growth late in the year and ongoing improvement in domestic demand. Foreign trade contributed 0.8 percentage points and domestic demand contributed 0.7 percentage points to GDP growth, while a substantial decrease in inventories made a negative contribution.
The biggest economies of Germany, France and Italy (EU big three) have averaged 1.7 per cent annual GDP growth over the past ten years, as opposed to 3.7 per cent for the other euro countries. France has enjoyed the most rapid growth of the EU big three during most of that time. But Germany has pulled into the lead since early 2005, while Italy is lagging further and further behind.
German investment activity tapered off in mid-2006 and is expected to continue doing so in 2007 as the result of weaker global demand and lower capacity utilisation. Closer trade relations with new EU Member States and Eastern Europe have favoured German exports. In contrast to most other euro countries, Germany’s share of world trade has increased in recent years. Several years of cost-cutting by the business sector have improved competitiveness and substantially lowered unit labour costs.
14
French GDP growth has been driven more by a rapid upturn in consumption, while industrial activity has moderated considerably. Favourable labour market trends are paving the way for a continuation of healthy economic growth in 2007 and 2008. But due to mounting competition problems and more feeble consumption, the deceleration of Italian GDP growth will be more evident during that period.
Common to virtually all euro countries is high business confidence in the manufacturing industry. Expectations for the future dimmed somewhat in autumn 2006 but remain optimistic. New orders are still brisk, while manpower requirements have decreased somewhat. All in all, the confidence indicators point to a modest slowdown in industrial output in 2007.
Consumption recovering
Greater household consumption is vital to the persistence of strong GDP growth in 2007 and 2008. Consumption has been one of the main drivers of economic expansion in countries such as Spain and France that experience favourable employment growth and rising housing prices. However, consumption has contributed only modestly to euro area GDP growth as a whole. But largely due to an increase in Germany as well, euro area consumption grew more rapidly in 2006 than at any time since 2001. The weaker global economy notwithstanding, a number of indications suggest that consumption growth in the euro area will persist in 2007 and 2008. The number of employed workers has increased significantly, and consumer confidence is at its highest point in five years. As public finances strengthen, precautionary saving by households is expected to decrease and provide additional latitude for consumption.
As a result of the VAT hike from 16 per cent to 19 per cent that took effect in January 2007, German consumption growth is forecast to slow down temporarily this year. The acceleration of consumption expected in 2006 barely manifested. Although retail sales (particularly new cars) were up substantially during the fourth quarter, the overall impact was small. Given a considerable improvement in the labour market and rising consumer confidence, the 2007 slowdown stemming from the VAT hike is expected to be short-lived and relatively modest in terms of both consumer prices and consumption.
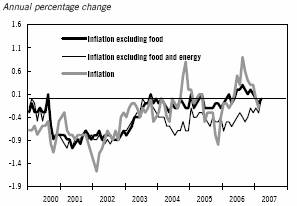
Inflation more modest in 2007
Falling energy prices moderated inflation considerably in autumn 2006. But inflation speeded up again in early 2007. Measured as the Harmonised Consumer Price Index (HICP), inflation was up from 1.6 per cent in October 2006 to 1.8 per cent in February 2007.
Core inflation (HICP excluding energy and unprocessed food) has risen sharply since the end of 2006. As a result, the difference between aggregate HICP inflation and core inflation has evaporated. Core inflation was 1.9 per cent in February 2007.
Figure 1.5 Inflation in the euro area
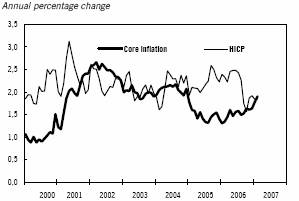
Sources: Eurostat.
Much of the rate of growth in core inflation is due to the German VAT hike, as the result of which inflation (excluding energy prices) in Germany rose from 1.2 per cent in December 2006 to 1.8 per cent in February 2007.
Inflation of 2.2 per cent in 2006 was above the ECB inflation target for the seventh consecutive year. Because the impact of earlier oil price hikes will drop out of the 12-month comparisons this summer, the energy component of the consumer price index will hold down inflation until midyear. The combination of lower energy prices and tighter monetary policy is expected to push inflation down to 2.0 per cent in 2007 and 2008.
When will wage growth take off?
The 7.4 per cent unemployment rate at the beginning of 2007 was lower than the high-growth years around 2000. The decrease in the number of jobless workers is forecast to taper off, leaving
15
the unemployment rate at approximately 7.4 per cent in both 2007 and 2008.
A key difference between now and the period around 2000 is that a considerably improved labour market has not accelerated wage growth. One possible reason is that the labour market reforms adopted in recent years have held down equilibrium unemployment. A less auspicious explanation may be that there is a greater time lag between a tighter labour market and its impact on wages than was previously the case. If that is true, wage growth is likely to accelerate considerably in 2007 once the euro area business cycle enters a more mature phase. But global competition and the ECB’s interest rate policy are likely to restrain wage increases.
Figure 1.6 Unemployment and unit labour costs
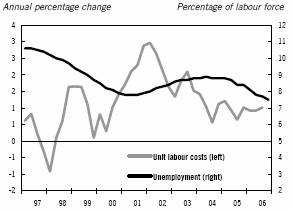
Sources: Eurostat.
1.3 Asia
Increasingly integral to the global economy
Many years of very rapid growth, particularly in China and India, have gradually increased Asia’s share of world GDP. Measured as purchasing power parity (PPP)(1), Asia’s share rose to approximately 36 per cent in 2006, as opposed to 20 per cent for the United States and 15 per cent for the euro area. As GDP rises in Asia, global growth increasingly reflects developments in the region.
Whereas both the U.S. and euro area economies are set to slow down in 2007, Asia still faces bright prospects of continued rapid growth over the next few years. Domestic demand is an increasingly vital driver for the entire region. Intra-Asian trade has risen, while reliance on exports to the United States has decreased. Furthermore, low inflationary pressure has opened the door to a more expansionary monetary policy if necessary. Due to strengthening public finances, fiscal policy is also becoming an increasingly viable instrument of control. The exception is India, whose tight fiscal policy will remain hostage to large government budget deficits.
Asian GDP increases are expected to moderate over the next two years in the wake of somewhat slower growth in China and India, as well as the newly industrialised economies of South Korea, Taiwan, Hong Kong and Singapore that will be affected by less vigorous global export demand.
Chinese growth will taper off but remain very high
Exports have been fuelling growth in China. According to the IMF, China’s share of world exports rose from 1 per cent in the early 1980s to more than 8 per cent in 2006. The advances of the export industry have generated both higher corporate profits and rising employment in the urban regions. Gross capital formation, and to a lesser extent consumption, has grown very fast as a result. Rapid credit expansion has also spurred gross capital formation, thereby increasing the risk of overinvestment and bad loans. The persistence of strong gross capital formation and export growth in 2006 contributed to a 10.7 per cent increase in GDP.
(1) Measuring GDP as PPP takes differences among the purchasing power of the various countries into consideration.
16
Figure 1.7 Chinese GDP growth by quarter
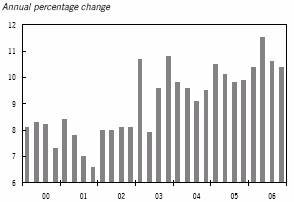
Source: National Bureau of Statistics.
China adopted austerity measures in late 2006 aimed at restraining rapid gross capital formation and credit growth. Consisting of a lending rate hike, stronger administrative controls and higher reserve requirements, the effort made an impact and checked growth of gross capital formation somewhat at the end of the year. The moderating effect on growth of gross capital formation is expected to continue in 2007 and 2008, thereby contributing to more deliberate (but still very rapid) GDP increases. Weaker export trends as a result of more sluggish global demand growth are also set to rein in Chinese economic expansion. The country’s currency strategy of a gradual appreciation of the yuan against the dollar in order to achieve greater exchange-rate flexibility is also expected to detrimentally affect exports at the margin.
Expectations that GDP will grow somewhat slower are in line with China’s current five-year economic plan, which targets a long-term, economically sustainable average of 7.5 per cent a year. The idea is also for consumption and innovation to drive growth more than before. But consumption growth is unlikely to speed up within the next four years. Given the flimsy social safety net, the saving ratio among Chinese households is forecast to remain high.
Indian economic growth will slow down
Domestic demand and household consumption have historically made the biggest contributions to Indian economic growth. Partly due to rising demand by China, which accounts for approximately half of Indian export trade in Asia, exports have become an increasingly important engine of economic growth in recent years. India’s share of world GDP has risen to more than 6 per cent. Measured as PPP, only the United States, China and Japan contribute more to world GDP.
Indian GDP grew by 9.3 per cent in 2006. Owing to a rising level of resource utilisation, thereby restraining output in both the industrial and service sectors, economic growth is projected to taper off in 2007 and 2008. Moreover, Indian monetary policy is likely to tighten in the wake of rising inflation and rapid credit expansion. Given large government budget deficits, fiscal policy is expected to be restrictive.
Japan back in the game
While Japan has played a more modest role during the arduous years of deflation, its importance should not be underestimated. GDP growth of 2.2 per cent in 2006 reinforced the view that Japan is once more a force to be reckoned with. The Japanese economy is expected to expand somewhat slower in 2007-2008 than 2006 but remain above OECD’s estimated potential growth of 1.4 per cent. One factor contributing to more modest GDP increases is likely to be weaker growth of gross capital formation in the next two years. The significant decline in machinery orders early in 2007 will probably restrain the Japanese industrial sector’s propensity to make capital expenditures. The incipient adjustment of output capacity to demand is also holding down the machinery component of gross capital formation. Furthermore, the Bank of Japan has dropped its zero interest policy and raised its key interest rate by 50 basis points. The probable result will be additional restraint on gross capital formation at the margin.
Although employment has risen and unemployment declined, household consumption is forecast to grow only modestly in 2007 and 2008. Inflation, which is struggling to stay above zero, is restraining the propensity to consume. Japan had zero inflation in February 2007, and prices are expected to rise only marginally for the rest of the year.
17
Figure 1.8 Inflation in Japan
Source: Ministry of Internal Affairs and Communications.
Owing partly to the large percentage of part-time employees and number of workers retiring, real wage growth has also been sluggish. Wage demands and levels are lower among young workers than those who are retiring. As the labour market tightens, real wage growth is expected to accelerate but not enough for consumption to take off in earnest. Exports, the main reason that the Japanese economy has steadily strengthened since 2000, are forecast to exhibit somewhat slower growth going forward as the result of weaker import demand by its most important trading partners of China and the United States. But due partly to weaker import growth, net exports are set to continue making a positive contribution to Japanese economic expansion.
1.4 Oil prices
Oil prices hit record highs in summer 2006. Brent crude peaked at close to USD 80 per barrel in early August. Due partially to unusually warm weather in the United States, oil prices retreated late in the year. Cold weather and reduced oil inventories contributed to renewed hikes in early 2007.
For a number of reasons, oil prices have risen substantially since 2002. Output capacity has expanded relatively slowly since 2000, while demand for oil has risen rapidly in recent years.
The strong global economy has contributed to greater demand for oil. The emergence of China and India as significant net consumers of oil has helped narrow the gap between potential supply and actual demand (reserve capacity). As a result, oil prices have become increasingly vulnerable to supply disruptions and geopolitical uncertainty in oil-producing regions.
Figure 1.9 Price of Brent crude
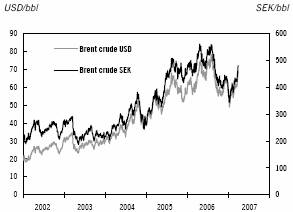
Source: Reuters.
Global reserve capacity is expected to be limited in the short term, while demand remains strong. Thus, relatively high oil prices are expected to persist.
There is much to suggest that global reserve capacity will increase over the longer term. The price hikes of recent years have boosted investment in both new and existing oil fields. In the wake of a less vigorous global economy, demand is likely to taper off toward the end of the forecast period. As a result, the supply of crude is projected to rise faster than demand in the long term and thereby increase reserve capacity. Refinery capacity is also expected to expand, especially after 2009 as the OPEC countries and Asia put new capacity to use.
Expanding reserve capacity is likely to reduce the risk premium and thereby oil prices as well. But the price decline should be limited by the risk of geopolitical unrest and future production disruptions, as well as higher costs of oil production. Oil is projected to cost USD 60 per barrel at the end of 2007, USD 60 at the end of 2008, USD 55 at the end of 2009 and USD 50 at the end of 2010.
Predicting future oil prices is still associated with a great deal of uncertainty. Politically unstable countries account for an increasing percentage of production. Changes in global growth, unexpected production disruptions, and geopolitical tensions retain the potential to significantly affect oil prices.
18
2 Financial markets
The financial markets have been haunted recently by uncertainty about the U.S. economy. Signs of a slowdown in the United States and uneasiness about the U.S. mortgage market have contributed to a decline in international bond yields. In the light of weaker economic growth, the Federal Reserve is expected to cut the federal funds rate in the latter half of 2007. Meanwhile, the ECB and Riksbank are likely to further tighten monetary policy. The Bank of Japan is also forecast to continue raising its key interest rate, albeit slowly.
Expectations of future interest rate differentials among various countries have set the tone for the foreign exchange market. The prospect of narrower differentials contributed to a depreciation of the dollar against both the euro and krona in 2006. As the differentials between Sweden and the other regions narrow, the krona is expected to appreciate further.
Higher interest rates and a stronger krona involve tighter monetary conditions in Sweden. But the change is from an expansionary level, and interest rates are set to remain low. All in all, Swedish monetary conditions are anticipated to remain relatively expansionary.
2.1 Outside Sweden
Lower bond yields due to less risk appetite
Owing largely to greater uncertainty about the U.S. economy, international bond yields fell after summer 2006. Strong economic indicators in late 2006 and early 2007 raised expectations for U.S. growth, thereby contributing to rising international bond yields. Most recently, uncertainty about the U.S. economy and uneasiness about U.S. mortgage lending institutions have dogged the financial markets. The greater risk aversion stemming from that uncertainty has caused capital flight from investment options with lower creditworthiness to government bonds, thereby helping to push down bond yields. Generally speaking, both Swedish and international bond yields are at historically low levels.
Figure 2.1 Ten-year bond yields in Germany, the United States, Japan and Sweden
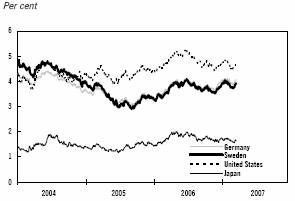
Source: Reuters.
Flatter yield curve
As short-term bond yields have continued to climb while long-term yields have declined since the beginning of 2007, the yield curve(2) has flattened. The yield on the 10-year U.S. Treasury note is lower than on short-term bills. In the past, such conditions have often signalled an impending economic downturn.
(2) The yield curve describes the relationship between the yields on treasury bills and bonds of various maturities.
Given the various structural explanations for the low bond yields, whether that historical relationship still holds true today is a matter of speculation. One explanation stems from new rules for pension funds, leading to greater demand for long-term bonds. Increased confidence in the inflation targets of central banks has probably contributed to a decrease in the term premium – in other words, investors are demanding less compensation for holding long-term bonds because they believe that inflation is now less volatile. An increase in world net saving, particularly in the newly industrialised Asian economies and other emerging economies, has presumably helped depress bond yields as well.
Recent short-term interest rate hikes by the ECB and Bank of Japan also explain the flat shape of the yield curve.
European and Japanese bond yields are expected to increase in the wake of strong economic growth, greater resource utilisation, rising inflation and higher short-term interest rates. Because the U.S. curve is likely to acquire a positive slope, yields are predicted to increase
19
marginally in the United States as well. Several factors point to generally higher international interest rates in the longer term. Globalisation has contributed to an expansion of global labour supply. The higher gross capital formation required by such an expansion should add impetus to rising interest rates. Moreover, the high level of household saving in Asian countries is set to subside as incomes rise and social safety nets improve.
This forecast anticipates a yield of 4.80 per cent on the 10-year U.S. Treasury note and 4.30 per cent on its German counterpart at the end of both 2007 and 2008.
ECB will continue tightening while the Federal Reserve cuts federal funds rate
The Federal Reserve has left the federal funds rate at 5.25 per cent since summer 2006. Due to the strength of U.S. economic indicators at the end of 2006, prices of forward contracts indicated that the Federal Reserve would tighten monetary policy. But the slowdown in U.S. GDP growth during the first quarter of 2007 changed prices of forward contracts, which now point to a cut in the federal funds rate to 4.75 per cent by the end of 2007. This forecast anticipates that the signs of weaker economic growth will be pivotal to the Federal Reserve’s decisions. The prediction is that the federal funds rate will be cut this year and decrease from the 4.75 per cent figure in December 2007 to 4.5 per cent in December 2008.
The ECB has continued to tighten monetary policy, raising its key interest rate by 2 percentage points to 3.75 per cent since December 2005. The ECB’s moves have been motivated by the fact that inflation and money supply growth, the two pillars of its monetary policy strategy, have been above the target level. Rapid, persistent price increases can increase the inflation expectations of households and undermine their confidence in the target, thereby spurring wage growth. Due partly to strong growth in lending to households, money supply is continuing to expand rapidly. Meanwhile, the recent strengthening of the European economy points to additional hikes in the ECB’s key interest rate. The ECB has been signalling that it plans to gradually raise the rate toward a more neutral level – this forecast anticipates 4.0 per cent at the end of both 2007 and 2008.
Responding to the recent palpable strength of the real Japanese economy, the Bank of Japan has raised its key interest rate by 50 basis points since summer 2006. Core inflation has also risen, though remaining low. This forecast anticipates that the Bank of Japan will continue raising its key interest rate, albeit slowly.
Figure 2.2 Key interest rates in the euro area, Sweden and the United States
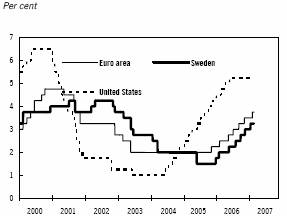
Sources: ECB, Riksbank and Federal reserve.
Dollar will weaken further
Strong U.S. economic indicators in late autumn 2006 temporarily shored up the dollar. Weaker indicators recently have raised expectations that the Federal Reserve will cut the federal funds rate during the course of 2007. The prospect of lower positive interest rate differentials vis-à-vis other currency areas has sapped the dollar’s strength once again.
Figure 2.3 U.S. dollar against the yen and euro
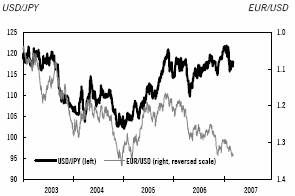
Source: Reuters.
The dollar is likely to depreciate further as growth and interest rate differentials narrow. This forecast anticipates that the dollar will fall
20
to 1.35 against the euro and 115 against the yen at the end of 2007, followed by 1.35 against the euro and 110 against the yen at the end of 2008.
Carry trades
Carry trades have had a major impact on the foreign exchange market in recent years. A carry trade involves borrowing in a low-interest currency to invest in higher yielding assets. A similar transaction is available in the currency futures market. The principle is the same – to take advantage of the interest rate differential between two countries. The theory posits that systematic generation of profits on interest rate arbitrage is impossible, but that the differentials should manifest in the simultaneous appreciation of low-interest currencies and depreciation of high-interest currencies. Nevertheless, such arbitrage trading has periodically generated profits and affected the foreign exchange market. The yen has gradually depreciated against the dollar and euro over the past two years. Traders have been borrowing in yen at low interest rates to invest in higher yielding dollar and euro assets. Low Japanese interest rates have further depressed the yen. A carry trade can be undermined by altered monetary conditions. Recent economic indicators suggest that Japanese growth has accelerated, and the Bank of Japan raised its key interest rate in February 2007. Changes in monetary policy can quickly affect currency flows and exchange rate levels. Nevertheless, the Bank of Japan is expected to raise its key interest rate at a deliberate pace.
Equity markets are more volatile
The major world stock indices have been more volatile recently. Uncertainty about U.S. economic growth and uneasiness about U.S. mortgage lending institutions have contributed to substantial movements on world equity markets. Whether a temporary correction or a more sustained bear market is under way after almost four years of a bull market remains to be seen.
Swedish firms reported generally higher profits for the fourth quarter of 2006 than analysts had predicted. However, the consensus estimate is that profits will decline somewhat going forward. Both the U.S. and European equity markets are undervalued in comparison with the bond market. But rising interest and labour costs may squeeze the margins of firms in the longer term.
Figure 2.4 Equity market performance in the euro area, the United States, Japan and Sweden
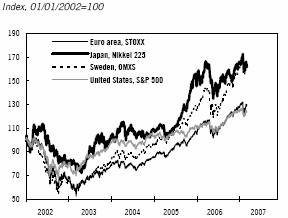
Source: Reuters.
2.2 Sweden
After the yield on 10-year Swedish government bonds rose in late 2006, long-term yields have retreated in line with international trends. But given the favourable economic conditions, bond yields are still low.
Figure 2.5 Spread between ten-year bond yields in Sweden and Germany
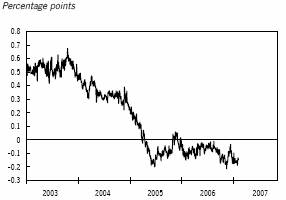
Source: Reuters.
Since May 2005, 10-year Swedish government bonds have been in the historically unusual position of yielding less than their German equivalent. The fact that the Riksbank’s repo rate has been lower than the ECB’s key interest rate during that period provides most of the explanation. In addition, new rules for pension funds
21
have stimulated demand for long-term Swedish bonds. Meanwhile Sweden’s shrinking, relatively small central government debt is limiting the supply of long-term government bonds.
This forecast anticipates that Swedish bond yields will rise in both 2007 and 2008 as available economic resources dwindle and monetary policy becomes less expansionary. Swedish bond yields are expected to increase somewhat more than their German equivalents in 2008 as the spread between the Riksbank’s repo rate and the ECB’s key interest rate narrows. The yield on 10-year Swedish government bonds is projected at 4.05 per cent in December 2007, 4.65 per cent in December 2008 and 4.85 per cent in December 2009.
Riksbank continuing to raise the repo rate
The Riksbank is continuing to tighten monetary policy. Its repo rate hikes from 1.5 per cent to 3.25 per cent since 2006 are likely to be followed by more. Despite strong economic growth, Swedish inflation is low. Thus, the spread between the repo rate and inflation has widened. Inflation remains below the Riksbank’s target. But underlying inflation, as measured by the Riksbank’s UND1X index, is expected to rise during the latter half of the year to 0.8 per cent at the end of 2007, 1.9 per cent at the end of 2008 and 2.4 per cent at the end of 2009 (see Section 4.3 on inflation).
Figure 2.6 Repo rate and uncertainty range

Sources: Riksbank and Ministry of Finance.
The Ministry of Finance issues its repo rate forecast with an uncertainty range based on its past forecast errors.(3) The present forecast anticipates gradual hikes in the repo rate over the next few years. Ongoing employment growth is expected to contribute to more rapid wage increases and higher resource utilisation. The forecast anticipates a repo rate of 3.5 per cent at the end of 2007, 4.5 per cent at the end of 2008, 4.75 per cent at the end of 2009 and 4.25 per cent at the end of 2010.
(3) The deviations are based on forecasts in the 1998-2006 Spring Fiscal Policy Bills.
Krona will appreciate
Due primarily to the prospect that the Riksbank would tighten monetary policy, the krona appreciated against both the euro and dollar in autumn 2006. But owing chiefly to changed expectations about interest rate differentials between Sweden and the other regions, the krona has depreciated against both currencies since the beginning of 2007.
Favourable underlying factors such as a current account surplus, stable public finances, solid economic growth and modest inflation are set to strengthen the krona. The trade-weighted (TCW) exchange-rate index is projected to be 124 at the end of 2007, 120 at the end of 2008, 121 at the end of 2009 and 121 at the end of 2010.
Figure 2.7 TCW exchange-rate index
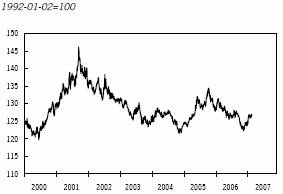
Source: Reulers.
22
Volatility on the Stockholm Stock Exchange
Owing primarily to rising corporate profits, the Swedish bull market charged ahead in autumn 2006. The stock market started off 2007 on a strong note. But uncertainty about the U.S. economy and mortgage market led to falling share prices around the world. At the moment, the equity markets appear to have stabilised.
At approximately 24 per cent, growth in corporate profits was somewhat higher than expected in the fourth quarter of 2006. The primary industries of forestry, steel and minerals reported the biggest increases, followed by the engineering and pharmaceutical industries. Analysts generally predict that earnings growth will continue but decelerate. The consensus estimate(4) is that the earnings of firms listed on the Stockholm Stock Exchange will rise by approximately 6 per cent in 2007, 9 per cent in 2008 and 5 per cent in 2009. By and large, slower earnings growth points to an impending period characterised by weaker growth of gross capital formation (see Section 3.2 on gross capital formation).
(4) Source: FactSet Consensus Estimates (JCF)
Outlook for the Swedish economy
Financial market factors such as interest and exchange rates affect the Swedish economy by influencing business strategies and consumer behaviour. Prices of capital assets such as equities and housing affect household net worth and ultimately consumption. Fiscal conditions are expected to stay relatively expansionary throughout the rest of 2007 but tighten as the Riksbank raises the repo rate throughout 2008. Short-term real interest rates have risen in the wake of the higher repo rate, while inflation has remained low. Household borrowing is still increasing rapidly, albeit more modestly. The borrowing trend, which is partly due to the continuation of expansionary monetary policy, is contributing to strong demand growth in the total economy. The relatively weak krona is expected to appreciate in late 2007 and 2008.
Table 2.1 Interest and exchange rate assumptions
Value at the end of each year
| | 2006 | | 2007 | | 2008 | | 2009 | | 2010 | |
Repo rate | | 3.00 | | 3.50 | | 4.50 | | 4.75 | | 4.25 | |
6-month interest rate | | 3.07 | | 3.60 | | 4.55 | | 4.70 | | 4.30 | |
5-year interest rate | | 3.70 | | 3.95 | | 4.60 | | 4.80 | | 4.50 | |
10-year interest rate | | 3.65 | | 4.05 | | 4.65 | | 4.85 | | 4.55 | |
Spread Swe-Ger 10 year | | -0.15 | | -0.25 | | 0.35 | | 0.55 | | 0.25 | |
6-month EURIBOR | | 3.61 | | 4.05 | | 4.05 | | 4.05 | | 4.05 | |
TCW index | | 123 | | 124 | | 120 | | 121 | | 121 | |
EUR/SEK | | 9.04 | | 9.10 | | 8.80 | | 8.90 | | 8.90 | |
USD/SEK | | 6.84 | | 6.74 | | 6.52 | | 6.59 | | 6.59 | |
EUR/USD | | 1.32 | | 1.35 | | 1.35 | | 1.35 | | 1.35 | |
Sources: Reuters and Ministry of Finance.
23
3 Swedish demand and output
Due largely to an increase in demand on a broad front, Swedish GDP growth was very strong at 4.4 per cent in 2006 (see Figure 3.1). Export growth has been rapid, the sustained upswing in gross fixed capital formation has persisted and household consumption has risen steadily.
Figure 3.1 GDP
Sources: Statistics Sweden and Ministry of Finance.
GDP growth will remain rapid in 2007 and 2008
In the wake of more modest growth of exports and gross fixed capital formation, GDP growth is set to be slower in 2007 and 2008 (see Table 3.1) but remain high. Given a cooling off of the global economy and a stronger krona, export growth is likely to be somewhat slower, though healthy from a historical perspective. The persistence of robust demand, high capacity utilisation and the financial strength of firms should help keep gross fixed capital formation in sectors such as industry and residential construction at a high level. But as demand tapers off somewhat and the output capacity that has been added in recent years is put to use, growth in gross fixed capital formation is likely to decelerate in 2007 and 2008.
Steady expansion of Swedish household consumption is expected to partially offset slower growth of exports and gross capital formation. Disposable income is rising quickly, employment is proceeding upward and household net worth is starting from a solid position. The cumulative impact should be high consumption growth in 2007 and 2008, particularly in 2007 as income tax cuts help boost household disposable income. Spurred by sound finances, local government is set to exhibit the most rapid consumption growth in the general government sector.
Table 3.1 Demand and output
| | SEK Billion | | Percentage change in volume | |
| | 2006 | | 2006 | | 2007 | | 2008 | | 2009 | | 2010 | |
Household consumption | | 1 339 | | 2.8 | | 4.2 | | 3.8 | | 2.4 | | 2.6 | |
General government consumption | | 759 | | 1.8 | | 1.4 | | 1.4 | | 0.5 | | 0.6 | |
Central govt. | | 207 | | 1.0 | | 0.5 | | 0.4 | | 0.1 | | 0.1 | |
Local govt. | | 552 | | 2.0 | | 1.8 | | 1.7 | | 0.7 | | 0.7 | |
Investment | | 509 | | 8.2 | | 5.6 | | 3.4 | | 2.3 | | 2.7 | |
Change in stocks(1) | | 0 | | 0.0 | | 0.0 | | 0.1 | | 0.0 | | 0.2 | |
Exports | | 1 456 | | 9.1 | | 7.0 | | 6.3 | | 6.3 | | 6.0 | |
Imports | | 1 224 | | 7.8 | | 7.6 | | 6.7 | | 6.7 | | 6.7 | |
GDP | | 2 838 | | 4.4 | | 3.7 | | 3.3 | | 2.1 | | 2.3 | |
GDP, calendar adjusted | | — | | 4.7 | | 3.9 | | 3.2 | | 2.1 | | 2.0 | |
(1) Contribution to GDP-growth, percentage points.
Sources: Statistics Sweden and Ministry of Finance.
More moderate GDP growth in 2009 and 2010
GDP growth forecasts for the years after 2008 are based on estimates of the size of potential supply, measured as potential GDP. As described by an explanatory box in Chapter 4, potential GDP is calculated on the basis of potential productivity and potential labour supply.
Due to a rapid expansion of GDP and employment in 2007-2008, the level of resource utilisation is forecast to be high. In other words, the output gap is expected to be positive. Given a positive output gap in 2008, wage and price increases are likely to accelerate while the Riks-bank raises the repo rate, thereby contributing to a stronger krona and weaker domestic demand. Both household and general government consumption, as well as gross fixed capital formation, are set to rise slower in 2009 and 2010 than 2008. Partly due to the appreciation of the krona, export growth should moderate somewhat.
Demand is likely to taper off somewhat in 2009 and 2010 while GDP increases approximately 1 percentage point slower than potential GDP.
24
Risk outlook
The primary risk to the Swedish GDP forecast would be an unexpectedly abrupt downturn in the U.S. economy that restrains global (and thereby Swedish) growth. But as discussed in Section 1.1, the base scenario is a soft landing in the United States.
Certain risks are primarily associated with developments in the medium term. The magnitude and timing of the impact of the government’s economic policies are difficult to project. Assessing current resource utilisation and future growth in potential GDP is also fraught with uncertainty. Such factors are integral to the direction of the economy over the next few years. To illustrate the uncertainty of the assessments, Chapter 6 presents two alternative scenarios in which the Swedish economy takes a different course than in the base scenario.
3.1 Exports
Swedish exports grew rapidly in 2006 and are expected to continue upward. The upswing in 2006 extended to most groups of products and virtually every region, with the exception of the United States. Increases to European countries were particularly rapid, and the strong German economy helped make it Sweden’s biggest export partner once again.
Given that the European economy has stabilised at a high level and global demand is still brisk, the prospects for Swedish export growth remain auspicious. Exports are likely to rise steadily throughout the forecast period but at a gradually slower pace as the krona appreciates and the global economy cools off. Export growth is expected to total 7.0 per cent in 2007 and 6.3 per cent in 2008, followed by a further modest deceleration in 2009-2010.
Outlook for Swedish exports remains bright
The prospects for ongoing robust export growth are good. Both the global economy and demand for Swedish exports in the world market remain strong. Exports are rising steadily to all major regions, particularly Europe by virtue of its vigorous economy, except the United States. The European economy is more stable now that it is transitioning from having been driven mainly by external demand to increasingly being driven by domestic demand. A total of 70 per cent of Swedish exports goes to European countries.
Figure 3.2 World market growth and growth in Swedish exports

Sources: Statistics Sweden and Ministry of Finance.
Given high sales and earnings in 2006, Swedish firms find themselves in a strong financial position. The high sustained level of industrial activity is particularly benefiting the industrial sector, and the engineering sector is especially optimistic.
The competitiveness of the industrial sector is strong. In both national and common currency, the sector’s unit labour cost has trended downward compared to other countries since the early 1990s (see Figure 3.3 below). The reason is that Sweden has enjoyed higher productivity growth and the krona has depreciated for a long time.
The NIER Investment and Intermediate Goods Survey points to persistence of strong export growth. The Purchasing Managers Index also suggests that industrial activity will remain brisk.
Exports of finished goods such as motor vehicles, telecom products and pharmaceuticals grew very rapidly, particularly in late 2006. The trend is expected to generally proceed in 2007, if somewhat more leisurely than in 2006.
Firms in the basic industries are also enjoying solid export growth, and survey statistics suggest that they will continue to do so. But exports of primary products are expected to slow down more than exports of finished goods in 2007. For instance, exports of petroleum products are
25
set to taper off significantly in 2007 in the wake of supply restrictions following very rapid growth in 2006
Exports of goods are likely to grow steadily throughout the forecast period, though gradually decelerating due to a cooling down of the global economy and an appreciation of the krona. Exports of goods are forecast to rise by 6.9 per cent in 2007 and 6.1 per cent in 2008.
Figure 3.3 Unit labour cost in Swedish industry compared to 14 OECD countries
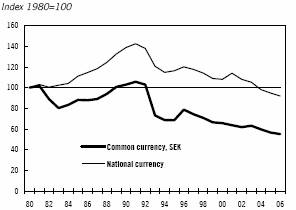
Sources: Statistics Sweden, NIER and Ministry of Finance.
Exports of services growing at a healthy clip
While exports of services grow in line with exports of goods, the trend for the past ten years has been a somewhat faster services growth. As a result, services accounted for 26 per cent of total exports in 2006 – up 6 percentage points since 1996.
Exports of services rose by 12 per cent in 2006, and the healthy increases are expected to continue in 2007. Brisk world trade has led to a rapid upturn in exports of transport services and to greater exports of business services. Export of travel and tourism (expenditures of foreign visitors in Sweden) has also benefited from the robust global economy, which is increasingly dependent on household consumption growth. Like exports of goods, exports of services are expected to grow more modestly in the next few years as the global economy cools off and the krona appreciates.
Net trade in services has been positive in recent years, and exports of services are projected to increase faster than imports of services during the forecast period. However, due to the appreciation of the krona, import of travel and tourism (foreign travel by Swedes and associated expenditures abroad) is likely to rise a little faster than export of travel and tourism in 2008.
Exports of services are expected to grow by 7.4 per cent in 2007 and 6.9 per cent in 2008.
Table 3.2 Exports of goods and services and change in export prices
| | SEK billion | | Percentage change in volume | |
| | 2006 | | 2006 | | 2007 | | 2008 | | 2009 | | 2010 | |
Exports of goods | | 1 051 | | 8.0 | | 6.9 | | 6.1 | | — | | — | |
Processed goods | | 878 | | 8.3 | | 7.5 | | 6.7 | | — | | — | |
Exports of services | | 367 | | 12.0 | | 7.4 | | 6.9 | | — | | — | |
Total exports | | 1 418 | | 9.1 | | 7.0 | | 6.3 | | 6.3 | | 6.0 | |
Export prices | | — | | 2.7 | | -0.7 | | -0.3 | | 1.0 | | 1.2 | |
Sources: Statistics Sweden and Ministry of Finance.
Export prices to fall again
Due primarily to rising petrol and metal prices, along with the weaker krona, export prices have increased over the past two years. As primary product prices fall back and the krona appreciates, export prices are expected to retreat in 2007-2008.
After rising substantially in late 2006, metal prices are expected to decline during 2007. However, demand for metals remains robust, and the decline is not likely to be as steep as the increases in 2005-2006.
The expected appreciation of the krona during the forecast period should exert pressure on firms to hold down the prices of their products so as not to compromise competitiveness. But once again, the price cuts should be limited by the heavy demand that many firms are still encountering. Although primary product costs have risen considerably for a number of years and production costs are thereby higher, some firms are still able to pass part of the increase on to their customers by raising prices. For instance, big steel companies have announced hikes this spring. Export prices are expected to fall by 0.7 per cent in 2007 and 0.3 per cent in 2008. Partly due to the diminished impact of the stronger krona, export prices will probably recover somewhat in the medium term, rising by 1.0 per cent in 2009 and 1.2 per cent in 2010.
26
3.2 Investment
Robust growth of investment for the past three years
Investment has risen at an accelerating pace since 2003 (see Figure 3.4), and the brisk investment activity has spilled over to more and more of the total economy. Growth of investment averaged 7.6 per cent in 2004–2006, including 8.2 per cent in 2006. Not since the late 1980s has investment grown so rapidly for three consecutive years.
Figure 3.4 Investment
Sources: Statistics Sweden and Ministry of Finance.
Investment will grow steadily
Persistently high capacity utilisation and the financial strength of firms are set to spur growth of investment going forward. The government’s economic policies, which are expected to boost employment and thereby capital expenditure requirements by firms, should promote continuation of solid growth of investment. But a growing number of firms are likely to have expanded their output capacity over the next year while global demand tapers off. As a result, growth of investment is predicted to gradually decelerate in 2007 and 2008. Total investment is projected to increase by 5.6 per cent in 2007, 3.4 per cent in 2008 (see Table 3.3), 2.3 per cent in 2009 and 2.7 per cent in 2010. Investment is expected to account for 18.3 per cent of GDP, the highest percentage since 1991, at the end of 2010 (see Figure 3.5).
Figure 3.5 Investment as a percentage of GDP
Sources: Statistics Sweden and Ministry of Finance.
Investment by goods producers growing rapidly again
The upswing in exports that began in 2003 has claimed a growing share of industrial sector output capacity (see Figure 3.6), generating a need for greater investment – particularly on machinery. Investment in machinery in the industrial sector advanced vigorously during 2005, above all in the paper products industry. Once the paper products industry started up the machinery in autumn 2005, investment decreased sharply and moderated the increases for the industrial sector as a whole in 2006. Nevertheless, machinery investment continued to grow steadily in other sub-sectors during 2006 and brought the total figure for the industrial sector to 2.3 per cent.
Figure 3.6 Capacity utilisation in the industrial sector
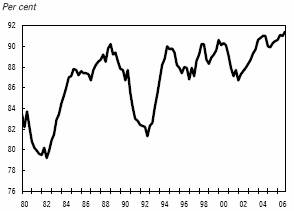
Source: Statistics Sweden.
Despite the vigorous investment activity of recent years, persistently strong foreign demand and rising domestic demand has propelled capacity utilisation to a record high since measurements
27
began in 1980. New orders to the industrial sector remain high, both foreign and domestic demand are strong, interest rates are relatively low and corporate profits are growing briskly. Thus, the prospects are bright for continuation of rapid growth in investment.
The Statistics Sweden Business Investments survey points to a sharp upswing in 2007. The majority of sectors, most notably the chemical and mining industries, are planning for increased investment. Investment in the paper products industry is also expected to increase somewhat, while the construction component of investment in the industrial sector should taper off.
The global economy is set to slow down in 2007–2008, and Swedish exports are likely to cool off. Thus, demand for Swedish-made goods will probably decline somewhat, as reflected in progressively lower expectations by the manufacturing industry for orders from the export market. The need for investment on machinery should also ebb in the longer term.
Investment in the industrial sector is expected to grow briskly in 2007 but slow down somewhat in 2008.
Particularly in view of major efforts by electricity suppliers to boost generation and improve supply, rapidly increasing investment in the energy sector over the past few years is likely to continue.
Table 3.3 Investment
Percentage change
| | 2006 | | 2007 | | 2008 | | 2009 | | 2010 | |
Business sector | | 6.1 | | 4.8 | | 4.6 | | — | | — | |
Producers of goods | | 6.1 | | 8.1 | | 5.9 | | — | | — | |
Producers of services | | 6.1 | | 2.1 | | 3.4 | | — | | — | |
Housing | | 16.5 | | 10.1 | | -1.5 | | — | | — | |
General government | | 8.7 | | 4.1 | | 4.4 | | — | | — | |
Central government | | 8.2 | | 7.2 | | 5.7 | | — | | — | |
Local government | | 9.2 | | 0.9 | | 3.0 | | — | | — | |
Total | | 8.2 | | 5.6 | | 3.4 | | 2.3 | | 2.7 | |
Sources: Statistics Sweden and Ministry of Finance.
According to the NIER Business Tendency Survey, expectations in the construction industry have dimmed somewhat of late. While firms believe that new orders and construction will grow further, fewer and fewer anticipate an improvement in the construction market over the next 12 months. But investment in housing is expected to increase substantially in 2007, while construction in the property management sub-sector and the general government sector has taken off. Given solid new orders and a broader-based upswing in construction activity, investment by the construction industry is thereby expected to rise steadily in 2007 and 2008.
Investment by goods producers is predicted to climb by 8.1 per cent in 2007 and 5.9 per cent in 2008 (see Table 3.3).
Investment by service producers will slow down
Investment in the service sector – particular financial services and property management, as well as post and telecommunications – rose steadily in 2006.
Investment in wholesale and retail trade also grew at a healthy pace in 2006, and robust consumption growth is likely to give it an additional boost in 2007–2008. For instance, new department stores are opening in several market segments, including building supplies and home furnishings. Investment in household services is also forecast to grow at a good clip in 2007 and 2008.
After declining for three years, investment in the property management sub-sector (excluding housing) rose in 2005 and took off even more in 2006. Rapidly expanding household consumption is fuelling most of the investment, including new construction and expansion of shopping centres, in this sector as well. As a result, investment in the property management sub-sector is expected to grow steadily in 2007 and 2008.
Due particularly to construction of 3G networks, investment in post and telecommunications rose sharply in 2006. The networks should be completed by 1 June 2007. Construction of networks in the 450 MHz band, which will improve mobile phone coverage in sparsely populated areas, is also likely to be completed this summer. Thus, investment in the sector is expected to taper off during the latter half of 2007 and 2008.
Excluding vessels and aircraft, investment in the transport sector declined somewhat in 2006. The NIER Business Tendency Survey reflects considerably weaker demand for transport services recently. Thus, investment activity is set to remain sluggish in 2007.
Investment by service producers is projected to increase by 2.1 per cent in 2007. Owing
28
particularly to strong employment growth in the service sector, the figure is expected to rise to 3.4 per cent in 2008.
General government investment rising steadily
Investment in central and local government rose sharply in 2006. The machinery component of investment grew the most in central government, while buildings were the largest component in the local government sector.
Major infrastructure improvements by the National Rail Administration and National Road Administration over the next few years will contribute to rapid growth in central government investment in both 2007 and 2008. Among the Rail Administration projects are the Bothnia Line, the Malmö City Tunnel and the tunnel through Hallandsås. Road Administration projects include the Northern Link and the extension of the E45 European motorway. Following a sharp upswing in local government investment during 2006, its growth is likely to decelerate somewhat in 2007.
General government investment is expected to increase by 5.1 per cent in 2007 and 5.3 per cent in 2008.
Investment in housing will remain strong
Largely due to an increase in housing construction, activity in the construction industry has risen steadily in recent years. Housing starts averaged 19 per cent annual growth in 2002–2005 (see Figure 3.7).
The Government Budget Bill for 2007 proposed the elimination of state interest subsidy and investment grant as of 1 January 2007. As a result, an estimated 7,000–8,500 housing starts were accelerated. Preliminary data from Statistics Sweden indicates that housing starts rose by approximately 40 per cent in 2006 to more than 44,500.
While construction activity remains brisk, longer-term expectations for the construction market are more cautious. One indicator of residential construction activity for the next six months is the number of building permits granted. Permits were granted for approximately 24,500 units in the latter half of 2006, an increase of more than 40 per cent from 12 months earlier. Even disregarding accelerated housing starts, the rapid increase in permits points to persistent residential construction growth.
Figure 3.7 Housing starts
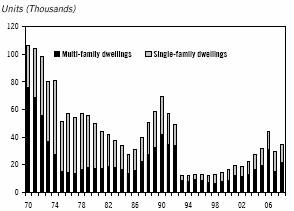
Sources: Statistics Sweden and Ministry of Finance.
Demand for housing is high. According to the National Board of Housing, Building and Planning Housing Market Survey for 2007, 42 per cent of municipalities report housing shortages, as opposed to 11 per cent in the late 1990s. Net influx to those municipalities totalled approximately 39,000 people in 2006, while overall population growth was approximately 57,000. Housing demand is also set to increase going forward. The Board predicts that demographic trends, particularly the entry of people born in the 1980s into the housing market, will ensure a rapid increase in the number of Swedish households until 2010. The size of the 20–24 year old population remained largely unchanged in 1999–2005. But the Statistics Sweden population forecast anticipates that its numbers will swell by almost 20,000 annually until 2010. Low interest rates, as well as healthy increases in household disposable income and financial assets, are also contributing to the growing demand for housing.
Robust demand is pushing up housing prices. For instance, prices of single-family dwellings were more than 9 per cent higher in February 2007 than 12 months earlier. Prices of owner-occupied flats are also up sharply over the past year. As reflected in higher Tobin’s q values, steep prices and lower relative costs are making it lucrative to build.(5)
(5) Tobin’s q measures the relationship between the price of a used single-family dwelling and the production cost of a new single-family dwelling of a similar standard. A Tobin’s q greater than 1 indicates that it is lucrative to build a new home. The national average for Tobin’s q was around 1 in 2006. But it was much higher in urban regions – close to 1.5 in Stockholm County.
29
Despite strong demand and solid profitability, rising interest rates and costs are expected to depress residential construction growth. Interest rates are likely to increase in 2007–2008, blunting the appetite of households to buy. The production costs of construction firms represent a pivotal factor. Production costs increased by just over 3 per cent annually in 2000–2005. But price hikes gradually accelerated in 2006, and production costs were 6.4 per cent higher in February 2007 than 12 months earlier. While building materials account for the greatest increases, costs for property developers(6) have also risen in the wake of higher interest costs. Rising interest rates should contribute to steadily higher costs for property developers. Accelerating wage growth should also contribute to mounting production costs. Wages in the construction industry are projected to increase by 4.4 per cent in the next few years, as opposed to 3 per cent annually in 2004–2006.
Housing starts are expected to decrease to 29,000 in 2007 in the wake of accelerated projects, followed by 36,000 in 2008.
Due largely to renovation of housing built as part of the Million Homes Programme, refurbishment is also expected to exhibit rapid growth.
Given increases in new construction and refurbishment, total investment in housing should rise by 10.1 per cent in 2007. Owing to accelerated housing starts, the figure is expected to decline by 1.5 per cent in 2008.(7)
3.3 Stockbuilding
Inventories did not affect GDP growth in 2006
GDP growth was not significantly affected by total stockbuilding in 2006. Heavy stockbuilding of standing timber offset large withdrawals from industrial sector inventories of intermediate goods, as well as inventories in wholesale and retail trade.
Industrial sector will replenish inventories in 2008
When foreign demand for Swedish goods recovered in the latter part of 2005, finished goods inventories in the industrial sector dwindled considerably. As a result, a growing number of firms regarded their inventories as insufficient. Industrial output speeded up in 2006 while withdrawals from finished goods inventories continued. As export growth tapers off in 2007 and 2008, the industrial sector is expected to replenish its finished goods inventories.
Industrial sector inventories of intermediate goods have shrunk since 2002. The ongoing trend toward application of the just-in-time concept, which dictates lower inventories of intermediate goods, provides some of the explanation. But the delivery times of suppliers have lengthened recently, and imports of primary products have been sluggish. Meanwhile, export demand has been brisk and industrial output has risen. As a result, firms consider inventories of intermediate goods to have reached a low level. As exports cool off, the decrease in inventories of intermediate goods is set to slow down in 2007. But the industrial sector is likely to replenish them in 2008.
Inventories in wholesale and retail trade, particularly primary products, fell sharply in 2006. Assessments of inventories in wholesale and retail trade are low now, suggesting a desire to replenish them. Given strong domestic demand going forward, inventories are likely to continue dwindling in 2007 and 2008 but at a somewhat slower pace.
Stockbuilding of standing and felled timber is returning to normal levels after the severe storm of January 2005. There were large withdrawals from felled timber in 2006, while inventories of standing timber began to increase. The trend is likely to continue, particularly when it comes to felled timber.
Inventories will boost GDP growth in 2008
A negative contribution to GDP growth by timber inventories is expected to offset a positive contribution by inventories in the industrial sector and wholesale and retail trade in 2007. In other words, the overall impact on GDP growth of 2007 inventory adjustments is forecast to be neutral. Stockbuilding in the two sectors is projected to contribute 0.1 percentage points to
(6) Interest, credit, planning and administrative costs.
(7) For housing, which often takes a long time to build, total investment value is distributed over time in the National Accounts. The amount of investment entered for a period corresponds to the percentage completed during the period. Given that housing starts are expected to be lower in 2007 due to the acceleration of certain projects and it takes an average of 1½ years to complete a block of flats, residential construction investment is likely to decrease in 2008.
30
GDP growth in 2008. Inventory adjustments are not likely to affect GDP growth in 2009 and 2010.
3.4 Household consumption
Stable consumption growth in 2006
Household consumption trends were very weak in 2001, but household consumption growth has accelerated year by year to 2.8 per cent in 2006. Rising disposable income, as well as increases in the value of real and financial assets, has fuelled the growth. The brightening outlook for the labour market since mid-2005 has contributed as well.
Consumption of goods, particularly food and home electronics, exhibited the most rapid growth in 2006. Meanwhile, consumption of electricity, gas and heating decreased significantly.
Excellent prospects for strong consumption
Real household disposable income rose by 2.0 per cent in 2006. In addition to substantially higher interest expenditure, rising capital gains from 2005 to 2006 moderated the growth. The reason is that the National Accounts include capital gains taxes, but not the gains themselves, in the definition of disposable income. The wallet version of disposable income (see explanatory box on next page) excludes capital gains taxes in order to provide a fairer assessment of how households experience changes in their income.
At 5.7 per cent in real terms, growth of household disposable income is expected to be sharply higher in 2007 than 2006. The strong labour market is set to contribute an equally robust increase in hours worked as 2006, while hourly wages are likely to rise more quickly. Thus, aggregate wage bill is forecast to grow more quickly than in 2006. However, social benefits from the general government sector to households should decrease in 2007. Given a strengthening labour market and a reduction in the level of unemployment benefits, unemployment-related social benefits are expected to shrink the most. Social benefits related to ill health are also set to decrease from 2006 to 2007. Growth of other income, such as from owner-occupied dwellings, is expected to be relatively vigorous in 2007.
Table 3.4 Household disposable income
Percentage change, current prices
| | SEK billion | | | | | | | | | | | |
| | 2006 | | 2006 | | 2007 | | 2008 | | 2009 | | 2010 | |
Wage bill(1) | | 1 137 | | 5.4 | | 6.1 | | 5.5 | | 4.9 | | 4.5 | |
Number of hours worked | | — | | 2.0 | | 1.8 | | 0.9 | | 0.2 | | -0.1 | |
Hourly wages(2) | | — | | 3.3 | | 4.3 | | 4.6 | | 4.7 | | 4.6 | |
General government transfers | | 497 | | 1.7 | | -0.2 | | 2.6 | | 4.5 | | 4.7 | |
Other income | | 299 | | 1.5 | | 4.7 | | 4.4 | | 4.9 | | 5.3 | |
Taxes and charges | | -556 | | 4.9 | | -1.9 | | 5.3 | | 5.5 | | 5.1 | |
Nominal disposable income | | 1 377 | | 3.3 | | 6.8 | | 4.3 | | 4.6 | | 4.5 | |
Price index | | — | | 1.3 | | 0.9 | | 1.6 | | 2.2 | | 2.4 | |
Real disposable income | | 1 359 | | 2.0 | | 5.7 | | 2.7 | | 2.4 | | 2.1 | |
(1) The wage bill is defined as the number of hours worked multiplied by the hourly wages.
(2) According to the definition in the National Accounts.
Sources: Statistics Sweden and Ministry of Finance.
Tax cuts, primarily the earned income credit, are estimated to make the greatest contribution (SEK 40 billion) to the rapid growth of household disposable income in 2007. Other tax reforms will also help boost household disposable income. The hike in contributions to unemployment benefit funds partially offset the impact of tax cuts on household disposable income. The repeal of the wealth tax proposed by this bill boost household disposable income by an estimated SEK 5 billion.
Real disposable income in 2008 is expected to rise by 2.7 per cent, considerably more modest than 2007 but above the 1993–2006 average of 1.6 per cent. The relatively rapid growth projected for 2008 is primarily due to persistently strong labour market trends.
Nominal disposable income is forecast to increase by 4.6 per cent in 2009 and 4.5 per cent in 2010. But because the consumption deflator is likely to rise fairly quickly both years, real disposable income growth is set to be a modest 2.4 per cent in 2009 and 2.1 per cent in 2010.
31
Revised method for calculating the wallet version of household disposable income
The Government Budget Bill for 2007 presented an initial method for calculating household disposable income that better reflects how households experience changes in their income. A revision to the calculation has now added the impact on household disposable income of financial intermediation services indirectly measured (FISIM) to the factors that are excluded.
The Government Budget Bill for 2007 explained the reasons for a wallet version of household disposable income. Certain adjustments to the concept of household disposable income as defined by the National Accounts are needed in order to better describe how households experience changes in their income. As opposed to the principles applied in the National Accounts, the wallet version excludes capital gains taxes, operating surplus from owner-occupied dwellings, interest for individual insurance policies and the yield tax. In addition to using differing measures of income, the National Accounts deflate disposable income with the implicit price index for household consumption, while the wallet version deflates it with the Riksbank’s index of underlying inflation (UND1X).
FISIM is the portion of the net interest income of banks that is reported as production. FISIM did not previously affect GDP, but a change to accounting principles in autumn 2005 led to an upward annual adjustment of approximately 1 percentage point. However, growth rates were not significantly affected. As a result of the change, household disposable income and consumption were adjusted by the same amount. In other words, FISIM did not affect the household saving ratio.
Nevertheless, the reporting of FISIM can render the very concept of disposable income misleading as an indicator of how households experience changes in their income. Interest income and expenditure affect that experience whether or not they are classified as FISIM. Thus, excluding the impact of FISIM on household disposable income in accordance with the National Accounts is an appropriate way of better assessing the experience.
Real disposable income – National Accounts vs. the wallet version
Percentage change
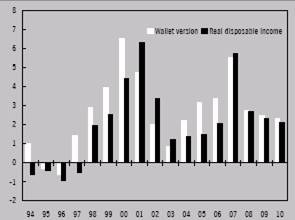
Sources: Statistics Sweden and Ministry of Finance.
The above figure shows changes to real disposable income in accordance with the National Accounts and the wallet version. The two methods may generate distinctly different results for a particular year. For instance, the wallet version grew a good deal faster in 2006 than the National Accounts definition suggests. The underlying reason was that capital gains increased substantially from 2005 to 2006, thereby reducing disposable income growth as defined by the National Accounts. In adjusting for that effect, the wallet version generates a higher rate of growth for household income. Because capital gains are expected to decrease from 2006 to 2007, the wallet version of disposable income rise slower this year than in the National Accounts definition.
32
Figure 3.8 Household disposable income and consumption
SEK billion, constant prices, reference year 2005
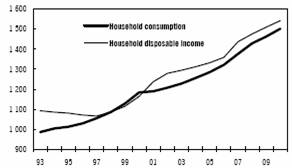
Note: From 2000 is the Church of Sweden included in the household sector. Sources: Statistics Sweden and Ministry of Finance.
Besides the fact that household disposable income has increased and is expected to continue upward at a healthy clip, consumption is benefiting from the rapid growth in the value of household financial assets over the past few years. Households realised some of the value growth in 2006 by selling equities and funds and depositing the proceeds in bank accounts.
Household assets are not simply financial, but include single-family dwellings and tenant ownership rights. The value of the housing assets appreciated by an estimated 12 per cent in 2006 to approximately SEK 3,700 billion at the end of the year. The prices of single-family dwellings have been rising for more than a decade. The very high rate of growth in early 2006 has subsequently decelerated somewhat. The value of tenant ownership rights has also increased in the past ten years. Recent interest rate hikes do not appear to have noticeably moderated housing prices yet.
Figure 3.9 Household debt
Per cent
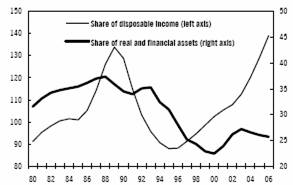
Sources: Statistics Sweden, The Swedish Financial Supervisory Authority and Ministry of Finance.
Household debt has also continued upward. The tendency is closely related to the upturn in housing prices. Household debt rose by almost 11 per cent in 2006. Debt as a percentage of disposable income has risen to above the levels of the late 1980s and early 1990s (see Figure 3.9). Due to both higher housing prices and the bull market of the past few years, debt as a percentage of household real and financial assets has not increased to anywhere near the same degree.
Households have benefited for several years from low, albeit recently rising, interest rates. Although rates are expected to proceed upward during the forecast period, interest expenditure should remain relatively low (see Figure 3.10). The greater indebtedness of recent years and the large percentage of borrowing at variable rates have left households vulnerable to major interest rate fluctuations.
Figure 3.10 Household interest expenditure
Per cent of disposable income
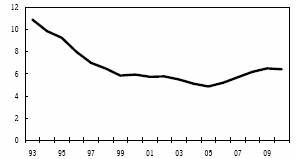
Note: The interest expenditures are not adjusted for FISIM. (see explanatory box on the following page for further explanation of FISIM).
Sources: Statistics Sweden and Ministry of Finance.
Indicators point to strong consumption growth
Available indicators suggest relatively rapid consumption increases in the coming months. According to the NIER Household Survey, households expect that their own finances, the Swedish economy and the labour market will all do very well over the next year. The NIER Business Tendency Survey reports ongoing growth of retail sales and optimism about the future. Statistics Sweden and the Swedish Research Institute of Trade Retail Sales Index shows that growth has been particularly robust in consumer durables recently but considerable in consumer non-durables as well.
33
Rapid consumption growth during forecast period
The steady consumption growth of the past few years is likely to continue during the forecast period.
The substantial disposable income growth predicted for 2007, the second largest in 25 years, is the main reason that household consumption is set to increase so rapidly.
The state of the labour market is integral to the magnitude of consumption growth in the next few years (see Figure 3.11). Employment has been rising rapidly and is expected to continue sharply upward in 2007 and 2008. Apart from affecting household income, rising employment contributes substantially to consumer confidence and thereby their propensity to consume rather than save.
Figure 3.11 Employment and household consumption
Annual percentage change
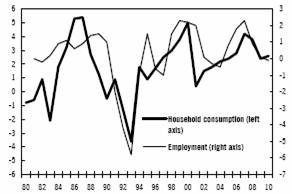
Sources: Statistics Sweden and Ministry of Finance.
Household consumption is expected to rise by 4.2 per cent in 2007 and 3.8 per cent in 2008.
Given persistently healthy income increases, a strong wealth position and high initial saving, the outlook for strong consumption growth is also bright in the medium term. Household consumption is forecast to rise by 2.4 per cent in 2009 and 2.6 per cent in 2010, somewhat faster than the average since 1980.
Household savings
Household savings totalled SEK 38 billion, or 2.8 per cent of disposable income, in 2006.
An increase to SEK 62 billion, or 4.2 per cent of disposable income, is projected for household saving in 2007. Net saving in supplementary pension schemes (including savings in the premium pension system) is projected to be SEK 82 billion, generating a total saving ratio of 9.3 per cent.
Figure 3.12 Household saving
Per cent of disposable income
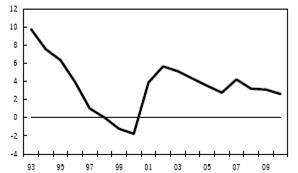
Note.: Own savings is household net savings excluding savings in supplementary pension schemes and the premium pension system.
Sources: Statistics Sweden and Ministry of Finance.
As the result of strong income growth, household saving is set to increase rather significantly from 2006. But the saving ratio is likely to decline steadily in 2008–2010.
3.5 General government consumption
General government consumption(8) averaged 0.8 per cent growth in 2000–2005. Preliminary figures for 2006 show general government consumption growth of 1.8 per cent, the lion’s share in the local government sector. In current prices, general government consumption in 2006 accounted for 27 per cent of GDP, 19 percentage points of which was attributable to the local government sector. General government consumption is expected to increase by 1.4 per cent in both 2007 and 2008, followed by an annual average of 0.5 per cent in 2009 and 2010.
(8) As of 2000, the Church of Sweden was reclassified from the local government to household sector. To ensure comparability, it has been excluded from the statistics for previous years as well.
Local government consumption growing rapidly
Local government consumption averaged 1.3 per cent annual growth in 2000–2005. During the first three years, the sector averaged 1.8 per cent
34
increases and had a negative cumulative financial result(9) of SEK 4 billion. The local government sector adopted a cost-cutting plan in 2003 to curb its spiralling expenditures. The effort to consolidate finances made an impact in 2004, and the sector’s financial result was positive. The adoption of the balanced budget requirement in 2000, along with the demand for sound economic management, appears to have helped restrain local government consumption.
The local government sector’s financial result in 2005 was SEK 13 billion, a considerable improvement over previous years. Along with higher central government grants and a stronger tax base, the consolidation effort has firmed up local government sector finances. Preliminary figures for 2006 indicate a continued high financial result of SEK 15 billion for the sector as a whole.
According to preliminary figures, local government consumption rose by 2.0 per cent in 2006. Value added was up by 1.3 per cent. A 4.3 per cent increase in social transfers in kind made a major contribution to favourable consumption trends. Social transfers in kind are made up of general government purchases of goods and services (from market producers) that are provided to households with no further transformation in production within the general government sector.(10)
At 1.8 per cent, consumption growth in the local government sector is expected to be relatively strong again in 2007. The primary reason is that the sector’s incomes from taxes and central government grants are likely to continue growing at a healthy pace, thereby creating greater fiscal latitude for consumption (see section 5.6). As in 2006, social transfers in kind are projected to rise faster than total consumption. Thus, the trend for the local government sector to rely on market producers is set to continue accelerating.
Local government consumption is forecast to increase by 1.7 per cent in 2008. The migration policy measures announced in this bill will boost the consumption figure. Excluding those measures, consumption trends are expected to be somewhat weaker as the result of smaller income increases than 2007.
Given that the calculation assumes that central government grants will be nominally unchanged in 2009 and 2010, annual consumption growth should be limited to an average of 0.7 per cent during that period.
The bonus job scheme has boosted local government consumption in 2006 and 2007. The phase-out of the scheme in 2008 and 2009 will have the opposite effect. Bonus jobs affect hours worked in the sector, and thereby both output and consumption.
Modest growth of central government consumption
Average annual central government consumption remained essentially unchanged throughout 2000–2005. Consumption in constant prices rose by a slight 0.3 per cent from SEK 197 billion in 2000 to SEK 198 billion in 2005. But year-to-year variations, a significant percentage of which was attributable to defence, were relatively large – from a decrease of 3 per cent in 2000 to an increase of 3 per cent in 2002.
Preliminary figures for 2006 show central government consumption rising by 1.0 per cent in constant prices. Payroll expenses were up by a slight 0.1 per cent. Value added increased by 0.6 per cent. Social transfers in kind grew by a robust 6.0 per cent.
The appropriations announced in the Government Budget Bill for 2007 for purposes such as due process, international operations and research are set to boost central government consumption by 0.5 per cent in 2007. The dental care reform and the proposal in this bill for increased appropriations to the Migration Board, etc., should contribute to 0.4 per cent consumption growth in 2008. Consumption is forecast to increase by an average of 0.1 per cent in 2009 and 2010.
3.6 Imports
Imports of goods rose substantially in 2006
Imports of goods were up in 2006 by 7.6 per cent, or 1.5 percentage points above the average for the past ten years. Both rapid export growth, thereby increasing the need for imports, and
(9) Excluding extraordinary items.
(10) Such goods and services include privately owned old-age homes, prescription drugs and dental care, and privately owned or cooperative preschools.
35
robust domestic demand explain the strength of the trend. Excluding textiles, clothing and footwear, imports of capital and consumer goods rose sharply in 2006. Probably due in part to substantial price hikes in 2006, petroleum products and crude – which account for more than 10 per cent of the import of goods – were down by approximately 5 per cent. Despite rapid price increases, imports of metals averaged approximately 10 per cent growth.
Prices of imported goods expected to decline
The prices of finished goods such as textiles, wood products and metalware rose slightly in 2006. Meanwhile, the prices of telecom products, office machines and computers continued downward by almost 10 per cent. All in all, the prices of imported goods rose relatively much in the wake of substantial hikes on crude, petroleum products and other primary products such as metals. Although the prices of finished goods are up somewhat during the past two years, import prices have exhibited more modest increases than the prices of Swedish-made goods. As a result, importing finished goods has become a more lucrative venture despite the depreciation of the krona.
Appreciation of the krona over the next few years is expected to be accompanied by lower import prices in both 2007 and 2008. Along with a declining world market price of oil, a stronger krona against the dollar should lead to a pronounced turnaround for petroleum product and crude prices from 2006 to 2007. After having risen by approximately 20 per cent in 2006, they are forecast to retreat by almost the same percentage in 2007. The price of metals is projected to decline in the course of 2007 as global demand for them cools off somewhat and inventories are replenished. But the prediction is associated with a high degree of uncertainty.
Demand for imported goods will remain robust
Both exports and industrial output are expected to enjoy steady, albeit decelerating, growth in both 2007 and 2008. Household consumption is set to be vigorous both years. Inventories, which firms regard as insufficient to boost output enough to satisfy demand, will need replenishment. Such a shortage would help boost imports. Brisk economic activity in Sweden is expected to ensure persistently strong import growth over the next two years. Demand for imported goods is likely to be robust, due partly to the fact that a stronger krona will restrain their price hikes compared to Swedish-made goods.
Table 3.5 Imports of goods and services and change in import prices
| | SEK billion | | Percentage change in volume | |
| | 2005 | | 2006 | | 2007 | | 2008 | | 2009 | | 2010 | |
Imports of goods | | 827 | | 7.6 | | 7.9 | | 7.3 | | — | | — | |
Finished goods(1) | | 620 | | 9.7 | | 9.5 | | 8.3 | | — | | — | |
Imports of services | | 270 | | 8.5 | | 6.5 | | 5.1 | | — | | — | |
Total imports | | 1 097 | | 7.8 | | 7.6 | | 6.7 | | 6.7 | | 6.7 | |
Import prices | | | | 3.5 | | -2.1 | | -1.0 | | 0.8 | | 1.1 | |
(1) Classification according to SNI.
Sources: Statistics Sweden and Ministry of Finance.
Now that crude imports have fallen for three consecutive years, oil inventories are low. Meanwhile, import prices of crude are expected to decline sharply. As a result, refineries are likely to replenish their oil inventories, thereby boosting crude imports in 2007. Although crude does not account for a large percentage of imports of goods, it affects the total when there are major fluctuations in the rate of its import growth.
Imports of goods are expected to increase by a total of 7.9 per cent in 2007 and 7.3 per cent in 2008.
Imports of services continue to rise steadily
Imports of services were up by a robust 8.5 per cent in 2006. Business services exhibited the strongest growth, while transport services increased at a fast pace as well. Consisting of consultancy, banking, licenses and patents, business services account for almost half of imports of services. Both transport and business services correlate with goods imports.
Persistently strong domestic demand, solid growth of goods imports and an appreciation of the krona should ensure that imports of services continue to rise during the forecast period – though probably at a more deliberate pace in 2007-2008, given that that both business and
36
transport services correlate with world trade and the global economy is set to cool off. However, import of travel and tourism (foreign travel by Swedes and associated expenditures abroad) is projected to rise as the krona strengthens and household consumption expands.
Imports of services are expected to grow by 6.5 per cent in 2007 and 5.1 per cent in 2008.
3.7 Output
Industrial activity remains brisk
Swedish industrial activity speeded up in winter 2005/2006. The main driver was strong demand for Swedish products abroad, generating high export growth in the first quarter of 2006 (see Figure 3.13). After slowing down in the second quarter, industrial output growth got a second wind as exports of goods took off again. Industrial output grew by 5.6 per cent in 2006 (see Table 3.6).
Figure 3.13 Industrial output and exports of goods
Annual percentage change
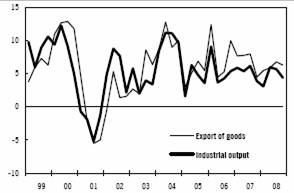
Sources: Statistics Sweden and Ministry of Finance.
Industrial output has bright initial prospects of growing further in 2007 and 2008. The major gross capital formation of recent years – including mining and the pulp, paper and paper products industries – have boosted output capacity (see Section 3.2). Moreover, low relative unit labour costs indicate that the competitiveness of the Swedish industrial sector is good (see Section 3.1).
Table 3.6 Business sector output
| | SEK billion | | Percentage change in volume | |
| | 2006 | | 2006 | | 2007 | | 2008 | | 2009 | | 2010 | |
Producers of goods | | 756 | | 5.2 | | 4.7 | | 3.8 | | — | | — | |
of which: Industry | | 519 | | 5.6 | | 5.3 | | 4.8 | | — | | — | |
Construction | | 125 | | 9.6 | | 5.8 | | 1.8 | | — | | — | |
Producers of services | | 1 174 | | 5.9 | | 4.2 | | 3.8 | | — | | — | |
Total business sector | | 1 930 | | 5.6 | | 4.4 | | 3.8 | | 2.5 | | 2.8 | |
Note: Output refers to value added, i.e. gross output minus input goods.
Sources: Statistics Sweden and Ministry of Finance.
As the global economy cools off somewhat in 2007 and 2008, demand for Swedish goods is not expected to grow as fast as in 2006. The resulting slowdown in export growth should help moderate the expansion of industrial output. The NIER Business Tendency Survey corroborates that assessment. According to the survey, new orders from the export market have been high in early 2007 but not at the same level as during much of 2006 (see Figure 3.14). Expectations for both new orders and output also suggest that actual industrial output will cool off somewhat. Total industrial output is forecast to increase by 5.3 per cent in 2007 and 4.8 per cent in 2008.
Figure 3.14 Inflow of new orders from the export market to the manufacturing industry
Seasonaly adjusted values
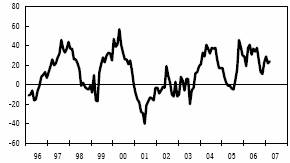
Note: The graph shows the difference between the percentage of firms reporting increased and decreased flow of new orders.
Source: NIER.
Construction activity will gradually slow down
Construction output has grown rapidly since 2004, and the 9.6 per cent increase in 2006 was the highest for over 25 years. Among the reasons for the high rate of growth were an ongoing expansion of gross capital formation in housing, as well as a sharp upswing in local government
37
gross capital formation in buildings and construction of commercial premises.
The NIER Business Tendency Survey indicates that construction activity in early 2007 has been very brisk, characterised by continued increases in new orders, employment and construction alike. Although the survey has long pointed to a palpable manpower shortage in the construction industry, particularly residential construction, the impact on output growth appears to be limited so far. Thus, construction activity has remained vigorous despite insufficient resources. But the expectations of construction firms for the next 12 months indicate that activity will cool off in 2007. As residential construction rises and levels off, output growth in the construction industry is expected to slow down. In the medium term, higher interest rates should also contribute to the more deliberate pace. Construction output is forecast to increase by 5.8 per cent in 2007 and 1.8 per cent in 2008.
Households spurring production of services
Production in the service sector expanded by 5.9 per cent in 2007. The strength of the upswing was primarily due to rapid growth in the production of business services. Production of other services, such as financial services and wholesale and retail trade, also showed vigorous increases and contributed to the favourable trend for the sector as a whole.
The NIER Business Tendency Survey indicates that many private service sub-sectors have continued to enjoy rising demand in early 2007 but that the increases have not been as robust as during the latter part of 2006 (see Figure 3.15). The survey also suggests that retail sales are rising somewhat slower than 2006. Nevertheless, overall conditions remain propitious and the wholesale and retail confidence indicator is still comparatively high.
Figure 3.15 Demand for private services
Seasonally adjusted values
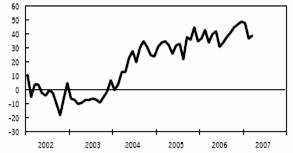
Note: The graph shows the difference between the percentage of firms reporting increased and decreased demand.
Source: NIER.
Given demand changes in the total economy, production growth in the service sector is expected to be somewhat less vigorous in 2007 and 2008 but remain high. Production of business services is likely to cool off. These services are being largely driven by domestic demand from the industrial sector, as well as the construction and contracting industry, not to mention demand for Swedish services abroad. Given slower growth in the industrial sector, construction activity and exports of services in 2007 and 2008, the production of associated businesses services is also expected to taper off. Rising household consumption should help ensure rapid ongoing production growth in wholesale and retail trade and household services, as well as other services such as hotel and restaurant. Production growth for the service sector as a whole is projected at 4.2 per cent in 2007. Demand is likely to slow further in 2008 and help push the growth in production of services down to 3.8 per cent.
Demand changes in the total economy should moderate business sector output but leave it comparatively high during the forecast period. Total business sector output is expected to increase by 4.4 per cent in 2007, 3.8 per cent in 2008, 2.5 per cent in 2009 and 2.8 per cent in 2010.
General government output
General government output consists mostly of total compensation of employees, the changes to which are due to employment measured as hours worked. Payroll expenses averaged 86 per cent of general government output in 2000–2006.
38
The business sector has taken over a growing share of the production of welfare services since the early 1990s. Publicly financed services have been contracted out and the number of temporary workers has increased, while hospitals and preschools have been privatised or corporatised. As a result of such structural changes, consumption has expanded faster than output. General government output averaged 0.6 per cent, while general government consumption averaged 0.9 per cent, growth in 2000–2006.(11) The trend is expected to continue in the next few years.
(11) As of 2000, the Church of Sweden was reclassified from the local government to household sector. To ensure comparability, it has been excluded from the statistics for previous years as well.
Local government output rose by 1.3 per cent and consumption by 2.0 per cent in 2006. Consumption growth was driven by materials, services and social transfers in kind.(12) Output growth is projected at 1.6 per cent in both 2007 and 2008, followed by a cooling off period in 2009 and 2010 (see section 3.5). As a result, local government output is expected to average 0.5 per cent annual growth.
(12) Social transfers in kind are made up of general government purchases of goods and services (from market producers) that are provided to households with no further transformation in production within the general government sector. Such goods and services include privately owned old-age homes, prescription drugs and dental care, and privately owned or cooperative preschools.
Central government output, which rose by 0.6 per cent in 2006, is expected to increase by 0.7 per cent in 2007 and 0.5 per cent in 2008, followed by an annual average of 0.2 per cent in 2009 and 2010.
General government output is forecast to increase by an average of 0.9 per cent in 2007–2010.
3.8 Current account
The trend of a growing current account surplus over the past few years is expected to continue during the forecast period. Due primarily to rapid growth in exports of goods, the surplus rose by SEK 20 billion to SEK 210 billion, or 7.2 per cent of GDP, in 2006. Given steady increases in the trade and services balance, the current account balance is expected to rise further to 7.8 per cent of GDP in 2007 and 2008. In addition to trade in goods and services, the current account balance consists of current transfers (Swedish development assistance and the contribution to EU funding) and factor income (wages and return on capital). Medium-term projections anticipate small additional increases in the current account surplus to 8.0 per cent of GDP in 2009 and 7.9 per cent in 2010.
3.9 GNI
Gross national income (GNI) differs from GDP in that it also includes primary income, which is the net of taxes, wages and property income – in other words, the net of Swedish income in the rest of the world and rest of the world income in Sweden. Given positive primary income, GNI is expected to be somewhat higher than GDP in 2007. GNI is forecast to increase by 6.4 per cent in 2007 and 5.6 per cent in 2008. In current prices, GNI and GDP in current prices are each expected to grow by 4.7 percent annually in 2009 and 2010.
39
Long-term impact of the government’s policies
Achieving high sustainable employment is vital to maintaining high economic growth and stable public finances, as well as ameliorating labour market exclusion. The government has adopted and announced a number of reforms that target sustainable employment growth. This bill proposes additional reforms. The purpose of this explanatory box is to describe how the government’s economic policies are seen as affecting the direction of the economy. The reforms that are being adopted and announced are expected to make a major impact on the economy in the next few years but not have their full effect for another 5-10 years. A more fundamental, detailed discussion of labour supply and employment appears in the explanatory box entitled “Labour supply and employment”.
Incentives to work strengthened
The government has adopted and announced reforms that will increase the incentives to work. Income taxes have been cut through adoption of the earned income tax credit, while benefit levels in several social insurance systems have been lowered. But the hike in contributions to unemployment benefit funds may have somewhat of an offsetting effect. Once it becomes more lucrative to work, more people will find their way into the labour market – in other words, the supply of labour will expand. In addition, unemployed workers are expected to more actively look for jobs, leading to improved matching between labour supply and demand. The likely overall impact of the stronger incentives is that labour supply will expand and equilibrium unemployment will decrease over the long term. As a result, the reforms should generate higher sustainable employment.
A number of studies can serve as a starting point for assessing the degree to which the strengthened incentives to work will affect labour supply, unemployment and employment.(13) An overall analysis of relevant studies suggests that the reforms will boost employment by 0.9 per cent and lower equilibrium unemployment by almost 0.5 percentage points in the long term. The impact until 2010 is expected to be somewhat less, given that it will probably take longer than that for the policies to have their full effect.
(13) The research literature presents a series of estimates about how incentives to work, measured as the tax wedge, affect employment. One such study is Nickell, S & R. Layard (1999), “Labour Market Institutions and Economic Performance”, in the Handbook of Labor Economics. Its findings are in line with many of the most important studies in the area, as well as the Ministry of Finance’s assessment. But the estimated impact varies considerably from study to study. A number of studies also treat the impact on employment of changes in the level of unemployment benefits. The Ministry of Finance’s assessment is similar to the findings presented in Bassanini, A & R. Duval (2006), “Employment Patterns in OECD Countries: Reassessing the Role of Policies and Institutions”, OECD Economics Department Working Papers 486, OECD Economics Department.
Income tax reforms will also affect incentives for people with jobs to change their working hours. On the one hand, some people will probably work more once the marginal advantage of staying on the job for an extra hour is greater than before. On the other hand, some workers may prioritise more time off when tax cuts leave them with higher wages after tax. The net impact on average hours worked in the total economy is expected to be positive, and hours worked are expected to increase by 0.2 per cent more than employment.
Change in scope and direction of labour market policy programmes
The government has adopted a number of measures for a more effective labour market policy. Several programmes – including the bonus jobs, the sabbatical year, and certain employment subsidies – whose participants are defined as employed are being eliminated. Because many of the participants are expected to gain employment in the regular labour market, these changes will boost regular employment. But because not everyone will obtain a regular job, the impact on total employment will be negative.
The number of people in labour market policy programmes – such as work experience placements and vocational training – whose participants are by definition not counted among
40
the labour force will not noticeably change between 2006 and 2010. But the programmes will be modified so as to focus more on people who have particular difficulty gaining employment. Starting in 2008, virtually everyone participating in the programmes will participate in a job and development guarantee for long-term unemployed workers or job guarantee for youth. Participants in these programmes will be registered as outside the labour force, thereby lowering open unemployment, but they will nevertheless be actively seeking jobs so that the effective labour supply will increase. The labour market reforms will reduce the risk that people who actually would have good prospects for gaining regular employment will be trapped in a cycle of various policy programmes. The above reforms are expected to increase employment. But the magnitude of the impact is difficult to assess and is highly dependent on how successfully the employment offices implement the intentions of the reforms.
The introduction of new starts jobs and entry jobs (instegsjobb), as well as the appropriation of additional resources to Samhall (a state-owned company that offers sheltered employment to people with disabilities), is also intended to make it easier for those who have particular difficulty gaining employment to find work.
The changes in the labour market policy programmes are expected to boost employment by 0.4 per cent and reduce equilibrium unemployment, measured as open unemployment, by 0.4 percentage points by 2010. The long-term impact of the changes is projected to be the same. Some of the reduction in open unemployment will reflect the fact that people participating in the job and development guarantee for long-term unemployed workers and the job guarantee for youth will be statistically defined as outside the labour force even though they are part of the effective labour supply. Elimination of the sabbatical year scheme is expected to increase average hours worked by 0.2 per cent.
Targeted reductions of employer’s social contributions to boost employment
Because general reductions of employer’s social contributions have a long-term tendency to boost wages, their impact on employment is limited.(14) Targeted reductions are less likely to be passed on as higher wages. As a result, reductions that target specific sectors or worker categories can have a long-lasting impact on employment. A number of such targeted stimulus measures have been adopted. Among them are the re-entry job scheme mentioned above and tax cuts for household services. The main probable impact of such tax cuts is that services that currently go unreported will be reported. Thus, the effect on employment may not be particularly large.(15) However, tax receipts will definitely increase. The government has also proposed reduced employer’s social contributions for certain service sub-sectors. But because the shape of the reductions remains hazy, the present calculation assumes that the change will not have any significant impact on employment. The changes in employer’s social contributions, excluding new start jobs, are expected to boost employment by 0.1-0.2 per cent in the long term.
(14) For a more detailed discussion, see the explanatory box entitled “Labour supply and employment”.
(15) Some people whose services go unreported are probably already registered as employed in the Statistics Sweden Labour Force Survey. The National Accounts calculation of GDP and hours worked includes an estimate of unreported services, a percentage of which will probably become reported services.
Wage formation will improve
Increased labour supply in the wake of the reforms should moderate wage growth. Reduced subsidies to unemployment benefit funds may also have an impact. Greater self-financing of the funds will oblige members to bear a greater share of the costs for those who are jobless. The result may be restraint on wage demands. Thus, increasing self-financing may help wage formation work better, thereby contributing to lower equilibrium unemployment and higher sustainable employment. But the design of the fee, particularly its relationship with the cost of unemployment in each fund, can be structured better. The government plans to review the system and propose changes in its Budget Bill for 2008. As currently structured, self-financing of unemployment benefit funds is estimated to increase employment by 0.1 per cent.
41
Total employment will increase by 1.6 per cent
The government’s economic policies are expected to boost the total number of employed workers by 1.6 per cent over the long term. The regular employment rate – the total number of employed workers excluding those statistically defined as employed in labour market policy programmes – should increase by 1.9 percentage points. Equilibrium unemployment, measured as open unemployment, is expected to decrease by 1.1 percentage points in the long term.
As mentioned above, average hours worked are likely to increase once it is more lucrative to stay on the job longer. Elimination of the sabbatical year, as well as changes in sickness allowance calculations, should also favourably affect average hours worked. But much of the employment growth will reflect entry into the labour market of people who work fewer average hours. Because they are likely to work part-time more than other employees, they will restrain average hours worked. But the net impact on average hours worked will probably be positive so that the total number increases by 2.1 per cent (somewhat outstripping employment increase).
Given that additions to the labour force are assumed to have below average productivity, the impact on GDP is estimated at somewhat below 2.1 per cent.
Assessing when and how much the reforms that have been adopted and announced will have an impact is associated with considerable uncertainty. Chapter 6 of this appendix presents a calculation in which the reforms are assumed to make a substantially greater impact than anticipated by this forecast.
Important to keep in mind is that the government’s economic policies can affect growth and employment via other routes than described here. Educational policy and investments in infrastructure may contribute to more robust growth going forward. Changes with respect to the supply of venture capital and repeal of the wealth tax also have the potential to bolster economic growth. But because the effects of such measures are still far away or more poorly documented in the research literature, the calculations do not take them into consideration.
Long-term impact of the government’s economic policies
Change in per cent or percentage points
| | Employ- | | Unemploy- | | Hours | | GDP, % | |
| | ment, % | | ment, p.p. | | worked, % | | | |
Strengthened incentives to work | | 0.9 | | -0.5 | | 1.1 | | — | |
Change in labour market policy programmes | | 0.4 | | -0.4 | | 0.6 | | — | |
Reductions of employer’s social contributions(1) | | 0.1 | | -0.1 | | 0.1 | | — | |
Improved wage formation | | 0.1 | | -0.1 | | 0.1 | | — | |
Change in sickness allowance | | — | | — | | 0.2 | | — | |
Total | | 1.6 | | -1.1 | | 2.1 | | 1.8 | |
Note.: Due to rounding, the parts do not add up to the whole.
(1) Excluding new start jobs.
Source: Ministry of Finance.
42
4 Labour market, wages, inflation and resource utilisation
Sustained rise in employment
Labour market trends have been favourable since mid-2005. Employment and hours worked have risen and open unemployment has fallen. Robust growth in demand for labour is forecast for the next few years. GDP growth is high and indicators point to a sustained and significant rise in employment.
Increasing employment has not yet caused general problems for firms in finding suitable workers, but there are signs that recruiting is becoming more difficult and that wage growth is accelerating. Labour resource utilisation appears to be tightening. Employment and unemployment are consequently now at levels where wages and prices may rise faster than consistent with the Riksbank’s inflation target. Conditions for strong and sustainable employment growth over the next few years are nevertheless good, due to the assessed high net inflow of workers in the labour market, in part due to adopted and proposed measures to stimulate labour supply.
Changes in labour market policy programmes will affect the labour market
Except cyclical and structural changes in the labour market, employment and labour supply are influenced by changes to the scope and direction of labour market policy programmes. The number of programmes in which participants are defined as employed will decline relatively sharply in 2007 and 2008, subduing employment growth. However, regular employment (excluding participants in labour market policy programmes) will rise faster than total employment.
The number of places in programmes whose participants are defined as outside the labour force in 2010 will be about equal to the 2006 level, but programme orientation will change. As of 2008, most people participating in labour market programmes will participate in one of the new programmes to be introduced: the job and development guarantee for long-term unemployed workers or the job guarantee for youth. The programmes will be oriented more clearly towards eliminating labour market exclusion. The job and development guarantee is expected to encourage unemployed workers to look for jobs more actively and efficiently or participate in a work experience programme. Although participants will be registered as outside the labour force, reducing the open unemployment rate, they will in fact be seeking jobs and will therefore increase the effective labour supply. Sharper focus on individuals who are less immediately employable will reduce the risk that people who actually would have good prospects for gaining regular employment will become trapped in an endless cycle of policy programmes. The new labour market policy is to raise the long-term employment level.
Table 4.1 Selected statistics
Percentage change unless otherwise stated
| | 2006 | | 2007 | | 2008 | | 2009 | | 2010 | |
GDP | | 4.4 | | 3.7 | | 3.3 | | 2.1 | | 2.3 | |
Productivity | | 3.1 | | 2.2 | | 2.1 | | 1.8 | | 1.8 | |
Hours worked | | 1.4 | | 1.5 | | 1.1 | | 0.2 | | 0.5 | |
Average hours worked | | -0.4 | | -0.8 | | 0.2 | | 0.1 | | 0.6 | |
Employed | | 1.8 | | 2.3 | | 0.9 | | 0.1 | | -0.1 | |
Regular employment rate, age group 16-64(1) | | 73.5 | | 75.0 | | 75.6 | | 75.7 | | 75.6 | |
Regular employment rate, age group 20-64(1) | | 77.7 | | 79.4 | | 80.2 | | 80.3 | | 80.1 | |
Labour force | | 1.2 | | 1.5 | | 0.3 | | 0.2 | | -0.1 | |
Open unemployment(2) | | 5.4 | | 4.7 | | 4.1 | | 4.2 | | 4.2 | |
Labour market policy programmes(23) | | 3.0 | | 2.0 | | 2.0 | | 1.9 | | 1.9 | |
Total unemployment(2) | | 8.4 | | 6.7 | | 6.2 | | 6.1 | | 6.2 | |
Hourly wages(3) | | 3.1 | | 4.0 | | 4.3 | | 4.5 | | 4.4 | |
CPI, year-on-year (4) | | 1.4 | | 1.8 | | 2.3 | | 2.7 | | 2.5 | |
UND1X, year-on-year(4) | | 1.2 | | 0.8 | | 1.5 | | 2.2 | | 2.2 | |
Note: Figures in the table refer to non-calendar-adjusted data. A more detailed table is available in the tables appendix.
(1) The number of people in regular employment for the specific age group; that is excluding people employed in labour market policy programmes, as a percentage of the population in the age group.
(2) As a percentage of the labour force.
(3) According to short-term wage statistics.
(4) Annual average.
Sources: Statistics Sweden, National Labour Market Board, National Institute of Economic Research and Ministry of Finance.
Labour supply will increase slower than employment
Relatively rapid labour supply growth is anticipated in 2007. Supply growth will be considerably lower in 2008, in part due to introduction of the job and development guarantee for long-term unemployed workers and the job guarantee for youth. The labour supply is set to increase in 2007 and 2008 more than demographic growth among the working age population would suggest,
43
as more people enter the labour market due to rising demand for labour. The demand momentum is also affecting outward flow from the labour force and fewer workers are likely to leave the labour market prematurely. The trend labour participation rate is also gathering momentum among certain age groups, which is expected to continue. Implemented and proposed reforms to increase labour supply are also promoting labour supply growth. Nevertheless, labour supply is growing at a slower rate than employment, leading to a decline in unemployment.
Resource utilisation will be progressively higher
Indications are that labour resource utilisation is rising. Unemployment has declined relatively quickly and there are signs of accelerating wage growth. The percentage of firms reporting labour shortages in surveys is rising and tendencies suggest it is getting more difficult to recruit suitable workers in some sectors. Consequently, unless there are structural changes in the labour market, employment cannot continue rising as rapidly as in the last year without triggering inflationary wage growth. In other words, the employment gap is around zero, meaning actual employment is close to potential employment. However, the assessed output gap, which includes employment as well as changes in average hours worked and productivity, is positive. The primary driver is productivity growth, which has risen in recent years above the level considered sustainable in the long term. (See explanatory box, “Potential GDP and the output gap”.)
Several reforms have been adopted and others announced to increase supply and demand in the labour market and improve both wage formation and matching between supply and demand for workers. The reforms are expected to help sustain favourable employment and GDP growth in future years. However, the expansionary economy and attendant high demand for labour is anyhow expected to cause actual employment to increase faster than potential employment. Consequently, the level of resource utilisation will be high and the employment gap will widen to nearly 1 per cent in 2008, meaning employment will be about 1 per cent higher than is sustainable long-term (see Figure 4.1).
Figure 4.1 Output gap and employment gap
Per Cent
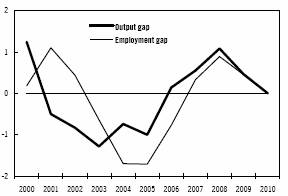
Source: Ministry of Finance.
Rising wage growth and inflation
Wage growth has been low over the past few years, mainly due to high available labour supply competing for jobs, making it relatively easy for employers to recruit suitable workers. As employment rises in the future and resource utilisation becomes progressively higher, wage growth is anticipated to rise. The growing labour supply combined with factors including the reformed unemployment insurance system is expected to check wage growth to a certain extent.
Inflation has been low in recent years and remains relatively subdued. Moderate wage growth combined with strong productivity growth has kept the labour costs of firms down, contributing to controlling domestic inflation. The CPI has been increasing somewhat faster recently, due to higher energy prices, increased interest costs and rising import prices. Domestic inflationary pressure will increase when wage growth rises in parallel with more moderate productivity growth in the future. But a stronger krona and falling energy prices are expected to restrain inflation in upcoming years.
Economy will adjust towards normal resource utilisation in 2009 and 2010
The calculations for 2009 and 2010 are not based on an assessment of the business cycle. The calculations for those years are based on assessments of the level of resource utilisation in 2008 and the potential growth rate in the total economy. The economy is assumed to be
44
moving towards normal resource utilisation in 2010.
Potential GDP is estimated to rise by an average of 2.7 per cent(16) a year in 2009-2010 and potential employment by an average of 0.5 per cent a year, lower than for 2006-2008. The progressive moderation of potential growth is primarily attributable to flagging population growth. Estimated potential productivity growth is around 2.2 per cent per year.
(16) The number of working days will be higher in 2010 than in 2009, which is assumed to augment GDP growth by 0.3 percentage points and average hours worked by 0.6 percentage points.
Labour resource utilisation is likely to be high in 2008, and wage growth will rise to a level inconsistent with a balanced economy. The forecast underlying inflation rate will be slightly higher than the Riksbank’s inflation target in 2009 and 2010. The Riksbank is expected to respond by raising the repo rate to a maximum of 4.75 per cent in 2009.
Relatively high wage growth and tighter monetary policy are expected to moderate eco-nomic growth and demand for labour. As a result, GDP growth should be below potential GDP in 2009 and 2010. Employment is also expected to show only sluggish growth in 2009, followed by a decline in 2010. Open unemployment is set to rise slightly. This triggers a decline in resource utilisation, which is expected to reach a long-term sustainable level in 2010.
Figure 4.2 Employment gap, wage growth, inflation and repo rate
Per cent, annual average
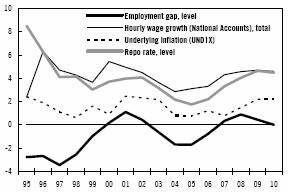
Sources: Statistics Sweden, Riksbank and Ministry of Finance.
Adjusted for the effect of the increase in working days between 2009 and 2010, average hours worked should remain unchanged in both years. Policy changes are expected to increase average hours worked, but the increase will be offset by the demographic trend.
Productivity growth should be weaker than growth in potential productivity for 2007-2010 due to high capacity utilisation and more limited scope for efficiency gains.
Overall, labour market trends in upcoming years are expected to stimulate a rise of 2 percentage points in the regular employment rate for workers age 16-64 between 2006 and 2010, when it will be 75.6 per cent. A decline in open unemployment is expected from 5.4 per cent to 4.2 per cent in the same period, and total unemployment (including participants in labour market policy programmes) should drop from 8.4 per cent to 6.2 per cent.
Uncertainty in assessments of resource utilisation and the impact of new proposals
The risks in labour market forecasts are mainly associated with uncertainty in assessments of the impact of government policy and how rapidly the effects will materialise. The current assessment is reported in the explanatory box “Long-term impact of the government’s economic policies”. Uncertainty is also considerable with respect to the level of resource utilisation in the total economy. There is often a lag before wages and inflation respond to changes in the labour market, which hampers the assessment. The alternative scenario presented in Chapter 6 assumes government policy will have considerably greater impact than stated in this forecast.
45
Potential GDP and the output gap
Overall economic output is determined by the number of workers employed, the average hours they work and their output per hour worked, or productivity. Output at a given point in time can theoretically be divided into two components: a structural component usually called potential output and a cyclical component that describes cyclical variations around the potential level. The Ministry of Finance’s calculations of potential GDP are based on an assessment of how high employment can rise without triggering wage and price growth inconsistent with the Riksbank’s inflation target, how many hours workers can normally work and the productivity trend. In other words, potential GDP is a measure of how much can be produced in the total economy at a level of resource utilisation consistent with stable inflation. Potential GDP is a concept that can be assessed and calculated in a variety of ways and the assessments are highly uncertain.
The output gap measures the difference, expressed as a percentage, between actual and potential GDP. A negative output gap means actual GDP is below potential and the opposite is true if the output gap is positive. As overall economic output is determined by the number of employed workers, their average hours worked and their productivity, the output gap can be divided into an employment gap, an hours worked gap and a productivity gap, all expressed as percentages of the potential levels.
The employment gap illustrates available resources in the labour market. A positive or negative gap means the actual employment rate differs from the potential employment rate; that is, the highest level of employment possible without triggering inflationary wage growth and without continual increases in the profit share of GDP. If the gap is closed, unit labour costs for firms(17) develop so that inflation is consistent with the Riksbank’s inflation target. The potential employment level is determined by population size, the assessed percentage of the population participating in the labour force in a normal economy and the percentage defined as outside the labour force (categories including students and people receiving sickness/activity compensation for instance) and the level of equilibrium unemployment, which is the level below which unemployment cannot fall without causing severe labour shortages.
(17) Growth in unit labour cost is calculated as wage growth including social contributions per hour worked minus productivity growth.
The productivity gap illustrates the difference between actual productivity and an estimated trend.
The hours worked gap illustrates the difference between average hours worked and the estimated potential level in a normal economy.
All gaps are not always positive or negative in tandem. On the contrary, the productivity gap and hours worked gap tend to be positive when the employment gap is negative and vice versa. The reason is that productivity often rises rapidly early in an economic upturn when there is scope to use machinery and labour more efficiently. Once capacity utilisation has risen sufficiently, there is less scope for efficiency gains. Average hours worked often increase when the employment rate falls because various categories of absence tend to decline when employment growth is weak. Thus, a positive hours worked gap early in an economic upturn is often accompanied by a negative employment gap.
Because the components are correlated to GDP growth in various ways, the output gap (the total of the productivity gap, the hours worked gap and the employment gap) is on average less negative or positive than the employment gap.
46
4.1 Labour market
Strong trend continued in 2006
Following four years of weak growth, the employment trend began recovering in the second half of 2005 and employment growth has since remained positive. Unemployment was not affected because the labour force increased in parallel with employment until summer 2006. Indications are that many workers who gained employment during this period were former students and thus by definition previously outside the labour force. Employment increased faster than the labour force in autumn 2006 and winter 2007, pushing down unemployment. Total unemployment, including the open unemployment and participants in labour market policy programmes, has declined rapidly in the last six months.
The employment trend has been good in most sectors (see Table 4.2), particularly private services and construction. Employment growth has been strongest in the construction industry, but since the sector accounts for only about 6 per cent of all workers employed, the contribution to total employment growth was far below that of the private service sector. The main driver of growth in the latter has been a steep rise in business and household services. Relatively robust employment growth in the local government sector made a substantial contribution to total employment growth, but much of the increase in local government employment stemmed from the expansion of bonus jobs in 2006 and does not qualify as growth in regular employment.(18)
(18) People defined as being in regular employment include all employed persons except those categorised as employed in labour market policy programmes (employment support, bonus jobs, sabbatical year, trainee replacement and business start-up grant).
Employment rose in 2006 for virtually all age groups. The increase was highest for the youngest (16–19) and the oldest (60–64) workers. The number of employed in the 16–19 age group increased by 14 per cent in 2006.
Table 4.2 Employment trends by sector and contributions to total employment change in 2006
| | Percentage
change | | Contribution,
percentage points | |
Private service sector | | 2.9 | | 1.2 | |
Business services | | 4.9 | | 0.5 | |
Household services | | 4.0 | | 0.3 | |
Trade | | 1.5 | | 0.2 | |
Real estate services | | 5.5 | | 0.1 | |
Financial services | | 3.2 | | 0.1 | |
Other services | | 1.4 | | 0.1 | |
Construction | | 6.9 | | 0.4 | |
Industry | | -0.6 | | -0.1 | |
Local government | | 1.2 | | 0.3 | |
Central government | | 0.8 | | 0.0 | |
Total | | 1.8 | | 1.8 | |
Note: The figures are rounded off and the individual items do not add up to the total.
Source: Statistics Sweden.
Labour market policy programmes scaled back…
The number of participants in labour market policy programmes averaged 138,000 in 2006. The number of programme places was increased during the year successively through the end of October when the new government commenced the effort to change the direction of labour market policy, including restructuring the volume and content of labour market policy programmes. The Budget Bill for 2007 proposed the elimination of bonus jobs, general and extended employment supports, the sabbatical year scheme, the trainee replacement scheme and graduate internships. The National Labour Market Board also sharply scaled back the number of participants in other programmes in late autumn and winter (see Figure 4.3).
47
Figure 4.3 Participants in labour market policy programmes
Thousands of persons
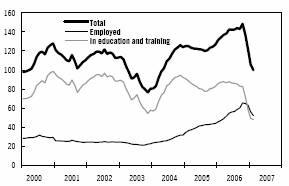
Note: Seasonally adjusted data.
Source: National Labour Market Board.
In this bill, the government is proposing a job and development guarantee for long-term unemployed workers, to take effect 2 July 2007. It is possible to provide places to everyone covered by unemployment insurance who has used 300 benefit days. It will also be possible to extend the guarantee to uninsured people who have been unemployed or in a policy programme for at least 18 months. Unemployed parents of minor children should be able to choose between participating in the guarantee programme or receiving unemployment benefits from the 301st through the 450th benefit day. Participation in the guarantee programme will not qualify individuals for a new period of unemployment benefits.
The government is also proposing a job guarantee for youth that would take effect 1 December 2007. It should be possible to provide places to youth under age 25 who have been registered as jobseekers with the Employment Office for 100 days.
The two guarantees contain measures that must be individually adapted and aimed primarily at encouraging unemployed people to look for work more actively and efficiently, which will help augment the effective labour supply. In the second step, unemployed people will be referred to work experience placements, jobs with employment support and skills development initiatives aimed at increasing their likelihood of gaining employment. In the third step, everyone who has not found a job after 450 benefit days under the job and development guarantee will be referred to long-term public service employment.
The number of places in labour market policy programmes is estimated at 95,000 as an annual average in 2007, a substantial reduction compared to 2006. The bulk of the cutbacks were implemented in late 2006 and early 2007. A further modest decline in programme volumes is expected in 2008–2010. Although volumes will decline somewhat in the future, projected volumes are higher in this forecast, due to the new initiatives, than anticipated in the Budget Bill for 2007.
Table 4.3 Participants in labour market policy programmes
Thousands, annual average
| | 2006 | | 2007 | | 2008 | | 2009 | | 2010 | |
Employed | | 56 | | 41 | | 20 | | 12 | | 12 | |
Special employment support(1) | | 9 | | 7 | | 8 | | 8 | | 8 | |
Bonus jobs | | 11 | | 19 | | 8 | | 0 | | 0 | |
Other employment support(2) | | 25 | | 7 | | 0 | | 0 | | 0 | |
Sabbatical year | | 10 | | 5 | | 0 | | 0 | | 0 | |
Other | | 6 | | 4 | | 4 | | 4 | | 4 | |
In education and training | | 82 | | 54 | | 75 | | 78 | | 78 | |
Job and development guarantee for long-term unemployed | | 0 | | 14 | | 41 | | 46 | | 44 | |
Job guarantee for young | | 0 | | 0 | | 28 | | 28 | | 28 | |
Other | | 82 | | 40 | | 6 | | 5 | | 6 | |
Total | | 138 | | 95 | | 95 | | 90 | | 90 | |
(1) Starting 1 July 2007, the special employment support will be included in the job and development guarantee for long-term unemployed workers.
(2) Academic internships are included in this item.
Sources: National Labour Market Board and Ministry of Finance.
…but other initiatives expanded
The new start jobs was introduced in January 2007. New start jobs are aimed at helping people with a weak foothold in the labour market gain regular employment. New start jobs reduce labour costs by means of employer tax credits. The scheme was designed for people who have received unemployment benefits, sickness allowance, sickness and activity compensation or social assistance benefits for more than a year. Recently arrived refugees and their families will also be eligible for new start jobs for three years after receiving a permanent residence permit. The tax credit will apply for a period equal to the time the individual has been out of work, up to five years.(19)
(19) The tax credit period is doubled for people age 55 or older up to a maximum of ten years. Youth who have been unemployed for more than six months are covered by the tax credit for up to one year. New start jobs will be available only to private sector employers and public sector employers engaged in commercial activity.
48
The number of new start jobs rose steadily during early 2007 and is expected to reach 20,000 by the end of the year, corresponding to an annualised average of 10,000. The number of new start jobs should continue to increase in 2008 up to an annualised average of 25,000 (see Table 4.4).
Table 4.4 New start jobs
Thosands, annual average
| | 2006 | | 2007 | | 2008 | | 2009 | | 2010 | |
New start jobs | | 0 | | 10 | | 25 | | 30 | | 25 | |
Source: Ministry of Finance.
The employer is entitled to a tax credit for employees eligible for new start jobs. People in new start jobs will be defined as in regular employment, not as participants in labour market policy.
In this bill, the government is proposing a entry jobs scheme in a targeted initiative to benefit immigrants. Entry jobs will benefit asylum-seekers, quota refugees and their families.
In this bill, the government is also proposing expanded initiatives for people with disabilities.
Favourable indicators
The conditions for continued strong growth in the labour market are good. GDP growth is high and indicators point to strong employment growth in the next six months.
According to the National Labour Market Board, newly reported vacancies are very high and had increased by 40 per cent in February compared to a year before.(20) From an historical perspective, there has been a relatively strong correlation whereby growth in newly reported vacancies is followed two quarters later by growth in employment (see Figure 4.4). Newly reported vacancies has increased across most sectors and geographical regions. Increases have been recorded for both skilled and non-skilled and temporary and permanent jobs.
(20) Note that National Labour Market Board statistics probably indicate an inordinately rosy picture of developments because the Board’s market share has increased, meaning that a larger percentage of vacancies is now being registered with the Employment Office. Statistics Sweden’s firm-based statistics also provide an optimistic view of the trend, despite lower growth figures. Reports from Statistics Sweden show that vacancies in the private sector increased by 25 per cent in the fourth quarter of 2006 compared to one year before.
The NIER Business Tendency Survey reveals optimistic hiring plans among firms in most sectors.
Figure 4.4 Newly reported vacancies and employment
Annual percentage change
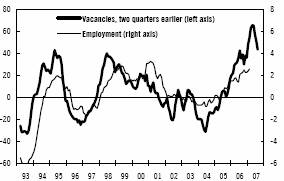
Note: Three months moving average.
Sources: National Labour Market Board and Statistics Sweden (LFS).
The same survey shows increasing labour shortages in most sectors since early 2005. A co-weighted average for the business sector shows that about one fourth of firms are experiencing labour shortages. Shortages are most severe in construction and business services. There are no general indications that the time required to fill vacancies is increasing.
Employment growth will continue
Healthy demand is expected to generate favourable employment growth during the forecast period, despite cutbacks in 2007 and 2008 in labour market policy programmes whose participants are defined as employed. In the current economy, policy programmes are expected to a significant substitution of regular employment.(21) The net effect of programme cutbacks on employment will be smaller than it would have been in a poorer economy, but programme orientation varies widely, as does the impact on employment.
(21) Substitution of regular employment refers to situations where either (i) a person who is employed under a recruitment incentive or other scheme would have been employed even if the subsidy did not exist, or (ii) another person, not eligible for the scheme, would have been employed if the subsidy did not exist. If substitution of regular employment is high (low), the net effect on employment will be insignificant (significant).
49
The income tax reductions and unemployment insurance reforms effective 1 January 2007 are expected to bolster employment growth in the future. The tax allowance for household services that will take effect in July 2007 should also promote employment growth in the private service sector.
Employment is estimated to rise by 2.3 per cent in 2007 and 0.9 per cent in 2008, equivalent to an increase of approximately 140,000 people in work. The increase in regular employment is estimated at about 175,000 people, taking into account a reduction during the same period of 35,000 participants in labour market policy programmes defined as employed (see Figure 4.5). Employment is projected to reach an unsustainably high level in 2008. A weaker employment trend is assumed in 2009 and 2010 as the economy adjusts towards normal resource utilisation.
Figure 4.5 Employment and people in the labour force
Thousands of persons
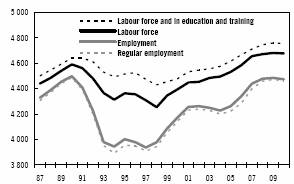
Sources: Statistics Sweden (LFS), National Labour Market Board and Ministry of Finance.
Employment growth will be strongest in the business sector
Around 80 per cent of employment growth in 2007–2008 is expected to be in the business sector. The service and construction sectors are expected to bolster increased employment, while industrial employment should continue falling slightly.
The hiring plans of firms in the private service sector are still positive in most segments. The service sector should account for the majority of total employment growth in 2007–2008.
Construction activity is still strengthening. Firms remain optimistic about the future, anticipating growth in construction activity as well as employment, but the shortage of construction workers since 2005 is still worsening. The problem is most severe for firms specialising in residential construction. In light of severe labour shortages in construction, employment has progressed surprisingly well in the last year. While this may indicate that shortages are restricted to certain occupational categories so far, the time required to fill vacancies has increased in the last six months, indicating that labour shortages may hold back future employment growth in the construction sector.
Industrial employment has trended downward for several decades, rising only in years when industrial activity has been unusually strong. Output growth is projected to be high in 2007 and 2008, but not sufficient to result in employment growth.
Strong local government finances are forecast to contribute to employment growth in the sector by 22,000 people between 2006 and 2008. Bonus jobs will increase employment in the local government sector in 2007,(22) while elimination of the sabbatical year and training replacement will restrain employment growth during the year. Employment in the local government sector is expected to continue rising in 2008 despite the phase-out of bonus jobs. In the central government sector, employment is expected to increase by around 2,000 people between 2006 and 2008. Elimination of the bonus jobs, sabbatical year and trainee replacement schemes will also restrain future employment growth in the central government sector.
(22) As no further bonus jobs will be granted in 2007, the scheme will not increase employment during this year, but will increase average employment compared to last year because the average number of people in bonus jobs is higher in 2007 than in 2006.
Average hours worked will rise slightly
Average hours worked per person employed is determined the percentage of people absent from work for various reasons and the average hours worked by all people in work. Changes in average hours worked have been marginal for the last three years. In the past, there has been a strong correlation between sickness absence and the employment rate, but sickness absence has steadily declined in the face of continuous
50
employment growth for 18 months (see Figure 4.6). More stringent procedures applied by the Social Insurance Agency are believed to have deterred sickness absence, but there was a slight rise in the fourth quarter of 2006, which may indicate that the decline is levelling off. Sickness absence accounted for around 20 per cent of absence in 2006. Absence for reasons other than sickness has risen since early 2005. Holiday leave makes up around half of all absence and temporary parental benefit leave accounts for approximately 15 per cent.
Figure 4.6 Absence and employment
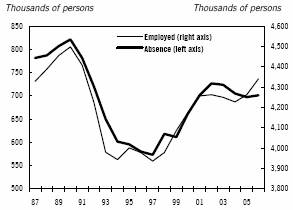
Note: Absence refers to those who have been absent the whole reference week.
Source: Statistics Sweden (LFS).
Total absence is expected to increase in 2007–2008 with adverse impact on average hours worked. The strong overall labour market is a key driver of rising absenteeism. Absence for reasons other than sickness is expected to rise during the forecast period. The trend is mainly dependent on economic conditions, but also on an upward trend in temporary parental benefit leave due to factors including larger families. Sickness absence(23) is expected to remain essentially stable. The expansionary economy is pushing sickness absence up while the government’s policy of lowering the ceiling for sickness insurance benefits and the Social Insurance Agency’s more restrictive procedures have an opposite effect.
(23) In the Labour Force Survey (LFS), sickness absence is reported as either “sickness absence the whole reference week” or “sickness absence part of the reference week”. LFS statistics are not directly comparable with Social Insurance Agency (SIA) statistics on the number of people on sick leave. SIA statistics include only people who have been on sick leave for more than 14 days, while unemployed persons and students on sick leave are included in SIA statistics but not in LFS statistics.
Demographic trends are also expected to adversely impact average hours worked in future years. Population growth is strong in age groups with low average hours worked and vice versa. For cyclical reasons, the employment rate for age groups with low average hours worked is expected to rise more than for the average, exacerbating the effect.
Opportunities for underemployed individuals often become available in an expansionary economy, with positive impact on average hours worked.
It is hard to assess the impact on average hours worked of the new earned income tax credit. The credit will promote higher average hours worked, given that it will be more profitable for people, particularly low-income earners, to increase their working hours. But there is risk that high-income earners will cut back their working hours and some people who gain employment as a result of the proposal will work part-time.
Beyond the earned income tax credit, other components of the government’s policy are aimed at ameliorating labour market exclusion. It is reasonable to presume that some of the people entering the labour market will work fewer hours than the average, which would lessen average hours worked. On the other hand, the unemployment insurance reform is encouraging more people to work full time.
Phasing out the sabbatical year scheme will bolster average hours worked in 2007 because people on sabbatical leave are defined as employed, even though their working hours are zero.
Adjusted for the variation in the number of working days from year to year, a marginal increase in average hours worked is expected in future years. A relatively strong decline in average hours worked is expected for 2007, on an annualised basis, due to developments in previous years.
Productivity growth will taper off
Productivity growth moderated in 2005, due to a temporary slowdown in industrial activity and
51
the reduced contribution from merchanting.(24) As economic growth gathered momentum in early 2006, productivity growth was very high among private market producers of goods and services. Productivity growth remained high in the second half of 2006, stimulated in part by a strong contribution from merchanting.
(24) Merchanting is the trade margin that arises when Swedish parent companies manage billing for sales to third countries by foreign subsidiaries. The trade margin is accounted for as output in the Swedish National Accounts, but this output does not correspond to any hours worked at the relevant point in time.
Productivity growth is forecast to fall in the future, as economic growth moderates and the economy moves towards higher resource utilisation. Initially assessed as positive, the productivity gap will consequently close.
Labour supply will continue to grow
The total economy strongly influences labour supply trends. Higher demand for labour stimulates more people to enter the labour market. The impact of the economy on the labour supply varies according to worker age group. The labour participation rate varies more over an economic cycle among young workers due to their strong tendency to participate in the labour force only after they get a job.(25) Labour force participation among older workers is often affected more than the average by economic conditions, as they tend to stay in work longer when the labour market is flourishing. When the labour market is shaky, older workers are inclined to retire earlier than they would have otherwise.
(25) For instance, young people have greater opportunities to get summer and temporary jobs in an expansionary economy. Rising employment among youth does not necessarily mean they are abandoning their studies. If a person works one or more hours during the reference week, he or she is regarded as employed in the LFS (whether or not the individual is a full-time student).
The labour supply is also affected by demographic trends. A larger population obviously means that there are more people available to work, but the structure of population growth is also significant (see Figure 4.7). From a labour force perspective, demographic trends in the coming years will be relatively unfavourable. Age groups with low labour force participation will grow strongly. This applies particularly to the 16–19 and 60–64 age groups, but also to the 20–24 age group. The 45–54 and 55–59 age groups, which have a high labour force participation rate, will decline or remain largely unchanged.
Labour force participation among workers age 60–64 has trended strongly upward for several years. This trend is mainly driven by the increasing numbers of older workers who are choosing to remain in work longer than earlier generations. The oldest groups in the labour market are mainly people born in the 1940s. They are healthier on average than their predecessors and have a strong foothold in the labour market. They were not hit as hard by the economic crisis of the 1990s as the people who were at that time the older groups in the labour market. Reform of the pension system may also have affected labour participation among older workers. Indications are that the rising labour participation trend among older workers will continue in coming years.
Figure 4.7 Labour participation by age group
Percentage of the population
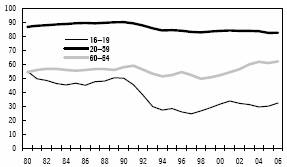
Note: Due to the harmonisation of statistics in 2005 the numbers are not totally comparable.
Source: Statistics Sweden.
Income tax and unemployment insurance reforms previously proposed by the government combined with reduction of employer’s social contributions for certain categories are expected to have favourable long and short-term impact on labour supply. Employer’s contributions have been waived for workers over 64 to make them more attractive in the labour market and improve their opportunities to remain in work longer. A weaker labour supply trend is expected due to the proposed job and development guarantee for long-term unemployed workers and job guarantee for youth, as participants in the programmes will be statistically defined as outside the labour force. But the effective labour supply will be augmented when unemployed workers participate in programmes
52
that enhance their employability and encourage active job search.
The labour supply is anticipated to increase by 1.5 per cent in 2007. Growth in 2008 is expected to level off at 0.3 per cent, partly due to the expanded scope of policy programmes whose participants are statistically categorised as outside the labour force. Higher growth in labour force participation and employment is forecast for the oldest and youngest workers than for other groups. The growth rate is expected to slacken further in 2009, followed by a slight decline in the labour supply in 2010.
Unemployment will drop
There was a relatively swift decline in open and total unemployment(26) in autumn 2006 and winter 2007. The decline in open unemployment trend was surprisingly strong considering the recent sharp cutbacks in labour market policy programmes. There was little improvement in youth unemployment, despite very strong employment growth for the group, probably because more people register as jobseekers when the labour market improves.
(26) Open unemployment and participants in labour market policy programmes that are dependent on economic activity, as a percentage of the labour force.
The decline in open unemployment is expected to continue during the forecast period (see Figure 4.8). Robust employment growth is the main driver, but the job and development guarantee for long-term unemployed workers and the job guarantee for youth are also expected to have an impact. Open unemployment is projected at 4.7 per cent in 2007 and 4.1 per cent in 2008.
Total unemployment is also expected to fall during the forecast period, more so than open unemployment between 2006 and 2007 due to the sharp cutbacks in policy programme volumes. Forecast total unemployment will be 6.7 per cent in 2007 and 6.2 per cent in 2008.
Open unemployment should rise marginally in 2009–2010 due to the assumed adjustment of the economy towards normal resource utilisation. Total unemployment is forecast at 6.2 per cent in 2010.
Figure 4.8 Open and total unemployment
Percentage of labour force
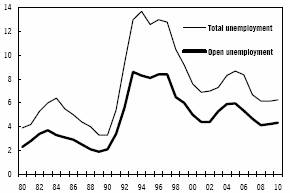
Sources: Statistics Sweden, National Labour Market Board and Ministry of Finance.
53
Labour supply and employment
Achieving and maintaining high employment is critically important to people on a human level and to ensuring a flourishing Swedish economy. Individuals who are now jobless are at greater risk of permanent exclusion or earning persistently lower wages if they do manage to find work. Joblessness also takes a toll on people’s health and well-being. As labour income is the most important tax base, high employment also brings high tax receipts, making it possible to finance good public service while maintaining a surplus in public finances. Given that demographic pressure on public finances is going to increase in the future, achieving high employment will reduce public debt and the need for future tax increases, which are harmful to employment.(27)
(27) Demographic pressure on public finances can be illustrated with the demographic dependency ratio, which shows the number of people younger than 20 and older than 64 in relation to the number of people age 20–64.
Demographic dependency ratio
Per cent
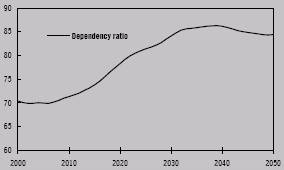
Note: The dependency ratio shows the number of people younger than 20 or older than 64 in relation to the number of people age 20–64.
Source: Statistics Sweden.
Employment at any given time can theoretically be divided into two components: a structural component usually called potential employment and a cyclical component that describes cyclical variations around the potential level. As described in the explanatory box, “Potential GDP and the output gap”, potential employment is the level of employment consistent with an economically sustainable wage growth and inflation consistent with the Riksbank’s target. The cyclical variation is temporary and arises when supply and demand in the total economy shift in relation to each other. A flexible and adaptable economy combined with a stabilising monetary policy speeds up the readjustment to a level of employment consistent with stable wages and prices.
Labour supply critical to high employment
Potential employment is determined by two factors: how many workers are willing and able to participate (potential labour supply) and the percentage of those who are unemployed (equilibrium unemployment). Accordingly, higher employment over the long term can be achieved by increasing the labour supply and/or reducing equilibrium unemployment.
Labour supply will have to increase substantially to make a substantial and lasting increase in employment in Sweden possible. As shown in the following figure, variations in unemployment rate are relatively minor among OECD countries. Estimated equilibrium unemployment in Sweden is currently between 4 and 5 per cent. It is unlikely that it can be lowered by more than 2 percentage points, considering that no OECD countries have unemployment below 2 per cent.
Contributions to employment rate variations among selected OECD countries compared to Sweden, 2005
Percentage points
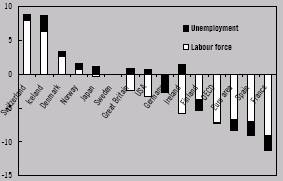
Note: Number of employed in relation to population in the age group 15–64.
Source: OECD.
Variations in unemployment are relatively minor among OECD countries, but differences in the labour participation rate are much greater. A high labour supply is the key factor for achieving a high employment rate, while the unemployment rate is less significant. If Sweden is to achieve an employment rate on par with Switzerland and Iceland, for example, the labour
54
supply must rise to the levels comparable to those countries.
The role of economic policy
The structure of the labour market is complex and its functions are shaped by the behaviour of various actors: the political system, firms, workers and other regions. Accordingly, it is impossible to provide an exhaustive and yet concise description of all factors that affect labour supply and employment. In addition, analysts accord varying importance to a range of explanatory factors. Nevertheless, there is significant consensus as to how economic policy can influence labour supply and equilibrium unemployment, and thus employment.
The design of economic policy sets the frameworks for economic development. Long-term, credible and predictable systems promote fundamental stability. Such systems include the fiscal policy framework, the independence of the Riksbank and the stability of the pension system.
The direction of economic policy may also more directly contribute to higher employment. Three aspects are particularly important here: the incentive to work, the level of employer’s contributions and matching in the labour market.
Stronger incentives increase the labour supply
The combination of high taxes and relatively high social insurance benefits provide little incentive to look for work. Stronger incentives to participate in the labour force can contribute to increasing the effective labour supply and thus employment. The earned income tax credit that took effect in January 2007 is a good example of how incentive can be heightened.(28) The earned income tax credit will narrow tax wedges and make it relatively more profitable for people to be employed.(29) Likewise, lower benefits make working more profitable.
(28) See the explanatory box “Long-term impact the government’s economic policies” for an analysis of the government’s supply reforms.
(29) The tax wedge measures the difference between what the employer pays in total labour costs per hour worked in relation to the employee’s net pay.
Targeted reductions of social contributions increase demand for labour
One problem in the labour market is that the productivity of some individuals is not sufficiently high in relation to labour costs – or such is perceived to be the case. Generally high tax pressure contributes to these costs. Due to the compressed wage structure, there is also little demand in Sweden for workers with relatively low productivity. But general reductions in taxes and employer’s social contributions mainly affect labour demand in the short run. One reason factors like general reductions of employer’s social contributions are not thought to have significant long-term impact on labour demand is that such reductions tend to be passed on to employees as correspondingly higher wages. Lower contributions entail higher profits for firms, leading to greater demand for labour and thus higher wages. In the long run therefore, workers gain the primary benefit from reductions in employer’s social contributions through higher wages. Higher wages will however also make it more profitable to work. General reductions in employer’s social contributions and income taxes may thus promote higher labour supply and to some extent higher employment, but cause a relatively substantial reduction in tax receipts, in relation to the employment effects.
Targeted reductions of employer’s social contributions are less likely to be passed on to workers as higher wages. As a result, demand stimuli that target specific sectors or worker categories may lead to greater long-term employment effects. Examples of targeted stimuli implemented by the government include a tax reduction for household services, the new start jobs scheme and targeted reductions of employer’s social contributions for specific groups.
Effective vocational training may also contribute to improving people’s productivity and opportunities in the labour market.
55
Policy can also influence wage formation and thereby labour market efficiency. The self-financed component of unemployment benefit funds was increased partly to encourage the worker collective to take greater responsibility for wage formation by bearing a larger share of the costs for wage growth that leads to higher unemployment.
Better matching in the labour market will cut unemployment
Measures to facilitate and improve matching (the process by which jobseekers and potential employers are brought together) may contribute to lower unemployment and higher employment. Bolstering incentives to look for and find work, such as through tax reductions and lower unemployment benefits, is one aspect. Labour market policy may also encourage better matching. An efficient Employment Office that provides employer contacts and gives jobseekers active support (‘job coaching’) improves their opportunities to find jobs. Likewise, vocational training adapted to the needs of the labour market can help ensure that jobseekers’ skills better meet the needs of prospective employers.
56
4.2 Wages
Subdued wage growth in 2006
Wage growth has been modest for the last four years. According to preliminary statistics, nominal wage growth in the business sector was 3.2 per cent in 2006. Wages increased at essentially the same rate in the industrial, construction and service sectors. This may seem somewhat surprising in light of strong output and employment growth in construction. Possible explanations for subdued wage growth in the construction sector may be that labour immigration held back wage formation and that labour shortages have been restricted so far to isolated occupational categories, whose wage growth does not have significant impact on average wage growth for the industry.
Wages rose in the local government sector by 2.7 per cent in 2006. The low growth rate is partially explained by the lower-than-average wages of people in bonus jobs employed during the year. Note that the statistics will likely be revised upward due to ‘retroactive wage distributions’. Wages in the central government sector rose by 3.3 per cent.
Improved labour market will accelerate wage growth
Low labour resource utilisation is the primary explanation behind the low wage growth of recent years. Since 2005, however, strong trends in the number of hours worked and the number of people employed has increased resource utilisation. Strong labour market trends are expected to have greater impact on wage growth during the forecast period in parallel with further increases in resource utilisation (see Figure 4.9).
Workers will be in a stronger position for the 2007 wage round compared to the last major wage round in 2004. Agreements are likely to result in higher wage levels this time. (See explanatory box “2007 wage round”.)
Wage growth is expected to accelerate in all sectors, but faster in the business sector than in the general government sector. Wages are expected to rise fastest in construction, given that labour shortages are more severe in that sector than in others.
Figure 4.9 Employment gap and wage growth
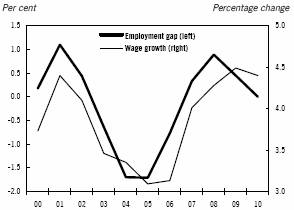
Sources: Statistics Sweden and Ministry of Finance.
The changes to unemployment benefits rules that took effect on 1 January 2007 are likely to restrain wage growth to a certain extent.
Nominal wages in the total economy are expected to increase by 4.0 per cent in 2007 and 4.3 per cent in 2008, with a further increase in wage growth during 2009–2010. Taken as a whole, real wages are forecast to rise by around 2 per cent a year for the next four years (see Figure 4.10).
Figure 4.10 Nominal and real wage growth
Annual percentage change
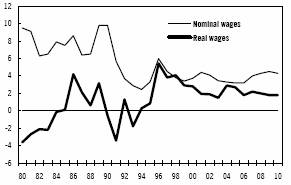
Sources: Statistics Sweden and Ministry of Finance.
Wages are set to rise in the next four years at a rate somewhat faster than considered consistent with long-term productivity and inflation trends. It should, however, be noted that wage growth has been below that level for the past four years.
57
2007 wage round
Some 80 per cent of all workers will be covered by the 2007 wage round. This year’s wage round is comparable in magnitude to the 2001 and 2004 wage rounds. All sectors other than transport and banking will renegotiate agreements in 2007.(30) The majority of agreements in the business sector expired on 31 March. The agreements expire in June in the local government sector and September in the central government sector.
(30) The two sectors not included in this wage round will be renegotiating their agreements in 2008.
‘Industry Agreement’ sets standard
Following several decades of less than ideal wage formation, conditions changed in the 1990s with the advent of the Riksbank’s inflation target and the 1997 Industry Agreement. Negotiations within the framework of the Industry Agreement assume that the scope for wage increases should be based on the economic outlook presented by the Economic Council for Industry. As well, the highly competitive export industry should function as a benchmark for other industries and sectors. During the latest wage rounds, there has been broad consensus that the agreements in industry should set the standard for subsequent agreements.
Wage formation increasingly decentralised
Wage formation has become increasingly decentralised since the late 1990s. Many agreements provide an opportunity for local parties to agree on the total scope for wage increases as well as pay allocation at an individual level. However, the rules are often linked to fall-back agreements that come into effect if the parties fail to agree at the local level. All workers in the central government sector are covered by agreements based on some form of local wage formation. The proportion is 30 per cent in the business sector and 5 per cent in the local government sector.
Outcomes of previous wage rounds
In the latest major wage round in 2004, which covered the entire central government sector and nearly the entire business sector, almost all agreements were equivalent to the 7.3 per cent rise in pay over three years set in industrial negotiations.(31) Most of the agreements in the business sector and all in the central government sector were for three years.
(31) The agreement level refers to agreements including the value of reduced working hours.
Business sector agreements were 0.5 percentage points lower per year than for the previous agreement term of 2001–2003, mainly due to the lower negotiated reduction in working hours. Agreements in the central government sector were 0.3 percentage points lower per year compared to 2001–2003.
The 2005 wage round was not as comprehensive as 2004 and mainly covered the local government sector. Central agreements in the sector are largely similar, providing in most cases 2 per cent a year. The negotiated pay rise for the Swedish Municipal Workers’ Union, by far the largest trade union, was higher than for the others at an estimated 2.9 per cent a year. Overall, the average negotiated pay rise in the local government sector was 2.4 per cent.(32) The Swedish Municipal Workers’ Union agreement was 0.8 percentage points lower than the agreement signed in 2001 and 0.3 percentage points lower than the one-year agreement of 2003.
(32) This agreement level is not directly comparable to the agreement levels referred to in the section above and the table on the following page, because these figures include agreements that do not specify figures.
Agreement levels in relation to actual wage growth
The average agreement level for the total economy in 2004–2006 was 2.0 per cent. During the same period, actual wage growth was 3.2 per cent (see table on the next page). The agreements were 0.4 percentage points lower than the previous period, while actual wage growth was 0.8 percentage points lower. Weak labour resource utilisation that slowed wage drift is the likely reason actual wage growth in 2004–2006 shifted downward more than the agreement
58
level. It should, however, be emphasised that the transition to more decentralised wage formation has made it increasingly difficult to accurately allocate wage growth between negotiated increases and wage drift.(33)
(33) This is because local agreements are not publicised and reports from the National Mediation Office on negotiated wage increases cover only the central agreements. The difference between actual pay increases and negotiated pay increases, which could previously be defined as wage drift, now includes both wage drift and wage increases according to local agreements.
Central agreements and wage outcomes 2001–2006
Percentage change per year
| | Agreements | | Outcomes | |
| | 2001-03 | | 2004-06 | | 2001-03 | | 2004-06 | |
Business sector | | 2.6 | | 2.1 | | 3.8 | | 3.1 | |
Industry | | 2.3 | | 2.0 | | 3.7 | | 3.1 | |
Construction | | 2.6 | | 2.3 | | 4.1 | | 3.0 | |
Private services | | 2.7 | | 2.1 | | 3.8 | | 3.2 | |
Local government | | 2.3 | | 1.9 | | 4.4 | | 3.4 | |
Central government | | 1.8 | | 1.6 | | 4.2 | | 3.1 | |
Total | | 2.5 | | 2.0 | | 4.0 | | 3.2 | |
Note: Average over three calendar years. The figures include agreements that do not specify figures.
Sources: National Institute of Economic Research and National Mediation Office.
Wage demands compared to previous wage round
Initial wage demands by trade unions were generally higher than in the preceding wage round. Certain public statements and opening counter-offers from the management side also point to a higher level this time. If the cost of the ‘gender equality pay pool’ is factored in, the Swedish Trade Union Confederation’s joint agreement demands equal an estimated 4.45 per cent a year, slightly more than 1 percentage point higher than in the 2004 wage round.
But the relevance of initial demands to the final agreement level is highly uncertain. The difference between initial demands and final agreements tends to be large, while calculating the costs associated with the various demands entails certain difficulties.(34)
(34) The last two negotiations for the Swedish Municipal Workers’ Union (SMWU) are an example of how difficult it is to make predictions based on union demands. When SMWU negotiated in 2003, the final agreement level was 2.3 percentage points lower than their demand. In contrast, the agreement level in 2005 was around 1 percentage point lower than demanded. It is noteworthy that the final agreement levels were relatively similar after both negotiation rounds.
Higher agreement levels expected
A comparison of the level of resource utilisation when the preceding wage rounds took place indicates that the agreement level in the 2007 wage round will be higher than in 2004 but lower than in 2001.(35) But it is likely that other factors will also affect the outcome of negotiations. How union members and representatives perceive the latitude allowed by economic conditions is probably significant, for instance. On the one hand, people are more optimistic about the economy in future years than they were in 2001, but the favourable trend in the labour market prior to the 2007 wage round has not endured as long.
(35) At present, the assessed employment gap is slightly negative. In contrast, the assessed employment gap was sharply negative when the 2004 wage round took place and sharply positive in 2001.
The first industrial agreements were reached in mid March 2007. The total cost framework for the agreements totals 10.2 per cent over three years or 3.4 per cent a year on average. Wages will increase by 3.2 per cent a year on average including pay reviews. Other changes include improved occupational pensions and curtailed working hours corresponding to 0.2 per cent a year. However, the substance of the agreements varies from one to the next and between occupational categories (‘white-collar’ and ‘blue-collar’ workers).
A number of adjustments must be made to compare the new industrial agreements with those of 2004. Occupational pensions are not included in short-term wage statistics, for instance. The greater component of guaranteed wage drift expressed as a guaranteed level of pay review makes historical comparison of agreement levels difficult. The guaranteed wage drift is made up mainly of the wage drift that would probably have come about even without an agreement. Comparing the agreements including the guaranteed level of pay review thus provides an overstated view of the upward adjustment of the agreements. The overall assessment is that agreements are around 0.8 percentage points higher in terms of short-term wages than the corresponding agreements in the preceding wage round.
High corporate earnings and more favourable industrial activity than in either 2001 or 2004 are
59
possible reasons the industrial agreements were adjusted upward more than a comparison of resource utilisation in the various years would indicate.
Given the normative role of industry in Swedish wage rounds, the industrial agreements finalised thus far indicate that agreements for other sectors will also be higher than in the two preceding wage rounds. The extent to which a higher central agreement level will affect final wage outcomes is however uncertain.
60
4.3 Inflation
Inflation still subdued, but rising
Inflation began a slow rise in 2005 (see Figure 4.11) that continued in 2006. Inflation measured as the percentage change in the consumer price index (CPI) over a 12-month period averaged 1.4 per cent in 2006. Underlying inflation measured according to the Riksbank’s UND1X was slightly lower at 1.2 per cent. Unlike the CPI, the UND1X was not affected by the rise in mortgage rates in the second half of 2006.(36) Inflation has continued to rise in early 2007. In January and February, average CPI inflation was 2.0 per cent and UND1X inflation was 1.3 per cent.
(36) UND1X excludes interests costs for owner-occupied dwellings and the direct effects on consumer prices caused by changes to indirect taxes and subsidies.
Figure 4.11 Consumer prices
Annual percentage change
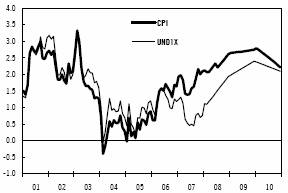
Sources: Statistics Sweden and Ministry of Finance.
Housing costs and domestic goods prices main drivers of CPI inflation
Domestic and international factors both enter into the inflation trend of the last year. Figure 4.12 illustrates the positive or negative impact of price trends for various groups of goods and services on total CPI inflation, expressed in percentage points. As shown, energy prices were a strong contributor to inflation in the first half of 2006 but somewhat less so in the second half. Lower prices for imported goods other than oil and petrol in early 2006 compared to one year before restrained inflation in the first quarter of 2006. These import goods have since had a neutral or mildly inflationary effect.
Figure 4.12 Effects on CPI inflation of prices for various goods and services
Percentage points
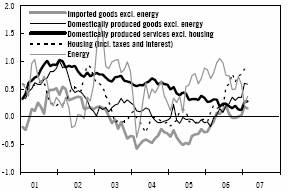
Sources: Statistics Sweden and Ministry of Finance.
Domestic goods prices increasingly contributed to rising inflation in 2006 and early 2007. The contribution from domestic services (excluding housing) continued slipping in 2006 but rebounded slightly in January and February 2007. In those two months, prices increased for categories such as vehicle repair and maintenance, telecommunications services and equipment as well as recreational and cultural services. Prices for telecommunications services and equipment have otherwise been declining (except in isolated months) for several years, due to stiffer competition in the telecommunications market and falling producer prices.
Housing costs are currently the main driver of inflation. After having kept inflation in check since March 2003, rising mortgage rates began contributing to inflation in July 2006.
The rise in inflation over the past year stemmed mainly from higher energy prices, domestic goods prices and housing costs. But for the first time since spring 2003, all goods and service groups reported in Figure 4.12 have been contributing to inflation since April 2006.
Domestic inflationary pressure will rise in 2008
Low labour resource utilisation is the main factor behind the low domestic inflationary pressure of recent years. Employment declined in 2003 and 2004 before climbing again in 2005. There were abundant available resources in the
61
labour market during those years; wage growth was moderate and productivity growth high. Favourable employment growth continued in 2006 in tandem with controlled wage growth and strong productivity growth. Employment is forecast to continue rising rapidly in 2007 and 2008 as available labour market resources progressively shrink. The employment gap (the difference between actual and potential employment, see introduction to Section 4) is set to cross over from the negative position of the last several years to a positive gap in 2007, rising further in 2008. Due to rising labour resource utilisation, estimated wage growth in 2007–2008 will be considerably higher than during the immediately preceding years (see Figure 4.13). Productivity growth is forecast to be somewhat lower than the average in recent years.
Rising domestic cost pressure is expected with higher consumer prices lagging after. Several measures in the Budget Bill for 2007 and in this bill are expected to stimulate labour supply growth and favourably influence wage formation, restraining wage growth and the rise in inflationary pressure in 2008 and afterwards.
Strong demand trends in the total economy are also making it somewhat easier for firms to improve margins.
Figure 4.13 Hourly wage and inflation
Per cent, annual average
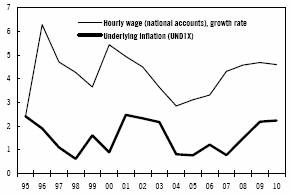
Sources: Statistics Sweden and Ministry of Finance.
Stronger krona leading to declining prices for imports
The consumer price trend for imported goods depends on trends in producer prices for the goods, exchange rate movements and retail margins.
Due mainly to the depreciation of the krona in 2005, import prices (excluding oil) began contributing to inflation in 2006. Exchange rates normally affect consumer prices for imports after a slight lag (see Figure 4.14). The krona rebounded in 2006 only to fall again after the end of the year. The slump is expected to be temporary and a strong krona is forecast (see also Section 2.2), which is expected to result in falling import prices.
Figure 4.14 Exchange rate and imported inflation

Sources: National Institute of Economic Research, Riksbank and Ministry of Finance.
Producer prices for finished goods have been depressed for some years by increased international trade and stiffer competition in the world market, which are aspects of globalisation. The phenomenon has also restrained inflation in Sweden. Long-term, the trend should affect only consumer prices and not the inflation rate, but adjustment to the new level will likely be a protracted process lasting several years.
Both exchange rate movements and trends in producer prices for imported finished goods are expected to further reduce prices for imported consumer goods, holding down inflation during the forecast period.
Oil prices will check inflation
Oil prices reached very high levels intermittently in 2006 but declined towards the end of the year. Previously inflationary, prices for heating oil and petrol are now having a deflationary impact. Oil prices started 2007 by rising once again, but are still lower now than during most of 2006.
Measured in dollars, oil prices are expected to remain stable in 2007 and 2008 and decline in the two following years (see Section 1.4 and Figure 4.15). The direct impact of oil price trends in
62
dollars on Swedish consumer prices is neither immediate nor complete; as for other imported goods, the impact also depends on the exchange rate and trade margins, in this case for oil companies. Due to the forecast appreciation of the krona, oil prices measured in Swedish kronor will decline during the forecast period despite remaining stable near current levels in 2007 and 2008. The deflationary impact of consumer prices for petrol and heating oil is expected to continue.
The indirect effects of high oil prices are difficult to quantify, as they involve factors such as how firms pass on increased costs (such as for transport) to consumers. The current assessment is that indirect effects of high oil prices in recent years may continue contributing to somewhat higher inflation in 2007 and 2008.
Figure 4.15 Oil price in USD and SEK and petrol in the CPI
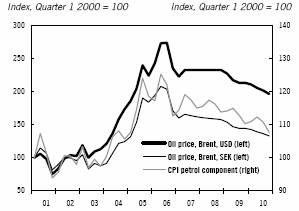
Sources: Statistics Sweden, Reuters and Ministry of Finance.
Low rent increases this year
Residential rents are one of the main CPI items contributing to the low inflation of 2006. Centrally negotiated rent agreements so far indicate rent increases will be higher than in 2006, but still relatively low in 2007. Rents are expected to rise by 1.7 per cent during 2007. Due to higher interest rates, energy costs and maintenance costs, rents are expected to increase by about 2.9 per cent in 2008, consistent with the trend since 2000.
Falling electricity prices in 2007
Consumer prices for electricity were high in 2006, pulling up inflation. The spot price (for immediate delivery) on the Nordpool Nordic power exchange remained high for most of 2006 but fell sharply in autumn and continued dropping through the early months of 2007. The price of electricity for delivery at a later date also fell, but not as dramatically as the spot price. The average price of electricity to consumers has so far not declined in parity with the drop in the spot price on the power exchange.
Consumer prices for electricity are expected to decline further in spring 2007 before beginning a slow upturn. The price of electricity is expected to reduce CPI inflation by 0.4 percentage points in late 2007 and increase it by 0.2 percentage points in late 2008.
Rising mortgage rates will increase the CPI
Based on the interest forecast provided in Section 2.2, mortgage interest costs for owner-occupied dwellings is expected to swell CPI inflation throughout the forecast period. CPI inflation will thus be higher than underlying inflation measured with UND1X. Mortgage rates are expected to increase CPI inflation in late 2007 by 0.9 percentage points. The impact will be less in following years, but mortgage rates are still expected to contribute 0.2 percentage points to CPI inflation in late 2010.
Tax and subsidy changes inflationary in 2007 and deflationary in 2008
A number of tax reforms, including increases in taxes on tobacco and energy, were implemented in January 2007 that contributed overall to pushing up CPI inflation. The government has announced a number of other changes to taxes and subsidies in 2007 including a new tax on car insurance premiums, permanent implementation of congestion charges in Stockholm and tax reductions for household services. For 2008, the government has announced reduced social contributions for certain segments of the service sector and a new central government subsidy for dental care. Overall, the net effect of tax and subsidy reforms is expected to increase CPI inflation by around 0.4 percentage points in December 2007 and reduce it by around 0.2 percentage points in December 2008.
63
Inflation will rise above Riksbank target in 2009–2010
The overall assessment is that underlying inflation will remain low in 2007, in part due to a stronger krona, low electricity prices and low rent increases. Rising labour resource utilisation is expected to bring higher wage growth than in recent years along with slackening productivity growth. The impact of these factors on inflation will manifest after a time lag. The low wage growth and high productivity growth of recent years will check inflation this year to a certain extent, but underlying inflationary pressure is set for a relatively rapid rise in 2008. The upturn in inflation in 2008 will be constrained somewhat by the tax and subsidy reforms discussed above.
The interest forecast in Section 2.2 assumes successive increases in the repo rate throughout 2007–2008 and tighter monetary policy. As a result, demand and employment growth in the total economy and labour resource utilisation will be somewhat lower in 2009 than in 2008. But the employment gap will remain positive and wage growth will accelerate slightly. The employment gap will close the following year, 2010, but will hold back wage growth only slightly, due to the strong labour market in prior years. The supply stimulating policy is expected to hold back wage growth for the entire period.
Due to the high level of resource utilisation in 2009, inflation is expected to increase modestly throughout the year before slowing in 2010 (see Table 4.5).
Table 4.5 Consumer prices
Annual percentage change
| | 2006 | | 2007 | | 2008 | | 2009 | | 2010 | |
CPI, December | | 1.6 | | 2.1 | | 2.6 | | 2.7 | | 2.2 | |
CPI, annual average | | 1.4 | | 1.8 | | 2.3 | | 2.7 | | 2.5 | |
UND1X, December | | 1.2 | | 0.8 | | 1.9 | | 2.4 | | 2.1 | |
UND1X, annual average | | 1.2 | | 0.8 | | 1.5 | | 2.2 | | 2.2 | |
Sources: Statistics Sweden and Ministry of Finance.
Uncertainty associated with energy prices and domestic inflationary pressure
Assessment of domestic inflationary pressure is a significant source of uncertainty in the forecast, especially for 2008 and afterwards. Domestic inflationary pressure has often been overestimated in recent years (see also Section 6.1), and consumer prices may increase less than predicted in this forecast, due to sustained favourable productivity growth and heightened competition.
On the other hand, prices may rise faster than expected in 2008–2010 if firms increase margins above forecast in response to strong domestic demand. It is also possible that high demand for labour will stimulate higher wage growth than assumed in the forecast, either generally or in isolated industries.
Finally, there is uncertainty related to the supply stimulant impact of government policy. If the impact is greater than expected, it will contribute to moderating inflation and vice versa.
Oil and electricity price forecasts are highly uncertain and have sizable impact on inflation. Accordingly, these forecasts entail some risk that inflation will be higher or lower than expected throughout the forecast period.
64
5 General government sector
Strong finances in general government
General government finances are assessed as stronger now than calculated in the Budget Bill for 2007. Set to increase during the forecast period, net lending was 3.1 per cent of GDP in 2006 (see Table 5.1), adjusted for new accounting procedures for the premium pension system (PPS) (see Section 5.5 for a review of the effects).
Table 5.1 General government net lending
Percentage of GDP
| | 2006 | | 2007 | | 2008 | | 2009 | | 2010 | |
Spring budget bill | | 2.1 | | 2.3 | | 2.2 | | 2.5 | | 3.2 | |
PPS | | 1.0 | | 1.0 | | 1.0 | | 1.0 | | 0.9 | |
Spring budget bill incl. PPS | | 3.1 | | 3.3 | | 3.2 | | 3.5 | | 4.1 | |
Budget bill 2007 | | 2.8 | | 2.3 | | 2.6 | | 3.1 | | — | |
Sources: Statistics Sweden and Ministry of Finance.
5.1 General government finances
General government finances strengthened over the last three years and net lending was SEK 60 billion, or 2.1 per cent of GDP, in 2006, outperforming the surplus of 1.9 per cent of GDP in 2005.
Figure 5.1 Net lending, revenue and expenditure
Percentage of GDP
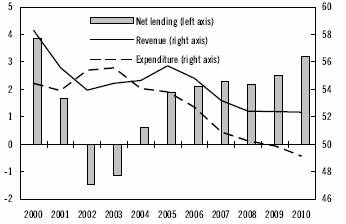
Sources: Statistics Sweden and Ministry of Finance.
Revenues and expenditures both declined as a percentage of GDP. All general government sub-sectors showed surpluses (see Figure 5.1).
General government financial assets exceeded liabilities by SEK 444 billion or 15.6 per cent of GDP at the end of 2006. The general government sector’s property income (interest receivable and dividends) also exceeds interest payable. The strong net worth should be regarded in light of assets in the National Pension System buffer funds, which amounted to SEK 850 billion. Consolidated gross debt was 46.9 per cent of GDP, comfortably below the EU reference value of 60 per cent of GDP.
Table 5.2 General government finances
SEK billion unless otherwise stated
| | 2006 | | 2007 | | 2008 | | 2009 | | 2010 | |
Revenue | | 1 556 | | 1 606 | | 1 671 | | 1 749 | | 1 830 | |
Percentage of GDP | | 54.8 | | 53.2 | | 52.4 | | 52.4 | | 52.3 | |
Taxes and charges | | 1 403 | | 1 431 | | 1 498 | | 1 571 | | 1 647 | |
Percentage of GDP | | 49.4 | | 47.4 | | 47.0 | | 47.1 | | 47.1 | |
Property income | | 63 | | 69 | | 67 | | 68 | | 70 | |
Other income | | 90 | | 105 | | 106 | | 109 | | 113 | |
65
Expenditure | | 1 496 | | 1 536 | | 1 602 | | 1 665 | | 1 718 | |
Percentage of GDP | | 52.7 | | 50.9 | | 50.3 | | 49.9 | | 49.1 | |
Primary expenditure | | 1 442 | | 1 481 | | 1 546 | | 1 610 | | 1 665 | |
Interest | | 54 | | 55 | | 56 | | 55 | | 53 | |
Net lending | | 60 | | 69 | | 69 | | 83 | | 112 | |
Percentage of GDP | | 2.1 | | 2.3 | | 2.2 | | 2.5 | | 3.2 | |
Central government | | 19 | | 32 | | 33 | | 58 | | 93 | |
Old-age pension system | | 30 | | 26 | | 22 | | 16 | | 11 | |
Local government | | 10 | | 11 | | 13 | | 10 | | 8 | |
Financial position | | | | | | | | | | | |
Net debt | | -444 | | -511 | | -587 | | -668 | | -780 | |
Percentage of GDP | | -15.6 | | -16.9 | | -18.4 | | -20.0 | | -22.3 | |
Consolidated gross debt | | 1 331 | | 1 235 | | 1 167 | | 1 074 | | 943 | |
Percentage of GDP | | 46.9 | | 40.9 | | 36.6 | | 32.2 | | 27.0 | |
Note: Consolidated gross debt is defined by EU rules (the Maastricht criteria).
Sources: Statistics Sweden and Ministry of Finance.
The expansionary economy is providing fiscal scope to implement tax reductions and other reforms. Enacted and proposed tax reductions are expected to sharply reduce tax receipts and revenue as a percentage of GDP, while expenditures decline to an equal extent. Net lending is virtually unchanged compared to 2006 at slightly higher than 2 per cent of GDP in 2007 and 2008 (see Table 5.2).
Net lending is set to improve successively in 2009 and 2010. The surplus will continue to strengthen the general government sector’s net worth. Gross debt will also be reduced following
66
the planned divestment of state shareholdings. Estimated consolidated debt should equal 27 per cent of GDP at the end of the forecast period (see Figure 5.2).
Figure 5.2 Consolidated gross debt
Percentage of GDP
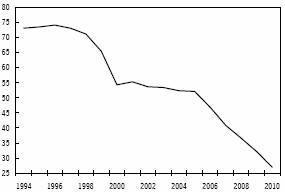
Sources: Statistics Sweden and Ministry of Finance.
Taxes and social insurance contributions
The tax receipts reported in the National Accounts for the general government sector are somewhat lower than total tax receipts. The portion of value added tax and customs receipts included in the EU contribution are reported as transfers to the rest of the world and not as tax receipts in the general government sector.
The tax ratio in 2006 was 49.8 per cent, of which 30.3 percentage points or slightly more than 60 per cent consisted of taxes and social security contributions due on income from wages and social benefits. Receipts from taxes on social benefits are around 4 per cent of GDP. Social benefits are taxed in Sweden, which impedes comparison of the tax ratio with countries where pensions, sickness allowance and other social benefits are not taxed.
Tax on property income corresponded to 6.5 per cent of GDP, the highest percentage since 2000 when tax on property income equalled 7.3 per cent of GDP. Tax on corporate profits accounted for more than half of tax on property income in 2006. Tax receipts on household property income have increased in recent years due to higher capital gains and dividends. Receipts from tax on household property income were 1.1 per cent of GDP in 2006, compared to 1.7 per cent of GDP in 2000.
Table 5.3 Taxes and charges
Percentage of GDP
| | 2006 | | 2007 | | 2008 | | 2009 | | 2010 | |
Taxes on employment and transfers | | 30.3 | | 28.9 | | 28.6 | | 28.8 | | 28.8 | |
Income tax | | 17.3 | | 16.0 | | 16.0 | | 16.1 | | 16.2 | |
Payroll charges | | 12.9 | | 12.9 | | 12.6 | | 12.6 | | 12.6 | |
Taxes on property income | | 6.5 | | 5.8 | | 5.7 | | 5.7 | | 5.8 | |
Household | | 1.1 | | 0.8 | | 0.7 | | 0.6 | | 0.7 | |
Company profits | | 3.4 | | 3.3 | | 3.3 | | 3.3 | | 3.3 | |
Property tax | | 0.9 | | 0.9 | | 0.8 | | 0.8 | | 0.8 | |
Other taxes on capital | | 1.1 | | 0.8 | | 0.9 | | 0.9 | | 1.0 | |
Value added tax | | 9.3 | | 9.3 | | 9.3 | | 9.3 | | 9.4 | |
Other taxes | | 3.7 | | 3.7 | | 3.6 | | 3.5 | | 3.4 | |
Total | | 49.8 | | 47.7 | | 47.2 | | 47.3 | | 47.3 | |
General government | | 49.4 | | 47.4 | | 47.0 | | 47.1 | | 47.1 | |
EU | | 0.3 | | 0.2 | | 0.2 | | 0.2 | | 0.2 | |
Note: Total tax revenues are according to the National Accounts and broken down into different categories by the Ministry of Finance. For 2005, the preliminary outcome of the National Accounts is SEK 2 billion lower than the Ministry of Finance’s assessment. The difference, which is equivalent to 0.1 per cent of GDP, has been added to Other Taxes in the table.
Sources: Statistics Sweden and Ministry of Finance.
67
Value added tax equalled 9.3 per cent and other taxes 3.7 per cent of GDP (see Table 5.3).
Household income tax was reduced this year by means of a tax reduction on income from employment (the earned income tax credit), which reduced tax receipts by SEK 40 billion. The tax reduction has been financed in part through reduced tax deductions (see Table 5.4).
Aimed at stimulating employment, employer’s social contributions will be reduced for youth and older workers and, starting in 2008, for certain service industries. A tax reduction for household services will also take effect on 1 July 2007. The current general reduction of employer’s social contributions will be halved. The overall effect of regulatory changes will be a reduction in employer’s social contributions.
Capital gains are expected to fall towards a more normal level from an historical perspective, reducing household taxes on property income. Corporate taxes are expected to decline somewhat as a percentage of GDP, despite sustained strong earnings growth.
Tax assessment values for real property will be frozen at the 2006 level starting in 2007. The government is announcing in this bill the repeal of the wealth tax as of 2007, which will reduce tax receipts by around SEK 5 billion. The announced proposal to repeal the state property tax was not factored into the calculations.
68
Value added tax as a percentage of GDP in 2007 is expected to remain at the 2006 level, or 9.3 per cent of GDP. Among selective purchase taxes, the tax on tobacco has been increased. A tax on auto insurance premiums will be implemented, aimed at transferring to liability insurance the costs of social insurance benefits paid to victims of traffic accidents.
Overall, the tax ratio will decline sharply in 2007 to 47.7 per cent of GDP, the lowest since the mid 1980s. The reduction of 2.1 percentage points between 2006 and 2007 equals SEK 65 billion, including an estimated SEK 42 billion stemming from regulatory changes taking effect in 2007. The tax ratio will decline slightly in 2008 as well, when regulatory changes either take effect or reach full impact.
Table 5.4 Regulatory changes in the tax system; gross effects compared to preceding year
SEK billions
| | 2006 | | 2007 | | 2008 | | 2009 | | 2010 | |
Taxes on employment | | -11 | | -36 | | -9 | | 0 | | 0 | |
Taxes on property income | | -2 | | -9 | | 0 | | 0 | | 0 | |
Taxes on consumption and input goods | | 3 | | 2 | | 1 | | 1 | | 0 | |
Total | | -10 | | -42 | | -7 | | 1 | | 0 | |
Source: Ministry of Finance.
Other incomes
In addition to tax receipts, the general government sector has other incomes, which amounted to SEK 153 billion or 5.4 per cent of GDP in 2006. Around 40 per cent is provided by property income (interest receivable and dividends), of which around one third derives from direct returns on the National Pension Funds. Property income is set to rise sharply in 2007 due to higher dividends.
Other income will increase by SEK 15 billion in 2007, including SEK 10 billion stemming from increases in personal contributions to unemployment benefit funds. In addition, other incomes consist mainly of imputed pension contributions and consumption of fixed capital. This income is imputed and offset on the expenditure side by equally large costs, which are included in general government final consumption.
Expenditure
General government expenditure expressed as a percentage of GDP (the expenditure ratio) declined over the past three years to 52.7 per cent in 2006. Continued successive decline in the expenditure ratio is expected during the forecast period (see Table 5.5).
Social benefits to households, which accounted for one third of expenditures in 2006, will decline in relation to GDP during the forecast period.
Pension benefits account for nearly half of social benefits to households and 16 per cent of general government expenditure. The retired population has remained relatively unchanged for a long time, but has begun rising in recent years. Pension benefits are set to rise relatively sharply towards the end of the forecast period due to the rising population of senior citizens and the higher pension levels of new retirees.
The number of sickness benefit days has been declining since 2002, a trend expected to continue in 2007. For subsequent years, only a computational projection is made, by which the number of sickness benefit days for 2008–2010 has been set at the 2007 level. The lower number of sickness benefit days does not mean that overall ill health has declined to the same extent in recent years, given the sharp increase in the numbers receiving sickness and activity compensation (formerly disability pension). This trend is now assessed as reversing and the number of people receiving sickness and activity compensation is expected to decline during 2007–2010. Expenditure on personal assistance grants, which rose from SEK 7 billion in 2000 to SEK 16 billion in 2006, is estimated to rise at a somewhat lower rate during the forecast period .
There was a slight decline in the number of unemployed people, including participants in labour market policy programmes, in 2006. Several changes to the unemployment insurance system were implemented in 2007 and the number of participants in labour market policy programmes was scaled back. The total number of openly unemployed persons and participants in labour market policy programmes is set to decline sharply in 2007 and somewhat again in 2008. Labour market-related social benefits will decline due to the volume trend and reduced benefits ceilings.
69
Social benefits related to family circumstances increased sharply in 2006 consequent upon the increase in the parental insurance benefits ceiling to ten price base amounts as of 1 July. A relatively moderate increase in social benefits related to family circumstances is expected during the forecast period. The improved labour market is set to reduce other social benefits to households, such as student aid and social assistance, in relation to GDP during the forecast period.
Other transfers and subsidies equalled 3.4 per cent of GDP in 2006. International development assistance increased sharply in the past two years, approaching 1 per cent of GDP in 2006. Sweden’s contribution to the EU budget was also equal to around 1 per cent of GDP. The contribution to EU funding will be reduced during the forecast period when a decision on reduction of the contribution is expected to take effect.
General government consumption was 26.7 per cent of GDP in 2006 and accounted for half of general government expenditure. See Section 3 for a discussion of trends in general government consumption. GDP will rise faster than general government consumption in current prices, but the latter will increase as a percentage of expenditures.
Gross capital formation in the general government sector increased sharply in 2006 to 3 per cent of GDP. Lower but still strong increases are expected in 2007 and 2008.
Table 5.5 General government expenditure
Percentage of GDP
| | 2006 | | 2007 | | 2008 | | 2009 | | 2010 | |
Transfers to households | | 17.7 | | 16.6 | | 16.1 | | 16.1 | | 16.1 | |
Pensions | | 8.4 | | 8.2 | | 8.1 | | 8.3 | | 8.4 | |
Ill-health | | 4.2 | | 3.8 | | 3.7 | | 3.6 | | 3.6 | |
Labour market | | 1.4 | | 1.0 | | 0.9 | | 0.9 | | 0.9 | |
Family and children | | 1.9 | | 1.8 | | 1.7 | | 1.7 | | 1.7 | |
Other | | 1.8 | | 1.7 | | 1.6 | | 1.5 | | 1.5 | |
Other transfers | | 3.4 | | 3.0 | | 3.0 | | 2.9 | | 2.4 | |
Consumption | | 26.7 | | 26.5 | | 26.3 | | 26.3 | | 26.1 | |
Investment | | 3.0 | | 3.1 | | 3.1 | | 3.1 | | 3.0 | |
Interest | | 1.9 | | 1.8 | | 1.8 | | 1.6 | | 1.5 | |
Total | | 52.7 | | 50.9 | | 50.3 | | 49.9 | | 49.1 | |
exclusive interest | | 50.8 | | 49.1 | | 48.5 | | 48.2 | | 47.6 | |
Sources: Statistics Sweden and Ministry of Finance.
Interest income payable equalled 1.9 per cent of GDP in 2006 compared to 4.2 per cent of GDP in 2000. Due to the reduction of central government debt, interest income payable should continue declining despite the forecast increase in interest rates.
5.2 Fiscal policy targets
Fiscal policy is governed by two medium-term targets. The first is the surplus target, which is average general government net lending of 1 per cent of GDP over a business cycle. Secondly, central government and pension system expenditures combined must not exceed an expenditure ceiling set three years in advance. Finally, there is a balanced budget requirement for the local government sector. The expenditure ceiling has been in effect since 1997 and the surplus target and balanced budget requirement since 2000.
This section presents an evaluation of the surplus target and expenditure ceilings along with an assessment of fiscal policy stance.
In addition, the section discusses reinforcements of the fiscal policy framework in accordance with the government’s proposals and assessments provided in the Spring Fiscal Policy Bill. The government intends to continue examining opportunities for further improvements to the framework during the electoral term.
Surplus target
A surplus target equal to 2 per cent of GDP was set in 2000. Since that time, Eurostat has adopted new accounting rules in relation to funded pension systems. Due to the change, savings in the Swedish premium pension system are reported in the household sector as of 2007, rather than the general government sector, reducing general government net lending by around 1 per cent of GDP a year (see Section 5.5). Consequent upon this technical change, the government is proposing a new surplus target for the general government sector of on average 1 per cent of GDP over a business cycle.
70
Table 5.6 Net lending in general governmnet
Percentage of GDP, unless otherwise stated
| | 2000 | | 2001 | | 2002 | | 2003 | | 2004 | | 2005 | | 2006 | | 2007 | | 2008 | | 2009 | | 2010 | |
Net lending, SEK billions | | 85 | | 38 | | -34 | | -28 | | 15 | | 51 | | 60 | | 69 | | 69 | | 84 | | 112 | |
Net lending | | 3.8 | | 1.7 | | -1.5 | | -1.1 | | 0.6 | | 1.9 | | 2.1 | | 2.3 | | 2.2 | | 2.5 | | 3.2 | |
Adjusted for business cycle | | -0.7 | | 0.3 | | 0.5 | | 0.7 | | 0.4 | | 0.5 | | -0.1 | | -0.3 | | -0.6 | | -0.3 | | 0.0 | |
Adjusted for one-offs(1) | | -0.5 | | 0.0 | | 0.0 | | 0.0 | | -0.5 | | -0.4 | | 0.0 | | 0.0 | | 0.0 | | 0.0 | | 0.0 | |
Adjusted, extraordinary capital gains | | | | | | | | | | | | | | | | | | | | | | | |
tax revenue | | -0.9 | | -0.1 | | 0.2 | | 0.2 | | 0.1 | | -0.2 | | -0.4 | | -0.1 | | 0.0 | | 0.0 | | 0.0 | |
Structural balance | | 1.7 | | 1.9 | | -0.8 | | -0.2 | | 0.6 | | 1.8 | | 1.6 | | 1.9 | | 1.6 | | 2.3 | | 3.2 | |
Net lending, average from 2000 | | 3.8 | | 2.8 | | 1.4 | | 0.7 | | 0.7 | | 0.9 | | 1.1 | | 1.2 | | 1.3 | | 1.5 | | 1.6 | |
Output gap, per cent | | 1.2 | | -0.5 | | -0.8 | | -1.3 | | -0.7 | | -1.0 | | 0.1 | | 0.6 | | 1.1 | | 0.5 | | 0.0 | |
(1) The one-off effects in 2004 and 2005 were due to higher tax receipts after certain companies reversed all or portions of their provisions to reserves, making the funds subject to taxation.
Sources: Statistics Sweden and Ministry of Finance.
The primary purpose of the surplus target is to strengthen general government net worth in preparation for future demographic strains on public welfare systems, while meeting the need to achieve uniform intergenerational distribution of the resources allocated by the general government sector. The figure below illustrates the impact of demographic trends on general government finances until 2050. With a budget surplus in the general government sector until 2015, central government debt in 2050 is expected to be about the same as in the early 2000s.
Figure 5.3 Central government debt 2000–2050, excluding proceeds from sales
Percentage of GDP
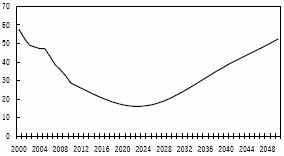
Note: Changes in both incomes and expenditures are due to demographic trends. Wage-dependent expenditures in the calculation are wage-indexed, i.e., real tax rates are the same as 2015, but incomes vary with growth and demographic trends.
Sources: National Debt Office and Ministry of Finance.
Maintaining a surplus creates the prerequisites for eliminating the need for tax increases in response to higher costs resulting from population growth.
Predictable developments in taxes and expenditures also provide stable ground rules for individuals and firms, promoting economic efficiency and low interest rates, which promote healthy economic development.
The target also creates latitude for avoiding too large deficits in a contractionary economy. Hence, the EU criterion that deficits must not exceed 3 per cent of GDP can be met.
General government finances are affected by automatic variations in tax receipts and expenditures over a business cycle. That combined with the normal uncertainty about economic trends means the surplus for individual years may diverge from 1 per cent of GDP without endangering the medium-term target. This represents an attempt to strike a balance between short-term flexibility in economic stabilisation policies and long-term sustainability. For that reason, the surplus target is stated as an average over a business cycle.
71
Expenditure ceiling
The expenditure ceiling for the central government is the main instrument used to attain the surplus target. It is a key tool in the budget process, as it prevents temporarily higher income from leading to permanently higher expenditures and promotes the setting of clear priorities for central government expenditures.
Surplus target indicators
Evaluations of whether the surplus target has been attained should consider that business cycle durations are uncertain and may vary over time. Indicators for evaluating target attainment are discussed below.
72
Average net lending
A new indicator for assessing whether the proposed fiscal policy is consistent with the surplus target has been introduced with the 2007 Spring Fiscal Policy Bill. The indicator is forward-looking and is a moving average over seven years, computed for three years before and three years after the current year. The average must also be adjusted for significant, clearly defined one-off effects.(37)
(37) An example would be the higher incomes resulting from the institution of interest charges on tax allocation reserves as of 1 January 2004. In response, many firms chose to reverse all or portions of their tax allocation reserves, making the funds subject to taxation. The temporary tax receipts from reversed tax allocation reserves are estimated at SEK 10 billion for 2004 and SEK 13 billion for 2005.
Given that the average also includes three forward-looking years, which is the medium-term fiscal policy horizon, this type of indicator is useful in discussions of the direction of fiscal policy. For 2007, the average discussed above is computed for 2004–2010 and is equal to 2.0 per cent of GDP. The indicator shows that the direction of the proposed fiscal policy is clearly consistent with the surplus target.
Table 5.7 Net lending: moving average for seven years excluding premium pension system
Percentage of GDP
| | 2004 | | 2005 | | 2006 | | 2007 | |
Average in Spring budget bill | | 0.7 | | 0.8 | | 1.4 | | 2.0 | |
Source: Ministry of Finance.
The indicator for 2007 is thus an average of net lending for 2004–2010 and amounts to 2.0 per cent of GDP.(38)
(38) Average adjusted for one-off effects in 2004 and 2005 attributable to tax receipts stemming from corporate reversals of reserve provision, which made the funds taxable. Total one-off effects of this type make up around 1 per cent of GDP.
Net lending will be high throughout the electoral term
The average indicator shows that net lending during the forecast period will be above the surplus target, which it should be in an expansionary economy. However, the entire amount above the target cannot be used for reforms. The most important reason is that in the current business cycle, the economy could be overheated by a stimulus. Reserves are also required as a buffer against future economic downturns. It is difficult to estimate the reserve requirement, but based on experience from the relatively moderate weakening of resource utilisation in 2002–2004, it may be estimated at around SEK 80-100 billion, at least. A buffer to cover other uncertainties is also needed. The greatest uncertainties apply to developments in relation to sickness benefits and other health related expenditures and how taxes on property income evolve.
Structural balance
A supplementary indicator called the structural balance may be used to assess whether net lending in individual years is consistent with the target. This indicator consists of net lending adjusted for variations in general government incomes and expenditures dependent on economic activity, and for temporary effects of other types. Adjusted net lending reflects the underlying or ‘structural’ level of net lending.
Adjustment of net lending to the business cycle is based on assessing the state of the economy and its effects on general government finances. Economic conditions are described using the GDP gap, which is the difference in percentage between actual and potential GDP. Calculations of the GDP gap are provided in Section 4. In the Ministry of Finance’s judgement, a change of 1 percentage point in the output gap will affect general government net lending by an average of 0.55 per cent of GDP.
Sensitivity may vary from year to year depending on how various output components develop in relation to each other. It must be emphasised that calculation of the structural balance is tentative, especially given that the assessment of potential output is uncertain.
The structural balance has varied both above and below 1 per cent of GDP since 2000 (see Table 5.6). Resource utilisation in the total economy began rising in 2006 and a positive GDP gap is expected for both 2007 and 2008. As a result, the structural balance is expected to be somewhat lower than actual net lending and equal 1.9 per cent of GDP in 2007 and 1.6 per cent in 2009. The output gap should close during 2009 and 2010 and the structural balance coincide with actual net lending at the end of the forecast period.
73
Table 5.8 Central government expenditure ceiling
SEK billions, unless otherwise stated
| | 2000 | | 2001 | | 2002 | | 2003 | | 2004 | | 2005 | | 2006 | | 2007 | | 2008 | | 2009 | | 2010 | |
Expenditure ceiling | | 720 | | 746 | | 773 | | 803 | | 836 | | 870 | | 907 | | 938 | | 971 | | 1 003 | | 1 033 | |
Percentage of GDP | | 32.5 | | 32.6 | | 32.6 | | 32.7 | | 32.6 | | 32.6 | | 32.0 | | 31.1 | | 30.5 | | 30.0 | | 29.6 | |
Budget margin | | 5.0 | | 4.7 | | 0.4 | | 2.9 | | 2.4 | | 5.7 | | 11.8 | | 26.1 | | 18.7 | | 32.8 | | 26.5 | |
Expenditure under the ceiling | | 715 | | 741 | | 773 | | 800 | | 834 | | 864 | | 895 | | 912 | | 952 | | 970 | | 1 007 | |
Percentage of GDP | | 32.2 | | 32.4 | | 32.6 | | 32.5 | | 32.5 | | 32.4 | | 31.5 | | 30.2 | | 29.9 | | 29.1 | | 28.8 | |
Note: The expenditure ceiling and ceiling-limited expenditures have been adjusted for technical changes. The budgetary margin is the difference between a determined or assessed expenditure ceiling and the ceiling-limited expenditures.
Sources: Statistics Sweden and Ministry of Finance.
Fiscal policy consistent with surplus target
The average indicator shows that the fiscal policy is consistent with the surplus target. The size of the structural balance in 2007 and immediately following years supports that assessment.
Ex post evaluation
Average net lending for 2000–2006 of 1.1 per cent of GDP is a logical indicator for ex post evaluation of the surplus target. Of the average, 0.2 per cent of GDP is attributable to positive one-off effects of taxes on corporate profits (reversed tax allocation reserves and extra dividends from Alecta, an insurance company).
Expenditure ceiling
If the now proposed reinforcements of the fiscal policy framework are adopted, the two general targets, the expenditure ceiling for central government and general government net lending (the surplus target) will be retained and the formulation clarified in several respects. That expenditures subject to the ceiling must not exceed the adopted expenditure ceiling for central government remains a central commitment of fiscal policy. The expenditure ceilings have been met every year since they were introduced (see Table 5.8).
The formulation of the expenditure ceiling will become even clearer, in that the ceiling must explicitly support the surplus target. In addition, there should be a modest reduction in expenditure ceilings as a percentage of GDP.
According to the reinforcement of the financial framework now proposed, the government aims to re-establish a distinct medium-term perspective for expenditure ceilings by which they are set three years in advance.
Beyond a return to a medium-term horizon, the government is proposing several specific measures to strengthen the framework, including the transfer of expenditures reported on the income side of the budget to the expenditure side.
Certain changes in the composition of general government finances may call for technical adjustments of the expenditure ceiling. Technical adjustments are unavoidable, but should be symmetrical in the sense that the same principles are applied regardless of whether they involve raising or lowering the expenditure ceiling.
In the government’s judgement, Eurostat’s reclassification of savings in the premium pension system to the household sector justifies their elimination from ceiling-limited expenditures and provides reason for a technical adjustment of the expenditure ceiling in the Budget Bill for 2008 to ensure consistency with the surplus target.
5.3 Fiscal policy
The effects of variations in general government finances on private sector demand are difficult to assess for several reasons. Tax reforms directed at households probably have a different effect than those directed at firms. Likewise, households with different propensities to consume respond in various ways to fiscal stimuli.
Public consumption and public capital formation expenditure also have direct impact on demand. But variations in net lending due to changes in transfers to the rest of the world, such as development assistance and the EU contribution, have no impact on demand in the Swedish economy.
74
Confidence in the long-term sustainability of general government finances is required for fiscal policy to have the desired effects. Households become more cautious and save more when government deficits are large, as the shortfalls must sooner or later be financed with tax increases or spending cutbacks. Conversely, consumer confidence may increase when general government finances are showing large surpluses.
For these reasons, changes in general government net lending measures the general government sector’s stimulus to private sector demand, but is only a rough indicator of the fiscal impact of general government finances on demand in the total economy.
The change in general government net lending from year to year may be described based on three components that affect net lending: automatic stabilisers, discretionary fiscal policy and other factors that affect the balance.
Automatic stabilisers are a key component of the stabilisation policy. Above-trend GDP growth bolsters general government finances and dampens income growth in the private sector, which helps constrain domestic demand and reduces the risk of overheating. Below-trend growth stimulates the economy. The automatic stabilisers thus cushion the impact of cyclical fluctuations.
Discretionary fiscal policy is made up of active reform decisions. A list of previously adopted and now proposed or announced reforms is provided in Chapter 4 of this bill. The budgetary impact refers to the year decisions take effect, regardless of when they were made.
General government finances are affected by several other factors in addition to discretionary fiscal policy and the automatic stabilisers. These factors include the composition of GDP growth, changes in property income and interest income payable following on changes in the general government sector’s assets and liabilities, interest rates and trends in social benefits expenditures due to demographic trends or behavioural changes. Finally, general government finances are affected by policy decisions in the local government sector.
The change in general government net lending is made up of the total of the three components above. Changes in actual net lending measures the general government sector’s stimulus to demand. The change in the structural balance (the change in net lending not dependent on automatic stabilisers) is an indicator of the fiscal policy stance. This indicator thus comprises not only decisions on reforms and savings in the central government budget, but also factors that affect the balance, in addition to the business cycle, such as changes in local government net lending and changes in general government net lending due to structural changes in the economy.
Fiscal policy stance 2007–2010
The fiscal policy stance is assessed as largely neutral in 2007, meaning it neither stimulates demand nor constrains economic activity. Changes in the structural balance and general government net lending are expected to be moderately positive between 2006 and 2007. There is likely to be only slight effect on demand from the decline in net lending stemming from repeal of the wealth tax. Consequently, fiscal policy will contribute to stable conditions for monetary policy operations.
Table 5.9 Indicators of stimulus to demand
Change in per cent of GDP
| | 2006 | | 2007 | | 2008 | | 2009 | | 2010 | |
Net lending | | 0.2 | | 0.2 | | -0.1 | | 0.3 | | 0.7 | |
of which | | | | | | | | | | | |
Automatic stabilizers | | 0.6 | | 0.2 | | 0.3 | | -0.3 | | -0.3 | |
On off effects | | -0.4 | | 0.0 | | 0.0 | | 0.0 | | 0.0 | |
Extraordinary capital gains tax revenue | | 0.2 | | -0.3 | | -0.1 | | 0.0 | | 0.0 | |
Structural balance | | -0.2 | | 0.3 | | -0.3 | | 0.7 | | 1.0 | |
of which | | | | | | | | | | | |
Discretionary fiscal policy | | -1.2 | | -0.7 | | -0.2 | | 0.1 | | 0.1 | |
capital costs, net | | 0.1 | | 0.1 | | -0.1 | | 0.0 | | 0.1 | |
Other factors | | 0.9 | | 0.8 | | 0.1 | | 0.5 | | 0.8 | |
Local government finances | | -0.2 | | 0.0 | | 0.0 | | -0.1 | | -0.1 | |
Other | | 1.1 | | 0.8 | | 0.0 | | 0.7 | | 0.8 | |
GDP-gap, percentage points | | 1.1 | | 0.4 | | 0.5 | | -0.6 | | -0.5 | |
Sources: Statistics Sweden and Ministry of Finance.
The stimulus to aggregate demand is assessed as minor for 2008 as well. The change in net lending between 2007 and 2008 will consist of certain income and expenditure classes that have little effect on demand, including international development assistance and reductions in taxes
75
on property income. This reinforces the conclusion that the effect on demand will be slight. The structural balance is expected to weaken slightly, but the automatic stabilisers will have a cooling effect due to rising resource utilisation between 2007 and 2008.
General government net lending is expected to improve between 2008 and 2010 by a total of around 1 per cent of GDP.
5.4 Central government sector
In the National Accounts, the central government sector encompasses all activities mainly financed by taxes and controlled by the central government, regardless of the type of organisation. Output from public corporations and enterprises is reported among market producers and producers for own final use and not in the central government sector. The central government budget includes all transactions that affect the central government’s borrowing requirement.
National Accounts
Central government net lending showed a surplus of SEK 19 billion or 0.7 per cent of GDP in 2006. The surplus is expected to exceed SEK 30 billion in 2007 and 2008. Given current economic conditions and fiscal policy decisions adopted and proposed, the surplus is forecast to increase to SEK 93 billion by 2010 (see Table 5.10).
Table 5.10 Central government finances
SEK billions, unless otherwise stated
| | 2006 | | 2007 | | 2008 | | 2009 | | 2010 | |
Revenue | | 867 | | 886 | | 915 | | 954 | | 997 | |
Taxes and charges | | 789 | | 790 | | 822 | | 861 | | 902 | |
Other income | | 77 | | 95 | | 92 | | 93 | | 95 | |
Expenditure | | 848 | | 853 | | 881 | | 896 | | 903 | |
Primary expenditure | | 802 | | 805 | | 834 | | 850 | | 860 | |
Interest | | 46 | | 48 | | 48 | | 46 | | 44 | |
Net lending | | 19 | | 32 | | 33 | | 58 | | 93 | |
Percentage of GDP | | 0.7 | | 1.1 | | 1.1 | | 1.7 | | 2.7 | |
Sources: National Debt Office and Ministry of Finance.
Central government budget
Central government net lending shows the change in net worth, excluding changes in value. The budget balance reveals the central government’s borrowing requirement and thus reflects the change in central government debt. Net lending is not affected by the central government’s sale or purchase of financial assets, such as equities, or increasing lending, such as student financial aid, since such transactions do not affect net worth. However, both the budget balance and central government debt are affected by such financial transactions.
Table 5.11 Central government net lending and budget balance
SEK billions
| | 2006 | | 2007 | | 2008 | | 2009 | | 2010 | |
Net lending | | 19 | | 32 | | 33 | | 58 | | 93 | |
Difference between interest accrued and paid | | -9 | | 1 | | 2 | | 0 | | -1 | |
Effect of timing difference of tax revenue | | 13 | | 12 | | -18 | | -9 | | -6 | |
Sales of shares | | 0 | | 50 | | 50 | | 50 | | 50 | |
Extraordinary dividends | | 10 | | 17 | | - | | - | | - | |
Effect of PPS(1) | | -21 | | 2 | | 1 | | 2 | | 3 | |
Other financial transactions | | 6 | | -8 | | -6 | | 0 | | -4 | |
Budget balance | | 18 | | 107 | | 63 | | 102 | | 135 | |
(1) Effect of PPS refers to the difference between how transactions between the central government and the premium pension system affect net lending and the budget balance.
Sources: National Debt Office and Ministry of Finance.
76
Beyond this fundamental difference, accounting in the central government budget differs in several respects from the National Accounts. The budget balance is reported on a cash basis, while the National Accounts apply the accrual method of accounting. This difference mainly affects reporting of tax receipts and interest income payable.
The differences in accounting principles result in discrepancies between the budget balance and net lending. There are also considerable differences between the central government budget and the National Accounts concerning reporting of incomes and expenditures, which do not affect the balance.
The budget surplus in 2006 was SEK 18 billion, or nearly equal to net lending. Interest income payable was SEK 9 billion lower on an accrual basis than on a cash basis. Conversely, accrued tax receipts, which refer to the 2006 year
77
of income, were SEK 14 billion lower than paid-in tax receipts reported on a cash basis. Unusually large dividends are credited to the budget balance and not included in net lending. Transactions between the Swedish National Debt Office and the premium pension system sharply reduced the budget balance in 2006, because transfers to the pension system in 2006 included two years of earned pension entitlements. Student loans and other financial transactions (see Table 5.11) were charged against the budget balance, but not net lending.
Table 5.12 Budget balance and central government debt
SEK billions, unless otherwise stated
| | 2006 | | 2007 | | 2008 | | 2009 | | 2010 | |
Revenue | | 810 | | 884 | | 868 | | 905 | | 953 | |
Expenditure under the ceiling | | 716 | | 723 | | 752 | | 753 | | 771 | |
Interest expenditure | | 49 | | 41 | | 39 | | 39 | | 38 | |
Net borrowing etc. | | 26 | | 12 | | 13 | | 11 | | 9 | |
Budget balance | | 18 | | 107 | | 63 | | 102 | | 135 | |
Percentage of GDP | | 0.6 | | 3.5 | | 2.0 | | 3.0 | | 3.9 | |
Debt disposals etc. | | -23 | | -1 | | -7 | | 2 | | -2 | |
Central government debt | | 1 220 | | 1 112 | | 1 042 | | 942 | | 805 | |
Percentage of GDP | | 43.0 | | 36.9 | | 32.7 | | 28.2 | | 23.0 | |
Sources: National Debt Office and Ministry of Finance.
The government plans to sell shares worth SEK 50 billion a year during 2007–2010, which will affect the budget balance, but not net lending. In 2007 as well, unusually large dividends will augment the budget balance. Transactions with the premium pension system will have a marginal effect as the preliminary contributions are about equal to transfers to the system. The difference in accruals of tax receipts will also be substantial for 2007–2009, but will approach zero for 2006–2009. The reduction in Sweden’s contribution to the EU budget will be accrued in the National Accounts but will not show up on a cash basis until 2009.
Consolidated central government debt was SEK 1,220 billion at the end of 2006, equal to 43 per cent of GDP. Central government debt declined by SEK 39 billion between 2005 and 2006, SEK 21 billion more than the budget surplus. The difference, expressed as debt adjustments, is partially attributable to the reduction in debt denominated in foreign currency due to the stronger krona. The forecast appreciation of the krona is expected to contribute to reducing the debt somewhat more than the budget surplus in 2007 and 2008 as well. Central government debt is expected to decline to 23 per cent of GDP by 2010 (see Table 5.12), entailing a reduction by 20 per cent of GDP between 2006 and 2010. Almost 6 percentage points of the reduction will come from the planned divestments of shareholdings.
5.5 Pension system
The Swedish pension system consists of a pay-as-you-go element (income-related pension) and a funded element (premium pension). According to a decision by Eurostat, funded pension schemes may not be included in the general government sector in the National Accounts.
The premium pension system is funded by social insurance contributions and central government pension contributions due on social benefits, etc. The contributions are reported in the National Accounts as income to the insurance sector, which invests the funds first with the National Debt Office and later with the fund manager chosen by the individual. The saving is transferred to the household sector, as with funded occupational pension insurance plans.
Compared to previous accounts, general government net lending was reduced starting in 1995 when allocations to the premium pension system began. Starting in 1999 when the premium pension contribution was increased, general government net lending has declined by around 1 per cent of GDP a year and the tax ratio by around 1 percentage point a year. General government net worth was reduced for 2006 by around 10 per cent of GDP while consolidated gross debt increased by around 1 per cent of GDP .
Accounting in the central government budget and of central government debt are not affected by the changed accounting for the premium pension system in the National Accounts.
The pension system in the general government sector now encompasses only the income-related pension scheme, for which the National Pension Funds function as a buffer. During the build-up phase, income is greater than pension benefits. Net lending was SEK 30 billion or 1.1 per cent of GDP in 2006. Above that assets in the National Pension Funds grew by around SEK 60 billion due to growth in value. Changes
78
in value do not affect net lending, which includes only direct returns in the form of interest income receivable and dividends.
Income from pension contributions will exceed pension benefits through the end of 2008. Due to progressively higher pension benefits, a deficit will arise between contributions and benefits starting in 2009. The deficit will be covered by direct returns, but net lending will decline during the forecast period (see Table 5.13).
Table 5.13 The old-age pension system
SEK billions, unless otherwise stated
| | 2006 | | 2007 | | 2008 | | 2009 | | 2010 | |
Revenue | | 210 | | 215 | | 223 | | 233 | | 245 | |
Contributions | | 186 | | 190 | | 198 | | 207 | | 217 | |
Interest and dividends | | 24 | | 24 | | 25 | | 27 | | 28 | |
Expenditure | | 180 | | 189 | | 201 | | 218 | | 235 | |
Pensions | | 176 | | 185 | | 197 | | 213 | | 230 | |
Other | | 4 | | 4 | | 4 | | 4 | | 4 | |
Net lending | | 30 | | 26 | | 22 | | 16 | | 11 | |
Percentage of GDP | | 1.1 | | 0.8 | | 0.7 | | 0.5 | | 0.3 | |
Sources: National Debt Office and Ministry of Finance.
5.6 Local government
Local government finances have strengthened substantially in recent years. The sector reported financial result and net lending in both 2005 and 2006 in excess of SEK 10 billion.(39) Consequently, budget outcomes during these years have been at a level that should be considered consistent with principles of good financial management, a strong improvement compared to 1994–2004.
(39) Financial result refers to income before extraordinary items.
The strong trend is attributable mainly to tax receipts and income from central government grants.
Strong growth in tax base
Strong growth in tax receipts is expected again in 2007. Tax receipts and central government grants combined will increase by 5.3 per cent, a higher increase than in 2006 (see Table 5.14). Tax receipts are expected to increase by 4.2 percent, including an average tax reduction of SEK 0.05 per SEK 100.
Table 5.14 Taxes and central government grants
Percentage change
| | 2006 | | 2007 | | 2008 | | 2009 | | 2010 | |
Taxes and central government grants excl. VAT | | 4.6 | | 5.3 | | 5.0 | | 4.0 | | 3.9 | |
Tax revenue | | 4.3 | | 4.2 | | 5.4 | | 5.3 | | 4.9 | |
Central government grants | | 4.8 | | 9.7 | | 3.5 | | -1.4 | | -1.0 | |
Note: The table shows the percentage change in central government grants exclusive compensation for VAT (see footnote 41).
Sources: Statistics Sweden and Ministry of Finance.
Central government grants including compensation for VAT , as defined in the National Accounts, are expected to increase by 9.7 per cent in 2007.(40) The greatest increase will be in municipal economic equalisation grants, but a significant portion will be atttributable to transfers from other areas such as education, social services and employment support. Other initiatives will result in higher grants for health care, social services and refugee reception. Transfers to the local government sector will also increase due to the sharply higher number of placements in bonus jobs in late 2006.
(40) VAT is reported as an expenditure in the National Accounts under general government final consumption and gross capital formation. In contrast to the central government budget, the compensation for these expenditures paid to local government authorities is reported as government grants.
Tax receipts are expected to increase by 5.0 per cent in 2008, including an effect of SEK 0.9 billion arising when the local government sector’s tax receipts increase after the reduction in the tax deduction for pension savings. The Budget Bill for 2008 intends to reduce central government grants to the local government sector by a corresponding amount.
79
Table 5.15 Central government grants according to the National Accounts
SEK billions
| | 2006 | | 2007 | | 2008 | | 2009 | | 2010 | |
Grants for local government financial equalisation | | 58 | | 71 | | 75 | | 75 | | 75 | |
Employment support | | 7 | | | | | | | | | |
Bonus jobs | | 2 | | 4 | | 2 | | | | | |
Other grants(1) | | 46 | | 48 | | 49 | | 50 | | 49 | |
Central government grants excl. VAT | | 113 | | 123 | | 127 | | 125 | | 125 | |
Annual change | | 6 | | 10 | | 4 | | -2 | | -1 | |
Note: The amounts refer to all grants distributed over a number of expenditure areas, and are those reported in the National Accounts, which differ from the central government budget. In the National Accounts, grants on the income side of the budget are shown as expenditure, and expenditure is accrued differently.
(1) Other grants are almost exclusively special purpose grants. Subsidies for drugs account for almost half of the special purpose grants.
Source: Ministry of Finance.
Central government grants are expected to increase by 3.5 per cent in 2008, primarily due to higher general grants. Grants will also increase for purposes including refugee reception, health care and social services. Transfers to the local government sector, including those related to bonus jobs and education, will decline in parallel, offsetting the effect. Overall, tax receipts and central government grants are expected to increase by 5.0 per cent in 2008.
Tax receipts are forecast to continue rising by around 5 per cent a year in 2009 and 2010. Growth will be weaker for central government grants, in part due to the elimination of bonus jobs and because general grants will remain unchanged in nominal terms. As a result, somewhat weaker annual increases of around 4 per cent in incomes from tax receipts and central government grants are expected in these years.
Net lending and financial result
Net lending and financial result are expected to exceed SEK 11 billion in 2007 with slightly weaker financial result than in 2006. This is attributable to factors including the forecast increase in pension expenses in 2007. Financial result was also augmented temporarily in 2006 by SEK 3 billion consequent upon final adjustment of tax receipts for 2005.
Table 5.16 Local government sector finances
SEK billions
| | 2006 | | 2007 | | 2008 | | 2009 | | 2010 | |
Revenue | | 658 | | 694 | | 727 | | 757 | | 786 | |
Taxes and central govt. grants excl. VAT | | 567 | | 597 | | 627 | | 652 | | 677 | |
Percentage of GDP | | 20.0 | | 19.8 | | 19.7 | | 19.5 | | 19.4 | |
Other revenue | | 91 | | 97 | | 100 | | 105 | | 109 | |
Expenditure | | 648 | | 683 | | 714 | | 747 | | 779 | |
Consumption | | 552 | | 584 | | 612 | | 641 | | 669 | |
Percentage change in volume | | 2.0 | | 1.8 | | 1.7 | | 0.7 | | 0.7 | |
Other expenditure | | 96 | | 100 | | 102 | | 106 | | 110 | |
Net lending | | 10 | | 11 | | 13 | | 10 | | 8 | |
Percentage of GDP | | 0.4 | | 0.4 | | 0.4 | | 0.3 | | 0.2 | |
Financial result | | 15 | | 11 | | 14 | | 10 | | 9 | |
(1) Other incomes include transfers that refer to compensation for input VAT.
Sources: Statistics Sweden and Ministry of Finance.
Relatively strong growth in tax receipts, combined with forecast weaker growth in final consumption expenditure in constant prices, is expected to strengthen net lending and financial result in 2008. The surplus is expected to weaken in 2009 and 2010 despite relatively restrained consumption growth. Nevertheless, net lending and income are expected to end up at a relatively high level of around SEK 8-10 billion.
80
Figure 5.4 Local government sector finances
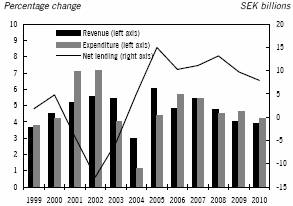
Sources: Statistics Sweden and Ministry of Finance.
81
6 Alternative scenarios
There is considerable uncertainty associated with forecasting future economic trends, as well as the sustainable rate of economic growth over the long term. The latter uncertainty is currently unusually great, in part because it is difficult to more precisely assess the magnitude of the long-term impact of government policy. An assessment by the Ministry of Finance of how implemented structural reforms are affecting the Swedish economy is provided in the explanatory box “Long-term impact of the government’s economic policies”. This assessment is based mainly on international research, but research findings differ considerably from one study to the next, itself a source of uncertainty. There is also a relative dearth of research that explores how multiple interacting reforms may affect economic conditions.
Two alternative scenarios are provided below that illustrate the uncertainty in forecasts of future economic trends and the impact of the uncertainty on general government finances.
The high-growth scenario assumes that the government’s supply-stimulating policies will have greater impact than in the base scenario. Labour supply growth will be higher and wage growth consequently lower. The Riksbank is assumed to pursue a less contractionary monetary policy. The overall effect will be faster growth in GDP and employment than in the base scenario. This alternative also entails a substantial strengthening of general government finances.
The low-growth scenario assumes a downturn in the Swedish economy caused by an international recession in the wake of falling prices for capital assets and real property in the United States. The price slump spreads to Sweden, slowing down household consumption, exports and investment compared to the base scenario. The overall effect is a temporary sag in GDP growth and higher unemployment than in the base scenario.
6.1 Base scenario
Continued rapid increases in GDP and employment in the next few years are expected in the base scenario. Forecast growth is assessed as unsustainably high. Resource utilisation rises progressively as a result and the output gap approaches 1 per cent in 2008. Wage growth and inflation accelerate and the Riksbank increases the repo rate up to a maximum of 4.75 per cent. This cools down Swedish economic growth and GDP and employment growth are slower than the potential growth rate in 2009-2010. The gaps close by 2010 and the regular employment rate reaches 75.6 per cent. Open unemployment is 4.2 per cent and total unemployment 6.1 per cent.
Table 6.1 Selected statistics, base scenario
Percentage change unless otherwise stated
| | 2007 | | 2008 | | 2009 | | 2010 | |
GDP | | 3.7 | | 3.3 | | 2.1 | | 2.3 | |
GDP gap(1) | | 0.6 | | 1.1 | | 0.5 | | 0.0 | |
Regular employment rate(2) | | 75.0 | | 75.6 | | 75.7 | | 75.6 | |
Open unemployment, level(3) | | 4.7 | | 4.1 | | 4.2 | | 4.2 | |
Total unemployment, level(3) | | 6.7 | | 6.2 | | 6.1 | | 6.1 | |
Repo rate, final entry | | 3.50 | | 4.50 | | 4.75 | | 4.25 | |
Hourly wages | | 4.0 | | 4.3 | | 4.5 | | 4.4 | |
CPI, annual average | | 1.8 | | 2.3 | | 2.7 | | 2.5 | |
Net lending in general govt., percent of GDP | | 2.3 | | 2.2 | | 2.5 | | 3.2 | |
(1) Percentage difference between actual and potential output.
(2) Number of people employed age 16-64, excluding people employed in labour market policy programmes, as a percentage of the population.
(3) As a percentage of the labour force.
Source: Ministry of Finance.
General government finances improve during the period. The tax ratio drops relatively sharply between 2006 and 2007, mainly as a result of the earned income credit. But expenditures also decline, resulting in higher net lending than the year before.
6.2 High-growth scenario
In this bill, the government has made an assessment of the impact of reforms on labour supply and employment based on mainstream economic research. (See explanatory box, “Long-term impact of the government’s economic policies”) The assessment is consistent with the conclusions of other analysts. However, there is some disagreement among research findings. For instance, economist Edward C. Prescott believes that tax and fiscal policy have much greater implications for the labour supply
82
than shown by the majority of studies.(41) In this alternative scenario, government policy is assumed to have an effect on the labour supply consistent with Prescott’s findings.
The scenario assumes that labour supply and the number of people employed can remain long-term around 3 per cent higher in 2010 than in the base scenario. Productivity growth and growth in hours worked are expected to be somewhat lower than in the base scenario, as the workers who make up the additional supply cannot be assumed to have the same productivity and hours worked as the average for all workers. As a result, employment growth is higher than GDP growth.
Due to the strong increase in labour supply, employment in 2007–2008 is able to rise somewhat faster than in the base scenario without causing a high level of resource utilisation. Unemployment is higher short-term, resulting in lower wage growth and inflation. The Riksbank does not have to raise the repo rate to the extent assumed in the base scenario.
Table 6.2 Selected statistics, high-growth scenario
Percentage change unless otherwise stated
| | 2007 | | 2008 | | 2009 | | 2010 | |
GDP | | 3.7 | | 3.4 | | 3.3 | | 3.5 | |
GDP gap(1) | | 0.3 | | 0.2 | | 0.0 | | 0.0 | |
Regular employment rate(2) | | 75.0 | | 75.8 | | 76.9 | | 77.9 | |
Open unemployment, level(3) | | 4.8 | | 4.5 | | 4.3 | | 4.2 | |
Total unemployment, level(3) | | 6.8 | | 6.6 | | 6.2 | | 6.1 | |
Repo rate, final entry | | 3.50 | | 4.00 | | 4.25 | | 4.25 | |
Hourly wages | | 3.9 | | 4.1 | | 4.1 | | 4.1 | |
CPI, annual average | | 1.8 | | 2.1 | | 2.4 | | 2.2 | |
Net lending in general govt., percent of GDP | | 2.3 | | 2.2 | | 3.1 | | 4.4 | |
(1) Percentage difference between actual and potential output.
(2) Number of people employed age 16-64, excluding people employed in labour market policy programmes, as a percentage of the population.
(3) As a percentage of the labour force.
Source: Ministry of Finance.
Stimulated by lower interest rates and higher employment, investment increases among market producers. Due to stronger employment growth and lower inflation, growth in real household disposable income is much more vigorous than in the base scenario, despite slower wage growth. Combined with lower interest rates, this stimulates faster growth in household final consumption.
Lower resource utilisation, slower wage growth and a lower repo rate allow considerably faster GDP and employment growth than in the base scenario in 2009–2010. Unemployment declines progressively to 4.2 per cent by 2010, the same level as in the base scenario.
Higher growth in household final consumption increases general government incomes compared to the base scenario, primarily through higher incomes from taxes on products. Incomes are further enhanced by stronger growth in aggregate wages, especially in 2010. The lower rate of inflation further contributes to downward pressure on general government expenditure, which is mainly dependent on general price trends. Overall, the stronger labour supply results in considerably stronger general government finances compared to the base scenario.
6.3 Low-growth scenario
The low-growth scenario assumes considerably weaker performance in the international economy compared to the base scenario. A price slump for real property and financial assets in the United States is assumed to have strong ripple effects in other sectors of the American economy, as well as the world economy.
There has been a considerable slowdown in the rate of growth for house prices in the United States through early 2007. The low-growth scenario assumes that house prices will fall by around 20 per cent, the estimated level of over-valuation in the American housing market according to several analysts.
In this scenario, a sharp decline in house prices causes a significant reduction in the real net worth of American households and scope for debt-financed consumption, triggering an increase in precautionary saving and a severe slowdown in consumption and investment. The lower demand results in weaker employment growth, further reducing household final consumption. More households have difficulty making their payments due to the worsening labour market, leading to continued bankruptcies among mortgage lending institutions. Equity prices tumble as the market reacts to turbulence in the American mortgage lending market, combined with reduced corporate profit margins and
(41) Edward C. Prescott (2004), “Why Do Americans Work So Much More Than Europeans?”, Federal Reserve Bank of Minneapolis Quarterly Review, 28:1, 2-13.
83
sagging consumer confidence. But the scenario assumes the Federal Reserve Bank will respond quickly by cutting the federal funds rate and the slowdown in growth is assumed to be relatively short-lived. But significant impact on the world economy is expected, in part due to lower American demand for imports but also because the financial problems in the United States spread and affect prices in the property and equity markets in other countries.
The international economic downturn also has considerable impact on the Swedish economy. The global slowdown weakens growth in Swedish exports and slows down industrial investment. The scenario also assumes that falling prices for assets and real estate spread to Sweden, although the price slump is assumed to be somewhat less severe than in the United States. Falling prices sharply reduce household net worth and there is a sharp downturn in household consumption. The slowdown in the Swedish housing market leads to weaker housing investment trends.
The severe economic downturn reverses the upward employment trend in 2007. Unemployment climbs and resource utilisation falls. Unemployment remains high in 2008 and there are substantial available resources in the Swedish economy.
Inflationary pressure is moderated by falling demand and lower resource utilisation. The Riksbank raises the repo rate more cautiously during 2007–2009 than in the base scenario. The krona depreciates somewhat against world currencies as a result of lower interest rates, ameliorating the decline in exports.
From a more long-term perspective, the downturn in demand is expected to wane. A gradual international recovery and sustained expansionary monetary policy combined with slower wage growth lead to faster growth in exports, investment and household final consumption in 2009-2010 compared to the base scenario. Due to stronger demand, the rise in employment and fall in unemployment are greater in those years than in the base scenario.
The effects of the economic downturn will peter out by 2010 and GDP and employment will be at the same levels as in the base scenario.
Table 6.3 Selected statistics, low-growth scenario
Percentage change unless otherwise stated
| | 2007 | | 2008 | | 2009 | | 2010 | |
GDP | | 2.3 | | 2.7 | | 3.0 | | 3.2 | |
GDP gap(1) | | -0.9 | | -1.0 | | -0.4 | | 0.0 | |
Regular employment rate(2) | | 73.6 | | 73.9 | | 75.0 | | 75.6 | |
Open unemployment, level(3) | | 5.6 | | 5.2 | | 4.7 | | 4.2 | |
Total unemployment, level(3) | | 7.6 | | 7.3 | | 6.7 | | 6.2 | |
Repo rate, final entry | | 3.50 | | 4.00 | | 4.00 | | 4.25 | |
Hourly wages | | 3.9 | | 4.0 | | 4.1 | | 4.1 | |
CPI, annual average | | 1.8 | | 2.1 | | 2.4 | | 2.2 | |
Net lending in general govt., percent of GDP | | 1.6 | | 1.0 | | 1.9 | | 3.0 | |
(1) Percentage difference between actual and potential output.
(2) Number of people employed age 16-64, excluding people employed in labour market policy programmes, as a percentage of the population.
(3) As a percentage of the labour force.
Source: Ministry of Finance.
The consequence for general government finances is a significant reduction in incomes from taxes on income from employment and taxes on products, due to slower growth in aggregate wages and household consumption. But the rate of inflation will be weaker than in the base scenario, with positive impact on general government finances, as lower inflation results in lower general government expenditures. Nevertheless, the overall effect will be poorer general government finances compared to the base scenario.
84
7 Forecast evaluation
Forecasts issued by the Ministry of Finance constitute inputs for the central government budget and for the government’s formulation of economic policy. Economic policy is highly target-oriented. Several of the government’s explicit targets, such as the target of a surplus in general government net lending, are related to general economic conditions and reliable forecasts are thus highly significant. Evaluating earlier forecasts is thus a key aspect of improving forecast reliability.
This section reports how well the four forecasts for 2006 provided by the Ministry of Finance in the 2005 and 2006 Spring and Autumn Fiscal Policy Bills coincided with the preliminary outcome published by Statistics Sweden on 1 March 2007. As with earlier forecast evaluations, forecasts issued by the Ministry of Finance are also compared to forecasts by other economic analysts. The evaluation also includes an analysis of changes in this forecast compared to the preceding forecast. The purpose of the comparison is to shed light on the reasons behind the changes in the forecast.
7.1 Ministry of Finance forecasts
GDP increased by 4.4 per cent in 2006 according to the preliminary outcome from the National Accounts (see Table 7.1). The outcome was unexpectedly strong and GDP growth was underestimated in all forecasts made in the fiscal policy and budget bills in 2005 and 2006. Even unemployment in 2006 was underestimated in the forecasts made in 2005 and spring 2006, but was slightly overestimated in the autumn 2006 forecast. Inflation forecasts, measured as the change in the CPI, were relatively accurate in all forecasts.
GDP forecasts made in 2005
The Swedish economy gained momentum in 2004 due to a strong upturn in exports and growth has gradually spread since then. The view in the 2005 forecasts was that domestic demand would become an increasingly important growth driver in 2006. A strong upturn in industrial output was also forecast. Almost all components of GDP from the expenditure approach were underestimated in the 2005 forecasts. In particular, general government consumption, investment, exports and imports were stronger than expected. Overall, the result was relatively large disparities between GDP forecasts and outcome.
Table 7.1 Ministry of Finance forecasts and outcome for 2006
Percentage change unless otherwise stated
| | Spring
2005 | | Autumn
2005 | | Spring
2006 | | Autumn
2006 | | Outcome
2006 | |
GDP | | 2.7 | | 3.1 | | 3.6 | | 4.0 | | 4.4 | |
Household cons. | | 2.7 | | 3.0 | | 3.4 | | 3.6 | | 2.8 | |
Gen. govt. cons. | | 0.7 | | 1.8 | | 1.8 | | 1.4 | | 1.8 | |
Investment | | 5.2 | | 5.0 | | 5.6 | | 7.2 | | 8.2 | |
Stocks(1) | | -0.1 | | 0.0 | | 0.0 | | -0.2 | | 0.0 | |
Exports | | 5.8 | | 6.1 | | 8.2 | | 8.3 | | 9.1 | |
Imports | | 6.2 | | 6.7 | | 8.6 | | 7.6 | | 7.8 | |
Industry prod. | | 5.0 | | 4.6 | | 5.5 | | 5.3 | | 5.6 | |
Employment(2) | | 1.1 | | 1.3 | | 1.8 | | 1.7 | | 1.8 | |
Productivity | | 1.9 | | 2.0 | | 2.5 | | 2.8 | | 3.1 | |
Hours worked(2) | | -0.4 | | -0.2 | | -0.7 | | -0.6 | | -0.4 | |
Open unempl.(2),(3) | | 4.4 | | 4.8 | | 4.9 | | 5.6 | | 5.4 | |
CPI, annual avg. | | 1.5 | | 1.5 | | 1.4 | | 1.6 | | 1.4 | |
Repo rate(4) | | 2.75 | | 2.50 | | 2.50 | | 3.00 | | 3.00 | |
GDP world | | 3.9 | | 4.1 | | 4.5 | | 5.0 | | 5.2 | (5) |
(1) Changes in volume as percent of GDP in the preceding year.
(2) The 2005 restructuring of the LFS implies that outcome and forecasts are not directly comparable.
(3) Per cent of the labour force.
(4) Repo rate at year-end.
(5) For some countries the outcome is forecast.
Sources: Statistics Sweden, Riksbank and Ministry of Finance.
GDP forecasts in 2006
The Swedish economy was expected to develop strongly during the year according to forecasts in 2006. Swelling international demand and the strong competitiveness of Swedish firms pointed to strong export and industrial output growth. Rapid growth was also forecast for gross capital formation and consumption. Even imports were expected to increase strongly due to strong demand growth.
Due to overestimation of growth in disposable income, the two forecasts for 2006 issued during the year overestimated growth in household consumption. Higher impact on consumption was also expected from favourable labour market trends.
85
General government consumption was underestimated because available statistics in the autumn indicated lower growth than turned out to be the case. With respect to central government consumption, growth in hours worked and social transfers in kind(42) in particular exceeded expectations. The overestimated components of local government consumption were mainly sales and social transfers in kind.
(42) Social transfers in kind are made up of general government purchases of goods and services (from market producers) that are provided to households with no further transformation in production within the general government sector. Such goods and services include privately owned old-age homes, prescription drugs and dental care, and privately owned or cooperative preschools.
As in 2005, the strength of investment in housing and general government investment were also underestimated when the 2006 Spring Fiscal Policy Bill was drafted. But in part due to surprisingly strong outcomes in spring 2006, the forecast for general government investment was revised upward prior to the Budget Bill for 2007. Investment in housing and in the general government sector proved even stronger, and total growth in investment was underestimated by around 1 percentage point in autumn 2006.
Actual export growth in 2006 was stronger for both goods and services than forecast in connection with the fiscal policy and budget bills in the same year, primarily due to stronger world market demand than assessed when the two forecasts were made.
The forecast for imports of goods was revised upward sharply in spring 2006 on the heels of stronger foreign and domestic demand. The sharp revision led to an import forecast above the outcome. Import growth slackened in the second quarter of 2006 and the forecast was revised downward again in the autumn.
Labour market forecasts
The 2005 Spring Fiscal Policy Bill forecast a rise in employment by 1.1 per cent in 2006. The forecast was revised upward by two tenths in the Budget Bill for 2006. The restructuring of the Labour Force Survey (LFS) caused considerable statistical difficulties in the forecasting process. The most severe consequences were in the summer months, and it was particularly difficult to assess labour supply in the new LFS. The former government also presented a major labour market policy initiative in the Budget Bill for 2006 prior to the upcoming election year. One of the consequences was a sharp downward revision in the labour supply forecast. Open unemployment was revised upward from 4.4 per cent to 4.8 per cent, due entirely to the new definition of unemployment in the LFS.
The indicators had gained strength by the time the 2006 Spring Fiscal Policy Bill was produced, while employment and labour supply growth were more favourable than expected. The employment forecast was accordingly revised upward by five tenths to 1.8 per cent. It also became clear that the labour supply had been underestimated due to the statistical restructuring and the supply forecast was revised upward by six tenths. Forecast open unemployment was revised upward slightly to 4.9 per cent. Labour market policy programmes did not increase to the planned extent early in the year. The forecast for the year was based on the assumption that it would be possible to dramatically expand policy measures later in the year.
Due to weak trends in the second quarter according to the LFS, the employment forecast was revised downward in the Budget Bill for 2007. Given that it had not been possible in practice to expand policy measures to the extent assumed, the outcome for open unemployment was poorer than forecast. Open unemployment was revised upward by seven tenths to 5.6 per cent.
Employment rose more than expected in the final months of the year. The open unemployment trend was favourable despite substantial cutbacks in policy measures. The outcome was employment growth of 1.8 per cent and open unemployment of 5.4 per cent.
Inflation forecasts
The forecasts produced in 2005 and 2006 overestimated average inflation (measured with the CPI, and underlying inflation measured with UND1X) in 2006 by between 0.1 and 0.2 percentage points. The two forecasts made in 2005 overstated inflation in early 2006 while the forecast for the latter part of 2006 was more consistent with the outcome.
An unusually serious forecast error was made in the Budget Bill for 2007 concerning the inflation trend for the remainder of 2006. UND1X inflation in December 2006 was overestimated by a full 0.6 percentage points. One source of
86
the error was declining petrol prices that could not be factored in, but a general overestimation of domestic and imported price pressure also contributed to the forecast error. The forecast error for CPI inflation was even greater than for UND1X inflation for a few months at the end of 2006, mainly because property tax reductions were figured into the CPI earlier than expected.
7.2 Comparison with other forecasters
Comparing forecast errors for a few key variables among various economic forecasters is one way to evaluate forecasts produced by the Ministry of Finance. But several limitations are associated with such forecast comparison and they can be misleading. For instance, the forecasts are issued at different dates, so forecasters do not always have access to the same information. This becomes particularly obvious when high-frequency variables from financial markets or monthly data such as inflation and unemployment are analysed, or when an analyst has access to critical information such as a new outcome from the National Accounts. The comparison made here attempts to ameliorate this problem by comparing forecasts issued on roughly the same date.
Forecasters also apply different assumptions in several cases. The Ministry of Finance bases its forecasts on economic policy measures either previously adopted or proposed in the bill. Other forecasters make explicit assumptions about future economic policy. These discrepancies are not considered when forecasts are compared. Despite these difficulties, comparative analysis may provide an understanding of the reliability of various economic analysts, and perhaps also of how large forecast errors can be and still be considered normal. However, the point is not to rank forecasters.
Several forecasters’ absolute forecast errors for GDP growth, inflation and unemployment for 2006 are shown in Figure 7.1. The forecasts were made in spring and autumn in both 2005 and 2006. Compared to previous years, forecast errors for GDP growth in 2006 are relatively large. All forecasters underestimated GDP growth in their 2005 and 2006 forecasts, but the forecast errors were considerably greater in the forecasts made in 2005. The average absolute forecast error for GDP growth for 2006 was about 1 percentage point, compared to 0.4 percentage points the year before. The average error during 1990–2005 was about 0.75 percentage points in absolute terms.
Nearly all forecasters understated unemployment for 2006 in the forecasts made in 2005, but the picture was more fragmented for forecasts made in 2006. The average absolute forecast error was about 0.4 percentage points for the 2006 forecast year, compared to 0.5 percentage points during 1990-2005.
Figure 7.1 Average absolute forecast errors for 2006
Percentage points
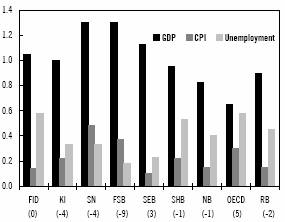
Note: The average refers to errors, in absolute terms, made in four forecasts for 2006, i.e. in the spring and autumn of 2005 and the spring and autumn of 2006. The figures in brackets indicate when the respective forecasting institute’s forecast is published, on average, in relation to the Ministry of Finance’s forecast, measured in weeks. The forecast sample was made so that the forecast coincides with the Ministry of Finance’s publication date as much as possible. These institutions are the Ministry of Finance (FID), the National Institute of Economic Research (KI), the Confederation of Swedish Enterprise (SN), Swedbank (FSB), SEB, Handelsbanken (SHB), Nordea (NB), Organisation for Economic Cooperation and Development (OECD) and the Riksbank (RB).
Sources: Statistics Sweden, Ministry of Finance and the respective analysts.
Inflation forecasts produced in 2005 and 2006 both overestimated and underestimated the trend for 2006. It is noteworthy that inflation forecasts for 2006 were good. The average absolute forecast error for 2006 was 0.2 percentage points, compared to 0.6 percentage points in 2005. The average absolute forecast error for 1990–2005 was 0.7 percentage points.
Comparing forecasters based on a single outcome year is obviously uncertain. Aimed at clarifying the matter, trends in forecast errors for GDP growth in recent years measured as a five-year moving average are shown in Table 7.2. GDP growth was misjudged in the most recent five-year period by an average of 0.7 percentage points in absolute terms. The major forecast errors for 2001 when the GDP growth rate fell by around 3 percentage points considerably hikes up the average for 2001–2005. This also
87
illustrates that judging the development of economic turning points is the forecaster’s most difficult task. Generally speaking, the assessments of all forecasters are better than a ‘naive forecast’ which is defined as a forecast for year t that is identical with the actual data for the immediately preceding year, t-1.
Table 7.2 Average absolute forecast error for GDP-growth
Percentage points, five-year moving average
| | 2001 | | 2002 | | 2003 | | 2004 | | 2005 | | 2006 | |
FID | | 0.70 | | 0.71 | | 0.80 | | 0.81 | | 0.76 | | 0.67 | |
FSB | | 0.76 | | 0.73 | | 0.73 | | 0.79 | | 0.78 | | 0.71 | |
KI | | 0.68 | | 0.74 | | 0.84 | | 0.82 | | 0.77 | | 0.65 | |
Nordea | | 0.68 | | 0.75 | | 0.85 | | 0.82 | | 0.79 | | 0.66 | |
OECD | | 0.72 | | 0.74 | | 0.81 | | 0.74 | | 0.67 | | 0.57 | |
SEB | | 0.64 | | 0.66 | | 0.71 | | 0.74 | | 0.70 | | 0.63 | |
SHB | | 0.89 | | 0.93 | | 1.05 | | 0.98 | | 0.92 | | 0.73 | |
SN | | 0.89 | | 0.88 | | 0.97 | | 0.95 | | 0.88 | | 0.86 | |
Average | | 0.75 | | 0.77 | | 0.85 | | 0.83 | | 0.78 | | 0.69 | |
Naive | | 1.03 | | 1.05 | | 0.94 | | 1.18 | | 1.21 | | 1.04 | |
Note: The averages refer to the absolute errors made for the year in question, i.e. the autumn and spring of the previous year, in addition to the autumn and spring of the current year. The errors for each year are also calculated as five-year moving averages. For example, for the year 2006, this would include the errors made for the period 2002-2006. Therefore, the averages refer to a total of 20 forecasts per column. The average error for each year reflects the averages of all forecasters’ forecast errors in absolute terms. In the naive forecast, the forecast made year t is set as equal to the outcome for year t–1.
Sources: Statistics Sweden, Ministry of Finance and the respective analysts.
The Confederation of Swedish Enterprise has a tendency to systematically underestimate GDP growth, while Handelsbanken tends to systematically overestimate it. This holds true for forecasts made in the 2000s as well as the 1990s. Nearly all forecasters’ absolute average error for GDP growth seems to have magnified somewhat over time, as shown in Figure 7.2. The overestimation of GDP growth in 2001 and the underestimation of the same variable in 2006 are the main factors driving up the absolute average error.
Figure 7.2 Average absolute forecast errors related to GDP
Percentage points

Note: The averages refer to the absolute errors made for the year in question, i.e. the autumn and spring of the previous year, in addition to the autumn and spring of the current year. The forecast sample was made so that the forecast coincides with Ministry of Finance’s publication date as much as possible.
Sources: Statistics Sweden, Ministry of Finance and the respective analysts.
Comparisons of accuracy among forecasters will provide relatively different results depending on the period studied. The Ministry of Finance was ranked fourth among nine forecasters studied in the evaluation of the 1997-2006 period performed by the NIER(43), but last in the Swedish National Audit Office’s evaluation of the 1994-2005 period(44). The Ministry of Finance’s lower ranking in the SNAO’s comparison is likely due to large forecast errors relative to other forecasters during 1994-1996. Individual forecast errors can play a critical role when forecasters are compared, as illustrated by the Ministry of Finance’s rankings in the NIER evaluation, which vary from first to last place among individual years.(45)
(43) National Institute of Economic Research, “The Swedish Economy,” March 2007.
(44) Swedish National Audit Office Report 2006:23, “Det makroekonomiska underlaget i budgetpropositionerna” (English translation not available).
(45) Bergvall, “Evaluation of the NIER’s Forecasts,” National Institute of Economic Research Special Study No. 5, 2005.
The Ministry of Finance is among the forecasters with the greatest tendency to underestimate unemployment, in part due to systematic overestimation of the percentage of people participating in labour market policy programmes.
88
Figure 7.3 Average absolute errors and average errors for unemployment 1997–2006
Percentage points
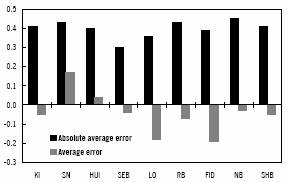
Source: National Institute of Economic Research.
The explanation behind the relatively large forecast error for unemployment made by the Ministry of Finance during the last four years is that unemployment first increased more and then did not decline as fast as predicted. Most other forecasters made the same error in judgement. Starting with the Budget Bill for 2006, forecast conditions were impaired due to the restructuring of the Labour Force Survey implemented in April 2005, which has made forecasting more difficult. The number of chained series is sharply limited and the seasonal pattern has changed dramatically. Despite these problems, forecast accuracy does not appear to have been impaired in the subsequent period.
7.3 Comparison with the preceding forecast
The forecast for Swedish GDP growth in 2007 has been revised upward since the Budget Bill for 2007. The stronger forecast for GDP growth is based mainly on an upward revision of forecast investment and exports.
The forecast for household consumption has not changed since the Budget Bill and the assessment of general government consumption also remains essentially firm.
Due to sustained high industrial capacity utilisation, strong demand for Swedish products and favourable financial conditions, the machinery component of investment in the industrial sector is expected to be stronger in 2007 than forecast in the Budget Bill. Certain housing construction projects have also been accelerated, and stronger growth in investment is now expected in 2007.
Overall, investment is currently expected to increase by 5.6 per cent compared to 3.6 per cent in the Budget Bill for 2007.
The forecast for export growth in 2007 has been revised upward compared to the assessment in the Budget Bill. Total export growth of 7.0 per cent is now expected, compared to the 6.4 per cent forecast in the Budget Bill. The revision reflects two factors: exports for the fourth quarter of 2006 outperformed the forecast and the Swedish krona is expected to appreciate less than previously forecast. Stronger GDP growth is also expected in the euro area, by far Sweden’s largest export market.
The import forecast has been revised upward from the Budget Bill, primarily based on the higher forecast for export growth.
Forecast employment growth has been revised upward by 0.8 percentage points, primarily due to strong monthly outcomes in late 2006 and early 2007. The indicators point to sustained robust demand. The forecast for open unemployment is a downward revision compared to the Budget Bill, mainly on the basis that unemployment was already lower at the beginning of the year than previously forecast. Open unemployment declined more than expected in late autumn and winter 2006. Volumes in labour market policy programmes are essentially unchanged from the Budget Bill, and forecast total unemployment has been revised downward for 2007.
Forecast wage growth has been revised upward by 0.3 percentage points compared to the Budget Bill, in part due to a revised perspective on resource utilisation.
The revised inflation forecast for 2007 is substantially lower. Inflation in late 2006 was considerably lower than forecast in the Budget Bill (see Section 7.1), and recent outcomes and indicators suggest weaker increases in consumer prices in 2007. CPI inflation has been revised downward less than underlying inflation measured according to UND1X, based on revised forecasts for mortgage rates as well as the net effect on consumer prices of tax and subsidy reforms. These components are included in the CPI, but not in UND1X.
The repo rate is now expected to be 3.50 per cent at the end of 2007, 0.50 percentage points lower than forecast in the Budget Bill.
The exchange rate forecast for December 2007 according to the TCW index has been re-
89
vised from 121 to 124 compared to the Budget Bill. Expectations for a weaker krona in trade-weighted terms depend in part on a depreciation of the krona in the first quarter of 2007. The krona is also expected to strengthen but somewhat less against the dollar.
General government net lending is now expected to be 0.9 per cent or SEK 26 billion higher than forecast in the Budget Bill. Incomes are revised upward by SEK 20 billion, including tax receipts of SEK 15 billion, while expenditures are now expected to be SEK 6 billion lower than forecast in the Budget Bill.
Forecast GDP growth in the euro area has been revised upward for 2007 based on stronger than expected outcome for GDP in the fourth quarter of 2006. Forecast GDP for the United States has been revised downward for 2007 and 2008. The revision is mainly based on the poorer than expected trend in the housing market, which is forecast to lead to a more palpable decline in investment in housing and slower growth in consumption.
Table 7.3 Ministry of Finance forecasts for 2007 in the Budget Bill for 2007 and the 2007 Spring Fiscal Policy Bill
Percentage change unless otherwise stated
| | autumn 07 | | spring 07 | |
Sweden | | | | | |
GDP | | 3.3 | | 3.7 | |
Household consumption | | 4.2 | | 4.2 | |
Government consumption | | 1.5 | | 1.4 | |
Investment | | 3.3 | | 5.6 | |
Exports | | 6.4 | | 7.0 | |
Imports | | 7.1 | | 7.6 | |
Employed | | 1.5 | | 2.3 | |
Hours worked | | 1.2 | | 1.5 | |
Open unemployment(1) | | 5.8 | | 4.7 | |
Wages | | 3.7 | | 4.0 | |
General government | | | | | |
net lending(2),(3) | | 1.3 | | 2.2 | |
CPI, annual average | | 2.5 | | 1.8 | |
Repo rate(4) | | 3.75 | | 3.50 | |
TCW-index(5) | | 123 | | 124 | |
USA, GDP | | 2.5 | | 2.2 | |
Euro area, GDP | | 1.9 | | 2.2 | |
(1) Per cent of labour force.
(2) Per cent of GDP.
(3) Adjusted for changes in premium pension system
(4) Repo rate at year-end.
(5) TCW-index at year-end.
Source: Ministry of Finance.
90
Tables Appendix
Tables Chapter 1 The global economy
GDP
Percentage change
| | 2001 | | 2002 | | 2003 | | 2004 | | 2005 | | 2006 | | 2007 | | 2008 | | 2009 | | 2010 | |
United States | | 0.8 | | 1.6 | | 2.5 | | 3.9 | | 3.2 | | 3.3 | | 2.2 | | 2.6 | | 3.3 | | 3.0 | |
Japan | | 0.2 | | 0.3 | | 1.5 | | 2.7 | | 1.9 | | 2.2 | | 1.8 | | 1.9 | | 2.0 | | 2.0 | |
Euro area | | 1.9 | | 0.9 | | 0.8 | | 2.0 | | 1.4 | | 2.6 | | 2.2 | | 2.1 | | 2.0 | | 2.0 | |
Global GDP | | 2.6 | | 3.2 | | 3.9 | | 5.3 | | 4.8 | | 5.2 | | 4.6 | | 4.5 | | 4.7 | | 4.5 | |
World market demand(1) | | 1.8 | | 2.6 | | 4.3 | | 9.7 | | 7.9 | | 9.8 | | 6.3 | | 6.4 | | 7.0 | | 6.9 | |
(1) World market demand measures the weighted import demand in all countries to which Sweden exports.
Sources: Eurostat, national sources and Ministry of Finance.
Unemployment
Percentage of labour force
| | 2001 | | 2002 | | 2003 | | 2004 | | 2005 | | 2006 | | 2007 | | 2008 | | 2009 | | 2010 | |
United States | | 4.7 | | 5.8 | | 6.0 | | 5.5 | | 5.1 | | 4.6 | | 4.8 | | 5.3 | | 5.2 | | 5.1 | |
Japan | | 5.0 | | 5.4 | | 5.2 | | 4.8 | | 4.4 | | 4.1 | | 3.9 | | 3.7 | | 3.7 | | 3.7 | |
Euro area | | 7.8 | | 8.2 | | 8.7 | | 8.8 | | 8.6 | | 7.9 | | 7.4 | | 7.4 | | 7.5 | | 7.5 | |
Note.: Eurostat definition for the euro area and national definitions for the United States and Japan.
Sources: Eurostat, national sources and Ministry of Finance.
Inflation
Annual percentage change
| | 2001 | | 2002 | | 2003 | | 2004 | | 2005 | | 2006 | | 2007 | | 2008 | | 2009 | | 2010 | |
United States | | 2.8 | | 1.6 | | 2.3 | | 2.7 | | 3.4 | | 3.2 | | 1.8 | | 2.6 | | 2.8 | | 2.9 | |
Japan | | -0.9 | | -0.8 | | -0.3 | | -0.1 | | -0.1 | | 0.2 | | 0.6 | | 0.9 | | 1.2 | | 1.5 | |
Euro area | | 2.3 | | 2.2 | | 2.1 | | 2.1 | | 2.2 | | 2.2 | | 2.0 | | 2.0 | | 1.9 | | 1.9 | |
Note: HICP for the euro area, CPI for the United States and Japan.
Sources: Eurostat, national sources and Ministry of Finance.
91
Tables Chapter 2 Financial markets
Interest and exchange rate assumptions, year-end
Value at year-end
| | 2001 | | 2002 | | 2003 | | 2004 | | 2005 | | 2006 | | 2007 | | 2008 | | 2009 | | 2010 | |
Repo rate | | 3.75 | | 3.75 | | 2.75 | | 2.00 | | 1.50 | | 3.00 | | 3.50 | | 4.50 | | 4.75 | | 4.25 | |
6-month interest rate | | 3.73 | | 3.54 | | 2.70 | | 2.05 | | 1.93 | | 3.07 | | 3.60 | | 4.55 | | 4.70 | | 4.30 | |
5-year interest rate | | 4.98 | | 4.14 | | 4.30 | | 3.33 | | 3.16 | | 3.70 | | 3.95 | | 4.60 | | 4.80 | | 4.50 | |
10-year interest rate | | 5.35 | | 4.71 | | 4.86 | | 3.90 | | 3.38 | | 3.65 | | 4.05 | | 4.65 | | 4.85 | | 4.55 | |
Spread Swe—Ger 10-year | | 0.35 | | 0.52 | | 0.51 | | 0.25 | | 0.02 | | -0.15 | | -0.25 | | 0.35 | | 0.55 | | 0.25 | |
6-month EURIBOR | | 3.14 | | 2.67 | | 2.14 | | 2.16 | | 2.60 | | 3.61 | | 4.05 | | 4.05 | | 4.05 | | 4.05 | |
TCW index | | 137 | | 131 | | 124 | | 121 | | 131 | | 123 | | 124 | | 120 | | 121 | | 121 | |
EUR/SEK | | 9.32 | | 9.12 | | 9.02 | | 8.98 | | 9.44 | | 9.04 | | 9.10 | | 8.80 | | 8.90 | | 8.90 | |
USD/SEK | | 10.45 | | 8.68 | | 7.36 | | 6.70 | | 7.95 | | 6.84 | | 6.74 | | 6.52 | | 6.59 | | 6.59 | |
EUR/USD | | 0.89 | | 1.05 | | 1.22 | | 1.34 | | 1.19 | | 1.32 | | 1.35 | | 1.35 | | 1.35 | | 1.35 | |
Sources: Riksbank, Reuters and Ministry of Finance.
Interest and exchange rate assumptions, annual average
Annual average
| | 2001 | | 2002 | | 2003 | | 2004 | | 2005 | | 2006 | | 2007 | | 2008 | | 2009 | | 2010 | |
6-month interest rate | | 4.05 | | 4.16 | | 3.01 | | 2.17 | | 1.75 | | 2.45 | | 3.42 | | 4.11 | | 4.63 | | 4.48 | |
5-year interest rate | | 4.70 | | 4.99 | | 4.08 | | 3.76 | | 2.85 | | 3.52 | | 3.93 | | 4.30 | | 4.71 | | 4.64 | |
10-year interest rate | | 5.11 | | 5.30 | | 4.64 | | 4.42 | | 3.38 | | 3.70 | | 3.98 | | 4.38 | | 4.76 | | 4.69 | |
Spread Swe—Ger 10-year | | 0.29 | | 0.51 | | 0.54 | | 0.36 | | 0.00 | | -0.08 | | -0.18 | | 0.08 | | 0.46 | | 0.39 | |
6-month EURIBOR | | 3.64 | | 3.28 | | 2.25 | | 2.09 | | 2.24 | | 3.06 | | 3.87 | | 4.05 | | 4.05 | | 4.05 | |
TCW index | | 136 | | 134 | | 128 | | 126 | | 128 | | 127 | | 124 | | 122 | | 121 | | 121 | |
EUR/SEK | | 9.25 | | 9.16 | | 9.12 | | 9.13 | | 9.28 | | 9.25 | | 9.14 | | 8.94 | | 8.85 | | 8.90 | |
USD/SEK | | 10.33 | | 9.73 | | 8.09 | | 7.35 | | 7.49 | | 7.38 | | 6.89 | | 6.62 | | 6.56 | | 6.59 | |
EUR/USD | | 0.90 | | 0.94 | | 1.13 | | 1.24 | | 1.24 | | 1.25 | | 1.33 | | 1.35 | | 1.35 | | 1.35 | |
Sources: Riksbank, Reuters and Ministry of Finance.
92
Tables Chapter 3 Swedish demand and output
Demand and output
| | SEK billion | | Percentage change in volume | |
| | 2006(1) | | 2001 | | 2002 | | 2003 | | 2004 | | 2005 | | 2006 | | 2007 | | 2008 | | 2009 | | 2010 | |
Household consumption expenditure | | 1 339 | | 0.4 | | 1.5 | | 1.8 | | 2.2 | | 2.4 | | 2.8 | | 4.2 | | 3.8 | | 2.4 | | 2.6 | |
General government consumption expenditure | | 759 | | 0.9 | | 2.3 | | 0.7 | | 0.4 | | 0.3 | | 1.8 | | 1.4 | | 1.4 | | 0.5 | | 0.6 | |
Central government | | 207 | | -1.5 | | 3.0 | | 1.5 | | -0.6 | | -2.0 | | 1.0 | | 0.5 | | 0.4 | | 0.1 | | 0.1 | |
Local government | | 552 | | 1.9 | | 2.0 | | 0.4 | | 0.8 | | 1.2 | | 2.0 | | 1.8 | | 1.7 | | 0.7 | | 0.7 | |
Gross fixed capital formation | | 509 | | -1.0 | | -2.6 | | 1.1 | | 6.4 | | 8.1 | | 8.2 | | 5.6 | | 3.4 | | 2.3 | | 2.7 | |
Change in stocks(2) | | 0 | | -0.5 | | -0.2 | | 0.3 | | -0.4 | | -0.1 | | -0.0 | | -0.0 | | 0.1 | | -0.0 | | 0.2 | |
Exports | | 1 456 | | 0.5 | | 1.2 | | 4.6 | | 11.2 | | 6.7 | | 9.1 | | 7.0 | | 6.3 | | 6.3 | | 6.0 | |
Imports | | 1 224 | | -2.6 | | -1.9 | | 5.0 | | 7.0 | | 6.9 | | 7.8 | | 7.6 | | 6.7 | | 6.7 | | 6.7 | |
GDP | | 2 838 | | 1.1 | | 2.0 | | 1.7 | | 4.1 | | 2.9 | | 4.4 | | 3.7 | | 3.3 | | 2.1 | | 2.3 | |
GDP, calendar adjusted | | — | | 1.2 | | 2.0 | | 1.8 | | 3.6 | | 2.9 | | 4.7 | | 3.9 | | 3.2 | | 2.1 | | 2.0 | |
(1) In current prices.
(2) Contribution to GDP growth.
Sources: Statistics Sweden and Ministry of Finance.
Contribution to GDP growth
Percentage points
| | 2001 | | 2002 | | 2003 | | 2004 | | 2005 | | 2006 | | 2007 | | 2008 | | 2009 | | 2010 | |
Household consumption expenditure | | 0.2 | | 0.7 | | 0.9 | | 1.1 | | 1.1 | | 1.4 | | 2.0 | | 1.8 | | 1.2 | | 1.3 | |
General government consumption expenditure | | 0.2 | | 0.6 | | 0.2 | | 0.1 | | 0.1 | | 0.5 | | 0.4 | | 0.4 | | 0.1 | | 0.1 | |
Central government | | -0.1 | | 0.2 | | 0.1 | | 0.0 | | -0.2 | | 0.1 | | 0.0 | | 0.0 | | 0.0 | | 0.0 | |
Local government | | 0.4 | | 0.4 | | 0.1 | | 0.2 | | 0.2 | | 0.4 | | 0.3 | | 0.3 | | 0.1 | | 0.1 | |
Gross fixed capital formation | | -0.2 | | -0.5 | | 0.2 | | 1.0 | | 1.3 | | 1.4 | | 1.0 | | 0.6 | | 0.4 | | 0.5 | |
Change in stocks(2) | | -0.5 | | -0.2 | | 0.3 | | -0.4 | | -0.1 | | -0.0 | | -0.0 | | 0.1 | | -0.0 | | 0.2 | |
Exports | | 0.2 | | 0.5 | | 2.0 | | 4.9 | | 3.1 | | 4.4 | | 3.6 | | 3.3 | | 3.4 | | 3.4 | |
Imports | | 1.0 | | 0.8 | | -1.9 | | -2.6 | | -2.6 | | -3.2 | | -3.2 | | -3.0 | | -3.1 | | -3.2 | |
GDP | | 1.1 | | 2.0 | | 1.7 | | 4.1 | | 2.9 | | 4.4 | | 3.7 | | 3.3 | | 2.1 | | 2.3 | |
Sources: Statistics Sweden and Ministry of Finance.
93
Exports and imports of goods and services and change in prices
| | SEK billion | | Percentage change in volume | |
| | 2006(1) | | 2001 | | 2002 | | 2003 | | 2004 | | 2005 | | 2006 | | 2007 | | 2008 | | 2009 | | 2010 | |
Exports | | | | | | | | | | | | | | | | | | | | | | | |
Exports of goods | | 1 084 | | -2.1 | | 2.0 | | 4.8 | | 10.2 | | 5.1 | | 8.0 | | 6.9 | | 6.1 | | — | | — | |
Processed goods(1) | | 886 | | -2.9 | | 1.9 | | 4.8 | | 10.3 | | 4.5 | | 8.3 | | 7.5 | | 6.7 | | — | | — | |
Exports of services | | 372 | | 10.1 | | -1.5 | | 3.6 | | 14.4 | | 11.5 | | 12.0 | | 7.4 | | 6.9 | | — | | — | |
Total exports | | 1 456 | | 0.5 | | 1.2 | | 4.6 | | 11.2 | | 6.7 | | 9.1 | | 7.0 | | 6.3 | | 6.3 | | 6.0 | |
Export prices | | — | | 2.5 | | -1.7 | | -1.9 | | -0.4 | | 3.0 | | 2.7 | | -0.7 | | -0.3 | | 1.0 | | 1.2 | |
Imports | | | | | | | | | | | | | | | | | | | | | | | |
Imports of goods | | 927 | | -5.0 | | -0.2 | | 7.0 | | 7.6 | | 7.9 | | 7.6 | | 7.9 | | 7.3 | | — | | — | |
Processed goods(2) | | 682 | | -6.5 | | -1.4 | | 5.6 | | 9.9 | | 9.3 | | 9.7 | | 9.5 | | 8.3 | | — | | — | |
Imports of services | | 297 | | 4.6 | | -6.4 | | -0.4 | | 5.3 | | 4.0 | | 8.5 | | 6.5 | | 5.1 | | — | | — | |
Total imports | | 1 224 | | -2.6 | | -1.9 | | 5.0 | | 7.0 | | 6.9 | | 7.8 | | 7.6 | | 6.7 | | 6.7 | | 6.7 | |
Import prices | | — | | 4.1 | | 0.1 | | -2.2 | | 0.8 | | 4.7 | | 3.5 | | -2.1 | | -1.0 | | 0.8 | | 1.1 | |
(1) In current prices.
(2) Classification according to SNI.
Källor: Statistiska centralbyrån och Finansdepartementet.
Gross fixed capital formation
| | SEK billion | | Percentage change in volume | |
| | 2006(1) | | 2001 | | 2002 | | 2003 | | 2004 | | 2005 | | 2006 | | 2007 | | 2008 | | 2009 | | 2010 | |
Business Sector(2) | | 335 | | -2.9 | | -7.1 | | 1.2 | | 5.9 | | 8.8 | | 6.1 | | 4.8 | | 4.6 | | — | | — | |
Producers of goods | | 152 | | -0.6 | | -9.4 | | 3.3 | | 3.4 | | 15.9 | | 6.1 | | 8.1 | | 5.9 | | — | | — | |
Industry | | 86 | | 2.2 | | -14.2 | | -1.4 | | 2.8 | | 13.9 | | 4.0 | | 9.1 | | 5.7 | | — | | — | |
Electricity, gas and water supply | | 34 | | -7.5 | | 3.9 | | 11.0 | | 7.2 | | 29.9 | | 11.4 | | 11.0 | | 9.2 | | — | | — | |
Producers of services(2) | | 184 | | -4.4 | | -5.4 | | -0.2 | | 7.8 | | 3.6 | | 6.1 | | 2.1 | | 3.4 | | — | | — | |
Corporate services | | 38 | | -7.6 | | -1.0 | | 0.5 | | 16.8 | | 5.6 | | 4.0 | | 1.7 | | 2.5 | | — | | — | |
Wholesale and retail trade | | 33 | | -6.8 | | -6.3 | | 9.0 | | 14.3 | | 5.1 | | 3.7 | | 4.9 | | 4.8 | | — | | — | |
Housing | | 91 | | 4.2 | | 10.5 | | 5.4 | | 15.4 | | 14.0 | | 16.5 | | 10.1 | | -1.5 | | — | | — | |
New construction | | 58 | | 5.7 | | 13.1 | | 6.3 | | 23.1 | | 16.5 | | 15.3 | | 12.1 | | -7.3 | | — | | — | |
Refurbishment | | 33 | | 2.4 | | 6.9 | | 4.0 | | 4.6 | | 10.0 | | 18.7 | | 6.6 | | 9.0 | | — | | — | |
General government | | 82 | | 4.5 | | 8.7 | | -2.7 | | 1.4 | | -0.3 | | 8.7 | | 4.1 | | 4.4 | | — | | — | |
Central government | | 42 | | 1.3 | | 11.1 | | 1.0 | | 9.6 | | -7.4 | | 8.2 | | 7.2 | | 5.7 | | — | | — | |
Local government | | 40 | | 7.7 | | 6.5 | | -6.3 | | -6.9 | | 8.3 | | 9.2 | | 0.9 | | 3.0 | | — | | — | |
Total | | 509 | | -1.0 | | -2.6 | | 1.1 | | 6.4 | | 8.1 | | 8.2 | | 5.6 | | 3.4 | | 2.3 | | 2.7 | |
Building and construction | | 226 | | 5.9 | | 2.6 | | -2.1 | | 6.4 | | 4.8 | | 12.2 | | 6.6 | | 1.8 | | — | | — | |
Machinery | | 209 | | -4.4 | | -3.6 | | 3.3 | | 6.3 | | 12.5 | | 4.7 | | 4.8 | | 4.8 | | — | | — | |
Other | | 74 | | -5.7 | | -11.9 | | 3.1 | | 6.9 | | 5.2 | | 7.0 | | 5.1 | | 5.1 | | — | | — | |
(1) Current prices.
(2) Excluding housing.
Sources: Statistics Sweden and Ministry of Finance.
94
Household income and savings
Household income
| | SEK billion | | Per centage change, current prices | |
| | 2006(1) | | 2001 | | 2002 | | 2003 | | 2004 | | 2005 | | 2006 | | 2007 | | 2008 | | 2009 | | 2010 | |
Real disposable income(2) | | 1 359 | | 6.3 | | 3.4 | | 1.2 | | 1.4 | | 1.5 | | 2.0 | | 5.7 | | 2.7 | | 2.4 | | 2.1 | |
Price index(3) | | — | | 2.1 | | 1.7 | | 1.8 | | 0.8 | | 1.3 | | 1.3 | | 0.9 | | 1.6 | | 2.2 | | 2.4 | |
Nominal disposable income | | 1 377 | | 8.5 | | 5.2 | | 3.0 | | 2.2 | | 2.8 | | 3.3 | | 6.8 | | 4.3 | | 4.6 | | 4.5 | |
Wage bill(4) | | 1 137 | | 5.8 | | 3.2 | | 2.4 | | 2.6 | | 3.7 | | 5.4 | | 6.1 | | 5.5 | | 4.9 | | 4.5 | |
Other factor income | | 250 | | 0.0 | | 5.1 | | 3.7 | | -2.3 | | 8.7 | | 5.9 | | 5.4 | | 5.3 | | 4.5 | | 4.7 | |
Interests and dividends, net(5) | | 7 | | 0.3 | | -0.4 | | 0.0 | | 0.9 | | -0.5 | | -0.5 | | 0.0 | | 0.0 | | 0.1 | | 0.2 | |
General government transfers | | 497 | | 2.7 | | 4.2 | | 7.7 | | 3.5 | | 1.6 | | 1.7 | | -0.2 | | 2.6 | | 4.5 | | 4.7 | |
Old age | | 238 | | 3.4 | | 4.1 | | 10.7 | | 3.3 | | 0.7 | | 2.8 | | 3.8 | | 4.6 | | 6.5 | | 6.3 | |
Sickness | | 118 | | 10.1 | | 8.8 | | 7.4 | | 1.0 | | 3.7 | | 0.0 | | -1.6 | | 1.6 | | 2.9 | | 4.1 | |
Labour market | | 40 | | -18.0 | | 1.9 | | 11.2 | | 10.9 | | -0.3 | | -9.0 | | -21.7 | | -4.7 | | 3.6 | | 0.9 | |
Family and children | | 53 | | 7.4 | | 2.3 | | 3.0 | | 1.8 | | 2.8 | | 8.7 | | 1.9 | | 2.6 | | 2.6 | | 2.8 | |
Education | | 13 | | 2.1 | | -3.6 | | -9.4 | | 1.2 | | 2.9 | | 5.3 | | -3.4 | | -1.0 | | 1.0 | | 1.6 | |
Other | | 35 | | 2.0 | | -0.2 | | -0.4 | | 6.4 | | 1.5 | | 2.0 | | -0.2 | | -0.8 | | 0.8 | | 1.2 | |
Private transfers | | 43 | | 31.2 | | -14.9 | | 5.2 | | 2.9 | | 0.1 | | -5.9 | | 0.8 | | 0.4 | | 4.1 | | 4.3 | |
Taxes and charges | | -556 | | -2.7 | | -3.1 | | 6.6 | | 4.6 | | 4.5 | | 4.9 | | -1.9 | | 5.3 | | 5.5 | | 5.1 | |
Household savings
| | SEK billion | | Percent of disposable income | |
| | 2006(1) | | 2001 | | 2002 | | 2003 | | 2004 | | 2005 | | 2006 | | 2007 | | 2008 | | 2009 | | 2010 | |
Own savings | | 38 | | 3.9 | | 5.7 | | 5.1 | | 4.3 | | 3.5 | | 2.8 | | 4.2 | | 3.2 | | 3.1 | | 2.6 | |
Net savings in supplementary pension schemes (incl. pps) | | 80 | | 6.6 | | 5.5 | | 6.0 | | 5.8 | | 5.7 | | 5.8 | | 5.6 | | 5.7 | | 5.8 | | 5.9 | |
Net savings(6) | | 118 | | 9.8 | | 10.6 | | 10.5 | | 9.6 | | 8.7 | | 8.1 | | 9.3 | | 8.4 | | 8.5 | | 8.1 | |
Net lending | | 88 | | 9.8 | | 10.2 | | 9.8 | | 8.2 | | 7.3 | | 6.4 | | 7.4 | | 6.6 | | 6.7 | | 6.4 | |
(1) In current prices.
(2) Household real disposable income is calculated by deflating nominal income by the implicit price index for household consumption expenditure (IPI).
(3) Implicit price index (IPI) for household consumption expenditure.
(4) The wage bill corresponds to the numbers of hours worked multiplied by the hourly wages.
(5) Interests and dividends are given as the net contribution to growth in household real disposable income.
(6) Net savings = net savings including net savings in supplementary pensions schemes (incl. savings in the premium pension system (pps) / (Disposable income + net savings in supplementary pensions schemes (incl. pps)).
Sources: Statistics Sweden and Ministry of Finance.
Business sector output
| | SEK billion | | Percentage change in volume | |
| | 2006(1) | | 2001 | | 2002 | | 2003 | | 2004 | | 2005 | | 2006 | | 2007 | | 2008 | | 2009 | | 2010 | |
Producers of goods | | 756 | | -0.3 | | 3.7 | | 1.7 | | 9.3 | | 3.5 | | 5.2 | | 4.7 | | 3.8 | | — | | — | |
of which: Industry | | 519 | | -2.2 | | 5.8 | | 3.7 | | 10.1 | | 4.1 | | 5.6 | | 5.3 | | 4.8 | | — | | — | |
Construction | | 125 | | 5.4 | | -0.5 | | -3.3 | | 5.1 | | 5.6 | | 9.6 | | 5.8 | | 1.8 | | — | | — | |
Producers of services | | 1 174 | | 1.8 | | 1.4 | | 2.1 | | 2.7 | | 3.8 | | 5.9 | | 4.2 | | 3.8 | | — | | — | |
of which: Trade | | 273 | | 1.2 | | 2.3 | | 5.9 | | 5.6 | | 5.0 | | 6.0 | | 5.4 | | 5.0 | | — | | — | |
Corporate services | | 262 | | 4.7 | | -4.0 | | 4.2 | | 7.5 | | 5.4 | | 10.2 | | 4.8 | | 4.5 | | — | | — | |
Total business sector | | 1 930 | | 1.0 | | 2.3 | | 1.9 | | 5.2 | | 3.7 | | 5.6 | | 4.4 | | 3.8 | | 2.5 | | 2.8 | |
(1) In current prices.
Sources: Statistics Sweden and Ministry of Finance.
95
General government output
| | SEK billion | | Percentage change in volume | |
| | 2006(1) | | 2001 | | 2002 | | 2003 | | 2004 | | 2005 | | 2006 | | 2007 | | 2008 | | 2009 | | 2010 | |
Local government output | | 367 | | 0.6 | | 0.0 | | 0.5 | | 2.3 | | 0.1 | | 1.3 | | 1.6 | | 1.6 | | 0.5 | | 0.5 | |
Central government output | | 131 | | 0.0 | | 2.2 | | 1.1 | | 1.2 | | -1.1 | | 0.6 | | 0.7 | | 0.5 | | 0.2 | | 0.2 | |
General government output | | 498 | | 0.4 | | 0.6 | | 0.6 | | 2.0 | | -0.2 | | 1.1 | | 1.4 | | 1.3 | | 0.4 | | 0.4 | |
(1) Current prices.
Sources: Statistics Sweden and Ministry of Finance.
Current account balance
SEK, billion, current prices unless otherwise stated
| | 2001 | | 2002 | | 2003 | | 2004 | | 2005 | | 2006 | | 2007 | | 2008 | | 2009 | | 2010 | |
Trade balance | | 149 | | 158 | | 150 | | 170 | | 144 | | 153 | | 169 | | 176 | | 187 | | 194 | |
% of GDP | | 6.5 | | 6.7 | | 6.1 | | 6.6 | | 5.4 | | 5.4 | | 5.6 | | 5.5 | | 5.6 | | 5.6 | |
Services balance | | -5 | | 6 | | 17 | | 43 | | 58 | | 78 | | 86 | | 98 | | 104 | | 110 | |
Factor income | | -15 | | -11 | | 31 | | -3 | | 21 | | 8 | | 9 | | 9 | | 10 | | 10 | |
Current transfers | | -28 | | -32 | | -18 | | -35 | | -34 | | -34 | | -28 | | -34 | | -33 | | -37 | |
Current account | | 101 | | 121 | | 181 | | 176 | | 188 | | 204 | | 236 | | 249 | | 268 | | 277 | |
% of GDP | | 4.4 | | 5.1 | | 7.3 | | 6.9 | | 7.1 | | 7.2 | | 7.8 | | 7.8 | | 8.0 | | 7.9 | |
Capital transfers | | -2 | | -1 | | 0 | | 0 | | 2 | | -21 | | -4 | | -5 | | -5 | | -5 | |
Net lending | | 99 | | 121 | | 180 | | 176 | | 191 | | 184 | | 233 | | 244 | | 263 | | 272 | |
% of GDP | | 4.3 | | 5.1 | | 7.3 | | 6.9 | | 7.1 | | 6.5 | | 7.7 | | 7.7 | | 7.9 | | 7.8 | |
Terms of trade percent change | | -1.6 | | -1.8 | | 0.4 | | -1.3 | | -1.7 | | -0.8 | | 1.4 | | 0.7 | | 0.2 | | 0.1 | |
Sources: Statistics Sweden and Ministry of Finance.
Components of saving
| | SEK billion | | Percent of GDP | |
| | 2006(1) | | 2001 | | 2002 | | 2003 | | 2004 | | 2005 | | 2006 | | 2007 | | 2008 | | 2009 | | 2010 | |
Real balance | | 509 | | 17.5 | | 16.6 | | 16.4 | | 16.3 | | 17.1 | | 17.9 | | 18.3 | | 18.4 | | 18.3 | | 18.3 | |
Fixed capital formation | | 509 | | 17.3 | | 16.5 | | 16.0 | | 16.3 | | 17.2 | | 17.9 | | 18.3 | | 18.4 | | 18.3 | | 18.3 | |
Stockbuilding | | 0 | | 0.3 | | 0.1 | | 0.4 | | 0.0 | | -0.1 | | 0.0 | | 0.0 | | 0.0 | | 0.0 | | 0.0 | |
Net lending | | 184 | | 4.3 | | 5.1 | | 7.3 | | 6.9 | | 7.2 | | 6.5 | | 7.7 | | 7.7 | | 7.9 | | 7.8 | |
General government | | 60 | | 1.7 | | -1.5 | | -1.1 | | 0.6 | | 1.9 | | 2.1 | | 2.3 | | 2.2 | | 2.5 | | 3.2 | |
Own savings | | 88 | | 5.0 | | 5.3 | | 5.0 | | 4.2 | | 3.6 | | 3.1 | | 3.6 | | 3.2 | | 3.2 | | 3.0 | |
Business sector | | 37 | | -2.4 | | 1.3 | | 3.4 | | 2.1 | | 1.6 | | 1.3 | | 1.8 | | 2.3 | | 2.2 | | 1.5 | |
Gross balance | | 693 | | 21.9 | | 21.7 | | 23.7 | | 23.1 | | 24.3 | | 24.4 | | 26.0 | | 26.0 | | 26.2 | | 26.1 | |
(1) In current prices.
Sources: Statistics Sweden and Ministry of Finance.
Gross national income (GNI)
SEK, billion, current prices
| | 2001 | | 2002 | | 2003 | | 2004 | | 2005 | | 2006 | | 2007 | | 2008 | | 2009 | | 2010 | |
GDP | | 2288 | | 2372 | | 2460 | | 2565 | | 2671 | | 2838 | | 3018 | | 3187 | | 3338 | | 3496 | |
Primary income | | -19 | | -9 | | 23 | | -5 | | -7 | | 7 | | 11 | | 11 | | 12 | | 11 | |
GNI | | 2269 | | 2362 | | 2482 | | 2560 | | 2663 | | 2846 | | 3029 | | 3198 | | 3350 | | 3507 | |
Sources: Statistics Sweden and Ministry of Finance.
96
Tables Chapter 4 Labour market, wages, inflation and resource utilisation
Labour market and resource utilisation
| | 2001 | | 2002 | | 2003 | | 2004 | | 2005 | | 2006 | | 2007 | | 2008 | | 2009 | | 2010 | |
Selected labour market statistics | | | | | | | | | | | | | | | | | | | | | |
Percentage change unless otherwise stated | | | | | | | | | | | | | | | | | | | | | |
GDP | | 1.1 | | 2.0 | | 1.7 | | 4.1 | | 2.9 | | 4.4 | | 3.7 | | 3.3 | | 2.1 | | 2.3 | |
Productivity(1) | | 0.4 | | 3.3 | | 3.2 | | 3.6 | | 2.2 | | 3.1 | | 2.2 | | 2.1 | | 1.8 | | 1.8 | |
Hours worked | | 0.5 | | -1.3 | | -1.5 | | 0.8 | | 0.6 | | 1.4 | | 1.5 | | 1.1 | | 0.2 | | 0.5 | |
Average hours worked | | -1.4 | | -1.4 | | -1.1 | | 1.3 | | -0.2 | | -0.4 | | -0.8 | | 0.2 | | 0.1 | | 0.6 | |
Calendar-adjusted | | | | | | | | | | | | | | | | | | | | | |
GDP | | 1.2 | | 2.0 | | 1.8 | | 3.6 | | 2.9 | | 4.7 | | 3.9 | | 3.2 | | 2.1 | | 2.0 | |
Productivity(1)(2) | | 0.3 | | 3.2 | | 3.0 | | 4.1 | | 2.1 | | 2.9 | | 2.0 | | 2.2 | | 1.8 | | 2.1 | |
Hours worked(2) | | 0.8 | | -1.2 | | -1.2 | | -0.3 | | 0.6 | | 2.0 | | 1.8 | | 0.9 | | 0.2 | | -0.1 | |
Average hours worked(2) | | -1.2 | | -1.4 | | -0.9 | | 0.2 | | -0.2 | | 0.1 | | -0.4 | | -0.0 | | 0.1 | | 0.0 | |
Employed | | 2.0 | | 0.1 | | -0.3 | | -0.5 | | 0.8 | | 1.8 | | 2.3 | | 0.9 | | 0.1 | | -0.1 | |
Regular empl. rate, age 16—64(3)(4) | | 75.1 | | 74.8 | | 74.2 | | 73.2 | | 73.2 | | 73.5 | | 75.0 | | 75.6 | | 75.7 | | 75.6 | |
Regular empl. rate, age 20—64(3)(4) | | 78.6 | | 78.4 | | 77.9 | | 77.2 | | 77.4 | | 77.7 | | 79.4 | | 80.2 | | 80.3 | | 80.1 | |
Labour force | | 1.2 | | 0.2 | | 0.7 | | 0.2 | | 0.8 | | 1.2 | | 1.5 | | 0.3 | | 0.2 | | -0.1 | |
Open unemployment(4)(5) | | 4.3 | | 4.3 | | 5.3 | | 6.0 | | 6.0 | | 5.4 | | 4.7 | | 4.1 | | 4.2 | | 4.2 | |
Labour market policy programmes(5)(6) | | 2.5 | | 2.6 | | 2.1 | | 2.4 | | 2.7 | | 3.0 | | 2.0 | | 2.0 | | 1.9 | | 1.9 | |
Total unemployment(5) | | 6.8 | | 6.9 | | 7.3 | | 8.3 | | 8.7 | | 8.4 | | 6.7 | | 6.2 | | 6.1 | | 6.2 | |
Participants in labour market policy programmes | | | | | | | | | | | | | | | | | | | | | |
Thousands, annual average | | | | | | | | | | | | | | | | | | | | | |
Employed | | 25 | | 24 | | 22 | | 27 | | 40 | | 56 | | 41 | | 20 | | 12 | | 12 | |
In education and training | | 86 | | 93 | | 70 | | 80 | | 83 | | 82 | | 54 | | 75 | | 78 | | 78 | |
Total | | 112 | | 117 | | 92 | | 107 | | 123 | | 138 | | 95 | | 95 | | 90 | | 90 | |
Resource utilisation | | | | | | | | | | | | | | | | | | | | | |
Per cent of potential level(7) | | | | | | | | | | | | | | | | | | | | | |
GDP gap | | -0.5 | | -0.8 | | -1.3 | | -0.7 | | -1.0 | | 0.1 | | 0.6 | | 1.1 | | 0.5 | | 0.0 | |
Productivity gap | | -1.8 | | -1.2 | | -0.9 | | 0.8 | | 0.4 | | 0.8 | | 0.5 | | 0.5 | | 0.1 | | 0.0 | |
Average hours worked gap | | 0.1 | | -0.2 | | 0.0 | | 0.1 | | 0.2 | | 0.2 | | -0.2 | | -0.1 | | 0.0 | | 0.0 | |
Employment gap | | 1.1 | | 0.4 | | -0.6 | | -1.7 | | -1.7 | | -0.8 | | 0.3 | | 0.9 | | 0.4 | | 0.0 | |
(1) Growth rates for productivity, hours worked and average hours worked may not add to GDP growth due to rounding and due to the fact that GDP growth is presented at market price whereas productivity growth is presented at base price.
(2) Calendar adjustment according to the National Institute of Economic Research.
(3) Number of employed in the age group, excluding those employed in labour market policy programmes, as a percentage of the population in the age group.
(4) According to the LFS after the harmonisation in 2005.
(5) Per cent of the labour force.
(6) People in labour market programmes.
(7) The parts may not sum to the GDP gap due to rounding and due to the fact that the GDP gap is calculated in terms of GDP at market price whereas the partial gaps are calculated in base price terms.
Sources: Statistics Sweden, National Labour Market Board, National Institute of Economic Research and Ministry of Finance.
97
Wages and inflation
Annual percentage change unless otherwise stated
| | 2001 | | 2002 | | 2003 | | 2004 | | 2005 | | 2006 | | 2007 | | 2008 | | 2009 | | 2010 | |
Nominal wages | | | | | | | | | | | | | | | | | | | | | |
Industry | | 3.9 | | 4.2 | | 3.2 | | 3.1 | | 3.1 | | 3.2 | | 4.2 | | 4.3 | | — | | — | |
Construction | | 4.8 | | 3.7 | | 3.8 | | 2.6 | | 3.2 | | 3.3 | | 4.2 | | 4.5 | | — | | — | |
Private service sector | | 4.3 | | 3.8 | | 3.2 | | 3.0 | | 3.2 | | 3.2 | | 4.1 | | 4.4 | | — | | — | |
Central government | | 4.2 | | 4.3 | | 4.2 | | 2.9 | | 3.2 | | 3.3 | | 3.6 | | 4.1 | | — | | — | |
Local government | | 4.9 | | 4.5 | | 3.8 | | 4.2 | | 2.8 | | 2.8 | | 3.8 | | 4.1 | | — | | — | |
Total, short-term wage statistics | | 4.4 | | 4.1 | | 3.5 | | 3.3 | | 3.1 | | 3.1 | | 4.0 | | 4.3 | | 4.5 | | 4.4 | |
Total, National Accounts | | 4.9 | | 4.5 | | 3.6 | | 2.8 | | 3.1 | | 3.3 | | 4.3 | | 4.6 | | 4.7 | | 4.6 | |
Consumer prices | | | | | | | | | | | | | | | | | | | | | |
CPI, December | | 2.7 | | 2.1 | | 1.3 | | 0.3 | | 0.9 | | 1.6 | | 2.1 | | 2.6 | | 2.7 | | 2.2 | |
CPI, year-on-year | | 2.4 | | 2.2 | | 1.9 | | 0.4 | | 0.5 | | 1.4 | | 1.8 | | 2.3 | | 2.7 | | 2.5 | |
UND1X, December | | 3.1 | | 2.0 | | 1.6 | | 0.7 | | 1.2 | | 1.2 | | 0.8 | | 1.9 | | 2.4 | | 2.1 | |
UND1X, year-on-year | | 2.5 | | 2.3 | | 2.2 | | 0.8 | | 0.8 | | 1.2 | | 0.8 | | 1.5 | | 2.2 | | 2.2 | |
HICP, December | | 3.1 | | 1.7 | | 1.8 | | 0.9 | | 1.3 | | 1.4 | | 1.1 | | 1.9 | | — | | — | |
HICP, year-on-year | | 2.7 | | 2.0 | | 2.3 | | 1.0 | | 0.8 | | 1.5 | | 1.1 | | 1.5 | | — | | — | |
Net price index, December | | 2.9 | | 2.2 | | 0.8 | | 0.1 | | 0.2 | | 1.9 | | 1.3 | | 1.9 | | — | | — | |
Net price index, year-on-year | | 2.6 | | 2.3 | | 1.5 | | 0.1 | | 0.1 | | 1.0 | | 1.8 | | 1.5 | | — | | — | |
Price base amount, SEK, thousand | | 36.9 | | 37.9 | | 38.6 | | 39.3 | | 39.4 | | 39.7 | | 40.3 | | 40.8 | | 41.8 | | 42.9 | |
Sources: Statistics Sweden and Ministry of Finance.
98
Tables Chapter 5 General government sector
General government finances
SEK billion unless otherwise stated
| | 2000 | | 2001 | | 2002 | | 2003 | | 2004 | | 2005 | | 2006 | | 2007 | | 2008 | | 2009 | | 2010 | |
Revenue | | 1 292 | | 1 272 | | 1 279 | | 1 339 | | 1 402 | | 1 488 | | 1 556 | | 1 606 | | 1 671 | | 1 749 | | 1 830 | |
Percentage of GDP | | 58.3 | | 55.6 | | 53.9 | | 54.5 | | 54.7 | | 55.7 | | 54.8 | | 53.2 | | 52.4 | | 52.4 | | 52.3 | |
Taxes and charges | | 1 153 | | 1 149 | | 1 151 | | 1 207 | | 1 271 | | 1 344 | | 1 403 | | 1 431 | | 1 498 | | 1 571 | | 1 647 | |
Percentage of GDP | | 52.0 | | 50.2 | | 48.5 | | 49.1 | | 49.6 | | 50.3 | | 49.4 | | 47.4 | | 47.0 | | 47.1 | | 47.1 | |
Capital income | | 68 | | 49 | | 48 | | 51 | | 50 | | 59 | | 63 | | 69 | | 67 | | 68 | | 70 | |
Other income | | 71 | | 74 | | 80 | | 82 | | 81 | | 85 | | 90 | | 105 | | 106 | | 109 | | 113 | |
Expenditure | | 1 207 | | 1 234 | | 1 314 | | 1 367 | | 1 387 | | 1 437 | | 1 496 | | 1 536 | | 1 602 | | 1 665 | | 1 718 | |
Percentage of GDP | | 54.4 | | 53.9 | | 55.4 | | 55.6 | | 54.1 | | 53.8 | | 52.7 | | 50.9 | | 50.3 | | 49.9 | | 49.1 | |
Transfers and subsidies | | 473 | | 485 | | 505 | | 545 | | 561 | | 585 | | 597 | | 589 | | 609 | | 631 | | 645 | |
Households | | 407 | | 419 | | 435 | | 469 | | 484 | | 493 | | 502 | | 500 | | 513 | | 536 | | 561 | |
Business | | 40 | | 38 | | 40 | | 44 | | 41 | | 51 | | 49 | | 44 | | 43 | | 47 | | 32 | |
Abroad | | 26 | | 28 | | 30 | | 33 | | 36 | | 41 | | 46 | | 45 | | 52 | | 49 | | 52 | |
Consumption | | 584 | | 614 | | 658 | | 691 | | 703 | | 724 | | 759 | | 800 | | 839 | | 877 | | 913 | |
Investment | | 58 | | 64 | | 73 | | 71 | | 73 | | 74 | | 86 | | 92 | | 98 | | 102 | | 106 | |
Interest | | 93 | | 71 | | 78 | | 59 | | 50 | | 54 | | 54 | | 55 | | 56 | | 55 | | 53 | |
Net lending | | 85 | | 38 | | -34 | | -28 | | 15 | | 51 | | 60 | | 69 | | 69 | | 83 | | 112 | |
Percentage of GDP | | 3.8 | | 1.7 | | -1.5 | | -1.1 | | 0.6 | | 1.9 | | 2.1 | | 2.3 | | 2.2 | | 2.5 | | 3.2 | |
Central government | | 89 | | 166 | | -45 | | -47 | | -13 | | 9 | | 19 | | 32 | | 33 | | 58 | | 93 | |
Old-age pension system | | -9 | | -124 | | 23 | | 25 | | 23 | | 27 | | 30 | | 26 | | 22 | | 16 | | 11 | |
Local government | | 5 | | -4 | | -13 | | -5 | | 5 | | 15 | | 10 | | 11 | | 13 | | 10 | | 8 | |
Financial position | | | | | | | | | | | | | | | | | | | | | | | |
Consolidated gross debt | | 1 205 | | 1 266 | | 1 273 | | 1 315 | | 1 345 | | 1 393 | | 1 331 | | 1 235 | | 1 167 | | 1 074 | | 943 | |
Percentage of GDP | | 54.4 | | 55.3 | | 53.7 | | 53.5 | | 52.4 | | 52.2 | | 46.9 | | 40.9 | | 36.6 | | 32.2 | | 27.0 | |
Net debt | | 123 | | 37 | | 164 | | 96 | | 31 | | -105 | | -444 | | -511 | | -587 | | -668 | | -780 | |
Percentage of GDP | | 5.5 | | 1.6 | | 6.9 | | 3.9 | | 1.2 | | -3.9 | | -15.6 | | -16.9 | | -18.4 | | -20.0 | | -22.3 | |
Sources: Statistics Sweden and Ministry of Finance.
99
Central government finances
SEK billion unless otherwise stated
| | 2000 | | 2001 | | 2002 | | 2003 | | 2004 | | 2005 | | 2006 | | 2007 | | 2008 | | 2009 | | 2010 | |
Revenue | | 802 | | 870 | | 699 | | 730 | | 771 | | 834 | | 867 | | 886 | | 915 | | 954 | | 997 | |
Taxes and charges | | 690 | | 653 | | 633 | | 661 | | 704 | | 758 | | 789 | | 790 | | 822 | | 861 | | 902 | |
Transfers from the pension fund | | 47 | | 155 | | 0 | | 0 | | 2 | | 0 | | 0 | | 0 | | 0 | | 0 | | 0 | |
Other income | | 65 | | 62 | | 66 | | 69 | | 65 | | 76 | | 77 | | 95 | | 92 | | 93 | | 95 | |
Expenditure | | 712 | | 704 | | 744 | | 777 | | 784 | | 826 | | 848 | | 853 | | 881 | | 896 | | 903 | |
Transfers to households, | | | | | | | | | | | | | | | | | | | | | | | |
business sector and abroad | | 297 | | 301 | | 316 | | 351 | | 359 | | 375 | | 378 | | 362 | | 370 | | 376 | | 374 | |
Grants to local government sector | | 111 | | 114 | | 119 | | 122 | | 122 | | 142 | | 149 | | 161 | | 167 | | 167 | | 168 | |
Contributions to the pension fund | | 20 | | 22 | | 21 | | 24 | | 26 | | 27 | | 27 | | 24 | | 23 | | 23 | | 25 | |
Consumption | | 171 | | 173 | | 184 | | 193 | | 193 | | 194 | | 203 | | 212 | | 223 | | 232 | | 240 | |
Investment | | 29 | | 30 | | 34 | | 36 | | 41 | | 40 | | 44 | | 47 | | 51 | | 52 | | 53 | |
Interest | | 86 | | 64 | | 70 | | 51 | | 44 | | 47 | | 46 | | 48 | | 48 | | 46 | | 44 | |
Net lending | | 89 | | 166 | | -45 | | -47 | | -13 | | 9 | | 19 | | 32 | | 33 | | 58 | | 93 | |
Percentage of GDP | | 4.0 | | 7.3 | | -1.9 | | -1.9 | | -0.5 | | 0.3 | | 0.7 | | 1.1 | | 1.1 | | 1.7 | | 2.7 | |
Budget balance | | 102 | | 39 | | 4 | | -47 | | -51 | | 14 | | 18 | | 107 | | 63 | | 102 | | 135 | |
Percentage of GDP | | 4.6 | | 1.7 | | 0.1 | | -1.9 | | -2.0 | | 0.5 | | 0.6 | | 3.5 | | 2.0 | | 3.0 | | 3.9 | |
Central government debt | | 1 278 | | 1 209 | | 1 166 | | 1 186 | | 1 213 | | 1 262 | | 1 220 | | 1 112 | | 1 042 | | 942 | | 805 | |
Percentage of GDP | | 57.6 | | 52.9 | | 49.1 | | 48.2 | | 47.3 | | 47.2 | | 43.0 | | 36.9 | | 32.7 | | 28.2 | | 23.0 | |
Sources: Statistics Sweden and Ministry of Finance.
The old-age pension system
SEK billion unless otherwise stated
| | 2000 | | 2001 | | 2002 | | 2003 | | 2004 | | 2005 | | 2006 | | 2007 | | 2008 | | 2009 | | 2010 | |
Revenue | | 179 | | 177 | | 177 | | 183 | | 191 | | 200 | | 210 | | 215 | | 223 | | 233 | | 245 | |
Social contributions | | 127 | | 137 | | 140 | | 143 | | 147 | | 151 | | 160 | | 167 | | 175 | | 183 | | 192 | |
Contribution from central government | | 20 | | 21 | | 21 | | 23 | | 26 | | 27 | | 27 | | 24 | | 23 | | 23 | | 25 | |
Interest and dividends | | 32 | | 19 | | 17 | | 17 | | 18 | | 22 | | 24 | | 24 | | 25 | | 27 | | 28 | |
Expenditure | | 188 | | 301 | | 154 | | 158 | | 168 | | 173 | | 180 | | 189 | | 201 | | 218 | | 235 | |
Pensions | | 139 | | 144 | | 152 | | 155 | | 163 | | 169 | | 176 | | 185 | | 197 | | 213 | | 230 | |
Transfers to central government | | 45 | | 155 | | 0 | | 0 | | 2 | | 0 | | 0 | | 0 | | 0 | | 0 | | 0 | |
Other | | 4 | | 2 | | 2 | | 3 | | 3 | | 4 | | 4 | | 4 | | 4 | | 4 | | 4 | |
Net lending | | -9 | | -124 | | 23 | | 25 | | 23 | | 27 | | 30 | | 26 | | 22 | | 16 | | 11 | |
Percentage of GDP | | -0.4 | | -5.4 | | 1.0 | | 1.0 | | 0.9 | | 1.0 | | 1.1 | | 0.8 | | 0.7 | | 0.5 | | 0.3 | |
Sources: Statistics Sweden and Ministry of Finance.
100
Local government finances
SEK billion unless otherwise stated
| | 2000 | | 2001 | | 2002 | | 2003 | | 2004 | | 2005 | | 2006 | | 2007 | | 2008 | | 2009 | | 2010 | |
Revenue | | 492 | | 517 | | 546 | | 575 | | 592 | | 628 | | 658 | | 694 | | 727 | | 757 | | 786 | |
Taxes | | 336 | | 359 | | 379 | | 403 | | 420 | | 435 | | 454 | | 475 | | 500 | | 527 | | 553 | |
Central government(1) | | 83 | | 84 | | 87 | | 90 | | 89 | | 108 | | 113 | | 123 | | 127 | | 125 | | 125 | |
Taxes and central government grants, per cent of GDP(1) | | 18.9 | | 19.4 | | 19.6 | | 20.1 | | 19.9 | | 20.3 | | 20.0 | | 19.8 | | 19.7 | | 19.5 | | 19.4 | |
Capital income | | 10 | | 9 | | 11 | | 11 | | 11 | | 10 | | 10 | | 11 | | 12 | | 13 | | 14 | |
Other income(2) | | 62 | | 65 | | 69 | | 71 | | 72 | | 76 | | 81 | | 86 | | 88 | | 91 | | 95 | |
Expenditure | | 487 | | 521 | | 559 | | 581 | | 587 | | 613 | | 648 | | 683 | | 714 | | 747 | | 779 | |
Transfers to households | | 26 | | 28 | | 26 | | 25 | | 26 | | 27 | | 27 | | 27 | | 26 | | 26 | | 27 | |
Other transfers and subsidies | | 8 | | 9 | | 12 | | 12 | | 10 | | 11 | | 15 | | 17 | | 17 | | 18 | | 18 | |
Consumption | | 411 | | 438 | | 471 | | 495 | | 507 | | 526 | | 552 | | 584 | | 612 | | 641 | | 669 | |
Investment | | 34 | | 39 | | 41 | | 40 | | 39 | | 43 | | 47 | | 49 | | 51 | | 54 | | 56 | |
Interest | | 7 | | 7 | | 9 | | 8 | | 6 | | 6 | | 7 | | 7 | | 8 | | 9 | | 9 | |
Net lending | | 5 | | -4 | | -13 | | -5 | | 5 | | 15 | | 10 | | 11 | | 13 | | 10 | | 8 | |
Per cent of GDP | | 0.2 | | -0.2 | | -0.5 | | -0.2 | | 0.2 | | 0.6 | | 0.4 | | 0.4 | | 0.4 | | 0.3 | | 0.2 | |
Financial result | | 1 | | 1 | | -7 | | -1 | | 2 | | 13 | | 15 | | 11 | | 14 | | 10 | | 9 | |
(1) Central grants exclusive VAT.
(2) Other grants includes compensation for VAT.
Sources: Statistics Sweden and Ministry of Finance.
101