 John W. Rowe Chairman, President and Chief Executive Officer 2007 Exelon Investor Conference New York, NY December 19, 2007 Exhibit 99.2 |
 2 Forward-Looking Statements This presentation includes forward-looking statements within the meaning of the Private Securities Litigation Reform Act of 1995, that are subject to risks and uncertainties. The factors that could cause actual results to differ materially from these forward-looking statements include those discussed herein as well as those discussed in (1) Exelon’s 2006 Annual Report on Form 10-K in (a) ITEM 1A. Risk Factors, (b) ITEM 7. Management’s Discussion and Analysis of Financial Condition and Results of Operations and (c) ITEM 8. Financial Statements and Supplementary Data: Note 18; (2) Exelon’s Third Quarter 2007 Quarterly Report on Form 10-Q in (a) Part II, Other Information, ITEM 1A. Risk Factors and (b) Part I, Financial Information, ITEM 1. Financial Statements: Note 13; and (3) other factors discussed in filings with the Securities and Exchange Commission by Exelon Corporation, Exelon Generation Company, LLC, Commonwealth Edison Company, and PECO Energy Company (Companies). Readers are cautioned not to place undue reliance on these forward- looking statements, which apply only as of the date of this presentation. None of the Companies undertakes any obligation to publicly release any revision to its forward-looking statements to reflect events or circumstances after the date of this presentation. This presentation includes references to adjusted (non-GAAP) operating earnings that exclude the impact of certain factors. We believe that these adjusted operating earnings are representative of the underlying operational results of the company. Please refer to the Supplemental Information presentation in Form 8-K filed on December 19, 2007 for a reconciliation of adjusted (non-GAAP) operating earnings to GAAP earnings and a reconciliation of GAAP net income to adjusted (non-GAAP) EBITDA. |
 3 Today’s Conference Agenda 10:00 a.m. – 10:35 a.m. John Rowe – Welcome and Strategic Overview 10:35 a.m. – 11:00 a.m. John Young – Financial Overview 11:00 a.m. – 11:15 a.m. Break 11:15 a.m. – 12:15 p.m. Panel Q&A – John Rowe, John Young, Chris Crane, Lisa Crutchfield, Ian McLean, Betsy Moler, Anne Pramaggiore 12:15 p.m. – 12:30 p.m. John Rowe – Wrap-up 12:30 p.m. – 1:30 p.m. Lunch / Informal discussion (Hilton Room) |
 4 |
 5 $3.22 $3.10 $2.78 $2.61 $2.41 $2.24 $1.93 Oct- 00 Apr- 01 Oct- 01 Apr- 02 Oct- 02 Apr- 03 Oct- 03 Apr- 04 Oct- 04 Apr- 05 Oct- 05 Apr- 06 Oct- 06 Apr- 07 Oct- 07 10/20/00 – 11/30/07 Assumes dividend reinvestment Source: Bloomberg EXC 241% UTY 105% (1) 8-year growth rate through 2008; calculated using midpoint of 2008 Operating EPS guidance range and 2000 Operating EPS of $1.93/share as base year. $4.15-$4.30 Sustainable Financial Performance Total Shareholder Return Adjusted (non-GAAP) Operating EPS $4.00-$4.40 2000 – 2008 compound annual operating EPS growth is projected at ~10%. Seven-year total return exceeds 240% |
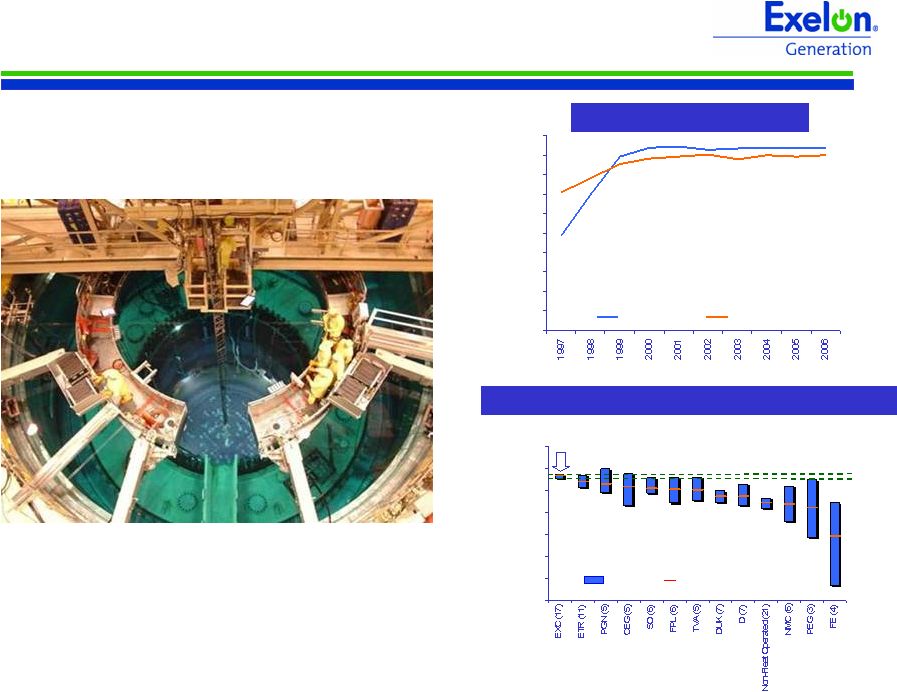 6 Sustainable Operating Excellence – Exelon Generation 0% 10% 20% 30% 40% 50% 60% 70% 80% 90% 100% Exelon Industry Average Capacity Factor Note: Exelon data prior to 2000 represent ComEd-only nuclear fleet. Sources: Platt’s, Nuclear News, Nuclear Energy Institute and Energy Information Administration (Department of Energy). Range of Fleet 2-Yr Avg Capacity Factor (2002-2006) 65% 70% 75% 80% 85% 90% 95% 100% Operator (# of Reactors) Range 5-Year Average EXC 93.2% |
 7 Sustainable Operating and Regulatory Performance – ComEd Fewer Interruptions and Shorter Outages Note: Data based on IEEE definition which excludes major events and planned outages. “State touts rate-relief plan; Proposal could trim average ComEd bill $8 a month” (July 24, 2007) 0.50 1.00 1.50 2.00 1998 2007 Projected 0 50 100 150 200 Frequency (SAIFI) Duration (CAIDI) |
 8 Sustainable Operating and Regulatory Performance – PECO 0.50 0.60 0.70 0.80 0.90 1.00 1.10 1998 2007 Projected 0 40 80 120 160 Frequency (SAIFI) Duration (CAIDI) Fewer Interruptions and Shorter Outages “Rendell sees urgent need to complete energy plan” (September 14, 2007) Note: Data based on IEEE definition which excludes major events and planned outages. |
 9 5 DRAFT 12/7/2006 10:00 AM A Sustainable Vision, A Dynamic Strategy Exelon’s Strategic Direction Protect Today’s Value • Deliver superior operating performance – Keep the lights on – Continue nuclear excellence • Support competitive markets – Maintain/bolster PJM – Step up advocacy – Encourage market-based new entry – Enhance auction construct – Participate in competitive new entry • Protect the value of our generation – Optimize the generation portfolio – Hedge market risk appropriately • Build healthy, self-sustaining delivery companies – ComEd – fight rate freeze legislation, seek long-term peace and drive path to financial health – PECO – maintain performance and prepare for 2011 transition to market Grow Long-Term Value • Take the organization to the next level of performance – Foster positive employee relations – Require accountability for results and values – Acquire, develop and retain key talent – Continuously improve productivity • Align our financial management policies with the changing profile of our company • Rigorously evaluate new growth opportunities – Generation – Transmission – Distribution • Advance an environmental strategy that leverages our carbon position + |
 10 A Sustainable Environment |
 11 |
 John F. Young Executive Vice President, Finance and Markets, and Chief Financial Officer 2007 Exelon Investor Conference New York, NY December 19, 2007 |
 13 YTD Highlights • Solid financial operating EPS results - Higher generation margins - Favorable weather - Strong nuclear performance • Illinois Settlement • Engaged in Pennsylvania transition • Value Return Plan implementation • ComEd Regulatory Recovery Plan execution 2007 Operating EPS Guidance of $4.15 - $4.30 2008 Operating EPS Guidance of $4.00 - $4.40 Financial Update YTD EPS Results $3.26 $2.53 Weather Normalized $3.31 $2.50 Operating Sep-07 Sep-06 2008 (1) $0.55 - $0.60 $3.15 - $3.45 $4.00 - $4.40 $0.35 - $0.40 2008 EPS Guidance (1) Operating EPS: $4.00 - $4.40 GAAP EPS: $3.70 - $4.10 (1) Refer to Appendix for key assumptions supporting 2008 earnings guidance and for expected 2008 earnings drivers for Exelon Generation, ComEd and PECO. Operating Company ranges do not add to Exelon guidance of $4.00 - $4.40/share due to rounding. ComEd PECO Exelon Generation HoldCo/Other ~$(0.10) Exelon |
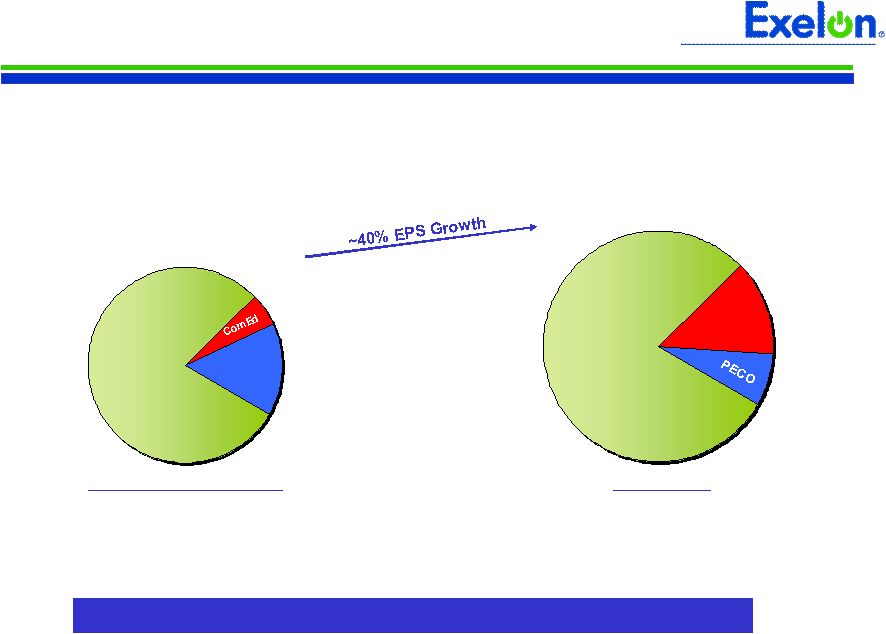 14 PECO ExGen Operating EPS Guidance: $4.15 – $4.30 2007 ~9% Compound Annual Growth Rate in EPS from 2007 to 2011 2011 ExGen ComEd Major Driver: End of below-market contract in PA Exelon Is Uniquely Positioned for Sustainable Value Creation |
      15 PECO and ComEd Average Annual Rate Base ($ in Billions) CTC Electric Transmission Electric Distribution Gas Numbers may not sum due to rounding (1) Illustrative. Provided solely to illustrate possible future outcomes that are based on a number of different assumptions, all ofwhich are subject to uncertainties and should not be relied upon as a forecast of future results. (2) ComEd estimated equity based on definition provided in most recent ICC distribution rate case order (book equity less goodwill). Projected book equity ratio in 2007 is 58%. (3) ComEd 2008 estimated net income assumes full $361M revenue increase granted in current distribution rate case. 6.0 6.6 8.0 1.8 2.0 2.2 $220 - $260M (3) $130 - $165M ~5.5 - 6.5% ~3.8 - 4.8% 45% 44% 7.8 8.6 ~$460 - $500M ~10 - 11% ~45% 2007E 2008E 2011 (1) 10.2 2.6 2.8 3.1 0.5 0.5 0.6 2.7 2.0 1.1 1.1 1.2 6.9 6.4 2007E 2008E 2011 (1) 4.9 ~$245 - $270M ~10 - 11% ~50% $435 - $470M Not applicable due to transition rate structure $360 - $400M Net Income ROE Equity (2) |
    16 • Large, low-cost, low-emissions, exceptionally well-run nuclear fleet • Complementary and flexible fossil and hydro fleet • Improving power market fundamentals (commodity prices, heat rates, and capacity values) • End of below-market contracts in Pennsylvania beginning 2011 • Potential carbon restrictions Value Proposition Exelon Generation is the premier unregulated generation company – positioned to capture market opportunities and manage risk Exelon Generation • Continue to focus on operating excellence, cost management, and market discipline • Support competitive markets • Pursue nuclear & hydro plant license extension and strategic investment in material condition • Maintain industry-leading talent Protect Value • Pursue nuclear plant uprates (~200MW by 2012) and investigate potential for more • Pursue nuclear Construction and Operating License in Texas • Capture increased value of low-carbon generation portfolio Grow Value |
 17 Sustainable Operating Excellence 0% 10% 20% 30% 40% 50% 60% 70% 80% 90% 100% Exelon Industry Average Capacity Factor Note: Exelon data prior to 2000 represent ComEd-only nuclear fleet. Sources: Platt’s, Nuclear News, Nuclear Energy Institute and Energy Information Administration (Department of Energy). 65 70 75 80 85 90 95 100 Operator (# of Reactors) Range 5-Year Average Range of Fleet 2-Yr Avg Capacity Factor (2002-2006) EXC 93.2% |
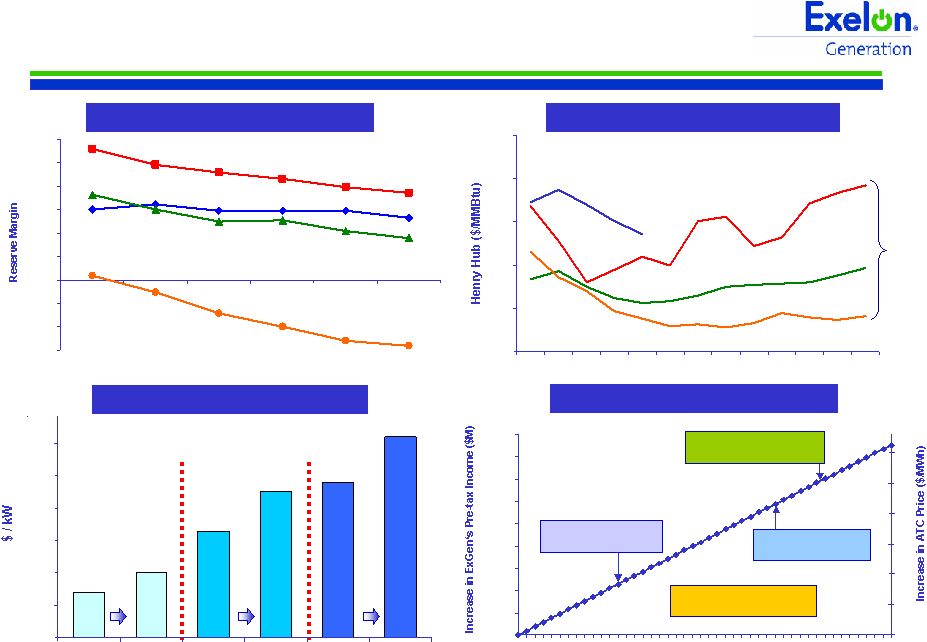 18 -15% -10% -5% 0% 5% 10% 15% 20% 25% 30% 2007 2008 2009 2010 2011 2012 Reserve Margins Declining Natural Gas Prices Remaining High PJM-West PJM-East NI-Hub ERCOT $5 $6 $7 $8 $9 $10 2008 2010 2012 2014 2016 2018 2020 NYMEX (1) Positively Exposed to Market Dynamics Note: Illustrative estimate. Overnight, all-in capital cost without interest during construction. 0 500 1,000 1,500 2,000 2,500 3,000 3,500 4,000 4,500 0 5 10 15 20 25 30 35 40 45 0 5 10 15 20 25 30 EIA Carbon Case 2010: $31/tonne Europe Carbon-Trading 2012: $36.50/tonne Carbon Credit ($/Tonne) Carbon Legislation Progressing Lieberman-Warner Possible $20 to $40/tonne Bingaman-Specter 2012: $12/tonne Various 3rd party estimates Construction Costs Escalating New Generation Installed Cost Combined Cycle Gas Turbine Coal Nuclear 0 500 1,000 1,500 2,000 2,500 3,000 2006 2007 2006 2007 2006 2007 (1) As of 7/31/07. |
 19 2008 “Open” EBITDA 2008 EBITDA 2008 Un-hedged EBITDA (No Carbon) $ Millions ~$4,100 ~$3,900 2007 EBITDA Un-hedged (“Open”) EBITDA plus upside from energy, capacity, and carbon drives Exelon Generation’s value (1) Un-hedged EBITDA assumes that existing hedges (including the PECO load, Illinois auction load, ComEd financial swap, and other sales) are priced at market prices as of 7/31/07. (2) 1 tonne = 2,205 lbs. ~$5,350 Hedged – 2008E Un-hedged – 2008E (1) Hedged – 2007E 169.10 Eastern MAAC Capacity Price ($/MW-day) 82.40 Rest-of-Market Capacity Price ($/MW-day) 5.60 NI-Hub Implied Heat Rate (mmBtu/MWh) 6.60 PJM W-Hub Implied Heat Rate (mmBtu/MWh) 47.00 NI-Hub ATC Price ($/MWh) 62.90 PJM W-Hub ATC Price ($/MWh) 8.50 Henry Hub Gas Price ($/mmBtu) 2008 Un-hedged EBITDA (1) Assumptions ~$1,000M + $10/Tonne Carbon Price (2) ~$80M +/- $10/MW-Day Capacity Price ~$750M +/- 500 Btu/KWh ATC Heat Rate ~$560M +/- $1/mmBtu Gas Price (Pre-Tax Impact) 2008 Un-hedged EBITDA (1) Sensitivities $2,060 - $2,260 Operating Earnings: $2,320 - $2,385 |
 20 Disciplined Financial Management • Announced a new Value Return Policy last December – Established annual base dividend of $1.76/share; anticipated to grow modestly over time – Returns excess cash and/or balance sheet capacity through share repurchases • Executed a $1.25 billion accelerated share repurchase agreement in September 2007 Today’s announcement: • New share repurchase program of $500 million – Incremental to $1.25 billion buyback executed in September 2007 and to any additional buybacks that may be authorized in 2008 • Annual base dividend rate reset at $2.00/share (beginning Q1 2008); anticipated to grow modestly over time (1) – Higher base dividend reflects higher expected long-term earnings due to improved market fundamentals (1) Future dividends are subject to declaration by the Board of Directors. |
 21 2008 Projected Sources and Uses of Cash $1,240 Cash available after Dividend ($1,310) Dividend (3) $2,550 Cash available before Dividend $1,220 Net Financing (excluding Dividend) (2) ($3,120) Capital Expenditures $4,450 Cash Flow from Operations (1) Exelon (4) $ Millions (1) Cash Flow from Operations = Net cash flows provided by operating activities less net cash flows used in investing activities other than capital expenditures. (2) Net Financing (excluding Dividend) = Net cash flows used in financing activities excluding dividends paid on common and preferred stock. (3) Assumes 2008 Dividend of $2.00 per share. (4) Includes cash flow activity from Holding Company, eliminations, and other corporate entities. |
 22 0 2 4 6 8 10 12 14 16 18 (-25%) Forward Gas Prices as of 7/31/07 (+25%) Balance Sheet Capacity Exelon expects to create substantial incremental balance sheet capacity over the next five years, based on planning assumptions 2008 - 2012 Potential Uses of Available Cash • Growth opportunities • Future unfunded liabilities • Buffer against potentially lower commodity prices • Share repurchases or other value return options (1) Available Cash after Dividend = Cash Flow from Operations - CapEx - Dividends +/- Net Financings. Cash Flow from Operations = Net cash flows provided by operating activities less net cash flows used in investing activities other than capital expenditures. Net Financing (excluding Dividends) = Net cash flows used in financing activities excluding dividends paid on common stock. Assumes annualized dividend of $2.00 /share in 2008, growing 5% annually; actual amounts may vary, subject to board approval. (2) Available Cash after Dividend excludes any benefit from potential carbon impact . (3) See “FFO Calculation and Ratios” definitions slide in Appendix. FFO / Debt includes: debt equivalents for purchased power agreements, unfunded pension and other postretirement benefits obligations, capital adequacy for energy trading, and related imputed interest. S&P “BBB” Range for FFO/Debt Ratio: 20% to 30% Gas Price Sensitivity 2008 - 2012 Cumulative Available Cash (Illustrative) |
 23 Sustainable Value • Continued strong financial and operating performance, and long-term earnings growth driven by unregulated generation • Largest, lowest-cost nuclear fleet in competitive markets • Executing regulatory recovery plan to put ComEd on a path toward appropriate returns and solid credit metrics • Managing transition to competitive markets in Pennsylvania • Increasingly strong cash flows and balance sheet • Implementing Value Return Policy Exelon is uniquely positioned to create sustainable value |
 24 |
 25 Appendix |
 26 Key Assumptions 37.3 1.2 2.0 23.90 115.40 6.40 6.80 43.60 7.30 7.80 57.1 7.00 149,800 40,900 (5) 190,700 94.7 2007 Est. 37.2 1.6 1.2 82.40 169.10 5.60 8.40 47.00 6.60 9.50 62.90 8.50 148,200 41,100 (5) 189,300 93.1 2008 Est. 6.56 8.41 Chicago City Gate Gas Price ($/mmBtu) 7.31 9.67 Tetco M3 Gas Price ($/mmBtu) 37.0 37.5 Effective Tax Rate (%) (4) 0.6 1.3 ComEd 1.2 0.9 PECO Electric Delivery Growth (%) (3) 1.75 0.13 PJM West Capacity Price ($/MW-day) 1.75 0.13 PJM East Capacity Price ($/MW-day) 6.32 5.52 NI Hub Implied ATC Heat Rate (mmbtu/MWh) 41.42 46.39 NI Hub ATC Price ($/MWh) 6.98 6.30 PJM West Hub Implied ATC Heat Rate (mmbtu/MWh) 51.07 60.92 PJM West Hub ATC Price ($/MWh) 6.74 8.85 Henry Hub Gas Price ($/mmBtu) 71,326 72,376 Total Genco Market and Retail Sales (GWhs) (2) 119,354 121,961 Total Genco Sales to Energy Delivery (GWhs) 190,680 194,337 Total Genco Sales Excluding Trading (GWhs) 93.9 93.5 Nuclear Capacity Factor (%) (1) 2006 Actual 2005 Actual (1) Excludes Salem. (2) 2008 estimate includes Illinois Auction sales. (3) Weather-normalized retail load growth. (4) Excludes results related to investments in synthetic fuel-producing facilities. (5) Sales to PECO only. |
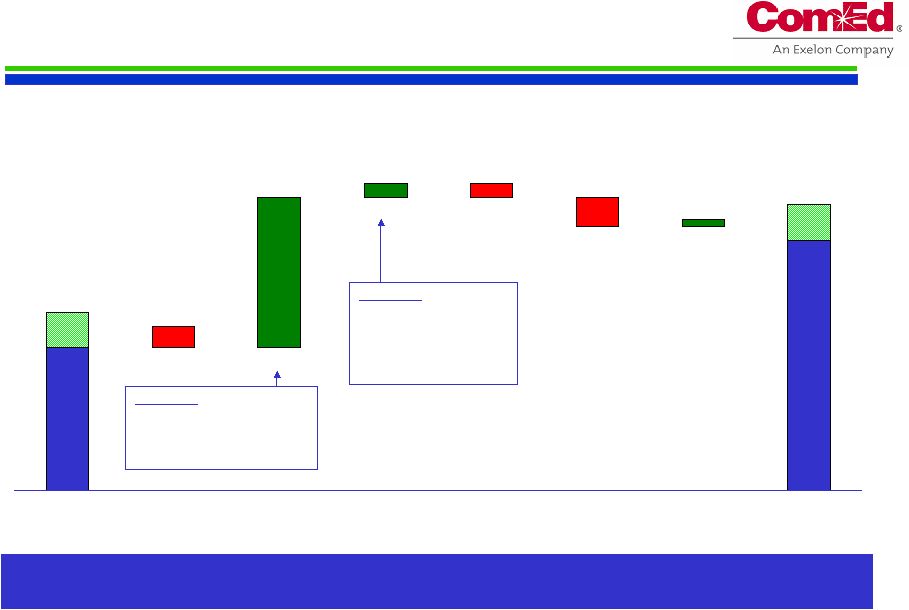 27 ComEd 2008 EPS Contribution ComEd’s operating earnings are expected to increase in 2008 primarily due to execution of its Regulatory Recovery Plan 2007 (1) RNF O&M Depreciation / Amortization Interest Expense Other $0.35 - $0.40 $220M - $260M (2) $0.20 - $0.25 $0.21 $0.02 ($0.02) $(0.04) 2008 (1) $0.01 Key Items: Storms: $0.02 Inflation: $(0.02) Post-2006/Opt-in: $0.02 Bad Debt: $0.01 ($0.03) Weather $130M - $165M $ / Share NOTE: Refer to “Key Assumptions” slide in Appendix. (1) Estimated contribution to Exelon’s operating earnings guidance. (2) Assumes full $361M revenue increase granted in current distribution rate case and effective 10/1/08. Key Items: Distribution case (2) : $0.09 Transmission revenue: $0.06 Load growth: $0.03 |
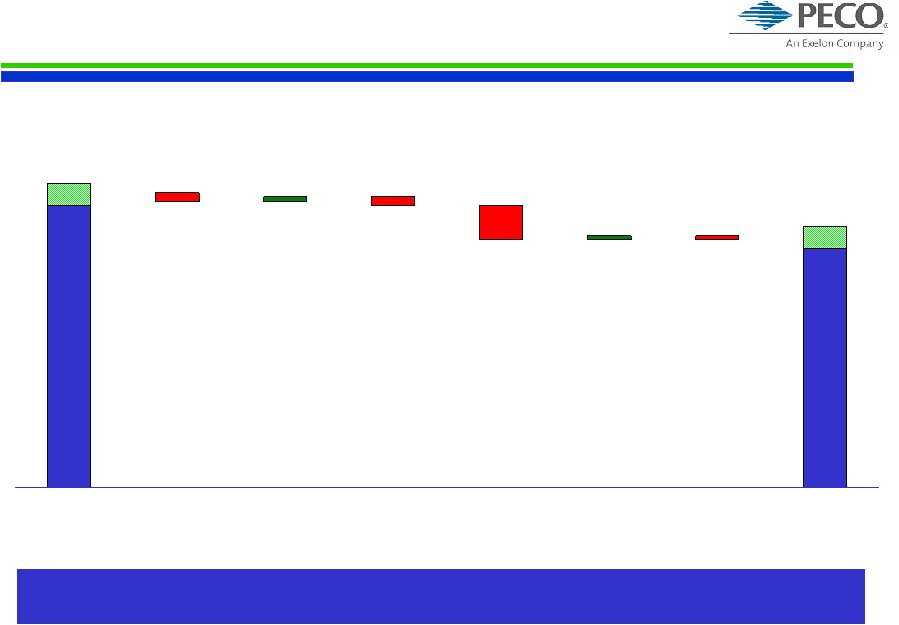 28 PECO 2008 EPS Contribution PECO’s operating earnings are expected to decrease in 2008 primarily due to increasing CTC amortization expense 2007 (1) 2008 (1) $0.65 - $0.70 $451M ($0.08) $0.01 ($0.02) ($0.01) $0.55 - $0.60 $360M - $400M RNF O&M CTC Amortization / Depreciation Other NOTE: Refer to “Key Assumptions” slide in Appendix. (1) Estimated contribution to Exelon’s operating earnings guidance. ($0.02) Weather $0.01 Interest Expense $435M - $470M $ / Share |
 29 Exelon Generation 2008 EPS Contribution Exelon Generation’s earnings are impacted primarily by increased number of refueling outages and nuclear fuel expense 2007 (1) 2008 (1) ($0.05) $(0.17) $0.05 $3.15 - $3.45 $2,060M - $2,260M RNF O&M Other Key Items: Inflation: ($0.07) Nuclear security: ($0.02) Add’l refueling outages: ($0.06) $50M +/- 500 Btu/KWh ATC Heat Rate $6M +/- $1/mmBtu Gas 2008 Market Sensitivities (After-Tax) Depreciation $(0.03) $3.45 - $3.55 $2,320M - $2,385M $ / Share NOTE: Refer to “Key Assumptions” slide in Appendix. (1) Estimated contribution to Exelon’s operating earnings guidance. Key Items: Market / portfolio: $0.08 Add’l refueling outages: ($0.10) Nuclear fuel expense: ($0.06) State Line buyout: ($0.02) |
 30 Projected 2008 Key Credit Measures 3.5x – 5.5x BBB 2.6x 2.6x FFO / Interest ComEd: 25% – 40% 11% 9% FFO / Debt 52% – 42% 57% 60% Rating Agency Debt Ratio Adjusted Book Debt Ratio: 44% 2.5x – 3.5x A 4.1x 4.1x FFO / Interest PECO: 12% – 20% 20% 17% FFO / Debt 62% – 52% 49% 52% Rating Agency Debt Ratio Adjusted Book Debt Ratio: 49% 52% – 42% 44% 60% Rating Agency Debt Ratio Adjusted Book Debt Ratio: 44% 25% – 40% 77% 43% FFO / Debt 3.5x – 5.5x BBB+ 13.9x 7.2x FFO / Interest Exelon Generation: 62% 29% 5.6x Without PPA & Pension / OPEB (2) 55% – 45% 69% Rating Agency Debt Ratio Adjusted Book Debt Ratio: 55% 20% – 30% 22% FFO / Debt 3.2x – 4.5x BBB 4.6x FFO / Interest Exelon Consolidated: “BBB” Target Range (4) S&P Credit Ratings (3) With PPA & Pension / OPEB (1) Notes: Projected credit measures reflect impact of Illinois electric rates and policy settlement. Exelon, ComEd and PECO metrics exclude securitization debt. See following slide for FFO (Funds from Operations)/Interest, FFO/Debt and Adjusted Book Debt Ratio reconciliations to GAAP. (1) Reflects S&P updated guidelines, which include imputed debt and interest related to purchased power agreements (PPA), unfunded pension and other postretirement benefits (OPEB) obligations, capital adequacy for energy trading, operating lease obligations, and other off-balance sheet debt. Debt is imputed for estimated pension and OPEB obligations by operating company. (2) Excludes items listed in note (1) above. (3) Current senior unsecured ratings for Exelon and Generation and senior secured ratings for ComEd and PECO as of 12/14/07. (4) Based on S&P Business Profiles: 7 for Exelon, 8 for Generation and ComEd, and 4 for PECO. |
 31 FFO Calculation and Ratios FFO Calculation = FFO - PECO Transition Bond Principal Paydown + Gain on Sale, Extraordinary Items and Other Non-Cash Items (3) + Change in Deferred Taxes + Depreciation, amortization (including nucl fuel amortization), AFUDC/Cap. Interest Add back non-cash items: Net Income Adjusted Interest FFO + Adjusted Interest = Adjusted Interest + 7% of Present Value (PV) of Operating Leases + Interest on imputed debt related to PV of Purchased Power Agreements (PPA), unfunded Pension and Other Postretirement Benefits (OPEB) obligations, and Capital Adequacy for Energy Trading (2) , as applicable - PECO Transition Bond Interest Expense Net Interest Expense (Before AFUDC & Cap. Interest) FFO Interest Coverage + Capital Adequacy for Energy Trading (2) FFO = Adjusted Debt + PV of Operating Leases + 100% of PV of Purchased Power Agreements (2) + Unfunded Pension and OPEB obligations (2) + A/R Financing Add off-balance sheet debt equivalents: - PECO Transition Bond Principal Balance + STD + LTD Debt: Adjusted Debt (1) FFO Debt Coverage Rating Agency Capitalization Rating Agency Debt Total Adjusted Capitalization Adjusted Book Debt = Total Rating Agency Capitalization + Off-balance sheet debt equivalents (2) - Goodwill Total Adjusted Capitalization = Rating Agency Debt + ComEd Transition Bond Principal Balance + Off-balance sheet debt equivalents (2) Adjusted Book Debt = Total Adjusted Capitalization + Adjusted Book Debt + Preferred Securities of Subsidiaries + Total Shareholders' Equity Capitalization: = Adjusted Book Debt - Transition Bond Principal Balance + STD + LTD Debt: Debt to Total Cap Note: Reflects S&P guidelines and company forecast. FFO and Debt related to non-recourse debt are excluded from the calculations. (1) Uses current year-end adjusted debt balance. (2) Metrics are calculated in presentation unadjusted and adjusted for debt equivalents and related interest for PPAs, unfunded Pension and OPEB obligations, and Capital Adequacy for Energy Trading. (3) Reflects depreciation adjustment for PPAs and decommissioning interest income and contributions. |