 Deutsche Bank Alternative Energy, Utilities and Power Conference William A. Von Hoene, Jr., EVP Finance & Legal May 12, 2011 Exhibit 99.1 |
 Cautionary Statements Regarding Forward-Looking Information 2 Except for the historical information contained herein, certain of the matters discussed in this communication constitute “forward-looking statements” within the meaning of the Securities Act of 1933 and the Securities Exchange Act of 1934, both as amended by the Private Securities Litigation Reform Act of 1995. Words such as “may,” “will,” “anticipate,” “estimate,” “expect,” “project,” “intend,” “plan,” “believe,” “target,” “forecast,” and words and terms of similar substance used in connection with any discussion of future plans, actions, or events identify forward-looking statements. These forward-looking statements include, but are not limited to, statements regarding benefits of the proposed merger, integration plans and expected synergies, the expected timing of completion of the transaction, anticipated future financial and operating performance and results, including estimates for growth. These statements are based on the current expectations of management of Exelon Corporation (Exelon) and Constellation Energy Group, Inc. (Constellation), as applicable. There are a number of risks and uncertainties that could cause actual results to differ materially from the forward-looking statements included in this communication. For example, (1) the companies may be unable to obtain shareholder approvals required for the merger; (2) the companies may be unable to obtain regulatory approvals required for the merger, or required regulatory approvals may delay the merger or result in the imposition of conditions that could have a material adverse effect on the combined company or cause the companies to abandon the merger; (3) conditions to the closing of the merger may not be satisfied; (4) an unsolicited offer of another company to acquire assets or capital stock of Exelon or Constellation could interfere with the merger; (5) problems may arise in successfully integrating the businesses of the companies, which may result in the combined company not operating as effectively and efficiently as expected; (6) the combined company may be unable to achieve cost-cutting synergies or it may take longer than expected to achieve those synergies; (7) the merger may involve unexpected costs, unexpected liabilities or unexpected delays, or the effects of purchase accounting may be different from the companies’ expectations; (8) the credit ratings of the combined company or its subsidiaries may be different from what the companies expect; (9) the businesses of the companies may suffer as a result of uncertainty surrounding the merger; |
 Cautionary Statements Regarding Forward-Looking Information (Continued) 3 (10) the companies may not realize the values expected to be obtained for properties expected or required to be divested; (11) the industry may be subject to future regulatory or legislative actions that could adversely affect the companies; and (12) the companies may be adversely affected by other economic, business, and/or competitive factors. Other unknown or unpredictable factors could also have material adverse effects on future results, performance or achievements of the combined company. Discussions of some of these other important factors and assumptions are contained in Exelon’s and Constellation’s respective filings with the Securities and Exchange Commission (SEC), and available at the SEC’s website at www.sec.gov, including: (1) Exelon’s 2010 Annual Report on Form 10-K in (a) ITEM 1A. Risk Factors, (b) ITEM 7. Management’s Discussion and Analysis of Financial Condition and Results of Operations and (c) ITEM 8. Financial Statements and Supplementary Data: Note 18; (2) Exelon’s Quarterly Report on Form 10-Q for the quarterly period ended March 31, 2011 in (a) Part II, Other Information, ITEM 1A. Risk Factors, (b) Part I, Financial Information, ITEM 2. Management’s Discussion and Analysis of Financial Condition and Results of Operations and (c) Part I, Financial Information, ITEM 1. Financial Statements: Note 12; (3) Constellation’s 2010 Annual Report on Form 10-K in (a) ITEM 1A. Risk Factors, (b) ITEM 7. Management’s Discussion and Analysis of Financial Condition and Results of Operations and (c) ITEM 8. Financial Statements and Supplementary Data: Note 12; and (4) Constellation’s Quarterly Report on Form 10-Q for the quarterly period ended March 31, 2011 in (a) Part II, Other Information, ITEM 5.Other Information, (b) Part I, Financial Information, ITEM 2. Management’s Discussion and Analysis of Financial Condition and Results of Operations and (c) Part I, Financial Information, ITEM 1. Financial Statements: Notes to Consolidated Financial Statements, Commitments and Contingencies. These risks, as well as other risks associated with the proposed merger, will be more fully discussed in the joint proxy statement/prospectus that will be included in the Registration Statement on Form S-4 that Exelon will file with the SEC in connection with the proposed merger. In light of these risks, uncertainties, assumptions and factors, the forward-looking events discussed in this communication may not occur. Readers are cautioned not to place undue reliance on these forward-looking statements, which speak only as of the date of this communication. Neither Exelon nor Constellation undertake any obligation to publicly release any revision to its forward- looking statements to reflect events or circumstances after the date of this communication. |
 Additional Information and Where to Find It 4 This communication does not constitute an offer to sell or the solicitation of an offer to buy any securities, or a solicitation of any vote or approval, nor shall there be any sale of securities in any jurisdiction in which such offer, solicitation or sale would be unlawful prior to registration or qualification under the securities laws of any such jurisdiction. Exelon intends to file with the SEC a registration statement on Form S-4 that will include a joint proxy statement/prospectus and other relevant documents to be mailed by Exelon and Constellation to their respective security holders in connection with the proposed merger of Exelon and Constellation. WE URGE INVESTORS AND SECURITY HOLDERS TO READ THE JOINT PROXY STATEMENT/PROSPECTUS AND ANY OTHER RELEVANT DOCUMENTS WHEN THEY BECOME AVAILABLE, BECAUSE THEY WILL CONTAIN IMPORTANT INFORMATION about Exelon, Constellation and the proposed merger. Investors and security holders will be able to obtain these materials (when they are available) and other documents filed with the SEC free of charge at the SEC's website, www.sec.gov. In addition, a copy of the joint proxy statement/prospectus (when it becomes available) may be obtained free of charge from Exelon Corporation, Investor Relations, 10 South Dearborn Street, P.O. Box 805398, Chicago, Illinois 60680-5398, or from Constellation Energy Group, Inc., Investor Relations, 100 Constellation Way, Suite 600C, Baltimore, MD 21202. Investors and security holders may also read and copy any reports, statements and other information filed by Exelon, or Constellation, with the SEC, at the SEC public reference room at 100 F Street, N.E., Washington, D.C. 20549. Please call the SEC at 1-800- SEC-0330 or visit the SEC’s website for further information on its public reference room. Participants in the Merger Solicitation Exelon, Constellation, and their respective directors, executive officers and certain other members of management and employees may be deemed to be participants in the solicitation of proxies in respect of the proposed transaction. Information regarding Exelon’s directors and executive officers is available in its proxy statement filed with the SEC by Exelon on March 24, 2011 in connection with its 2011 annual meeting of shareholders, and information regarding Constellation’s directors and executive officers is available in its proxy statement filed with the SEC by Constellation on April 15, 2011 in connection with its 2011 annual meeting of shareholders. Other information regarding the participants in the proxy solicitation and a description of their direct and indirect interests, by security holdings or otherwise, will be contained in the joint proxy statement/prospectus and other relevant materials to be filed with the SEC when they become available. |
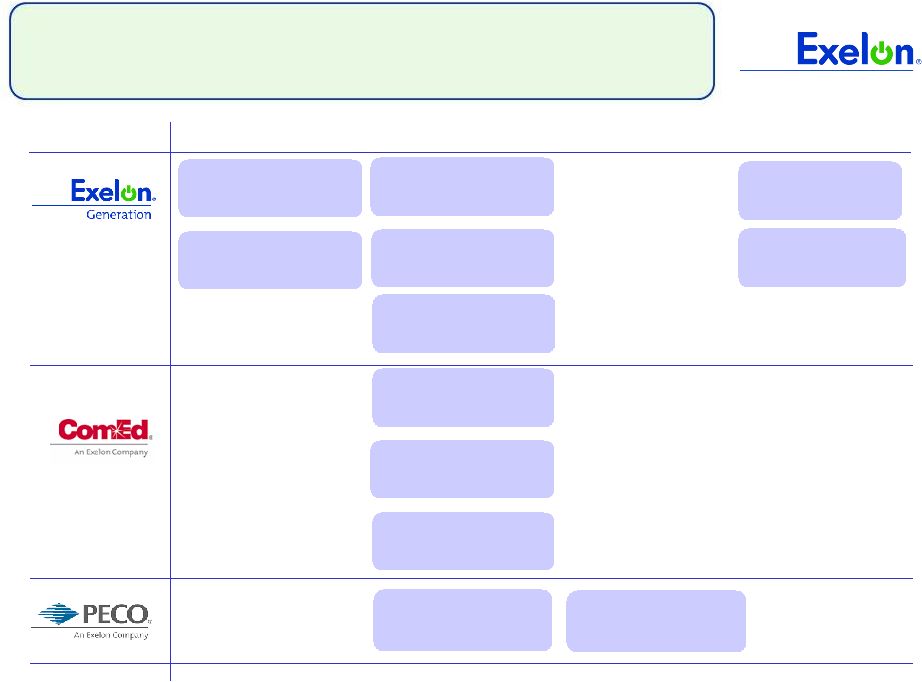
 Transaction Overview 100% stock – 0.930 shares of EXC for each share of CEG Upfront transaction premium of 18.1% (1) $2.10 per share Exelon dividend maintained Expect to close in early 1Q 2012 Exelon and Constellation shareholder approvals in 3Q 2011 Regulatory approvals including FERC, DOJ, MD, NY, TX Executive Chairman: Mayo Shattuck President and CEO: Chris Crane Board of Directors: 16 total (12 from Exelon, 4 from Constellation) Exelon Corporation 78% Exelon shareholders 22% Constellation shareholders Corporate headquarters: Chicago, IL Constellation headquarters: Baltimore, MD No change to utilities’ headquarters Significant employee presence maintained in IL, PA and MD Company Name Consideration Pro Forma Ownership Headquarters Governance Approvals & Timing (1) Based on the 30-day average Exelon and Constellation closing stock prices as of April 27, 2011. 5 |
 Creating Value Through a Strategic Merger Delivers financial benefits to both sets of shareholders Increases scale and scope of the business across the value chain Matches the industry’s premier clean merchant generating fleet with the leading retail and wholesale customer platform Diversifies the generation portfolio Continued upside to power market recovery Maintains a strong regulated earnings profile with large urban utilities 6 Combining Exelon’s generation fleet and Constellation’s customer-facing businesses creates a strong platform for growth and delivers benefits to investors and customers |
 Exelon Transaction Rationale Increases geographic diversity of generation, load and customers in competitive markets Shared Commitment to Competitive Markets Enhances Scalable Growth Platform Creates Shareholder Value Expands a valuable channel to market our generation Enhances margins in the competitive portfolio Diversifies portfolio across the value chain EPS break-even in 2012 and accretive by +5% in 2013 Maintains strong credit profile and financial discipline Maintains earnings upside to future environmental regulations and power market recovery Adds stability to earnings and cash flow Adds mix of clean generation to the portfolio Clean Generation Fleet This transaction meets all of our M&A criteria and can be executed 7 |
 This Combination Is Good for Maryland Maintains employee presence and platform for growth in Maryland – Exelon’s Power Team will be combined with Constellation’s wholesale and retail business under the Constellation brand and will be headquartered in Baltimore – Constellation and Exelon’s renewable energy business headquartered in Baltimore – BGE maintains independent operations headquartered in Baltimore – No involuntary merger-related job reductions at BGE for two years after close Supports Maryland’s economic development and clean energy infrastructure – $10 million to spur development of electric vehicle infrastructure – $4 million to support EmPower Maryland Energy Efficiency Act – 25 MWs of renewable energy development in Maryland – Charitable contributions maintained for at least 10 years Provides direct benefits to BGE customers – $5 million provided for Maryland’s Electric Universal Service Program (EUSP) – Over $110 million to BGE residential customers from $100 one-time rate credit 8 We will bring direct benefits to the State of Maryland, the City of Baltimore and BGE customers. Total investment in excess of $250 million. |
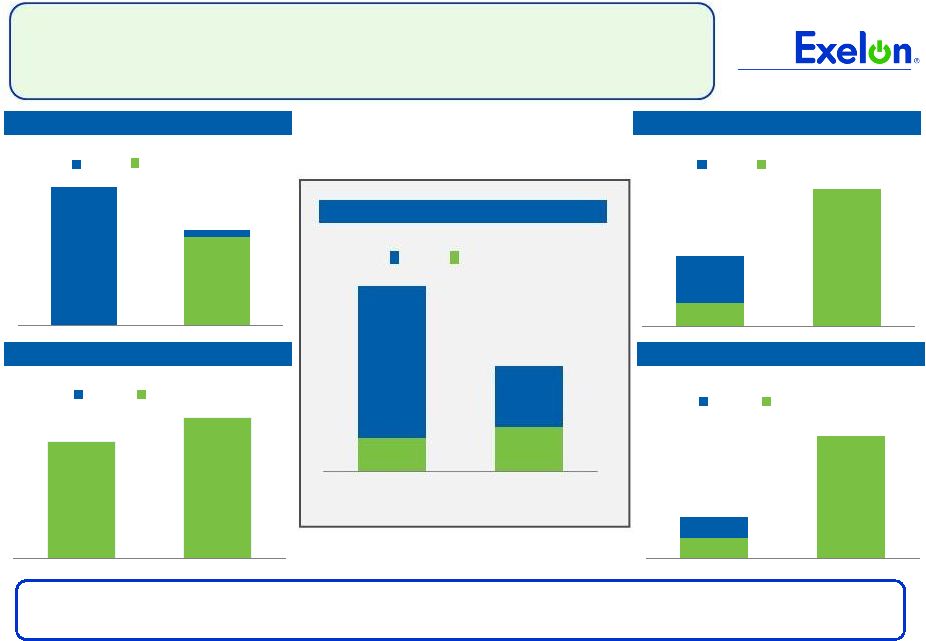 5.8 0.5 9.1 Exelon Constellation 23.2 27.8 MISO (TWh) South (1) (TWh) ISO-NE & NY ISO (2) (TWh) West (TWh) Load Generation Exelon Constellation 4.8 27.1 9.1 Exelon Constellation Exelon Constellation 2.4 0.4 0.4 Exelon Constellation Load Generation Generation Load Load Generation Load Generation 6.3 9.1 101.5 179.1 27.8 23.2 27.1 13.9 2.4 0.8 Portfolio Matches Generation with Load in Key Competitive Markets (1) Represents load and generation in ERCOT, SERC and SPP. (2) Constellation load includes ~0.7TWh of load served in Ontario Note: Data for Exelon and Constellation represents expected generation and load for 2011 as of 12/31/10. Exelon load includes ComEd Swap, load sold through affiliates, fixed and indexed load sales and load sold through POLR auctions. Constellation load includes load sold through affiliates, fixed and indexed load sales and load sold through POLR auctions. The combination establishes an industry-leading platform with regional diversification of the generation fleet 9 147.3 31.8 42.8 58.7 PJM (TWh) |
 Transaction Economics Are Attractive for Both Companies EPS break-even in 2012 and accretive by +5% in 2013 Free cash flow accretive beginning in 2012 Run-rate synergies of ~$260 million – Total costs to achieve of ~$500 million – Synergies primarily from corporate consolidation and power marketing platform integration Lower consolidated liquidity requirements, resulting in cost savings Investment-grade ratings and credit metrics 10 |
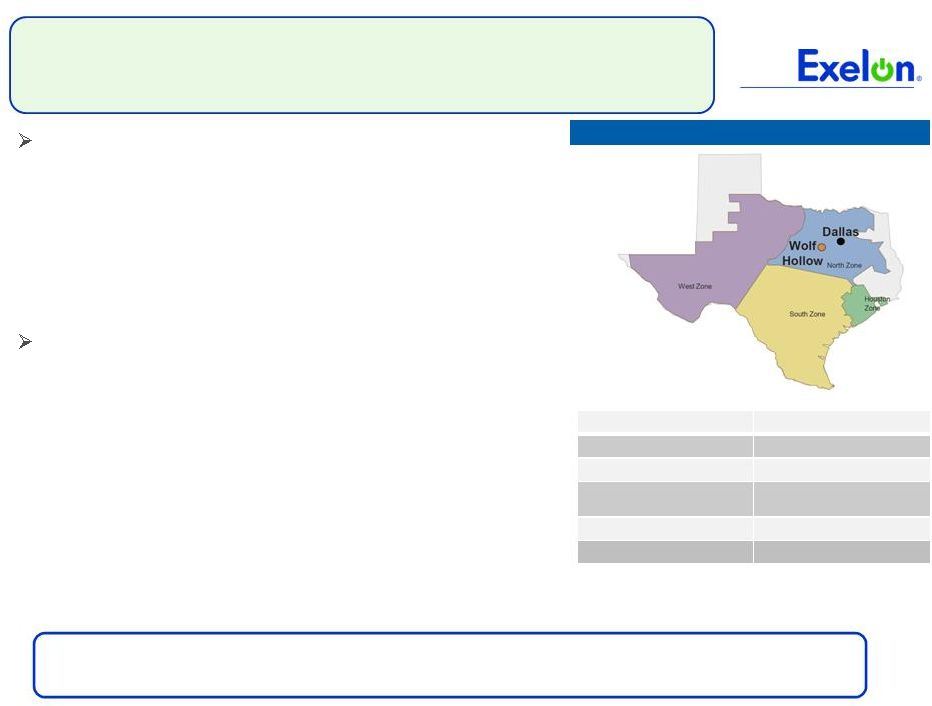 Wolf Hollow Acquisition 11 Wolf Hollow Overview Diversifies generation portfolio • Expands geographic and fuel characteristics of fleet • Advances Exelon and Constellation merger strategy of matching load with generation in key competitive markets Creates value for shareholders • Purchase price compares favorably to cost of new build • Free cash flow accretive beginning in 2012; earnings and credit neutral • Eliminates current above market purchase power agreement (PPA) with Wolf Hollow • Enhances opportunity to benefit from future market heat rate expansion in ERCOT Transaction expected to close in Q3 2011 Location Granbury, Texas Commercial Operation Date August 2003 Nominal Net Operating Capacity 720MW Equipment Technology 2 Mitsubishi combined-cycle gas turbines Primary Fuel Natural Gas Secondary Fuel None ERCOT = Electric Reliability Council of Texas |
 12 Appendix |
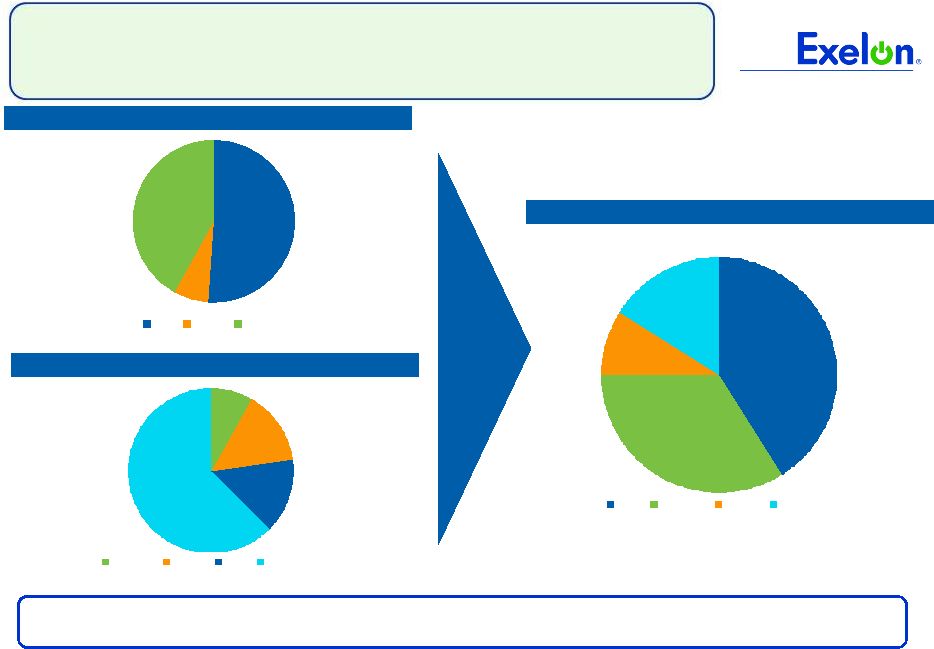
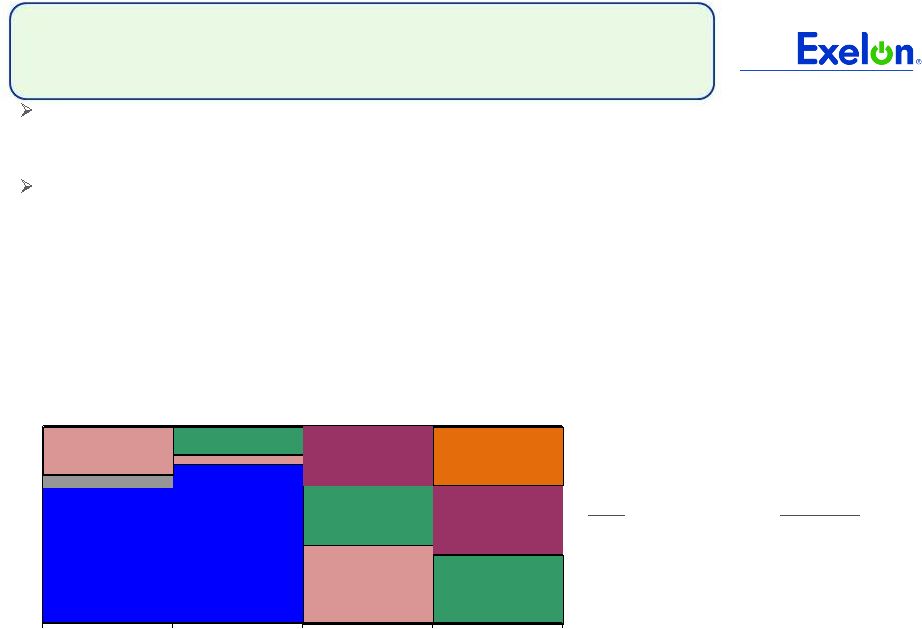
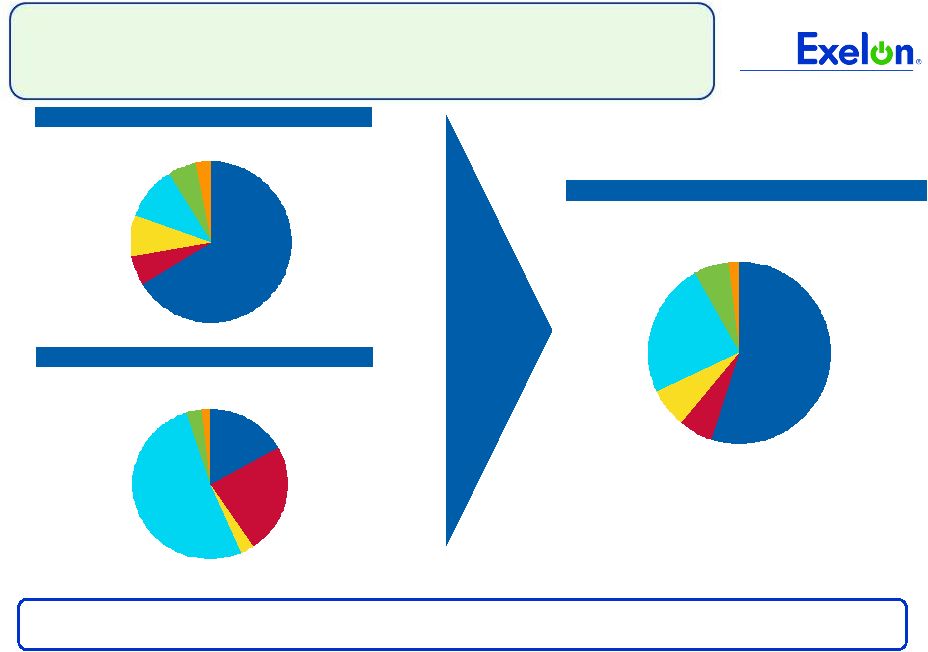 Coal 6% Oil 8% Gas 11% Hydro 6% Wind/Solar/Other 3% Nuclear 67% A Clean Generation Profile Creates Long-Term Value in Competitive Markets (1) Net of market mitigation assumed to be 2,648 MW. (2) Constellation generation includes Boston Generation acquisition (2,950 MW of natural gas) and excludes Quail Run (~550 MW of natural gas). Constellation nuclear reflects 50.01% interest in Constellation Energy Nuclear Group LLC. Exelon Standalone Total Generation: 25,619 MW Constellation Standalone (2) Total Generation: 11,430 MW Pro forma Company (Net of Mitigation) (1) Total Generation: 34,401 MW Coal 24% Nuclear 17% Gas 52% Wind/Solar/Other 2% Hydro 3% Oil 3% Nuclear 55% Coal 6% Oil 7% Gas 24% Hydro 6% Wind/Solar/ Other 2% 13 Combined company remains premier low-cost generator |
 16% 34% 41% 9% RTO EMAAC MAAC SWMAAC 8% 15% 15% 63% EMAAC MAAC RTO SWMAAC 42% 7% 51% RTO MAAC EMAAC Increased Regional Diversity in PJM: Capacity Eligible for 2014/15 RPM Auction (1) Pro forma Company 4,390 MW 2,535 MW 9,230 MW 11,345 MW Exelon Standalone Constellation Standalone 8,700 MW 10,300 MW 1,500 MW 1,035 MW 4,390 MW 1,045 MW 530 MW 14 2014/15 RPM auction results will be announced on May 13 , 2011 th (1) All generation values are approximate and not inclusive of wholesale transactions; all capacity values are in installed capacity terms (summer ratings) located in the areas and adjusted for mid-year PPA roll-offs. |
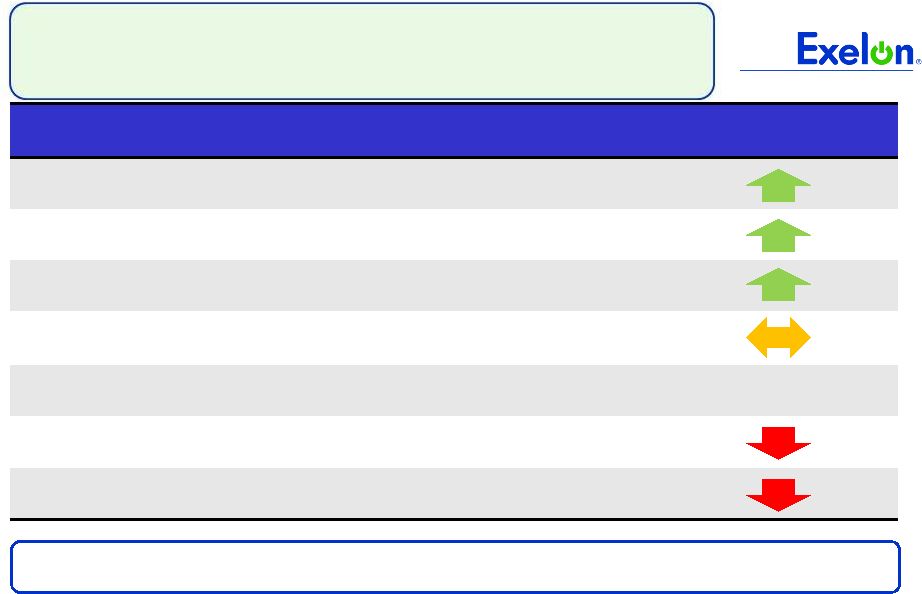 15 Factors Influencing PJM RPM Capacity Auction (Comparison of PY 14/15 and PY 13/14 Price Drivers) Exelon Price Impact Cost of Environmental Upgrades (1) Higher Net CONE (2) Higher Net ACRs for Coal Units (3) Import Transmission Limits and Objectives (muted impact on portfolio revenues due to regional diversification) NJ CCGT Proposal / PJM Minimum Offer Price Rules Peak Load (4) Demand Response Growth 2014/15 PJM Capacity Auction: Expected Changes Since Planning Year 2013/14 Expect overall results to be similar to last year’s auction N/A (1) We expect generators to reflect cost of capital expenditures into their cost based offers at the upcoming auction. (2) Cost of new entry (CONE) increased by 7.6% (for RTO) and 5.3% to 6.5% (within Locational Deliverability Areas (LDAs)). (3) Replacing 2007 net revenues with significantly lower 2010 revenues in the Net ACR (avoidable cost rate) calculations for coal generators may increase offer caps for certain coal generators in the next auction. However, some coal units may not be affected due to high net revenues compared to avoidable costs. (4) Peak load reduced by approx. 1% in RTO (excluding the impact from Duke Ohio integration). Note: RPM = Reliability Pricing Model; CCGT = combined cycle gas turbine |
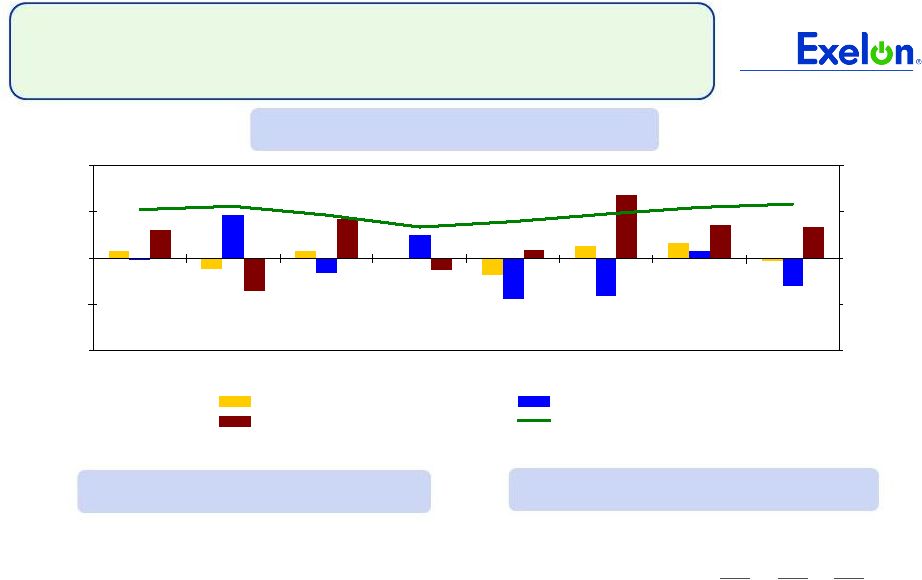
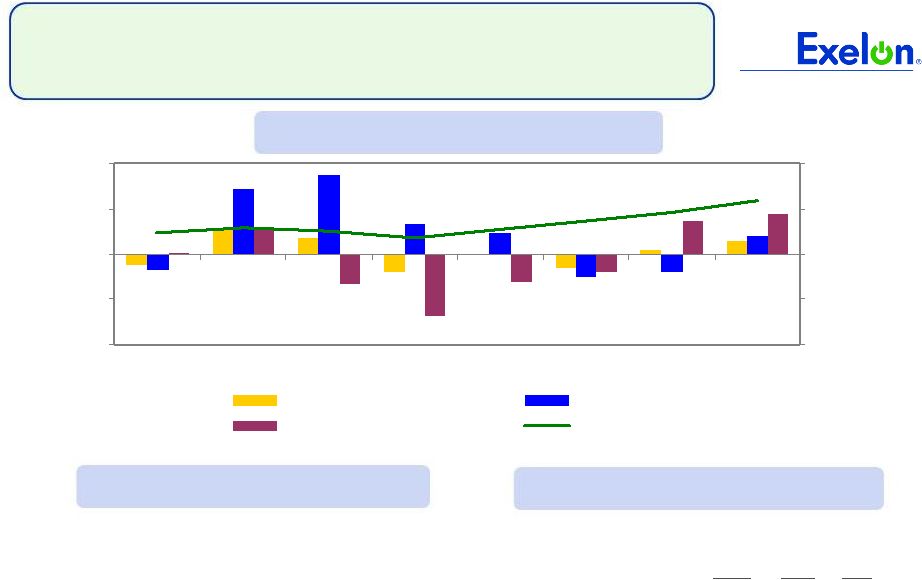 16 16 16 ComEd Load Trends Chicago U.S. Unemployment rate (1) 8.5% 8.8% 2011 annualized growth in gross domestic/metro product (2) 2.5% 3.2% Note: C&I = Commercial & Industrial Weather-Normalized Load Year-over-Year Key Economic Indicators Weather-Normalized Load 2010 1Q11 2011E Average Customer Growth 0.2% 0.4% 0.5% Average Use-Per-Customer (1.4)% (2.2)% 0.1% Total Residential (1.2)% (1.8)% 0.5% Small C&I (0.6)% 0.6% (0.3)% Large C&I 2.6% 1.4% (0.1)% All Customer Classes 0.2% (0.1)% 0.0% (1) Source: U.S. Dept. of Labor (March 2011) and Illinois Department of Security (March 2011) (2) Source: Global Insight February 2011 -6.0% -3.0% 0.0% 3.0% 6.0% 1Q10 2Q10 3Q10 4Q10 1Q11 2Q11 3Q11 4Q11 -6.0% -3.0% 0.0% 3.0% 6.0% All Customer Classes Large C&I Residential Gross Metro Product |
 17 17 17 ComEd 2010 Rate Case Update ComEd Reply Brief (2/23/11) $343M increase requested 11.50% ROE / 47.28% equity ratio Rate base $7,349M 2009 test year with pro forma plant additions through 6/30/11 ICC Staff Reply Brief Position (2/23/11) $113M increase proposed 10.00% ROE / 47.11% equity ratio Rate base $6,480M Pro forma plant additions and depreciation reserve through 12/31/10 ALJ Proposed Order (4/1/11) $152M increase proposed (after correcting ~$14M calculation error) 10.50% ROE / 47.28% equity ratio Rate base $6,629M Pro forma plant additions and depreciation reserve through 12/31/10 with very limited exceptions (ICC Docket No. 10-0467) Illinois Commerce Commission Final Order will be issued by May 31 |
 Illinois Power Agency (IPA) RFP Procurement Note: Chart is for illustrative purposes only. REC = Renewable Energy Credit; RFP = request for proposal June 2011 June 2012 June 2013 June 2014 Financial Swap Agreement with ExGen (ATC baseload energy only – notional quantity 3,000 MW) Term Fixed Price 1/1/11-12/31/11 $51.26/MWh 1/1/12-12/31/12 $52.37 1/1/13-5/31/13 $53.48 18 Financial Swap 2010 RFP 2011 RFP 2011 RFP 2011 RFP 2012 RFP 2012 RFP 2012 RFP 2013 RFP 2013 RFP 2014 RFP ICC has approved Long Term REC Procurement held in November 2010 – 1.26 Million MWh of renewable resources annually beginning in June 2012 under 20 year contract – 8 winning suppliers with an average 2012-13 plan-year price of $55.18/MWh Spring 2011 Procurement Plan – IPA Procurement Plan approved by the ICC • Standard Product bids due 5/16; ICC decision on 5/20 • Annual REC bids due 5/18; ICC decision on 5/24 – Provisions included: • Annual energy procurements over a three-year time frame • Target a 35%/35%/30% laddered procurement approach • No additional Energy Efficiency, Demand Response purchases • No additional long term contracts for renewables • No 10% overprocurement for summer peak energy June 2015 |
 19 PECO Load Trends Philadelphia U.S. Unemployment rate (1) 8.4% 8.8% 2010 annualized growth in gross domestic/metro product (2) 3.0% 3.2% Note: C&I = Commercial & Industrial Weather-Normalized Load Year-over-Year Key Economic Indicators Weather-Normalized Load 2010 1Q11 2011E Average Customer Growth 0.3% 0.4% 0.4% Average Use-Per-Customer 0.3% 0.2% 1.7% Total Residential 0.5% 0.5% 2.1% Small C&I (1.9)% (1.1)% 0.1% Large C&I 0.8% (2.7)% (1.6)% All Customer Classes 0.1% (1.1)% 0.1% (1) Source: U.S Dept. of Labor data March 2011 -US U.S Dept. of Labor prelim. data February 2011 - Philadelphia (2) Source: Global Insight February 2011 -6.0% -3.0% 0.0% 3.0% 6.0% 1Q10 2Q10 3Q10 4Q10 1Q11 2Q11 3Q11 4Q11 -6.0% -3.0% 0.0% 3.0% 6.0% All Customer Classes Large C&I Residential Gross Metro Product |
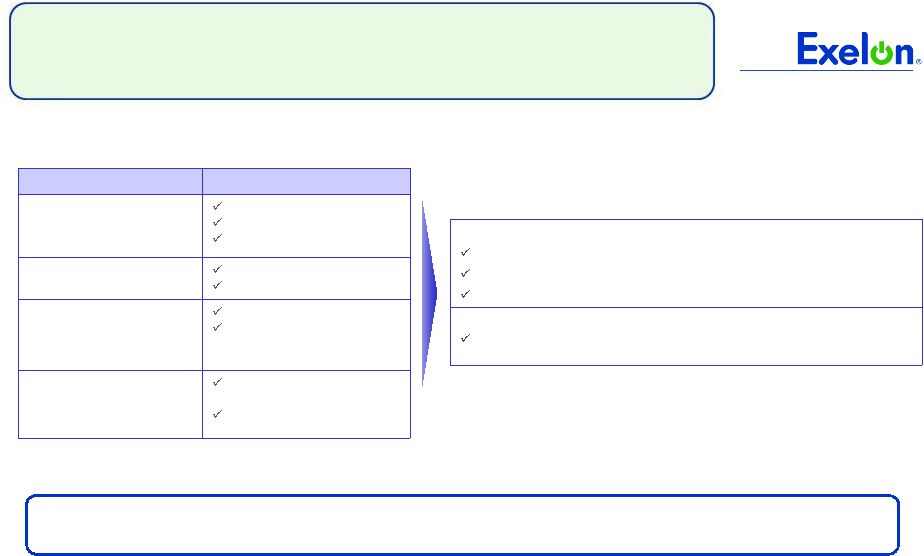 20 PECO Procurement Plan (1) See PECO Procurement website (http://www.pecoprocurement.com) for additional details regarding PECO’s procurement plan and RFP results. (2) For Large C&I customers who previously opted to participate in the 2011 fixed-priced full requirements product. (3) Large C&I tranches which were not fully subscribed in the fall 2010 procurement Customer Class Products Residential 75% full requirements 20% block energy 5% energy only spot Small Commercial (peak demand <100 kW) 90% full requirements 10% full requirements spot Medium Commercial (peak demand >100 kW but <= 500 kW) 85% full requirements 15% full requirements spot Large Commercial & Industrial (peak demand > 500 kW) Fixed-Priced Full requirements (2) Hourly Full requirements PECO Procurement Plan (1) Residential 80 MW of baseload (24x7) block energy product (for Jan-Dec 2012) 70 MW of Jun-Aug 2011 summer on-peak block energy product 40 MW of Dec 2011-Feb 2012 winter on-peak block energy product Large Commercial and Industrial - Hourly 36% of Hourly Full requirements product (Jun 2011-May 2012) (3) May 2, 2011 RFP - Fifth in a series of nine procurements for the PUC- approved Default Service Plan Spring 2011 RFP was held on May 2, 2011, with results public 15 days thereafter |
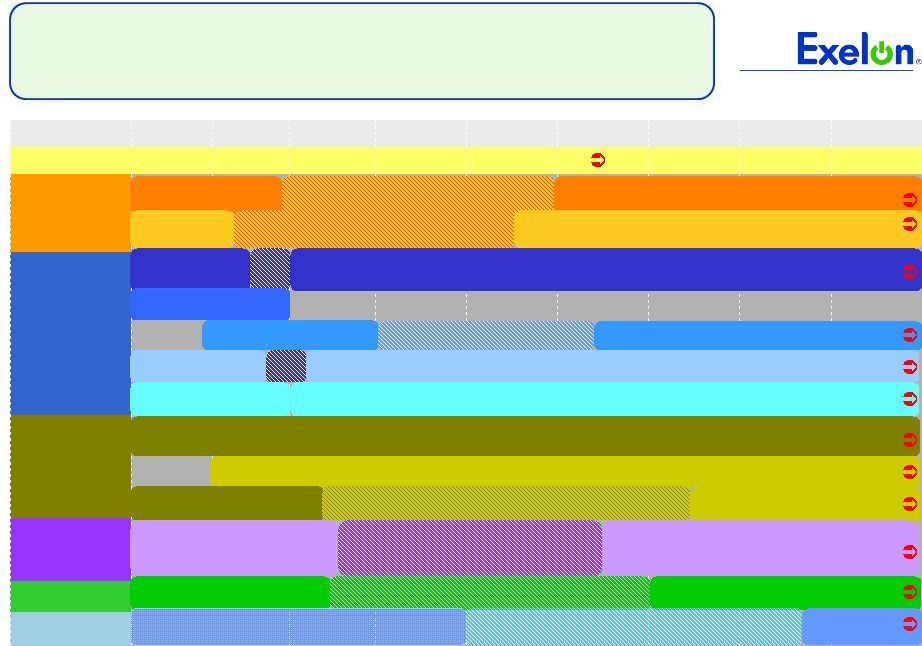 21 21 EPA Regulations Will Move Forward in 2011 2010 2011 2012 2013 2014 2015 2016 2017 2018 PJM RPM Auction 14/15 15/16 16/17 17/18 Hazardous Air Pollutants Criteria Pollutants Greenhouse Gases Coal Combustion By-Products Cooling Water Effluents Develop Toxics Rule Develop ICI MACT Pre Compliance Period Compliance With Toxics Rule Pre Compliance Period Compliance With ICI MACT Develop Transport Rule Compliance With Transport Rule Interim CAIR Develop O3 Transport Rule (TR 2) Estimated Compliance Develop Criteria NSPS revision Compliance with Revised Criteria NSPS Develop Revised NAAQS SIP provisions developed in response to revised NAAQS (e.g., Ozone, PM2.5, SO2, NO2, NOx/SOx, CO) Compliance with Federal GHG Reporting Rule PSD/BACT and Title V Apply to GHG Emissions (PSD only for new and modified sources) Develop GHG NSPS Pre Compliance Period Compliance With GHG NSPS Develop Coal Combustion By-Products Rule Pre Compliance Period Compliance With Federal CCB Regulations Develop 316(b) Regulations Pre Compliance Period Phase In Of Compliance Develop Effluent Regulations Pre Compliance Period Phase In Of Compliance Notes: RPM auctions take place annually in May. For definition of the EPA regulations referred to on this slide, please see the EPA’s Terms of Environment (http://www.epa.gov/OCEPAterms/). |
 22 2011 Events of Interest Q1 Q2 Q3 Q4 RPM Auction results (5/13) Illinois Power Agency RFP (5/16) ALJ Proposed Order – DST Rate Case (4/1) Procurement RFP (bids accepted 5/2; results by 5/17) DST Rate Case Final Order (by 5/31) EPA Final Toxics Rule (November) Retirement of Cromby 1 & Eddystone 1 units (5/31) Proposed Toxics Rule (3/16) Procurement RFP (bids due 9/19; results by 10/19) Retirement of Cromby 2 unit (12/31) Proposed 316(b) EPA Regulation (3/28) For definition of the EPA regulations referred to on this slide, please see the EPA’s Terms of Environment (http://www.epa.gov/OCEPAterms/). EPA Final Transport Rule (June) |
 23 Exelon Generation Hedging Disclosures (as of March 31, 2011) |
 24 24 Important Information The following slides are intended to provide additional information regarding the hedging program at Exelon Generation and to serve as an aid for the purposes of modeling Exelon Generation’s gross margin (operating revenues less purchased power and fuel expense). The information on the following slides is not intended to represent earnings guidance or a forecast of future events. In fact, many of the factors that ultimately will determine Exelon Generation’s actual gross margin are based upon highly variable market factors outside of our control. The information on the following slides is as of March 31, 2011. We update this information on a quarterly basis. Certain information on the following slides is based upon an internal simulation model that incorporates assumptions regarding future market conditions, including power and commodity prices, heat rates, and demand conditions, in addition to operating performance and dispatch characteristics of our generating fleet. Our simulation model and the assumptions therein are subject to change. For example, actual market conditions and the dispatch profile of our generation fleet in future periods will likely differ – and may differ significantly – from the assumptions underlying the simulation results included in the slides. In addition, the forward- looking information included in the following slides will likely change over time due to continued refinement of our simulation model and changes in our views on future market conditions. |
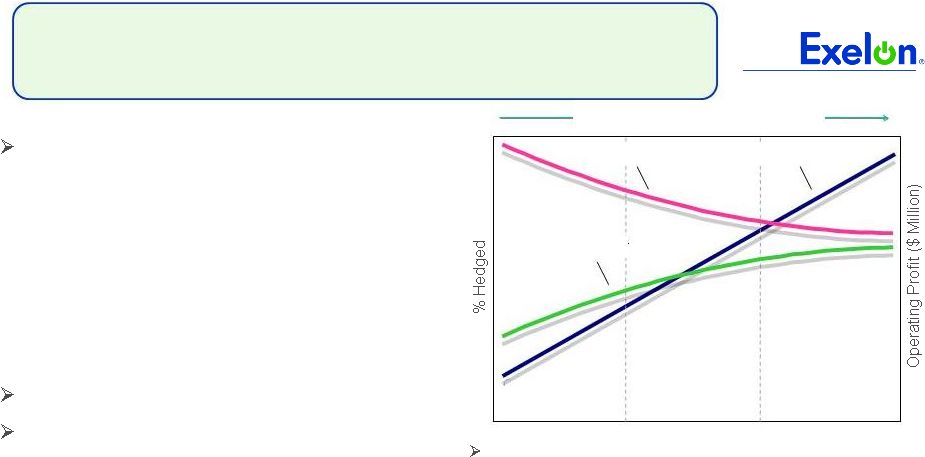 25 25 Portfolio Management Objective Align Hedging Activities with Financial Commitments Power Team utilizes several product types and channels to market • Wholesale and retail sales • Block products • Load-following products and load auctions • Put/call options Exelon’s hedging program is designed to protect the long-term value of our generating fleet and maintain an investment-grade balance sheet • Hedge enough commodity risk to meet future cash requirements if prices drop • Consider: financing policy (credit rating objectives, capital structure, liquidity); spending (capital and O&M); shareholder value return policy Consider market, credit, operational risk Approach to managing volatility • Increase hedging as delivery approaches • Have enough supply to meet peak load • Purchase fossil fuels as power is sold • Choose hedging products based on generation portfolio – sell what we own • Heat rate options • Fuel products • Capacity • Renewable credits % Hedged High End of Profit Low End of Profit Open Generation with LT Contracts Portfolio Optimization Portfolio Management Portfolio Management Over Time |
 26 26 Percentage of Expected Generation Hedged • How many equivalent MW have been hedged at forward market prices; all hedge products used are converted to an equivalent average MW volume • Takes ALL hedges into account whether they are power sales or financial products Equivalent MWs Sold Expected Generation = Our normal practice is to hedge commodity risk on a ratable basis over the three years leading to the spot market • Carry operational length into spot market to manage forced outage and load-following risks • By using the appropriate product mix, expected generation hedged approaches the mid-90s percentile as the delivery period approaches • Participation in larger procurement events, such as utility auctions, and some flexibility in the timing of hedging may mean the hedge program is not strictly ratable from quarter to quarter Exelon Generation Hedging Program |
 27 27 2011 2012 2013 Estimated Open Gross Margin ($ millions) (1)(2) $5,250 $4,900 $5,500 Open gross margin assumes all expected generation is sold at the Reference Prices listed below Reference Prices (1) Henry Hub Natural Gas ($/MMBtu) NI-Hub ATC Energy Price ($/MWh) PJM-W ATC Energy Price ($/MWh) ERCOT North ATC Spark Spread ($/MWh) (3) $4.47 $31.32 $44.23 $4.42 $5.06 $31.32 $46.19 $1.88 $5.41 $32.83 $48.10 $2.06 Exelon Generation Open Gross Margin and Reference Prices (1) Based on March 31, 2011 market conditions. (2) Gross margin is defined as operating revenues less fuel expense and purchased power expense, excluding the impact of decommissioning and other incidental revenues. Open gross margin is estimated based upon an internal model that is developed by dispatching our expected generation to current market power and fossil fuel prices. Open gross margin assumes there is no hedging in place other than fixed assumptions for capacity cleared in the RPM auctions and uranium costs for nuclear power plants. Open gross margin contains assumptions for other gross margin line items such as various ISO bill and ancillary revenues and costs and PPA capacity revenues and payments. The estimation of open gross margin incorporates management discretion and modeling assumptions that are subject to change. (3) ERCOT North ATC spark spread using Houston Ship Channel Gas, 7,200 heat rate, $2.50 variable O&M. |
 28 28 2011 2012 2013 Expected Generation (GWh) (1) 165,800 165,400 162,800 Midwest 99,000 97,800 96,100 Mid-Atlantic 56,300 57,200 56,400 South & West 10,500 10,400 10,300 Percentage of Expected Generation Hedged (2) 93-96% 73-76% 38-41% Midwest 93-96 75-78 35-38 Mid-Atlantic 94-97 72-75 42-45 South & West 76-79 59-62 40-43 Effective Realized Energy Price ($/MWh) (3) Midwest $43.00 $41.00 $41.00 Mid-Atlantic $56.50 $50.50 $50.50 South & West $4.50 $0.00 ($3.00) Generation Profile (1) Expected generation represents the amount of energy estimated to be generated or purchased through owned or contracted for capacity. Expected generation is based upon a simulated dispatch model that makes assumptions regarding future market conditions, which are calibrated to market quotes for power, fuel, load following products, and options. Expected generation assumes 12 refueling outages in 2011 and 10 refueling outages in 2012 and 2013 at Exelon-operated nuclear plants and Salem. Expected generation assumes capacity factors of 93.0%, 93.6% and 93.1% in 2011, 2012 and 2013 at Exelon-operated nuclear plants. These estimates of expected generation in 2012 and 2013 do not represent guidance or a forecast of future results as Exelon has not completed its planning or optimization processes for those years. (2) Percent of expected generation hedged is the amount of equivalent sales divided by the expected generation. Includes all hedging products, such as wholesale and retail sales of power, options, and swaps. Uses expected value on options. Reflects decision to permanently retire Cromby Station and Eddystone Units 1&2 as of May 31, 2011. (3) Effective realized energy price is representative of an all-in hedged price, on a per MWh basis, at which expected generation has been hedged. It is developed by considering the energy revenues and costs associated with our hedges and by considering the fossil fuel that has been purchased to lock in margin. It excludes uranium costs and RPM capacity revenue, but includes the mark-to-market value of capacity contracted at prices other than RPM clearing prices including our load obligations. It can be compared with the reference prices used to calculate open gross margin in order to determine the mark-to-market value of Exelon Generation's energy hedges. |
 29 29 Gross Margin Sensitivities with Existing Hedges ($ millions) (1) Henry Hub Natural Gas + $1/MMBtu - $1/MMBtu NI-Hub ATC Energy Price +$5/MWH -$5/MWH PJM-W ATC Energy Price +$5/MWH -$5/MWH Nuclear Capacity Factor +1% / -1% 2011 $5 $(5) $15 $(10) $10 $(10) +/- $30 2012 $145 $(65) $145 $(125) $90 $(90) +/- $45 2013 $425 $(380) $315 $(310) $180 $(175) +/- $45 Exelon Generation Gross Margin Sensitivities (with Existing Hedges) (1) Based on March 31, 2011 market conditions and hedged position. Gas price sensitivities are based on an assumed gas-power relationship derived from an internal model that is updated periodically. Power prices sensitivities are derived by adjusting the power price assumption while keeping all other prices inputs constant. Due to correlation of the various assumptions, the hedged gross margin impact calculated by aggregating individual sensitivities may not be equal to the hedged gross margin impact calculated when correlations between the various assumptions are also considered. |
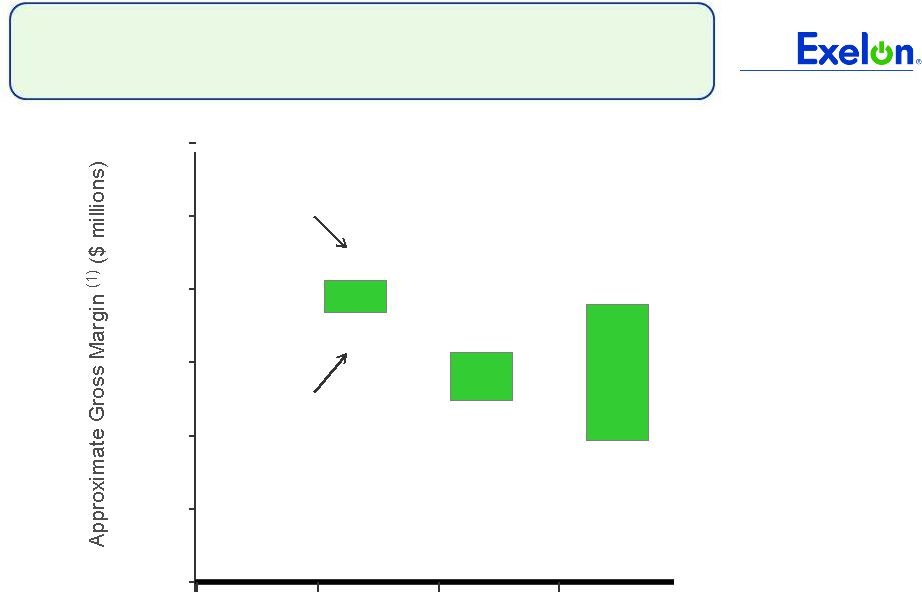 30 30 95% case 5% case $5,500 $7,100 $6,800 $6,200 Exelon Generation Gross Margin Upside / Risk (with Existing Hedges) $3,000 $4,000 $5,000 $6,000 $7,000 $8,000 $9,000 2011 2012 2013 $6,900 $4,900 (1) Represents an approximate range of expected gross margin, taking into account hedges in place, between the 5th and 95th percent confidence levels assuming all unhedged supply is sold into the spot market. Approximate gross margin ranges are based upon an internal simulation model and are subject to change based upon market inputs, future transactions and potential modeling changes. These ranges of approximate gross margin in 2012 and 2013 do not represent earnings guidance or a forecast of future results as Exelon has not completed its planning or optimization processes for those years. The price distributions that generate this range are calibrated to market quotes for power, fuel, load following products, and options as of March 31, 2011. |
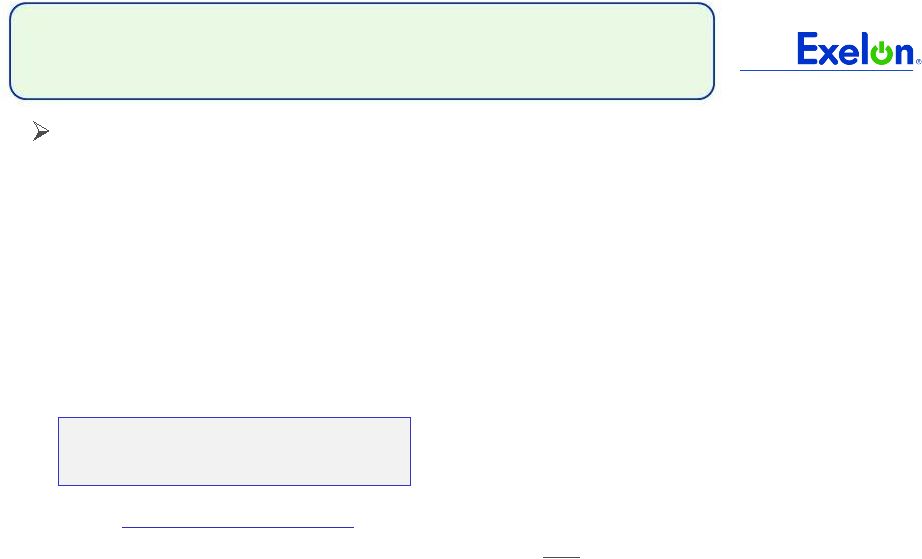
 31 31 Midwest Mid-Atlantic South & West Step 1 Start with fleetwide open gross margin $5.25 billion Step 2 Determine the mark-to-market value of energy hedges 99,000GWh * 94% * ($43.00/MWh-$31.32MWh) = $1.09 billion 56,300GWh * 95% * ($56.50/MWh-$44.23MWh) = $0.66 billion 10,500GWh * 77% * ($4.50/MWh-$4.42/MWh) = $0.00 billion Step 3 Estimate hedged gross margin by adding open gross margin to mark-to- market value of energy hedges Open gross margin: MTM value of energy hedges: Estimated hedged gross margin: Illustrative Example of Modeling Exelon Generation 2011 Gross Margin (with Existing Hedges) $5.25 billion $1.09billion + $0.66billion + $0.00 billion $7.00 billion |
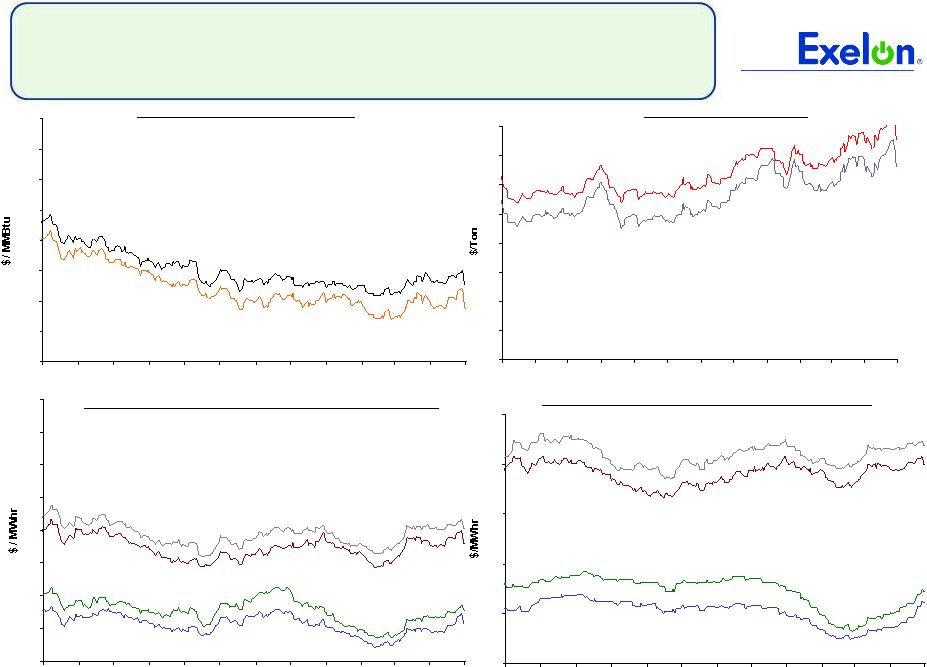 32 35 40 45 50 55 60 65 70 75 5/10 6/10 7/10 8/10 9/10 10/10 11/10 12/10 1/11 2/11 3/11 4/11 5/11 4.0 4.5 5.0 5.5 6.0 6.5 7.0 7.5 8.0 5/10 6/10 7/10 8/10 9/10 10/10 11/10 12/10 1/11 2/11 3/11 4/11 5/11 32 32 20 25 30 35 40 45 5/10 6/10 7/10 8/10 9/10 10/10 11/10 12/10 1/11 2/11 3/11 4/11 5/11 50 55 60 65 70 75 80 85 90 5/10 6/10 7/10 8/10 9/10 10/10 11/10 12/10 1/11 2/11 3/11 4/11 5/11 Market Price Snapshot Forward NYMEX Natural Gas PJM-West and Ni-Hub On-Peak Forward Prices PJM-West and Ni-Hub Wrap Forward Prices 2012 $5.21 2013 $5.49 Rolling 12 months, as of May 6th 2011. Source: OTC quotes and electronic trading system. Quotes are daily. Forward NYMEX Coal 2012 $78.21 2013 $82.04 2012 Ni-Hub $40.60 2013 Ni-Hub $42.66 2013 PJM-West $54.37 2012 PJM-West $52.35 2012 Ni-Hub $25.18 2013 Ni-Hub $27.24 2013 PJM-West $40.97 2012 PJM-West $39.03 |
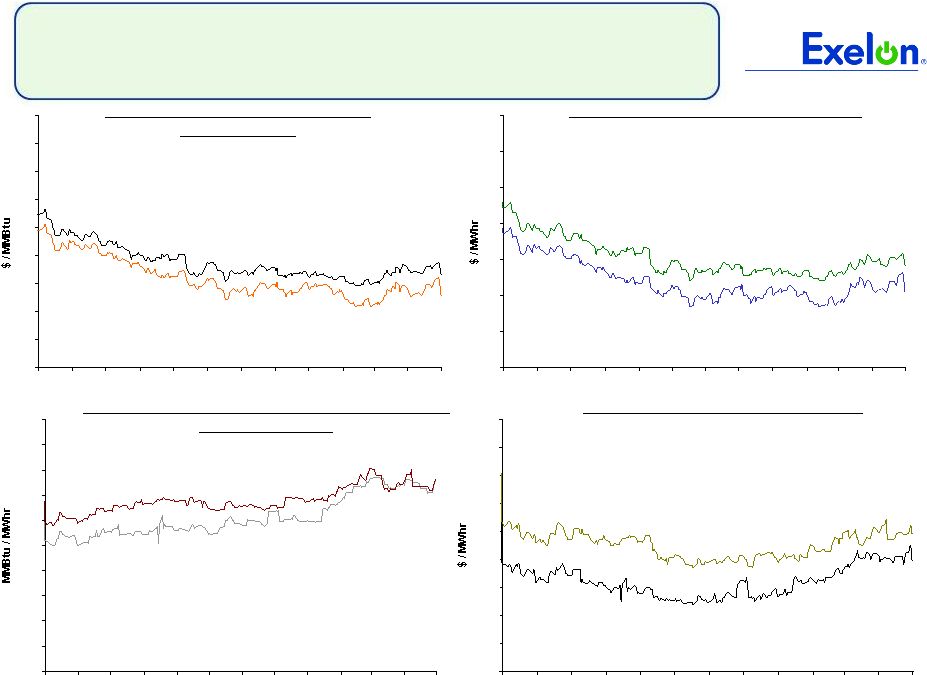 33 33 33 4.5 5.5 6.5 7.5 8.5 9.5 10.5 11.5 12.5 13.5 5/10 6/10 7/10 8/10 9/10 10/10 11/10 12/10 1/11 2/11 3/11 4/11 5/11 8.0 8.2 8.4 8.6 8.8 9.0 9.2 9.4 9.6 9.8 10.0 5/10 6/10 7/10 8/10 9/10 10/10 11/10 12/10 1/11 2/11 3/11 4/11 5/11 35 40 45 50 55 60 65 70 5/10 6/10 7/10 8/10 9/10 10/10 11/10 12/10 1/11 2/11 3/11 4/11 5/11 3.5 4.0 4.5 5.0 5.5 6.0 6.5 7.0 7.5 8.0 5/10 6/10 7/10 8/10 9/10 10/10 11/10 12/10 1/11 2/11 3/11 4/11 5/11 Market Price Snapshot 2013 9.36 2012 9.23 2012 $46.94 2013 $50.23 2012 $5.09 2013 $5.37 Houston Ship Channel Natural Gas Forward Prices ERCOT North On-Peak Forward Prices ERCOT North On-Peak v. Houston Ship Channel Implied Heat Rate 2012 $7.72 2013 $9.00 ERCOT North On Peak Spark Spread Assumes a 7.2 Heat Rate, $1.50 O&M, and $.15 adder Rolling 12 months, as of May 6th 2011. Source: OTC quotes and electronic trading system. Quotes are daily. |