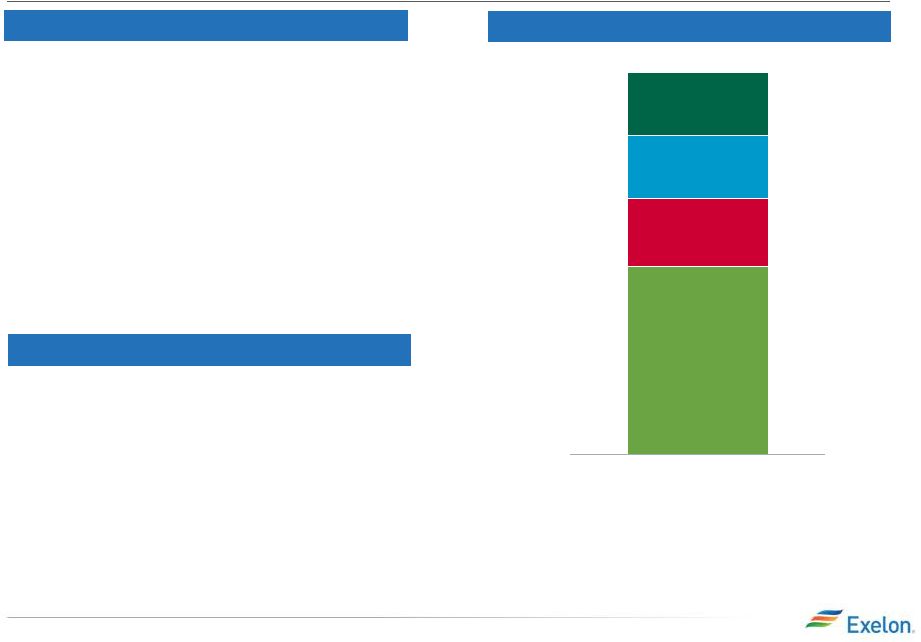
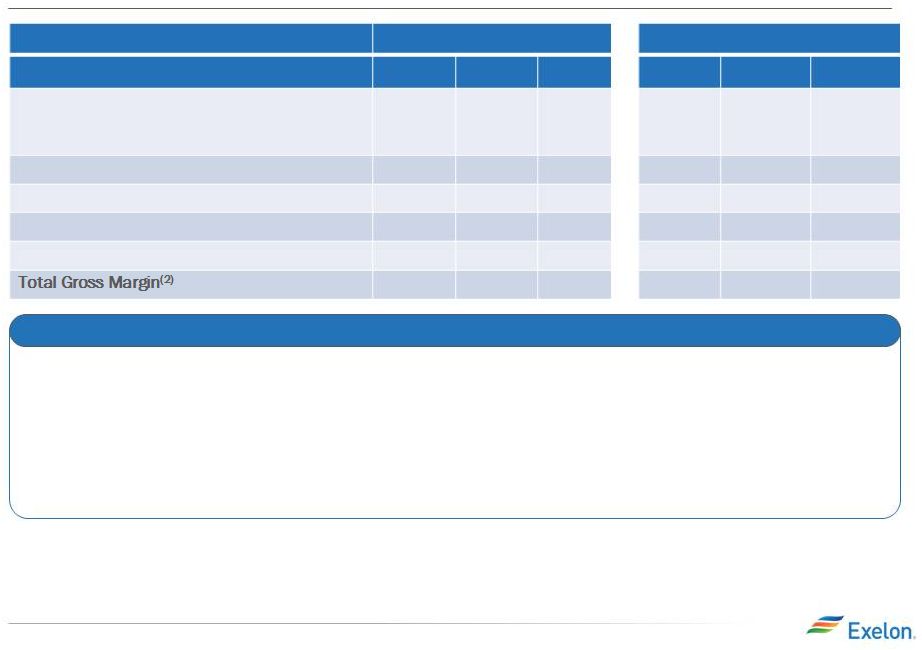
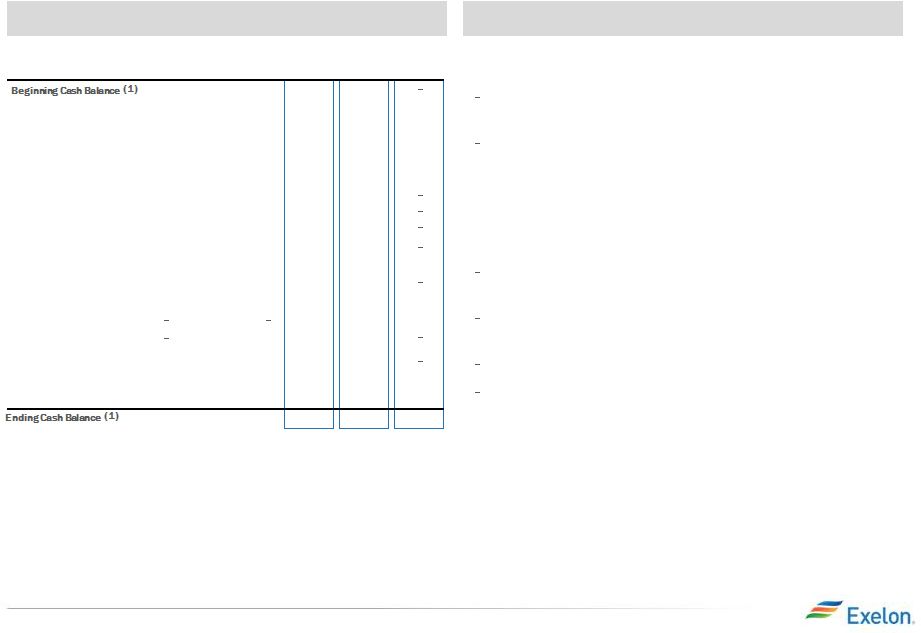
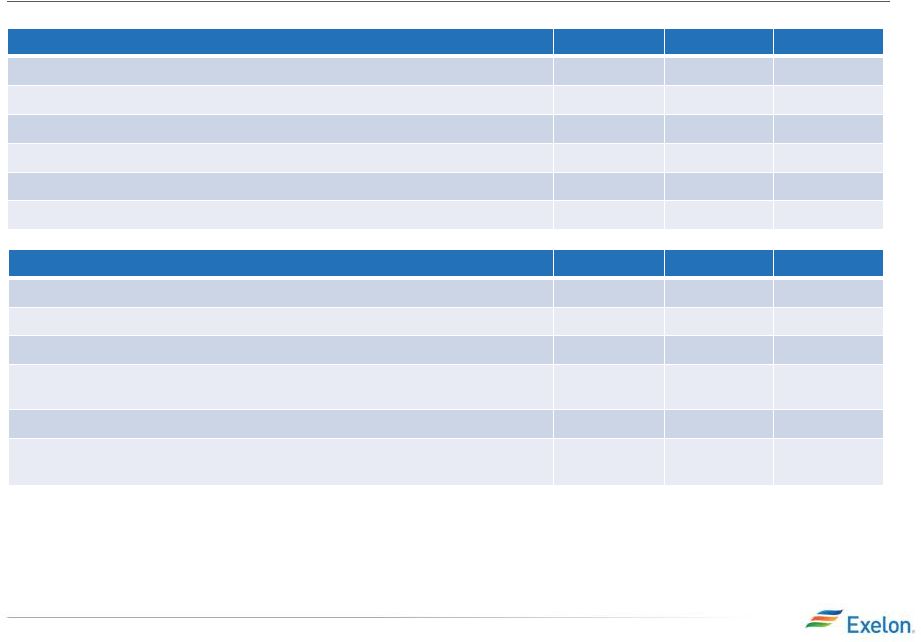
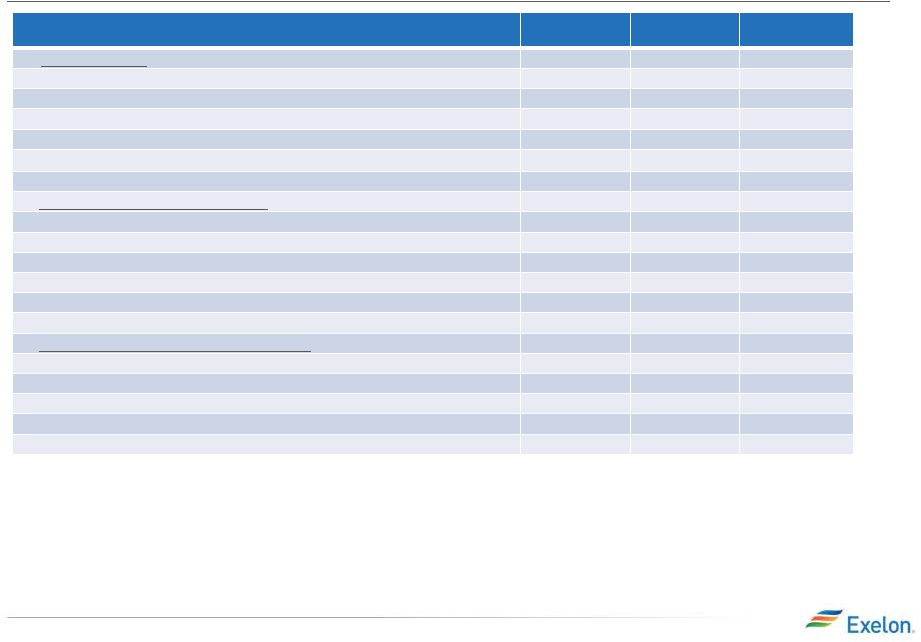
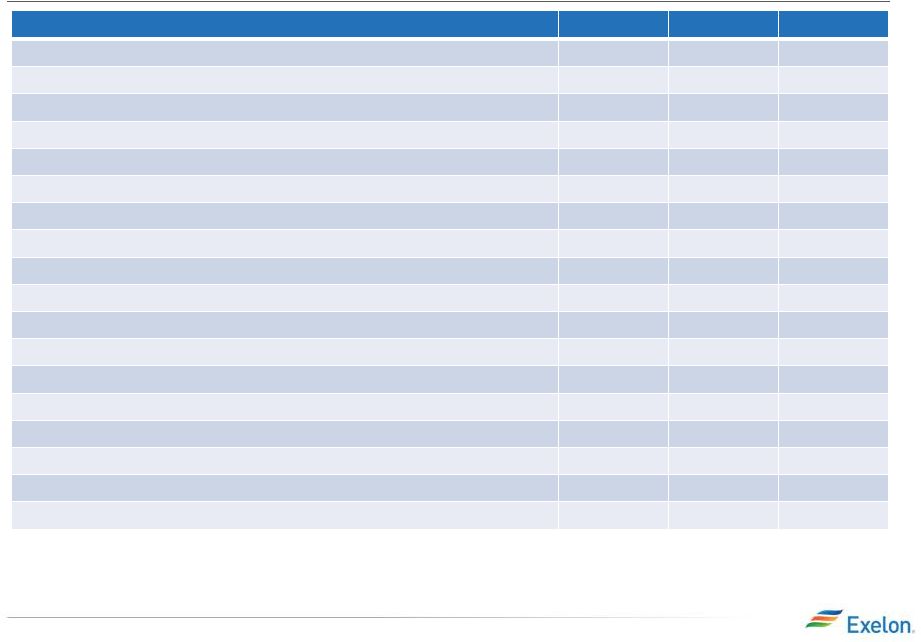
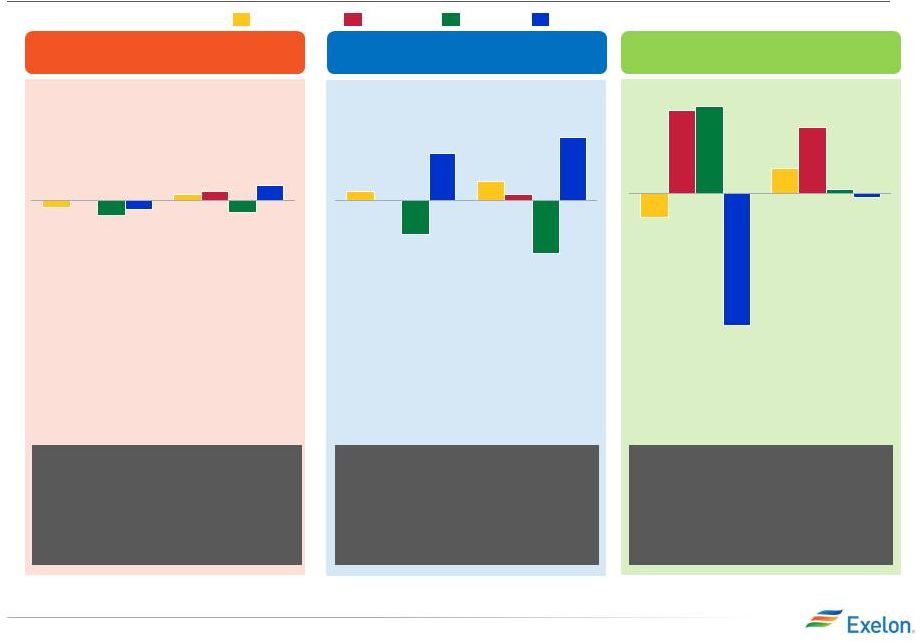
2014 Projected Sources and Uses of Cash Key Messages • Cash from Operations is projected to be $6,200M vs Plan of $6,100M for a $100M variance. This variance is driven by: $150M Reclassification of CENG capital expenditure at EXC ownership ($50M) Lower Constellation gross margin due to plant underperformance • Cash from Financing activities is projected to be equal to Plan of ($825M) • Cash from Investing activities is projected to be ($5,375M) vs Plan of ($5,475M) for a $100M variance. This variance is driven by: $325M early lease termination fee received at Corporate from the City of San Antonio Public Service (“CPS”) ($150M) Reclassification of CENG Capital Expenditure at EXC ownership ($50M) Higher PECO CapEx primarily due to January Ice Storm ($25M) ExGen: additional turbine purchases at Fourmile wind, CENG capital at ownership, and gas and hydro. Projected Sources & Uses (1) Excludes counterparty collateral of $134 million at 12/31/2013. In addition, the 12/31/2014 ending cash balance does not include collateral. (2) Adjusted Cash Flow from Operations (non-GAAP) primarily includes net cash flow from operating activities and net cash flows from investing activities excluding capital expenditures of $5.4B for 2014. For March 31, 2014, includes EDF’s proportionate ownership share of CENG Joint Venture CapEx and Nuclear Fuel. For December 31, 2013, includes 100% of CENG Joint Venture CapEx and Nuclear Fuel. (3) For March 31, 2014, excludes EDF’s proportionate ownership share of CENG Joint Venture CapEx and Nuclear Fuel. For December 31, 2013, excludes 100% of CENG Joint Venture CapEx and Nuclear Fuel. (4) Dividends are subject to declaration by the Board of Directors. (5) “Other” includes CENG distribution to EDF, proceeds from stock options, and expected changes in short-term debt. (6) Includes cash flow activity from Holding Company, eliminations, and other corporate entities. CapEx for Exelon is shown net of $325M CPS early lease termination fee. (7) All amounts rounded to the nearest $25M. (8) Net 2014 sources and uses for each operating company are expected to be $0M, $325M, $100M and $600M for BGE, ComEd, PECO and ExGen, respectively 2014 1Q Earnings Release Slides 10 ($ in millions) BGE ComEd PECO ExGen Exelon (6) As of 4Q13 Variance 1,475 1,475 675 1,425 600 3,475 6,200 6,100 100 (525) (1,575) (500) (1,175) (3,475) (3,675) 200 n/a n/a n/a (975) (975) (900) (75) (1,075) (1,075) n/a n/a n/a (150) (150) (150) n/a n/a n/a (75) (75) (75) n/a n/a n/a (200) (200) (200) n/a n/a n/a (50) (50) (25) (25) (75) (200) (175) n/a (450) (450) 950 300 1,250 1,200 50 (625) (250) (525) (1,375) (1,375) n/a n/a n/a 675 675 675 Adjusted Cash Flow from Operations (3) CapEx (excluding other items below): (3) Nuclear Fuel Dividend (4) Nuclear Uprates Wind Solar Upstream Utility Smart Grid/Smart Meter Net Financing (excluding Dividend): Debt Issuances Debt Retirements Project Finance/Federal Financing Bank Loan Other (5) (75) 350 125 (400) (300) (250) (50) 1,475 1,275 200 (7) (7,8) (2) |