EXHIBIT C-10

Annual Financial Report
of the Government of Canada
Fiscal Year 2010–2011

©Her Majesty the Queen in Right of Canada (2011)
All rights reserved
All requests for permission to reproduce this document or any part thereof
shall be addressed to Public Works and Government Services Canada.
Cette publication est également disponible en français.
Cat. No.: FI-25/2011E-PDF

Table of Contents
| | | | |
| |
Report Highlights | | | 5 | |
| |
Revenues | | | 14 | |
| |
Expenses | | | 18 | |
| |
The Budgetary Balance and Financial Source/Requirement | | | 23 | |
| |
Federal Debt | | | 25 | |
| |
Comparison of Actual Budgetary Outcomes to Projected Results | | | 27 | |
| |
Independent Auditor’s Report | | | 28 | |
| |
Condensed Financial Statements of the Government of Canada | | | 29 | |
3

Note to Readers
The financial results in this report are based on the audited financial statements of the Government of Canada for the fiscal year ended March 31, 2011, the condensed form of which is included in this report. For the 13th consecutive year, the Government has received an unqualified audit opinion, now referred to as an unmodified audit opinion under the new Canadian auditing standards, from the Auditor General of Canada on the financial statements. The complete financial statements will be set out in the Public Accounts of Canada 2011 when tabled in Parliament.
The Fiscal Reference Tables have been updated to incorporate the results for 2010–11 as well as historical revisions to the National Economic and Financial Accounts published by Statistics Canada.
4
Report Highlights
| • | | The Government posted a budgetary deficit of $33.4 billion for the fiscal year ended March 31, 2011, compared to a budgetary deficit of $55.6 billion in 2009–10. This represents a 40-per-cent reduction in the deficit from 2009–10. |
| • | | Roughly half of the $33.4-billion deficit was attributable to actions taken under Canada’s Economic Action Plan, which has provided significant additional support to Canadians in the form of personal income tax reductions, enhanced Employment Insurance (EI) benefits, investments in infrastructure and support for housing, support for industries and communities, and actions to improve access to financing. |
| • | | The $33.4-billion deficit in 2010–11 was $2.8 billion lower than the $36.2-billion deficit forecast in the June 2011 budget. Revenues were $1.5 billion higher than forecast, while program expenses were $1.2 billion lower than forecast. |
| • | | The federal debt (the difference between total liabilities and total assets) stood at $550.3 billion at March 31, 2011. The federal debt-to-GDP (gross domestic product) ratio was 33.9 per cent, down slightly from a year earlier. The federal debt-to-GDP ratio at March 31, 2011 stood at less than half of its peak of 68.4 per cent at March 31, 1996. |
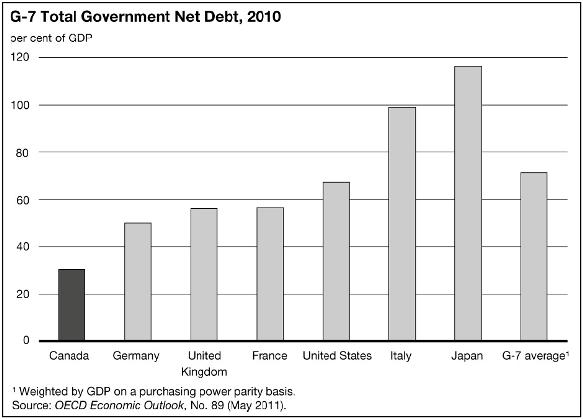
| • | | As reported by the Organisation for Economic Co-operation and Development (OECD), Canada’s total government net debt-to-GDP ratio stood at 30.4 per cent in 2010. This is the lowest level among Group of Seven (G-7) countries, which the OECD estimates recorded an average net debt of 71.4 per cent of GDP in that same year. |
5
Table 1
Financial Highlights
| | | | | | | | | | |
| | | 2009–10 | | | 2010–11 | | | |
| | | ($ billions) | | | |
| | | |
Budgetary transactions | | | | | | | | | | |
| | | |
Revenues | | | 218.6 | | | | 237.1 | | | |
| | | |
Expenses | | | | | | | | | | |
| | | |
Program expenses | | | 244.8 | | | | 239.6 | | | |
| | | |
Public debt charges | | | 29.4 | | | | 30.9 | | | |
| | | | | | | | | | |
Total expenses | | | 274.2 | | | | 270.5 | | | |
| | | |
Budgetary balance | | | -55.6 | | | | -33.4 | | | |
| | | |
Non-budgetary transactions | | | -8.0 | | | | -12.8 | | | |
| | | |
Financial source/requirement | | | -63.6 | | | | -46.2 | | | |
| | | |
Net change in financing activities | | | 45.1 | | | | 32.0 | | | |
| | | | | | | | | | |
Net change in cash balances | | | -18.5 | | | | -14.1 | | | |
| | | |
Cash balance at end of period | | | 28.5 | | | | 14.3 | | | |
| | | |
Financial position | | | | | | | | | | |
| | | |
Total liabilities | | | 883.3 | | | | 920.9 | | | |
| | | |
Total financial assets | | | 300.8 | | | | 304.0 | | | |
| | | | | | | | | | |
Net debt | | | 582.5 | | | | 616.9 | | | |
| | | |
Non-financial assets | | | 63.4 | | | | 66.6 | | | |
| | | | | | | | | | |
Federal debt (accumulated deficit) | | | 519.1 | | | | 550.3 | | | |
| | | |
Financial results (% of GDP) | | | | | | | | | | |
| | | |
Revenues | | | 14.3 | | | | 14.6 | | | |
| | | |
Program expenses | | | 16.0 | | | | 14.7 | | | |
| | | |
Public debt charges | | | 1.9 | | | | 1.9 | | | |
| | | |
Budgetary balance | | | -3.6 | | | | -2.1 | | | |
| | | |
Federal debt (accumulated deficit) | | | 34.0 | | | | 33.9 | | | |
Note: Numbers may not add due to rounding.
6
Economic Highlights1
Throughout 2010 and into early 2011, the global economy continued its recovery from the deepest and most synchronized recession since the 1930s. During this time, global financial market conditions improved and commodity prices rebounded.
Reflecting Canada’s solid economic and fiscal fundamentals, together with the impact of Canada’s Economic Action Plan and monetary policy stimulus, the Canadian economy has recovered strongly from the recession. The Canadian economy has recovered more than all of the GDP and more than all of the employment lost during the downturn.
Growth in Canada has been fuelled by a strong rebound in domestic activity. Growth in real consumer spending on goods and services averaged more than 3 per cent per quarter in 2010. Business investment in machinery and equipment was even stronger, growing on average by more than 17 per cent per quarter. In the first half of 2011, domestic demand in Canada remained strong, with consumption and business investment continuing to expand. In particular, business investment in machinery and equipment grew by more than 16 per cent. The strength of the domestic economy, however, has been dampened by weak demand for Canadian exports, particularly from the U.S.
The economic recovery has underpinned a strong rebound in Canada’s labour market. By August 2011, the economy had created about 600,000 jobs relative to its trough in July 2009—more than offsetting the jobs lost in Canada during the global economic downturn. Furthermore, most of the jobs created over the recovery have been full-time and in relatively high-wage industries.
The level of economic activity in 2010 was considerably higher than in 2009. Real GDP increased by 3.2 per cent in 2010. Nominal GDP (the broadest single measure of the Government’s tax base) increased by 6.3 per cent as a result of the increase in real GDP together with a significant rebound in global commodity prices.
However, in more recent months, the global economic recovery has become uneven and more fragile and downside risks have become more significant. Weakening global economic growth, particularly in the U.S. and Europe, combined with ongoing concern about sovereign debt in Europe, have led to increasing volatility in global equity, bond and foreign exchange markets. Canada is not immune from these external developments. Real GDP contracted slightly in the second quarter of 2011—the first quarter of negative growth since mid-2009. The outlook for Canada looking forward is for positive but modest growth. However, risks remain to this outlook, given the current uncertainty surrounding the global economic situation.
| 1 | This section incorporates data available up to and including October 6, 2011. However, fiscal results in the following section cover the period from April 1, 2010 to March 31, 2011. Rates in this section are reported at annual rates. |
7
Canada’s Economic Action Plan
In Budget 2009, the Government introduced Canada’s Economic Action Plan (EAP) in response to the worst economic and financial crisis since the 1930s. The EAP was designed to support economic growth and job creation, and its implementation has been effective at shielding Canadians from the worst of the global recession. The EAP has:
| — | | Reduced taxes permanently. |
| — | | Helped the unemployed through enhanced EI benefits and training programs. |
| — | | Prevented layoffs by enhancing the EI work-sharing program. |
| — | | Made significant investments in infrastructure. |
| — | | Provided support to the housing sector through the Home Renovation Tax Credit. |
| — | | Advanced Canada’s knowledge economy by improving infrastructure at colleges and universities and supporting research and technology. |
| — | | Supported industries and communities most affected by the global downturn. |
| — | | Improved access to and the affordability of financing for Canadian households and businesses. |
These measures have been implemented across a large number of departments, agencies and Crown corporations, often in partnership with other levels of government.
Because the stimulus in the EAP was designed to provide temporary support to the economy, the vast majority of initiatives announced in Budget 2009 ended as planned on March 31, 2011. In order to provide additional flexibility to the Government’s partners, the completion deadline for four provincial, territorial and municipal infrastructure programs was extended to October 31, 2011. As a result of this decision, the economic benefits and job creation impact of stimulus projects were continued for an additional construction season.
Progress in Implementing Canada’s Economic Action Plan
| | | | | |
| | | 2010–11 Impact of EAP |
| | | (accrual basis—$ billions) |
Reducing the tax burden for Canadians | | | | 3.2 | |
| |
Helping the unemployed | | | | 5.0 | |
| |
Building infrastructure to create jobs | | | | 5.1 | |
| |
Advancing Canada’s knowledge economy and creating better jobs | | | | 1.4 | |
| |
Supporting industries and communities | | | | 1.8 | |
| | | | | |
Total federal support | | | | 16.5 | |
Note: Totals may not add due to rounding.
Actions taken during the second year of the EAP account for approximately $16.5 billion of the 2010–11 deficit of $33.4 billion. Of the amounts recorded under the EAP, revenue reductions account for $5.9 billion, while expenditure measures account for $10.6 billion.
The $16.5 billion of EAP measures in 2010–11 are recorded on an accrual basis. This amount is lower than the cash value of the EAP due largely to investments in federal assets (for which budgetary costs are amortized over a number of years) and loans to third parties (for which budgetary costs are only recorded to the extent there is a risk of loss). The seven reports to Canadians on the EAP have focused on its cash value because this is the best measure for assessing the impact of the stimulus on the economy.
The Government has reported regularly to Canadians on the implementation of the EAP. Canadians can learn more about individual elements of the EAP at http://www.actionplan.gc.ca.
8
The Budgetary Balance
The Government posted a budgetary deficit of $33.4 billion in 2010–11, reflecting the impact of the global economic recession and the stimulus measures introduced to help mitigate its impact.
Revenues were up $18.5 billion, or 8.5 per cent, from the prior year. Over half of this increase was attributable to growth in personal income tax revenues, which grew by $9.5 billion, reflecting growth in personal income, combined with the expiration of the Home Renovation Tax Credit on January 31, 2010. The remaining growth in revenues was largely attributable to increases in other revenues and Goods and Services Tax (GST) revenues, which increased by $6.5 billion and $1.4 billion, respectively.
Expenses were down $3.7 billion, or 1.4 per cent, from the prior year. Program expenses decreased by $5.2 billion, largely reflecting one-time assistance to the automotive industry and Harmonized Sales Tax (HST) transitional assistance to the provinces of Ontario and British Columbia in 2009–10, as well as a decline in EI benefit payments. Public debt charges increased by $1.5 billion, or 5.0 per cent, from the prior year, reflecting a higher stock of interest-bearing debt.
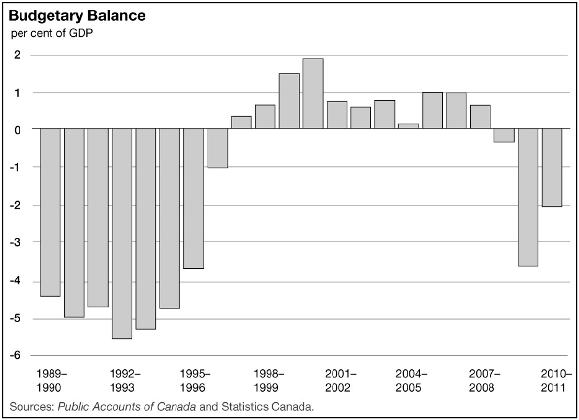
In the absence of policy changes, the budgetary balance primarily mirrors economic developments. To enhance the comparability of financial results over time and across jurisdictions, the budgetary balance and its components are often presented as a percentage of GDP. The following chart shows the budgetary balance as a percentage of GDP since 1989–90. In 2010–11, the deficit was 2.1 per cent of GDP, down from 3.6 per cent a year earlier, and down 3.5 percentage points from its most recent peak of 5.6 per cent in 1992–93.
9
Federal Debt
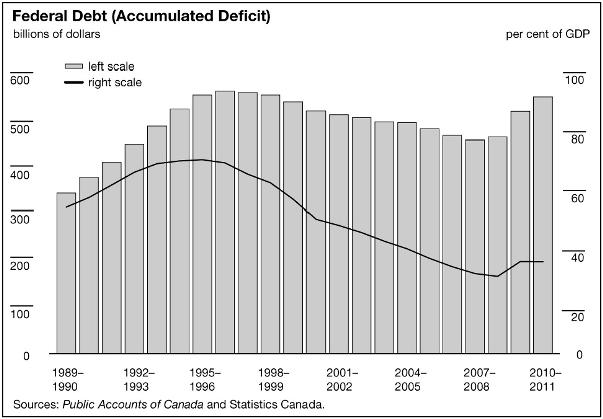
The federal debt (accumulated deficit) is the difference between the Government’s total liabilities and its total assets. At the end of 2010–11, the federal debt stood at $550.3 billion.
The federal debt increased by $31.2 billion in 2010–11, due to the $33.4-billion budgetary deficit, partially offset by $2.1 billion in other comprehensive income. A significant portion of the $2.1 billion in other comprehensive income relates to unrealized gains resulting from the increase in the value of the Government’s holdings of General Motors common shares.
The following chart shows the federal debt since 1989–90. The federal debt stood at 33.9 per cent of GDP in 2010–11, less than half of its peak of 68.4 per cent in 1995–96.
10
Net Debt
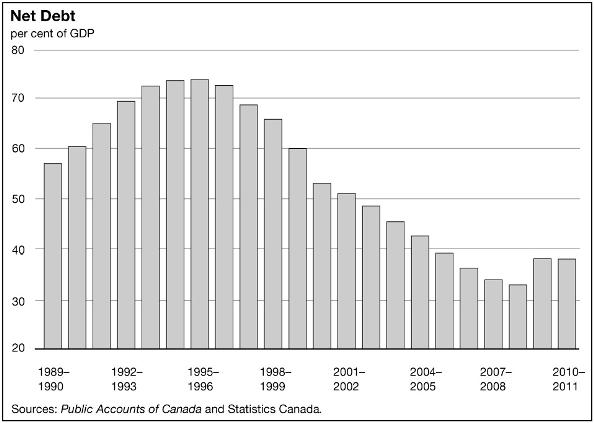
The net debt is the difference between the Government’s total liabilities and its financial assets. Under this measure of debt, liabilities are reduced only by financial assets as non-financial assets cannot normally be converted to cash to pay off the debt without disrupting government operations. At the end of 2010–11, the Government’s net debt stood at $616.9 billion, up $34.4 billion from 2009–10.
The net debt-to-GDP ratio measures debt relative to the ability of the country’s taxpayers to finance it. The following chart shows the net debt-to-GDP ratio since 1989–90. The ratio stood at 38.0 per cent in 2010–11, down 0.1 percentage point from 2009–10, remaining well below its peak in the mid-1990s.
11
International comparisons of net debt are made on a total government, National Accounts basis, which for Canada includes the net debt of federal, provincial/territorial and local governments, as well as the net assets held in the Canada Pension Plan and Québec Pension Plan.
Canada’s total government net debt-to-GDP ratio stood at 30.4 per cent in 2010, as shown in the following chart. According to the OECD, this is by far the lowest level among G-7 countries, which the OECD estimates recorded an average net debt of 71.4 per cent of GDP in that same year.
12
Federal Debt (Accumulated Deficit)
The financial statements of the Government of Canada are presented on an accrual basis of accounting. On this basis, there are several generally accepted definitions of government debt.
Net debt represents the total liabilities of the Government less its financial assets. Financial assets include cash and cash equivalents, accounts receivable, foreign exchange accounts, and loans, investments and advances.
The accumulated deficit is equal to total liabilities less total assets—both financial and non-financial. Non-financial assets include tangible capital assets, such as land and buildings, inventories and prepaid expenses. The annual change in the accumulated deficit is equal to the budgetary balance plus other comprehensive income or loss. Other comprehensive income or loss represents certain unrealized gains and losses on financial instruments reported by enterprise Crown corporations and other government business enterprises. In accordance with accounting standards issued by the Public Sector Accounting Board of the Canadian Institute of Chartered Accountants, other comprehensive income or loss is not included in the Government’s annual budgetary balance, but is instead recorded in the Government’s Statement of Accumulated Deficit and Statement of Change in Net Debt.
The federal debt, referred to in the budget documents and the Annual Financial Report of the Government of Canada, is the accumulated deficit. It is the federal government’s main measure of debt.
Table 2
Federal Debt (Accumulated Deficit)
| | | | | | | | | | | | |
| | | 2009–10 | | | 2010–11 | | | Net change | |
| | | | | | ($ millions) | | | | |
| | | |
Federal debt at beginning of year | | | 463,710 | | | | 519,097 | | | | 55,387 | |
| | | |
Annual deficit | | | 55,598 | | | | 33,372 | | | | -22,226 | |
| | | |
Other comprehensive income | | | 211 | | | | 2,142 | | | | 1,931 | |
| | | | | | | | | | | | |
Federal debt at end of year | | | 519,097 | | | | 550,327 | | | | 31,230 | |
Financial Source/Requirement
The financial source/requirement measures the difference between cash coming in to the Government and cash going out. It differs from the budgetary balance, which measures revenues and expenses as they are earned or incurred rather than when the associated cash is received or paid.
There was a financial requirement of $46.2 billion in 2010–11, compared to a financial requirement of $63.6 billion in 2009–10. The decrease in the financial requirement reflects the improvement in the budgetary balance, as well as the wind-down in 2009–10 of purchases of insured mortgage pools under the Insured Mortgage Purchase Program (IMPP) administered by Canada Mortgage and Housing Corporation (CMHC). These decreases were partially offset by a financial requirement in 2010–11 resulting from transactions affecting the Government’s accounts payable and accounts receivable, including the payment of $3.8 billion in HST transitional assistance to the provinces of Ontario and British Columbia and an increase in taxes receivable, reflecting the Government’s administration of the HST in Ontario and British Columbia as of July 1, 2010.
13
Revenues
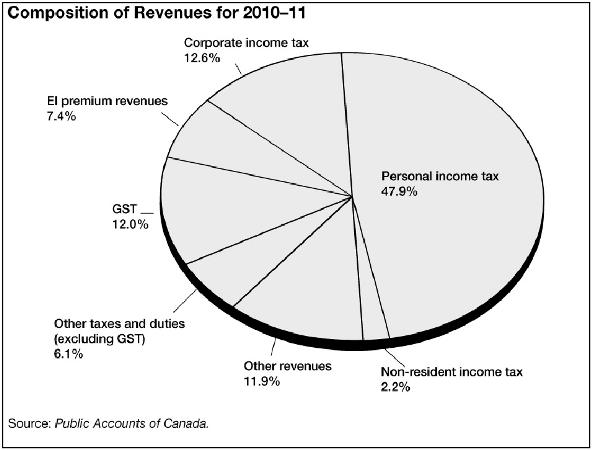
Revenues totalled $237.1 billion in 2010–11, an increase of $18.5 billion or 8.5 per cent from 2009–10 (Table 3). The increase over the prior year was due primarily to higher personal income tax revenues, GST revenues and other revenues.
The following chart illustrates the composition of revenues for 2010–11. The largest source of federal revenues is personal income tax revenues, which accounted for 47.9 per cent of total revenues in 2010–11. The second largest source was corporate income tax revenues at 12.6 per cent. GST revenues were 12.0 per cent of revenues while EI premium revenues contributed 7.4 per cent. Other revenues made up 11.9 per cent of total revenues in 2010–11, up 2.0 percentage points from a year earlier, due mainly to an increase in the net profits of enterprise Crown corporations.
Personal income tax revenues increased by $9.5 billion, or 9.1 per cent, in 2010–11. This increase reflected growth in personal income, combined with the expiration of the Home Renovation Tax Credit on January 31, 2010.
Corporate income tax revenues decreased by $0.4 billion, or 1.3 per cent, in 2010–11, reflecting one-time factors which boosted 2009–10 revenues. Corporate income tax revenues were $1.0 billion higher than projected in Budget 2011, reflecting strong gains in corporate profits.
14
Non-resident income tax revenues were down $0.2 billion, or 2.9 per cent, in 2010–11, stemming from large reassessments of prior-year revenues, partially offset by growth in revenues from the current taxation year.
Other taxes and duties increased by $2.3 billion, or 5.7 per cent, from the prior year, driven by a $1.4-billion, or 5.3-per-cent, increase in GST revenues, reflecting higher consumption as the economy recovered. Other excise taxes and duties increased by $0.7 billion, or 14.2 per cent, energy taxes increased by $0.2 billion, or 3.2 per cent, and customs import duties increased by $30 million, or 0.9 per cent.
EI premium revenues increased by $0.7 billion, or 4.4 per cent, from the previous year, reflecting lower unemployment and the EI premium rate of $1.78 per $100 of insurable earnings for 2011.
Other revenues increased by $6.5 billion, or 29.8 per cent, in 2010–11. This growth was driven by an increase in the net profits of enterprise Crown corporations, due mainly to a decrease in expenses associated with provisions for credit losses and claims, unrealized gains on derivatives held under the IMPP administered by CMHC, gains realized on the Government’s sale of common shares in General Motors as part of the automaker’s initial public offering in November 2010, and foreign exchange gains.
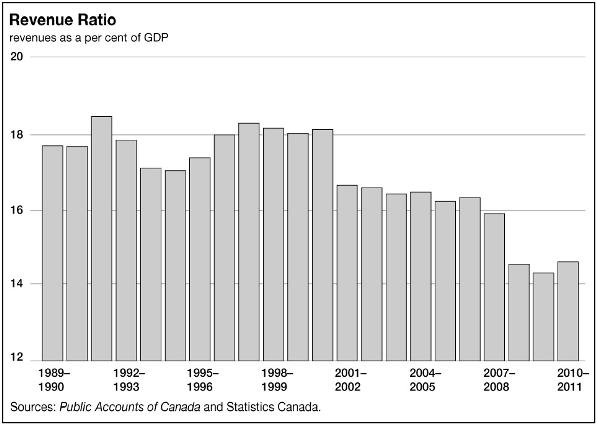
The revenue ratio—revenues as a percentage of GDP—compares the total of all federal revenues to the size of the economy. This ratio is influenced by changes in statutory tax rates and by economic developments. The following chart illustrates the revenue ratio since 1989–90. The ratio stood at 14.6 per cent in 2010–11, up 0.3 percentage points from 2009–10, reflecting the economic recovery and the expiration of the Home Renovation Tax Credit. However, the ratio has been declining gradually since 2001–02, and is down significantly from an average of 18 per cent over the period 1996–97 to 2000–01. This decline is due primarily to tax reduction measures.
15
16
Table 3
Revenues
| | | | | | | | | | | | | | | | | | |
| | | 2009–10 | | | 2010–11 | | | Net change | | | |
| | | ($ millions) | | | ($ millions) | | | ($ millions) | | | (%) | | | |
| | | | | |
Tax revenues | | | | | | | | | | | | | | | | | | |
| | | | | |
Income tax | | | | | | | | | | | | | | | | | | |
| | | | | |
Personal | | | 103,947 | | | | 113,457 | | | | 9,510 | | | | 9.1 | | | |
| | | | | |
Corporate | | | 30,361 | | | | 29,969 | | | | -392 | | | | -1.3 | | | |
| | | | | |
Non-resident | | | 5,293 | | | | 5,137 | | | | -156 | | | | -2.9 | | | |
| | | | | | | | | | | | | | | | | | |
Total | | | 139,601 | | | | 148,563 | | | | 8,962 | | | | 6.4 | | | |
| | | | | |
Other taxes and duties | | | | | | | | | | | | | | | | | | |
| | | | | |
Goods and Services Tax | | | 26,947 | | | | 28,379 | | | | 1,432 | | | | 5.3 | | | |
| | | | | |
Energy taxes | | | 5,178 | | | | 5,342 | | | | 164 | | | | 3.2 | | | |
| | | | | |
Customs import duties | | | 3,490 | | | | 3,520 | | | | 30 | | | | 0.9 | | | |
| | | | | |
Other excise taxes and duties | | | 4,958 | | | | 5,662 | | | | 704 | | | | 14.2 | | | |
| | | | | | | | | | | | | | | | | | |
Total | | | 40,573 | | | | 42,903 | | | | 2,330 | | | | 5.7 | | | |
| | | | | |
Total tax revenues | | | 180,174 | | | | 191,466 | | | | 11,292 | | | | 6.3 | | | |
| | | | | |
Employment Insurance premium revenues | | | 16,761 | | | | 17,501 | | | | 740 | | | | 4.4 | | | |
| | | | | |
Other revenues | | | | | | | | | | | | | | | | | | |
| | | | | |
Crown corporations | | | 7,622 | | | | 12,937 | | | | 5,315 | | | | 69.7 | | | |
| | | | | |
Other programs | | | 12,396 | | | | 13,378 | | | | 982 | | | | 7.9 | | | |
| | | | | |
Net foreign exchange | | | 1,647 | | | | 1,809 | | | | 162 | | | | 9.8 | | | |
| | | | | | | | | | | | | | | | | | |
Total | | | 21,665 | | | | 28,124 | | | | 6,459 | | | | 29.8 | | | |
| | | | | |
Total revenues | | | 218,600 | | | | 237,091 | | | | 18,491 | | | | 8.5 | | | |
Note: Numbers may not add due to rounding.
17
Expenses
Expenses consist of program expenses and public debt charges. In 2010–11, expenses amounted to $270.5 billion, down $3.7 billion, or 1.4 per cent, from 2009–10.
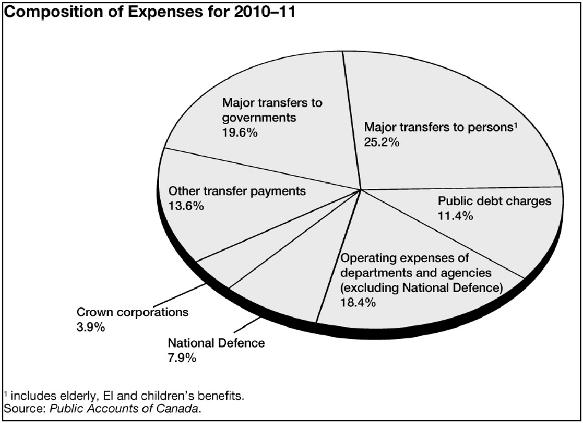
The chart below shows the composition of expenses for 2010–11. Major transfers to persons (elderly, EI and children’s benefits) and major transfers to other levels of government (the Canada Health Transfer, the Canada Social Transfer, fiscal arrangements, transfers to provinces on behalf of Canada’s cities and communities, other transfers and the Quebec Abatement) were the two largest components of expenses in 2010–11, representing 25.2 per cent and 19.6 per cent of expenses, respectively.
The remaining elements of program expenses (other transfer payments, Crown corporation expenses, and operating expenses of departments and agencies, including National Defence) make up the Government’s direct program expenses.
After major transfers to persons and major transfers to other levels of government, the next largest component of expenses was the operating costs of government departments and agencies, excluding National Defence, at 18.4 per cent. Operating costs include items such as salaries and benefits, facilities and equipment, and supplies and travel. Other transfer payments, which include transfers made by various federal departments to individuals, businesses and other organizations and groups, made up 13.6 per cent of total expenses in 2010–11.
Public debt charges amounted to 11.4 per cent of expenses in 2010–11. This is down from a peak of nearly 30 per cent in the mid-1990s, when public debt charges was the largest component of spending.
18
Program expenses amounted to $239.6 billion in 2010–11, down $5.2 billion or 2.1 per cent from 2009–10 (Table 4). Within program expenses, transfers decreased by $7.5 billion and operating expenses of departments and agencies, excluding National Defence, increased by $1.8 billion. Operating expenses of National Defence grew by $0.4 billion, while Crown corporation expenses grew by $0.1 billion.
Major transfers to persons decreased by $0.4 billion, or 0.6 per cent, in 2010–11.
| • | | Elderly benefits consist of Old Age Security and Guaranteed Income Supplement and Allowance payments (formerly known as the Spousal Allowance). Total benefits were up $1.0 billion, or 2.8 per cent, in 2010–11, reflecting growth in the elderly population and changes in consumer prices, to which benefits are fully indexed. |
| • | | EI benefits consist of regular benefits, special benefits (sickness, maternity, parental, adoption and fishing) and work-sharing agreements. Total benefits decreased by $1.7 billion, or 8.0 per cent, in 2010–11, due mainly to a decrease in regular benefits, reflecting a lower unemployment rate. |
| • | | Children’s benefits, which consist of the base Canada Child Tax Benefit, the National Child Benefit Supplement, the Child Disability Benefit and the Universal Child Care Benefit, increased by $0.3 billion, or 2.6 per cent, reflecting enhancements to the National Child Benefit Supplement and the Canada Child Tax Benefit which took effect in July 2009 as part of Canada’s Economic Action Plan. |
19
Major transfers to other levels of government include the Canada Health Transfer (CHT), the Canada Social Transfer (CST), fiscal arrangements (Equalization, transfers to the territories, as well as a number of smaller transfer programs), transfers to provinces on behalf of Canada’s cities and communities, other transfers and the Quebec Abatement. These transfers decreased by $4.0 billion, or 7.1 per cent, compared to 2009–10.
| • | | The CHT and CST—block-funded transfers—support health care, post-secondary education, social assistance and social services, including early childhood development. These programs provide support in the form of cash and tax transfers to the provinces and territories. Transfers in support of health and other social programs increased by $1.5 billion in 2010–11, reflecting legislated growth. |
| • | | Total entitlements under fiscal arrangements increased by $0.8 billion in 2010–11, reflecting legislated growth in Equalization and Territorial Formula Financing payments and a total of $0.5 billion in one-time transfer protection payments to provinces to prevent declines in combined CHT, CST and Equalization transfers between 2009–10 and 2010–11. |
| • | | Transfers to provinces on behalf of Canada’s cities and communities decreased by $0.1 billion in 2010–11. |
| • | | Other transfers decreased by $5.8 billion, reflecting the one-time impact of HST transitional assistance to the provinces of Ontario and British Columbia in 2009–10. |
| • | | The Quebec Abatement is a recovery from the province of Quebec for an additional tax point transfer (16.5 points) above and beyond the CHT and CST tax point transfers. The $0.5-billion increase in this recovery was due to an increase in the value of personal income tax points in 2010–11 compared to 2009–10. |
Other transfer payments decreased by $3.1 billion, or 7.7 per cent, over the prior year. This decrease mainly reflects one-time assistance to the automotive industry in 2009–10, partially offset by increases in transfers across a number of departments and the revaluation of the Government’s liability to Ontario for the province’s one-third participation in the value of the Government’s common shares in General Motors.
Other direct program expenses increased from $79.3 billion in 2009–10 to $81.7 billion in 2010–11, up $2.3 billion, or 3.0 per cent. The $2.3-billion increase reflects past service costs associated with amendments made to veteran future benefit programs, which expand eligibility for certain allowances provided to injured veterans and provide access to all veteran benefit programs for veterans suffering from amyotrophic lateral sclerosis, as well as an increase in the estimated cost of the Government’s environmental liabilities. Other direct program expenses include:
| • | | Expenses related to Crown corporations increased by $0.1 billion, or 1.1 per cent, compared to 2009–10. |
| • | | National Defence expenses increased by $0.4 billion, or 2.0 per cent. |
| • | | All other departmental and agency expenses increased by $1.8 billion, or 3.8 per cent. |
Public debt charges increased by $1.5 billion, or 5.0 per cent, to $30.9 billion in 2010–11, reflecting a higher stock of interest-bearing debt.
20
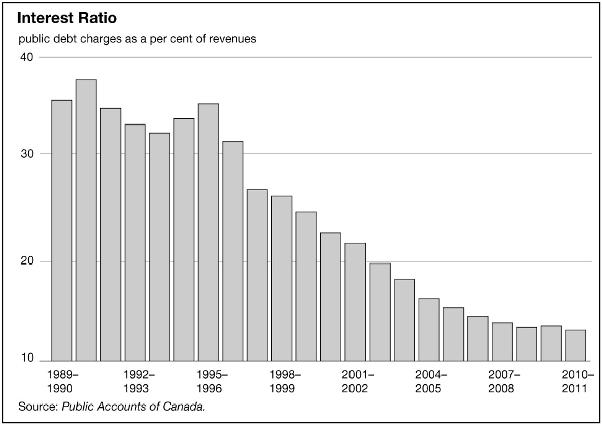
The following chart illustrates the interest ratio (public debt charges as a percentage of revenues) since 1989–90. This ratio has been decreasing in recent years, falling from 37.6 per cent in 1990–91 to 13.5 per cent in 2009–10. It fell an additional 0.5 percentage points in 2010–11, reaching 13.0 per cent. This means that, in 2010–11, the Government spent 13 cents of every revenue dollar on interest on the public debt. The lower the ratio, the more flexibility the Government has to address the key priorities of Canadians.
21
Table 4
Expenses
| | | | | | | | | | | | | | | | |
| | | 2009–10 | | | 2010–11 | | | Net change | |
| | | ($ millions) | | | ($ millions) | | | ($ millions) | | | (%) | |
Major transfers to persons | | | | | | | | | | | | | | | | |
| | | | |
Elderly benefits | | | 34,653 | | | | 35,629 | | | | 976 | | | | 2.8 | |
| | | | |
Employment Insurance benefits | | | 21,586 | | | | 19,850 | | | | -1,736 | | | | -8.0 | |
| | | | |
Children’s benefits | | | 12,340 | | | | 12,656 | | | | 316 | | | | 2.6 | |
| | | | | | | | | | | | | | | | |
Total | | | 68,579 | | | | 68,135 | | | | -444 | | | | -0.6 | |
| | | | |
Major transfers to other levels of government | | | | | | | | | | | | | | | | |
| | | | |
Support for health and other social programs | | | 35,678 | | | | 37,210 | | | | 1,532 | | | | 4.3 | |
| | | | |
Fiscal arrangements | | | 16,789 | | | | 17,577 | | | | 788 | | | | 4.7 | |
| | | | |
Canada’s cities and communities | | | 1,872 | | | | 1,751 | | | | -121 | | | | -6.5 | |
| | | | |
Other transfers | | | 5,950 | | | | 184 | | | | -5,766 | | | | -96.9 | |
| | | | |
Quebec Abatement | | | -3,299 | | | | -3,751 | | | | -452 | | | | 13.7 | |
| | | | | | | | | | | | | | | | |
Total | | | 56,990 | | | | 52,971 | | | | -4,019 | | | | -7.1 | |
| | | | |
Direct program expenses | | | | | | | | | | | | | | | | |
| | | | |
Other transfer payments | | | 39,892 | | | | 36,820 | | | | -3,072 | | | | -7.7 | |
| | | | |
Other direct program expenses | | | | | | | | | | | | | | | | |
| | | | |
Crown corporations | | | 10,428 | | | | 10,547 | | | | 119 | | | | 1.1 | |
| | | | |
National Defence | | | 20,863 | | | | 21,273 | | | | 410 | | | | 2.0 | |
| | | | |
All other departments and agencies | | | 48,032 | | | | 49,846 | | | | 1,814 | | | | 3.8 | |
| | | | | | | | | | | | | | | | |
Total other direct program expenses | | | 79,323 | | | | 81,666 | | | | 2,343 | | | | 3.0 | |
| | | | |
Total direct program expenses | | | 119,215 | | | | 118,486 | | | | -729 | | | | -0.6 | |
| | | | |
Total program expenses | | | 244,784 | | | | 239,592 | | | | -5,192 | | | | -2.1 | |
| | | | |
Public debt charges | | | 29,414 | | | | 30,871 | | | | 1,457 | | | | 5.0 | |
| | | | |
Total expenses | | | 274,198 | | | | 270,463 | | | | -3,735 | | | | -1.4 | |
Note: Numbers may not add due to rounding.
22
The Budgetary Balance and Financial Source/Requirement
The budgetary balance is the most comprehensive measure of the federal government’s fiscal results. It is presented on an accrual basis of accounting, recording government expenses when they are incurred, regardless of when the cash payment is made, and recording tax revenues when earned, regardless of when the cash is received.
In contrast, the financial source/requirement measures the difference between cash coming in to the Government and cash going out. It differs from the budgetary balance in that it includes cash transactions in loans, investments and advances, federal employees’ pension accounts, other specified purpose accounts, foreign exchange activities, and changes in other financial assets, liabilities and non-financial assets. These activities are included as part of non budgetary transactions.
Non-budgetary transactions also include adjustments for the effects of non-cash items included in the budgetary balance and for any accruals of past or future cash receipts or payments. Examples of non-cash items include amortization of tangible capital assets, pension expenses not funded in the period, and the recognition of previously deferred revenue.
Non-budgetary transactions resulted in a net requirement for funds amounting to $12.8 billion in 2010–11, compared to a net requirement for funds of $8.0 billion in 2009–10.
With a budgetary deficit of $33.4 billion and a net requirement from non-budgetary transactions of $12.8 billion, there was a financial requirement of $46.2 billion in 2010–11, compared to a financial requirement of $63.6 billion in 2009–10 (Table 5).
The Government financed this financial requirement of $46.2 billion by increasing unmatured debt by $32.0 billion and reducing its cash balances by $14.1 billion. The increase in debt was achieved largely through the issuance of marketable bonds.
Cash balances at the end of March 2011 stood at $14.3 billion, down $14.1 billion from their level at the end of March 2010. The decrease in cash and cash equivalents over the prior year mainly reflects the unwinding of special liquidity facilities introduced by the Bank of Canada during the financial crisis to support the efficient functioning of the Canadian financial system. With improved conditions in financial markets, the Government’s cash balances were reduced by the end of 2010–11.
23
Table 5
Budgetary Balance, Financial Source/Requirement and Net Financing Activities
| | | | | | | | | | |
| | | 2009–10 | | | 2010–11 | | | |
| | | ($ billions) | | | |
| | | |
Deficit for the year | | | -55.6 | | | | -33.4 | | | |
| | | |
Non-budgetary transactions | | | | | | | | | | |
| | | |
Pension and other accounts | | | | | | | | | | |
| | | |
Public sector pensions | | | 2.9 | | | | 3.3 | | | |
| | | |
Other employee and veteran future benefits | | | 3.9 | | | | 4.0 | | | |
| | | |
Other liabilities | | | 0.7 | | | | -0.3 | | | |
| | | | | | | | | | |
| | | |
Total | | | 7.5 | | | | 7.0 | | | |
| | | |
Non-financial assets | | | -1.9 | | | | -3.2 | | | |
| | | |
Loans, investments and advances | | | -27.4 | | | | -3.7 | | | |
| | | |
Other transactions | | | | | | | | | | |
| | | |
Accounts payable, receivable, accruals and allowances | | | 8.9 | | | | -11.3 | | | |
| | | |
Foreign exchange activities | | | 4.8 | | | | -1.6 | | | |
| | | | | | | | | | |
Total | | | 13.7 | | | | -12.9 | | | |
| | | |
Total non-budgetary transactions | | | -8.0 | | | | -12.8 | | | |
| | | |
Financial requirement | | | -63.6 | | | | -46.2 | | | |
| | | |
Net change in financing activities | | | | | | | | | | |
| | | |
Marketable bonds (Canadian currency) | | | 72.8 | | | | 48.1 | | | |
| | | |
Treasury bills | | | -16.4 | | | | -12.9 | | | |
| | | |
Retail debt | | | -0.7 | | | | -1.7 | | | |
| | | |
Other | | | -10.6 | | | | -1.5 | | | |
| | | | | | | | | | |
Total | | | 45.1 | | | | 32.0 | | | |
| | | |
Change in cash balances | | | -18.5 | | | | -14.1 | | | |
| | | |
Cash at end of year | | | 28.5 | | | | 14.3 | | | |
Note: Numbers may not add due to rounding.
24
Federal Debt
The Government’s liabilities consist of interest-bearing debt and accounts payable and accrued liabilities. Interest-bearing debt includes unmatured debt, liabilities for pension and other employee future benefits, and other liabilities. At March 31, 2011, interest-bearing debt amounted to $801.8 billion, up $39.0 billion from a year earlier (Table 6). Within interest-bearing debt, unmatured debt increased by $32.0 billion while liabilities for pension and other employee future benefits increased by $7.3 billion. Other liabilities, which include deposit and trust accounts and other specified purpose accounts, decreased by $0.3 billion. The increase in unmatured debt, mainly marketable bonds, primarily reflects financing requirements associated with the budgetary deficit.
Accounts payable and accrued liabilities amounted to $119.1 billion at March 31, 2011, down $1.5 billion from the close of 2009–10. The decrease is largely attributable to a $2.9-billion decrease in other accounts payable and accrued liabilities, primarily reflecting the payment of $3.8 billion in HST transitional assistance to the provinces of Ontario and British Columbia accrued in 2009–10. This decrease was partially offset by a $1.1-billion increase in environmental liabilities. Environmental liabilities include estimated costs related to the remediation of contaminated sites.
The Government’s assets consist of financial assets (cash and other accounts receivable, including tax receivables, foreign exchange accounts, and loans, investments and advances) and non-financial assets (tangible capital assets, inventories and prepaid expenses). Financial assets totalled $304.0 billion at March 31, 2011, up $3.1 billion from March 31, 2010. Cash and other accounts receivable decreased by $14.1 billion, mainly reflecting the unwinding of special liquidity facilities introduced by the Bank of Canada during the global financial crisis to support the efficient functioning of the Canadian financial system. Taxes receivable increased by $9.6 billion, largely reflecting the Government’s administration of the HST in Ontario and British Columbia as of July 1, 2010. Foreign exchange accounts increased by $1.6 billion over the prior year, due mainly to an increase in loans issued to the International Monetary Fund (IMF) to provide temporary resources to IMF member countries requiring balance of payments assistance. Loans, investments and advances increased by $5.9 billion, due mainly to net profits recorded by enterprise Crown corporations and other government business enterprises during 2010–11. As a result, the Government’s net debt (total liabilities less financial assets) stood at $616.9 billion at March 31, 2011, up $34.4 billion from March 31, 2010.
Non-financial assets amounted to $66.6 billion at March 31, 2011, up $3.2 billion from March 31, 2010.
With total liabilities of $920.9 billion, financial assets of $304.0 billion and non-financial assets of $66.6 billion, the federal debt (accumulated deficit) stood at $550.3 billion at March 31, 2011, up $31.2 billion from March 31, 2010. The federal debt stood at 33.9 per cent of GDP at March 31, 2011, down 0.1 percentage point from the previous year.
25
Table 6
Outstanding Debt at Year-End
| | | | | | | | | | |
| | | 2009–10 | | | 2010–11 | | | |
| | | ($ billions) | | | |
| | | |
Liabilities | | | | | | | | | | |
| | | |
Accounts payable and accrued liabilities | | | 120.5 | | | | 119.1 | | | |
| | | |
Interest-bearing debt | | | | | | | | | | |
| | | |
Unmatured debt | | | 559.1 | | | | 591.2 | | | |
| | | |
Pension and other future benefits | | | 197.1 | | | | 204.3 | | | |
| | | |
Other liabilities | | | 6.6 | | | | 6.3 | | | |
| | | | | | | | | | |
Total interest-bearing debt | | | 762.8 | | | | 801.8 | | | |
| | | |
Total liabilities | | | 883.3 | | | | 920.9 | | | |
| | | |
Financial assets | | | | | | | | | | |
| | | |
Cash and other accounts receivable | | | 32.1 | | | | 18.3 | | | |
| | | |
Tax receivables | | | 69.1 | | | | 78.6 | | | |
| | | |
Foreign exchange accounts | | | 47.0 | | | | 48.5 | | | |
| | | |
Loans, investments and advances | | | 152.7 | | | | 158.5 | | | |
| | | | | | | | | | |
Total financial assets | | | 300.8 | | | | 304.0 | | | |
| | | |
Net debt | | | 582.5 | | | | 616.9 | | | |
| | | |
Non-financial assets | | | | | | | | | | |
| | | |
Tangible capital assets | | | 55.1 | | | | 57.7 | | | |
| | | |
Inventories | | | 6.2 | | | | 6.8 | | | |
| | | |
Prepaid expenses | | | 2.1 | | | | 2.1 | | | |
| | | | | | | | | | |
Total non-financial assets | | | 63.4 | | | | 66.6 | | | |
| | | |
Federal debt (accumulated deficit) | | | 519.1 | | | | 550.3 | | | |
Note: Numbers may not add due to rounding.
26
Comparison of Actual Budgetary Outcomes to Projected Results
This section compares the actual outcome for the major components of the budgetary balance for 2010–11 to the Government’s most recent projections for 2010–11 set out in the June 2011 budget. The Government estimated a deficit of $36.2 billion for 2010–11 in the June 2011 budget. The final audited budgetary deficit for 2010–11 was $33.4 billion.
Revenues were $1.5 billion higher than expected, largely reflecting higher-than-expected corporate income tax and other revenues. Program expenses were $1.2 billion lower than forecast, mainly reflecting lower-than-expected year-end accrual adjustments.
Table 7
Comparison of Actual Outcomes to June 2011 Budget
| | | | | | | | | | | | |
| | | |
| | | Actual | | | June 2011 Budget1 | | | Difference | |
| | | ($ billions) | |
Revenues | | | | | | | | | | | | |
| | | |
Personal income tax | | | 113.5 | | | | 113.3 | | | | 0.2 | |
| | | |
Corporate income tax | | | 30.0 | | | | 29.0 | | | | 1.0 | |
| | | |
Non-resident income tax | | | 5.1 | | | | 5.0 | | | | 0.1 | |
| | | |
Other taxes and duties | | | 42.9 | | | | 43.4 | | | | -0.5 | |
| | | |
Employment Insurance premium revenues | | | 17.5 | | | | 17.5 | | | | 0.0 | |
| | | |
Other revenues | | | 28.1 | | | | 27.3 | | | | 0.8 | |
| | | | | | | | | | | | |
Total | | | 237.1 | | | | 235.6 | | | | 1.5 | |
| | | |
Program expenses | | | | | | | | | | | | |
| | | |
Major transfers to persons | | | | | | | | | | | | |
| | | |
Elderly benefits | | | 35.6 | | | | 35.9 | | | | -0.2 | |
| | | |
Employment Insurance benefits | | | 19.9 | | | | 20.1 | | | | -0.3 | |
| | | |
Children’s benefits | | | 12.7 | | | | 12.7 | | | | 0.0 | |
| | | | | | | | | | | | |
Total | | | 68.1 | | | | 68.6 | | | | -0.5 | |
| | | |
Major transfers to other levels of government | | | | | | | | | | | | |
| | | |
Support for health and other social programs | | | 37.2 | | | | 37.2 | | | | 0.0 | |
| | | |
Fiscal arrangements | | | 17.6 | | | | 17.6 | | | | 0.0 | |
| | | |
Canada’s cities and communities | | | 1.8 | | | | 2.0 | | | | -0.2 | |
| | | |
Other transfers | | | 0.2 | | | | 0.0 | | | | 0.2 | |
| | | |
Quebec Abatement | | | -3.8 | | | | -3.7 | | | | 0.0 | |
| | | | | | | | | | | | |
Total | | | 53.0 | | | | 53.0 | | | | -0.1 | |
| | | |
Direct program expenses | | | 118.5 | | | | 119.1 | | | | -0.7 | |
| | | |
Total program expenses | | | 239.6 | | | | 240.8 | | | | -1.2 | |
| | | |
Public debt charges | | | 30.9 | | | | 30.9 | | | | 0.0 | |
| | | |
Budgetary outcome/estimate | | | -33.4 | | | | -36.2 | | | | 2.8 | |
Note: Numbers may not add due to rounding.
| 1 | Comparative figures from the June 2011 budget have been reclassified to conform to the presentation in the audited financial statements. |
27
Independent Auditor’s Report
To the Minister of Finance
The accompanying condensed financial statements, which comprise the condensed statement of financial position as at 31 March 2011, the condensed statement of operations and accumulated deficit, condensed statement of change in net debt and condensed statement of cash flow for the year then ended, and related notes, are derived from the audited financial statements of the Government of Canada for the year ended 31 March 2011. I expressed an unmodified audit opinion on those financial statements in my report dated 1 September 2011.
The condensed financial statements do not contain all the disclosures required by Canadian public sector accounting standards. Reading the condensed financial statements, therefore, is not a substitute for reading the audited financial statements of the Government of Canada.
The Government’s Responsibility for the Condensed Financial Statements
The Government is responsible for the preparation of the condensed financial statements on the basis described in Note 1.
Auditor’s Responsibility
My responsibility is to express an opinion on the condensed financial statements based on my procedures, which were conducted in accordance with Canadian Auditing Standard (CAS) 810, “Engagements to Report on Summary Financial Statements”.
Opinion
In my opinion, the condensed financial statements derived from the audited financial statements of the Government of Canada for the year ended 31 March 2011 are a fair summary of those financial statements, on the basis described in Note 1.
John Wiersema, FCA
Interim Auditor General of Canada
1 September 2011
Ottawa, Canada
28
Condensed Financial Statements
of the Government of Canada
The fundamental purpose of these condensed financial statements is to provide an overview of the financial affairs and resources for which the Government is responsible under authority granted by Parliament. Responsibility for the integrity and objectivity of these statements rests with the Government.
Table 8
Government of Canada
Condensed Statement of Operations and Accumulated Deficit
for the Year Ended March 31, 2011
| | | | | | | | | | | | |
| | | 2011 Budget 1 | | | 2011 Actual | | | 2010
Actual | |
| | | ($ millions) | |
| | | |
Revenues | | | | | | | | | | | | |
| | | |
Income tax revenues | | | 147,980 | | | | 148,563 | | | | 139,601 | |
| | | |
Other taxes and duties | | | 40,965 | | | | 42,903 | | | | 40,573 | |
| | | |
Employment insurance premiums | | | 17,630 | | | | 17,501 | | | | 16,761 | |
| | | |
Other revenues | | | 26,274 | | | | 28,124 | | | | 21,665 | |
| | | | | | | | | | | | |
| | | |
Total revenues | | | 232,849 | | | | 237,091 | | | | 218,600 | |
| | | |
Expenses | | | | | | | | | | | | |
| | | |
Transfer payments | | | | | | | | | | | | |
| | | |
Old age security benefits and related payments | | | 36,658 | | | | 35,629 | | | | 34,653 | |
| | | |
Major transfer payments to other levels of government | | | 56,812 | | | | 52,971 | | | | 56,990 | |
| | | |
Employment insurance benefits | | | 22,624 | | | | 19,850 | | | | 21,586 | |
| | | |
Children’s benefits | | | 12,744 | | | | 12,656 | | | | 12,340 | |
| | | |
Other transfer payments | | | 39,414 | | | | 36,820 | | | | 39,892 | |
| | | | | | | | | | | | |
Total transfer payments | | | 168,252 | | | | 157,926 | | | | 165,461 | |
| | | |
Other program expenses | | | 82,454 | | | | 81,666 | | | | 79,323 | |
| | | | | | | | | | | | |
Total program expenses | | | 250,706 | | | | 239,592 | | | | 244,784 | |
| | | |
Public debt charges | | | 31,341 | | | | 30,871 | | | | 29,414 | |
| | | | | | | | | | | | |
Total expenses | | | 282,047 | | | | 270,463 | | | | 274,198 | |
| | | | | | | | | | | | |
Annual deficit | | | 49,198 | | | | 33,372 | | | | 55,598 | |
| | | |
Accumulated deficit at beginning of year | | | 519,097 | 2 | | | 519,097 | | | | 463,710 | |
| | | |
Other comprehensive income | | | | | | | 2,142 | | | | 211 | |
| | | | | | | | | | | | |
Accumulated deficit at end of year | | | 568,295 | | | | 550,327 | | | | 519,097 | |
The accompanying notes are an integral part of these statements.
| 1 | Derived from Budget 2010. Budget 2010 amounts have been restated to reflect the reclassification of Canadian Commercial Corporation from an enterprise Crown corporation to a consolidated Crown corporation in 2009-2010. This restatement has resulted in a $1,500 million increase in both budgeted other revenues and other program expenses, with no overall impact on the 2010-2011 annual deficit. |
| 2 | Adjusted to the actual closing amount of the previous year. |
29
Table 9
Government of Canada
Condensed Statement of Financial Position
as at March 31, 2011
| | | | | | | | | | |
| | | 2011 | | | 2010 | | | |
| | | ($ millions) | | | |
Liabilities | | | | | | | | | | |
| | | |
Accounts payable and accrued liabilities | | | 119,060 | | | | 120,525 | | | |
| | | |
Interest-bearing debt | | | | | | | | | | |
| | | |
Unmatured debt | | | 591,155 | | | | 559,126 | | | |
| | | |
Pension and other future benefits | | | 204,341 | | | | 197,070 | | | |
| | | |
Other liabilities | | | 6,315 | | | | 6,587 | | | |
| | | | | | | | | | |
Total interest-bearing debt | | | 801,811 | | | | 762,783 | | | |
| | | | | | | | | | |
Total liabilities | | | 920,871 | | | | 883,308 | | | |
| | | |
Financial assets | | | | | | | | | | |
| | | |
Cash and accounts receivable | | | 96,907 | | | | 101,205 | | | |
| | | |
Foreign exchange accounts | | | 48,507 | | | | 46,950 | | | |
| | | |
Loans, investments and advances | | | 158,549 | | | | 152,681 | | | |
| | | | | | | | | | |
Total financial assets | | | 303,963 | | | | 300,836 | | | |
| | | | | | | | | | |
Net debt | | | 616,908 | | | | 582,472 | | | |
| | | |
Non-financial assets | | | | | | | | | | |
| | | |
Tangible capital assets | | | 57,668 | | | | 55,054 | | | |
| | | |
Other | | | 8,913 | | | | 8,321 | | | |
| | | | | | | | | | |
Total non-financial assets | | | 66,581 | | | | 63,375 | | | |
| | | | | | | | | | |
Accumulated deficit | | | 550,327 | | | | 519,097 | | | |
The accompanying notes are an integral part of these statements.
30
Table 10
Government of Canada
Condensed Statement of Change in Net Debt
for the Year Ended March 31, 2011
| | | | | | | | | | | | | | |
| | | 2011 Budget 1 | | | 2011 Actual | | | 2010 Actual | | | |
| | | ($ millions) | | | |
| | | | |
Net debt at beginning of year | | | 582,472 | 2 | | | 582,472 | | | | 525,213 | | | |
| | | | |
Change in net debt during the year | | | | | | | | | | | | | | |
| | | | |
Annual deficit | | | 49,198 | | | | 33,372 | | | | 55,598 | | | |
| | | | |
Acquisition of tangible capital assets | | | 8,185 | | | | 8,061 | | | | 7,136 | | | |
| | | | |
Amortization of tangible capital assets | | | -4,630 | | | | -4,756 | | | | -4,418 | | | |
| | | | |
Other | | | 45 | | | | -99 | | | | -846 | | | |
| | | | | | | | | | | | | | |
Net increase in net debt due to operations | | | 52,798 | | | | 36,578 | | | | 57,470 | | | |
| | | | |
Other comprehensive income | | | | | | | -2,142 | | | | -211 | | | |
| | | | | | | | | | | | | | |
Net increase in net debt | | | 52,798 | | | | 34,436 | | | | 57,259 | | | |
| | | | | | | | | | | | | | |
Net debt at end of year | | | 635,270 | | | | 616,908 | | | | 582,472 | | | |
The accompanying notes are an integral part of these statements.
| 1 | Derived from Budget 2010. |
| 2 | Adjusted to the actual closing amount of the previous year. |
31
Table 11
Government of Canada
Condensed Statement of Cash Flow
for the Year Ended March 31, 2011
| | | | | | | | | | |
| | | |
| | | 2011 | | | 2010 | | | |
| | | ($ millions) | | | |
| | | |
Cash used by operating activities | | | | | | | | | | |
| | | |
Annual deficit | | | -33,372 | | | | -55,598 | | | |
| | | |
Items not affecting cash | | | -8,293 | | | | 18,146 | | | |
| | | | | | | | | | |
| | | -41,665 | | | | -37,452 | | | |
| | | |
Cash used by capital investment activities | | | -7,614 | | | | -6,839 | | | |
| | | |
Cash provided or used (-) by investing activities | | | 2,872 | | | | -27,614 | | | |
| | | | | | | | | | |
Total cash used before financing activities | | | -46,407 | | | | -71,905 | | | |
| | | |
Cash provided by financing activities | | | 32,280 | | | | 53,370 | | | |
| | | | | | | | | | |
Net decrease in cash | | | -14,127 | | | | -18,535 | | | |
| | | |
Cash and cash equivalents at beginning of year | | | 28,450 | | | | 46,985 | | | |
| | | | | | | | | | |
Cash and cash equivalents at end of year | | | 14,323 | | | | 28,450 | | | |
| | | |
Supplementary information | | | | | | | | | | |
Cash used for interest | | | 15,854 | | | | 15,887 | | | |
The accompanying notes are an integral part of these statements.
32
Notes to the Condensed Financial Statements of the
Government of Canada
1. Applied Criteria in the Preparation of the Condensed Financial Statements
The criteria applied by the Government in the preparation of these condensed financial statements are as follows:
| i. | These condensed financial statements are extracted from the audited financial statements included in Section 2 of Volume I of the Public Accounts of Canada 2011, which are expected to be tabled in Parliament later this year. |
| ii. | The condensed financial statements are in agreement with the related information in the audited financial statements and contain the information necessary to avoid distorting or obscuring matters disclosed in the related complete financial statements, including the notes thereto. |
| iii. | As these condensed financial statements are, by their nature, summarized, they do not include all disclosures required by Canadian public sector accounting standards. |
| iv. | Readers interested in the disclosure of more detailed data should refer to the audited financial statements in the Public Accounts of Canada. |
2. Summary of Significant Accounting Policies
The reporting entity of the Government of Canada includes all of the government organizations which comprise the legal entity of the Government as well as other government organizations, including Crown corporations, which are separate legal entities but are controlled by the Government. The financial activities of all of these entities, except for enterprise Crown corporations and other government business enterprises, are consolidated in these financial statements on a line-by-line and uniform basis of accounting after eliminating significant intergovernmental balances and transactions. Enterprise Crown corporations and other government business enterprises, which are not dependent on the Government for financing their activities, are recorded under the modified equity method. The Canada Pension Plan, which includes the assets of the Plan under the administration of the Canada Pension Plan Investment Board, is excluded from the reporting entity because changes to the Plan require the agreement of two thirds of participating provinces and it is therefore not controlled by the Government.
The Government accounts for transactions on an accrual basis, using the Government’s accounting policies that are described in Note 1 to its audited financial statements, which are based on Canadian public sector accounting standards. The use of these stated accounting policies does not result in any significant differences from Canadian public sector accounting standards.
Financial assets recorded on the Condensed Statement of Financial Position can provide resources to discharge liabilities or finance future operations and are recorded at the lower of cost or net realizable value. Non-financial assets cannot normally be converted into cash to finance future operations without disrupting government operations; they are recorded at cost less accumulated amortization. Liabilities are recorded at the estimated amount ultimately payable, adjusted for the passage of time, as required. Obligations for pension and other future benefits are determined on an actuarial basis. Allowances for valuation are established for loans, investments and advances, as well as for loan guarantees and other obligations.
33
Some amounts in these statements are based on estimates and assumptions made by the Government. These are based on facts and circumstances available at the time the estimates and assumptions are made, historical loss experience and general economic conditions. By their nature, such estimates are subject to measurement uncertainty. The effect of changes to such estimates and assumptions in future periods could be significant to the financial statements. Some of the more significant estimates used in these financial statements affect the accrual of tax revenues and obligations for pension and other future benefits.
3. Contractual Obligations
Contractual obligations that will materially affect the level of future expenditures include transfer payment agreements, acquisitions of property and equipment, and goods and services, operating leases and funding of international organizations. At March 31, 2011, contractual obligations amount to $97,619 million ($93,856 million in 2010), of which $26,606 million pertains to fiscal year 2012.
4. Contingent Liabilities
Contingent liabilities arise in the normal course of operations and their ultimate disposition is unknown. The Government’s contingent liabilities include guarantees provided by the Government, callable share capital in international organizations, environmental liabilities, claims and pending and threatened litigation, and insurance programs of agent enterprise Crown corporations.
| i. | Guarantees provided by the Government include guarantees on the borrowings of enterprise Crown corporations and other government business enterprises, loan guarantees, insurance programs managed by the Government, and other explicit guarantees. At March 31, 2011, these guarantees amount to $236,509 million ($221,979 million in 2010) for which an allowance of $592 million ($535 million in 2010) has been recorded. Of the total amount guaranteed, $227,642 million ($211,454 million in 2010) relates to guarantees on the borrowings of agent enterprise Crown corporations for which no allowance (nil in 2010) has been recorded. |
| ii. | The Government has callable share capital in certain international organizations that could require payments to those agencies. At March 31, 2011, callable share capital amounts to $25,479 million ($17,177 million in 2010). |
| iii. | Environmental liabilities are accrued to record the estimated costs related to the remediation of contaminated sites and future asset restoration where the Government is obligated or likely obligated to incur such costs. At March 31, 2011, the Government has recorded environmental liabilities of $7,745 million ($6,602 million in 2010). |
The Government has estimated additional clean-up costs for remediation of contaminated sites for which it may be potentially liable of $1,044 million ($1,512 million in 2010). In addition, the Government has estimated further clearance costs related to unexploded explosive ordnance affected sites ranging from $180 million to $524 million. These costs are not accrued as the Government’s obligation to incur these costs is not determinable.
34
| iv. | There are thousands of claims and pending and threatened litigation cases outstanding against the Government. While the total amount claimed in these actions is significant, their outcomes are not determinable. The Government has recorded an allowance for claims and litigation where it is likely that there will be a future payment and a reasonable estimate of the loss can be made. Claims and litigation for which the outcome is not determinable and a reasonable estimate can be made amount to approximately $4,211 million ($4,300 million in 2010). Certain large and significant claims relate to comprehensive land claims, assessed taxes under objection or appeal, and public sector pension litigation. |
| v. | At March 31, 2011, insurance in force relating to self-sustaining insurance programs operated by three agent enterprise Crown corporations amounts to $1,473,068 million ($1,396,212 million in 2010). The Government expects that all three corporations will cover the cost of both current claims and possible future claims. |
35