EXHIBIT C-7
©Her Majesty the Queen in Right of Canada (2014)
All rights reserved
All requests for permission to reproduce this document or any part thereof
shall be addressed to the Department of Finance Canada.
Cette publication est également disponible en français.
Cat. No.: F1-25/2014E-PDF
ISSN: 1487-0428
| | |
| | |  |
| Annual Financial Report | |
TABLEOF CONTENTS
| | | | |
Report Highlights | | | 5 | |
| |
Revenues | | | 17 | |
| |
Expenses | | | 21 | |
| |
The Budgetary Balance and Financial Source/Requirement | | | 25 | |
| |
Federal Debt | | | 27 | |
| |
Annex — OECD Measure of Total Government Net Debt | | | 29 | |
| |
Report of the Auditor General on the Condensed Consolidated Financial Statements of the Government of Canada | | | 31 | |
| |
Condensed Consolidated Financial Statements of the Government of Canada | | | 33 | |
3
| | |
| | |
| | Fiscal Year 2013–2014 |
NOTETO READERS
The financial results in this report are based on the audited consolidated financial statements of the Government of Canada for the fiscal year ended March 31, 2014, the condensed form of which is included in this report. For the 16th consecutive year, the Government has received an unmodified audit opinion from the Auditor General of Canada on the consolidated financial statements. The complete consolidated financial statements will be set out in the Public Accounts of Canada 2014 when tabled in Parliament.
The Fiscal Reference Tables have been updated to incorporate the results for 2013–14 as well as historical revisions to the National Economic and Financial Accounts published by Statistics Canada.
4
| | |
| | | |
| Annual Financial Report | |
REPORT HIGHLIGHTS
| • | | The Government posted a budgetary deficit of $5.2 billion for the fiscal year ended March 31, 2014, down from a budgetary deficit of $18.4 billion in 2012–13. |
| • | | Revenues increased by $15.0 billion, or 5.9 per cent, from 2012–13, reflecting increases across all revenue streams. Program expenses increased by $2.4 billion, or 1.0 per cent, as increases in major transfers to persons and other levels of government were offset in part by a decrease in direct program expenses. Public debt charges were down $0.7 billion, or 2.3 per cent. |
| • | | Direct program expenses, which include other transfer payments, the operating expenses of government departments and agencies, and the expenses of consolidated Crown corporations, have now decreased for four years in a row. This is the first time this has occurred since 1961–62, the earliest year for which records are available. This decline reflects effective control of government spending. |
| • | | The federal debt (the difference between total liabilities and total assets) stood at $611.9 billion at March 31, 2014. The federal debt-to-GDP (gross domestic product) ratio was 32.5 per cent, down from 33.5 per cent a year earlier. |
| • | | As reported by the Organisation for Economic Co-operation and Development (OECD), Canada’s total government net debt-to-GDP ratio, which includes the net debt of the federal, provincial/territorial and local governments, as well as the net assets held in the Canada Pension Plan and Québec Pension Plan, stood at 40.4 per cent in 2013. This is the lowest level among Group of Seven (G-7) countries, which the OECD expects will record an average net debt of 84.3 per cent of GDP for the same year. |
| • | | For the 16th consecutive year, the Government has received an unmodified audit opinion from the Auditor General of Canada on the consolidated financial statements. |
5
| | |
| | |
| | Fiscal Year 2013–2014 |
Table 1
Financial Highlights
$ billions
| | | | | | | | | | | | |
| | | 2012–13
Restated1 | | 2013–14 |
| | | | |
Budgetary transactions | | | | | | | | | | | | |
Revenues | | | 256.6 | | | | | | 271.7 | | | |
Expenses | | | | | | | | | | | | |
Program expenses | | | 246.2 | | | | | | 248.6 | | | |
Public debt charges | | | 28.9 | | | | | | 28.2 | | | |
Total expenses | | | 275.1 | | | | | | 276.8 | | | |
Budgetary balance | | | -18.4 | | | | | | -5.2 | | | |
Non-budgetary transactions | | | -11.8 | | | | | | 22.7 | | | |
Financial source/requirement | | | -30.2 | | | | | | 17.5 | | | |
Net change in financing activities | | | 40.4 | | | | | | -13.4 | | | |
Net change in cash balances | | | 10.2 | | | | | | 4.1 | | | |
Cash balance at end of period | | | 27.3 | | | | | | 31.4 | | | |
| | | | |
Financial position | | | | | | | | | | | | |
Total liabilities | | | 1,016.1 | | | | | | 1,000.8 | | | |
Total financial assets | | | 337.8 | | | | | | 318.5 | | | |
Net debt | | | 678.3 | | | | | | 682.3 | | | |
Non-financial assets | | | 68.9 | | | | | | 70.4 | | | |
Federal debt (accumulated deficit) | | | 609.4 | | | | | | 611.9 | | | |
| | | | |
Financial results (% of GDP) | | | | | | | | | | | | |
Revenues | | | 14.1 | | | | | | 14.4 | | | |
Program expenses | | | 13.5 | | | | | | 13.2 | | | |
Public debt charges | | | 1.6 | | | | | | 1.5 | | | |
Budgetary balance | | | -1.0 | | | | | | -0.3 | | | |
Federal debt (accumulated deficit) | | | 33.5 | | | | | | 32.5 | | | |
| | | | | | | | | | | | | |
Note: Numbers may not add due to rounding.
| 1 | Certain comparative figures have been restated. Information regarding this restatement can be found in Note 3 of the condensed consolidated financial statements. |
6
| | |
| | | |
| Annual Financial Report | |
Recent Economic Developments1
Five years after the global recession, the global economic environment remains fragile. In this challenging external environment, the Canadian economy has performed well. Canada has led all other G-7 economies in real GDP growth over the recovery. This has translated into one of the strongest job creation performances over the period, with over 1.1 million more Canadians now working than in July 2009, when the recovery began—an increase of 6.6 per cent. Canada’s strong labour market performance over the recovery has been driven by domestic growth, in particular strong business investment early in the recovery and household spending.
However, Canada is not immune to events outside our borders. The global economy has weakened since 2010, and global growth has repeatedly underperformed expectations. While the International Monetary Fund expects global growth to pick up slightly in 2014, it is still expected to be far below its pace four years ago. Moreover, risks remain—from ongoing weakness in Europe to easing momentum in China.
Weak external demand has negatively affected the Canadian economy. Real export growth has been flat for the last two years. Without growth in external demand for Canadian products, there has been less incentive for businesses to increase capacity. As a result, business investment growth has slowed considerably since late 2011. Moreover, external weakness has more recently begun to be reflected in slower employment growth.
Reflecting these developments, nominal GDP—the broadest single measure of the tax base—increased by 3.4 per cent in both 2012 and 2013. Nominal GDP growth in 2013 was broadly in line with the projections in Budget 2013 and Budget 2014. Short- and long-term interest rates have remained at historically low levels over the last two years, and in 2013 were in line with the projections in Budget 2013. Interest rates fell in early 2014, and in the first quarter of 2014 were lower than anticipated at the time of Budget 2014. The unemployment rate declined from 7.2 per cent in 2012 to 7.1 per cent in 2013. Consumer Price Index (CPI) inflation remained below the mid-point of the Bank of Canada’s target band in 2012 and 2013. Reflecting excess slack in the economy and lower commodity prices, CPI inflation in 2013 was lower than projected in Budget 2013.
Looking forward, the largest single risk to the Canadian economy remains the external environment. Global growth remains uncertain and risks are tilted to the downside. Developments in Europe are concerning, the Chinese economy is slowing and U.S. economic growth has been uneven. In addition, recent weakness in Canada’s domestic economy, in particular employment, if sustained, could restrain household and business spending, further dampening overall growth. Moreover, high levels of household debt could cause households to restrain spending more than they otherwise would in the event of a negative external shock.
| 1 | This section incorporates data available up to and including September 30, 2014. |
7
| | |
| | |
| | Fiscal Year 2013–2014 |
Table 2
Average Private Sector Forecasts
per cent
| | | | | | | | | | | | | | |
| | | 2012 | | | 2013 | | | 2014 | | | |
| | | | |
Real GDP growth | | | | | | | | | | | | | | |
March 2013 survey/Budget 2013 | | | 1.8 | | | | 1.6 | | | | 2.5 | | | |
December 2013 survey/Budget 2014 | | | 1.7 | | | | 1.7 | | | | 2.3 | | | |
Actual | | | 1.7 | | | | 2.0 | | | | | | | |
| | | | |
Nominal GDP growth | | | | | | | | | | | | | | |
March 2013 survey/Budget 2013 | | | 3.1 | | | | 3.3 | | | | 4.7 | | | |
December 2013 survey/Budget 2014 | | | 3.4 | | | | 3.2 | | | | 3.9 | | | |
Actual | | | 3.4 | | | | 3.4 | | | | | | | |
| | | | |
3-month treasury bill rate | | | | | | | | | | | | | | |
March 2013 survey/Budget 2013 | | | 1.0 | | | | 1.0 | | | | 1.3 | | | |
December 2013 survey/Budget 2014 | | | 1.0 | | | | 1.0 | | | | 1.0 | | | |
Actual | | | 1.0 | | | | 1.0 | | | | | | | |
| | | | |
10-year government bond rate | | | | | | | | | | | | | | |
March 2013 survey/Budget 2013 | | | 1.9 | | | | 2.1 | | | | 2.8 | | | |
December 2013 survey/Budget 2014 | | | 1.9 | | | | 2.3 | | | | 3.0 | | | |
Actual | | | 1.9 | | | | 2.3 | | | | | | | |
| | | | |
Unemployment rate | | | | | | | | | | | | | | |
March 2013 survey/Budget 2013 | | | 7.2 | | | | 7.1 | | | | 6.9 | | | |
December 2013 survey/Budget 2014 | | | 7.2 | | | | 7.1 | | | | 6.8 | | | |
Actual | | | 7.2 | | | | 7.1 | | | | | | | |
| | | | |
Consumer Price Index inflation | | | | | | | | | | | | | | |
March 2013 survey/Budget 2013 | | | 1.5 | | | | 1.3 | | | | 2.0 | | | |
December 2013 survey/Budget 2014 | | | 1.5 | | | | 1.0 | | | | 1.5 | | | |
Actual | | | 1.5 | | | | 1.0 | | | | | | | |
Source: Actuals, Statistics Canada.
8
| | |
| | | |
| Annual Financial Report | |
The Budgetary Balance
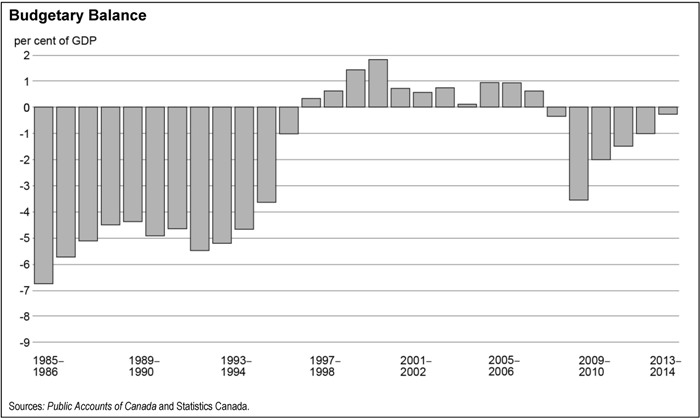
The Government posted a budgetary deficit of $5.2 billion in 2013–14, down from the $18.4-billion deficit recorded in 2012–13.
Revenues were up $15.0 billion, or 5.9 per cent, from the prior year, reflecting increases across all revenue streams.
Expenses were up $1.8 billion, or 0.6 per cent, from the prior year. Program expenses increased by $2.4 billion, reflecting an increase in transfer payments, offset in part by a decrease in other program expenses. Public debt charges decreased by $0.7 billion, or 2.3 per cent, from the prior year, reflecting a lower average effective interest rate on the stock of interest-bearing debt.
To enhance the comparability of financial results over time and across jurisdictions, the budgetary balance and its components are often presented as a percentage of GDP. The following chart shows the budgetary balance as a percentage of GDP since 1985–86. In 2013–14, the deficit was 0.3 per cent of GDP, down from 1.0 per cent a year earlier.
9
| | |
| | |
| | Fiscal Year 2013–2014 |
COMPARISONOF ACTUAL BUDGETARY OUTCOMESTO PROJECTED RESULTS
The Government estimated a deficit of $15.9 billion for 2013–14 in the February 2014 budget, after adjusting for the change in the accounting treatment of unamortized premiums and discounts on bond buybacks, as described in Note 3 of the Condensed Consolidated Financial Statements of the Government of Canada. The final audited budgetary deficit for 2013–14 was $5.2 billion.
Revenues were $7.7 billion higher than expected, reflecting unanticipated gains in all major revenue streams due, in part, to a number of specific one-time factors which raised 2013–14 revenues. These included large one-time income tax assessments and foreign exchange gains, as well as the fact that the $1.5-billion adjustment for risk included in the Budget 2014 projection was not required.
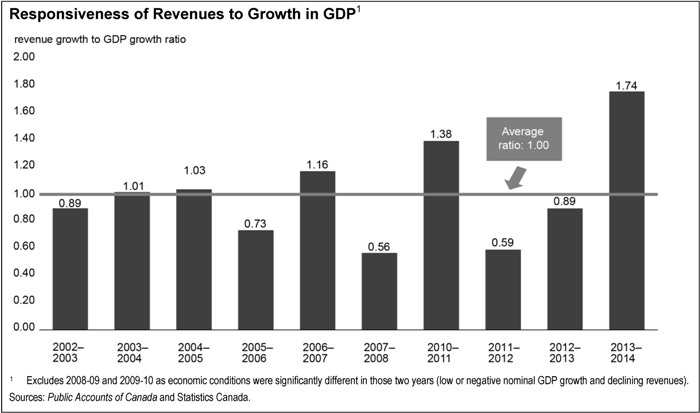
The chart below illustrates how exceptional the growth in revenues has been in 2013��14, when compared to prevailing economic conditions. In 2013–14, the overall revenue growth of 5.9 per cent significantly outpaced growth in nominal GDP of 3.4 per cent, and the ratio between the two measures (1.74)—which indicates how responsive revenues are to increases in nominal GDP—was the highest since the introduction of accrual accounting in 2002–03. This ratio was also well above the average for that period (1.00).
Program expenses were $2.6 billion lower than forecast, largely reflecting lower-than-expected direct program expenses. In particular, the estimated federal liability under the Disaster Financial Assistance Arrangements for assistance related to the 2013 flood in Alberta was $1.2 billion lower than expected, reflecting updated information from the province. The remaining difference is due to lower-than-expected spending by departments.
10
| | |
| | | |
| Annual Financial Report | |
Public debt charges were $0.4 billion lower than forecast, reflecting a lower-than-expected average effective interest rate on the stock of interest-bearing debt, due in part to interest rates in the first quarter of 2014 being lower than expected by private sector economists at the time of Budget 2014.
Table 3
Comparison of Actual Outcomes to February 2014 Budget
$ billions
| | | | | | | | | | |
| | | Actual | | | February 2014 Budget1 | | Difference | | |
| | | | |
Revenues | | | | | | | | | | |
Personal income tax | | | 130.8 | | | 130.1 | | 0.7 | | |
Corporate income tax | | | 36.6 | | | 35.0 | | 1.6 | | |
Non-resident income tax | | | 6.4 | | | 5.5 | | 0.9 | | |
Other taxes and duties | | | 46.1 | | | 44.8 | | 1.4 | | |
Employment Insurance premium revenues | | | 21.8 | | | 21.5 | | 0.3 | | |
Other revenues | | | 30.0 | | | 27.1 | | 2.8 | | |
Total | | | 271.7 | | | 264.0 | | 7.7 | | |
Program expenses | | | | | | | | | | |
Major transfers to persons | | | | | | | | | | |
Elderly benefits | | | 41.8 | | | 41.8 | | 0.0 | | |
Employment Insurance benefits | | | 17.3 | | | 17.0 | | 0.3 | | |
Children’s benefits | | | 13.1 | | | 13.2 | | 0.0 | | |
Total | | | 72.2 | | | 72.0 | | 0.2 | | |
Major transfers to other levels of government | | | | | | | | | | |
Support for health and other social programs | | | 42.8 | | | 42.5 | | 0.3 | | |
Fiscal arrangements | | | 15.6 | | | 15.9 | | -0.3 | | |
Gas Tax Fund | | | 2.1 | | | 2.1 | | 0.0 | | |
Total | | | 60.5 | | | 60.5 | | 0.0 | | |
Direct program expenses | | | 115.9 | | | 118.7 | | -2.8 | | |
Total program expenses | | | 248.6 | | | 251.2 | | -2.6 | | |
Public debt charges | | | 28.2 | | | 28.6 | | -0.4 | | |
Budgetary outcome/estimate | | | -5.2 | | | -15.9 | | 10.7 | | |
Note: Numbers may not add due to rounding.
| 1 | To enhance comparability with actual 2013–14 results, Budget 2014 amounts have been adjusted to reflect the change in the Government’s accounting policy for bond buyback operations in 2013–14. This restatement has resulted in a $696-million decrease in budgeted public debt charges and a corresponding decrease in the budgeted 2013–14 annual deficit. |
11
| | |
| | |
| | Fiscal Year 2013–2014 |
Federal Debt
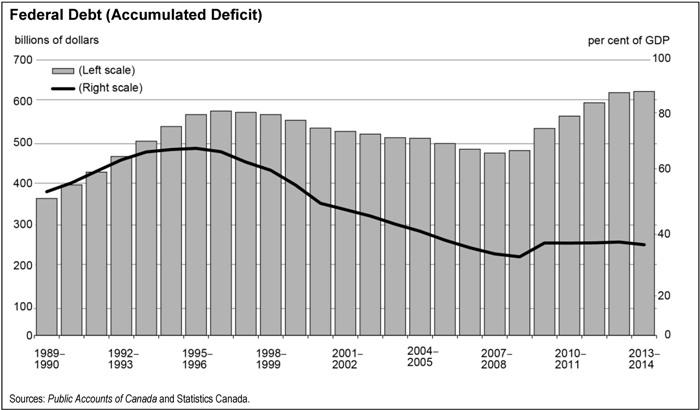
The federal debt (accumulated deficit) is the difference between the Government’s total liabilities and its total assets. At the end of 2013–14, the federal debt stood at $611.9 billion.
Table 4
Federal Debt (Accumulated Deficit)
$ millions
| | | | | | | | | | | | | | | | | | |
| | | 2012–13
Restated1 | | 2013–14 | | Net change |
| | | | | | |
Federal debt at beginning of year – as previously reported | | | 583,576 | | | | | | 602,441 | | | | | | 18,865 | | | |
Unamortized premiums and discounts on the buyback of bonds | | | 5,669 | | | | | | 5,387 | | | | | | -282 | | | |
Loans expected to be repaid from future appropriations | | | 1,795 | | | | | | 1,563 | | | | | | -232 | | | |
Federal debt at beginning of year – as restated | | | 591,040 | | | | | | 609,391 | | | | | | 18,351 | | | |
Annual deficit | | | 18,415 | | | | | | 5,150 | | | | | | -13,265 | | | |
Other comprehensive income | | | -64 | | | | | | -2,660 | | | | | | -2,596 | | | |
Federal debt at end of year | | | 609,391 | | | | | | 611,881 | | | | | | 2,490 | | | |
| | | | | | | | | | | | | | | | | | | |
Note: Numbers may not add due to rounding.
| 1 | Additional information regarding this restatement can be found in Note 3 of the condensed consolidated financial statements. |
The opening balance of the federal debt in 2012–13 and 2013–14 has been restated to reflect two accounting changes in 2013–14. The first change is a change in the accounting policy for unamortized premiums and discounts arising on the buyback of bonds. Previously, premiums and discounts arising on the Government’s buybacks of bonds that are subsequently refinanced were deferred and amortized over the shorter of the remaining life of the old debt or the new debt. Under the Government’s new accounting policy, when bonds are extinguished as a result of their repurchase or exchange, premiums and discounts arising on the buyback of bonds are recognized immediately in public debt charges. This change in accounting policy has been applied on a retroactive basis, resulting in a $5.7-billion increase in the opening balance of the federal debt in 2012–13, a $5.4-billion increase in the opening balance of the federal debt in 2013–14, and a $0.3-billion decrease in the 2012–13 annual deficit.
The second change is a correction to the Government’s valuation allowance for social housing program loans that are expected to be repaid through future appropriations for federal financial assistance to the borrowers. During 2013–14, the Government performed a detailed review of the valuation allowance calculation and determined that the allowance established in prior years did not take into account all relevant loans receivable. Consequently, the Government has adjusted the valuation allowance accordingly, resulting in a retroactive restatement of prior years’ balances. This restatement has resulted in a $1.8-billion increase in the opening balance of the federal debt in 2012–13, a $1.6-billion increase in the opening balance of the federal debt in 2013–14, and a $0.2-billion decrease in the 2012–13 annual deficit.
The federal debt increased by $2.5 billion in 2013–14, reflecting the 2013–14 $5.2-billion budgetary deficit, offset in part by $2.7 billion in other comprehensive income. The $2.7 billion in other comprehensive income largely reflects $0.9 billion in net unrealized gains on available-for-sale financial assets, including gains on the revaluation of the Government’s holdings of General Motors common shares, and $1.8 billion in net actuarial gains on pension and other employee future benefits recorded by enterprise Crown corporations and other government business enterprises.
12
| | |
| | | |
| Annual Financial Report | |
The following chart shows the federal debt as a percentage of GDP since 1989–90. The federal debt stood at 32.5 per cent of GDP in 2013–14, down from 33.5 per cent in 2012–13 and less than half of its post-World War II peak of 67.1 per cent at March 31, 1996.
13
| | |
| | |
| | Fiscal Year 2013–2014 |
Measures of Government Debt
The consolidated financial statements of the Government of Canada are presented on an accrual basis of accounting. On this basis, there are several generally accepted definitions of government debt.
Net debt represents the total liabilities of the Government less its financial assets. Financial assets include cash and cash equivalents, accounts receivable, foreign exchange accounts, and loans, investments and advances.
The accumulated deficit is equal to total liabilities less total assets—both financial and non-financial. Non-financial assets include tangible capital assets, such as land and buildings, inventories and prepaid expenses. The annual change in the accumulated deficit is equal to the budgetary balance plus other comprehensive income or loss.
Other comprehensive income or loss represents certain unrealized gains and losses on financial instruments and certain actuarial gains and losses related to pensions and other employee future benefits reported by enterprise Crown corporations and other government business enterprises. In accordance with Canadian public sector accounting standards, other comprehensive income or loss is not included in the Government’s annual budgetary balance, but is instead recorded directly to the accumulated deficit.
The federal debt, referred to in the budget documents and the Annual Financial Report of the Government of Canada, is the accumulated deficit. It is the federal government’s main measure of debt. The following table shows net debt and the federal debt at March 31, 2014.
Net Debt and the Federal Debt at March 31, 2014
| | | | | | | | |
| | | ($ billions) | | | (% of GDP) | |
| | |
Total liabilities | | | 1,000.8 | | | | 53.2 | |
Less: Financial assets | | | 318.5 | | | | 16.9 | |
Net debt | | | 682.3 | | | | 36.3 | |
Less: Non-financial assets | | | 70.4 | | | | 3.7 | |
Federal debt (accumulated deficit) | | | 611.9 | | | | 32.5 | |
Note: Numbers may not add due to rounding.
14
| | |
| | | |
| Annual Financial Report | |
Net Debt
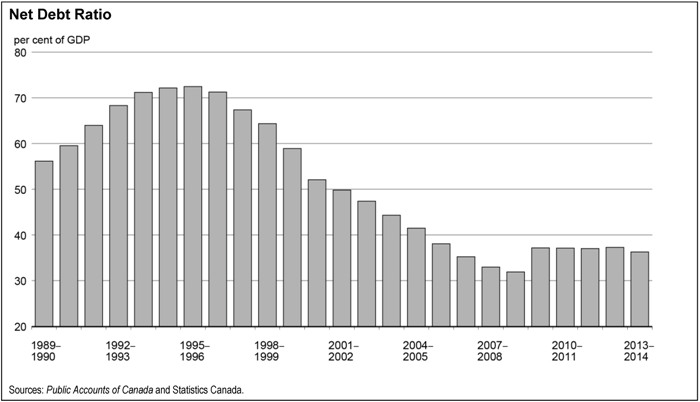
The net debt is the difference between the Government’s total liabilities and its financial assets. Under this measure of debt, liabilities are reduced only by financial assets as non-financial assets cannot normally be converted to cash to pay off the debt without disrupting government operations. At the end of 2013–14, the Government’s net debt stood at $682.3 billion, up $4.0 billion from 2012–13.
The net debt ratio, net debt expressed as a percentage of GDP, measures debt relative to the ability of the country’s taxpayers to finance it. The following chart shows the net debt ratio since 1989–90. The ratio stood at 36.3 per cent in 2013–14, down from 37.3 per cent a year earlier, and down by nearly half from its peak of 72.5 per cent in the mid-1990s.
15
| | |
| | |
| | Fiscal Year 2013–2014 |
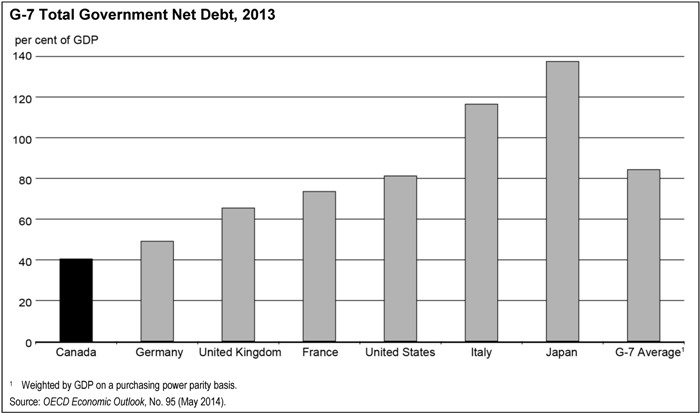
International Comparisons of Government Debt
International comparisons of net debt are made on a total government, National Accounts basis, which for Canada includes the net debt of federal, provincial/territorial and local governments, as well as the net assets held in the Canada Pension Plan and Québec Pension Plan. Further details on the calculation of Canada’s net debt, along with a reconciliation of federal net debt on a National Accounts basis and a Public Accounts basis, are provided in the annex.
Canada’s total government net debt-to-GDP ratio stood at 40.4 per cent in 2013, as shown in the following chart. This is the lowest level among G-7 countries and is less than half of the G-7 average, which the OECD estimates will be 84.3 per cent of GDP for the same year.
Financial Source/Requirement
The financial source/requirement measures the difference between cash coming in to the Government and cash going out. It differs from the budgetary balance, which measures revenues and expenses as they are earned or incurred rather than when the associated cash is received or paid.
There was a financial source of $17.5 billion in 2013–14, compared to a financial requirement of $30.2 billion in 2012–13. This change is largely due to the repayment of principal on assets maturing under the Insured Mortgage Purchase Program (IMPP) administered by Canada Mortgage and Housing Corporation (CMHC).
16
| | |
| | | |
| Annual Financial Report | |
REVENUES
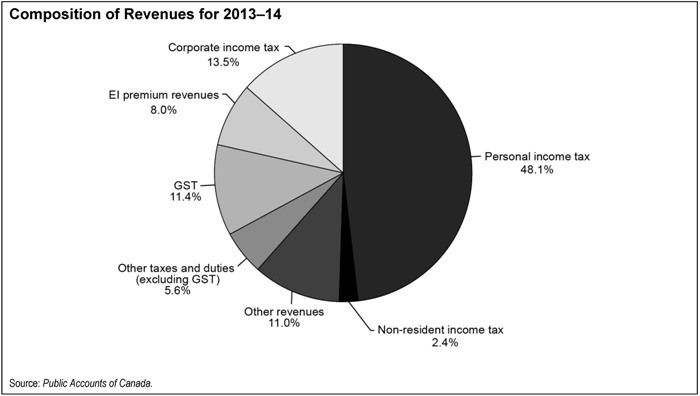
Revenues totalled $271.7 billion in 2013–14, up $15.0 billion, or 5.9 per cent, from 2012–13 (Table 5), reflecting increases across all revenue streams.
The following chart illustrates the composition of revenues for 2013–14. The largest source of federal revenues is personal income tax revenues, which accounted for 48.1 per cent of total revenues in 2013–14. The second largest source was corporate income tax revenues at 13.5 per cent. Goods and Services Tax (GST) revenues were 11.4 per cent of revenues while other taxes and duties were 5.6 per cent. Employment Insurance (EI) premium revenues contributed 8.0 per cent of revenues and non-resident income tax revenues made up 2.4 per cent. Other revenues, which include net profits from enterprise Crown corporations, revenues of consolidated Crown corporations, revenues from sales of goods and services, returns on investments, net foreign exchange revenues and miscellaneous revenues, contributed 11.0 per cent of revenues in 2013–14.
Personal income tax revenues increased by $5.1 billion, or 4.0 per cent, in 2013–14, reflecting gains in personal income.
Corporate income tax revenues increased by $1.6 billion, or 4.6 per cent, reflecting growth in corporate taxable income.
Non-resident income tax revenues were up $1.3 billion, or 26.2 per cent, due in part to large one-time assessments relating to the current and prior years.
17
| | |
| | |
| | Fiscal Year 2013–2014 |
Other taxes and duties increased by $2.6 billion, or 5.9 per cent, driven by a $2.2-billion, or 7.6-per-cent, increase in GST revenues, reflecting growth in household spending and moderate growth in the GST credit. Energy taxes increased by $0.1 billion, customs import duties rose by $0.3 billion, and other excise taxes and duties increased by $43 million.
EI premium revenues increased by $1.4 billion, or 6.7 per cent, reflecting growth in insurable earnings.
Other revenues increased by $3.1 billion, or 11.4 per cent. This increase was attributable to a variety of factors including:
| • | | a $1.5-billion increase in interest and penalties, due in part to large prior-year tax reassessments and higher tax receivables; |
| • | | a $1.0-billion increase in profits of enterprise Crown corporations and other government business enterprises, largely reflecting the $0.7-billion gain realized by the Canada Development Investment Corporation on the Government’s sale of 30 million shares of General Motors common stock in September 2013; |
| • | | a $0.6-billion gain on the March 27, 2014 sale of Macdonald House, a Canadian High Commission property in London; |
| • | | a $0.5-billion increase in net foreign exchange revenues and foreign exchange gains; and, |
| • | | a $0.4-billion increase in the Government’s revenues from the sales of goods and services. |
These increases were offset in part by a $0.5-billion decrease in interest revenues from the Government’s loans to enterprise Crown corporations, largely reflecting the repayment of principal on assets maturing under the IMPP, and a $0.6-billion decrease in revenues from commercial trading transactions of the Canadian Commercial Corporation (CCC). Note that this decrease in CCC’s revenues is offset by a corresponding decrease in the corporation’s expenses related to commercial trading transactions, which are recorded under Crown corporation expenses (see the “Expenses” section below).
18
| | |
| | | |
| Annual Financial Report | |
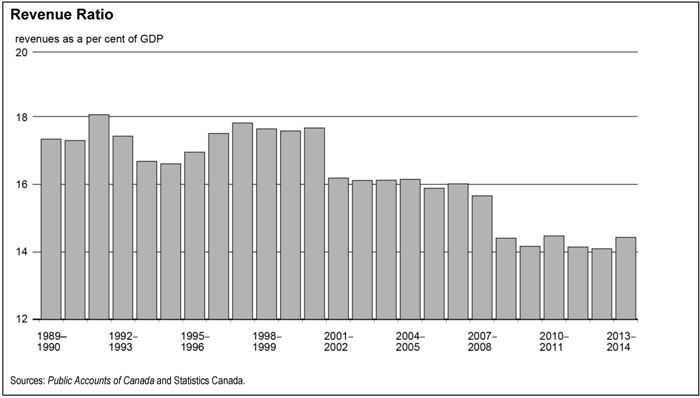
The revenue ratio—revenues as a percentage of GDP—compares the total of all federal revenues to the size of the economy. This ratio is influenced by changes in statutory tax rates and by economic developments. The following chart illustrates the revenue ratio since 1989–90. The ratio stood at 14.4 per cent in 2013–14, up from 14.1 per cent in 2012–13. This increase was attributable to strong growth in all major revenue streams, which was due in part to specific one-time factors. Notably, in 2013–14 revenue growth of 5.9 per cent significantly outpaced nominal GDP growth of 3.4 per cent, and the ratio between the two measures (1.74)—which indicates how responsive revenues are to increases in nominal GDP—was the highest since the introduction of accrual accounting in 2002–03. Overall, the revenue ratio has declined since 2001–02, and is down significantly from an average of nearly 18 per cent over the 1996–97 to 2000–01 period. This longer-term decline is due primarily to tax reduction measures.
19
| | |
| | |
| | Fiscal Year 2013–2014 |
Table 5
Revenues
| | | | | | | | | | |
| | | 2012–13 | | 2013–14 | | Net change | | |
| | | ($ millions) | | ($ millions) | | ($ millions) | | (%) | | |
| | | | | |
Tax revenues | | | | | | | | | | |
Income tax | | | | | | | | | | |
Personal | | 125,728 | | 130,811 | | 5,083 | | 4.0 | | |
Corporate | | 34,986 | | 36,587 | | 1,601 | | 4.6 | | |
Non-resident | | 5,073 | | 6,404 | | 1,331 | | 26.2 | | |
Total | | 165,787 | | 173,802 | | 8,015 | | 4.8 | | |
Other taxes and duties | | | | | | | | | | |
Goods and Services Tax | | 28,821 | | 30,998 | | 2,177 | | 7.6 | | |
Energy taxes | | 5,381 | | 5,486 | | 105 | | 2.0 | | |
Customs import duties | | 3,979 | | 4,239 | | 260 | | 6.5 | | |
Other excise taxes and duties | | 5,370 | | 5,413 | | 43 | | 0.8 | | |
Total | | 43,551 | | 46,136 | | 2,585 | | 5.9 | | |
Total tax revenues | | 209,338 | | 219,938 | | 10,600 | | 5.1 | | |
| | | | | |
Employment Insurance premium revenues | | 20,395 | | 21,766 | | 1,371 | | 6.7 | | |
| | | | | |
Other revenues | | | | | | | | | | |
Crown corporations | | 11,448 | | 11,455 | | 7 | | 0.1 | | |
Other programs | | 13,952 | | 16,836 | | 2,884 | | 20.7 | | |
Net foreign exchange | | 1,502 | | 1,682 | | 180 | | 12.0 | | |
Total | | 26,902 | | 29,973 | | 3,071 | | 11.4 | | |
| Total revenues | | 256,635 | | 271,677 | | 15,042 | | 5.9 | | |
Note: Numbers may not add due to rounding.
20
| | |
| | | |
| Annual Financial Report | |
EXPENSES
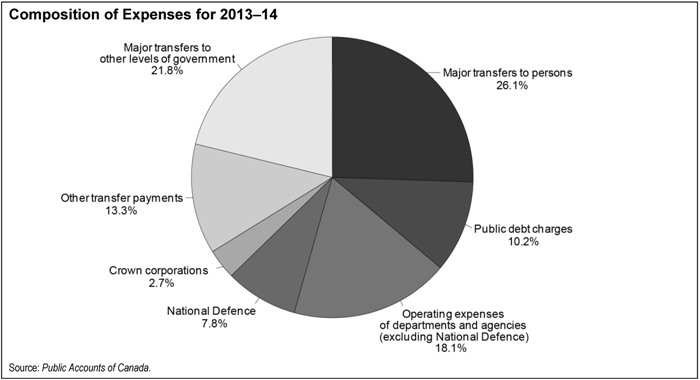
Expenses consist of program expenses and public debt charges. In 2013–14, expenses amounted to $276.8 billion, up $1.8 billion, or 0.6 per cent, from 2012–13.
The chart below shows the composition of expenses for 2013–14. Major transfers to persons (elderly, EI and children’s benefits) and major transfers to other levels of government (the Canada Health Transfer, the Canada Social Transfer, fiscal arrangements, Gas Tax Fund transfers and other transfers) were the two largest components of expenses in 2013–14, representing 26.1 per cent and 21.8 per cent of expenses, respectively.
The remaining elements of program expenses (other transfer payments, Crown corporation expenses, and operating expenses of departments and agencies) make up the Government’s direct program expenses. Operating expenses of government departments and agencies, excluding National Defence, made up 18.1 per cent of total expenses in 2013–14. Operating expenses include items such as salaries and benefits, amortization of facilities and equipment, and supplies. Operating expenses of National Defence accounted for 7.8 per cent of expenses. Other transfer payments, which include transfers to Aboriginal peoples, assistance to farmers, students and businesses, support for research and development, and foreign aid and international assistance, made up 13.3 per cent of total expenses in 2013–14, and Crown corporation expenses accounted for 2.7 per cent of expenses.
Public debt charges amounted to 10.2 per cent of expenses in 2013–14. This is down from a peak of nearly 30 per cent in the mid-1990s, when public debt charges were the largest component of spending.
21
| | |
| | |
| | Fiscal Year 2013–2014 |
Program expenses amounted to $248.6 billion in 2013–14, up $2.4 billion, or 1.0 per cent, from 2012–13 (Table 6).
Within program expenses, major transfers to persons increased by $1.9 billion, or 2.7 per cent, in 2013–14.
| • | | Elderly benefits consist of Old Age Security and Guaranteed Income Supplement and Allowance payments. Total benefits were up $1.5 billion, or 3.8 per cent, reflecting growth in the elderly population and changes in consumer prices, to which benefits are fully indexed. |
| • | | EI benefits consist of regular benefits, special benefits (sickness, maternity, parental, adoption and fishing) and work-sharing agreements. Total benefits increased by $0.2 billion, or 1.2 per cent. |
| • | | Children’s benefits, which include the Canada Child Tax Benefit and the Universal Child Care Benefit, increased by $0.2 billion, or 1.2 per cent. |
Major transfers to other levels of government include the Canada Health Transfer (CHT), the Canada Social Transfer (CST), fiscal arrangements (Equalization, transfers to the territories, a number of smaller transfer programs and the Quebec Abatement), Gas Tax Fund transfers, and other transfers. These transfers increased by $2.1 billion, or 3.6 per cent, in 2013–14.
| • | | The CHT and CST—block-funded transfers—support health care, post-secondary education, social assistance and social services, including early childhood development. These programs provide support in the form of cash and tax transfers to the provinces and territories. Transfers in support of health and other social programs increased by $2.0 billion, reflecting legislated growth. |
| • | | Total entitlements under fiscal arrangements increased by $15 million, as legislated growth in Equalization and Territorial Formula Financing payments was largely offset by a decrease in total transfer protection payments and an increase in the value of personal tax points under the Quebec Abatement. |
| • | | Gas Tax Fund transfers increased by $0.1 billion. |
| • | | Other transfers decreased by $39 million. |
Direct program expenses include other transfer payments to individuals and other organizations not included in major transfers to persons and other levels of government, and other direct program expenses, which consist of operating expenses of National Defence, other departments and agencies, and expenses of consolidated Crown corporations. Direct program expenses decreased by $1.6 billion, or 1.3 per cent, in 2013–14. These expenses have now decreased for four years in a row, the first time this has occurred since 1961–62, the earliest year for which records are available. This decline reflects effective control of government spending.
| • | | Other transfer payments increased by $1.8 billion, or 5.3 per cent, in 2013–14. This increase largely reflects disaster assistance related to the 2013 flood in Alberta and an increase in expenses associated with the revaluation of the Government’s liability to Ontario for the province’s one-third participation in the value of the Government’s equity holdings in General Motors. |
| • | | Other direct program expenses decreased from $82.6 billion in 2012–13 to $79.2 billion in 2013–14, down $3.4 billion, or 4.1 per cent. |
| | – | Expenses related to Crown corporations decreased by $2.0 billion, or 21.3 per cent, largely reflecting a $1.5-billion decrease in expenses related to Atomic Energy of Canada Limited’s liability for nuclear decommissioning and waste management, as well as a $0.6-billion decrease in expenses related to commercial trading transactions of the Canadian Commercial Corporation. |
22
| | |
| | | |
| Annual Financial Report | |
| | – | National Defence expenses decreased by $1.5 billion, or 6.4 per cent, reflecting in part expenses recorded in 2012–13 due to changes in the Service Income Security Insurance Plan, as well as a decrease in amortization expenses and losses due to write-offs and write-downs of assets. |
| | – | All other departmental and agency expenses increased by $0.1 billion, or 0.2 per cent. |
Public debt charges decreased by $0.7 billion, or 2.3 per cent, to $28.2 billion in 2013–14, reflecting a lower average effective interest rate on the stock of interest-bearing debt.
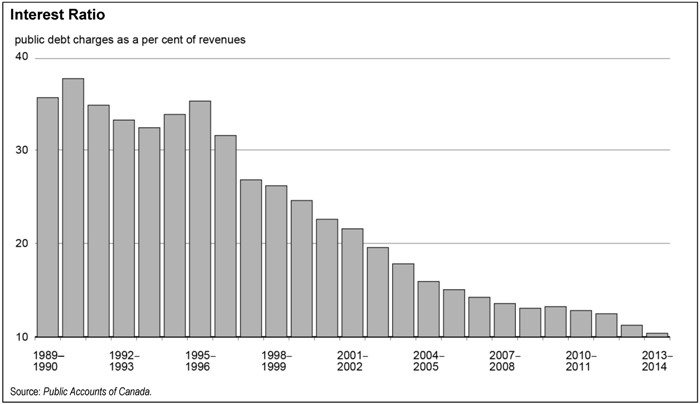
The following chart illustrates the interest ratio (public debt charges as a percentage of revenues) since 1989–90. This ratio has been decreasing in recent years, falling from a peak of 37.6 per cent in 1990–91 to 10.4 per cent in 2013–14. This means that, in 2013–14, the Government spent approximately 10 cents of every revenue dollar on interest on the public debt. The lower the ratio, the more flexibility the Government has to address the key priorities of Canadians.
23
| | |
| | |
| | Fiscal Year 2013–2014 |
Table 6
Expenses
| | | | | | | | | | | | | | | | | | |
| | | 2012–13
Restated1 | | | 2013–14 | | | Net change | | | |
| | | ($ millions) | | | ($ millions) | | | ($ millions) | | | (%) | | | |
| | | | | |
Major transfers to persons | | | | | | | | | | | | | | | | | | |
Elderly benefits | | | 40,255 | | | | 41,786 | | | | 1,531 | | | | 3.8 | | | |
Employment Insurance benefits | | | 17,099 | | | | 17,300 | | | | 201 | | | | 1.2 | | | |
Children’s benefits | | | 12,975 | | | | 13,136 | | | | 161 | | | | 1.2 | | | |
Total | | | 70,329 | | | | 72,222 | | | | 1,893 | | | | 2.7 | | | |
| | | | | |
Major transfers to other levels of government | | | | | | | | | | | | | | | | | | |
Support for health and other social programs | | | 40,772 | | | | 42,758 | | | | 1,986 | | | | 4.9 | | | |
Fiscal arrangements | | | 15,595 | | | | 15,610 | | | | 15 | | | | 0.1 | | | |
Gas Tax Fund | | | 1,964 | | | | 2,107 | | | | 143 | | | | 7.3 | | | |
Other transfers | | | 39 | | | | 0 | | | | -39 | | | | -100.0 | | | |
Total | | | 58,370 | | | | 60,475 | | | | 2,105 | | | | 3.6 | | | |
| | | | | |
Direct program expenses | | | | | | | | | | | | | | | | | | |
Other transfer payments | | | 34,862 | | | | 36,698 | | | | 1,836 | | | | 5.3 | | | |
Other direct program expenses | | | | | | | | | | | | | | | | | | |
Crown corporations | | | 9,512 | | | | 7,484 | | | | -2,028 | | | | -21.3 | | | |
National Defence | | | 22,978 | | | | 21,511 | | | | -1,467 | | | | -6.4 | | | |
All other departments and agencies | | | 50,128 | | | | 50,217 | | | | 89 | | | | 0.2 | | | |
Total other direct program expenses | | | 82,618 | | | | 79,212 | | | | -3,406 | | | | -4.1 | | | |
Total direct program expenses | | | 117,480 | | | | 115,910 | | | | -1,570 | | | | -1.3 | | | |
Total program expenses | | | 246,179 | | | | 248,607 | | | | 2,428 | | | | 1.0 | | | |
Public debt charges | | | 28,871 | | | | 28,220 | | | | -651 | | | | -2.3 | | | |
Total expenses | | | 275,050 | | | | 276,827 | | | | 1,777 | | | | 0.6 | | | |
Note: Numbers may not add due to rounding.
| 1 | Certain comparative figures have been restated. Information regarding this restatement can be found in Note 3 of the condensed consolidated financial statements. |
24
| | |
| | | |
| Annual Financial Report | |
THE BUDGETARY BALANCEAND FINANCIAL SOURCE/REQUIREMENT
The budgetary balance is the most comprehensive measure of the federal government’s fiscal results. It is presented on an accrual basis of accounting, recording government expenses when they are incurred, regardless of when the cash payment is made, and recording tax revenues when earned, regardless of when the cash is received.
In contrast, the financial source/requirement measures the difference between cash coming in to the Government and cash going out. It differs from the budgetary balance in that it includes cash transactions in loans, investments and advances, public sector pensions, other specified purpose accounts, foreign exchange activities, and changes in other financial assets, liabilities and non-financial assets. These activities are included as part of non-budgetary transactions.
Non-budgetary transactions also include adjustments for the effects of non-cash items included in the budgetary balance and for any accruals of past or future cash receipts or payments. Examples of non-cash items include amortization of tangible capital assets, pension expenses not funded in the period, and the recognition of previously deferred revenue.
Non-budgetary transactions resulted in a net source of funds amounting to $22.7 billion in 2013–14, compared to a net requirement for funds of $11.8 billion in 2012–13. This change largely reflects the repayment of principal on assets maturing under the IMPP.
With a budgetary deficit of $5.2 billion and a net source from non-budgetary transactions of $22.7 billion, there was a financial source of $17.5 billion in 2013–14, compared to a financial requirement of $30.2 billion in 2012–13 (Table 7).
The Government used this financial source of $17.5 billion to reduce unmatured debt by $13.4 billion and increase its cash balances by $4.1 billion.
Cash balances at the end of March 2014 stood at $31.4 billion, up $4.1 billion from their level at the end of March 2013, reflecting increased cash balances held under the prudential liquidity plan. In Budget 2011, the Government announced its intention to increase its liquidity position by $35 billion over a three-year period beginning in 2011–12. The increased liquidity is held in the form of foreign exchange reserves and government deposits with financial institutions and the Bank of Canada. With full implementation of the prudential liquidity plan in 2013–14, the Government’s overall liquidity levels are now sufficient to cover at least one month of net projected cash flows, including coupon payments and debt refinancing needs.
25
| | |
| | |
| | Fiscal Year 2013–2014 |
Table 7
Budgetary Balance, Financial Source/Requirement and Net Financing Activities
$ billions
| | | | | | |
| | | 2012–13
Restated1 | | 2013–14 | | |
| | | |
Deficit for the year | | -18.4 | | -5.2 | | |
| | | |
Non-budgetary transactions | | | | | | |
Pensions and other liabilities | | | | | | |
Public sector pensions | | 2.8 | | 1.4 | | |
Other employee and veteran future benefits | | 5.4 | | 4.1 | | |
Other liabilities | | -0.9 | | -0.1 | | |
Total | | 7.3 | | 5.4 | | |
| | | |
Non-financial assets | | -1.0 | | -1.5 | | |
| | | |
Loans, investments and advances | | -3.7 | | 39.9 | | |
| | | |
Other transactions | | | | | | |
Accounts payable, receivable, accruals and allowances | | -12.6 | | -7.7 | | |
Foreign exchange activities | | -1.8 | | -13.5 | | |
Total | | -14.3 | | -21.2 | | |
| | | |
Total non-budgetary transactions | | -11.8 | | 22.7 | | |
| | | |
Financial source/requirement | | -30.2 | | 17.5 | | |
| | | |
Net change in financing activities | | | | | | |
Marketable bonds (Canadian currency) | | 20.9 | | 4.3 | | |
Treasury bills | | 17.5 | | -27.7 | | |
Retail debt | | -1.4 | | -1.2 | | |
Other | | 3.4 | | 11.1 | | |
Total | | 40.4 | | -13.4 | | |
| | | |
Change in cash balances | | 10.2 | | 4.1 | | |
| | | |
Cash at end of year | | 27.3 | | 31.4 | | |
Note: Numbers may not add due to rounding.
| 1 | Certain comparative figures have been restated. Information regarding this restatement can be found in Note 3 of the condensed consolidated financial statements. |
26
| | |
| | | |
| Annual Financial Report | |
FEDERAL DEBT
Liabilities
The Government’s liabilities consist of interest-bearing debt and accounts payable and accrued liabilities. Interest-bearing debt includes unmatured debt, liabilities for pensions and other future benefits, and other liabilities. At March 31, 2014, interest-bearing debt amounted to $889.4 billion, down $8.0 billion from a year earlier (Table 8). Within interest-bearing debt, unmatured debt decreased by $13.4 billion while liabilities for pensions and other future benefits increased by $5.5 billion. Other liabilities, which include deposit and trust accounts and other specified purpose accounts, decreased by $0.1 billion. The decrease in unmatured debt largely reflects a $19.3-billion decrease in market debt, mainly treasury bills, offset in part by a $5.7-billion increase in the value of cross-currency swap revaluations. The decrease in market debt reflects lower financing requirements due to the repayment of principal on assets maturing under the IMPP, offset in part by financial requirements associated with the budgetary deficit and the implementation of the Government’s prudential liquidity plan.
Accounts payable and accrued liabilities amounted to $111.4 billion at March 31, 2014, down $7.3 billion from the close of 2012–13. This decrease is mainly due to a reduction in other accounts payable and accrued liabilities and amounts payable to taxpayers. Other accounts payable and accrued liabilities decreased by $5.8 billion in 2013–14, driven in large part by a $4.1-billion decrease in accounts payable and a $1.6-billion decrease in liabilities under provincial, territorial and Aboriginal tax collection agreements. The decrease in accounts payable is due to a number of factors including the payment of the $1.5-billion final installment to Quebec for sales tax harmonization assistance accrued in 2011–12 and a $1.1-billion decrease in the allowance for claims under Indian and Northern Affairs Canada, reflecting in part the payment of claimant awards related to the Indian Residential Schools Settlement. The decrease in liabilities under tax collection agreements reflects the settlement of prior years’ tax assessments and timing differences. Amounts payable to taxpayers decreased by $2.3 billion in 2013–14, from $54.9 billion at March 31, 2013 to $52.6 billion at March 31, 2014, reflecting a decrease in amounts payable in respect of corporate income tax and Goods and Services Tax, due in part to British Columbia transitioning out of the Harmonized Sales Tax framework.
Assets
The Government’s assets consist of financial assets (cash and other accounts receivable, including tax receivables, foreign exchange accounts, and loans, investments and advances) and non-financial assets (tangible capital assets, inventories and prepaid expenses). Financial assets totalled $318.5 billion at March 31, 2014, down $19.4 billion from March 31, 2013. Cash and other accounts receivable increased by $4.0 billion, largely reflecting increased cash balances held under the prudential liquidity plan. Tax receivables increased by $0.4 billion. Foreign exchange accounts increased by $13.5 billion, due mainly to growth in foreign exchange reserves held in the Exchange Fund Account, reflecting $6.9 billion in foreign exchange gains and $6.9 billion in additional advances to the Account during the year. Under the Government’s prudential liquidity plan, liquid foreign exchange reserves will continue to rise sufficiently to maintain their level at or above 3 per cent of GDP. The Government’s investments in enterprise Crown corporations and other government business enterprises increased by $3.4 billion, reflecting $5.9 billion in net profits and $2.7 billion in other comprehensive income recorded by these corporations and enterprises during 2013–14, offset in part by $5.2 billion in dividends paid to the Government. Loans and advances to enterprise Crown corporations decreased by $39.9 billion in 2013–14, due mainly to a decrease in loans to Crown corporations under the consolidated borrowing framework. This decrease was driven by the repayment of principal on assets maturing under the IMPP administered by CMHC. Other loans, investments and advances decreased by $0.3 billion.
27
| | |
| | |
| | Fiscal Year 2013–2014 |
The Government’s net debt (total liabilities less financial assets) stood at $682.3 billion at March 31, 2014, up $4.0 billion from March 31, 2013.
Non-financial assets amounted to $70.4 billion at March 31, 2014, up $1.5 billion from March 31, 2013.
Federal Debt (Accumulated Deficit)
With total liabilities of $1.0 trillion, financial assets of $318.5 billion and non-financial assets of $70.4 billion, the federal debt (accumulated deficit) stood at $611.9 billion at March 31, 2014, up $2.5 billion from March 31, 2013. The federal debt stood at 32.5 per cent of GDP at March 31, 2014, down from 33.5 per cent the previous year.
Table 8
Outstanding Debt at Year-End
$ billions
| | | | | | |
| | | 2012–13
Restated1 | | 2013–14 | | |
| | | |
Liabilities | | | | | | |
Accounts payable and accrued liabilities | | 118.7 | | 111.4 | | |
Interest-bearing debt | | | | | | |
Unmatured debt | | 672.4 | | 659.0 | | |
Pensions and other future benefits | | 219.0 | | 224.5 | | |
Other liabilities | | 6.0 | | 5.9 | | |
Total interest-bearing debt | | 897.4 | | 889.4 | | |
Total liabilities | | 1,016.1 | | 1,000.8 | | |
| | | |
Financial assets | | | | | | |
Cash and other accounts receivable | | 32.0 | | 36.1 | | |
Tax receivables | | 92.1 | | 92.5 | | |
Foreign exchange accounts | | 58.8 | | 72.3 | | |
Loans, investments and advances | | 154.9 | | 117.6 | | |
Total financial assets | | 337.8 | | 318.5 | | |
Net debt | | 678.3 | | 682.3 | | |
| | | |
Non-financial assets | | | | | | |
Tangible capital assets | | 60.2 | | 61.9 | | |
Inventories | | 7.5 | | 7.3 | | |
Prepaid expenses | | 1.2 | | 1.2 | | |
Total non-financial assets | | 68.9 | | 70.4 | | |
Federal debt (accumulated deficit) | | 609.4 | | 611.9 | | |
Note: Numbers may not add due to rounding.
| 1 | Certain comparative figures have been restated. Information regarding this restatement can be found in Note 3 of the condensed consolidated financial statements. |
28
| | |
| | | |
| Annual Financial Report | |
ANNEX
OECD MEASUREOF TOTAL GOVERNMENT NET DEBT
International comparisons of net debt are made on a total government, National Accounts basis, which for Canada includes the net debt of federal, provincial/territorial and local governments, as well as the net assets held in the Canada Pension Plan (CPP) and Québec Pension Plan (QPP).
The following table provides a breakdown of Canada’s net debt for 2012, the most recent complete year for which historical estimates have been published by the OECD.
Table 9
OECD Measure of Total Government Net Debt on a National Accounts Basis, 2012
| | | | | | |
| | | ($ billions) | | (% of GDP) | | |
| | | |
Total federal net debt | | 532.1 | | 29.2 | | |
Add: Net debt of provincial/territorial and local governments | | 475.1 | | 26.1 | | |
Less: Net assets of the CPP/QPP | | 213.3 | | 11.7 | | |
| Total government net debt | | 793.9 | | 43.6 | | |
Note: Numbers may not add due to rounding.
Source: Statistics Canada.
The primary differences between National Accounts federal net debt as published by the OECD and federal net debt on a Public Accounts basis relate to the Government’s liabilities for federal public sector pensions and other future benefits and the basis of measurement for total federal net debt. With respect to public sector pensions and other future benefits, these liabilities are excluded from the measurement of Canada’s net debt for international comparison purposes as the vast majority of advanced economies do not record such liabilities. With respect to the basis of measurement, National Accounts federal net debt as published by the OECD values assets and liabilities at their current market value, meaning the value of the debt tends to rise when interest rates fall. Federal net debt on a Public Accounts basis is generally measured on the basis of historical cost, in accordance with Canadian public sector accounting standards. The following table presents a reconciliation between the two measures of federal net debt.
Table 10
Reconciliation of Federal Net Debt on a National Accounts and a Public Accounts Basis
| | | | | | |
| | | ($ billions) | | (% of GDP) | | |
| | | |
Net debt (Public Accounts basis) | | 678.3 | | 37.3 | | |
Less: Liabilities for public sector pensions | | 151.7 | | 8.3 | | |
Less: Liabilities for other future benefits | | 67.3 | | 3.7 | | |
Add: Conversion to market value of total federal net debt | | 68.1 | | 3.7 | | |
Add: Other1 | | 4.7 | | 0.3 | | |
Total federal net debt (National Accounts basis) | | 532.1 | | 29.2 | | |
Note: Numbers may not add due to rounding.
| 1 | Other includes timing differences (National Accounts data are as of December 31), differences in the universe covered by each accounting system, and differences in accounting treatments of various transactions such as capital gains. |
Sources: Statistics Canada and Public Accounts of Canada.
29

INDEPENDENT AUDITOR’S REPORT
To the Minister of Finance
The accompanying condensed consolidated financial statements, which comprise the condensed consolidated statement of financial position as at 31 March 2014, the condensed consolidated statement of operations and accumulated deficit, condensed consolidated statement of change in net debt and condensed consolidated statement of cash flow for the year then ended, and related notes, are derived from the audited consolidated financial statements of the Government of Canada for the year ended 31 March 2014. I expressed an unmodified audit opinion on those consolidated financial statements in my report dated 4 September 2014.
The condensed consolidated financial statements do not contain all the disclosures required by Canadian public sector accounting standards. Reading the condensed consolidated financial statements, therefore, is not a substitute for reading the audited consolidated financial statements of the Government of Canada.
The Government’s Responsibility for the Condensed Consolidated Financial Statements
The Government is responsible for the preparation of the condensed consolidated financial statements on the basis described in Note 1.
Auditor’s Responsibility
My responsibility is to express an opinion on the condensed consolidated financial statements based on my procedures, which were conducted in accordance with Canadian Auditing Standard (CAS) 810, “Engagements to Report on Summary Financial Statements”.
Opinion
In my opinion, the condensed consolidated financial statements derived from the audited consolidated financial statements of the Government of Canada for the year ended 31 March 2014 are a fair summary of those consolidated financial statements, on the basis described in Note 1.

Michael Ferguson, CPA, CA
FCA (New Brunswick)
Auditor General of Canada
4 September 2014
Ottawa, Canada
|
|
2 4 0 r u e S p a r k s S t r e e t , O t t a w a , O n t a r i o K 1 A 0 G 6 |
| | |
| | | |
| Annual Financial Report | |
CONDENSED CONSOLIDATED FINANCIAL STATEMENTS
OFTHE GOVERNMENTOF CANADA
The fundamental purpose of these condensed consolidated financial statements is to provide an overview of the financial affairs and resources for which the Government is responsible under authority granted by Parliament. Responsibility for the integrity and objectivity of these condensed consolidated financial statements rests with the Government.
Table 11
Government of Canada
Condensed Consolidated Statement of Operations and Accumulated Deficit
for the Year Ended March 31, 2014
$ millions
| | | | | | | | | | | | | | |
| | | 2014
Budget
(Note 4) | | | 2014
Actual | | | 2013
Actual
Restated
(Note 3) | | | |
| | | | |
Revenues | | | | | | | | | | | | | | |
Income tax revenues | | | 171,505 | | | | 173,802 | | | | 165,787 | | | |
Other taxes and duties | | | 44,879 | | | | 46,136 | | | | 43,551 | | | |
Employment insurance premiums | | | 21,887 | | | | 21,766 | | | | 20,395 | | | |
Other revenues | | | 26,223 | | | | 29,973 | | | | 26,902 | | | |
Total revenues | | | 264,494 | | | | 271,677 | | | | 256,635 | | | |
| | | | |
Expenses | | | | | | | | | | | | | | |
Transfer payments | | | | | | | | | | | | | | |
Old age security benefits and related payments | | | 41,964 | | | | 41,786 | | | | 40,255 | | | |
Major transfer payments to other levels of government | | | 60,254 | | | | 60,475 | | | | 58,370 | | | |
Employment insurance benefits | | | 18,311 | | | | 17,300 | | | | 17,099 | | | |
Children’s benefits | | | 13,126 | | | | 13,136 | | | | 12,975 | | | |
Other transfer payments | | | 37,386 | | | | 36,698 | | | | 34,862 | | | |
Total transfer payments | | | 171,041 | | | | 169,395 | | | | 163,561 | | | |
Other program expenses | | | 82,414 | | | | 79,212 | | | | 82,618 | | | |
Total program expenses | | | 253,455 | | | | 248,607 | | | | 246,179 | | | |
Public debt charges | | | 29,048 | | | | 28,220 | | | | 28,871 | | | |
Total expenses | | | 282,503 | | | | 276,827 | | | | 275,050 | | | |
| | | | |
Annual deficit | | | 18,009 | | | | 5,150 | | | | 18,415 | | | |
| | | | |
Accumulated deficit at beginning of year – as previously reported | | | | | | | 602,441 | | | | 583,576 | | | |
| | | | |
Accounting changes and restatement (Note 3) | | | | | | | | | | | | | | |
Unamortized premiums and discounts on the buy-back of bonds | | | | | | | 5,387 | | | | 5,669 | | | |
Loans expected to be repaid from future appropriations | | | | | | | 1,563 | | | | 1,795 | | | |
| | | | |
Accumulated deficit at beginning of year – as restated | | | 609,391 | 1 | | | 609,391 | | | | 591,040 | | | |
| | | | |
Other comprehensive income | | | | | | | (2,660 | ) | | | (64 | ) | | |
| | | | |
Accumulated deficit at end of year | | | 627,400 | | | | 611,881 | | | | 609,391 | | | |
The accompanying notes are an integral part of these condensed consolidated financial statements.
| 1 | Adjusted to the actual closing amount of the previous year. |
33
| | |
| | |
| | Fiscal Year 2013–2014 |
Table 12
Government of Canada
Condensed Consolidated Statement of Financial Position
as at March 31, 2014
$ millions
| | | | | | | | | | |
| | | 2014 | | | 2013
Restated
(Note 3) | | | |
| | | |
Liabilities | | | | | | | | | | |
Accounts payable and accrued liabilities | | | 111,421 | | | | 118,744 | | | |
Interest-bearing debt | | | | | | | | | | |
Unmatured debt | | | 658,958 | | | | 672,387 | | | |
Pensions and other future benefits | | | 224,492 | | | | 218,968 | | | |
Other liabilities | | | 5,914 | | | | 6,046 | | | |
Total interest-bearing debt | | | 889,364 | | | | 897,401 | | | |
Total liabilities | | | 1,000,785 | | | | 1,016,145 | | | |
| | | |
Financial assets | | | | | | | | | | |
Cash and accounts receivable | | | 128,574 | | | | 124,154 | | | |
Foreign exchange accounts | | | 72,262 | | | | 58,759 | | | |
Loans, investments and advances | | | 117,635 | | | | 154,919 | | | |
Total financial assets | | | 318,471 | | | | 337,832 | | | |
Net debt | | | 682,314 | | | | 678,313 | | | |
| | | |
Non-financial assets | | | | | | | | | | |
Tangible capital assets | | | 61,942 | | | | 60,241 | | | |
Other | | | 8,491 | | | | 8,681 | | | |
Total non-financial assets | | | 70,433 | | | | 68,922 | | | |
Accumulated deficit | | | 611,881 | | | | 609,391 | | | |
Contractual obligations and contingent liabilities (Notes 5 and 6) | | | | | | | | | | |
The accompanying notes are an integral part of these condensed consolidated financial statements.
34
| | |
| | | |
| Annual Financial Report | |
Table 13
Government of Canada
Condensed Consolidated Statement of Change in Net Debt
for the Year Ended March 31, 2014
$ millions
| | | | | | | | | | | | | | |
| | | 2014
Budget
(Note 4) | | | 2014
Actual | | | 2013
Actual
Restated
(Note 3) | | | |
| | | | |
Net debt at beginning of year – as previously reported | | | | | | | 671,363 | | | | 651,535 | | | |
| | | | |
Accounting changes and restatement (Note 3) | | | | | | | | | | | | | | |
Unamortized premiums and discounts on the buy-back of bonds | | | | | | | 5,387 | | | | 5,669 | | | |
Loans expected to be repaid from future appropriations | | | | | | | 1,563 | | | | 1,795 | | | |
Net debt at beginning of year – as restated | | | 678,313 | 1 | | | 678,313 | | | | 658,999 | | | |
| | | | |
Change in net debt during the year | | | | | | | | | | | | | | |
Annual deficit | | | 18,009 | | | | 5,150 | | | | 18,415 | | | |
Acquisition of tangible capital assets | | | 7,886 | | | | 7,129 | | | | 7,175 | | | |
Amortization of tangible capital assets | | | (5,333 | ) | | | (4,865 | ) | | | (5,184 | ) | | |
Other | | | (400 | ) | | | (753 | ) | | | (1,028 | ) | | |
Net increase in net debt due to operations | | | 20,162 | | | | 6,661 | | | | 19,378 | | | |
Other comprehensive income | | | | | | | (2,660 | ) | | | (64 | ) | | |
Net increase in net debt | | | 20,162 | | | | 4,001 | | | | 19,314 | | | |
Net debt at end of year | | | 698,475 | | | | 682,314 | | | | 678,313 | | | |
The accompanying notes are an integral part of these condensed consolidated financial statements.
| 1 | Adjusted to the actual closing amount of the previous year. |
35
| | |
| | |
| | Fiscal Year 2013–2014 |
Table 14
Government of Canada
Condensed Consolidated Statement of Cash Flow
for the Year Ended March 31, 2014
$ millions
| | | | | | | | | | |
| | | 2014 | | | 2013
Restated
(Note 3) | | | |
| | | |
Cash used by operating activities | | | | | | | | | | |
Annual deficit | | | (5,150 | ) | | | (18,415 | ) | | |
Items not affecting cash | | | (9,370 | ) | | | (3,205 | ) | | |
| | | (14,520 | ) | | | (21,620 | ) | | |
Cash used by capital investment activities | | | (6,254 | ) | | | (6,768 | ) | | |
Cash provided by investing activities | | | 43,989 | | | | 1,106 | | | |
Cash (used) or provided by financing activities | | | (19,127 | ) | | | 37,480 | | | |
Net increase in cash | | | 4,088 | | | | 10,198 | | | |
Cash and cash equivalents at beginning of year | | | 27,341 | | | | 17,143 | | | |
Cash and cash equivalents at end of year | | | 31,429 | | | | 27,341 | | | |
Supplementary information | | | | | | | | | | |
Cash used for interest | | | 16,123 | | | | 16,411 | | | |
The accompanying notes are an integral part of these condensed consolidated financial statements.
36
| | |
| | | |
| Annual Financial Report | |
Notes to the Condensed Consolidated Financial Statements
of the Government of Canada
1. Applied Criteria in the Preparation of the Condensed Consolidated Financial Statements
The criteria applied by the Government in the preparation of these condensed consolidated financial statements are as follows:
| i. | These condensed consolidated financial statements are extracted from the audited consolidated financial statements included in Section 2 of Volume I of the Public Accounts of Canada 2014, which are expected to be tabled in Parliament later this year. |
| ii. | The condensed consolidated financial statements are in agreement with the related information in the audited consolidated financial statements and contain the information necessary to avoid distorting or obscuring matters disclosed in the related complete consolidated financial statements, including the notes thereto. |
| iii. | As these condensed consolidated financial statements are, by their nature, summarized, they do not include all disclosures required by Canadian public sector accounting standards. |
| iv. | Readers interested in the disclosure of more detailed data should refer to the audited consolidated financial statements in the Public Accounts of Canada. |
2. Summary of Significant Accounting Policies
The reporting entity of the Government of Canada includes all of the government organizations which comprise the legal entity of the Government as well as other government organizations, including Crown corporations, which are separate legal entities but are controlled by the Government. The financial activities of all of these entities, except for enterprise Crown corporations and other government business enterprises, are consolidated in these financial statements on a line-by-line and uniform basis of accounting after eliminating significant inter-governmental balances and transactions. Enterprise Crown corporations and other government business enterprises, which are not dependent on the Government for financing their activities, are recorded under the modified equity method. The Canada Pension Plan (CPP), which includes the assets of the CPP under the administration of the Canada Pension Plan Investment Board, is excluded from the reporting entity because changes to the CPP require the agreement of two thirds of participating provinces and it is therefore not controlled by the Government.
The Government accounts for transactions on an accrual basis, using the Government’s accounting policies that are described in Note 1 to its audited consolidated financial statements, which are based on Canadian public sector accounting standards. The presentation and results using the stated accounting policies do not result in any significant differences from Canadian public sector accounting standards.
Financial assets recorded on the Condensed Consolidated Statement of Financial Position can provide resources to discharge liabilities or finance future operations and are recorded at the lower of cost or net realizable value. Non-financial assets cannot normally be converted into cash to finance future operations without disrupting government operations; they are recorded at cost less accumulated amortization. Liabilities are recorded at the estimated amount ultimately payable, adjusted for the passage of time, as required. Obligations for pensions and other future benefits are measured on an actuarial basis. Allowances for valuation are established for loans, investments and advances, as well as for loan guarantees and other obligations.
37
| | |
| | |
| | Fiscal Year 2013–2014 |
Some amounts in these condensed consolidated financial statements are based on estimates and assumptions made by the Government. They are based on facts and circumstances available at the time estimates and assumptions are made, historical loss experience and general economic conditions. By their nature, these estimates are subject to measurement uncertainty. The effect of changes to such estimates and assumptions in future periods could be significant to the condensed consolidated financial statements. Significant estimates used in the condensed consolidated financial statements affect the accrual of tax revenues and the related amounts receivable and payable, including the allowance for doubtful accounts and liabilities under provincial and territorial tax collection agreements, valuation allowances for loans, investments and advances, obligations for public sector pensions and other employee and veteran future benefits, contingent liabilities, environmental liabilities and other transfer payments.
3. Accounting Changes and Restatement
i. Restatement due to a change in accounting policy for unamortized premiums and discounts arising on the buy-back of bonds
The Government of Canada engages in bond buy-back operations in which bonds are exchanged or repurchased and refinanced with similar debt with the intent of sustaining market liquidity. Previously, premiums and discounts arising on the repurchase of bonds in these transactions were deferred and amortized over the remaining life of the old debt or the life of the new debt, whichever was shorter. In 2014, the Government ascertained that the source of Generally Accepted Accounting Principles on which this policy was based was no longer relevant. Consequently, a change to the accounting policy was considered necessary in order to provide a more appropriate presentation of these transactions that aligns with the guidance on derecognition of financial liabilities in the approved Public Sector Accounting Standard PS 3450, Financial Instruments, and with comparable guidance of other standard setters with similar conceptual frameworks. The Government will adopt PS 3450 on April 1, 2016, in accordance with the transitional provisions of that standard.
Under the new accounting policy for bond buy-back transactions, an exchange or repurchase of debt is considered to be an extinguishment of the financial liability when the transaction is a repurchase of bonds, or when there is an exchange of debt with an existing holder and the terms of the replacement debt are substantially different to those of the original debt. When the financial liability is extinguished, the difference between the carrying amount of the debt instrument and the net consideration paid is recognized in public debt charges. This change in accounting policy has been applied to the Government’s financial statements on a retroactive basis.
As a result of this restatement, the opening balances of unmatured debt, net debt and the accumulated deficit of the Government of Canada have increased by $5,387 million ($5,669 million in 2013) creating a decrease in the 2013 annual deficit of $282 million.
ii. Restatement of loans expected to be repaid through future appropriations
The Government of Canada provides loans to external borrowers pursuant to its Social Housing Programs. Some of these loans will be repaid through future appropriations of the Government under various subsidy programs which provide funds directly related to the repayment of the loan. When loans are expected to be wholly or partially repaid through future appropriations provided by the Government, a valuation allowance is established in the Government’s condensed consolidated financial statements to reflect the portion of the loans receivable that do not meet the definition of financial assets.
38
| | |
| | | |
| Annual Financial Report | |
In fiscal year 2014, the Government performed a detailed review of the loans receivable for which a valuation allowance is required. It was determined that the valuation allowance established in prior years did not take into account all relevant loans receivable that are expected to be wholly or partially repaid through future appropriations. Consequently, the Government has corrected the valuation allowance accordingly, resulting in a retroactive restatement of prior years’ balances.
As a result of this restatement, the opening balance of Loans, Investments and Advances has decreased by $1,563 million ($1,795 million in 2013) and the opening balances of net debt and the accumulated deficit of the Government of Canada have increased by $1,563 million ($1,795 million in 2013), creating a decrease in the 2013 annual deficit of $232 million.
In addition, from time to time, the Government refines or modifies the model used to estimate the percentage of loans expected to be repaid through future appropriations. As part of the detailed review noted above, the Government updated its model during the current year. The valuation allowance for loans expected to be repaid through future appropriations increased by $762 million as a result of this change in estimate.
4. Source of Budget Amounts
The budget amounts included in the Condensed Consolidated Statement of Operations and Accumulated Deficit and the Condensed Consolidated Statement of Change in Net Debt are derived from the amounts that were budgeted for 2014 in the March 2013 Budget Plan (Budget 2013). To enhance comparability with actual 2014 results, Budget 2013 amounts have been restated to reflect the reclassification of interest owed to taxpayers from interest income to expenses in the Public Accounts of Canada 2013. This restatement has resulted in a $603 million increase in budgeted other revenues and a $603 million increase in budgeted other program expenses, with no overall impact on the budgeted 2014 annual deficit. Budget 2013 amounts have also been adjusted to reflect the restatement of unamortized premiums and discounts arising on the buy-back of bonds. This restatement has resulted in a $696 million decrease in budgeted public debt charges and a corresponding decrease in the budgeted 2014 annual deficit.
Since actual opening numbers of the accumulated deficit and net debt were not available at the time of preparation of Budget 2013, the corresponding amounts in the budget column have been adjusted to the actual closing numbers of the previous year.
5. Contractual Obligations
The nature of government activities results in large multi-year contracts and agreements, including international treaties, protocols and agreements of various size and importance. Any financial obligations resulting from these are recorded as a liability when the terms of these contracts or agreements for the acquisition of goods and services or the provision of transfer payments are met.
Contractual obligations that will materially affect the level of future expenditures include transfer payment agreements, acquisitions of property and equipment, and goods and services, operating leases and funding of international organizations. At March 31, 2014, contractual obligations amount to $91,263 million ($72,040 million in 2013), of which $25,683 million pertains to fiscal year 2015.
39
| | |
| | |
| | Fiscal Year 2013–2014 |
6. Contingent Liabilities
Contingent liabilities arise in the normal course of operations and their ultimate disposition is unknown. The Government’s contingent liabilities include guarantees provided by the Government, callable share capital in international organizations, environmental liabilities, claims and pending and threatened litigation, and insurance programs of agent enterprise Crown corporations.
| i. | Guarantees provided by the Government include guarantees on the borrowings of enterprise Crown corporations and other government business enterprises, loan guarantees, insurance programs managed by the Government, and other explicit guarantees. At March 31, 2014, the principal amount outstanding for guarantees provided by the Government amounts to $407,039 million ($392,119 million in 2013) for which an allowance of $386 million ($428 million in 2013) has been recorded. Of the total amount guaranteed, $245,223 million ($243,581 million in 2013) relates to guarantees on the borrowings of agent enterprise Crown corporations for which no allowance (nil in 2013) has been recorded. |
| ii. | The Government has callable share capital in certain international organizations that could require payments to those agencies. At March 31, 2014, callable share capital amounts to $28,217 million ($26,094 million in 2013). |
| iii. | Environmental liabilities are accrued to record estimated costs related to the remediation of contaminated sites, future asset restoration obligations and unexploded explosive ordnance (UXO) affected sites where the Government is obligated or likely obligated to incur such costs. At March 31, 2014, the Government has recorded environmental liabilities of $11,143 million ($10,600 million in 2013). |
The Government’s ongoing efforts to assess contaminated sites, future asset restoration obligations and UXO affected sites may result in additional environmental liabilities related to newly identified sites or changes in the assessments of existing sites. Any additional liabilities will be accrued in the year in which they become known and can be reasonably estimated.
| iv. | There are thousands of claims and pending and threatened litigation cases outstanding against the Government. While the total amount claimed in these actions is significant, their outcomes are not determinable. The Government has recorded an allowance for claims and litigation where it is likely that there will be a future payment and a reasonable estimate of the loss can be made. Claims and litigation for which the outcome is not determinable and for which an amount has not been accrued are estimated at approximately $7,300 million ($7,041 million in 2013). Certain large and significant claims relate to comprehensive land claims, specific claims, and assessed taxes under objection or appeal. |
| v. | At March 31, 2014, insurance in force relating to self-sustaining insurance programs operated by three agent enterprise Crown corporations amounts to $1,642,950 million ($1,622,793 million in 2013). The Government expects that all three corporations will cover the cost of both current claims and possible future claims. |
7. Subsequent Event
On February 13, 2014, Industry Canada completed its 700 megahertz (MHz) wireless spectrum licence auction, which will raise $5,270 million in revenue over the 20 year term of the licences. Under the terms of the auction, provisional winners paid $1,070 million within 10 business days of the announcement of the results. This amount was recorded as deferred revenue and reported on the Condensed Consolidated Statement of Financial Position. The remaining $4,200 million was received on April 2, 2014 and recorded as deferred revenue in the 2015 fiscal year. Deferred revenue from the auction will be recognized as other revenue on the Condensed Consolidated Statement of Operations and Accumulated Deficit on a straight-line basis over the 20 year term of the licences.
40