|
EXHIBIT C-9 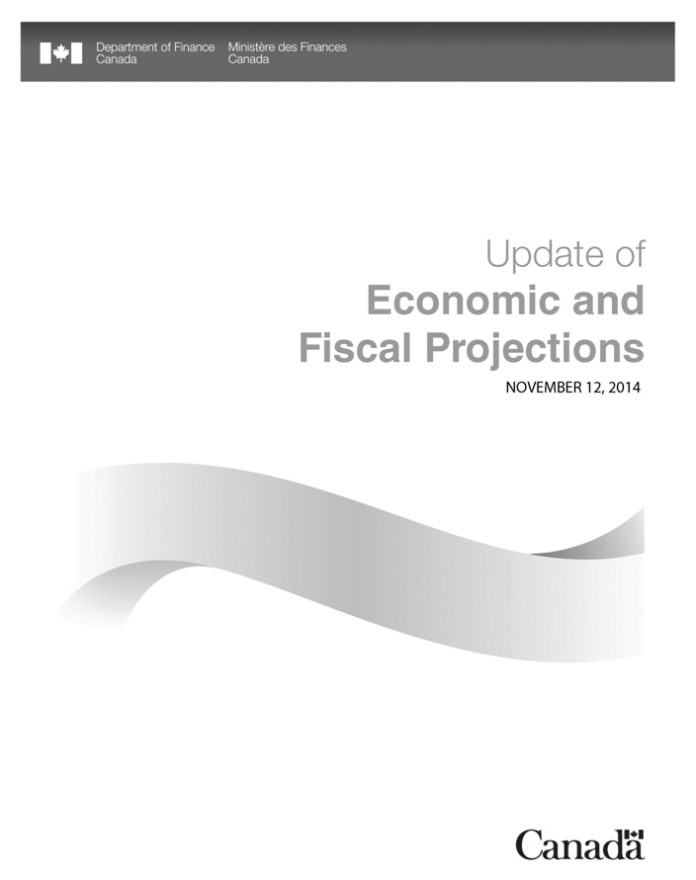
|
©Her Majesty the Queen in Right of Canada (2014)
All rights reserved
All requests for permission to reproduce this document or any part thereof
shall be addressed to the Department of Finance Canada.
Cette publication est également disponible en français.
Cat. No.: F1-37/2014E-PDF
TABLEOF CONTENTS
| | | | |
Highlights | | | 5 | |
| |
Chapter 1 — Creating Jobs and Growth and Supporting
Families in a Fragile Global Economy | | | 7 | |
| |
Supporting Canadian Families | | | 11 | |
| |
Supporting Businesses | | | 14 | |
| |
Returning to Balanced Budgets | | | 14 | |
| |
Chapter 2 — Economic Developments and Prospects | | | 17 | |
| |
Introduction | | | 17 | |
| |
Global Economic Developments and Outlook | | | 18 | |
| |
Financial Market Developments | | | 24 | |
| |
Commodity Prices | | | 26 | |
| |
Canada’s Economic Performance | | | 30 | |
| |
Canadian Economic Outlook — Private Sector Forecasts | | | 40 | |
| |
Adjustment to the September Survey of Private Sector Economists | | | 44 | |
| |
Risk Assessment | | | 45 | |
| |
Planning Assumptions | | | 48 | |
| |
Chapter 3 — Fiscal Situation and Outlook | | | 49 | |
| |
Fiscal Planning Assumptions | | | 49 | |
| |
Changes in the Fiscal Outlook Since Budget 2014 | | | 50 | |
| |
Summary Statement of Transactions | | | 54 | |
| |
Outlook for Budgetary Revenues | | | 57 | |
| |
Outlook for Program Expenses | | | 61 | |
| |
Risks to the Fiscal Projections | | | 65 | |
| |
Sensitivity of the Budgetary Balance to Economic Shocks | | | 65 | |
| |
Annex — Update of Long-Term Economic and Fiscal Projections | | | 69 | |
| |
Long-Term Economic and Fiscal Projections | | | 69 | |
| |
Methodology and Key Assumptions | | | 75 | |
| |
Detailed Fiscal Projections | | | 78 | |
| |
Sensitivity Analysis | | | 79 | |
| | |
| | |  |
| Update of Economic and Fiscal Projections | |
HIGHLIGHTS
| • | | Since 2006, the Government’s low-tax plan for jobs and growth has focused on creating jobs and growing our economy, keeping taxes low and supporting Canadian families. |
| • | | Five years after the global recession, despite ongoing uncertainty and an uneven global economy, the Government’s low-tax plan for jobs and growth continues to deliver results for Canadians. |
| • | | Indeed, not only has the Canadian economy performed well since 2009, outpacing most of its Group of Seven (G-7) peers, but the International Monetary Fund and the Organisation for Economic Co-operation and Development expect Canada to be among the strongest growing economies in the G-7 over this year and next. |
| • | | The Government’s low-tax plan to support jobs and growth is underpinned by a track record of sound fiscal management and a plan to return to balanced budgets in 2015. The Government is on track to meet this goal. |
| • | | But balancing the budget is not an end in itself. It is a means to further increase Canada’s economic potential, improve employment opportunities for Canadians and raise our standard of living. |
| • | | With balanced budgets in sight, the Government can now continue delivering on its commitment to provide further tax relief for Canadian families and businesses. |
| • | | On October 30, the Government announced its intention to increase and expand the Universal Child Care Benefit, introduce the Family Tax Cut and increase the Child Care Expense Deduction dollar limits to provide additional tax relief and enhanced benefits for hard-working Canadian families. Earlier in October, the Government announced its intention to double the Children’s Fitness Tax Credit and make it refundable, thereby making it more affordable for Canadian families to enroll their children in fitness activities. |
| • | | Taken together, these recently proposed initiatives amount to close to $27 billion of additional tax relief and benefits for families for this and the next five years. |
| • | | The Government also remains committed to help businesses thrive and create well-paid jobs for Canadians. To that end, in September it proposed to introduce the new Small Business Job Credit, which will make hiring new workers or investing in additional training easier for entrepreneurs and help them grow their businesses. |
| • | | Only as a result of its unrelenting commitment to responsible fiscal management can the Government now be in a position to deliver these initiatives, without having raised taxes or cut transfers to persons or other levels of government, while still expecting a surplus of $1.9 billion in 2015–16, steadily growing to $13.1 billion in 2019–20. |
| • | | The Government has judged it appropriate to continue to set aside $3.0 billion per year between 2014–15 and 2019–20 for contingencies. If the set-aside for contingencies is not required, it will be used to reduce the federal debt. |
| • | | The Government is also on track to meeting its commitment to reduce the federal debt to 25 per cent of gross domestic product (GDP) by 2021. In fact, the federal debt-to-GDP ratio is expected to fall to below its pre-recession level by 2017, helping to ensure that Canada’s total government net debt continues to decline and remains the lowest of any G-7 country. |
Note: This document incorporates economic, financial and fiscal data available up to and including November 7, 2014, unless otherwise indicated.
5
| | |
| | | |
| Creating Jobs and Growth and Supporting Families in a Fragile Global Economy | |
CHAPTER 1
CREATING JOBSAND GROWTHAND SUPPORTING FAMILIESINA FRAGILE GLOBAL ECONOMY
Five years into the recovery from the global recession, Canada remains exposed to a fragile and uneven global economy. A moderation in growth in China, combined with stalled growth in the euro area, has led forecasters to again revise down the global growth outlook, and to postpone to 2015 their expectations for the return to a stronger global growth path.
Fears over the sustainability of global growth also translated into significant volatility in global financial markets in early October, with sharp declines recorded among major equity markets, a fall in bond yields in advanced economies and an increase in risk spreads. Financial market turbulence also added to concerns of oversupply in crude oil markets, resulting in sharp declines in commodity prices. While markets have since stabilized to a large degree, this volatility underscores ongoing uncertainty of the global recovery.
Faced with this ongoing uncertainty and external weakness, the Government remains committed to the principles that have underpinned its actions since 2006, which are creating jobs and supporting growth, keeping taxes low, and supporting Canadian families and businesses.
Throughout the economic recovery, the Government remained steadfast in its efforts to create jobs and growth through measures focused on:
| • | | Connecting Canadians with available jobs and equipping them with the skills and training they need to succeed in the labour market; |
| • | | Supporting advanced research and innovation to foster a vibrant entrepreneurial culture where new ideas are translated into new businesses, products and services in the marketplace; |
| • | | Reducing red tape and the regulatory burden faced by businesses; |
| • | | Helping conserve Canada’s natural heritage and developing natural resources in a responsible and secure way; |
| • | | Helping Canadian businesses succeed in the global economy by encouraging trade and foreign investment and supporting our manufacturing sector; and, |
| • | | Investing in public infrastructure, including by delivering the New Building Canada Plan—the largest long-term federal investment in infrastructure in Canadian history. |
7
| | |
| | |
| | Chapter 1 |
The Government has also provided significant tax relief for individuals, families and businesses, further contributing to an environment where Canadians can succeed and Canadian businesses can grow, create new well-paying jobs and compete internationally. Today, in spite of years of global economic uncertainty, Canada’s low-tax plan and sound fiscal management are bearing fruit. Real gross domestic product (GDP) is significantly above pre-recession levels and Canada has enjoyed one of the strongest economic performances among the Group of Seven (G-7) countries over the recovery (Chart 1.1).
Both the International Monetary Fund and the Organisation for Economic Co-operation and Development expect Canada to be among the strongest growing economies in the G-7 over this year and the next. Over 1.2 million more Canadians are working now than in July 2009 (when the recovery began)—an increase of 7.3 per cent—representing one of the strongest job creation performances in the G-7.
8
| | |
| | | |
| Creating Jobs and Growth and Supporting Families in a Fragile Global Economy | |
Actions taken by this Government to reduce the tax burden on families and individuals have been instrumental in allowing Canadians to keep more of their hard-earned money in their pockets. Tax relief measures introduced since 2006, not including recently announced measures, have resulted in a tax reduction of approximately $3,400 in 2014 for an average two-earner family with two children. In addition, more than 1 million low-income Canadians, including 380,000 seniors, have been removed from the tax rolls.
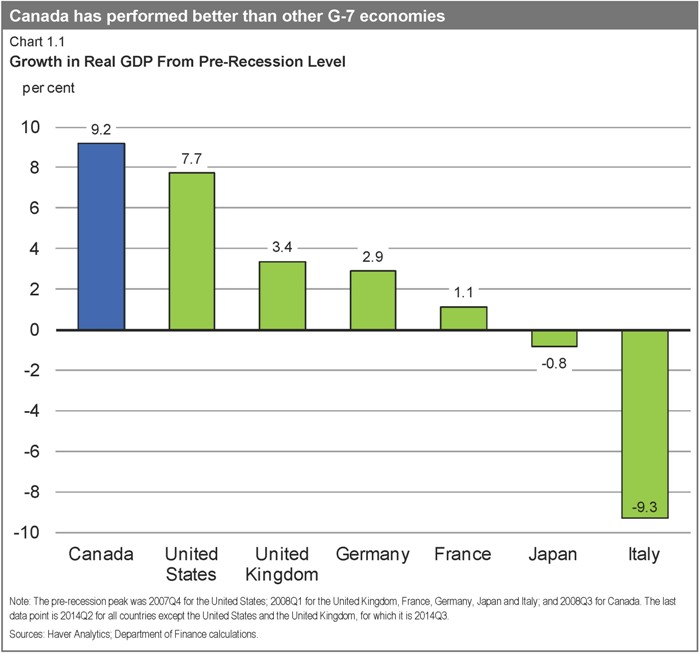
By 2010, the median per capita income of Canadians had caught up with the U.S. level—something that had never been seen before (Chart 1.2). More recent data suggest that middle-class incomes in Canada are now even higher than in the United States.
9
| | |
| | |
| | Chapter 1 |
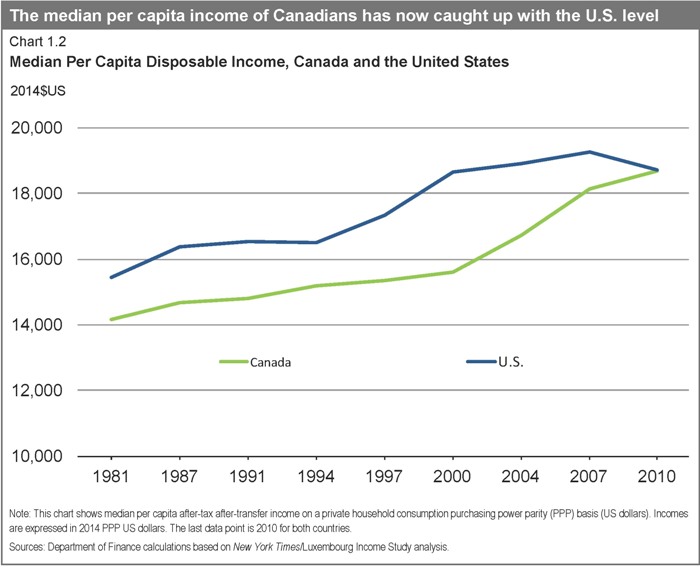
Furthermore, Canadian families in all major income groups have seen increases of about 10 per cent or more in their take-home incomes since 2006, with the largest gains in income growth occurring among low-income Canadians (Chart 1.3).
Throughout the global recession and recovery, the Government remained steadfast in its commitment to returning Canada to balanced budgets. This commitment is founded on the recognition that a sound fiscal position is necessary to ensure ongoing economic growth and job creation over the longer term. The Government achieved this by controlling program spending by federal departments. Federal direct program spending has declined for four consecutive years, a trend that has not been achieved in decades. By controlling the cost of government, Canadian families and businesses were protected from higher taxes or reduced transfers to individuals that provide important income support, such as Old Age Security and Employment Insurance benefits. Similarly, major transfers to provincial and territorial governments for social programs and health care continued to increase through the recession and recovery, reaching all-time high levels.
10
| | |
| | | |
| Creating Jobs and Growth and Supporting Families in a Fragile Global Economy | |
Balancing the budget is not an end in itself. It is a means to increase Canada’s economic potential, improve employment opportunities for Canadians and raise our standard of living. Indeed, balancing the budget and reducing debt will provide benefits to Canadians for years to come, notably by:
| • | | Ensuring that tax dollars are used to support important social services—like elderly benefits and health care—rather than paying interest costs; |
| • | | Instilling confidence in consumers and investors, whose dollars spur economic growth and job creation; and, |
| • | | Strengthening the country’s ability to respond to longer-term challenges, such as population aging, unexpected global economic shocks, and global security threats. |
Most importantly, with balanced budgets in sight, the Government can continue delivering on its commitment to provide further tax relief for Canadian families so that they can keep even more of what they earn and get ahead. As such, the Government recently proposed measures to make life affordable for Canadian families by reducing taxes to help them keep more of their hard-earned money and increasing benefits.
Supporting Canadian Families
On October 30, the Government announced its intention to implement four measures to help families prosper through additional tax reductions and benefit increases:
| • | | Increasing the Universal Child Care Benefit (UCCB) for children under the age of 6. Under the proposed changes, parents would receive a benefit of $160 per month for each child under the age of 6—up from $100 per month—as of January 1, 2015. In a single year, a parent would receive up to $1,920 per child. |
| • | | Expanding the UCCB to children aged 6 through 17. Under the expanded benefit, parents would receive $60 per month, as of January 1, 2015, for children aged 6 through 17. In a single year, a parent would receive up to $720 per child. The enhanced UCCB will replace the existing Child Tax Credit for the 2015 and subsequent taxation years. |
| • | | Introducing the Family Tax Cut. This federal non-refundable tax credit will allow a spouse to, in effect, transfer up to $50,000 of taxable income to a spouse in a lower tax bracket. Effective as of the 2014 taxation year, the credit would provide tax relief to couples with minor children, up to a maximum of $2,000. |
| • | | Increasing the Child Care Expense Deduction dollar limits by $1,000, effective for the 2015 taxation year. The maximum amounts that can be claimed would increase to $8,000 from $7,000 for children under age 7, to $5,000 from $4,000 for children aged 7 through 16 (and infirm dependent children over age 16), and to $11,000 from $10,000 for children who are eligible for the Disability Tax Credit. |
11
| | |
| | |
| | Chapter 1 |
|
Impact of Proposed New Measures—Examples |
Example 1—Two-Earner Couple
Dale and Kelly are a two-earner couple with two children aged 7 and 3. Kelly earns $95,000 and Dale earns $25,000. For the 2015 taxation year, the family would receive a net federal benefit of $2,835 as a result of the proposed new measures. This is in addition to the $2,000 in tax relief the couple would be receiving in early 2015 when they claim the Family Tax Cut on their 2014 returns.
| | • | | In 2015, the couple would begin receiving monthly Universal Child Care Benefit payments of $220, which includes $160 for their younger child plus $60 for their 7 year old (their first enhanced Universal Child Care Benefit payment would actually be received in July 2015 and would include a $720 catch-up payment for the January to June period). Previously, they had been receiving $100 per month for the younger child. Over a 12-month period, the Universal Child Care Benefit enhancement would represent a benefit of $1,440 for this family. Since the enhancements to the Universal Child Care Benefit would be taxable, and the Child Tax Credit would be repealed, the net federal benefit from the Universal Child Care Benefit for the family would be $536. | |
| | • | | Since the younger child attends full-time daycare and the older one attends summer camp and after-school care, Dale and Kelly would fully benefit from the $2,000 increase in the amount they can claim under the Child Care Expense Deduction for the 2015 taxation year. This enhancement to the Child Care Expense Deduction would provide $300 in additional federal tax relief. | |
| | • | | For the 2015 taxation year, the family’s tax payable would be further reduced by $2,000 due to the new Family Tax Cut. | |
As a result of the tax relief and benefit measures introduced since 2006, including those announced on October 30, this family would be better off by about $7,285 in 2015.
Example 2—One-Earner Couple
Isabelle and Marc are a one-earner couple earning $60,000. They have two children aged 2 and 4. As a result of the proposed new measures, this family would benefit from about $1,605 in federal relief for the 2015 taxation year. This is in addition to about $1,055 in tax relief they would receive in early 2015 when they claim the Family Tax Cut on their 2014 returns.
| | • | | The Universal Child Care Benefit enhancement would represent a benefit of $1,440 over a 12-month period. Since the enhancements to the Universal Child Care Benefit would be taxable, and the Child Tax Credit would be repealed, the net federal benefit from the enhanced Universal Child Care Benefit for the family would be $536 for the 2015 taxation year. | |
| | • | | For the 2015 taxation year, the new Family Tax Cut would reduce the family’s tax payable by about $1,070. | |
As a result of the tax relief and benefit measures introduced since 2006, including those announced on October 30, this family would be better off by about $6,240 in 2015.
12
| | |
| | | |
| Creating Jobs and Growth and Supporting Families in a Fragile Global Economy | |
|
Impact of Proposed New Measures—Examples |
Example 3—Single Parent
Alison is a single parent raising one child age 4 and earning $45,000. As a result of the proposed new measures, Alison would benefit from about $420 in federal relief for the 2015 taxation year.
| | • | | The Universal Child Care Benefit enhancement would represent a benefit of $720 over a 12-month period. Since the enhancement to the Universal Child Care Benefit would be taxable, and the Child Tax Credit would be repealed, the net federal benefit from the enhanced Universal Child Care Benefit for the family would be $268. | |
| | • | | Since her child attends full-time daycare, Alison would benefit from the $1,000 increase in the amount she can claim under the Child Care Expense Deduction for the 2015 taxation year. The enhancement to the Child Care Expense Deduction would provide $150 in additional federal tax relief. | |
As a result of the tax relief and benefit measures introduced since 2006, including those announced on October 30, Alison would be better off by about $3,325 in 2015.
Example 4—Two-Earner Couple With Equal Earnings
Thomas and Matty are a two-earner couple with two children aged 3 and 6. They each earn $60,000. For the 2015 taxation year, the family would receive a net federal benefit of $875 as a result of the proposed new measures.
| | • | | In 2015, the couple would begin receiving monthly Universal Child Care Benefit payments of $220, which includes $160 for their younger child plus $60 for their 6 year old (their first enhanced Universal Child Care Benefit payment would actually be received in July 2015 and would include a $720 catch up payment for the January to June period). Previously, they had been receiving $100 per month for the younger child. Over a 12-month period, the Universal Child Care Benefit enhancement would represent a benefit of $1,440 for this family. Since the enhancements to the Universal Child Care Benefit would be taxable, and the Child Tax Credit would be repealed, the net federal benefit from the Universal Child Care Benefit for the family would be $435. | |
| | • | | Since the younger child attends full-time daycare and the older one attends summer camp and after school care, Thomas and Matty would fully benefit from the $2,000 increase in the amount they can claim under the Child Care Expense Deduction for the 2015 taxation year. This enhancement to the Child Care Expense Deduction would provide $440 in additional federal tax relief. | |
As a result of the tax relief and benefit measures introduced since 2006, including those announced on October 30, this family would be better off by about $5,475 in 2015.
In addition to these most recent proposed changes, the Government also announced on October 9 its intention to double the Children’s Fitness Tax Credit (CFTC) and make it refundable. Parents will be able to take advantage of the new $1,000 maximum limit in the spring of 2015 when they file their tax returns for 2014. Making the credit refundable will increase the benefits to low-income families claiming the new credit for the 2015 and subsequent taxation years. When fully implemented, the proposed enhancements to the CFTC would deliver additional tax relief to about 850,000 families.
Taken together, these proposed changes would provide about $3.1 billion in tax relief and enhanced benefits in 2014–15, amounting to close to $27 billion over this and the next five years, and benefit more than 4 million Canadian families. The average tax relief and benefits for these families will be over $1,100 in 2015.
13
| | |
| | |
| | Chapter 1 |
Supporting Businesses
The Government also remains committed to help businesses prosper here in Canada and succeed in the global economy. To do so, businesses need their government to be a partner in achieving success and fostering job creation.
In September 2013, the Government announced a three-year freeze of the Employment Insurance (EI) rate at its 2013 level of $1.88 per $100 of insurable earnings to prevent it from rising to $1.93 in 2014, saving employers and employees an expected $660 million in 2014 alone.
Building on this measure, on September 11, 2014, the Government announced further action to create jobs, growth and long-term prosperity with the introduction of the new Small Business Job Credit. This credit is expected to save small businesses more than $550 million over 2015 and 2016. Any firm that pays employer EI premiums equal to or less than $15,000 in those years will be eligible for the credit, representing close to 90 per cent of all EI premium-paying businesses in Canada. The Canada Revenue Agency will automatically calculate the credit on a business’ T4 information return, ensuring that no new paper burden will be imposed on business owners.
In addition, all employers and employees will benefit from a substantial reduction in the EI premium rate in 2017 from the currently legislated $1.88 per $100 of insurable earnings to an estimated $1.45, when the new seven-year break-even rate-setting mechanism takes effect. This will ensure that EI premiums are no higher than needed to pay for the EI program over time.
Returning to Balanced Budgets
Canadian families recognize the importance of a balanced budget. Likewise, governments cannot indefinitely spend beyond their means. The Government has taken responsible and deliberate steps to reduce the deficit and return to a balanced budget. It remains committed to keeping its budget in balance. To that end, the Government will introduce balanced budget legislation that will require balanced budgets during normal economic times and concrete timelines for returning to balance in the event of an economic crisis.
It is only through its unrelenting commitment to responsible and sustainable management of public finances that the Government is now in a position to deliver more than $27 billion worth of additional tax relief and benefits to families and businesses over this and the next five years, while remaining on track to balance the budget in 2015.
14
| | |
| | | |
| Creating Jobs and Growth and Supporting Families in a Fragile Global Economy | |
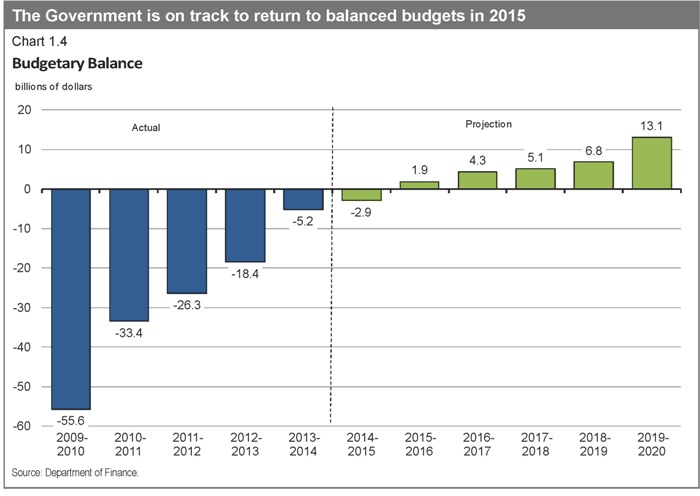
Indeed, in 2009, at the height of the global economic and financial crisis, the deficit stood at $55.6 billion. In recent years, the Government took important and responsible steps to reduce the deficit and ensure the sustainability of public finances and social programs for future generations. Today, after accounting for the initiatives described above, a surplus of $1.9 billion is projected for 2015–16, steadily growing to $13.1 billion in 2019–20 (Chart 1.4). In addition, the Government has judged it appropriate to continue to set aside $3.0 billion per year between 2014–15 and 2019–20 for contingencies. If the set-aside for contingencies is not required, it will be used to reduce the federal debt.
15
| | |
| | |
| | Chapter 1 |
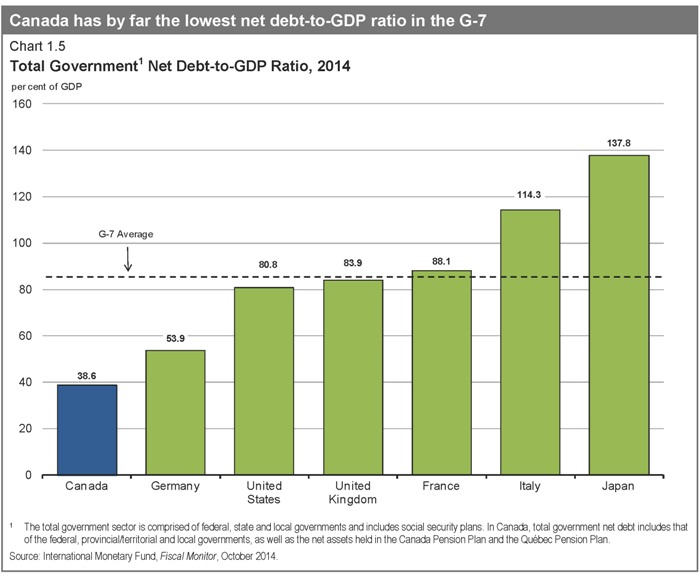
The federal debt-to-GDP ratio declined last year and is projected to steadily continue on that downward path, putting the Government well on its way to meeting its commitment to reduce the federal debt to 25 per cent of GDP by 2021. Indeed, the federal debt-to-GDP ratio is expected to fall below its pre-recession level by 2017. This will help to ensure that Canada’s total government net debt (which includes that of the federal, provincial, territorial and local governments as well as the net assets of the Canada Pension Plan and Québec Pension Plan) continues to decline. Indeed, the International Monetary Fund projects that Canada’s total government net debt-to-GDP ratio will remain the lowest of any G-7 country (Chart 1.5).
16
| | |
| | | |
| Economic Developments and Prospects | |
CHAPTER 2
ECONOMIC DEVELOPMENTSAND PROSPECTS
Introduction
While Canada’s economy has continued to post solid growth, the global economy has continued to surprise on the downside. Growth in China has been weaker than expected and growth in the euro area has once again stalled. This much softer-than-anticipated pace of economic activity early this year has led forecasters to again revise down the global growth outlook, and to postpone to 2015 their expectations for a return to a stronger global growth path.
In part reflecting expectations of weaker global growth, financial markets underwent a period of heightened volatility starting in mid-October, with sharp declines recorded in major equity markets, a fall in bond yields in advanced economies and an increase in risk spreads. Global commodity prices also declined sharply, reflecting expectations of weaker demand and concerns about oversupply in crude oil markets. Although markets have stabilized more recently, this period of turbulence points to the continued fragile and uncertain nature of the global recovery.
In this challenging economic environment, the Canadian economy has performed relatively well. Over the recovery, the expansion in Canada’s real gross domestic product (GDP) has outpaced that of all its Group of Seven (G-7) peers and employment growth has been among the strongest in the group. Over 1.2 million net new jobs have been created in Canada since the end of the recession, overwhelmingly full-time, in high-paying sectors and in the private sector.
However, weak global growth continues to weigh on the Canadian economy. Weak external demand has restrained export growth since the end of 2011, increasing uncertainty over future demand prospects and weighing on business investment.
This chapter reviews major global and Canadian economic developments since Budget 2014, presents the September 2014 average private sector economic forecast that forms the basis for the fiscal projections presented in this Update, and discusses the risks and uncertainties surrounding this economic forecast.
Note: All growth rates in this chapter are reported at annual rates unless otherwise noted.
17
| | |
| | |
| | Chapter 2 |
Global Economic Developments and Outlook
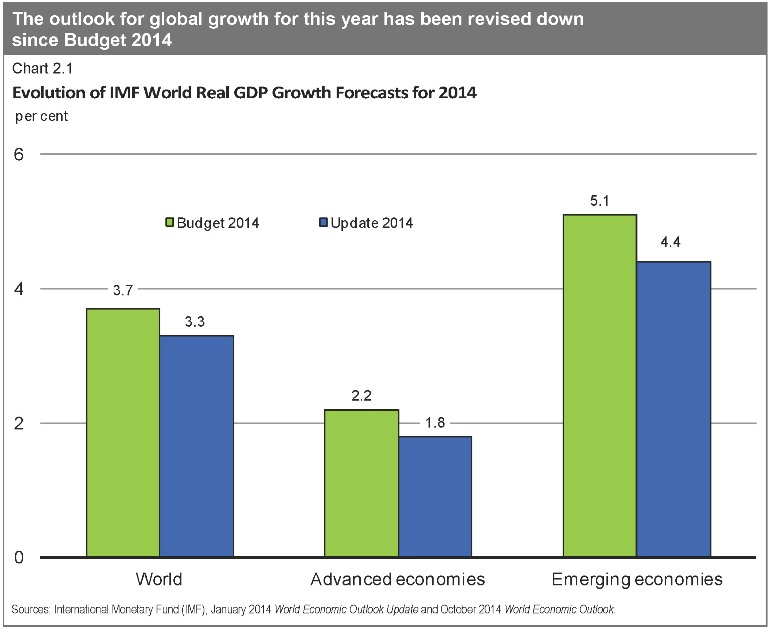
The global economy grew at a subdued pace in the first half of 2014. This largely reflected a contraction in the U.S. at the start of the year, stagnation in euro-area activity and slower growth in the first quarter in China. As well, growth in a number of other large emerging economies was below expectations. As a result, global growth projections for the year as a whole have been marked down from expectations at the time of Budget 2014 (Chart 2.1).
In the United States, output contracted unexpectedly by 2.1 per cent in the first quarter of this year, before rebounding to a robust 4.6 per cent in the second quarter as temporary factors, including inclement weather, receded. Growth averaged a weak 1.2 per cent over the first half of the year. Growth was 3.5 per cent in the third quarter, modestly above expectations in the September survey of private sector economists (Chart 2.2). Economic activity is expected to continue at about 3 per cent for several quarters, similar to what was anticipated at the time of Budget 2014. Overall, private sector economists expect U.S. real GDP to grow by 2.1 per cent this year, similar to its pace of 2.2 per cent in 2013, but then to improve to 3.1 per cent in 2015.
18
| | |
| | | |
| Economic Developments and Prospects | |

Domestic demand is expected to be a key driver of the improvement in U.S. growth, supported by rising financial and housing wealth, improving labour market conditions, expanding credit and continuing accommodative monetary policy. Moreover, there has been a reduction in fiscal uncertainty in the near term as recent budget deals have set out the government’s funding levels until September 2015. However, negotiations on the U.S. debt limit are set to ramp up in March 2015, potentially increasing uncertainty.
U.S. labour market indicators, which lagged Canada’s gains coming out of the recession, have been encouraging. Monthly job gains have picked up from about 195,000 on average in 2013 to about 230,000 so far this year, while the unemployment rate has declined to 5.8 per cent. Nonetheless, wage growth is modest, broader measures of unemployment (such as those which include individuals who are working part-time but would prefer to be working full-time) remain elevated and the labour force participation rate has declined markedly. Reflecting this, U.S. forecasters expect inflation to rise only gradually going forward.
19
| | |
| | |
| | Chapter 2 |
Consistent with the improvement in the U.S. outlook, the U.S. Federal Reserve had been reducing the pace of asset purchases under quantitative easing since the beginning of this year, and decided at its October 29th meeting to conclude purchases at the end of October. Financial markets expect the first policy rate increase in the second half of 2015. Nonetheless, the overall monetary policy stance is expected to remain highly accommodative, as the policy rate is expected to remain low for some time.
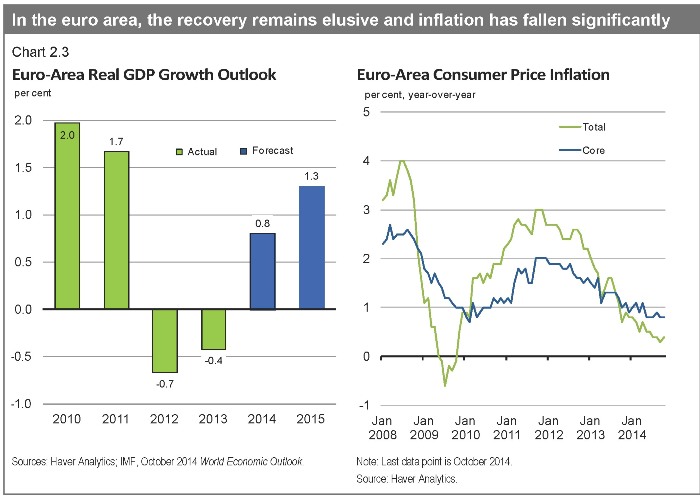
In the euro area, the recovery remains elusive. In mid-2013, the economy returned to tepid growth after a year-and-a-half-long recession. However, the recovery stalled in the second quarter of 2014, as economic activity in the three largest economies—Germany, France and Italy—contracted.
Persistently low inflation (0.4 per cent in October 2014 and below 1 per cent for 13 consecutive months) is posing new challenges as it raises real borrowing costs, which could slow the recovery and make it more difficult to reduce already-high debt burdens (Chart 2.3). Indeed, inflation expectations have recently drifted down, raising the risk of even lower inflation or deflation.
20
| | |
| | | |
| Economic Developments and Prospects | |
Despite some improvement over the past year, euro-area peripheral economies (Greece, Italy, Portugal and Spain) remain a source of uncertainty in the region. Financial conditions are still tight and the repair of European banks’ balance sheets is progressing slowly, leaving the banking sector vulnerable to negative shocks. In addition, Spain and Greece are currently in deflation, putting further pressure on fiscal sustainability in these countries. In Greece, political uncertainty has risen and markets are questioning the country’s ability to secure sufficient funding in the coming years. Progress on individual countries’ structural reforms has also generally been disappointing and risk of reform slippage is rising. As a result, sovereign borrowing costs for some of these at-risk economies have once again begun to rise.
In response to the deteriorating economic situation and threats to price stability, the European Central Bank introduced two rounds of monetary easing measures in June and September. These include reducing its interest rates to the effective lower bound, introducing targeted liquidity provisions for banks, which began in September, and introducing two new purchase programs for certain private assets, including covered bonds (which began on October 20) and asset-backed securities (scheduled to start sometime in the fourth quarter). Looking ahead, after a contraction in economic activity in both 2012 and 2013, the IMF expects the euro area to post positive but weak growth of 0.8 per cent in 2014, with a modest pickup to 1.3 per cent in 2015. The recovery will continue to be constrained by high unemployment, the need for structural reforms and the necessary balance sheet adjustments in the public and banking sectors.
In the United Kingdom, output growth has continued at a brisk pace since Budget 2014 and unemployment has fallen to post-crisis lows. The IMF projects that growth will pick up from 1.7 per cent in 2013 to 3.2 per cent in 2014 and 2.7 per cent in 2015, driven by both consumption and business investment.
Japan faces an uncertain growth outlook. After growth above 3 per cent on average over the five preceding quarters, real GDP contracted by 7.1 per cent in the second quarter of 2014, as consumers brought forward purchases ahead of an April 1 consumption tax increase. Recent inflation readings have also been lower than expected. As a result, the Bank of Japan recently announced additional easing measures, including increasing the pace of its asset purchases under quantitative easing. The IMF expects growth to slow from 1.5 per cent in 2013 to 0.9 per cent in 2014 and 0.8 per cent in 2015.
In emerging economies, growth appears to have eased further in 2014, driven by negative developments in a few large economies. In particular, growth in China is slowing, Brazil is in recession and the Russian economy has decelerated sharply. Looking to 2015, the IMF expects growth in emerging economies to improve to 5.0 per cent from 4.4 per cent this year, reflecting increased policy support, a lessening in geopolitical and domestic tensions, and stronger external demand from advanced economies.
21
| | |
| | |
| | Chapter 2 |
In China, the IMF expects real GDP growth in 2014 to ease to 7.4 per cent, down from 7.7 per cent in both 2013 and 2012. This is well below the 10-per-cent average annual growth over the decade preceding the global recession and the weakest pace since 1990. Growth is expected to ease further to 7.1 per cent in 2015 (Chart 2.4).
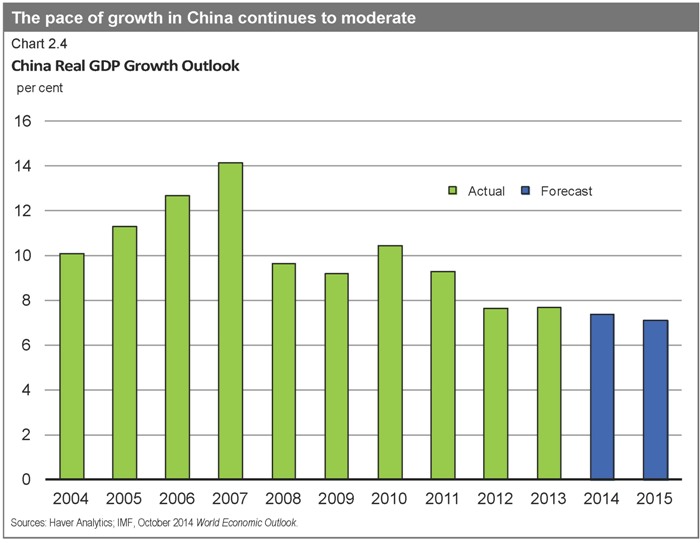
To some extent, this growth slowdown has been intentional and reflects measures to rein in credit growth and high property prices, as authorities seek to shift to a more sustainable growth model with greater reliance on domestic consumption. However, in the past several months, Chinese authorities have implemented targeted stimulus measures including an acceleration of infrastructure projects, a selective loosening of banks’ reserve requirements, liquidity injections in certain banks and an easing of mortgage policies. The uneven nature of these policies reflects the challenge facing the authorities of implementing financial and economic reforms, while at the same time maintaining the pace of growth near its 7.5-per-cent official target. Moreover, China’s economy continues to face risks from its lightly regulated shadow banking sector, the state of the housing sector, and high levels of local government debt.
22
| | |
| | | |
| Economic Developments and Prospects | |
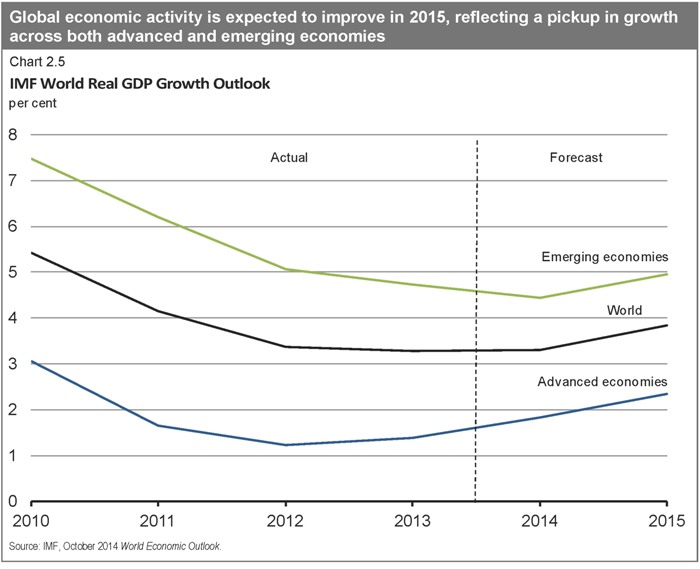
Overall, the IMF now expects global growth of 3.3 per cent for 2014, unchanged from 2013, with slightly stronger growth in advanced economies offset by a modest deceleration in emerging economies’ growth. For 2015, global growth is expected to pick up to 3.8 per cent (Chart 2.5).
23
| | |
| | |
| | Chapter 2 |
Financial Market Developments
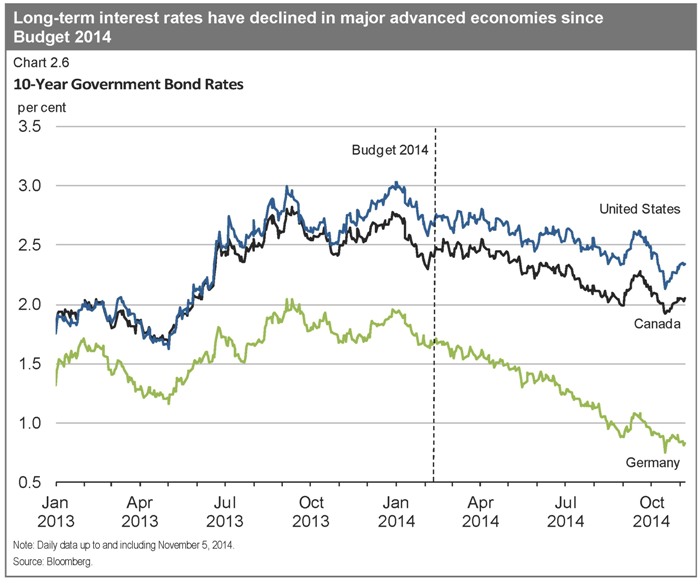
Ongoing accommodative monetary policies across most major advanced economies have led to declines in 10-year government bond rates since Budget 2014. In particular, anticipation of an eventual reduction of policy rates and targeted credit easing by the European Central Bank pushed euro-area interest rates down significantly through the first half of the year, while safe-haven flows into U.S. and Canadian government bonds led to lower rates in these countries. While government bond rates in major economies ticked up temporarily over the first half of September, growing uncertainty over the strength of the global recovery has weighed on market sentiment more recently. This has resulted in a return of safe-haven inflows, pushing rates down to historical lows (Chart 2.6).
24
| | |
| | | |
| Economic Developments and Prospects | |
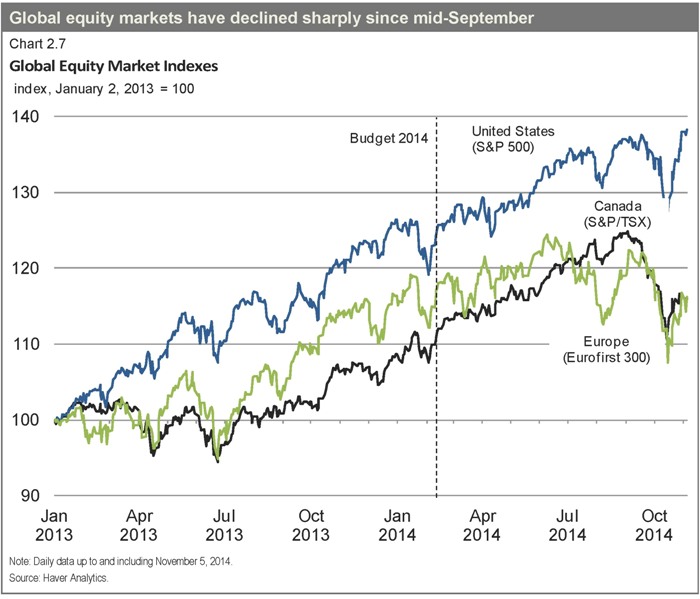
Accommodative monetary policies, which have helped to support global growth over the recovery, have been accompanied by greater investment in equity markets. This, along with signs of improving economic growth in the U.S., translated into higher equity prices during 2013 and most of 2014 (Chart 2.7). More recently, however, market uncertainty over the global economic outlook has translated into significant declines in equity prices since mid-September, culminating in a sharp retrenchment by mid-October. While equity markets have since recouped some lost ground, with a new record high reached in the United States, Canadian and European equity market indexes remain below their recent peaks.
25
| | |
| | |
| | Chapter 2 |
Commodity Prices
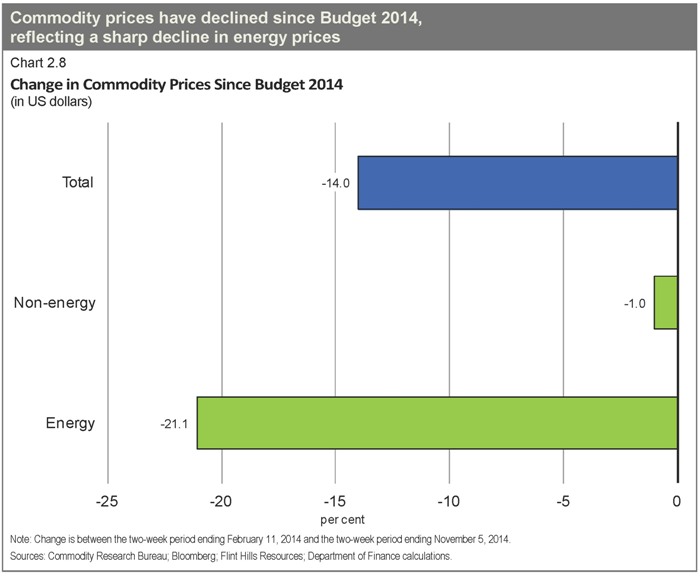
Since Budget 2014, the Department of Finance total commodity index has declined by 14 per cent, driven by a decline in energy prices (Chart 2.8). As discussed below, this decline was led by lower crude oil prices, reflecting both strong supply growth and weaker-than-expected global demand as well as growing uncertainty over the strength of the global recovery. Natural gas prices have also declined sharply, after spiking earlier this year due to the very strong demand and sharp drawdown in inventories that resulted from an extremely cold U.S. winter. Non-energy commodity prices have declined slightly since Budget 2014, as modest gains in agriculture prices, reflecting low supply, have been offset by lower metals and forestry prices.
Global crude oil prices have declined markedly since Budget 2014, with the bulk of this decline occurring since July. The decline in global prices reflects a number of factors including weaker-than-expected global demand, ongoing production increases in North America which have displaced crude oil imports from overseas, and an easing of concerns of supply disruptions due to geopolitical unrest in Iraq and Libya.
26
| | |
| | | |
| Economic Developments and Prospects | |
Increased supply from Libya, in particular, has put significant downward pressure on prices since mid-2014, as its production rose from near-zero early in the year as a result of civil unrest to close to 1 million barrels per day currently. In response, Saudi Arabia announced in August that it had cut its production by approximately 400,000 barrels per day, and market watchers at that time anticipated that the Organization of the Petroleum Exporting Countries (OPEC) would formally reduce production quotas at its upcoming meeting in late November. More recently, however, Saudi Arabia has signalled that it would be prepared to accept prices (the OPEC Basket Price, which is very similar to the global Brent benchmark) in the US$80 range, raising doubts over whether OPEC will reduce production levels in late November, which has put further downward pressure on global prices. Finally, global crude oil prices have been further depressed recently by refinery maintenance shutdowns in Europe, which are temporarily adding to the oversupply of crude in the region.
27
| | |
| | |
| | Chapter 2 |
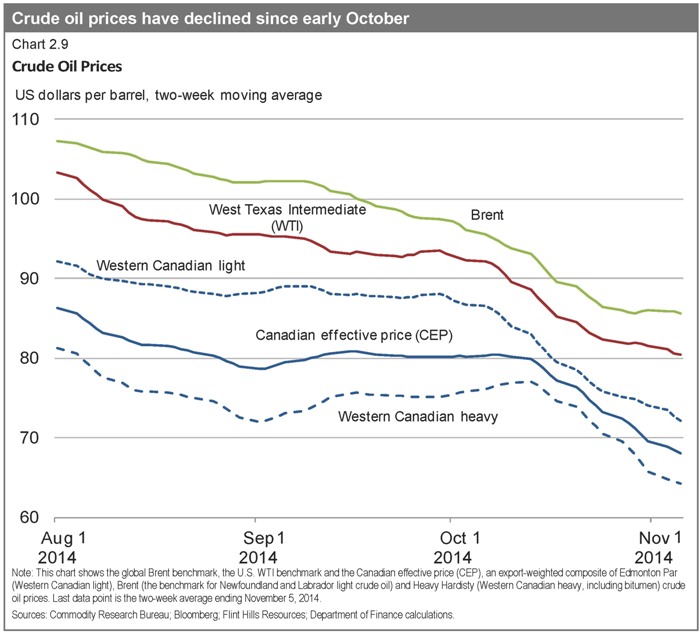
Canadian crude oil prices have also declined since the summer, reflecting lower global prices and continued increases in North American production. The decline in Canadian prices was initially more modest than for either the global Brent or the U.S. West Texas Intermediate (WTI) benchmarks, as prices for Canadian heavy crude oil, which represents approximately two-thirds of Canadian crude oil exports, were much less affected by oversupply than light crude (such as the Brent and WTI benchmarks) in global markets (Chart 2.9). However, increasing downward pressure from lower global crude oil price benchmarks has pushed down Canadian heavy crude oil prices since early October, leaving the decline in overall Canadian oil prices since the summer broadly in line with the fall of global oil price benchmarks.
28
| | |
| | | |
| Economic Developments and Prospects | |
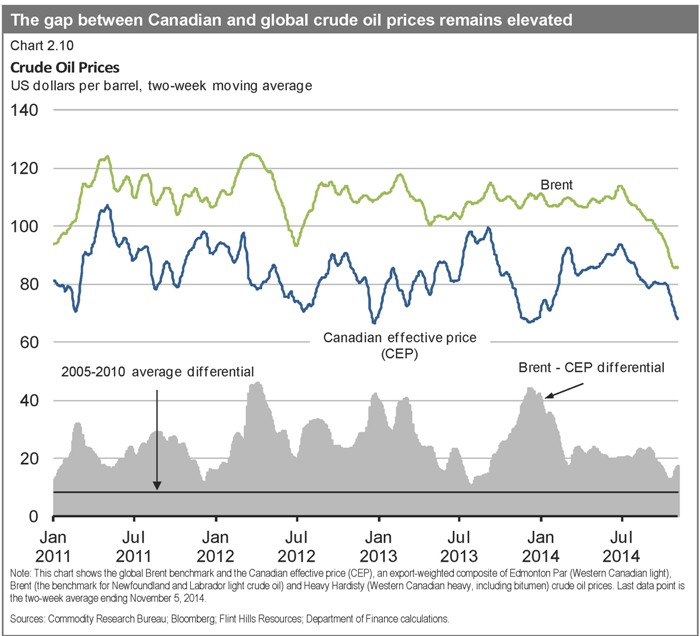
As a result, while the discount on Canadian crude oil relative to the global Brent benchmark had narrowed to approximately US$12 per barrel on average over the first half of October, only modestly above its average discount over the 2005–2010 period, by early November this discount had once again risen to approximately US$17 per barrel (Chart 2.10). This ongoing variation in Canadian prices relative to global benchmarks underscores the continued uncertainty facing Canadian producers over U.S. refinery demand amid the potential for continued growth in U.S. crude oil supply. As a result, without improved access to global markets, Canada’s continued dependence on the United States as the destination for virtually all of its crude oil exports will continue to translate into Canadian crude oil prices that are both lower and more volatile than those prevailing globally going forward.
29
| | |
| | |
| | Chapter 2 |
Canada’s Economic Performance
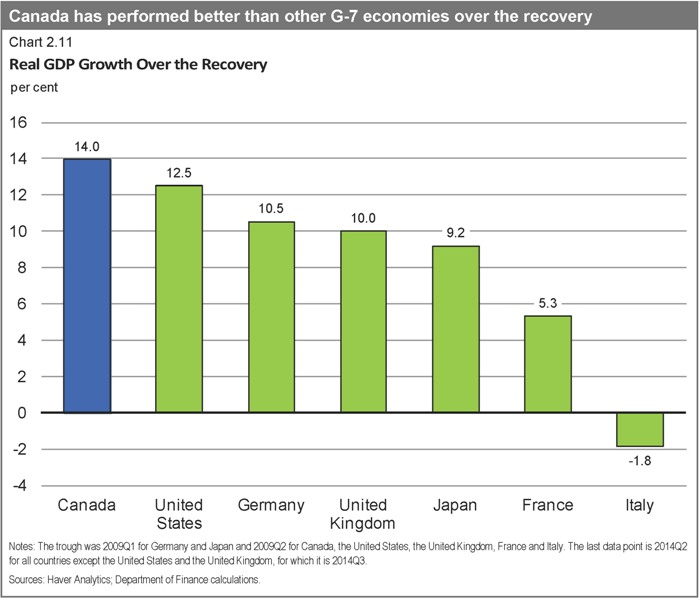
The Canadian economy remains resilient despite the challenges posed by a weak and uncertain global economic environment, and Canada continues to lead all other G-7 economies in real GDP growth over the recovery (Chart 2.11).
30
| | |
| | | |
| Economic Developments and Prospects | |
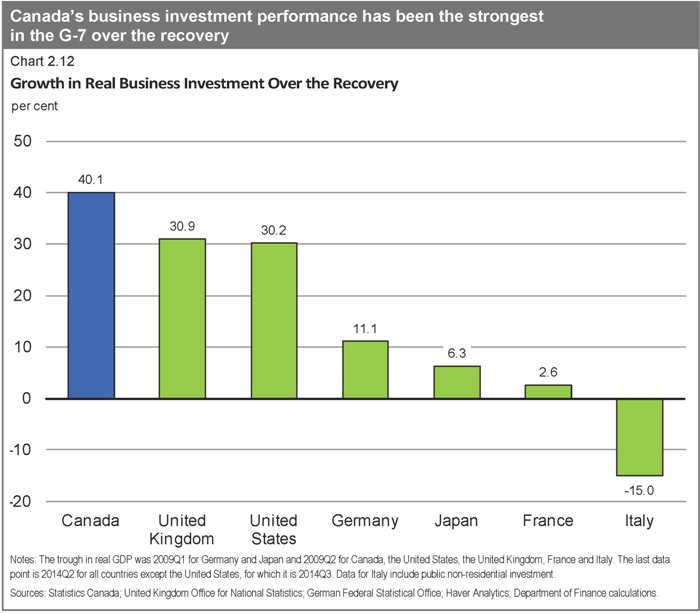
Canada’s strong economic performance has been driven by a solid domestic economy, with Canada enjoying continuous growth in private domestic demand since the end of the recession. This sustained growth has been led by the strongest growth in real business investment in the G-7 over the recovery (Chart 2.12).
31
| | |
| | |
| | Chapter 2 |
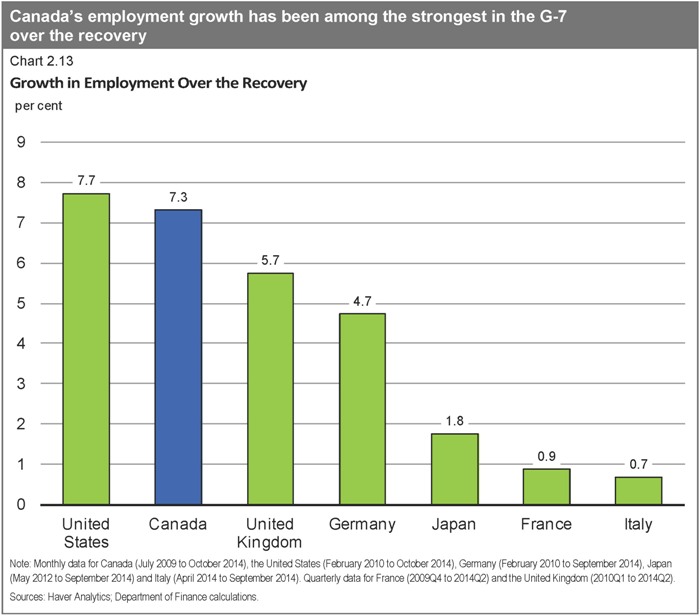
Canada’s strong real GDP growth over the recovery has translated into one of the strongest job creation performances in the G-7, with over 1.2 million more Canadians now working than in July 2009, when the recovery began—an increase of 7.3 per cent (Chart 2.13).
32
| | |
| | | |
| Economic Developments and Prospects | |
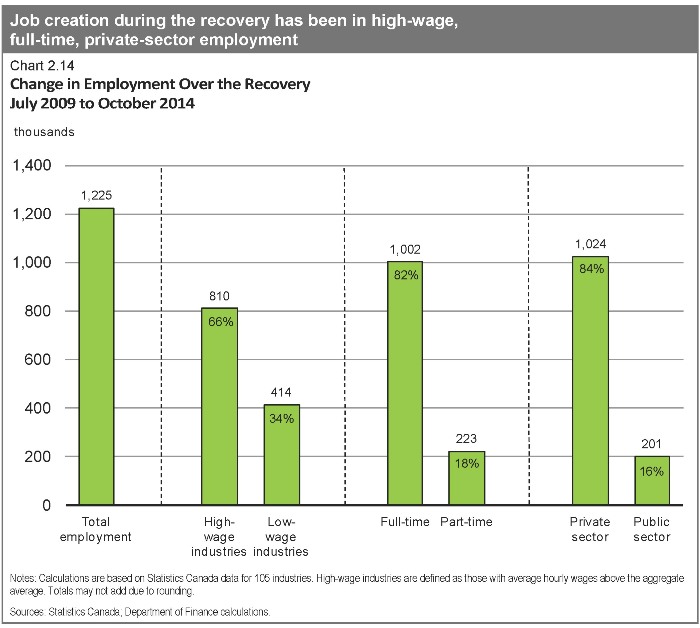
Moreover, over the recovery, more than 80 per cent of all jobs created have been full-time positions and about two-thirds in high-wage industries. Most importantly, almost 85 per cent of the jobs created have been in the private sector, which has been an important factor supporting Canada’s sustained economic growth (Chart 2.14).
33
| | |
| | |
| | Chapter 2 |
Canada’s employment situation contrasts sharply with that of the U.S., where employment is now only 1.0 per cent above its pre-recession peak, compared to 4.6 per cent in Canada. When measured on the same basis, the unemployment rate in the U.S. is 0.2 percentage points higher than in Canada1 (Chart 2.15). Moreover, this comparison does not take into account the large difference in the labour force participation rate between the two countries. The Canadian labour market has maintained a much higher labour force participation rate compared to the United States, where the participation rate has fallen by 2.7 percentage points since mid-2009 and stands near a 36-year low.2 As a result, Canada’s labour force participation rate remains more than 3 percentage points higher than in the United States.
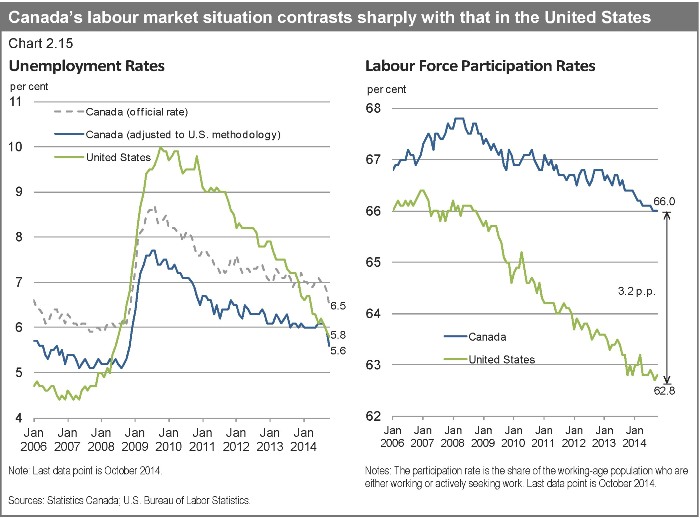
| 1 | Conceptual differences raise the Canadian unemployment rate relative to the U.S. rate. In particular, Statistics Canada considers as unemployed those passively looking for work (e.g. reading want ads) as well as those who will begin work in the near future, while the U.S. Bureau of Labor Statistics does not include either group in the labour force. In addition, the Canadian methodology includes 15-year-olds (who have a higher-than-average unemployment rate), while the U.S. does not. |
| 2 | The U.S. participation rate has fallen by 2.7 percentage points since July 2009, whereas Canada’s participation rate has declined by 1.1 percentage points over the same period. If the U.S. participation rate had fallen by the same amount as Canada’s, and the level of U.S. employment had stayed the same, the U.S. unemployment rate would currently be 8.0 per cent. |
34
| | |
| | | |
| Economic Developments and Prospects | |
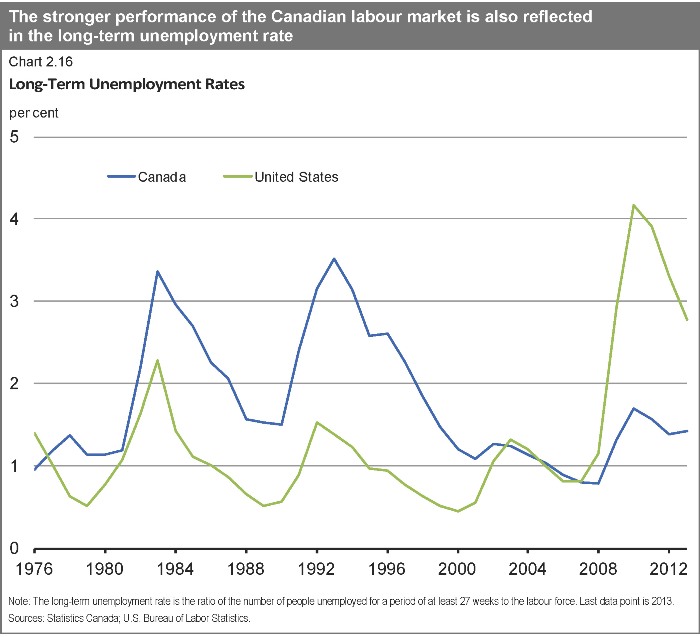
The stronger performance of the Canadian labour market is also reflected in the long-term unemployment rate (the number of people unemployed for a period of at least 27 weeks as a share of the labour force). Canada’s long-term unemployment rate stood at 1.4 per cent in 2013, below its historical average since 1976 and well below the U.S. level of 2.8 per cent, which remains more than double its average over the same period (Chart 2.16).
35
| | |
| | |
| | Chapter 2 |
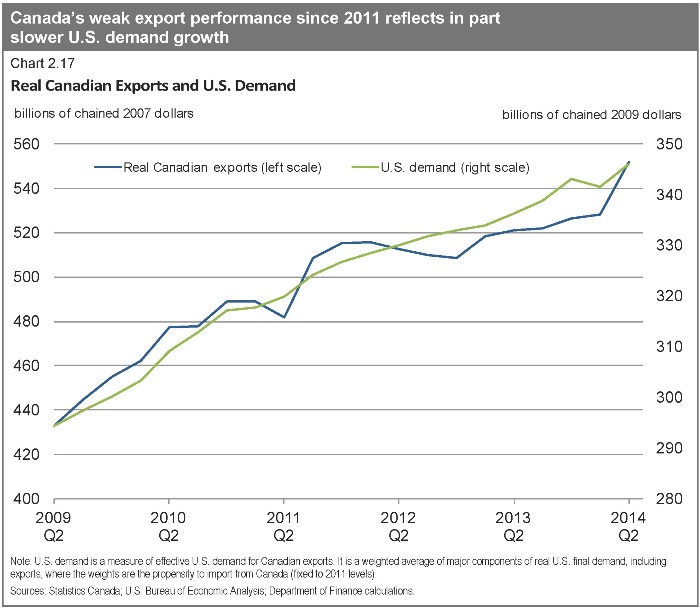
While Canada’s economic record over the recession and recovery has been strong, particularly relative to its peer countries in the G-7, Canada has not been immune to developments outside its borders. The weaker global economy, combined with ongoing uncertainty over the outlook, has weighed on global trade volumes and dampened business investment throughout the world. For Canada, slower growth in U.S. demand for the goods and services that Canada exports has been an important factor in the slowdown in our export growth since the end of 2011, with Canadian exports further dampened in 2012 by U.S. pipeline restrictions and closures and unplanned refinery shutdowns (Chart 2.17). Since late 2012, Canadian real exports have regained ground and by mid-2014 were in line with U.S. demand.
Despite the recent weakness in real export growth, there are some encouraging signs going forward. In particular, Canada has largely maintained its share of U.S. manufactured goods imports since 2009 after a significant decline over the previous decade. Over this earlier period, Canadian manufacturers faced the dual headwinds of a rising dollar and increasing competition from China, which underwent a period of rapid productivity growth over the decade, leading to an increase in its share of U.S. imports at the expense of Canada and other developed economies.
36
| | |
| | | |
| Economic Developments and Prospects | |
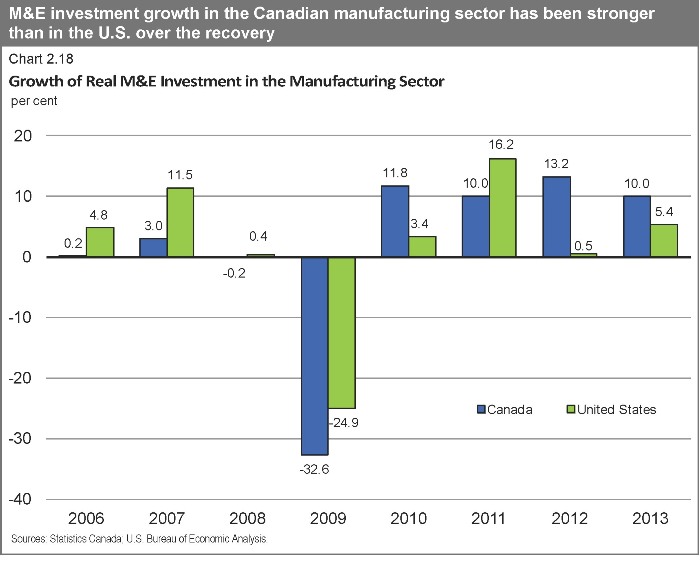
At the same time, the high Canadian dollar reduced prices for imported machinery and equipment (M&E) and intermediate inputs, allowing Canadian exporters to make productivity-enhancing investments and reduce their production costs. In addition, Government actions since 2006 have provided significant support to manufacturers and exporters. In particular, real investment in M&E by Canadian manufacturers, which is an important determinant of productivity growth and international competitiveness, has grown by more than 50 per cent over the recovery, outpacing that in the U.S. after lagging in prior years, with almost all industries posting very strong growth (Chart 2.18). As a result, Canadian manufacturers are now well placed to benefit from stronger demand from the U.S. and elsewhere when external economic conditions begin to improve. The strong rise in real exports in the second quarter of 2014 is a positive signal that Canadian exporters are beginning to take advantage of stronger U.S. demand as well as of the positive impacts of the decline in the Canadian dollar since early 2013.
While Canada’s export prospects are positive going forward, weaker export growth since the end of 2011 has translated into slower growth in business investment, with firms delaying capacity-increasing investment in the face of weak and uncertain global demand. Together, these factors have resulted in more modest real GDP growth since the end of 2011.
37
| | |
| | |
| | Chapter 2 |
With the moderation in real GDP growth, the pace of job creation eased in 2013 and in the first half of 2014 following very strong growth earlier in the recovery. This pace has picked up in recent months and going forward, private sector economists expect that employment will remain solid, forecasting that employment growth will average 20,000 per month for the coming year.
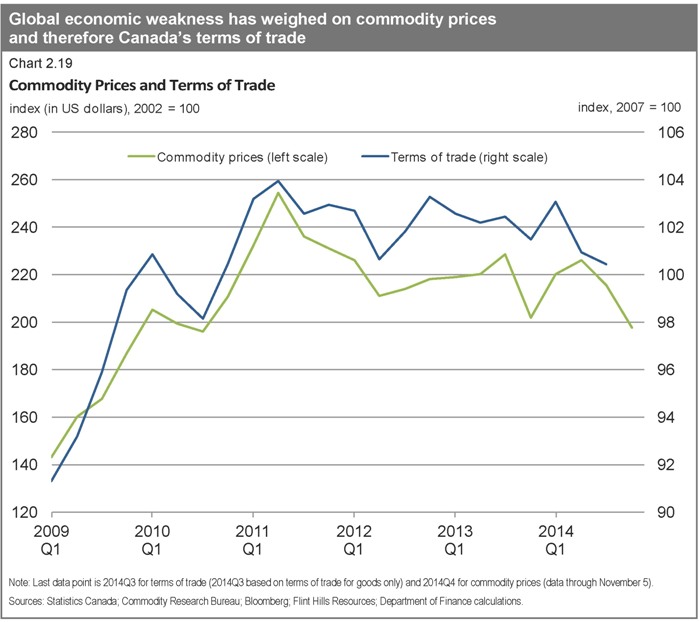
Global economic weakness and more moderate domestic growth have also been reflected in lower economy-wide prices in Canada. Prices for our key export commodities declined by 11.0 per cent between mid-2011 and mid-2014, which translated into a decline of 3.0 per cent in Canada’s terms of trade (the price of our exports relative to our imports—Chart 2.19). Since mid-2014, commodity prices have declined by a further 13 per cent, led by lower crude oil prices, which will put downward pressure on Canada’s terms of trade over the second half of 2014.
38
| | |
| | | |
| Economic Developments and Prospects | |
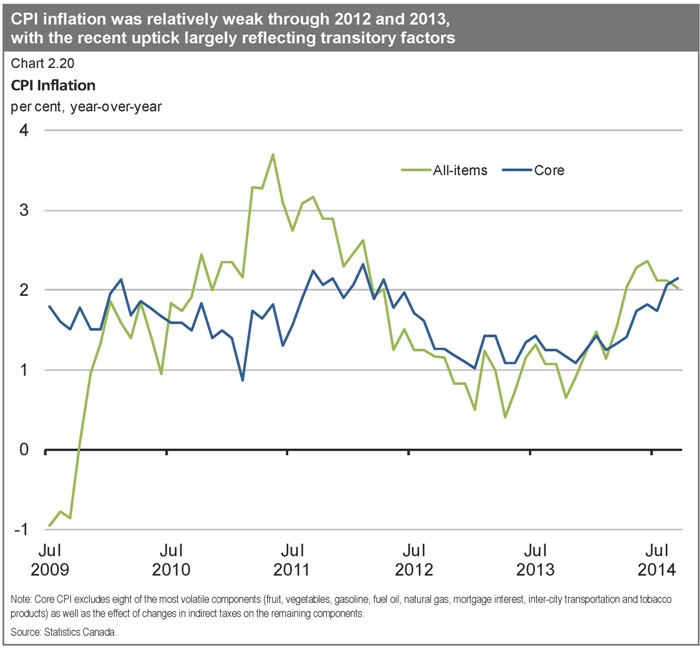
Similarly, Canada’s Consumer Price Index (CPI) inflation averaged 1.2 per cent over 2012 and 2013, reflecting both commodity price weakness and weaker domestic growth. While CPI inflation has accelerated more recently, this largely reflects transitory increases in energy prices (Chart 2.20). In particular, the severe winter weather experienced in early 2014 in much of the United States resulted in a temporary spike in natural gas prices. This translated into higher costs for firms (including indirectly through higher electricity costs), and in turn has resulted in higher prices more broadly in the economy (including core CPI inflation). As these impacts were temporary, they will not affect year-over-year inflation by early 2015, while recent declines in gasoline prices will begin to put downward pressure on prices in late 2014. As a result, private sector economists expect both core and total CPI inflation to ease back to below 2 per cent by mid-2015.
39
| | |
| | |
| | Chapter 2 |
Canadian Economic Outlook—Private Sector Forecasts
The average of private sector economic forecasts has been used as the basis for fiscal planning since 1994 and introduces an element of independence into the Government’s fiscal forecast. This practice has been supported by international organizations such as the IMF.
The Department of Finance regularly surveys private sector economists on their views on the outlook for the Canadian economy. The economic forecast presented in this section is based on a survey conducted in September 2014, and includes the views of 15 private sector economists.
The September 2014 survey of private sector economists included
| • | | Caisse de dépôt et placement du Québec, |
| • | | Canadian Federation of Independent Business, |
| • | | The Conference Board of Canada, |
| • | | Deutsche Bank of Canada, |
| • | | Industrial Alliance Insurance and Financial Services Inc., |
| • | | Laurentian Bank Securities, |
| • | | National Bank Financial Group, |
| • | | TD Bank Financial Group, and |
| • | | the University of Toronto (Policy and Economic Analysis Program). |
The September survey was completed in the first half of September, prior to the recent financial market volatility and the acceleration in the decline in Canadian crude oil prices in mid-October.
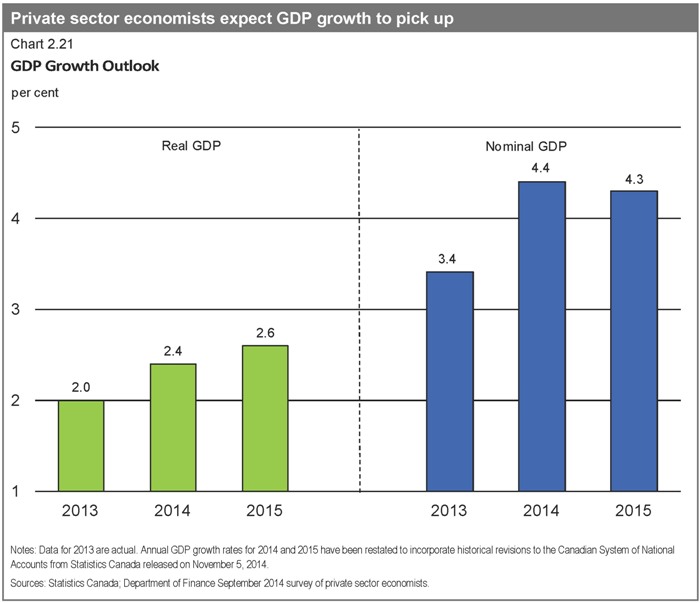
In the survey, private sector economists expect Canadian real GDP growth to pick up to 2.4 per cent in 2014 from 2.0 per cent growth recorded in 2013 (Chart 2.21). Real GDP growth is expected to average 2.5 per cent over the second half of 2014, compared to 2.3 per cent in the first half of the year, and then to pick up to 2.6 per cent for 2015 as a whole. Overall, economists expect real growth to average 2.4 per cent per year over the 2014 to 2018 period. This is unchanged from their expectations at the time of Budget 2014.
While the private sector forecast for real GDP growth is largely unchanged since Budget 2014, strong GDP inflation (the broadest measure of economy-wide price inflation) in the first quarter of 2014 has led to an increase in the outlook for GDP inflation in 2014 as a whole. As a result, nominal GDP growth in the September 2014 survey of private sector economists is expected to be 4.4 per cent in 2014 (compared with expectations of 3.9 per cent growth in Budget 2014). This has increased the projected level of nominal GDP in the September survey by about $6 billion per year, on average, over the 2014 to 2018 period, compared to the outlook in Budget 2014.
40
| | |
| | | |
| Economic Developments and Prospects | |
The economists have slightly revised their outlook for the unemployment rate over the 2014 to 2018 period. They expect the unemployment rate to fall to 6.3 per cent in 2018.
Reflecting higher CPI inflation in the last quarter of 2013 and the first two quarters of 2014 than anticipated at the time of Budget 2014, the outlook for CPI inflation has been revised up to 2.0 per cent in 2014 from 1.5 per cent at the time of the budget. Beyond 2014, the inflation rate is anticipated to remain at around 2 per cent.
Private sector economists have revised down their expectations for both short- and long-term interest rates over the medium term relative to the budget survey as they now expect the increase in interest rates to be more gradual.
41
| | |
| | |
| | Chapter 2 |
The outlook for short-term rates has been lowered by 30 basis points in 2015 and 60 basis points in subsequent years, indicating that private sector economists believe there will be a slightly slower ramp-up in rates than previously expected. On average, the economists’ forecast for short-term rates is consistent with policy rate increases starting in the third quarter of 2015, one quarter later than in the budget survey.
The economists have also decreased their outlook for long-term rates by 70 basis points in 2014 and 50 basis points thereafter compared to the budget survey. The economists expect a Canadian dollar value of just under 91 cents U.S. going forward.
The economists have revised down their forecast for U.S. real GDP growth for this year from 2.7 per cent to 2.1 per cent, reflecting the unexpected decline in U.S. real GDP in the first quarter of 2014. In addition, the outlook for U.S. growth is somewhat lower in subsequent years. As a consequence, the economists’ outlook for annual U.S. growth has fallen from 2.9 per cent to 2.7 per cent, on average, over the 2014 to 2018 period.
42
| | |
| | | |
| Economic Developments and Prospects | |
Table 2.1
Average Private Sector Forecasts
Per cent, unless otherwise indicated
| | | | | | | | | | | | | | | | | | | | | | | | | | | | | | |
| | | 2014 | | | 2015 | | | 2016 | | | 2017 | | | 2018 | | | 2019 | | | 2014–
2018 | | | |
| | | | | | | | |
Real GDP Growth1 | | | | | | | | | | | | | | | | | | | | | | | | | | | | | | |
Budget 2014 | | | 2.3 | | | | 2.5 | | | | 2.5 | | | | 2.3 | | | | 2.2 | | | | - | | | | 2.4 | | | |
2014 Fall Update | | | 2.4 | | | | 2.6 | | | | 2.4 | | | | 2.3 | | | | 2.2 | | | | 2.1 | | | | 2.4 | | | |
| | | | | | | | |
GDP Inflation1 | | | | | | | | | | | | | | | | | | | | | | | | | | | | | | |
Budget 2014 | | | 1.5 | | | | 2.0 | | | | 2.0 | | | | 2.0 | | | | 2.0 | | | | - | | | | 1.9 | | | |
2014 Fall Update | | | 1.9 | | | | 1.6 | | | | 2.0 | | | | 2.1 | | | | 2.0 | | | | 2.0 | | | | 1.9 | | | |
| | | | | | | | |
Nominal GDP Growth1 | | | | | | | | | | | | | | | | | | | | | | | | | | | | | | |
Budget 2014 | | | 3.9 | | | | 4.5 | | | | 4.5 | | | | 4.4 | | | | 4.2 | | | | - | | | | 4.3 | | | |
2014 Fall Update | | | 4.4 | | | | 4.3 | | | | 4.4 | | | | 4.4 | | | | 4.2 | | | | 4.1 | | | | 4.4 | | | |
| | | | | | | | |
Nominal GDP Level1 ($ billions) | | | | | | | | | | | | | | | | | | | | | | | | | | | | | | |
Budget 2014 | | | 1,968 | | | | 2,056 | | | | 2,150 | | | | 2,244 | | | | 2,339 | | | | - | | | | | | | |
2014 Fall Update | | | 1,977 | | | | 2,062 | | | | 2,153 | | | | 2,249 | | | | 2,345 | | | | 2,442 | | | | | | | |
Difference between 2014 Fall Update and Budget 2014 | | | 9 | | | | 5 | | | | 4 | | | | 5 | | | | 6 | | | | - | | | | | | | |
| | | | | | | | |
3-Month Treasury Bill Rate | | | | | | | | | | | | | | | | | | | | | | | | | | | | | | |
Budget 2014 | | | 1.0 | | | | 1.5 | | | | 2.7 | | | | 3.6 | | | | 4.0 | | | | - | | | | 2.6 | | | |
2014 Fall Update | | | 0.9 | | | | 1.2 | | | | 2.1 | | | | 2.9 | | | | 3.4 | | | | 3.6 | | | | 2.1 | | | |
| | | | | | | | |
10-Year Government Bond Rate | | | | | | | | | | | | | | | | | | | | | | | | | | | | | | |
Budget 2014 | | | 3.0 | | | | 3.5 | | | | 4.1 | | | | 4.6 | | | | 4.8 | | | | - | | | | 4.0 | | | |
2014 Fall Update | | | 2.3 | | | | 3.0 | | | | 3.6 | | | | 4.1 | | | | 4.3 | | | | 4.4 | | | | 3.5 | | | |
| | | | | | | | |
Exchange Rate (US cents/C$) | | | | | | | | | | | | | | | | | | | | | | | | | | | | | | |
Budget 2014 | | | 93.7 | | | | 95.3 | | | | 95.9 | | | | 96.2 | | | | 96.3 | | | | - | | | | 95.5 | | | |
2014 Fall Update | | | 91.3 | | | | 89.6 | | | | 90.8 | | | | 90.6 | | | | 90.8 | | | | 91.1 | | | | 90.6 | | | |
| | | | | | | | |
Unemployment Rate | | | | | | | | | | | | | | | | | | | | | | | | | | | | | | |
Budget 2014 | | | 6.8 | | | | 6.6 | | | | 6.4 | | | | 6.3 | | | | 6.2 | | | | - | | | | 6.5 | | | |
2014 Fall Update | | | 7.0 | | | | 6.8 | | | | 6.5 | | | | 6.4 | | | | 6.3 | | | | 6.3 | | | | 6.6 | | | |
| | | | | | | | |
Consumer Price Index Inflation | | | | | | | | | | | | | | | | | | | | | | | | | | | | | | |
Budget 2014 | | | 1.5 | | | | 1.9 | | | | 2.0 | | | | 2.0 | | | | 2.0 | | | | - | | | | 1.9 | | | |
2014 Fall Update | | | 2.0 | | | | 1.9 | | | | 2.0 | | | | 2.0 | | | | 2.0 | | | | 2.0 | | | | 2.0 | | | |
| | | | | | | | |
U.S. Real GDP Growth | | | | | | | | | | | | | | | | | | | | | | | | | | | | | | |
Budget 2014 | | | 2.7 | | | | 3.1 | | | | 3.0 | | | | 2.9 | | | | 2.6 | | | | - | | | | 2.9 | | | |
2014 Fall Update | | | 2.1 | | | | 3.1 | | | | 2.9 | | | | 2.8 | | | | 2.5 | | | | 2.5 | | | | 2.7 | | | |
| 1 | Figures have been restated due to historical revisions to the Canadian System of National Accounts from Statistics Canada released on November 5, 2014. |
Sources: For Budget 2014, the Department of Finance’s December 2013 survey of private sector economists; for the 2014 Fall Update, the September 2014 survey of private sector economists.
43
| | |
| | |
| | Chapter 2 |
Adjustment to the September Survey of Private Sector Economists
The September survey of private sector economists was completed in the first half of September, prior to the recent financial market volatility and the acceleration in the decline in Canadian crude oil prices in mid-October.
The September survey is consistent with an outlook of U.S. WTI crude oil prices of approximately US$98 per barrel in the fourth quarter of 2014, largely unchanged from their levels in the third quarter. However, WTI crude oil prices have declined by just over 15 per cent from third-quarter levels, averaging about US$81 per barrel since mid-October. This decline3 is likely to weigh on real GDP growth, but more importantly, on Canada’s terms of trade (the ratio of our export prices to our import prices) and therefore economy-wide prices (GDP inflation). At the same time, lower crude oil prices have also been accompanied by a lower level of the Canadian dollar, which has offset some of the oil price decline in Canadian-dollar terms and provided support to exporters in other industries. In addition, lower crude oil prices are translating into reduced prices for gasoline and other fuels, reducing costs for households and businesses. However, the Department of Finance expects the decline in crude oil prices to reduce the level of nominal GDP, and, therefore, the Government’s revenues.
If crude oil prices were to remain near their current levels, the Department of Finance estimates that this would reduce the level of nominal GDP by approximately $3 billion in 2014 and $16 billion per year thereafter, relative to the levels forecast in the September 2014 survey. To account for this decline in crude oil prices, the Government is therefore reducing the September private sector forecast for nominal GDP by $3 billion in 2014 and by $16 billion per year over the 2015–2019 period (Table 2.2). The impact of this adjustment on the fiscal projection is described in Chapter 3.
As a result, the projected level of nominal GDP in the adjusted September survey is $6 billion higher in 2014 and $10 billion to $12 billion lower over the 2015 to 2018 period, compared to the outlook in Budget 2014.
Table 2.2
Adjusted Forecast for Nominal GDP
billions of dollars
| | | | | | | | | | | | | | | | | | | | | | | | |
| | | 2014 | | | 2015 | | | 2016 | | | 2017 | | | 2018 | | | 2019 | |
September 2014 survey of private sector economists1 | | | 1,977 | | | | 2,062 | | | | 2,153 | | | | 2,249 | | | | 2,345 | | | | 2,442 | |
Adjustment for lower crude oil prices | | | -3 | | | | -16 | | | | -16 | | | | -16 | | | | -16 | | | | -16 | |
Adjusted September 2014 survey of private sector economists | | | 1,974 | | | | 2,046 | | | | 2,137 | | | | 2,233 | | | | 2,329 | | | | 2,426 | |
Difference between Update 2014 and Budget 20141 | | | 6 | | | | -11 | | | | -12 | | | | -11 | | | | -10 | | | | — | |
| 1 | Annual nominal GDP levels have been restated to reflect historical revisions to the Canadian System of National Accounts, as noted in Table 2.1 above. |
| 3 | In practice, the impact on nominal GDP is determined by Canadian crude oil prices, not the U.S. WTI benchmark. However, as Canadian crude oil prices have also declined by just over 15 per cent relative to their third-quarter levels (from US$83 per barrel to US$70 per barrel on average since mid-October), the impact on nominal GDP is the same regardless of the benchmark used. |
44
| | |
| | | |
| Economic Developments and Prospects | |
Risk Assessment
On October 14, 2014, the Minister of Finance met with the private sector economists to discuss the economic projections resulting from the September 2014 survey, as well as the risks surrounding the outlook. At that time, the economists agreed that the average forecast from the September survey was a reasonable basis for fiscal planning. However, the economists also noted that there was some downside risk to GDP inflation in the September survey given how oil prices were evolving. This risk has since materialized, as discussed above, and the Government has lowered the private sector outlook for nominal GDP in the September survey accordingly.
This being said, downside risks to this updated nominal GDP outlook remain, and are to a large extent external to the Canadian economy. In the euro area, the economic recovery appears to be uncertain and the risk of deflation is rising. In China, the challenges that the authorities face in introducing necessary policy reforms on the one hand, and maintaining their targeted growth objectives on the other, could lead to slower and more variable-than-expected growth. There is also the risk posed by ongoing geopolitical unrest in Ukraine and the Middle East.
Against this ongoing backdrop of weak and uncertain global growth, there had been broad-based concern that financial markets were underpricing risk in their search for higher returns. This concern reflected the steady gains in equity prices, and a reduction in risk spreads and market volatility to very low levels, which had occurred through 2013 and into late 2014. Some unwinding of these developments took place beginning in mid-September. As the U.S. Federal Reserve continued on its path towards normalization of its monetary policy and on the heels of a spate of negative economic news from the euro area and China, global equity prices retreated, government bond yields in advanced economies fell, risk spreads widened and overall financial market volatility spiked. More recently, global financial markets appear to have stabilized to some extent. However, should financial market volatility re-emerge, or become deeper and more enduring, this would weigh further on global and Canadian growth.
Along with the rise in volatility in global equities, considerable uncertainty remains over commodity prices, particularly for crude oil. While the outlook presented here has been adjusted to reflect recent declines in Canadian crude oil prices, the potential for further declines remains, particularly if global growth once again surprises on the downside. As discussed above, further crude oil price declines would dampen growth in economy-wide prices and ultimately nominal GDP.
45
| | |
| | |
| | Chapter 2 |
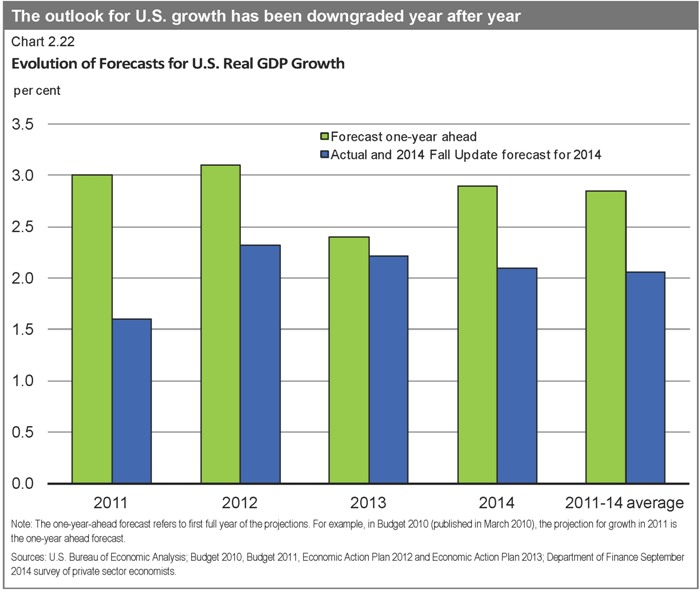
In contrast to these developments, in the U.S. the recovery appears to be gaining traction. Surveys of business activity and consumer confidence are at or near post-recession highs, and this could translate into stronger-than-expected growth. On the downside, however, growth may once again not pick up as expected, similar to the pattern of the last few years (Chart 2.22). In particular, despite strong fundamentals, the anticipated improvement in domestic demand significantly lagged expectations in the first half of the year, suggesting that underlying economic momentum may have weakened. The potential for weaker domestic demand could also be triggered, and exacerbated, by the recent rise in global market volatility.
46
| | |
| | | |
| Economic Developments and Prospects | |
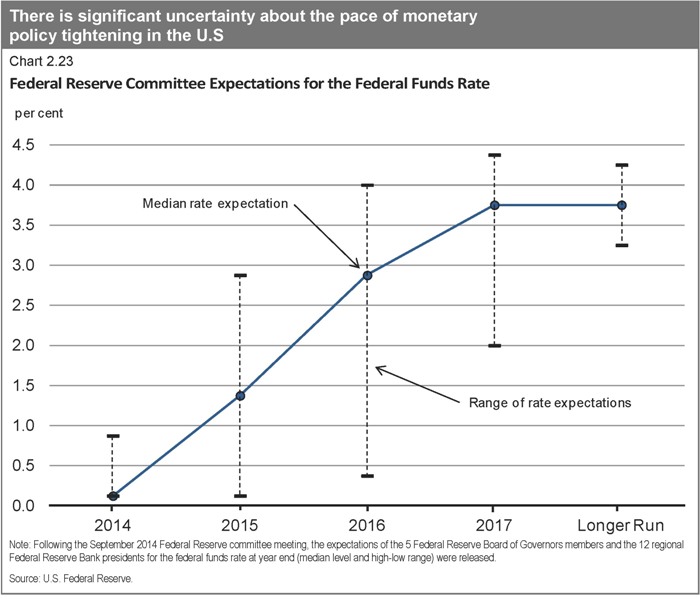
Interest rates are expected to normalize in the U.S. and other advanced economies from their low levels since the recession. However, even before the recent period of global financial market volatility, there was significant divergence in expectations about the pace of tightening among the Federal Reserve governors and regional bank presidents that form the body that determines the U.S. monetary policy stance (Chart 2.23). On the one hand, interest rates may again come in below expectations if global growth continues to disappoint, as has been the pattern over the past few years. However, it is also possible that monetary policy may tighten more quickly if U.S. growth or inflation pick up more than expected. Recent global developments have further increased the uncertainty around the timing of policy rate normalization.
On the domestic front, household debt remains the main risk to the Canadian outlook. Although household debt accumulation has moderated and the household debt-to-income ratio has broadly stabilized, there remains the risk that, given the ongoing low rate environment, stronger-than-expected underlying momentum in housing market activity could translate into further debt accumulation. As well, the lack of momentum in business investment, if maintained, would pose a downside risk to Canada’s near-term growth prospects.
47
| | |
| | |
| | Chapter 2 |
Planning Assumptions
As discussed above, in light of the impact of recent declines in crude oil prices, the Government is reducing the private sector forecast for nominal GDP by $3 billion in 2014 and by $16 billion per year over the 2015 to 2019 period. Further, to address the risks posed by uncertainty over the global economic outlook and the possibility of further declines in crude oil prices, for fiscal planning purposes, the Government has maintained the downward adjustment for risk to the private sector forecast for nominal GDP for 2014 at $20 billion, whereas in recent years, the adjustment for risk for the year underway had been lowered. For the 2015 through 2019 period, the adjustment for risk has been maintained at $20 billion included in Budget 2014 (Table 2.3) The Government will continue to evaluate economic developments and risks to determine whether or not it would be appropriate to maintain this adjustment for risk in the future. The fiscal outlook, including the fiscal impact of the adjustment for risk, is presented in Chapter 3.
Table 2.3
2014 Fall Update Planning Assumption for Nominal GDP
billions of dollars
| | | | | | | | | | | | | | | | | | | | | | | | |
| | | 2014 | | | 2015 | | | 2016 | | | 2017 | | | 2018 | | | 2019 | |
| | | | | | |
Adjusted September 2014 survey of private sector economists | | | 1,974 | | | | 2,046 | | | | 2,137 | | | | 2,233 | | | | 2,329 | | | | 2,426 | |
Adjustment for risk | | | -20 | | | | -20 | | | | -20 | | | | -20 | | | | -20 | | | | -20 | |
2014 Fall Update fiscal planning assumption | | | 1,954 | | | | 2,026 | | | | 2,117 | | | | 2,213 | | | | 2,309 | | | | 2,406 | |
Addendum | | | | | | | | | | | | | | | | | | | | | | | | |
Adjustment for risk in Budget 2014 | | | -20 | | | | -20 | | | | -20 | | | | -20 | | | | -20 | | | | - | |
48
| | |
| | | |
| Fiscal Situation and Outlook | |
CHAPTER 3
FISCAL SITUATIONAND OUTLOOK
While the Canadian economy has recovered from the global recession better than other Group of Seven (G-7) economies, the global economic environment remains fragile and risks continue to weigh on global growth prospects. Canada is not immune to these external developments. By continuing to control growth in direct program spending, the Government has been able to provide significant tax relief to Canadian families while remaining on track to return to balanced budgets in 2015.
The deficit has been reduced from $55.6 billion in 2009–10 to $5.2 billion in 2013–14. A deficit of $2.9 billion is projected in 2014–15 after taking into account the set-aside for contingencies. Looking forward, after taking into account recently announced measures, a surplus of $1.9 billion is projected for 2015–16, with surpluses increasing to $13.1 billion in 2019–20.
This chapter reviews the major fiscal developments since Budget 2014 and updates the Government’s fiscal projections for the 2014–15 to 2019–20 period.
Fiscal Planning Assumptions
To ensure objectivity and transparency, the economic forecast underlying the Government’s fiscal projections is based on an average of private sector economic forecasts. As discussed in Chapter 2, in light of the impact of recent declines in crude oil prices, which accelerated between the time of the forecast and the Update, the Government has reduced the private sector forecast for nominal gross domestic product (GDP) by $3 billion in 2014 and $16 billion per year over the 2015–2019 period. This lower level of nominal GDP translates into a reduction in government revenues and, hence, lowers the budgetary balance by $0.5 billion in 2014–15 and by $2.5 billion per year over the 2015–2019 period. Furthermore, the Government has judged it appropriate to maintain the adjustment for risk at $20 billion per year, translating into a set-aside of $3.0 billion per year between 2014–15 and 2019–20 for contingencies. If the set-aside for contingencies is not required, it will be used to reduce the federal debt.
Table 3.1
Planning Assumptions for the 2014 Update of Economic and Fiscal Projections
billions of dollars
| | | | | | | | | | | | | | | | | | | | | | | | |
| | | 2014–15 | | | 2015–16 | | | 2016–17 | | | 2017–18 | | | 2018–19 | | | 2019–20 | |
| | | | | | |
Set-aside for contingencies | | | -3.0 | | | | -3.0 | | | | -3.0 | | | | -3.0 | | | | -3.0 | | | | -3.0 | |
| | | | | | | | | | | | | | | | | | | | | | | | | |
49
| | |
| | |
| | Chapter 3 |
Changes in the Fiscal Outlook Since Budget 2014
While the global economy remains fragile, economic and fiscal developments have modestly improved the budgetary balance since Budget 2014. As a result, adjusting for the significant tax relief and enhanced benefits for Canadian families and small businesses, the projected budgetary balance remains broadly in line with Budget 2014 projections. Table 3.2 provides a summary of the changes in the fiscal projections between Budget 2014 and this Update.
Table 3.2
Summary of Changes in the Fiscal Outlook Since Budget 2014
billions of dollars
| | | | | | | | | | | | | | | | | | | | | | | | | | | | |
| | | | | | Projection | |
| | | 2013–14 | | | 2014–15 | | | 2015–16 | | | 2016–17 | | | 2017–18 | | | 2018–19 | | | 2019–20 | |
Budget 2014 budgetary balance | | | -16.6 | | | | -2.9 | | | | 6.4 | | | | 8.1 | | | | 8.1 | | | | 10.3 | | | | n/a | |
Accounting adjustment | | | 0.7 | | | | | | | | | | | | | | | | | | | | | | | | | |
| | | | | | | |
Budget 2014 budgetary balance, restated1 | | | -15.9 | | | | -2.9 | | | | 6.4 | | | | 8.1 | | | | 8.1 | | | | 10.3 | | | | n/a | |
Add: Set-aside for contingencies in Budget 2014 | | | 1.5 | | | | 3.0 | | | | 3.0 | | | | 3.0 | | | | 3.0 | | | | 3.0 | | | | | |
| | | | | | | |
Budget 2014 budgetary balance before set-aside for contingencies | | | -14.4 | | | | 0.1 | | | | 9.4 | | | | 11.1 | | | | 11.1 | | | | 13.3 | | | | n/a | |
| | | | | | | |
Impact of economic and fiscal developments2 | | | | | | | | | | | | | | | | | | | | | | | | | | | | |
Budgetary revenues | | | 6.2 | | | | 3.2 | | | | 1.0 | | | | 0.6 | | | | 0.5 | | | | 0.1 | | | | | |
Program expenses | | | 2.6 | | | | -1.2 | | | | -1.8 | | | | -1.3 | | | | -0.9 | | | | -0.7 | | | | | |
Public debt charges1 | | | 0.4 | | | | 1.2 | | | | 1.2 | | | | 1.8 | | | | 2.1 | | | | 1.9 | | | | | |
Total economic and fiscal developments | | | 9.2 | | | | 3.2 | | | | 0.5 | | | | 1.1 | | | | 1.8 | | | | 1.4 | | | | | |
| | | | | | | |
Measures since Budget 2014 | | | | | | | | | | | | | | | | | | | | | | | | | | | | |
Supporting Canadian families and small businesses | | | | | | | -3.2 | | | | -5.0 | | | | -4.9 | | | | -4.7 | | | | -4.8 | | | | -4.9 | |
| | | | | | | |
2014 Update budgetary balance before set-aside for contingencies | | | -5.2 | | | | 0.1 | | | | 4.9 | | | | 7.3 | | | | 8.1 | | | | 9.8 | | | | 16.1 | |
Less: Set-aside for contingencies | | | | | | | -3.0 | | | | -3.0 | | | | -3.0 | | | | -3.0 | | | | -3.0 | | | | -3.0 | |
| | | | | | | |
2014 Update budgetary balance | | | -5.2 | | | | -2.9 | | | | 1.9 | | | | 4.3 | | | | 5.1 | | | | 6.8 | | | | 13.1 | |
Note: Totals may not add due to rounding.
| 1 | The Budget 2014 forecast of the 2013–14 budgetary balance was restated in the Annual Financial Report of the Government of Canada—Fiscal Year 2013– 2014, from $16.6 billion in Budget 2014 to $15.9 billion. The restatement was made to reflect an accounting change in 2013–14 relating to bond buybacks, which has resulted in a roughly $700-million decrease in budgeted public debt charges. Restating budget forecasts on a retroactive basis to reflect accounting changes is consistent with generally accepted accounting principles and past practice. |
| 2 | A negative number implies a deterioration in the budgetary balance (lower revenues or higher spending). A positive number implies an improvement in the budgetary balance (higher revenues or lower spending). |
50
| | |
| | | |
| Fiscal Situation and Outlook | |
|
Restatement of Budget 2014 Forecast for 2013–14 to Reflect Change in Accounting
Treatment of Bond Buybacks |
Accounting changes and restatements of previous years’ actual results were made in 2013–14, and are described in greater detail in the notes to the audited Condensed Consolidated Financial Statements of the Government of Canada included in the Annual Financial Report of the Government of Canada—Fiscal Year 2013–2014. The fiscal outlook tables and charts in this Update reflect these restatements.
To enhance the comparability of the forecasted and actual results, the Budget 2014 forecast of the 2013–14 budgetary deficit was also restated, from $16.6 billion to $15.9 billion. This restatement was made to reflect an accounting change in 2013–14 relating to bond buybacks, which resulted in an approximately $700-million decrease in budgeted public debt charges in 2013–14.
The Government of Canada engages in bond buyback operations in which bonds are exchanged or repurchased and refinanced with similar debt with the intent of sustaining market liquidity. Previously, premiums and discounts arising from these transactions were deferred and amortized. In light of developments regarding generally accepted accounting principles, these premiums and discounts on the buyback of bonds that result in the extinguishment of debt will now be expensed in the year they are incurred.
Impact of Economic and Fiscal Developments
The $5.2-billion deficit in 2013–14 was down from an $18.4-billion deficit in 2012–13 and was $10.7 billion lower than the restated $15.9-billion deficit forecast in Budget 2014. Revenues in 2013–14 were $6.2 billion higher than projected in Budget 2014, reflecting unanticipated gains in all major revenue streams due, in part, to a number of specific one-time factors. These one-time factors include large tax assessments and foreign exchange gains, which do not carry forward to future years. In addition, the $1.5-billion set-aside for contingencies included in the Budget 2014 revenue projection was not required. Program expenses in 2013–14 were $2.6 billion lower than forecast, largely reflecting a $1.2-billion reduction in the estimated federal liability under the Disaster Financial Assistance Arrangements for assistance related to the 2013 flood in Alberta, following updated information from the province.
Compared to Budget 2014, projected budgetary revenues are higher over the forecast horizon, reflecting the partial carry-forward of better-than-expected revenue results for 2013–14. The improvement in the revenue outlook diminishes over the forecast horizon as a result of the downward revisions to the outlook for nominal GDP as a result of significant reductions in commodity prices, and the impact of lower interest rates, which decrease the rate of return on the Government’s interest-bearing assets, recorded as part of other revenues.
51
| | |
| | |
| | Chapter 3 |
Changes to Budget 2014 Asset Sales Provision
billions of dollars
| | | | | | | | | | | | | | | | | | | | | | | | |
| | | Projection | |
| | | 2014–15 | | | 2015–16 | | | 2016–17 | | | 2017–18 | | | 2018–19 | | | 2019–20 | |
Budget 2014 asset sales provision | | | 0.5 | | | | 1.5 | | | | | | | | | | | | | | | | | |
Less: Spectrum auction revenues | | | 0.3 | | | | 0.3 | | | | 0.3 | | | | 0.3 | | | | 0.3 | | | | 0.3 | |
| | | | | | |
Impact on budgetary balance | | | 0.0 | | | | 0.0 | | | | 0.3 | | | | 0.3 | | | | 0.3 | | | | 0.3 | |
Remaining asset sales provision | | | 0.2 | | | | 1.2 | | | | | | | | | | | | | | | | | |
The provision of $0.5 billion in 2014–15 and $1.5 billion in 2015–16 for future asset sales was introduced in the 2013 Update of Economic and Fiscal Projections and maintained in Budget 2014. This provision reflected expected gains from actions the Government has undertaken to systematically review federally owned assets to improve their efficiency and effectiveness and to ensure value for taxpayers. This review seeks to ensure that government ownership of federal assets remains in the best interests of Canadians. If it is determined that divestiture of an asset would create economic value and would represent the most efficient use of taxpayer resources, the Government will proceed with a sale process.
Since Budget 2014, the Government has completed the 700-megahertz spectrum auction. Consistent with the Government’s accounting policy, the revenues from this auction will be recognized evenly over the 20-year term of the licences.
This leaves the remaining asset sales provision at $0.2 billion for 2014–15 and $1.2 billion for 2015–16, amounts that the Government judges to be conservative and not reflective of the full potential gain that could be realized from the expected sale of assets.
Program expenses are expected to be above the level projected in Budget 2014 over the forecast horizon, driven largely by changes to employee pension and benefit expenses which have increased direct program expenses. This is largely due to changes to demographic assumptions and a change in the timing of when employee pension and benefit liabilities are expensed. Because long-term interest rates, which are used to discount those liabilities, are now expected to be lower than previously projected, relatively more of those liabilities must be expensed in the near term as opposed to the future. That said, the long-term total pension and benefit liability of the Government has not changed as a result of changes in interest rates. The outlook for direct program expenses has also been revised to reflect changes to the forecast for capital amortization expenses.
Public debt charges are expected to be lower than projected in Budget 2014 over the entire forecast horizon, largely due to lower projected interest rates, as well as the ongoing impact of the change in the accounting treatment of bond buybacks.
52
| | |
| | | |
| Fiscal Situation and Outlook | |
Supporting Canadian Families and Small Businesses
On October 30, 2014, the Government proposed new measures to help make life more affordable for Canadian families. All families with children are expected to benefit from these measures, which include a new Family Tax Cut, an increase and expansion of the Universal Child Care Benefit and an increase in the Child Care Expense Deduction dollar limits. Earlier in the month, on October 9, 2014, the Government also announced its intention to double the Children’s Fitness Tax Credit and make it refundable. Taken together, these measures will provide Canadian families with children with additional tax relief and enhanced benefits of $3.1 billion in 2014–15, and more than $4.6 billion per year in 2015–16 and beyond.
All Canadians are benefiting from the Government’s long-term commitment to keeping taxes low. Since 2006, the Government has introduced close to 180 tax relief measures. As a result of actions taken since 2006, including the recently proposed measures, Canadian families and individuals will receive about $35 billion in tax relief and increased benefits in 2014–15. Going forward, the Government will continue to examine ways of reducing the tax burden on Canadians.
In September 2013, the Government announced a three-year freeze of the Employment Insurance (EI) rate at its 2013 level of $1.88 per $100 of insurable earnings to prevent it from rising to $1.93 in 2014, saving employers and employees an expected $660 million in 2014 alone.
Building on this measure, on September 11, 2014, the Government announced further action to create jobs, growth and long-term prosperity with the introduction of the new Small Business Job Credit. The credit is expected to save small businesses more than $550 million over 2015 and 2016, by effectively lowering small businesses’ EI premiums from the current legislated rate of $1.88 to $1.60 per $100 of insurable earnings in 2015 and 2016. Any firm that pays employer EI premiums equal to or less than $15,000 in those years will be eligible for the credit, representing close to 90 per cent of all EI premium-paying businesses in Canada. The Canada Revenue Agency will automatically calculate the credit on a business’ T4 information return, ensuring that no new paper burden will be imposed on business owners.
In addition, all employers and employees will benefit from a substantial reduction in the EI premium rate in 2017 from the currently legislated $1.88 per $100 of insurable earnings to an estimated $1.45 when the new seven-year break-even rate-setting mechanism takes effect. This will ensure that EI premiums are no higher than needed to pay for the EI program over time.
Altogether, measures taken by the Government since Budget 2014 to support Canadian families and small businesses total $27.6 billion over six years.
53
| | |
| | |
| | Chapter 3 |
Summary Statement of Transactions
Table 3.3 summarizes the Government’s financial position over the forecast horizon. These projections are based on the adjusted average private sector forecast for the economy as described in Chapter 2, and the set-aside for contingencies discussed above.
Table 3.3
Summary Statement of Transactions
billions of dollars
| | | | | | | | | | | | | | | | | | | | | | | | | | | | |
| | | | | | Projection | |
| | | 2013–14 | | | 2014–15 | | | 2015–16 | | | 2016–17 | | | 2017–18 | | | 2018–19 | | | 2019–20 | |
| | | | | | | |
Budgetary revenues | | | 271.7 | | | | 277.6 | | | | 294.5 | | | | 307.6 | | | | 318.6 | | | | 332.8 | | | | 347.9 | |
Program expenses | | | 248.6 | | | | 252.7 | | | | 263.9 | | | | 273.0 | | | | 281.3 | | | | 292.2 | | | | 299.6 | |
Public debt charges | | | 28.2 | | | | 27.7 | | | | 28.7 | | | | 30.4 | | | | 32.3 | | | | 33.8 | | | | 35.2 | |
Total expenses | | | 276.8 | | | | 280.5 | | | | 292.6 | | | | 303.3 | | | | 313.6 | | | | 326.1 | | | | 334.8 | |
| | | | | | | |
Budgetary balance | | | -5.2 | | | | -2.9 | | | | 1.9 | | | | 4.3 | | | | 5.1 | | | | 6.8 | | | | 13.1 | |
Federal debt1 | | | 611.9 | | | | 615.8 | | | | 613.9 | | | | 609.5 | | | | 604.4 | | | | 597.6 | | | | 584.5 | |
| | | | | | | |
Per cent of GDP | | | | | | | | | | | | | | | | | | | | | | | | | | | | |
Budgetary revenues | | | 14.3 | | | | 14.2 | | | | 14.5 | | | | 14.5 | | | | 14.4 | | | | 14.4 | | | | 14.5 | |
Program expenses | | | 13.1 | | | | 12.9 | | | | 13.0 | | | | 12.9 | | | | 12.7 | | | | 12.7 | | | | 12.5 | |
Public debt charges | | | 1.5 | | | | 1.4 | | | | 1.4 | | | | 1.4 | | | | 1.5 | | | | 1.5 | | | | 1.5 | |
Budgetary balance | | | -0.3 | | | | -0.1 | | | | 0.1 | | | | 0.2 | | | | 0.2 | | | | 0.3 | | | | 0.5 | |
Federal debt | | | 32.3 | | | | 31.5 | | | | 30.3 | | | | 28.8 | | | | 27.3 | | | | 25.9 | | | | 24.3 | |
| | | | | | | | | | | | | | | | | | | | | | | | | | | | | |
Note: Totals may not add due to rounding.
| 1 | The projected level of federal debt for 2014–15 includes an estimate of other comprehensive income. |
54
| | |
| | | |
| Fiscal Situation and Outlook | |
As a result of the Government’s responsible management of public finances, a surplus of $1.9 billion is projected for 2015–16, growing to a surplus of $13.1 billion in 2019–20 (Chart 3.1).
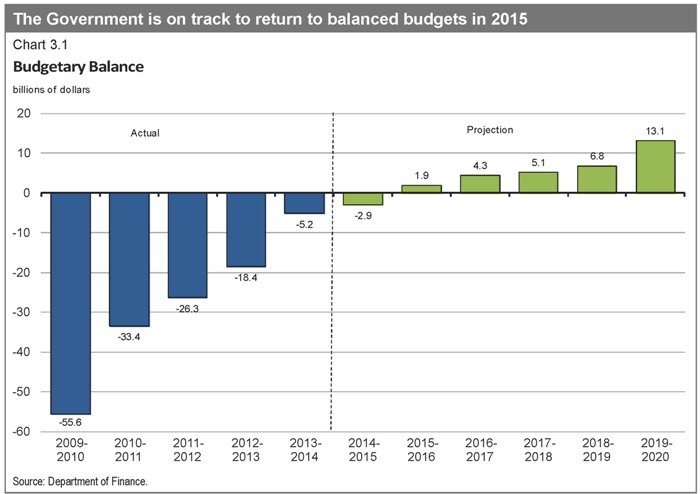
55
| | |
| | |
| | Chapter 3 |
The federal debt-to-GDP ratio (accumulated deficit) fell to 32.3 per cent in 2013–14 and is projected to steadily continue on a downward path, putting the Government well on its way to meeting its commitment to reduce the federal debt to 25 per cent of GDP by 2021. Indeed, the federal debt-to-GDP ratio is expected to fall to below its pre-recession level by 2017 (Chart 3.2). This will help to ensure that Canada’s total government net debt-to-GDP ratio (which includes that of the federal, provincial, territorial and local governments as well as the net assets of the Canada Pension Plan and Québec Pension Plan) continues to decline. Indeed, the International Monetary Fund (IMF) projects that Canada’s total government net debt-to-GDP ratio will remain the lowest of any G-7 country.
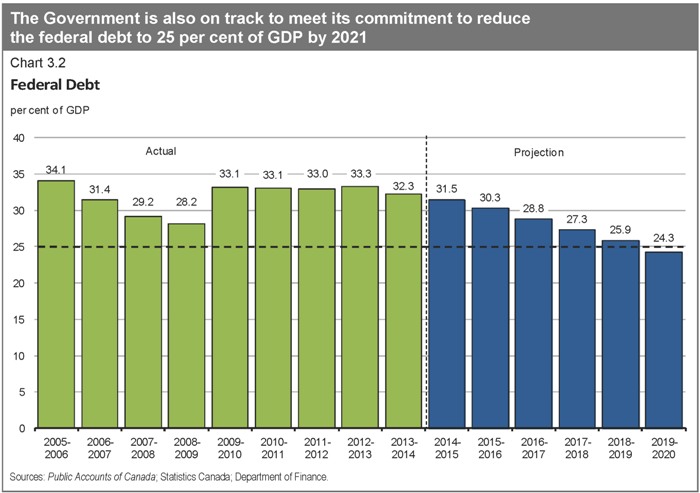
56
| | |
| | | |
| Fiscal Situation and Outlook | |
Outlook for Budgetary Revenues
Table 3.4
Revenue Outlook
billions of dollars
| | | | | | | | | | | | | | | | | | | | | | | | | | | | |
| | | | | | | | | | | | Projection | | | | | | | | | | |
| | | 2013–14 | | | 2014–15 | | | 2015–16 | | | 2016–17 | | | 2017–18 | | | 2018–19 | | | 2019–20 | |
| | | | | | | |
Income taxes | | | | | | | | | | | | | | | | | | | | | | | | | | | | |
Personal income tax | | | 130.8 | | | | 134.2 | | | | 143.9 | | | | 152.3 | | | | 160.1 | | | | 167.1 | | | | 175.1 | |
Corporate income tax | | | 36.6 | | | | 38.3 | | | | 40.4 | | | | 42.6 | | | | 44.3 | | | | 46.1 | | | | 48.2 | |
Non-resident income tax | | | 6.4 | | | | 6.4 | | | | 6.5 | | | | 7.0 | | | | 7.5 | | | | 7.9 | | | | 8.3 | |
Total income tax | | | 173.8 | | | | 178.9 | | | | 190.9 | | | | 201.9 | | | | 211.9 | | | | 221.1 | | | | 231.6 | |
| | | | | | | |
Excise taxes/duties | | | | | | | | | | | | | | | | | | | | | | | | | | | | |
Goods and Services Tax | | | 31.0 | | | | 31.8 | | | | 33.5 | | | | 35.4 | | | | 37.2 | | | | 38.9 | | | | 40.6 | |
Customs import duties | | | 4.2 | | | | 4.5 | | | | 5.0 | | | | 4.6 | | | | 4.8 | | | | 5.0 | | | | 5.2 | |
Other excise taxes/duties | | | 10.9 | | | | 11.5 | | | | 11.5 | | | | 11.5 | | | | 11.5 | | | | 11.5 | | | | 11.5 | |
Total excise taxes/duties | | | 46.1 | | | | 47.8 | | | | 50.0 | | | | 51.4 | | | | 53.5 | | | | 55.4 | | | | 57.3 | |
| | | | | | | |
Total tax revenues | | | 219.9 | | | | 226.7 | | | | 240.9 | | | | 253.3 | | | | 265.4 | | | | 276.5 | | | | 288.9 | |
Employment Insurance premium revenues | | | 21.8 | | | | 22.6 | | | | 23.3 | | | | 22.9 | | | | 19.4 | | | | 20.1 | | | | 21.0 | |
Other revenues | | | 30.0 | | | | 28.3 | | | | 30.3 | | | | 31.4 | | | | 33.9 | | | | 36.2 | | | | 38.0 | |
| | | | | | | |
Total budgetary revenues | | | 271.7 | | | | 277.6 | | | | 294.5 | | | | 307.6 | | | | 318.6 | | | | 332.8 | | | | 347.9 | |
| | | | | | | |
Per cent of GDP | | | | | | | | | | | | | | | | | | | | | | | | | | | | |
Personal income tax | | | 6.9 | | | | 6.9 | | | | 7.1 | | | | 7.2 | | | | 7.2 | | | | 7.2 | | | | 7.3 | |
Corporate income tax | | | 1.9 | | | | 2.0 | | | | 2.0 | | | | 2.0 | | | | 2.0 | | | | 2.0 | | | | 2.0 | |
Goods and Services Tax | | | 1.6 | | | | 1.6 | | | | 1.7 | | | | 1.7 | | | | 1.7 | | | | 1.7 | | | | 1.7 | |
Total tax revenues | | | 11.6 | | | | 11.6 | | | | 11.9 | | | | 12.0 | | | | 12.0 | | | | 12.0 | | | | 12.0 | |
Employment Insurance premium revenues | | | 1.1 | | | | 1.2 | | | | 1.2 | | | | 1.1 | | | | 0.9 | | | | 0.9 | | | | 0.9 | |
Other revenues | | | 1.6 | | | | 1.4 | | | | 1.5 | | | | 1.5 | | | | 1.5 | | | | 1.6 | | | | 1.6 | |
Total | | | 14.3 | | | | 14.2 | | | | 14.5 | | | | 14.5 | | | | 14.4 | | | | 14.4 | | | | 14.5 | |
Note: Totals may not add due to rounding.
Table 3.4 sets out the Government’s projection for budgetary revenues after factoring in the set-aside for contingencies. For planning purposes, the set-aside for contingencies is allocated proportionally to tax revenues and other revenues, net of flow-through revenues. Revenues are expected to increase by 2.2 per cent in
2014–15. Over the remainder of the forecast horizon, revenues are projected to grow at an average annual rate of 4.6 per cent.
Personal income tax revenues—the largest component of budgetary revenues—are projected to increase by only $3.4 billion or 2.6 per cent in 2014–15, reflecting the introduction of tax relief measures for families via the new Family Tax Cut. Over the remainder of the projection period, personal income tax revenues are forecast to increase somewhat faster than growth in nominal GDP, averaging 5.5 per cent annual growth, reflecting the progressive nature of the income tax system combined with projected real income gains.
57
| | |
| | |
| | Chapter 3 |
Corporate income tax revenues are projected to increase by $1.7 billion, or 4.8 per cent, in 2014–15, reflecting growth in corporate taxable income. Over the remainder of the projection period, corporate income tax revenues are forecast to grow at an annual rate of 4.7 per cent, based on projected profit growth, previously announced actions to close tax loopholes and improve the fairness and integrity of the tax system, and changes to the Canada Revenue Agency’s compliance programs.
Non-resident income tax revenues are income taxes paid by non-residents of Canada on Canadian-sourced income, notably dividends and interest payments. For 2014–15, non-resident income tax revenues are projected to remain at the same level as in 2013–14 ($6.4 billion), as non-resident income tax revenues were increased by one-time factors in 2013–14. Over the remainder of the forecast horizon, they are projected to increase at an average annual rate of 5.4 per cent, reflecting projected growth in corporate profits and dividends.
Goods and Services Tax (GST) revenues are projected to grow by 2.6 per cent in 2014–15 based on projected growth in taxable consumption and year-to-date results. Over the remainder of the projection period, GST revenues are projected to grow by 5.0 per cent per year on average, based on projected growth in taxable consumption and in the GST credit.
Customs import duties are projected to increase by 6.5 per cent in 2014–15, reflecting year-to-date results and projected growth in imports, followed by an increase of 10.4 per cent in 2015–16. However, customs import duties are projected to decline by 7.8 per cent in 2016–17, reflecting the expected impacts of the Canada-European Union Comprehensive Economic and Trade Agreement and the Canada-Korea Free Trade Agreement. Over the remainder of the projection period, annual growth in customs import duties is projected to average 4.2 per cent, based on projected growth in imports.
Other excise taxes and duties are projected to increase by 5.4 per cent to $11.5 billion in 2014–15, reflecting year-to-date results and adjustments to the excise duty rate for tobacco announced in Budget 2014, and are expected to remain stable over the remainder of the projection period.
Employment Insurance (EI) premium revenues are projected to grow by 3.8 per cent in 2014–15 and by 3.3 per cent in 2015–16, reflecting the growth in insurable earnings, as well as the offsetting impact of the Small Business Job Credit. Reflecting the introduction of the seven-year break-even rate mechanism in 2017, EI premium rates are expected to decrease to $1.45, bringing expected declines in EI premium revenues of 1.8 per cent in 2016–17 and 15.4 per cent in 2017–18. EI premium revenues are expected to resume their upward trend in 2018–19.
58
| | |
| | | |
| Fiscal Situation and Outlook | |
|
Employment Insurance Operating Account |
Employment Insurance Operating Account Projections
billions of dollars
| | | | | | | | | | | | | | | | | | | | | | | | | | | | |
| | | 2013–
2014 | | | 2014–
2015 | | | 2015–
2016 | | | 2016–
2017 | | | 2017–
2018 | | | 2018–
2019 | | | 2019–
2020 | |
EI premium revenues | | | 21.8 | | | | 22.6 | | | | 23.3 | | | | 22.9 | | | | 19.4 | | | | 20.1 | | | | 21.0 | |
EI benefits1 | | | 17.3 | | | | 17.6 | | | | 18.2 | | | | 18.8 | | | | 19.5 | | | | 20.3 | | | | 21.0 | |
| | | | | | | |
| | | 2013 | | | 2014 | | | 2015 | | | 2016 | | | 2017 | | | 2018 | | | 2019 | |
EI Operating Account annual balance2 | | | 2.9 | | | | 3.8 | | | | 3.9 | | | | 4.5 | | | | -1.3 | | | | -1.3 | | | | -1.3 | |
EI Operating Account cumulative balance2 | | | -5.2 | | | | -1.4 | | | | 2.5 | | | | 7.0 | | | | 5.6 | | | | 4.4 | | | | 3.1 | |
Reference: | | | | | | | | | | | | | | | | | | | | | | | | | | | | |
Projected premium rate (per $100 of insurable earnings) | | | 1.88 | | | | 1.88 | | | | 1.88 | | | | 1.88 | | | | 1.45 | | | | 1.45 | | | | 1.45 | |
| | 1 | EI benefits include regular EI benefits, sickness, maternity, parental, compassionate care, fishing and work-sharing benefits, and employment benefits and support measures. These represent 90 per cent of total EI program expenses. The remaining EI costs relate mainly to administration and are included in direct program expenses. | |
| | 2 | The EI Operating Account annual and cumulative balances are net of EI premium revenues and EI expenses, including administration costs. The balances are presented on a calendar-year basis since the EI premium rate is set on a calendar-year basis. | |
The EI Operating Account reached a cumulative deficit of $9.2 billion in 2011, due to the impact of the recession. Since then, the EI Operating Account has been recording annual surpluses which will eventually eliminate the cumulative deficit, consistent with the principle of breaking even over time. With the continued growth in EI premium revenues, annual surpluses are also expected for 2014 and 2015. As a result, the EI Operating Account is expected to return to cumulative balance in 2015.
The accumulated surplus will be gradually eliminated after the introduction of the seven-year break-even rate mechanism in 2017, resulting in a significant reduction in the premium rate that year. This new rate-setting mechanism will ensure that EI premiums are no higher than needed to pay for the EI program over time. The seven-year break-even rate will be set by the Canada Employment Insurance Commission, based on the projections of the EI Chief Actuary.
Other revenues include revenues from consolidated Crown corporations, net income from enterprise Crown corporations, returns on investments, foreign exchange revenues and proceeds from the sales of goods and services. These revenues are generally volatile, owing principally to the impact of interest rates on returns on investments and the assets in the Exchange Fund Account, and the net gains or losses from enterprise Crown corporations. These revenues are also affected by the impact of exchange rate movements on the Canadian-dollar value of foreign-denominated assets as well as flow-through items that give rise to an offsetting expense and therefore do not impact the budgetary balance.
For 2014–15, other revenues are projected to decrease by 5.7 per cent to $28.3 billion due in part to the fact that in 2013–14, other revenue results included two significant one-time transactions: the $0.7-billion gain realized by the Canada Development Investment Corporation on the Government’s sale of 30 million shares of General Motors common stock in September 2013; and a $0.6-billion gain on the March 27, 2014 sale of Macdonald House, a Canadian High Commission property in London. In addition, other revenues are lower in 2014–15 due to lower flow-through revenues, which are revenues that give rise to an equal and offsetting reduction in total expenses with no impact on the budgetary balance. Growth in other revenues is expected to average 6.1 per cent over the remainder of the forecast horizon, based on the projected profiles of interest rates and nominal GDP and the provision for future asset sales.
59
| | |
| | |
| | Chapter 3 |
The revenue-to-GDP ratio declined substantially since 2006–07 and is at its lowest level in more than 50 years, averaging just over 14 per cent since 2008–09 (Chart 3.3). This decline is due primarily to tax reduction measures. Over the forecast horizon, the revenue-to-GDP ratio is projected to remain relatively stable around its current level.
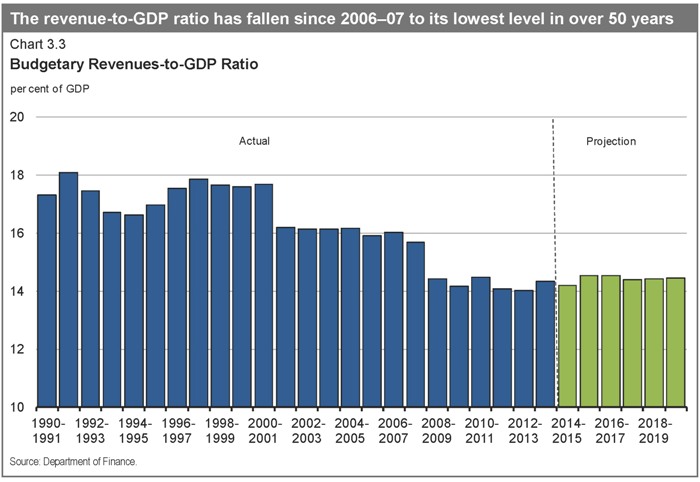
60
| | |
| | | |
| Fiscal Situation and Outlook | |
Outlook for Program Expenses
Table 3.5
Program Expenses Outlook
billions of dollars
| | | | | | | | | | | | | | | | | | | | | | | | | | | | |
| | | | | | Projection | |
| | | 2013–14 | | | 2014–15 | | | 2015–16 | | | 2016–17 | | | 2017–18 | | | 2018–19 | | | 2019–20 | |
Major transfers to persons | | | | | | | | | | | | | | | | | | | | | | | | | | | | |
Elderly benefits | | | 41.8 | | | | 43.9 | | | | 46.2 | | | | 48.8 | | | | 51.4 | | | | 54.3 | | | | 57.3 | |
Employment Insurance benefits1 | | | 17.3 | | | | 17.6 | | | | 18.2 | | | | 18.8 | | | | 19.5 | | | | 20.3 | | | | 21.0 | |
Children’s benefits | | | 13.1 | | | | 14.5 | | | | 18.3 | | | | 18.5 | | | | 18.7 | | | | 18.9 | | | | 19.1 | |
Total | | | 72.2 | | | | 76.0 | | | | 82.7 | | | | 86.1 | | | | 89.7 | | | | 93.4 | | | | 97.5 | |
| | | | |
Major transfers to other levels of government | | | | | | | | | | | | | | | | | |
Canada Health Transfer | | | 30.3 | | | | 32.1 | | | | 34.0 | | | | 36.1 | | | | 37.7 | | | | 39.3 | | | | 41.0 | |
Canada Social Transfer | | | 12.2 | | | | 12.6 | | | | 13.0 | | | | 13.3 | | | | 13.7 | | | | 14.2 | | | | 14.6 | |
Fiscal arrangements2 | | | 18.7 | | | | 19.4 | | | | 20.1 | | | | 20.9 | | | | 21.8 | | | | 22.6 | | | | 23.5 | |
Gas Tax Fund | | | 2.1 | | | | 2.0 | | | | 2.0 | | | | 2.1 | | | | 2.1 | | | | 2.2 | | | | 2.2 | |
Other major transfers3 | | | 0.7 | | | | 0.2 | | | | 0.2 | | | | 0.1 | | | | 0.1 | | | | 0.0 | | | | 0.0 | |
Alternative Payments for Standing Programs4 | | | -3.5 | | | | -3.7 | | | | -3.9 | | | | -4.1 | | | | -4.3 | | | | -4.5 | | | | -4.7 | |
Total | | | 60.5 | | | | 62.6 | | | | 65.4 | | | | 68.4 | | | | 71.0 | | | | 73.8 | | | | 76.6 | |
| | | | | | | |
Direct program expenses | | | | | | | | | | | | | | | | | | | | | | | | | | | | |
Operating expenses | | | 74.7 | | | | 73.0 | | | | 74.5 | | | | 75.1 | | | | 76.7 | | | | 79.7 | | | | 80.1 | |
Transfer payments | | | 36.7 | | | | 35.9 | | | | 35.6 | | | | 37.4 | | | | 37.6 | | | | 38.4 | | | | 38.5 | |
Capital amortization | | | 4.5 | | | | 5.2 | | | | 5.7 | | | | 6.0 | | | | 6.3 | | | | 6.9 | | | | 7.0 | |
Total | | | 115.9 | | | | 114.1 | | | | 115.7 | | | | 118.5 | | | | 120.6 | | | | 125.0 | | | | 125.5 | |
Total program expenses | | | 248.6 | | | | 252.7 | | | | 263.9 | | | | 273.0 | | | | 281.3 | | | | 292.2 | | | | 299.6 | |
| | | | | | | |
Per cent of GDP | | | | | | | | | | | | | | | | | | | | | | | | | | | | |
Major transfers to persons | | | 3.8 | | | | 3.9 | | | | 4.1 | | | | 4.1 | | | | 4.1 | | | | 4.0 | | | | 4.1 | |
Major transfers to other levels of government | | | 3.2 | | | | 3.2 | | | | 3.2 | | | | 3.2 | | | | 3.2 | | | | 3.2 | | | | 3.2 | |
Direct program expenses | | | 6.1 | | | | 5.8 | | | | 5.7 | | | | 5.6 | | | | 5.4 | | | | 5.4 | | | | 5.2 | |
Total program expenses | | | 13.1 | | | | 12.9 | | | | 13.0 | | | | 12.9 | | | | 12.7 | | | | 12.7 | | | | 12.5 | |
Note: Totals may not add due to rounding.
| 1 | EI benefits include regular EI benefits, sickness, maternity, parental, compassionate care, fishing and work-sharing benefits, and employment benefits and support measures. These represent 90 per cent of total EI program expenses. The remaining EI costs relate mainly to administration and are part of operating expenses. |
| 2 | Fiscal arrangements include Equalization, Territorial Formula Financing, the Youth Allowances Recovery and statutory subsidies. |
| 3 | Other major transfers to other levels of government include transitional payments; transfer protection payments in 2013–14; payments under the 2005 Offshore Accords; the Wait Times Reduction Transfer; and other health-related transfers. |
| 4 | Alternative Payments for Standing Programs represent a recovery from Quebec of an additional tax point transfer above and beyond the tax point transfer under the Canada Health Transfer and the Canada Social Transfer. |
61
| | |
| | |
| | Chapter 3 |
Table 3.5 sets out the main components of program expenses: major transfers to persons, major transfers to other levels of government, and direct program expenses.
Major transfers to persons are projected to increase steadily over the forecast horizon, from $76.0 billion in 2014–15 to $97.5 billion in 2019–20. Major transfers to persons consist of elderly, EI and children’s benefits.
Elderly benefits are comprised of Old Age Security, Guaranteed Income Supplement and Allowance payments to qualifying seniors. Elderly benefits are projected to grow from $43.9 billion in 2014–15 to $57.3 billion in 2019–20, or approximately 5.5 per cent per year—faster than nominal GDP, which is projected to grow on average by 4.2 per cent per year. The projected increase in elderly benefits is due to consumer price inflation, to which benefits are fully indexed, and a projected increase in the seniors’ population from 5.6 million in
2014–15 to 6.6 million in 2019–20, an average increase of 3.5 per cent per year.
EI benefits are projected to increase by 2.0 per cent to $17.6 billion in 2014–15 based on year-to-date results and projected growth in average benefits. Over the remainder of the projection period, EI benefits are projected to grow moderately, averaging 3.6 per cent annually, as projected increases in the average benefits paid to EI recipients more than offset the impacts of the reduction in the number of unemployed.
Children’s benefits are projected to increase over the forecast horizon from $14.5 billion in 2014–15 to $19.1 billion in 2019–20, reflecting growth in the eligible population, adjustments for inflation and, most importantly, the increase and expansion of the Universal Child Care Benefit, effective January 2015.
Major transfers to other levels of government are expected to increase over the forecast horizon, from $62.6 billion in 2014–15 to $76.6 billion in 2019–20. Major transfers to other levels of government include transfers in support of health and social programs, Equalization and Territorial Formula Financing, among others. The Canada Health Transfer (CHT) is projected to grow from $32.1 billion in 2014–15 to $41.0 billion in 2019–20. Starting in 2017–18, the CHT will grow in line with a three-year moving average of nominal GDP growth, with funding guaranteed to increase by at least 3 per cent per year. The Canada Social Transfer will continue to grow at 3 per cent per year.
The Government is committed to controlling the spending of federal departments. Direct program expenses have fallen over the last four years, decreasing from $122.8 billion in 2009–10 to $115.9 billion in 2013–14, the first time this has occurred since 1961–62, the earliest year for which data are readily available. This trend is expected to continue for a fifth year in a row, with projected direct program expenses dropping to $114.1 billion in 2014–15. Over the forecast horizon, direct program expenses are expected to decrease as a percentage of GDP, reaching a low of 5.2 per cent of GDP in 2019–20 (Chart 3.4).
62
| | |
| | | |
| Fiscal Situation and Outlook | |
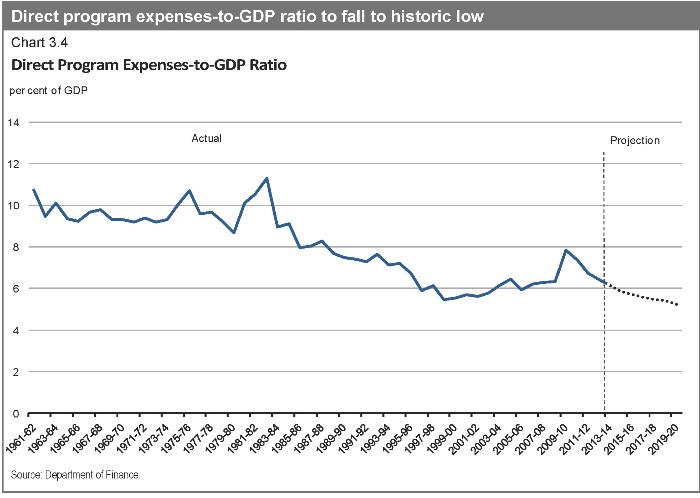
Direct program expenses include operating expenses, transfer payments administered by departments and capital amortization. Operating expenses reflect the cost of doing business for more than 100 government departments and agencies, including National Defence. Operating expenses are projected to increase modestly over the forecast horizon, rising from $73.0 billion in 2014–15 to $80.1 billion in 2019–20. This increase is a result of growth in National Defence funding reflecting increases provided under the Canada First Defence Strategy, as well as cost pressures related to funding for essential services such as public safety and non-discretionary payments (e.g. utilities, leases). Transfer payments administered by departments are broadly stable over the forecast horizon, rising from $35.9 billion in 2014–15 to $38.5 billion in 2019–20. Capital amortization expenses are expected to increase from $5.2 billion in 2014–15 to $7.0 billion in 2019–20. Capital expenditures are amortized over the expected useful life of assets. The increase in capital amortization expenses is a result of significant recent and planned investments in new capital as well as upgrades to existing capital.
63
| | |
| | |
| | Chapter 3 |
As a share of GDP, total program expenses are projected to decline from 13.1 per cent in 2013–14 to 12.5 per cent in 2019–20, which is below its pre-recession level (Chart 3.5).
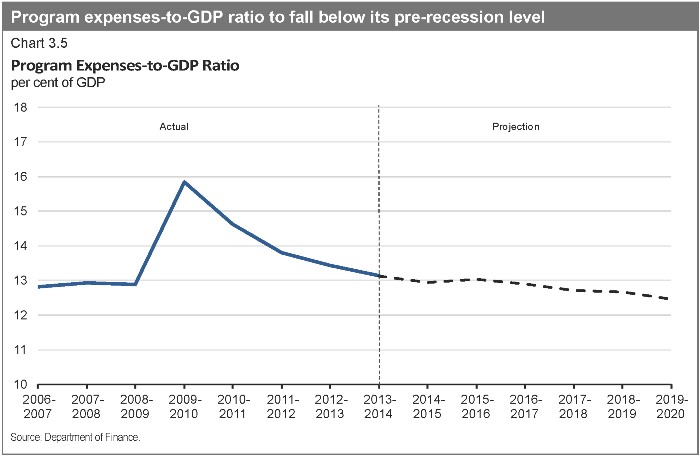
64
| | |
| | | |
| Fiscal Situation and Outlook | |
Risks to the Fiscal Projections
Risks to the economic outlook are the greatest source of uncertainty to the fiscal projections. To help quantify these risks, tables illustrating the sensitivity of the budgetary balance to a number of economic shocks are provided below.
Beyond the economic outlook, there remain upside and downside risks associated with the fiscal projections, as several key drivers of the fiscal outlook are not directly linked to economic variables (such as the relationship between personal income taxes and personal income or the extent to which departments and agencies do not fully use all of the resources appropriated by Parliament).
Sensitivity of the Budgetary Balance to Economic Shocks
Changes in economic assumptions affect the projections for revenues and expenses. The following tables illustrate the sensitivity of the budgetary balance to a number of economic shocks:
| • | | A one-year, 1-percentage-point decrease in real GDP growth driven equally by lower productivity and employment growth. |
| • | | A decrease in nominal GDP growth resulting solely from a one-year, 1-percentage-point decrease in the rate of GDP inflation (assuming that the Consumer Price Index (CPI) moves in line with GDP inflation). |
| • | | A sustained 100-basis-point increase in all interest rates. |
These sensitivities are generalized rules of thumb that assume any decrease in economic activity is proportional across income and expenditure components, and are meant to provide a broad illustration of the impact of economic shocks on the outlook for the budgetary balance. Actual economic shocks may have different fiscal impacts. For example, they may be concentrated in specific sectors of the economy or cause different responses in key economic variables (e.g. GDP inflation and CPI inflation may have different responses to a given shock).
65
| | |
| | |
| | Chapter 3 |
Table 3.6
Estimated Impact of a One-Year, 1-Percentage-Point Decrease in Real GDP Growth
on Federal Revenues, Expenses and Budgetary Balance
billions of dollars
| | | | | | | | | | | | | | |
| | | Year 1 | | | Year 2 | | | Year 5 | | | |
| | | | |
Federal revenues | | | | | | | | | | | | | | |
Tax revenues | | | | | | | | | | | | | | |
Personal income tax | | | -2.6 | | | | -2.8 | | | | -3.2 | | | |
Corporate income tax | | | -0.4 | | | | -0.5 | | | | -0.5 | | | |
Goods and Services Tax | | | -0.3 | | | | -0.4 | | | | -0.4 | | | |
Other | | | 0.0 | | | | -0.2 | | | | -0.2 | | | |
Total tax revenues | | | -3.4 | | | | -3.8 | | | | -4.4 | | | |
Employment Insurance premiums | | | -0.2 | | | | -0.2 | | | | -0.2 | | | |
Other revenues | | | -0.1 | | | | -0.1 | | | | -0.1 | | | |
Total budgetary revenues | | | -3.7 | | | | -4.1 | | | | -4.7 | | | |
| | | | |
Federal expenses | | | | | | | | | | | | | | |
Major transfers to persons | | | | | | | | | | | | | | |
Elderly benefits | | | 0.0 | | | | 0.0 | | | | -0.1 | | | |
Employment Insurance benefits | | | 0.8 | | | | 0.8 | | | | 0.6 | | | |
Children’s benefits | | | 0.0 | | | | 0.0 | | | | 0.2 | | | |
Total | | | 0.8 | | | | 0.8 | | | | 0.8 | | | |
Other program expenses | | | -0.2 | | | | -0.2 | | | | -0.2 | | | |
Public debt charges | | | 0.0 | | | | 0.1 | | | | 0.7 | | | |
Total expenses | | | 0.7 | | | | 0.8 | | | | 1.2 | | | |
| | | | |
Budgetary balance | | | -4.3 | | | | -4.9 | | | | -5.9 | | | |
Note: Totals may not add due to rounding.
A 1-percentage-point decrease in real GDP growth proportional across income and expenditure components reduces the budgetary balance by $4.3 billion in the first year, $4.9 billion in the second year and $5.9 billion in the fifth year (Table 3.6).
| • | | Tax revenues from all sources fall by a total of $3.4 billion in the first year and by $3.8 billion in the second year. Personal income tax revenues decrease as employment and wages and salaries fall. Corporate income tax revenues fall as output and profits decrease. GST revenues decrease as a result of lower consumer spending associated with the fall in employment and personal income. |
| • | | EI premium revenues decrease as employment and wages and salaries fall. In order to isolate the direct impact of the economic shock and provide a general overview of the fiscal impacts, the EI premium revenue impacts do not include changes in the premium rate. |
| • | | Expenses rise, mainly reflecting higher EI benefits (due to an increase in the number of unemployed) and higher public debt charges (reflecting a higher stock of debt due to the lower budgetary balance). This rise is partially offset by lower other program expenses (as certain programs are tied directly to growth in nominal GDP). |
66
| | |
| | | |
| Fiscal Situation and Outlook | |
Table 3.7
Estimated Impact of a One-Year, 1-Percentage-Point Decrease in GDP Inflation
on Federal Revenues, Expenses and Budgetary Balance
billions of dollars
| | | | | | | | | | | | | | |
| | | Year 1 | | | Year 2 | | | Year 5 | | | |
| | | | |
Federal revenues | | | | | | | | | | | | | | |
Tax revenues | | | | | | | | | | | | | | |
Personal income tax | | | -2.4 | | | | -1.7 | | | | -1.6 | | | |
Corporate income tax | | | -0.4 | | | | -0.5 | | | | -0.5 | | | |
Goods and Services Tax | | | -0.3 | | | | -0.4 | | | | -0.4 | | | |
Other | | | -0.2 | | | | -0.2 | | | | -0.2 | | | |
Total tax revenues | | | -3.4 | | | | -2.7 | | | | -2.8 | | | |
Employment Insurance premiums | | | -0.1 | | | | -0.2 | | | | -0.2 | | | |
Other revenues | | | -0.1 | | | | -0.1 | | | | -0.2 | | | |
Total budgetary revenues | | | -3.6 | | | | -3.0 | | | | -3.2 | | | |
| | | | |
Federal expenses | | | | | | | | | | | | | | |
Major transfers to persons | | | | | | | | | | | | | | |
Elderly benefits | | | -0.4 | | | | -0.5 | | | | -0.6 | | | |
Employment Insurance benefits | | | -0.1 | | | | -0.1 | | | | -0.1 | | | |
Children’s benefits | | | 0.0 | | | | 0.0 | | | | 0.0 | | | |
Total | | | -0.5 | | | | -0.6 | | | | -0.8 | | | |
Other program expenses | | | -0.4 | | | | -0.5 | | | | -0.9 | | | |
Public debt charges | | | -0.5 | | | | 0.1 | | | | 0.5 | | | |
Total expenses | | | -1.3 | | | | -1.0 | | | | -1.2 | | | |
| | | | |
Budgetary balance | | | -2.3 | | | | -2.0 | | | | -2.0 | | | |
Note: Totals may not add due to rounding.
A 1-percentage-point decrease in nominal GDP growth proportional across income and expenditure components resulting solely from lower GDP inflation (assuming that the Consumer Price Index moves in line with GDP inflation) lowers the budgetary balance by $2.3 billion in the first year, and by $2.0 billion in the second and fifth years (Table 3.7).
| • | | Lower prices result in lower nominal income and, as a result, personal income tax revenues decrease, reflecting declines in the underlying nominal tax base. As the parameters of the personal income tax system are indexed to inflation and automatically adjust in response to the shock, the fiscal impact is smaller than under the real shock. For the other sources of tax revenue, the negative impacts are similar under the real and nominal GDP shocks. |
| • | | EI premium revenues, absent any change in the premium rate, decrease in response to lower earnings. In order to isolate the direct impact of the economic shock and provide a general overview of the fiscal impacts, the EI premium revenue impacts do not include changes in the premium rate. |
| • | | Other revenues decline slightly as lower prices lead to lower revenues from the sales of goods and services. |
67
| | |
| | |
| | Chapter 3 |
| • | | Partly offsetting lower revenues are the declines in the cost of statutory programs that are indexed to inflation, such as elderly benefit payments and the Canada Child Tax Benefit, and downward pressure on federal program expenses. Payments under these programs are smaller if inflation is lower. Other program expenses are also lower as certain programs are tied directly to growth in nominal GDP. |
| • | | Public debt charges decline in the first year due to lower costs associated with Real Return Bonds, then rise due to the higher stock of debt. |
Table 3.8
Estimated Impact of a Sustained 100-Basis-Point Increase in All Interest Rates
on Federal Revenues, Expenses and Budgetary Balance
billions of dollars
| | | | | | | | | | | | | | |
| | | Year 1 | | | Year 2 | | | Year 5 | | | |
Federal revenues | | | 1.4 | | | | 1.8 | | | | 2.5 | | | |
Federal expenses | | | 1.5 | | | | 2.7 | | | | 4.1 | | | |
| | | | |
Budgetary balance | | | -0.1 | | | | -0.9 | | | | -1.6 | | | |
An increase in interest rates decreases the budgetary balance by $0.1 billion in the first year, $0.9 billion in the second year and $1.6 billion in the fifth year (Table 3.8). The decline stems entirely from increased expenses associated with public debt charges. The impact on debt charges rises through time as longer-term debt matures and is refinanced at higher rates. Moderating the overall impact is an increase in revenues associated with the increase in the rate of return on the Government’s interest-bearing assets, which are recorded as part of other revenues. The impacts of changes in interest rates on public sector pension and benefit expenses are excluded from the sensitivity analysis.
68
| | |
| | | |
| Update of Long-Term Economic and Fiscal Projections | |
ANNEX
UPDATEOF LONG-TERM ECONOMICAND FISCAL PROJECTIONS
This annex presents long-term economic and fiscal projections to 2050–51, using the medium-term forecast presented in this Update as the starting point. These projections follow the recommendation of the Auditor General of Canada to publish long-term fiscal sustainability analyses on an annual basis and update the Government’s long-term economic and fiscal projections published in the 2013 Update of Economic and Fiscal Projections.
Like any projection that extends over several decades, the demographic, economic and fiscal projections discussed in this annex are subject to considerable uncertainty. Rather than a forecast of the future, these projections are based on long-term developments that can be expected to occur based on current trends and policies and reasonable assumptions.
Long-Term Economic and Fiscal Projections
Since the publication of the Government’s last long-term fiscal sustainability analysis in November 2013, demographic, economic and fiscal trends have been relatively stable. Despite ongoing uncertainty and external weaknesses, the expansion in Canada’s real gross domestic product (GDP) has outpaced all its Group of Seven (G-7) peers over the recession and recovery and the return to balanced budgets is in sight. At the same time, Canada is still expected to age more rapidly than most other countries, meaning that Canadians and their governments will have to adjust to the economic and public finance implications of population aging sooner than many other advanced economies.
69
| | |
| | |
| | Annex |
Over the past decade, Canada’s strong employment performance has been a key factor behind the country’s strong economic performance relative to other G-7 countries. Canada’s employment as a share of the working-age population is now one of the highest among Organisation for Economic Co-operation and Development (OECD) countries. Going forward, however, demographic changes will make it increasingly difficult to continue to improve Canada’s economic performance through increases in employment. Indeed, falling fertility rates since the end of the baby boom and continuously increasing longevity have resulted in the Canadian population gradually growing older.4 And with the baby boomers gradually moving into retirement, the pace of population aging will soon accelerate with important consequences for Canadians and their governments. Indeed, the number of working-age Canadians for every senior is expected to fall from close to 5 over the past decade to about 2.5 in less than 20 years (Chart A.1), one of the largest projected decreases among OECD countries.
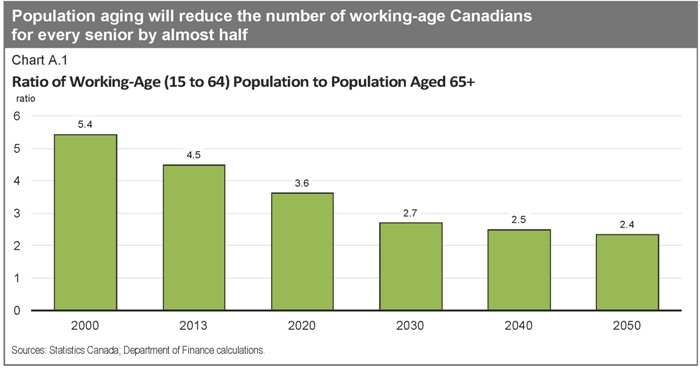
| 4 | The fertility rate in Canada rapidly decreased from a high of 3.9 children per woman in 1959 to 1.7 in 1979, and has stayed close to this level ever since. Canadians have seen their life expectancy at birth increase by about 20 years since the 1920s. |
70
| | |
| | | |
| Update of Long-Term Economic and Fiscal Projections | |
Population aging will result in an increase in the share of older workers in the labour force. Because older workers participate less in the labour market than younger workers, an aging population is expected to lead to a reduction in the overall rate of labour force participation (Chart A.2).5 In fact, the impact of the shift toward an older population is already being felt, as the overall participation rate has already likely reached its peak. Combined with slower growth in the population aged 15 and over and slightly declining average weekly hours worked per worker,6 reduced labour market participation is expected to reduce future growth in labour supply (i.e. the total number of hours worked by Canadians).
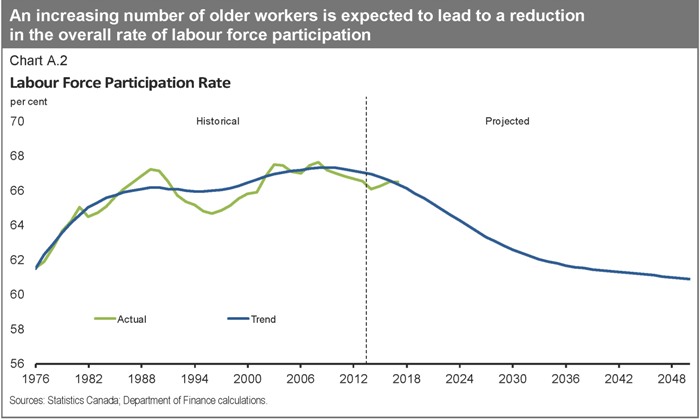
Economic growth stems from growth in either labour supply or labour productivity (real output per hour worked). Hence, unless labour market participation and productivity improve, population aging will negatively impact growth. With inflation expected to remain around 2 per cent per year, this impact on economic growth will be translated into lower growth in nominal GDP, the broadest single measure of the tax base. Slower nominal GDP growth will reduce the growth rate of government revenues, thereby limiting the capacity of governments to continue to finance growth in public expenditures at rates as high as in the past. At the same time, population aging is also expected to put upward pressure on public expenditures, notably for age-related programs such as elderly benefits and health care.
| 5 | The labour force includes non-institutionalized individuals aged 15 and over who are either working or actively seeking a job. Labour force participation rates are low when individuals are young (ages 15 to 24), reach peak levels between the ages of 25 and 54 and begin to decline starting at age 55. While participation rates of older individuals are expected to continue to increase, they are expected to remain well below rates seen among younger age groups. |
| 6 | Average annual hours worked by Canadians have gradually declined over the last four decades. This decline reflects several factors, including: rising post-secondary school enrolment, which limits the number of hours that younger individuals can work; the rise in part-time work, which is related to the increasing share of the service sector in the overall economy, characterized by a shorter and more flexible work week; and rising incomes, which have enabled the substitution of some work hours for some increased leisure time. |
71
| | |
| | |
| | Annex |
In the context of this upcoming rapid demographic transition, the Government has taken a number of actions since Budget 2010 to eliminate the deficit, which represents the first crucial and necessary step to guarantee long-term fiscal sustainability. Actions to return to balanced budgets in 2015 include controlling spending of federal departments, ensuring reasonable and affordable federal employee compensation, and closing tax loopholes. As shown in this Update, the success of these measures will be sufficient to ensure a return to balanced budgets starting in 2015–16, which will be achieved without raising taxes or cutting important transfers in support of health care and social services. To ensure public finances remain sustainable over the longer term as population aging pressures strengthen, actions to return to balanced budgets have been supplemented by measures to preserve social programs.
Updated long-term fiscal projections suggest that the Government’s actions will put the federal debt-to-GDP ratio on a downward trend (Chart A.3). These updated long-term fiscal projections are similar to those presented in the 2013 Update of Economic and Fiscal Projections, reflecting broadly unchanged economic, fiscal and demographic trends.
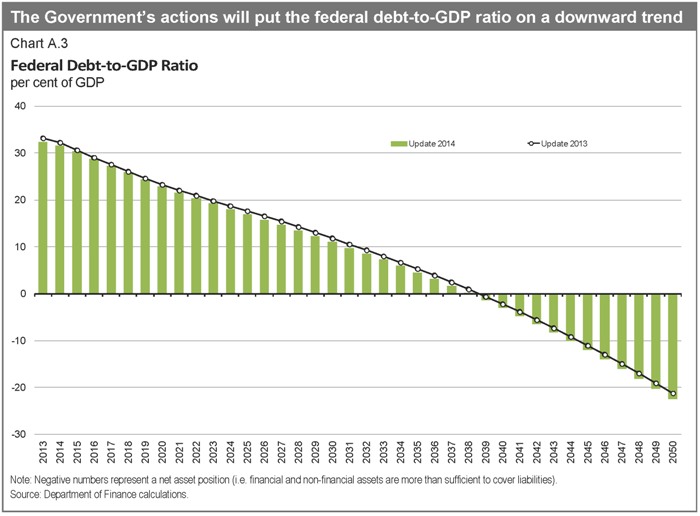
72
| | |
| | | |
| Update of Long-Term Economic and Fiscal Projections | |
It is important to note that, while useful to help assess the long-term impact of public policies based on “status quo” assumptions, long-term fiscal projections are not predictions. In particular, the projections in this annex assume sustained growth in economic activity and, as such, do not take into account the possibility that Canada could be hit by other recessions that would have long-lasting effects. They also do not include any new spending or tax measures beyond those previously announced.
The Government’s commitment to sound and sustainable public finances is intimately related to its fundamental belief that the private sector is the engine of growth and wealth creation. The role of government is to provide the framework policies, programs and services for a prosperous economy and society at levels of taxation that are competitive and sustainable for the long term.
Since 2006, the Government has taken action to create jobs and economic growth by keeping taxes low for Canadians and Canadian businesses, equipping Canadians with the skills and training they need to succeed, supporting advanced research and innovation, reducing red tape and delivering the largest and longest federal investment in public infrastructure through the New Building Canada Plan.
Over the past year, building on actions taken since 2006, the Government has continued to create an environment for Canadians to succeed by strengthening policies to connect Canadians with available jobs and improve their skills. For example:
| • | | Implemented the Canada Job Grant—To better align training with labour market needs, the Government has continued to work closely with provinces toward the implementation of the Canada Job Grant and the renewal of the Labour Market Agreements. |
| • | | Created the Canada Apprentice Loan—To support the training and employment of Canada’s next generation, the Government introduced in Economic Action Plan 2014 the Canada Apprentice Loan, which will be available in January 2015, providing apprentices registered in Red Seal trades with access to over $100 million in interest-free loans each year. |
| • | | Connecting Canadians With Available Jobs—To make sure Canadians are given the first chance at available jobs that match their skills in their local area, $11.8 million will be invested over two years, and $3.3 million per year on an ongoing basis, to launch an enhanced Job Matching Service. |
The Government has also announced and implemented a number of targeted, affordable measures that support advanced research and innovation, reduce red tape, support long-term economic growth and help Canadian businesses become more competitive here and around the world. For example:
| • | | Supporting Research and Innovation—To help Canadian post-secondary institutions excel globally in research areas that create long-term economic advantages for Canada, a new Canada First Research Excellence Fund with $1.5 billion in new funding over the next decade was created. |
| • | | Assisting the Manufacturing Sector and Entrepreneurs—To support significant new strategic research and development projects and long-term investments in the Canadian automotive sector, an additional $500 million over two years was provided to the Automotive Innovation Fund. To further help entrepreneurs create new companies and realize the potential of their ideas, the Canada Accelerator and Incubator Program was provided with an additional $40 million over four years, starting in 2015–16, increasing its total funding to $100 million. The funding will be used by recipient organizations to provide entrepreneurs with intensive mentoring and other resources to develop their business. |
| • | | Cutting Red Tape—To further reduce the tax compliance burden, the maximum number of required payments on account of source deductions was reduced for more than 50,000 small and medium-sized employers. |
73
| | |
| | |
| | Annex |
| • | | New Building Canada Plan—To ensure safe and efficient transportation for commuters, public transit users and commercial vehicles, the Government announced funding of $70 billion, including the $53-billion New Building Canada Plan announced in Economic Action Plan 2013, for public infrastructure over the next decade. This is the largest and longest infrastructure program in Canada’s history. In addition, the Government also announced, in Economic Action Plan 2014, funding to advance the construction of a new bridge for the St. Lawrence and funding of $470 million over two years for a new Windsor-Detroit International Crossing, in recognition that an efficient and secure Windsor-Detroit trade corridor is essential to the competitiveness of the manufacturing sector and Canada’s economy more broadly. |
| • | | Supporting Small Businesses—To recognize the important contribution that small businesses across the country make to job creation and economic growth, the Government recently introduced the new Small Business Job Credit, which is expected to save small businesses more than $550 million by effectively reducing their Employment Insurance premiums over 2015 and 2016. |
On the international stage, the Government continues to pursue an ambitious trade agenda to better position Canada as a strong competitor in the global economy. During the past year, negotiations were successfully concluded on the historic Canada-European Union Comprehensive Economic and Trade Agreement (CETA), Canada’s most ambitious trade initiative. The CETA will unlock opportunities across all manufacturing, agriculture and service sectors in a market of 500 million consumers across 28 countries. Canada also recently signed the Canada-Korea Free Trade Agreement. This landmark agreement constitutes Canada’s first trade agreement in Asia and will increase commercial opportunities in this fast-growing market of 50 million consumers. Altogether since 2006, Canada has reached free trade agreements with 38 countries and continues to negotiate with many more.
Together, actions taken by the Government since 2006 have helped the Canadian economy enjoy one of the best economic performances among G-7 countries over the recovery and can be expected to continue to improve Canada’s economic and labour market performance over the longer term. Ultimately, the resilience of the Canadian economy, and its ability to thrive in the 21st century global economy, must be underpinned by a strong fiscal position. In this context, recent Government actions to ensure the sustainability of Canada’s public finances, combined with affordable and targeted actions that foster growth and job creation now and in the future, improve the environment for investment by keeping taxes and interest rates low, reduce the burden placed on future generations of Canadians, and maintain the ability of the Government to respond to unexpected economic shocks.
74
| | |
| | | |
| Update of Long-Term Economic and Fiscal Projections | |
Methodology and Key Assumptions
Demographic Projections
The demographic projections used in this annex are based on medium-growth scenario projections produced by Statistics Canada.7 Statistics Canada projects the structure of the population by age and sex from one year to the next by adding births and net migrants and subtracting deaths. The demographic assumptions behind these projections are outlined in Population Projections for Canada, Provinces and Territories—2009 to 2036, published in 2010. The main assumptions are:
| • | | Life expectancy at birth for females is expected to increase from 82.9 years in 2006 to 87.3 years in 2036. For males, the life expectancy at birth is expected to rise from 78.2 years in 2006 to 84.0 years in 2036. |
| • | | The fertility rate for Canada used for the entire projection period is 1.70 children per woman. |
| • | | Except for the first three years, where data used are drawn from the immigration plan as formulated by Citizenship and Immigration Canada, the annual immigration rate is assumed to represent 0.75 per cent of the total population. When accounting for emigration and returning emigrants, the net immigration rate for Canada is assumed to range between 0.60 and 0.66 per cent over the projection period. |
For the purposes of this annex, the population projections produced by Statistics Canada have been adjusted to reflect recent population estimates.
Economic Projections
Over the first six years of the projection (2014–2019), key economic indicators (e.g. real GDP growth and interest rates) are taken from the Department of Finance September 2014 survey of private sector economists, which forms the basis for the fiscal forecast presented in this Update.
These results are benchmarked to the Department of Finance long-term projection model. In this model, real GDP growth is assumed to depend on labour productivity growth and labour input growth. Labour input growth is determined by age- and gender-specific labour force participation and average hours worked using population projections from Statistics Canada by age and gender.
Labour productivity is expected to grow at about its historical average over the 2014–2050 period. The unemployment rate over the 2014–2019 period is taken from the private sector forecast, which projects a gradual decline to 6.3 per cent by 2019, near its level prior to the 2008–2009 recession.
| 7 | Statistics Canada produces three long-term population projections based on low-, medium- and high-growth scenarios. |
75
| | |
| | |
| | Annex |
Over the medium term (2014–2019), growth in labour supply is projected to continue to contribute significantly to overall GDP growth, albeit somewhat less than over the last four decades. This in part reflects the positive effect of the ongoing recovery in labour markets from the 2008–2009 recession, translating into a falling unemployment rate (which contributes positively to labour supply growth). However, both labour force participation and average hours worked are projected to decline slightly each year (-0.2 percentage points for both) over the medium term, dampening labour supply growth (Table A.1).
Beyond 2019, the positive impacts of the current labour market recovery on labour supply are expected to disappear, while the unemployment rate is assumed to stabilize and average hours worked are projected to continue their trend decline. At the same time, an increasing rate of retirement among the baby boom generation is expected to result in a decline in labour force participation and the rate of growth of the working-age population. Combined, these factors suggest that the contribution of labour supply to real GDP growth will decline significantly to an average of just 0.5 percentage points per year over the 2020–2050 period. Given assumed trend productivity growth of 1.2 per cent per year, growth in real GDP would average 1.7 per cent per year over the same period.
|
Real GDP Growth Projection |
Table A.1
Average Annual Growth Rates
per cent, unless otherwise indicated
| | | | | | | | |
| | | 1970–2013 | | 2014–2019 | | 2020–2030 | | 2031–2050 |
Real GDP growth | | 2.8 | | 2.3 | | 1.6 | | 1.8 |
Contributions of (percentage points): | | | | | | | | |
Labour supply growth | | 1.6 | | 0.8 | | 0.4 | | 0.6 |
Working-age population | | 1.6 | | 1.0 | | 1.0 | | 0.8 |
Labour force participation | | 0.3 | | -0.2 | | -0.5 | | -0.1 |
Unemployment rate | | -0.1 | | 0.1 | | 0.0 | | 0.0 |
Average hours per worker | | -0.2 | | -0.2 | | -0.1 | | -0.1 |
Labour productivity growth | | 1.2 | | 1.5 | | 1.3 | | 1.2 |
Note: Contributions may not add due to rounding.
Sources: Statistics Canada; Department of Finance calculations.
76
| | |
| | | |
| Update of Long-Term Economic and Fiscal Projections | |
Fiscal Projections
Using the fiscal projections up to 2019–20 presented in this Update as the starting point, the fiscal projections contained in this annex are obtained through an accounting model in which each revenue and expense category is determined independently and is modelled as a function of the underlying demographic and economic projections, with the relationships defined either by current and already announced future government policies or assumptions. The model provides a detailed examination of the fiscal implications of population aging on government revenues and expenditures and provides an assessment of long-run fiscal sustainability by simulating long-run debt and deficit paths.
The principal assumptions underlying the fiscal projections from 2019–20 through 2050–51 are:
| • | | The Canada Social Transfer increases by 3 per cent annually, and the Canada Health Transfer and fiscal transfers (i.e. primarily Equalization and Territorial Formula Financing) payments grow in line with nominal GDP. |
| • | | Old Age Security program benefits grow with the targeted population (which is assumed to gradually change from 65 years old and over before 2023 to 67 years old and over in 2029) and inflation to reflect increases in the cost of living. |
| • | | Children’s benefits grow with the targeted population (less than 18 years old) and inflation to reflect increases in the cost of living. |
| • | | Direct program spending is linked to nominal GDP growth. |
| • | | Employment Insurance (EI) benefits grow in line with the projected number of beneficiaries and the projected growth in average weekly earnings. |
| • | | The EI premium rate grows according to current program parameters, i.e. EI revenues and expenditures (benefits and administration costs) break even over time. |
| • | | All tax revenues, including personal income tax, corporate income tax and Goods and Services Tax revenues, as well as other revenues, are assumed to grow in line with nominal GDP. |
| • | | With respect to federal debt charges, the initial stock of debt is subject to an average interest rate that is assumed to gradually increase from about 4 per cent in 2019–20 to 5 per cent by 2028–29 (to account for the fact that maturing debt will have to be renewed at increasingly higher rates) and remain constant thereafter. Any additional stock of debt (net assets) resulting from the accumulation of projected deficits (surpluses) is assumed to bear a 5-per-cent effective interest rate. Investment returns on financial assets (which are included in other revenues) are assumed to equal the borrowing costs (which are included in public debt charges) associated with their purchase. |
77
| | |
| | |
| | Annex |
Detailed Fiscal Projections
Table A.2
Long-Term Fiscal Projections
billions of dollars
| | | | | | | | | | | | | | | | | | | | | | | | | | | | | | | | |
| | | 2019–20 | | | 2021–22 | | | 2025–26 | | | 2030–31 | | | 2035–36 | | | 2040–41 | | | 2045–46 | | | 2050–51 | |
| | | | | | | | |
Revenues | | | 347.9 | | | | 376.2 | | | | 432.7 | | | | 518.0 | | | | 624.1 | | | | 754.9 | | | | 910.6 | | | | 1,093.7 | |
Program expenditures | | | 299.6 | | | | 325.1 | | | | 375.2 | | | | 446.9 | | | | 537.0 | | | | 641.8 | | | | 763.9 | | | | 908.7 | |
Public debt charges | | | 35.2 | | | | 38.6 | | | | 42.2 | | | | 43.1 | | | | 37.4 | | | | 25.3 | | | | 2.6 | | | | -35.4 | |
Budgetary balance | | | 13.1 | | | | 12.4 | | | | 15.2 | | | | 27.9 | | | | 49.6 | | | | 87.8 | | | | 144.1 | | | | 220.4 | |
Federal debt | | | 584.5 | | | | 559.9 | | | | 506.3 | | | | 394.7 | | | | 197.1 | | | | -158.5 | | | | -758.9 | | | | -1,700.1 | |
Nominal GDP1 | | | 2,406.0 | | | | 2,601.5 | | | | 2,991.6 | | | | 3,580.1 | | | | 4,320.9 | | | | 5,228.6 | | | | 6,308.5 | | | | 7,579.1 | |
| 1 | On a calendar-year basis. |
Table A.3
Long-Term Fiscal Projections, Share of GDP
per cent
| | | | | | | | | | | | | | | | | | | | | | | | | | | | | | | | |
| | | 2019–20 | | | 2021–22 | | | 2025–26 | | | 2030–31 | | | 2035–36 | | | 2040–41 | | | 2045–46 | | | 2050–51 | |
| | | | | | | | |
Revenues | | | 14.5 | | | | 14.5 | | | | 14.5 | | | | 14.5 | | | | 14.5 | | | | 14.5 | | | | 14.5 | | | | 14.5 | |
Program expenditures | | | 12.5 | | | | 12.5 | | | | 12.5 | | | | 12.5 | | | | 12.4 | | | | 12.3 | | | | 12.1 | | | | 12.0 | |
Public debt charges | | | 1.5 | | | | 1.5 | | | | 1.4 | | | | 1.2 | | | | 0.9 | | | | 0.5 | | | | 0.0 | | | | -0.5 | |
Budgetary balance | | | 0.5 | | | | 0.5 | | | | 0.5 | | | | 0.8 | | | | 1.1 | | | | 1.7 | | | | 2.3 | | | | 2.9 | |
Federal debt | | | 24.3 | | | | 21.5 | | | | 16.9 | | | | 11.0 | | | | 4.6 | | | | -3.0 | | | | -12.0 | | | | -22.4 | |
Table A.4
Long-Term Fiscal Projections, Annual Growth
per cent
| | | | | | | | | | | | | | | | | | | | | | | | | | | | | | | | |
| | | 2019–20 | | | 2021–22 | | | 2025–26 | | | 2030–31 | | | 2035–36 | | | 2040–41 | | | 2045–46 | | | 2050–51 | |
| | | | | | | | |
Revenues | | | 4.5 | | | | 3.8 | | | | 3.6 | | | | 3.7 | | | | 3.9 | | | | 3.9 | | | | 3.8 | | | | 3.7 | |
Program expenditures | | | 2.5 | | | | 4.1 | | | | 3.5 | | | | 3.8 | | | | 3.7 | | | | 3.6 | | | | 3.5 | | | | 3.6 | |
Nominal GDP1 | | | 4.2 | | | | 3.8 | | | | 3.6 | | | | 3.7 | | | | 3.9 | | | | 3.9 | | | | 3.8 | | | | 3.7 | |
| 1 | On a calendar-year basis. |
78
| | |
| | | |
| Update of Long-Term Economic and Fiscal Projections | |
Sensitivity Analysis
Because long-term projections and the range of possible results are inherently uncertain, the baseline projections presented in this annex are not intended to be exact forecasts. Rather, they provide a plausible baseline that follows from a reasonable set of demographic, economic and fiscal assumptions, which, as this sensitivity analysis shows, is fairly robust to a number of small changes to individual assumptions. On the other hand, larger changes or a combination of changes to some of these assumptions, a large change in the expected evolution of the medium-term economic and fiscal outlook, or a significant permanent shock to the Government’s revenue or spending would have more significant implications for the long-term economic and fiscal outlooks.
Table A.5
Description of Alternative Assumptions1
alternative assumption less baseline
| | | | | | | | |
| | | High | | | Low | |
| | |
Demographic: | | | | | | | | |
Fertility rate (average births per woman) | | | +0.2 births | | | | -0.2 births | |
Net immigration (per cent of population) | | | +0.1 p.p. | | | | -0.1 p.p. | |
Life expectancy at 65 | | | +3 years | | | | -3 years | |
| | |
Economic: | | | | | | | | |
Total labour force participation rate (per cent) | | | +1.0 p.p. | | | | -1.0 p.p. | �� |
Average weekly hours worked | | | +0.5 hours | | | | -0.5 hours | |
Unemployment rate (per cent) | | | +0.5 p.p. | | | | -0.5 p.p. | |
Labour productivity (per cent) | | | +0.1 p.p. | | | | -0.1 p.p. | |
Interest rates (per cent) | | | +0.5 p.p. | | | | -0.5 p.p. | |
Note: p.p. = percentage point.
| 1 | These alternative assumptions are applied starting in 2020 except for changes in life expectancy, which are gradually applied over the projection horizon. |
Table A.6
Impact of Alternative Assumptions on Nominal GDP
and Real Per Capita GDP Growth, 2020 to 2050
average annual growth, per cent
| | | | | | | | | | | | |
| | | Baseline | | High | | Low |
| | | Nominal
GDP | | Real Per Capita
GDP | | Nominal
GDP | | Real Per Capita
GDP | | Nominal
GDP | | Real Per Capita
GDP |
| | | | | | |
Demographic: | | | | | | | | | | | | |
Fertility rate | | 3.8 | | 0.9 | | 3.8 | | 0.8 | | 3.7 | | 0.9 |
Net immigration | | 3.8 | | 0.9 | | 3.9 | | 0.9 | | 3.6 | | 0.9 |
Life expectancy at 65 | | 3.8 | | 0.9 | | 3.8 | | 0.8 | | 3.7 | | 1.0 |
| | | | | | |
Economic: | | | | | | | | | | | | |
Total labour force participation rate | | 3.8 | | 0.9 | | 3.8 | | 0.9 | | 3.7 | | 0.8 |
Average weekly hours worked | | 3.8 | | 0.9 | | 3.8 | | 0.9 | | 3.7 | | 0.8 |
Unemployment rate | | 3.8 | | 0.9 | | 3.8 | | 0.9 | | 3.8 | | 0.9 |
Labour productivity | | 3.8 | | 0.9 | | 3.9 | | 1.0 | | 3.7 | | 0.8
|
79
| | |
| | |
| | Annex |
Table A.7
Impact of Alternative Assumptions on Nominal GDP and Real Per Capita GDP Levels in 2050
per cent difference relative to baseline
| | | | | | | | | | | | | | | | | | | | |
| | | High | | Low |
| | | Nominal
GDP | | Real Per Capita
GDP | | Nominal
GDP | | Real Per Capita
GDP |
| | | | |
Demographic: | | | | | | | | | | | | | | | | | | | | |
Fertility rate | | | | 2.0 | | | | | -1.3 | | | | | -2.0 | | | | | 1.4 | |
Net immigration | | | | 4.0 | | | | | 0.5 | | | | | -4.0 | | | | | -0.6 | |
Life expectancy at 65 | | | | 0.5 | | | | | -2.0 | | | | | -0.5 | | | | | 2.1 | |
| | | | |
Economic: | | | | | | | | | | | | | | | | | | | | |
Total labour force participation rate | | | | 1.6 | | | | | 1.6 | | | | | -1.6 | | | | | -1.6 | |
Average weekly hours worked | | | | 1.5 | | | | | 1.5 | | | | | -1.5 | | | | | -1.5 | |
Unemployment rate | | | | -0.5 | | | | | -0.5 | | | | | 0.5 | | | | | 0.5 | |
Labour productivity | | | | 3.1 | | | | | 3.1 | | | | | -3.0 | | | | | -3.0 | |
Table A.8
Impact of Alternative Assumptions on the Federal Deficit and Debt-to-GDP Ratio in 2050–51
per cent of GDP
| | | | | | | | | | | | | | | | | | | | | | | | | | | | | | |
| | | Baseline | | High | | Low |
| | | Deficit | | Debt | | Deficit | | Debt | | Deficit | | Debt |
| | | | | | |
Demographic: | | | | | | | | | | | | | | | | | | | | | | | | | | | | | | |
Fertility rate | | | | -2.9 | | | | | -22.4 | | | | | -2.9 | | | | | -21.1 | | | | | -3.0 | | | | | -23.8 | |
Net immigration | | | | -2.9 | | | | | -22.4 | | | | | -3.1 | | | | | -24.7 | | | | | -2.7 | | | | | -20.0 | |
Life expectancy at 65 | | | | -2.9 | | | | | -22.4 | | | | | -2.5 | | | | | -18.2 | | | | | -3.3 | | | | | -26.3 | |
| | | | | | |
Economic: | | | | | | | | | | | | | | | | | | | | | | | | | | | | | | |
Total labour force participation rate | | | | -2.9 | | | | | -22.4 | | | | | -3.1 | | | | | -25.3 | | | | | -2.7 | | | | | -19.4 | |
Average weekly hours worked | | | | -2.9 | | | | | -22.4 | | | | | -3.1 | | | | | -25.2 | | | | | -2.7 | | | | | -19.6 | |
Unemployment rate | | | | -2.9 | | | | | -22.4 | | | | | -2.8 | | | | | -21.4 | | | | | -3.0 | | | | | -23.4 | |
Labour productivity | | | | -2.9 | | | | | -22.4 | | | | | -3.1 | | | | | -24.9 | | | | | -2.7 | | | | | -19.9 | |
Interest rates | | | | -2.9 | | | | | -22.4 | | | | | -3.0 | | | | | -21.6 | | | | | -2.8 | | | | | -23.0 | |
80