EXHIBIT C-9
©Her Majesty the Queen in Right of Canada (2016)
All rights reserved
All requests for permission to reproduce this document or any part thereof
shall be addressed to the Department of Finance Canada.
Cette publication est également disponible en français.
Cat. No.: F1-25E-PDF
ISSN: 1487-0428
TABLEOF CONTENTS
| | | | |
Report Highlights | | | 6 | |
| |
Revenues | | | 15 | |
| |
Expenses | | | 17 | |
| |
The Budgetary Balance and Financial Source/Requirement | | | 21 | |
| |
Federal Debt | | | 23 | |
| |
Annex — IMF Measure of Total Government Net Debt | | | 25 | |
| |
Report of the Auditor General on the Condensed Consolidated Financial Statements of the Government of Canada | | | 27 | |
| |
Condensed Consolidated Financial Statements of the Government of Canada | | | 29 | |
NOTETO READERS
The financial results in this report are based on the audited consolidated financial statements of the Government of Canada for the fiscal year ended March 31, 2016, the condensed form of which is included in this report. For the 18th consecutive year, the Government has received an unmodified audit opinion from the Auditor General of Canada on the consolidated financial statements. The complete consolidated financial statements will be set out in the Public Accounts of Canada 2016 when tabled in Parliament.
The Fiscal Reference Tables have been updated to incorporate the results for 2015–16 as well as historical revisions to the National Economic and Financial Accounts published by Statistics Canada.
Annual Financial Report 2015–16 5
REPORT HIGHLIGHTS
| • | | The Government posted a budgetary deficit of $1.0 billion for the fiscal year ended March 31, 2016, compared to a budgetary surplus of $1.9 billion in 2014–15. |
| • | | Revenues increased by $13.1 billion, or 4.6 per cent, from 2014–15, largely reflecting growth in income tax revenues and other taxes and duties. Program expenses increased by $17.0 billion, or 6.7 per cent, reflecting increases in major transfers to persons and other levels of government and direct program expenses. Public debt charges were down $1.0 billion, or 3.8 per cent, from the prior year, due to a lower average effective interest rate on the stock of interest-bearing debt. |
| • | | The federal debt (the difference between total liabilities and total assets) stood at $616.0 billion at March 31, 2016. The federal debt-to-GDP (gross domestic product) ratio was 31.1 per cent, up slightly from the previous year. |
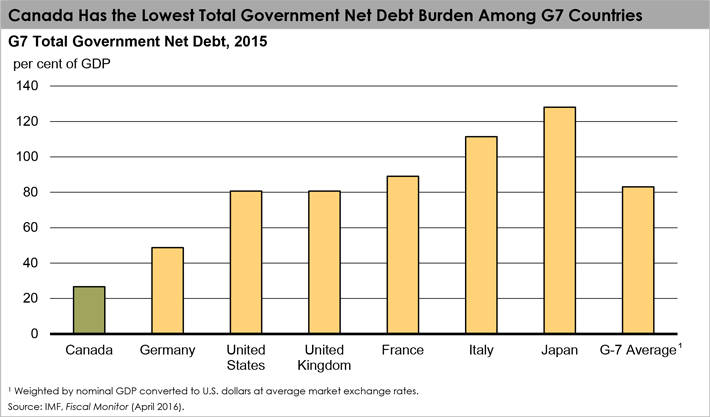
| • | | As reported by the International Monetary Fund (IMF), Canada’s total government net debt-to-GDP ratio, which includes the net debt of the federal, provincial/territorial and local governments, as well as the net assets held in the Canada Pension Plan and Québec Pension Plan, stood at 26.7 per cent in 2015. This is the lowest level among Group of Seven (G7) countries, which the IMF expects will record an average net debt of 83.0 per cent of GDP for the same year. |
| • | | For the 18th consecutive year, the Government has received an unmodified audit opinion from the Auditor General of Canada on the consolidated financial statements. |
6
Table 1
Financial Highlights
$ billions
| | | | | | | | | | | | | | | | |
| | | 2014–15 | | | 2015–16 | |
| | | | |
Budgetary transactions | | | | | | | | | | | | | | | | |
Revenues | | | 282.3 | | | | | | | | 295.5 | | | | | |
Expenses | | | | | | | | | | | | | | | | |
Program expenses | | | 253.8 | | | | | | | | 270.8 | | | | | |
Public debt charges | | | 26.6 | | | | | | | | 25.6 | | | | | |
Total expenses | | | 280.4 | | | | | | | | 296.4 | | | | | |
Budgetary balance | | | 1.9 | | | | | | | | -1.0 | | | | | |
Non-budgetary transactions | | | -4.6 | | | | | | | | -18.5 | | | | | |
Financial source/requirement | | | -2.7 | | | | | | | | -19.5 | | | | | |
Net change in financing activities | | | 6.2 | | | | | | | | 23.0 | | | | | |
Net change in cash balances | | | 3.6 | | | | | | | | 3.6 | | | | | |
Cash balance at end of period | | | 35.0 | | | | | | | | 38.6 | | | | | |
| | | | |
Financial position | | | | | | | | | | | | | | | | |
Total liabilities | | | 1,023.6 | | | | | | | | 1,059.6 | | | | | |
Total financial assets | | | 336.7 | | | | | | | | 365.8 | | | | | |
Net debt | | | 687.0 | | | | | | | | 693.8 | | | | | |
Non-financial assets | | | 74.6 | | | | | | | | 77.8 | | | | | |
Federal debt (accumulated deficit) | | | 612.3 | | | | | | | | 616.0 | | | | | |
| | | | |
Financial results (% of GDP) | | | | | | | | | | | | | | | | |
Revenues | | | 14.3 | | | | | | | | 14.9 | | | | | |
Program expenses | | | 12.9 | | | | | | | | 13.7 | | | | | |
Public debt charges | | | 1.3 | | | | | | | | 1.3 | | | | | |
Budgetary balance | | | 0.1 | | | | | | | | 0.0 | | | | | |
Federal debt (accumulated deficit) | | | 31.0 | | | | | | | | 31.1 | | | | | |
| | | | | | | | | | | | | | | | | |
Note: Numbers may not add due to rounding.
Economic Developments1
The performance of the world economy was disappointing in 2015, as global growth slowed to its weakest pace since the 2008–2009 Great Recession. Slowing economic activity in emerging markets weighed on global demand and maintained downward pressure on commodity prices, particularly oil prices. In the first quarter of 2016, momentum in the global economy remained weak, dampened by an ongoing slowdown in China, while the price of crude oil reached its lowest level since 2002, and volatility spiked in financial markets.
For Canada, as a producer and net exporter of crude oil, persistent weak global demand and low oil prices throughout 2015 and early in 2016 had negative implications for the economy. In particular, the oil and gas sector is estimated to have cut capital spending by between 30 and 40 per cent in 2015 to consolidate profit margins, in addition to significant personnel reductions made during the year. In the non-energy sector, economic activity grew at a fairly strong pace in 2015, although at a slower pace than in 2014. Overall, real GDP growth in Canada declined from 2.5 per cent in 2014 to 1.1 per cent in 2015, the slowest pace since the Great Recession.
| 1 | This section incorporates data available up to and including August 23, 2016. |
Annual Financial Report 2015–16 7
At the same time, nominal GDP, the broadest measure of the tax base, grew by just 0.5 per cent in 2015, the slowest growth since 1981 excluding the Great Recession.2 This reflected the additional impact of lower oil prices on Canada’s terms of trade—the prices of Canadian exports relative to Canadian imports. Both real and nominal GDP growth in 2015 were significantly lower than anticipated in Budget 2015.
In response to weak economic conditions, short- and long-term interest rates remained at historically low levels in 2015. The Bank of Canada cut its target for the overnight rate twice in 2015, from 1.0 per cent to 0.75 per cent in January and to 0.5 per cent in July. As a result, interest rates for 2015 came in slightly below Budget 2015 projections.
The unemployment rate was 6.9 per cent in both 2014 and 2015. In line with slower GDP growth and job creation, the unemployment rate for 2015 came in slightly higher than expected at the time of Budget 2015.
Reflecting lower commodity prices, Consumer Price Index (CPI) inflation slowed from 1.9 per cent in 2014 to 1.1 per cent in 2015. While the 2015 CPI inflation rate was below the mid-point of the Bank of Canada’s target range, it was slightly higher than projected in Budget 2015.
Table 2
Average Private Sector Forecasts
Per cent
| | | | | | | | | | | | | | | | | | | | |
| | | 2014 | | | 2015 | | | 2016 | | | 2017 | | | | |
| | | | | |
Real GDP growth | | | | | | | | | | | | | | | | | | | | |
Budget 20151 | | | 2.5 | | | | 2.1 | | | | 2.2 | | | | 2.3 | | | | | |
Budget 2016 | | | 2.5 | | | | 1.1 | | | | 1.4 | | | | 2.2 | | | | | |
Actual | | | 2.5 | | | | 1.1 | | | | – | | | | – | | | | | |
| | | | | |
Nominal GDP growth | | | | | | | | | | | | | | | | | | | | |
Budget 20151 | | | 4.3 | | | | 1.8 | | | | 4.9 | | | | 4.7 | | | | | |
Budget 2016 | | | 4.3 | | | | 0.5 | | | | 2.3 | | | | 4.6 | | | | | |
Actual | | | 4.3 | | | | 0.5 | | | | – | | | | – | | | | | |
| | | | | |
3-month treasury bill rate | | | | | | | | | | | | | | | | | | | | |
Budget 20151 | | | 0.9 | | | | 0.6 | | | | 1.0 | | | | 2.0 | | | | | |
Budget 2016 | | | 0.9 | | | | 0.5 | | | | 0.5 | | | | 0.7 | | | | | |
Actual | | | 0.9 | | | | 0.5 | | | | – | | | | – | | | | | |
| | | | | |
10-year government bond rate | | | | | | | | | | | | | | | | | | | | |
Budget 20151 | | | 2.2 | | | | 1.7 | | | | 2.5 | | | | 3.2 | | | | | |
Budget 2016 | | | 2.2 | | | | 1.5 | | | | 1.6 | | | | 2.3 | | | | | |
Actual | | | 2.2 | | | | 1.5 | | | | – | | | | – | | | | | |
| | | | | |
Unemployment rate | | | | | | | | | | | | | | | | | | | | |
Budget 20151 | | | 6.9 | | | | 6.7 | | | | 6.6 | | | | 6.3 | | | | | |
Budget 2016 | | | 6.9 | | | | 6.9 | | | | 7.1 | | | | 6.9 | | | | | |
Actual | | | 6.9 | | | | 6.9 | | | | – | | | | – | | | | | |
| | | | | |
Consumer Price Index inflation | | | | | | | | | | | | | | | | | | | | |
Budget 20151 | | | 1.9 | | | | 0.9 | | | | 2.2 | | | | 2.0 | | | | | |
Budget 2016 | | | 1.9 | | | | 1.1 | | | | 1.6 | | | | 2.0 | | | | | |
Actual | | | 1.9 | | | | 1.1 | | | | – | | | | – | | | | | |
| | | | | | | | | | | | | | | | | | | | | |
Note: Budget 2016 figures have been restated due to historical revisions to the Canadian System of National Accounts from Statistics Canada.
| 1 | Numbers as they appear in Budget 2016. |
| 2 | Or since the availability of published Canadian Income and Expenditure Accounts data. |
8
The Budgetary Balance
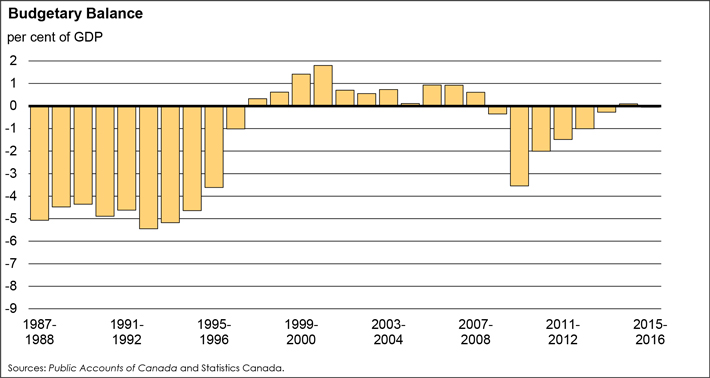
The Government posted a budgetary deficit of $1.0 billion in 2015–16, compared to a surplus of $1.9 billion in 2014–15.
Revenues were up $13.1 billion, or 4.6 per cent, from the prior year, largely reflecting growth in income tax revenues and other taxes and duties.
Expenses were up $16.0 billion, or 5.7 per cent, from the prior year. Program expenses increased by $17.0 billion, reflecting increases in major transfers to persons and other levels of government and direct program expenses. Public debt charges decreased by $1.0 billion, or 3.8 per cent, from the prior year, reflecting a lower average effective interest rate on the stock of interest-bearing debt.
To enhance the comparability of financial results over time and across jurisdictions, the budgetary balance and its components are often presented as a percentage of GDP. The following chart shows the budgetary balance as a percentage of GDP since 1987–88. In 2015–16, the budgetary deficit was 0.0 per cent of GDP, compared to a surplus of 0.1 per cent of GDP a year earlier.
Annual Financial Report 2015–16 9
COMPARISONOF ACTUAL BUDGETARY OUTCOMESTO PROJECTED RESULTS
The Government estimated a deficit of $5.4 billion for 2015–16 in the March 2016 budget. The final budgetary outcome for 2015–16 was a deficit of $1.0 billion.
Revenues were $4.2 billion (1.5 per cent) higher than expected, primarily reflecting better-than-expected personal and corporate income tax revenues.
Total program expenses and public debt charges were each $0.1 billion lower than forecast.
Table 3
Comparison of Actual Outcomes to March 2016 Budget
$ billions
| | | | | | | | | | | | | | | | |
| | | Actual | | | March 2016 budget | | | Difference | | | | |
| | | | |
Revenues | | | | | | | | | | | | | | | | |
Personal income tax | | | 144.9 | | | | 142.7 | | | | 2.2 | | | | | |
Corporate income tax | | | 41.4 | | | | 38.8 | | | | 2.6 | | | | | |
Non-resident income tax | | | 6.5 | | | | 6.3 | | | | 0.2 | | | | | |
Other taxes and duties | | | 49.8 | | | | 49.8 | | | | 0.0 | | | | | |
Employment Insurance premium revenues | | | 23.1 | | | | 23.0 | | | | 0.1 | | | | | |
Other revenues | | | 29.7 | | | | 30.6 | | | | -0.9 | | | | | |
Total | | | 295.5 | | | | 291.2 | | | | 4.2 | | | | | |
Program expenses | | | | | | | | | | | | | | | | |
Major transfers to persons | | | | | | | | | | | | | | | | |
Elderly benefits | | | 45.5 | | | | 45.6 | | | | -0.1 | | | | | |
Employment Insurance benefits | | | 19.4 | | | | 19.4 | | | | 0.0 | | | | | |
Children’s benefits | | | 18.0 | | | | 18.1 | | | | -0.1 | | | | | |
Total | | | 82.9 | | | | 83.1 | | | | -0.2 | | | | | |
Major transfers to other levels of government | | | | | | | | | | | | | | | | |
Support for health and other social programs | | | 47.0 | | | | 47.0 | | | | 0.0 | | | | | |
Fiscal arrangements | | | 16.9 | | | | 16.9 | | | | 0.0 | | | | | |
Gas Tax Fund | | | 2.0 | | | | 2.0 | | | | 0.0 | | | | | |
Total | | | 65.9 | | | | 65.8 | | | | 0.0 | | | | | |
Direct program expenses | | | 122.1 | | | | 122.0 | | | | 0.1 | | | | | |
Total program expenses | | | 270.8 | | | | 270.9 | | | | -0.1 | | | | | |
Public debt charges | | | 25.6 | | | | 25.7 | | | | -0.1 | | | | | |
Budgetary outcome/estimate | | | -1.0 | | | | -5.4 | | | | 4.5 | | | | | |
Note: Numbers may not add due to rounding.
10
Federal Debt
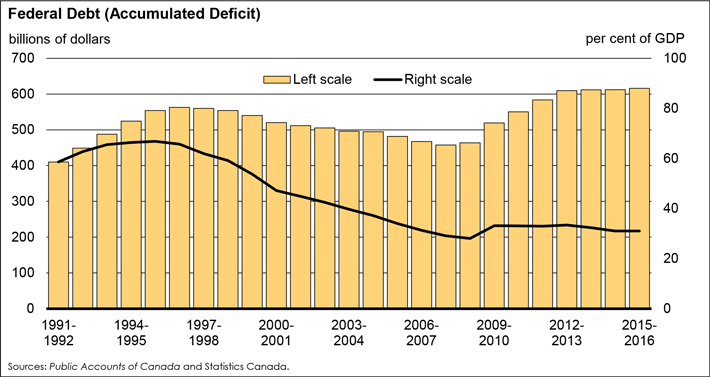
The federal debt (accumulated deficit) is the difference between the Government’s total liabilities and its total assets. At the end of 2015–16, the federal debt stood at $616.0 billion.
Table 4
Federal Debt (Accumulated Deficit)
$ millions
| | | | | | | | | | | | | | | | | | | | | | | | |
| | | 2014–15 | | | 2015–16 | | | Net change | |
| | | | | | |
Federal debt at beginning of year | | | 611,881 | | | | | | | | 612,330 | | | | | | | | 449 | | | | | |
Annual (surplus) or deficit | | | (1,911 | ) | | | | | | | 987 | | | | | | | | 2,898 | | | | | |
Other comprehensive loss | | | 2,360 | | | | | | | | 2,669 | | | | | | | | 309 | | | | | |
Federal debt at end of year | | | 612,330 | | | | | | | | 615,986 | | | | | | | | 3,656 | | | | | |
| | | | | | | | | | | | | | | | | | | | | | | | | |
The federal debt increased by $3.7 billion in 2015–16, reflecting the 2015–16 budgetary deficit of $1.0 billion and a $2.7-billion other comprehensive loss. The $2.7-billion other comprehensive loss is largely the result of a reclassification in the current year due to the Government’s sale of its remaining holdings of General Motors common shares in April 2015. Prior to the date of sale, the accumulated unrealized gain from the appreciation in value of the shares was recorded in other comprehensive income/loss. Upon the sale of these shares, the accumulated unrealized gain of $2.4 billion was reversed out of other comprehensive income and the actual realized gain of $2.1 billion was recorded as revenue and is incorporated within the 2015–16 budgetary balance.
The following chart shows the federal debt as a percentage of GDP since 1991–92. The federal debt stood at 31.1 per cent of GDP in 2015–16, up marginally from 31.0 per cent in 2014–15.
Annual Financial Report 2015–16 11
Measures of Government Debt
The consolidated financial statements of the Government of Canada are presented on an accrual basis of accounting. On this basis, there are several generally accepted definitions of government debt.
Net debt represents the total liabilities of the Government less its financial assets. Financial assets include cash and cash equivalents, accounts receivable, foreign exchange accounts, loans, investments and advances, and public sector pension assets.
The accumulated deficit is equal to total liabilities less total assets—both financial and non-financial. Non-financial assets include tangible capital assets, such as land and buildings, inventories, and prepaid expenses and other. The annual change in the accumulated deficit is equal to the budgetary balance plus other comprehensive income or loss.
Other comprehensive income or loss represents certain unrealized gains and losses on financial instruments and certain actuarial gains and losses related to pensions and other employee future benefits reported by enterprise Crown corporations and other government business enterprises. In accordance with Canadian public sector accounting standards, other comprehensive income or loss is not included in the Government’s annual budgetary balance, but is instead recorded directly to the accumulated deficit.
The federal debt, referred to in the budget documents and the Annual Financial Report of the Government of Canada, is the accumulated deficit. It is the federal government’s main measure of debt. The following table shows net debt and the federal debt at March 31, 2016.
Net Debt and the Federal Debt at March 31, 2016
| | | | | | | | |
| | | ($ billions) | | | (% of GDP) | |
| | |
Total liabilities | | | 1,059.6 | | | | 53.4 | |
Less: Financial assets | | | 365.8 | | | | 18.4 | |
Net debt | | | 693.8 | | | | 35.0 | |
Less: Non-financial assets | | | 77.8 | | | | 3.9 | |
Federal debt (accumulated deficit) | | | 616.0 | | | | 31.1 | |
Note: Numbers may not add due to rounding.
12
Net Debt
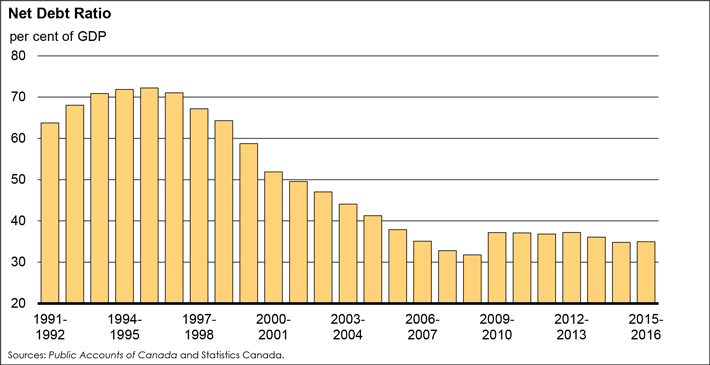
Net debt is the difference between the Government’s total liabilities and its financial assets. Under this measure of debt, liabilities are reduced only by financial assets as non-financial assets cannot normally be converted to cash to pay off the debt without disrupting government operations. At the end of 2015–16, the Government’s net debt stood at $693.8 billion, up $6.8 billion from 2014–15.
The net debt ratio, net debt expressed as a percentage of GDP, measures debt relative to the ability of the country’s taxpayers to finance it. The following chart shows the net debt ratio since 1991–92. The ratio stood at 35.0 per cent in 2015–16, up slightly from 34.8 per cent a year earlier, and down by more than half from its peak of 72.2 per cent in the mid-1990s.
International Comparisons of Government Debt
International comparisons of net debt are made on a total government, National Accounts basis, which for Canada includes the net debt of federal, provincial/territorial and local governments, as well as the net assets held in the Canada Pension Plan and Québec Pension Plan. Further details on the calculation of Canada’s net debt, along with a reconciliation of federal net debt on a National Accounts basis and a Public Accounts basis, are provided in the annex.
Canada’s total government net debt-to-GDP ratio stood at 26.7 per cent in 2015, as shown in the following chart. This is the lowest level among G7 countries and is less than half of the G7 average, which the IMF estimates stood at 83.0 per cent of GDP in that same year.
Annual Financial Report 2015–16 13
Financial Source/Requirement
The financial source/requirement measures the difference between cash coming in to the Government and cash going out. It differs from the budgetary balance, which measures revenues and expenses as they are earned or incurred rather than when the associated cash is received or paid.
There was a financial requirement of $19.5 billion in 2015–16, compared to a financial requirement of $2.7 billion in 2014–15. The year-over-year change in the financial requirement reflects a number of factors including the wind-up in 2014–15 of repayments of principal on assets maturing under the Insured Mortgage Purchase Program (IMPP) administered by Canada Mortgage and Housing Corporation (CMHC); growth in taxes receivable in 2015–16, as a portion of the cash associated with tax revenues included in the budgetary balance was not received by year-end; and $6.6 billion in cash collateral posted by the Government in 2015–16 under new swap and derivative agreements.
14
REVENUES
Revenues totalled $295.5 billion in 2015–16, up $13.1 billion, or 4.6 per cent, from 2014–15 (Table 5), reflecting growth in all revenue streams except other revenues.
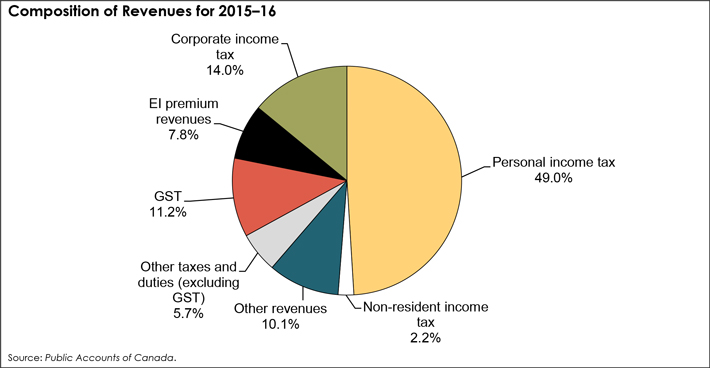
The following chart illustrates the composition of revenues for 2015–16. The largest source of federal revenues is personal income tax revenues, which accounted for 49.0 per cent of total revenues in 2015–16. The second largest source was corporate income tax revenues at 14.0 per cent. Goods and Services Tax (GST) revenues were 11.2 per cent of revenues while other taxes and duties were 5.7 per cent. Employment Insurance (EI) premium revenues contributed 7.8 per cent of revenues and non-resident income tax revenues made up 2.2 per cent. Other revenues, which include net profits from enterprise Crown corporations, revenues of consolidated Crown corporations, revenues from sales of goods and services, returns on investments, net foreign exchange revenues and miscellaneous revenues, contributed 10.1 per cent of revenues in 2015–16.
Personal income tax revenues increased by $9.2 billion, or 6.7 per cent, reflecting gains in personal income and tax planning by high-income individuals to recognize income in the 2015 tax year before the new 33 per cent tax rate came into effect in 2016.
Corporate income tax revenues increased by $2.0 billion, or 5.1 per cent, as weakness in the resource sector was more than offset by growth in corporate taxable income in other sectors of the economy.
Non-resident income tax revenues increased by $0.3 billion, or 4.6 per cent, reflecting growth in corporate earnings.
Other taxes and duties increased by $2.6 billion, or 5.6 per cent. GST revenues grew by $1.6 billion in 2015–16, or 5.1 per cent. Energy taxes grew by $37 million, or 0.7 per cent. Customs import duties increased by $0.8 billion, or 17.3 per cent, reflecting strong import growth and the removal of benefits for certain countries under Canada’s General Preferential Tariff regime, effective January 1, 2015. Other excise taxes and duties were up $0.2 billion, or 3.4 per cent.
EI premium revenues increased by $0.5 billion, or 2.2 per cent, reflecting growth in insurable earnings.
Annual Financial Report 2015–16 15
Other revenues decreased by $1.5 billion, or 4.7 per cent, in 2015–16, due in large part to lower Crown corporation revenues, including decreases in the net income of CMHC, Export Development Canada and Farm Credit Canada, which reflect, in part, the fact that revenues in the previous year were elevated due to one-time events (e.g., gains on the sale of investments within CMHC’s mortgage loan insurance investment portfolio). These decreases more than offset the $2.1-billion gain recorded in 2015–16 on the sale of the Government’s remaining holdings of General Motors common shares.
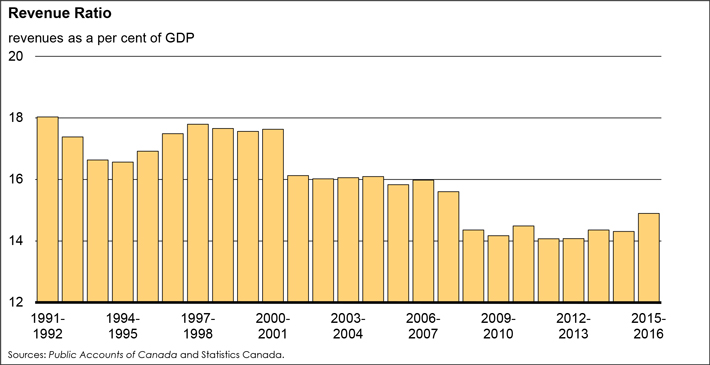
The revenue ratio—revenues as a percentage of GDP—compares the total of all federal revenues to the size of the economy. This ratio is influenced by changes in statutory tax rates and by economic developments. The following chart illustrates the revenue ratio since 1991–92. The ratio stood at 14.9 per cent in 2015–16, up from 14.3 per cent in 2014–15. This increase was attributable to strong growth in the Government’s major tax revenue streams (personal income tax, corporate income tax and GST revenues). Overall, the revenue ratio has declined since 2001–02, due primarily to tax reduction measures.
16
Table 5
Revenues
| | | | | | | | | | | | |
| | | 2014–15 | | 2015–16 | | Net change | | | |
| | | ($ millions) | | ($ millions) | | ($ millions) | | (%) | | | |
| | | | | |
Tax revenues | | | | | | | | | | | | |
Income tax | | | | | | | | | | | | |
Personal | | 135,743 | | 144,897 | | 9,154 | | 6.7 | | | | |
Corporate | | 39,447 | | 41,444 | | 1,997 | | 5.1 | | | | |
Non-resident | | 6,216 | | 6,505 | | 289 | | 4.6 | | | | |
Total | | 181,406 | | 192,846 | | 11,440 | | 6.3 | | | | |
Other taxes and duties | | | | | | | | | | | | |
Goods and Services Tax | | 31,349 | | 32,952 | | 1,603 | | 5.1 | | | | |
Energy taxes | | 5,528 | | 5,565 | | 37 | | 0.7 | | | | |
Customs import duties | | 4,581 | | 5,372 | | 791 | | 17.3 | | | | |
Other excise taxes and duties | | 5,724 | | 5,916 | | 192 | | 3.4 | | | | |
Total | | 47,182 | | 49,805 | | 2,623 | | 5.6 | | | | |
Total tax revenues | | 228,588 | | 242,651 | | 14,063 | | 6.2 | | | | |
| | | | | |
Employment Insurance premium revenues | | 22,564 | | 23,070 | | 506 | | 2.2 | | | | |
| | | | | |
Other revenues | | | | | | | | | | | | |
Crown corporations | | 13,480 | | 12,460 | | -1,020 | | -7.6 | | | | |
Other programs | | 16,359 | | 14,950 | | -1,409 | | -8.6 | | | | |
Net foreign exchange | | 1,355 | | 2,322 | | 967 | | 71.4 | | | | |
Total | | 31,194 | | 29,732 | | -1,462 | | -4.7 | | | | |
| Total revenues | | 282,346 | | 295,453 | | 13,107 | | 4.6 | | | |
EXPENSES
Expenses consist of program expenses and public debt charges. In 2015–16, expenses amounted to $296.4 billion, up $16.0 billion, or 5.7 per cent, from 2014–15.
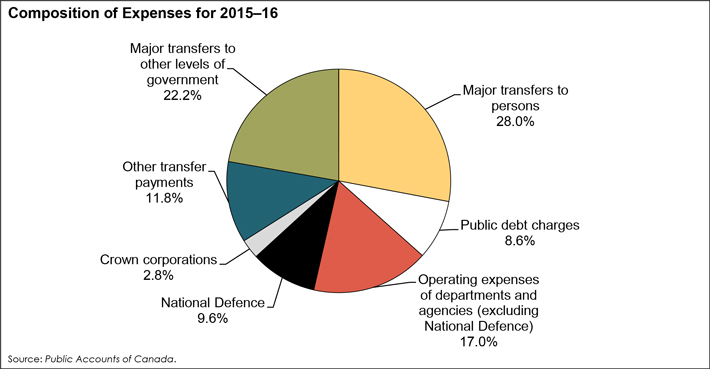
The chart below shows the composition of expenses for 2015–16. Major transfers to persons (elderly, EI and children’s benefits) and major transfers to other levels of government (the Canada Health Transfer, the Canada Social Transfer, fiscal arrangements, Gas Tax Fund transfers and other transfers) were the two largest components of expenses in 2015–16, representing 28.0 per cent and 22.2 per cent of expenses, respectively.
The remaining elements of program expenses (other transfer payments, Crown corporation expenses, and operating expenses of departments and agencies) make up the Government’s direct program expenses. Operating expenses of government departments and agencies, excluding National Defence, made up 17.0 per cent of total expenses in 2015–16. Operating expenses include items such as salaries and benefits, amortization of facilities and equipment, and supplies. Operating expenses of National Defence accounted for 9.6 per cent of expenses. Other transfer payments, which include transfers to Aboriginal peoples, assistance to farmers, students and businesses, support for research and development, and foreign aid and international assistance, made up 11.8 per cent of total expenses in 2015–16. Crown corporation expenses accounted for 2.8 per cent of expenses.
Annual Financial Report 2015–16 17
Public debt charges amounted to 8.6 per cent of expenses in 2015–16. This is down from a peak of nearly 30 per cent in the mid-1990s, when public debt charges were the largest component of spending.
Program expenses amounted to $270.8 billion in 2015–16, up $17.0 billion, or 6.7 per cent, from 2014–15 (Table 6).
Within program expenses, major transfers to persons increased by $6.4 billion, or 8.4 per cent, in 2015–16.
| • | | Elderly benefits consist of Old Age Security and Guaranteed Income Supplement and Allowance payments. Total benefits were up $1.4 billion, or 3.1 per cent, in 2015–16, reflecting growth in the elderly population and changes in consumer prices, to which benefits are fully indexed. |
| • | | EI benefits consist of regular benefits, special benefits (sickness, maternity, parental, adoption and fishing) and work-sharing agreements. Total benefits increased by $1.4 billion, or 7.6 per cent, in 2015–16, reflecting higher average regular benefits due to a worsening in labour market conditions. |
| • | | Children’s benefits, which include the Canada Child Tax Benefit and the Universal Child Care Benefit, increased by $3.7 billion, or 26.0 per cent, due mainly to the expansion and enhancement of the Universal Child Care Benefit in 2015. |
Major transfers to other levels of government include the Canada Health Transfer (CHT), the Canada Social Transfer (CST), fiscal arrangements (Equalization, transfers to the territories, a number of smaller transfer programs and the Quebec Abatement), Gas Tax Fund transfers and other transfers. These transfers increased by $2.7 billion, or 4.3 per cent, compared to 2014–15.
| • | | The CHT and CST—block-funded transfers—support health care, post-secondary education, social assistance and social services, including early childhood development. These programs provide support in the form of cash and tax transfers to the provinces and territories. Transfers in support of health and other social programs increased by $2.3 billion in 2015–16, reflecting legislated growth. |
| • | | Total entitlements under fiscal arrangements increased by $0.6 billion in 2015–16, mainly due to legislated growth in Equalization and Territorial Formula Financing payments. |
| • | | Gas Tax Fund transfers remained unchanged from the prior year at $2.0 billion. |
| • | | Other transfers decreased by $0.2 billion, reflecting payments made in 2014–15 to provinces and territories relating to the establishment of the Cooperative Capital Markets Regulatory System. |
18
Direct program expenses include transfer payments to individuals and other organizations not included in major transfers to persons and other levels of government, and other direct program expenses, which consist of operating expenses of National Defence, other departments and agencies, and expenses of Crown corporations. Direct program expenses increased by $7.8 billion, or 6.8 per cent, in 2015–16.
| • | | Other transfer payments decreased by $0.3 billion, or 0.7 per cent. |
| • | | Other direct program expenses increased by $8.1 billion, or 10.2 per cent. |
| | – | Crown corporation expenses increased by $0.8 billion, or 10.1 per cent, due in large part to an increase in commercial trading transactions of the Canadian Commercial Corporation. |
| | – | National Defence expenses increased by $4.9 billion, or 20.5 per cent, largely reflecting the accrual impact of amendments made to veterans future benefit plans in 2015–16. |
| | – | All other departmental and agency expenses increased by $2.5 billion, or 5.1 per cent, reflecting an increase in pension and other future benefit costs based on the Government’s latest actuarial valuations and a one-time expense recorded in 2015–16 related to the write-down of taxes receivable. |
Public debt charges decreased by $1.0 billion, or 3.8 per cent, to $25.6 billion in 2015–16, reflecting a lower average effective interest rate on the stock of interest-bearing debt.
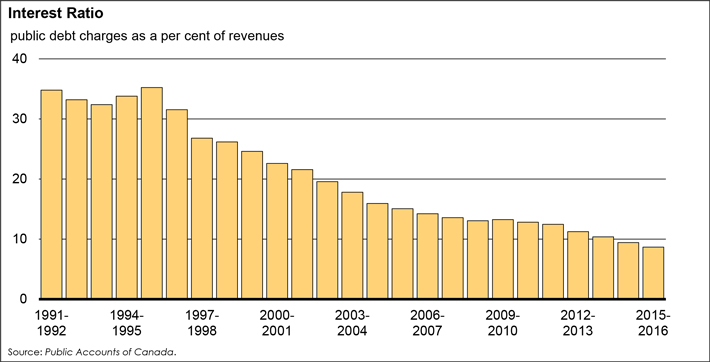
The following chart illustrates the interest ratio (public debt charges as a percentage of revenues) since 1991–92. This ratio has been decreasing in recent years, falling from a peak of 37.6 per cent in 1990–91 to 8.7 per cent in 2015–16. This means that, in 2015–16, the Government spent approximately 9 cents of every revenue dollar on interest on the public debt.
Annual Financial Report 2015–16 19
Table 6
Expenses
| | | | | | | | | | | | | | | | | | | | |
| | | 2014–15 | | | 2015–16 | | | Net change | | | | |
| | | ($ millions) | | | ($ millions) | | | ($ millions) | | | (%) | | | | |
| | | | | |
Major transfers to persons | | | | | | | | | | | | | | | | | | | | |
Elderly benefits | | | 44,103 | | | | 45,461 | | | | 1,358 | | | | 3.1 | | | | | |
Employment Insurance benefits | | | 18,052 | | | | 19,419 | | | | 1,367 | | | | 7.6 | | | | | |
Children’s benefits | | | 14,303 | | | | 18,025 | | | | 3,722 | | | | 26.0 | | | | | |
Total | | | 76,458 | | | | 82,905 | | | | 6,447 | | | | 8.4 | | | | | |
| | | | | |
Major transfers to other levels of government | | | | | | | | | | | | | | | | | | | | |
Support for health and other social programs | | | 44,696 | | | | 46,984 | | | | 2,288 | | | | 5.1 | | | | | |
Fiscal arrangements | | | 16,271 | | | | 16,893 | | | | 622 | | | | 3.8 | | | | | |
Gas Tax Fund | | | 1,973 | | | | 1,973 | | | | 0 | | | | 0.0 | | | | | |
Other transfers | | | 169 | | | | 0 | | | | -169 | | | | n/a | | | | | |
Total | | | 63,109 | | | | 65,850 | | | | 2,741 | | | | 4.3 | | | | | |
| | | | | |
Direct program expenses | | | | | | | | | | | | | | | | | | | | |
Other transfer payments | | | 35,126 | | | | 34,874 | | | | -252 | | | | -0.7 | | | | | |
Other direct program expenses | | | | | | | | | | | | | | | | | | | | |
Crown corporations | | | 7,590 | | | | 8,358 | | | | 768 | | | | 10.1 | | | | | |
National Defence | | | 23,669 | | | | 28,519 | | | | 4,850 | | | | 20.5 | | | | | |
All other departments and agencies | | | 47,889 | | | | 50,339 | | | | 2,450 | | | | 5.1 | | | | | |
Total other direct program expenses | | | 79,148 | | | | 87,216 | | | | 8,068 | | | | 10.2 | | | | | |
Total direct program expenses | | | 114,274 | | | | 122,090 | | | | 7,816 | | | | 6.8 | | | | | |
Total program expenses | | | 253,841 | | | | 270,845 | | | | 17,004 | | | | 6.7 | | | | | |
Public debt charges | | | 26,594 | | | | 25,595 | | | | -999 | | | | -3.8 | | | | | |
Total expenses | | | 280,435 | | | | 296,440 | | | | 16,005 | | | | 5.7 | | | | | |
20
THE BUDGETARY BALANCEAND FINANCIAL SOURCE/REQUIREMENT
The budgetary balance is the most comprehensive measure of the federal government’s fiscal results. It is presented on a full accrual basis of accounting, recording government expenses when they are incurred, regardless of when the cash payment is made, and recording tax revenues when earned, regardless of when the cash is received.
In contrast, the financial source/requirement measures the difference between cash coming in to the Government and cash going out. It differs from the budgetary balance in that it includes cash transactions in loans, investments and advances, public sector pensions, other specified purpose accounts, foreign exchange activities, and changes in other financial assets, liabilities and non-financial assets. These activities are included as part of non-budgetary transactions.
Non-budgetary transactions also include adjustments for the effects of non-cash items included in the budgetary balance and for any accruals of past or future cash receipts or payments. Examples of non-cash items include amortization of tangible capital assets, pension expenses not funded in the period, and the recognition of previously deferred revenue.
Non-budgetary transactions resulted in a net requirement for funds amounting to $18.5 billion in 2015–16, compared to a net requirement for funds of $4.6 billion in 2014–15. The year-over-year change in the financial requirement from non-budgetary transactions reflects a number of factors including the wind-up in 2014–15 of repayments of principal on assets maturing under the IMPP administered by CMHC; growth in taxes receivable in 2015–16, as a portion of the cash associated with tax revenues included in the budgetary balance was not received by year-end; and $6.6 billion in cash collateral posted by the Government in 2015–16 under new swap and derivative agreements, which is recorded as an account receivable by the Government.
With a budgetary deficit of $1.0 billion and a net requirement from non-budgetary transactions of $18.5 billion, there was a financial requirement of $19.5 billion in 2015–16, compared to a financial requirement of $2.7 billion in 2014–15 (Table 7).
The Government financed this financial requirement of $19.5 billion and increased its cash balances by $3.6 billion by increasing unmatured debt by $23.0 billion.
Cash balances at the end of March 2016 stood at $38.6 billion, up $3.6 billion from their level at the end of March 2015. Included in the March 31, 2016 balance of cash and cash equivalents is $20 billion which has been designated as a deposit held with the Bank of Canada with respect to prudential liquidity management. The Government’s overall liquidity is maintained at a level sufficient to cover at least one month of net projected cash flows, including coupon payments and debt refinancing needs.
Annual Financial Report 2015–16 21
Table 7
Budgetary Balance, Financial Source/Requirement and Net Financing Activities
$ billions
| | | | | | | | |
| | | 2014–15 | | 2015–16 | | | |
| | | |
Surplus or deficit (-) for the year | | 1.9 | | -1.0 | | | | |
| | | |
Non-budgetary transactions | | | | | | | | |
Pensions and other accounts | | | | | | | | |
Public sector pension liabilities | | -0.5 | | -0.4 | | | | |
Other employee and veteran future benefits liabilities | | 4.2 | | 9.5 | | | | |
Other liabilities | | 0.1 | | -0.4 | | | | |
Public sector pension assets | | -0.3 | | -0.4 | | | | |
Total | | 3.4 | | 8.3 | | | | |
| | | |
Non-financial assets | | -4.2 | | -3.1 | | | | |
| | | |
Loans, investments and advances | | 1.6 | | -4.9 | | | | |
| | | |
Other transactions | | | | | | | | |
Accounts payable, receivable, accruals and allowances | | 7.3 | | -10.2 | | | | |
Foreign exchange activities | | -12.8 | | -8.5 | | | | |
Total | | -5.4 | | -18.7 | | | | |
| | | |
Total non-budgetary transactions | | -4.6 | | -18.5 | | | | |
| | | |
Financial source/requirement (-) | | -2.7 | | -19.5 | | | | |
| | | |
Net change in financing activities | | | | | | | | |
Marketable bonds (Canadian currency) | | 14.6 | | 16.2 | | | | |
Treasury bills | | -17.3 | | 2.4 | | | | |
Retail debt | | -0.7 | | -0.6 | | | | |
Other | | 9.6 | | 5.0 | | | | |
Total | | 6.2 | | 23.0 | | | | |
| | | |
Net change in cash balances | | 3.6 | | 3.6 | | | | |
| | | |
Cash at end of year | | 35.0 | | 38.6 | | | | |
Note: Numbers may not add due to rounding.
22
FEDERAL DEBT
Liabilities
The Government’s liabilities consist of interest-bearing debt and accounts payable and accrued liabilities. Interest-bearing debt includes unmatured debt, liabilities for pensions and other employee future benefits, and other liabilities. At March 31, 2016, interest-bearing debt amounted to $931.7 billion, up $31.7 billion from a year earlier (Table 8). Within interest-bearing debt, unmatured debt increased by $23.0 billion and liabilities for pensions and other employee future benefits increased by $9.1 billion. Other liabilities, which include deposit and trust accounts and other specified purpose accounts, decreased by $0.4 billion. The increase in unmatured debt largely reflects an increase in marketable bonds and treasury bills.
Accounts payable and accrued liabilities amounted to $127.9 billion at March 31, 2016, up $4.2 billion from the close of 2014–15. This increase largely reflects growth in other accounts payable and accrued liabilities, offset in part by a decrease in amounts payable to taxpayers. Other accounts payable and accrued liabilities increased by $5.2 billion in 2015–16. Within this component, accrued salaries and benefits increased by $0.9 billion. Liabilities under provincial, territorial and Aboriginal tax agreements increased by $2.8 billion in 2015–16 due to settlements of prior years’ tax assessments and timing differences. Accounts payable of consolidated Crown corporations increased by $1.5 billion, largely reflecting growth in progress payments from foreign customers received by the Canadian Commercial Corporation. Amounts payable to taxpayers decreased by $2.5 billion in 2015–16, from $56.2 billion at March 31, 2015 to $53.7 billion at March 31, 2016.
Assets
The Government’s assets consist of financial assets (cash and other accounts receivable, taxes receivable, foreign exchange accounts, loans, investments and advances, and public sector pension assets) and non-financial assets (tangible capital assets, inventories, prepaid expenses and other). Financial assets totalled $365.8 billion at March 31, 2016, up $29.2 billion from March 31, 2015. Cash and other accounts receivable increased by $10.6 billion, largely reflecting collateral posted by the Government under new swap and derivative agreements in 2015–16. Taxes receivable increased by $7.3 billion during 2015–16 to $105.8 billion. Foreign exchange accounts increased by $8.5 billion, due mainly to growth in foreign exchange reserves held in the Exchange Fund Account, primarily reflecting $2.6 billion in foreign exchange gains and $4.6 billion in net additional advances to the Account during the year. Under the Government’s prudential liquidity plan, liquid foreign exchange reserves will continue to rise sufficiently to maintain their level at or above 3 per cent of GDP.
The Government’s loans, investments and advances consist of investments in and loans to enterprise Crown corporations and other government business enterprises, and other loans, investments and advances. The Government’s investments in enterprise Crown corporations and other government business enterprises decreased by $0.3 billion in 2015–16, as the $7.3 billion in net profits recorded by these entities during the year was more than offset by a $2.7-billion other comprehensive loss and $5.0 billion in dividends paid to the Government and other equity transactions. Net loans and advances to enterprise Crown corporations and other government business enterprises increased by $2.1 billion, reflecting an increase in loans under the consolidated borrowing framework. Other loans, investments and advances increased by $0.5 billion.
Public sector pension assets of consolidated Crown corporations increased by $0.4 billion.
The Government’s net debt (total liabilities less financial assets) stood at $693.8 billion at March 31, 2016, up $6.8 billion from March 31, 2015.
Non-financial assets amounted to $77.8 billion at March 31, 2016, up $3.1 billion from March 31, 2015, due mainly to an increase in tangible capital assets.
Annual Financial Report 2015–16 23
Federal Debt (Accumulated Deficit)
With total liabilities of $1.1 trillion, financial assets of $365.8 billion and non-financial assets of $77.8 billion, the federal debt (accumulated deficit) stood at $616.0 billion at March 31, 2016, up $3.7 billion from March 31, 2015. The federal debt stood at 31.1 per cent of GDP at March 31, 2016, up slightly from 31.0 per cent the previous year.
Table 8
Outstanding Debt at Year-End
$ billions
| | | | | | | | |
| | | 2014–15 | | 2015–16 | | | |
| | | |
Liabilities | | | | | | | | |
Accounts payable and accrued liabilities | | 123.6 | | 127.9 | | | | |
Interest-bearing debt | | | | | | | | |
Unmatured debt | | 665.2 | | 688.2 | | | | |
Pensions and other employee future benefits | | 228.8 | | 237.9 | | | | |
Other liabilities | | 6.0 | | 5.6 | | | | |
Total interest-bearing debt | | 900.0 | | 931.7 | | | | |
Total liabilities | | 1,023.6 | | 1,059.6 | | | | |
| | | |
Financial assets | | | | | | | | |
Cash and other accounts receivable | | 38.2 | | 48.8 | | | | |
Taxes receivable | | 98.5 | | 105.8 | | | | |
Foreign exchange accounts | | 85.0 | | 93.5 | | | | |
Loans, investments and advances | | 113.7 | | 116.0 | | | | |
Public sector pension assets | | 1.3 | | 1.6 | | | | |
Total financial assets | | 336.7 | | 365.8 | | | | |
Net debt | | 687.0 | | 693.8 | | | | |
| | | |
Non-financial assets | | | | | | | | |
Tangible capital assets | | 63.3 | | 65.8 | | | | |
Inventories | | 7.3 | | 7.2 | | | | |
Prepaid expenses and other | | 4.0 | | 4.7 | | | | |
Total non-financial assets | | 74.6 | | 77.8 | | | | |
Federal debt (accumulated deficit) | | 612.3 | | 616.0 | | | | |
Note: Numbers may not add due to rounding.
24
ANNEX
IMF MEASUREOF TOTAL GOVERNMENT NET DEBT
International comparisons of net debt are made on a total government, National Accounts basis, which for Canada includes the net debt of federal, provincial/territorial and local governments, as well as the net assets held in the Canada Pension Plan (CPP) and Québec Pension Plan (QPP).
The following table provides a breakdown of Canada’s net debt for 2014, the most recent complete year for which historical estimates have been published by the IMF.
Table 9
IMF Measure of Total Government Net Debt on a National Accounts Basis, 2014
| | | | | | | | |
| | | ($ billions) | | (% of GDP) | | | |
| | | |
Total federal net debt | | 452.6 | | 22.9 | | | | |
Add: Net debt of provincial/territorial and local governments | | 349.6 | | 17.7 | | | | |
Add: Net assets of the CPP/QPP | | (248.4) | | (12.6) | | | | |
| Total government net debt | | 553.8 | | 28.1 | | | |
Note: Numbers may not add due to rounding.
Source: Statistics Canada.
The primary differences between National Accounts federal net debt as published by the IMF and federal net debt on a Public Accounts basis relate to the Government’s liabilities for federal public sector pensions and other future benefits and the basis of measurement for total federal net debt. With respect to public sector pensions and other future benefits, these liabilities are excluded from the measurement of Canada’s net debt for international comparison purposes as the vast majority of advanced economies do not record such liabilities. The following table presents a reconciliation between the two measures of federal net debt.
Table 10
Reconciliation of Federal Net Debt on a National Accounts and a Public Accounts Basis
| | | | | | | | |
| | | ($ billions) | | (% of GDP) | | | |
| | | |
Net debt (Public Accounts basis) | | 687.0 | | 34.8 | | | | |
Less: Liability for public sector pensions | | 152.7 | | 7.7 | | | | |
Liability for other future benefits | | 76.1 | | 3.9 | | | | |
Add: National Accounts/Public Accounts methodological differences and timing adjustments1 | | (5.5) | | (0.3) | | | | |
| Total federal net debt (National Accounts basis) | | 452.6 | | 22.9 | | | |
Note: Numbers may not add due to rounding.
| 1 | Includes timing differences (National Accounts data are as of December 31), differences in the universe covered by each accounting system, and differences in accounting treatments of various transactions such as capital gains. |
Sources: Statistics Canada and Public Accounts of Canada.
Annual Financial Report 2015–16 25

INDEPENDENT AUDITOR’S REPORT
To the Minister of Finance
The accompanying condensed consolidated financial statements, which comprise the condensed consolidated statement of financial position as at 31 March 2016, the condensed consolidated statement of operations and accumulated deficit, condensed consolidated statement of change in net debt and condensed consolidated statement of cash flow for the year then ended, and related notes, are derived from the audited consolidated financial statements of the Government of Canada for the year ended 31 March 2016. I expressed an unmodified audit opinion on those consolidated financial statements in my report dated 6 September 2016.
The condensed consolidated financial statements do not contain all the disclosures required by Canadian public sector accounting standards. Reading the condensed consolidated financial statements, therefore, is not a substitute for reading the audited consolidated financial statements of the Government of Canada.
The Government’s Responsibility for the Condensed Consolidated Financial Statements
The Government is responsible for the preparation of the condensed consolidated financial statements on the basis described in Note 1.
Auditor’s Responsibility
My responsibility is to express an opinion on the condensed consolidated financial statements based on my procedures, which were conducted in accordance with Canadian Auditing Standard (CAS) 810, “Engagements to Report on Summary Financial Statements”.
Opinion
In my opinion, the condensed consolidated financial statements derived from the audited consolidated financial statements of the Government of Canada for the year ended 31 March 2016 are a fair summary of those consolidated financial statements, on the basis described in Note 1.

Michael Ferguson, CPA, CA
FCPA, FCA (New Brunswick)
Auditor General of Canada
6 September 2016
Ottawa, Canada
|
|
2 4 0 r u e S p a r k s S t r e e t , O t t a w a , O n t a r i o K 1 A 0 G 6 |
CONDENSED CONSOLIDATED FINANCIAL STATEMENTSOFTHE GOVERNMENTOF CANADA
The fundamental purpose of these condensed consolidated financial statements is to provide an overview of the financial affairs and resources for which the Government is responsible under authority granted by Parliament. Responsibility for the integrity and objectivity of these statements rests with the Government.
Government of Canada
Condensed Consolidated Statement of Operations and Accumulated Deficit
for the Year Ended March 31, 2016
$ millions
| | | | | | | | | | | | | | | | |
| | | 2016
Budget
(Note
3) | | | 2016
Actual | | | 2015
Actual | | | | |
| | | | |
Revenues | | | | | | | | | | | | | | | | |
Income tax revenues | | | 186,396 | | | | 192,846 | | | | 181,406 | | | | | |
Other taxes and duties | | | 49,023 | | | | 49,805 | | | | 47,182 | | | | | |
Employment insurance premiums | | | 23,125 | | | | 23,070 | | | | 22,564 | | | | | |
Other revenues | | | 31,742 | | | | 29,732 | | | | 31,194 | | | | | |
Total revenues | | | 290,286 | | | | 295,453 | | | | 282,346 | | | | | |
| | | | |
Expenses | | | | | | | | | | | | | | | | |
Transfer payments | | | | | | | | | | | | | | | | |
Old age security benefits and related payments | | | 45,678 | | | | 45,461 | | | | 44,103 | | | | | |
Major transfer payments to other levels of government | | | 65,436 | | | | 65,850 | | | | 63,109 | | | | | |
Employment insurance benefits | | | 18,375 | | | | 19,419 | | | | 18,052 | | | | | |
Children’s benefits | | | 17,959 | | | | 18,025 | | | | 14,303 | | | | | |
Other transfer payments | | | 33,987 | | | | 34,874 | | | | 35,126 | | | | | |
Total transfer payments | | | 181,435 | | | | 183,629 | | | | 174,693 | | | | | |
Other program expenses | | | 81,777 | | | | 87,216 | | | | 79,148 | | | | | |
Total program expenses | | | 263,212 | | | | 270,845 | | | | 253,841 | | | | | |
Public debt charges | | | 25,704 | | | | 25,595 | | | | 26,594 | | | | | |
Total expenses | | | 288,916 | | | | 296,440 | | | | 280,435 | | | | | |
| | | | |
Annual (deficit) surplus | | | 1,370 | | | | (987 | ) | | | 1,911 | | | | | |
| | | | |
Accumulated deficit at beginning of year | | | 612,330 | 1 | | | 612,330 | | | | 611,881 | | | | | |
Other comprehensive loss | | | (2,366 | ) | | | (2,669 | ) | | | (2,360 | ) | | | | |
| | | | |
Accumulated deficit at end of year | | | 613,326 | | | | 615,986 | | | | 612,330 | | | | | |
The accompanying notes are an integral part of these condensed consolidated financial statements.
| 1 | Adjusted to the actual closing amount of the previous year. |
Annual Financial Report 2015–16 29
Government of Canada
Condensed Consolidated Statement of Financial Position
as at March 31, 2016
$ millions
| | | | | | | | | | | | |
| | | 2016 | | | 2015 | | | | |
| | | |
Liabilities | | | | | | | | | | | | |
Accounts payable and accrued liabilities | | | 127,853 | | | | 123,631 | | | | | |
Interest-bearing debt | | | | | | | | | | | | |
Unmatured debt | | | 688,211 | | | | 665,180 | | | | | |
Pensions and other future benefits | | | 237,908 | | | | 228,804 | | | | | |
Other liabilities | | | 5,602 | | | | 6,002 | | | | | |
Total interest-bearing debt | | | 931,721 | | | | 899,986 | | | | | |
Total liabilities | | | 1,059,574 | | | | 1,023,617 | | | | | |
| | | |
Financial assets | | | | | | | | | | | | |
Cash and accounts receivable | | | 154,688 | | | | 136,696 | | | | | |
Foreign exchange accounts | | | 93,539 | | | | 85,018 | | | | | |
Loans, investments and advances | | | 115,957 | | | | 113,681 | | | | | |
Public sector pension assets | | | 1,639 | | | | 1,263 | | | | | |
Total financial assets | | | 365,823 | | | | 336,658 | | | | | |
Net debt | | | 693,751 | | | | 686,959 | | | | | |
| | | |
Non-financial assets | | | | | | | | | | | | |
Tangible capital assets | | | 65,838 | | | | 63,347 | | | | | |
Other | | | 11,927 | | | | 11,282 | | | | | |
Total non-financial assets | | | 77,765 | | | | 74,629 | | | | | |
Accumulated deficit | | | 615,986 | | | | 612,330 | | | | | |
Contractual obligations and contingent liabilities (Notes 4 and 5) | | | | | | | | | | | | |
The accompanying notes are an integral part of these condensed consolidated financial statements.
30
Government of Canada
Condensed Consolidated Statement of Change in Net Debt
for the Year Ended March 31, 2016
$ millions
| | | | | | | | | | | | | | | | |
| | | 2016
Budget (Note 3) | | | 2016
Actual | | | 2015
Actual | | | | |
Net debt at beginning of year | | | 686,959 | 1 | | | 686,959 | | | | 682,314 | | | | | |
| | | | |
Change in net debt during the year | | | | | | | | | | | | | | | | |
Annual deficit (surplus) | | | (1,370 | ) | | | 987 | | | | (1,911 | ) | | | | |
Acquisition of tangible capital assets | | | 8,541 | | | | 8,015 | | | | 7,204 | | | | | |
Amortization of tangible capital assets | | | (5,702 | ) | | | (5,049 | ) | | | (5,090 | ) | | | | |
Other | | | (400 | ) | | | 170 | | | | 2,082 | | | | | |
Net increase in net debt due to operations | | | 1,069 | | | | 4,123 | | | | 2,285 | | | | | |
Other comprehensive loss | | | 2,366 | | | | 2,669 | | | | 2,360 | | | | | |
Net increase in net debt | | | 3,435 | | | | 6,792 | | | | 4,645 | | | | | |
Net debt at end of year | | | 690,394 | | | | 693,751 | | | | 686,959 | | | | | |
The accompanying notes are an integral part of these condensed consolidated financial statements.
| 1 | Adjusted to the actual closing amount of the previous year. |
Government of Canada
Condensed Consolidated Statement of Cash Flow
for the Year Ended March 31, 2016
$ millions
| | | | | | | | | | | | |
| | | 2016 | | | 2015 | | | | |
| | | |
Cash used by operating activities | | | | | | | | | | | | |
Annual (deficit) surplus | | | (987 | ) | | | 1,911 | | | | | |
Adjustments to reconcile annual (deficit) surplus to cash used by operating activities | | | (10,145 | ) | | | (2,014 | ) | | | | |
| | | (11,132 | ) | | | (103 | ) | | | | |
Cash used by capital investment activities | | | (6,747 | ) | | | (5,850 | ) | | | | |
Cash provided by investing activities | | | 1,528 | | | | 9,156 | | | | | |
Cash provided by financing activities | | | 19,922 | | | | 367 | | | | | |
Net increase in cash and cash equivalents | | | 3,571 | | | | 3,570 | | | | | |
Cash and cash equivalents at beginning of year | | | 34,999 | | | | 31,429 | | | | | |
Cash and cash equivalents at end of year | | | 38,570 | | | | 34,999 | | | | | |
Supplementary information | | | | | | | | | | | | |
Cash used for interest | | | 14,337 | | | | 15,152 | | | | | |
The accompanying notes are an integral part of these condensed consolidated financial statements.
Annual Financial Report 2015–16 31
Notes to the Condensed Consolidated Financial Statements
of the Government of Canada
1. Applied Criteria in the Preparation of the Condensed Consolidated Financial Statements
The criteria applied by the Government in the preparation of these condensed consolidated financial statements are as follows:
| i. | These condensed consolidated financial statements are extracted from the audited consolidated financial statements included in Section 2 of Volume I of the Public Accounts of Canada 2016, which are to be tabled in Parliament. |
| ii. | The condensed consolidated financial statements are in agreement with the related information in the audited consolidated financial statements and contain the information necessary to avoid distorting or obscuring matters disclosed in the related complete consolidated financial statements, including the notes thereto. |
| iii. | As these condensed consolidated financial statements are, by their nature, summarized, they do not include all disclosures required by Canadian public sector accounting standards. |
| iv. | Readers interested in the disclosure of more detailed data should refer to the audited consolidated financial statements in the Public Accounts of Canada. |
2. Summary of Significant Accounting Policies
The reporting entity of the Government of Canada includes all of the government organizations which comprise the legal entity of the Government as well as other government organizations, including Crown corporations, which are separate legal entities but are controlled by the Government. The financial activities of all of these entities, except for enterprise Crown corporations and other government business enterprises, are consolidated in these financial statements on a line-by-line and uniform basis of accounting after eliminating significant inter-governmental balances and transactions. Enterprise Crown corporations and other government business enterprises, which are not dependent on the Government for financing their activities, are recorded under the modified equity method. The Canada Pension Plan (CPP), which includes the assets of the CPP under the administration of the Canada Pension Plan Investment Board, is excluded from the reporting entity because changes to the CPP require the agreement of two thirds of participating provinces and it is therefore not controlled by the Government.
The Government accounts for transactions on an accrual basis, using the Government’s accounting policies that are described in Note 1 to its audited consolidated financial statements, which are based on Canadian public sector accounting standards. The presentation and results using the stated accounting policies do not result in any significant differences from Canadian public sector accounting standards.
Financial assets recorded on the Condensed Consolidated Statement of Financial Position can provide resources to discharge liabilities or finance future operations and are recorded at the lower of cost or net realizable value. Non-financial assets cannot normally be converted into cash to finance future operations without disrupting government operations; they are recorded at cost less accumulated amortization. Liabilities are recorded at the estimated amount ultimately payable, adjusted for the passage of time, as required. Obligations for pensions and other future benefits are measured on an actuarial basis. Allowances for valuation are established for loans, investments and advances, as well as for loan guarantees and other obligations.
32
Some amounts in these condensed consolidated financial statements are based on estimates and assumptions made by the Government. They are based on facts and circumstances, historical experience, general economic conditions and reflect the Government’s best estimate of the related amount at the end of the reporting period. Estimates and underlying assumptions are reviewed annually at March 31. Revisions to accounting estimates are recognized in the period in which estimates are revised if revisions affect only that period or in the period of revision and future periods if revisions affect both current and future periods.
A material measurement uncertainty exists when it is reasonably possible that a material variance could occur in the reported or disclosed amount in the near term. Near term is defined as a period of time not to exceed one year from March 31. The Government has determined that a material measurement uncertainty exists with respect to the reported amounts for public sector pensions and other employee and veteran future benefits. Measurement uncertainty due to estimates and assumptions also exists in the accrual of tax revenues, the related amounts receivable and payable, and the allowance for doubtful accounts; and environmental liabilities included in accounts payable and accrued liabilities. It is reasonably possible that the Government’s reassessments of these estimates and assumptions could require a material change in reported amounts or disclosures in the condensed consolidated financial statements.
3. Source of Budget Amounts
The budget amounts included in the Condensed Consolidated Statement of Operations and Accumulated Deficit and the Condensed Consolidated Statement of Change in Net Debt are derived from the amounts that were budgeted for 2015-2016 in the April 2015 Budget Plan (Budget 2015).
Since actual opening balances of the accumulated deficit and net debt were not available at the time of preparation of Budget 2015, the corresponding amounts in the budget column have been adjusted to the actual closing balances of the previous year.
4. Contractual Obligations
The nature of government activities results in large multi-year contracts and agreements, including international treaties, protocols and agreements of various size and importance. Any financial obligations resulting from these contracts and agreements are recorded as a liability when the terms for the acquisition of goods and services or the provision of transfer payments are met.
Contractual obligations that will materially affect the level of future expenditures include transfer payment agreements, agreements for the acquisition of goods and services, operating leases and funding of international organizations. At March 31, 2016, contractual obligations amount to $106,345 million ($103,780 million in 2015), of which $27,473 million pertains to fiscal year 2017.
Annual Financial Report 2015–16 33
5. Contingent Liabilities
Contingent liabilities arise in the normal course of operations and their ultimate disposition is unknown.
The Government’s contingent liabilities include guarantees provided by the Government, callable share capital in international organizations, claims and pending and threatened litigation, and insurance programs of agent enterprise Crown corporations.
| i. | Guarantees provided by the Government include guarantees on the borrowings of enterprise Crown corporations and other government business enterprises, loan guarantees, insurance programs managed by the Government, and other explicit guarantees. At March 31, 2016, the principal amount outstanding for guarantees provided by the Government amounts to $490,557 million ($442,904 million in 2015) for which an allowance of $312 million ($317 million in 2015) has been recorded. Of the total amount guaranteed, $266,434 million ($253,049 million in 2015) relates to guarantees on the borrowings of agent enterprise Crown corporations for which no allowance (nil in 2015) has been recorded. |
| ii. | The Government has callable share capital in certain international organizations that could require payments to those agencies. At March 31, 2016, callable share capital amounts to $31,041 million ($30,601 million in 2015). |
| iii. | There are thousands of claims and pending and threatened litigation cases outstanding against the Government. While the total amount claimed in these actions is significant, their outcomes are not determinable. The Government has recorded an allowance for claims and litigation where it is likely that there will be a future payment and a reasonable estimate of the loss can be made. Claims and litigation for which the outcome is not determinable and for which an amount has not been accrued are estimated at approximately $8,679 million ($8,304 million in 2015). Certain large and significant claims relate to comprehensive land claims, specific claims, and assessed taxes under objection or appeal. |
| iv. | At March 31, 2016, insurance in force relating to self-sustaining insurance programs operated by four agent enterprise Crown corporations amounts to $1,672,619 million ($1,671,666 million in 2015). The Government expects that all four corporations will cover the cost of both current claims and possible future claims. |
34