Exhibit C-11
©Her Majesty the Queen in Right of Canada (2017)
All rights reserved
All requests for permission to reproduce this document
or any part thereof shall be addressed to
the Department of Finance Canada.
Cette publication est également disponible en français.
Cat. No.: F1-52E-PDF

TABLE OF CONTENTS
| | | | |
Introduction | | | 1 | |
| |
Chapter 1 – Economic and Fiscal Update | | | 3 | |
| |
Introduction | | | 3 | |
| |
Recent Developments in the Canadian Economy | | | 4 | |
| |
Global Economic Developments and Outlook | | | 13 | |
| |
Private Sector Outlook | | | 19 | |
| |
Risk Assessment | | | 20 | |
| |
Changes to the Fiscal Outlook | | | 21 | |
| |
Impact of Alternative Economic Scenarios | | | 24 | |
| |
Chapter 2 – Results for Middle Class Canadians | | | 25 | |
| |
Introduction | | | 25 | |
| |
Opportunities for the Middle Class | | | 26 | |
| |
An Innovative, Inclusive and Sustainable Economy | | | 33 | |
| |
Chapter 3 – Fairness for the Middle Class and Those Working Hard to Join It | | | 39 | |
| |
Introduction | | | 39 | |
| |
New Measures: Strengthening Support for Canadian Families and Workers | | | 40 | |
| |
A System That Works for the Middle Class | | | 44 | |
| |
Annex 1 – Details of Economic and Fiscal Projections | | | 57 | |
| |
Economic Projections | | | 57 | |
| |
Fiscal Projections | | | 60 | |

FALL ECONOMIC STATEMENT 2017
INTRODUCTION
Since coming into office, the Government has focused on investing in the economy so that it works for the middle class, and those working hard to join it. The investments we’ve made in people, in communities and in the economy have put more money in the pockets of those who need it most, are creating more well-paying jobs and are giving Canadians greater confidence in their future.
Today, Canada is the fastest growing economy in the Group of Seven (G7). The Government’s plan is working.
The new Canada Child Benefit and historic investments in early learning and child care mean a better future for our children, and more money in the pockets of parents who are struggling to make ends meet. They mean families have more money for things like skating lessons, camps or healthier food, and parents have more flexibility when they choose to go back to work after starting or growing their family.
A stronger retirement income system through increases in Old Age Security and the Guaranteed Income Supplement, as well as a strengthened Canada Pension Plan, means more money for seniors now, and will ensure workers today and in the future can look forward to a more secure retirement.
Investments in skills and innovation, a focus on post-secondary education and an immigration system focused on attracting top talent are positioning Canada and Canadians to lead in the rapidly changing global economy. This will create more Canadian jobs, and help students and workers get the tools and knowledge they need to advance throughout their career.
Historic investments in infrastructure projects like light rail transit, roads, bridges and clean water initiatives will help keep our people and our cities moving, support jobs now, and make our communities more efficient in the future.
A strong commitment to a clean growth economy—in partnership with all provinces and territories—means that Canada will continue to do its part to support a more sustainable, low-carbon economy, and provide new jobs and opportunities for Canadians in the process.
A renewed relationship with Indigenous Peoples sets the foundation for greater opportunity, stronger communities with basic necessities such as clean drinking water and more economic success.
The Government’s approach has been to focus on smart, targeted investments designed to create good, well-paying jobs now and to strengthen the economy over the long term, while preserving Canada’s low-debt advantage. Tax cuts for the middle class—including a proposed reduction in the small business tax rate—an historic agreement to strengthen the Canada Pension Plan, and boosts to Old Age Security, the Guaranteed Income Supplement and student grants, combined with transformative investments in infrastructure, have increased consumer confidence and investment. It’s an approach that’s working for the middle class, and those working hard to join it.
| | |
| | | FALL ECONOMIC STATEMENT 2017 1 |

| | |
| | “To support the economy, the government introduced tax cuts for the middle class, expanded family benefits, and raised infrastructure spending… [This agenda] has succeeded in revitalizing the economy after a tough year in 2015.” —International Monetary Fund |
The Government’s plan includes a responsible approach to fiscal management that is appropriate for the current economic cycle and focused on long-term economic growth and fiscal sustainability. This approach has been effective, and the economy is outperforming expectations.
As the economy strengthens, the Government is adjusting its fiscal strategy to adapt to the better-than-expected economic outlook. The current fiscal track shows steady improvements in the Government’s budgetary position along with a decline in the federal debt-to-GDP (gross domestic product) ratio.
The Government will maintain this downward deficit and debt ratio track—preserving Canada’s low-debt advantage for current and future generations.
The Government will continue to make decisions with a clear understanding of their impacts on different groups of women and men, and reduce barriers to individuals’ success. The Budget 2017 Gender Statement was an important step in bringing gender equality to the forefront of budget decision-making, and is contributing to the broader integration of gender and diversity considerations in Government policy-making. The Government will build on this work by ensuring that all future budget decisions are informed by clear and rigorous gender-based analysis, for a budget plan that promotes greater gender equality and inclusiveness.
Chapter 1
ECONOMIC AND FISCAL UPDATE
INTRODUCTION
The Government’s plan to invest in the economy and strengthen the middle class is working. The recent resurgence in gross domestic product (GDP) makes Canada the fastest growing economy in the Group of Seven (G7) (Chart 1.1). The economy has created over 450,000 jobs since late 2015, and the unemployment rate has dropped to its lowest level since 2008. Consumer confidence is up, thanks in part to the Canada Child Benefit (CCB), and growth is forecast to be 3.1 per cent in 2017—significantly above expectations at the beginning of the year.

Reflecting this recent economic strength, the fiscal outlook is improving, with projected budgetary balances and debt-to-GDP levels improving across the forecast horizon. The Government remains committed to sound fiscal management—balancing the need to make targeted investments to support economic growth while preserving Canada’s low-debt advantage for current and future generations.
This chapter provides an overview of recent major economic developments and presents the current fiscal situation and outlook.
Notes: This section incorporates data available up to and including October 20, 2017, unless otherwise indicated. All rates are reported at annual rates unless otherwise noted.
| | |
| | | ECONOMIC AND FISCAL UPDATE 3 |
RECENT DEVELOPMENTS IN THE CANADIAN ECONOMY
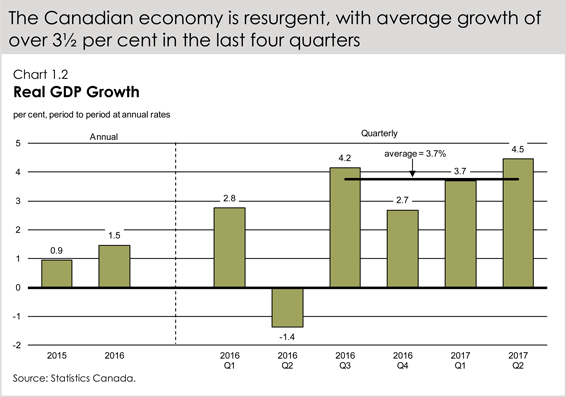
Canadian economic growth has accelerated sharply since the second half of 2016 (Chart 1.2). Over the last four quarters, the Canadian economy has had its fastest rate of growth since the beginning of 2006, and growth is becoming more balanced across sectors and regions.

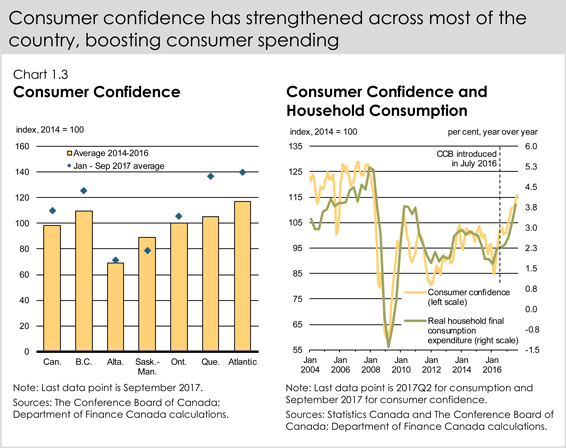
Household consumption has been the main contributor to economic growth over the past year, increasing at or above 3.0 per cent in each quarter since mid-2016, significantly above its post-recession average. Household consumption growth has been fairly broad-based across consumption categories and regions. It has been underpinned by solid employment gains, low interest rates, improving consumer confidence and, since July 2016, by the ongoing support of the CCB to families (Chart 1.3).
Recent strength in economic activity will likely translate into jobs and income gains, which should support continued consumption growth in the near term.
| | |
| | | ECONOMIC AND FISCAL UPDATE 5 |
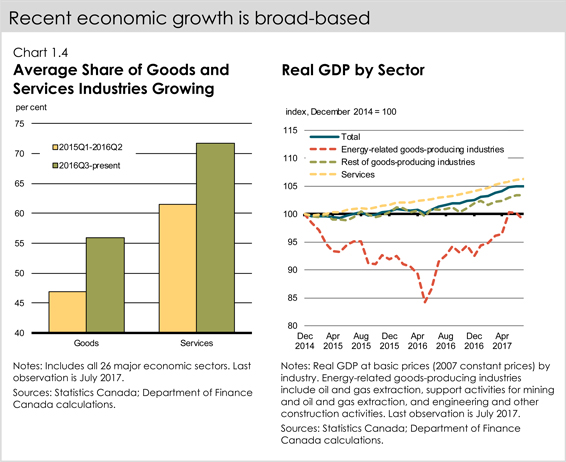
Growth in economic output has been observed across a larger number of both goods and services industries over the past year compared to what was observed in the aftermath of the oil price shock (Chart 1.4).
After being hit by the fall in oil prices, activity in energy-related goods-producing industries stabilized and started to gradually pick up in mid-2016 following the Fort McMurray wildfires in May. Along with this, activity in other related industries (e.g. machinery manufacturing) has also improved, contributing to broader overall growth among goods-producing industries.
Meanwhile, the services sector has continued to grow at a steady pace.
As global crude oil prices have stabilized, so has the economic situation in energy-producing provinces.
Since mid-2016, half of Alberta’s total job losses1 have been recouped, all in full-time positions. However, paid employment2 in the province—which recorded a larger decline as many laid off workers returned to their home province, where they are now accounted for—has recovered less quickly. The rebound in Alberta has boosted national GDP growth directly, as Alberta accounts for about 16 per cent of total Canadian output, and indirectly, as stronger demand from Alberta has boosted growth in other provinces via trade channels.
| 1 | Employment as measured in Statistics Canada’s Labour Force Survey (LFS). |
| 2 | Paid employment (for example, excluding the self-employed) as measured in Statistics Canada’s Survey of Employment, Payroll and Hours (SEPH). |
Similarly, stabilization in energy prices has been reflected in stronger economic activity in
Saskatchewan, with the provincial economy expected to post a strong rebound in real GDP growth in 2017 following two consecutive years of decline.
Growth has also been robust outside of these energy-producing regions, across the country.
For example:
| • | | Growth in the Maritime provinces in 2017 is expected to be at its strongest pace since 2010; |
| • | | The unemployment rate in Quebec is near its lowest level since at least 1976; |
| • | | Ontario has posted its longest back-to-back stretch of real GDP growth of above 2 per cent in over 15 years; and |
| • | | The British Columbia economy has created over 140,000 net new jobs since the beginning of last year—an increase of almost 6 per cent. |
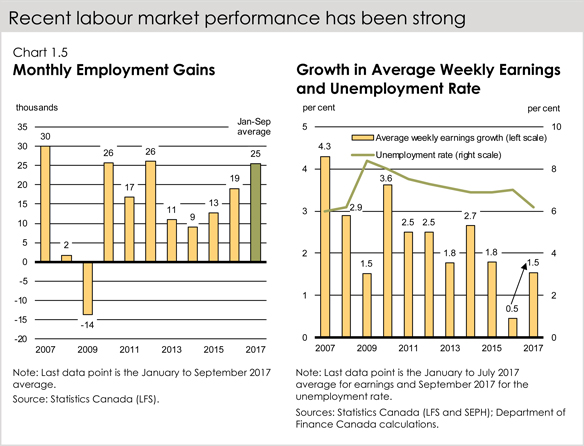
The recent acceleration and broadening of growth has coincided with robust job gains for Canada as a whole, as 472,300 net jobs have been created since November 2015. The pace of job creation so far in 2017—25,000 jobs per month—has been among the fastest in the past decade (Chart 1.5).
These recent gains in the labour market have contributed to lowering the unemployment rate from 7.2 per cent at the beginning of 2016 to 6.2 per cent in September 2017, its lowest level since October 2008. Moreover, according to the Bank of Canada’s Business Outlook Survey, hiring intentions have increased compared to 2015 and mid-2016. The net balance of firms facing greater labour market pressures compared to a year ago—although not yet limiting their ability to meet demand—reached its highest level in over a decade as of the latest survey. Meanwhile, wage growth is picking up, following softness in 2016. Average weekly earnings have increased by $15, or from $954 to $969, in the first seven months of 2017 compared to the same period last year.
| | |
| | | ECONOMIC AND FISCAL UPDATE 7 |
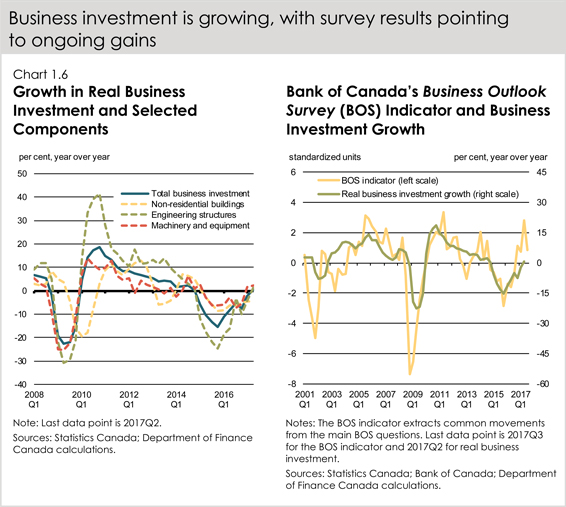
After rebounding rapidly during the recovery from the global recession, real business investment shrank over 2015 and 2016. This fall was driven by dramatic declines in engineering structures in the response to the global oil price shock and resulting pull-back in investment in oil-producing regions (Chart 1.6).
However, business investment is now growing, underpinned by stronger economic activity in both the resource and non-resource sectors and much improved business sentiment. The Bank of Canada’s Business Outlook Survey shows a strong improvement in business investment intentions over the last year. Despite a slight pull-back in the most recent Survey, intentions remain in solid positive territory, pointing to a further recovery in investments going ahead. With capacity utilization rates of several industries currently close to their pre-recession peaks, this suggests that the recent pick-up in business investment may prove to be more enduring.
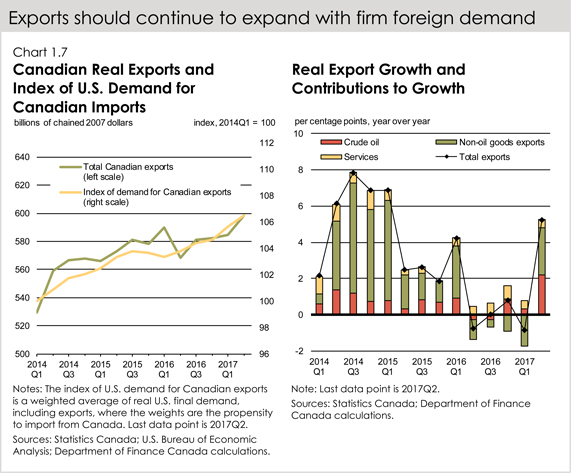
Total Canadian exports have continued to rise in recent years. Growth in non-oil goods exports was the main driver of overall export growth in 2014, largely explained by higher foreign demand (Chart 1.7).
Starting in early 2015, growth in exports of non-oil goods slowed in line with weaker U.S. demand, in spite of the lower Canadian dollar. Looking ahead, non-oil exports should continue to expand in line with a positive U.S. growth outlook.
| | |
| | | ECONOMIC AND FISCAL UPDATE 9 |
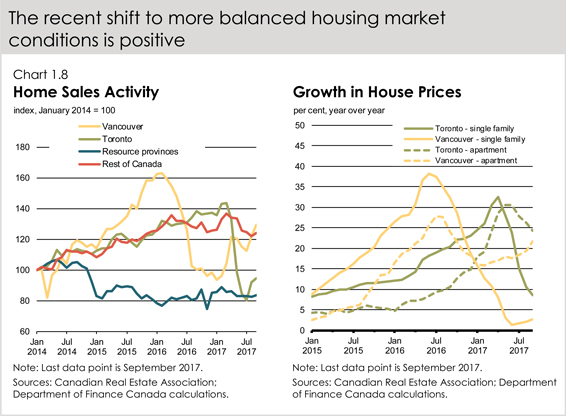
In the Canadian housing market, following rapid price growth in 2016 and early 2017, Toronto and surrounding regions have seen a shift to more balanced market conditions (Chart 1.8). In the Vancouver area, activity has rebounded modestly following a slowdown in the second half of 2016. Nonetheless, affordability remains a pressing concern in these markets, particularly for middle class families and lower-income Canadians. While prices for single-family homes have stagnated or declined, prices for other dwelling types, particularly apartment condominiums, continue to rise. This fall, the Government intends to release details of its National Housing Strategy, first announced in Budget 2017, which is estimated to help up to 500,000 Canadians find a safe and secure place to call home.
Looking ahead, ongoing solid economic conditions will provide support for housing demand across the country. However, rising interest rates, combined with recent federal and provincial housing measures, should temper housing demand going forward.
Household debt relative to income is at historic highs and continues to rise gradually, led by growth in mortgage debt (Chart 1.9). However, low interest rates have kept the household debt-service ratio stable, while rising asset values (for both housing and non-housing assets) have kept the debt-to-asset ratio (a measure of household leverage) low.
Rising interest rates are likely to increase debt-service ratios, which will in turn constrain future household spending growth. However, since most borrowers have fixed-rate mortgages that do not need to be renewed over the near term, the economic impacts of higher rates will be felt gradually over time. Nonetheless, households need to be prudent and manage their debt levels in the context of rising interest rates.
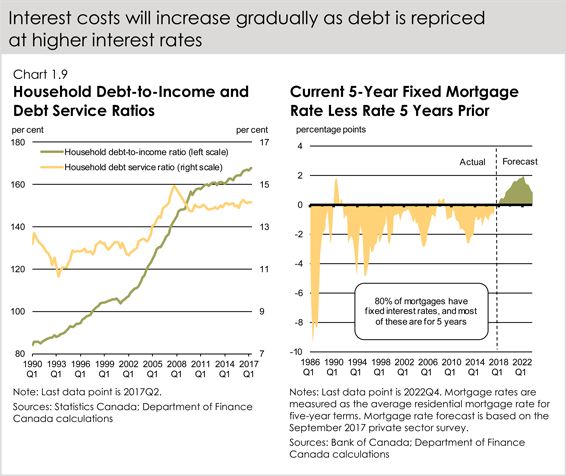
The federal government has introduced several measures since 2015 to help ensure the stability of housing and financial markets, protecting what is for many Canadians the most important investment of their lives. These include stricter down payment requirements for higher-priced homes, measures to improve tax fairness by ensuring that the principal residence exemption is available only in appropriate cases, and a mortgage rate stress test for insured mortgages, helping borrowers better afford their mortgages in a rising interest rate environment. The Office of the Superintendent of Financial Institutions also recently announced changes to its mortgage underwriting Guideline B-20 for federally regulated lenders, including a mortgage rate stress test for uninsured mortgages. These new measures will come into effect on January 1, 2018.
The federal government will continue to closely monitor the housing market, working collaboratively with provinces and municipalities.
| | |
| | | ECONOMIC AND FISCAL UPDATE 11 |
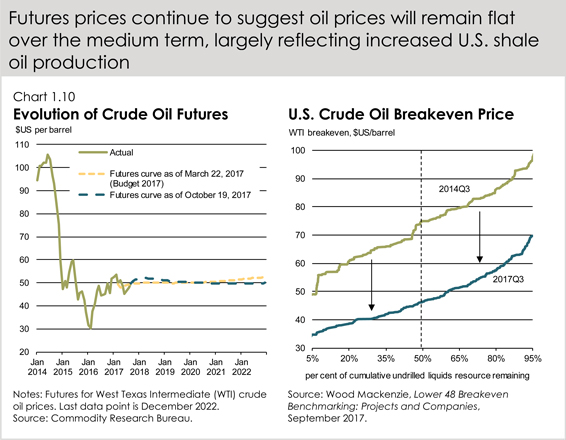
Oil prices have increased modestly from lows reached in early 2016, but are expected to remain largely flat over the medium term (Chart 1.10). This reflects increased output from U.S. shale oil producers, persistently high U.S. crude oil inventories, and concerns over the durability of the Organization of the Petroleum Exporting Countries production cuts.
The U.S. has emerged as the new global swing producer, as productivity enhancements in the industry have lowered costs over the last several years such that over half of undrilled oil reserves in the U.S. are now economical at sub-US$50 market prices.
GLOBAL ECONOMIC DEVELOPMENTS AND OUTLOOK
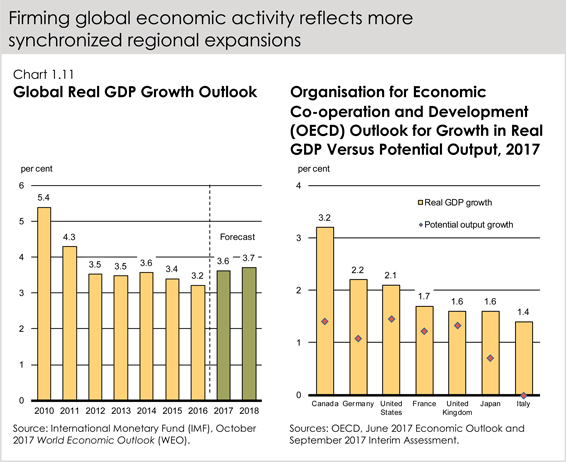
The strong recent economic performance in Canada is taking place in tandem with a firming global economic expansion. Global growth is showing signs of a durable pick-up after two consecutive years of deceleration (Chart 1.11).
All G7 countries are currently expanding faster than their estimated trend growth rates, economic activity in China remains robust, and growth is returning in Russia and Brazil, which faced deep recessions over the last three years.
| | |
| | | ECONOMIC AND FISCAL UPDATE 13 |
In the United States, the current economic expansion is the third-longest since World War II. Economic activity is growing at a healthy pace of roughly 2 per cent, which is slightly higher than its estimated potential growth rate (Chart 1.12). At the same time, expectations for a policy-driven acceleration in growth this year have been reduced, as prospects for significant fiscal stimulus in 2017 have dimmed. Reflecting this, both the IMF and OECD have unwound a previously assumed near-term boost to growth from their respective U.S. outlooks.
The U.S. labour market has continued to tighten, with the unemployment rate reaching a 16-year low of 4.2 per cent in September 2017. Moreover, the labour force participation rate has been rising modestly in spite of downward pressure from population aging, mainly due to an increase in the participation of women in the workforce. In light of the continued underlying strength of the U.S. economy, the Federal Reserve has increased interest rates twice so far in 2017 and started to very gradually reduce the size of its balance sheet.
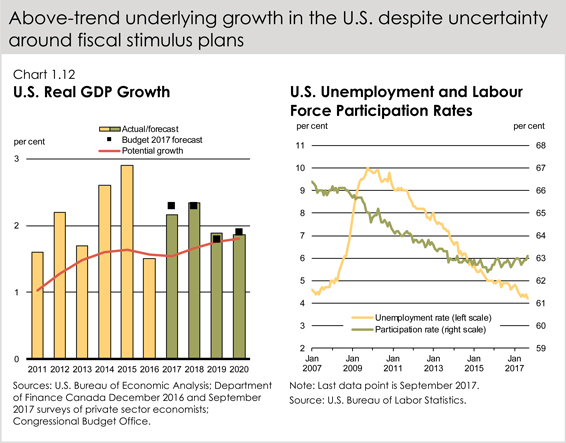
The recent natural disasters in Texas and Florida weighed on third-quarter growth as a result of disruptions to economic activity. However, similar to past experience, the macroeconomic impacts are expected to be transitory, as production recovers and reconstruction proceeds.
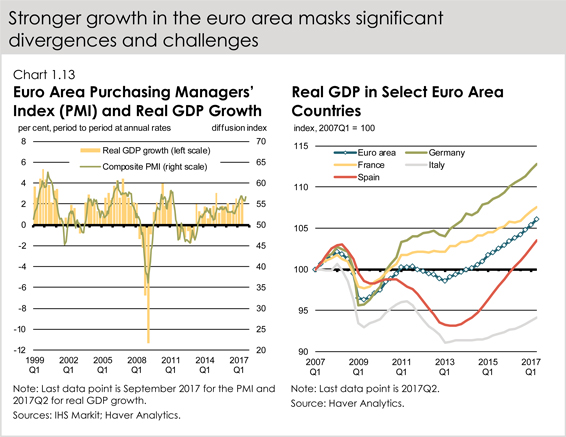
The pace of economic activity has also accelerated this year in Europe, and high-frequency indicators suggest a continuation of above-trend growth into late 2017 (Chart 1.13). With significant excess capacity remaining in many countries, as illustrated by still-elevated unemployment rates and below-target inflation, the European economic recovery has scope to maintain momentum in the coming year. Against this positive backdrop, ongoing vulnerabilities in the banking sector in some countries and uncertainties related to conditions of the United Kingdom’s upcoming exit from the European Union continue to be potential headwinds.
| | |
| | | ECONOMIC AND FISCAL UPDATE 15 |
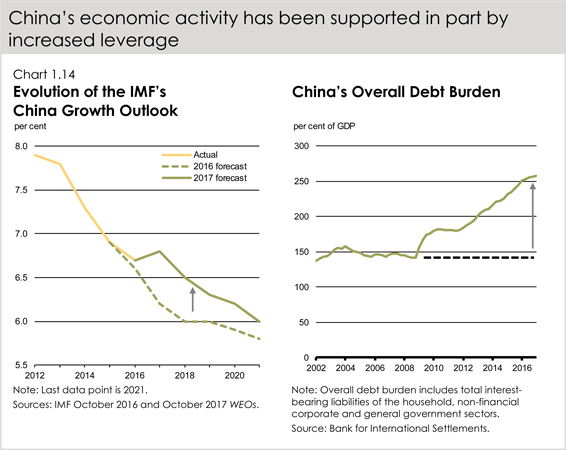
Among emerging economies, forecasts for China’s economy—the single largest contributor to global growth—have been revised up (Chart 1.14). Growth is being significantly aided by stimulative fiscal policy, and increased private and public borrowing. While this approach has supported growth in the short term, medium-term risks, notably related to corporate leverage and a buoyant housing market, remain unaddressed.
Among other large emerging economies, Brazil and Russia have returned to growth following their recent recessions, reflecting a firming in global commodity prices and more favourable financial conditions. In addition, the Indian economy continues to expand at a brisk pace. However, sustained strong growth in emerging economies hinges on domestic economic reforms to foster investment, boost productivity, as well as strengthen fiscal, monetary and exchange rate frameworks.
Global financial conditions remain supportive of economic activity (Chart 1.15). Interest rates remain at historically low levels, with short-term interest rates in a number of countries still in negative territory, and some central banks continuing to deploy extraordinary monetary policy measures to close domestic output gaps and stoke inflation. Globally, there remains more than US$8 trillion in negative-yielding sovereign debt, the bulk of which is from Europe and Japan.
In addition, equity markets have continued to rise, supported by the improving global economic backdrop, still highly accommodative monetary policy, increased confidence and investors’ continued search for yield.
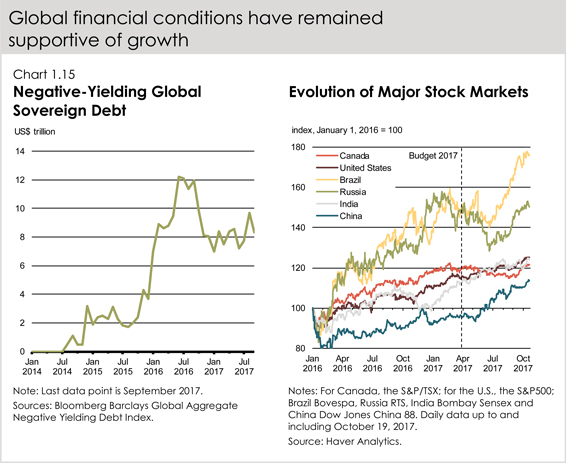
Measures of volatility remain muted despite elevated policy, and more recently geopolitical, uncertainty. This situation heightens the risk of complacency among market participants, which could exacerbate any potential financial market turbulence if financial conditions tighten faster than expected as monetary policy normalization proceeds globally. In addition, some emerging economies are more vulnerable to a global repricing of risk, which could trigger sharp movements in capital flows, especially in those countries with large holdings of U.S.-dollar-denominated debt.
| | |
| | | ECONOMIC AND FISCAL UPDATE 17 |
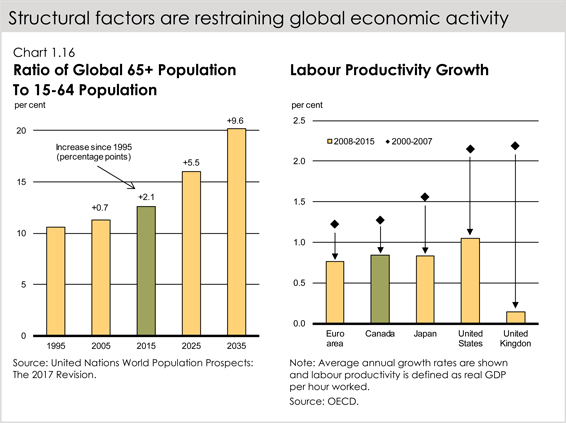
Despite strengthening global economic activity, declining unemployment rates and favourable financial conditions, the global economy continues to face a number of challenges. For example, the current strong economic performance, especially among advanced economies, is likely to moderate as many economies are expected to return to their respective trend growth rates in the short to medium term. In particular, pressures from changing demographics and productivity challenges, as well as risks from rising protectionism, continue to weigh on the outlook (Chart 1.16).
PRIVATE SECTOR OUTLOOK
The fiscal projections contained in this Fall Economic Statement are based on the September 2017 survey of private sector economists. Details of the full private sector economic outlook are presented in Annex 1.
In summary, the economists expect real GDP growth to rise from 1.5 per cent in 2016 to 3.1 per cent in 2017, significantly higher than the 2.0 per cent expected in Budget 2017 and the 2.2 per cent originally projected in Budget 2016. The outlook for real GDP growth is little changed thereafter compared to Budget 2017. Similarly, expectations for growth in nominal GDP—the broadest measure of the tax base—have been revised up for 2017 (from 4.2 per cent to 5.5 per cent), but are largely unchanged thereafter. As a result, the level of nominal GDP over the projection horizon is $30 billion higher per year, on average, than was anticipated in Budget 2017 (Table 1.1).
Table 1.1
Average Private Sector Forecasts
per cent, unless otherwise indicated
| | | | | | | | | | | | | | | | | | |
| | | 2016 | | 2017 | | 2018 | | 2019 | | 2020 | | 2021 | | 2022 | | | | 2017–
2021 |
Real GDP growth | | | | | | | | | | | | | | | | | | |
Budget 20161 | | 1.4 | | 2.2 | | 2.2 | | 2.0 | | 1.9 | | – | | – | | | | – |
Budget 20171 | | 1.4 | | 2.0 | | 2.0 | | 1.7 | | 1.7 | | 1.8 | | – | | | | 1.8 |
2017 Fall Economic Statement | | 1.5 | | 3.1 | | 2.1 | | 1.6 | | 1.7 | | 1.7 | | 1.8 | | | | 2.0 |
| | | | | | | | | |
GDP inflation | | | | | | | | | | | | | | | | | | |
Budget 20161 | | 0.9 | | 2.4 | | 2.1 | | 2.1 | | 2.1 | | – | | – | | | | – |
Budget 20171 | | 0.5 | | 2.1 | | 2.0 | | 1.8 | | 2.1 | | 2.0 | | – | | | | 2.0 |
2017 Fall Economic Statement | | 0.6 | | 2.4 | | 1.8 | | 1.8 | | 2.0 | | 1.9 | | 1.9 | | | | 2.0 |
| | | | | | | | | |
Nominal GDP growth | | | | | | | | | | | | | | | | | | |
Budget 20161 | | 2.3 | | 4.6 | | 4.3 | | 4.2 | | 4.1 | | – | | – | | | | – |
Budget 20171 | | 1.9 | | 4.2 | | 4.0 | | 3.5 | | 3.8 | | 3.8 | | – | | | | 3.9 |
2017 Fall Economic Statement | | 2.1 | | 5.5 | | 4.0 | | 3.4 | | 3.7 | | 3.6 | | 3.8 | | | | 4.1 |
| | | | | | | | | |
Nominal GDP level ($ billions) | | | | | | | | | | | | | | | | | | |
Budget 20161 | | 2,033 | | 2,126 | | 2,218 | | 2,310 | | 2,404 | | – | | – | | | | |
Budget 20171 | | 2,024 | | 2,109 | | 2,194 | | 2,271 | | 2,357 | | 2,447 | | – | | | | |
2017 Fall Economic Statement | | 2,028 | | 2,140 | | 2,226 | | 2,302 | | 2,388 | | 2,473 | | 2,568 | | | | |
| | | | | | | | | |
Difference between Budget 2016 and
2017 Fall Economic Statement | | -5 | | 13 | | 8 | | -8 | | -16 | | – | | – | | | | – |
Difference between Budget 2017 and
2017 Fall Economic Statement | | 3 | | 30 | | 31 | | 31 | | 31 | | 26 | | – | | | | 30 |
| 1 | GDP figures have been restated to reflect the historical revisions to the Canadian System of National Accounts, which were published along with data for the second quarter of 2017, released on August 31, 2017. |
Sources: For Budget 2016, Department of Finance Canada February 2016 survey of private sector economists; for Budget 2017, Department of Finance Canada December 2016 survey of private sector economists; for the 2017 Fall Economic Statement, Department of Finance Canada September 2017 survey of private sector economists; Statistics Canada.
| | |
| | | ECONOMIC AND FISCAL UPDATE 19 |
RISK ASSESSMENT
Global and Canadian growth have strengthened in recent quarters and upside risks to the outlook are present. Stronger growth in the world economy, particularly in the euro area and more recently in the U.S., could be more durable and self-sustaining than anticipated, which would reinforce Canadian growth. As a result, investment growth could surprise on the upside, boosting Canada’s long-term productive capacity.
There are still downside risks to the outlook. In China, elevated corporate debt levels and the slow pace of economic reforms could lead to a greater-than-expected slowdown in growth. Uncertainty over U.S. economic policies could affect Canadian business confidence. Additionally, global financial markets could experience periods of turbulence as advanced-economy central banks begin or continue the significant task of gradually normalizing monetary policy. This is especially true in the context of muted market volatility and rising market valuations.
On the domestic front, Canada’s household debt-to-income ratio remains elevated historically. This could limit the contribution to growth of both housing and consumer spending in the coming years, particularly in a rising interest rate environment.
Overall, the risks to the September 2017 economic outlook appear broadly balanced. For prudent planning purposes, the adjustment for risk is $1.5 billion in 2017–18 and $3.0 billion in future fiscal years, to account for risks and uncertainty in the economic and fiscal forecast.
CHANGES TO THE FISCAL OUTLOOK
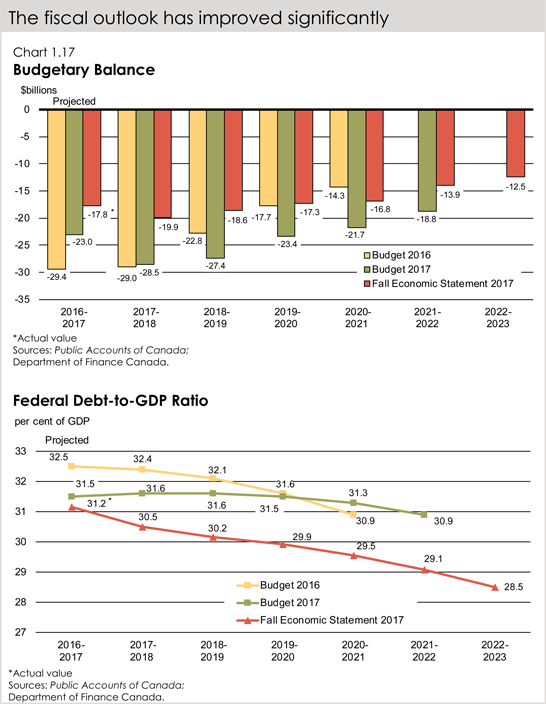
The improvement in the economic outlook of private sector forecasters, combined with the better-than-expected fiscal outcome in 2016–17, has resulted in a significant upward revision to the fiscal outlook (Chart 1.17).
In total, economic and fiscal developments since Budget 2017, including the measures announced in this Fall Economic Statement, have resulted in an improvement in the outlook for the budgetary balance of $8.6 billion in 2017–18, $8.8 billion in 2018–19, $6.1 billion in 2019–20 and $4.9 billion in each of the following two years. Correspondingly, recent strength in the economy and the improved fiscal outlook have reduced the debt-to-GDP ratio throughout the forecast horizon.
| | |
| | | ECONOMIC AND FISCAL UPDATE 21 |
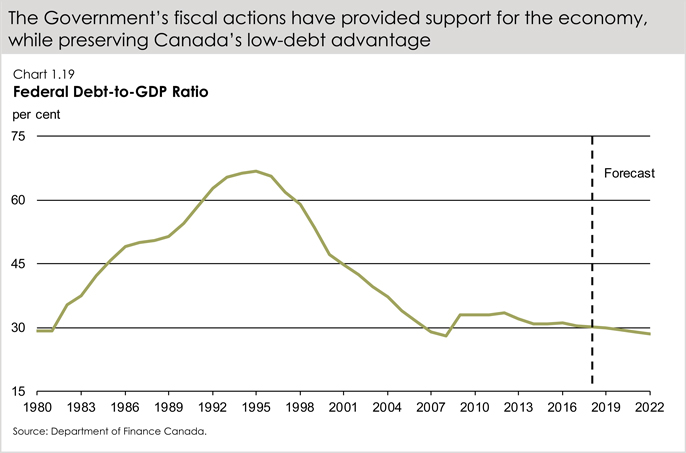
The Government has adopted a responsible approach to fiscal management that is appropriate to the current economic cycle and focused on long-term economic growth and fiscal sustainability.
During the economic weakness of late 2015 and early 2016, the Government made targeted fiscal investments, including tax cuts for the middle class, the Canada Child Benefit and infrastructure investments, that re-established economic momentum in Canada—protecting and creating Canadian jobs and supporting the long-term growth potential of the Canadian economy. These measures put money directly in the pockets of middle class Canadians, empowering them to support local small businesses, pay off their debts and save for the future. In just two years, the Government’s investments have helped to increase consumer confidence and brought hope for the future for millions of Canadian families.
The Government’s fiscal actions provided needed support for the economy—by leveraging the federal balance sheet to support growth at a time when household balance sheets were more leveraged. In this context, monetary and fiscal policies have become more complementary.
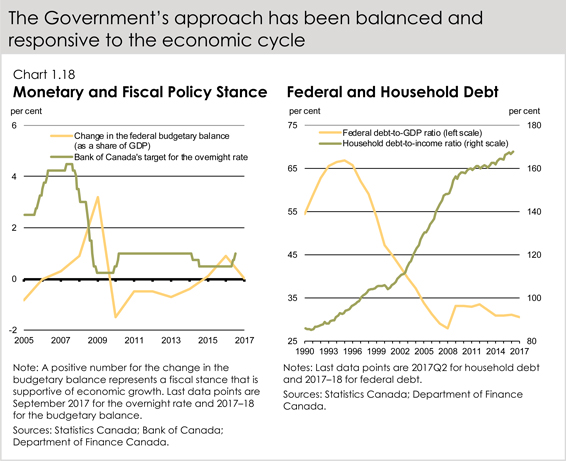
This approach has been effective, and the economy is now outperforming expectations. As the economy strengthens, the Government is adjusting its fiscal strategy to adapt to the better-than-expected economic outlook. The current fiscal track shows steady improvements in the Government’s budgetary position along with a commensurate decline in the federal debt-to-GDP ratio.
The Government will maintain this downward deficit and debt ratio track—preserving Canada’s low-debt advantage for current and future generations. Low debt levels support economic growth and intergenerational equity by keeping interest costs low and preserving flexibility to face future economic shocks and challenges.
| | |
| | | ECONOMIC AND FISCAL UPDATE 23 |
IMPACT OF ALTERNATIVE ECONOMIC SCENARIOS
The fiscal projections presented in this Fall Economic Statement are based on an average of the September 2017 private sector economic outlook survey. However, economists surveyed offered a wide range of views regarding future economic growth and, therefore, the path of nominal GDP (the broadest measure of the tax base). Changes in economic growth assumptions can also have large impacts on the budgetary balance and debt-to-GDP profile over an extended projection horizon.
For example, if the Government based current fiscal projections on the average of the top four individual forecasts for nominal GDP growth—which is equivalent to nominal GDP growth being 0.3 percentage points per year higher, on average, than in the full September survey—the budgetary balance would improve by $3.7 billion per year on average (Chart 1.20). Further, this would result in a federal debt-to-GDP ratio of 26.5 per cent, its lowest level since 1977.
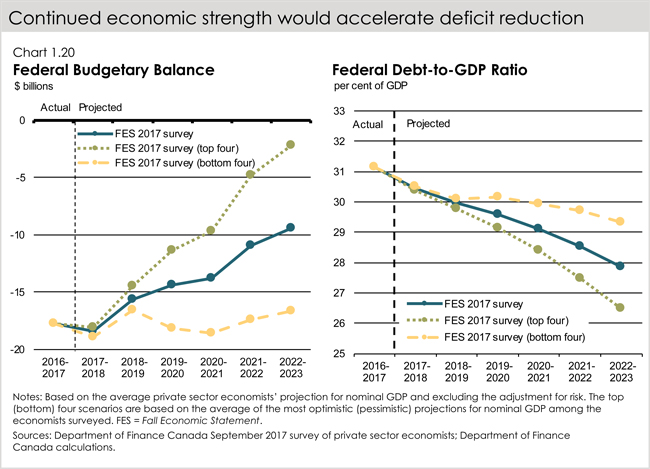
Conversely, basing fiscal projections on the average of the bottom four individual forecasts for nominal GDP growth—which is equivalent to nominal GDP growth being 0.3 percentage points per year lower, on average, than in the full September survey—the budgetary balance would worsen by $3.9 billion per year on average, and the federal debt-to-GDP ratio would still decline, but be 1.5 percentage points of GDP higher in 2022–23.
Chapter 2
RESULTS FOR MIDDLE CLASS CANADIANS
INTRODUCTION
Canadians across the country are seeing the results of investments in people and communities in real and tangible ways. From the over 450,000 jobs created since 2015, to a more secure retirement for millions of seniors and workers, to a reduction in the small business tax rate to 9 per cent, to the nine out of 10 families who have more money in their pockets as a result of the Canada Child Benefit, this chapter highlights important accomplishments made over the last two years—and the progress made on an ambitious plan for the middle class and those working hard to join it.
| | | | | | |
What Success Looks Like in 2017: Some Highlights |
| | | |

| | A stronger economy that benefits all Canadians | | ✓ | | Canada now the fastest growing economy in the G7 |
| | | ✓ | | Over 450,000 jobs created since 2015, and unemployment rate at lowest level since 2008 |
| | | ✓ | | Lowest youth unemployment rate on record at 10.3 per cent |
| | | ✓ | | Labour market participation of working-age women at an all-time high |
Opportunities for the Middle Class |
| | | |

| | A better future for children, and more opportunity and security for middle class women and men | | ✓ | | Nine out of 10 Canadian families are receiving more money with the new Canada Child Benefit |
| | | ✓ | | Employment Insurance benefits have improved to support unemployed and underemployed Canadians and families |
| | | ✓ | | Canada Pension Plan maximum retirement benefit will increase by about 50 per cent for workers today and for the next generation |
| | | ✓ | | Restored the eligibility age for Old Age Security and Guaranteed Income Supplement benefits to 65, putting thousands of dollars back in the pockets of Canadians as they become seniors |
| | | |

| | Stronger support for those who need it most | | ✓ | | Increased Guaranteed Income Supplement payments of up to $947 per year are helping nearly 900,000 low-income seniors, of which 70 per cent are women |
| | | ✓ | | Eligible veterans are now receiving 90 per cent of their pre-release salary and will soon qualify for up to $80,000 in financial support to pursue education and training after release |
| | | |

| | A renewed relationship with Indigenous Peoples | | ✓ | | Over $11 billion in new investments, working towards a new fiscal relationship |
| | | ✓ | | Over 50 new Self Determination Tables have been established to date to advance Indigenous rights, needs and interests |
| | | ✓ | | Since November 2015, 26 long-term drinking water advisories have been lifted |
| | | |

| | A fairer tax system for middle class Canadians | | ✓ | | Lower taxes for middle class Canadians and small business |
| | | ✓ | | A tax system better targeted to promote fairness, investment and growth |
| | | ✓ | | Investments in the Canada Revenue Agency to better enforce the rules so that everyone pays their fair share |
| | |
| | | RESULTS FOR MIDDLE CLASS CANADIANS 25 |
| | | | | | |
An Innovative, Inclusive and Sustainable Economy |

| | A Canada with the
skills to thrive in the global economy of tomorrow | | ✓ | | Up to $1,000 more per year for low- and middle-income post-secondary students through Canada Student Grants |
| | | ✓ | | A bold and inclusive Innovation and Skills Plan that builds on Canada’s strengths |
| | | ✓ | | Historically high levels of immigration and a Global Skills Strategy will ensure that Canada attracts top talent and investment from around the world |

| | Communities built for change | | ✓ | | Long-term infrastructure investments will strengthen communities and support sustainable economic growth by helping move goods and people more easily, and by creating jobs for today and tomorrow |
| | | ✓ | | Pan-Canadian Framework on Clean Growth and Climate Change adopted on December 9, 2016 |
OPPORTUNITIES FOR THE MIDDLE CLASS
The Government’s plan for the middle class is creating jobs, improving lives, strengthening communities and growing the economy.
SUPPORTING CHILDREN AND FAMILIES
In the first year of its mandate, the Government acted on two of its cornerstone commitments:
| • | | Middle class tax cut for 9 million Canadians: Single Canadians who benefit are saving an average of $330 each year, and couples who benefit are saving an average of $540 each year. The Government raised taxes on the wealthiest one per cent in order to give the middle class a break. |
| • | | Canada Child Benefit (CCB): Compared to the previous system of child benefits, the CCB is simpler, more generous and better targeted to those who need it most. During the first benefit year, over 3.3 million families received more than $23 billion in CCB payments, and the nine out of 10 families who are better off under the CCB received on average almost $2,300 more in benefits, tax-free. The CCB has helped lift hundreds of thousands of children out of poverty. |
The net result of these two measures has been more money in the pockets of middle class people and their families, contributing significantly to economic growth, creating jobs and bringing renewed confidence for the future for millions of Canadians.
To further help families, in June 2017, federal-provincial-territorial Ministers Responsible for Early Learning and Child Care announced a new agreement on a Multilateral Early Learning and Child Care Framework to make enhancements to provincial and territorial early learning and child care systems. Governments have committed to increase the quality, accessibility, affordability, flexibility and inclusivity in early learning and child care, with consideration for families that need it most. To implement this initiative, the Government of Canada is providing $7.5 billion over 11 years to support and create more high-quality, affordable child care across the country, and is working with provinces and territories to enter into three-year bilateral agreements that will outline their unique early learning and child care needs and the funding allocation for each jurisdiction.

A distinction-based Indigenous Early Learning and Child Care Framework will be developed between partners that will reflect the unique cultural needs of First Nations, Inuit and Métis children across Canada.
A Stronger, More Inclusive Canada
The Government is taking steps to ensure that all Canadians have a real and fair chance at success, and can benefit from a growing economy. This includes making sure all Canadians can look forward to a secure and dignified retirement, fulfilling Canada’s solemn promise to our veterans and ensuring that the most vulnerable in our society have a safe place to call home.
| • | | Seniors are more financially secure today, as a result of increases to the maximum Guaranteed Income Supplement top-up benefit—more than doubling top-up benefits for our most vulnerable single seniors. |
| | |
| | | RESULTS FOR MIDDLE CLASS CANADIANS 27 |
| | |
How Low-Income Single Seniors Benefit | | Lynn is a 74-year-old resident of Montréal, Quebec, who lives alone. With no income apart from Old Age Security and Guaranteed Income Supplement benefits, she struggles to make ends meet. The increase in the Guaranteed Income Supplement top-up benefit for single seniors introduced in Budget 2016 provides Lynn with an additional $947 per year. |
| |
| | Charles is a 68-year-old widower residing in Edmonton, Alberta. Charles receives annual Canada Pension Plan benefits of $5,000 along with Old Age Security and Guaranteed Income Supplement benefits. The increase in the Guaranteed Income Supplement top-up benefit for single seniors introduced in Budget 2016 provides Charles with an additional annual benefit of $848 per year. |
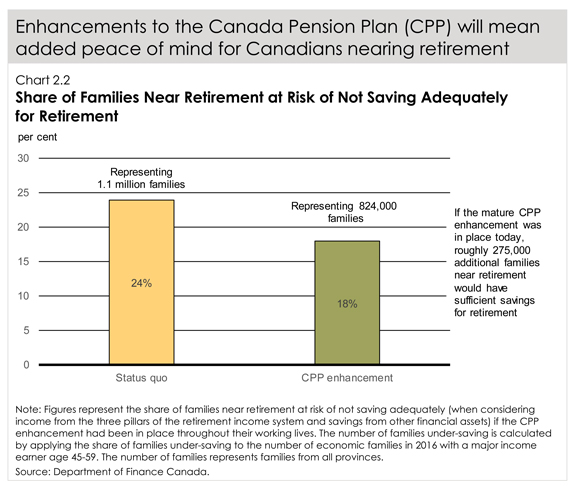
| • | | Future retirees have more peace of mind—as enhancements to the Canada Pension Plan will increase the maximum retirement benefit by about 50 per cent for workers today and for the next generation. |
| • | | Veterans who qualify for disability benefits are now receiving 90 per cent of their pre-release salary as well as more compensation for their pain and suffering. Starting in April 2018, eligible veterans will begin receiving up to $80,000 to go to college, university or a technical school after they complete their service. Further measures will increase financial support for caregivers and expand access to Military Family Resource Centres for the families of veterans living with mental and physical health issues as a result of their service. The total investment in improved veterans’ benefits and services exceeds $6.7 billion over seven years. The Government will continue to work with the veterans’ community to examine the best way to streamline and simplify the system of financial support programs currently offered to veterans. In addition, the Government will be moving forward with its commitment to re-establish lifelong pensions as an option for ill and injured veterans. Details are expected to be announced in advance of Budget 2018. |
|
A New Education Benefit for Veterans |
David is a 32-year-old Canadian Armed Forces member who will be released in the summer of 2018 after 12 years of service in the Regular Force as an ammunition technician. He is planning on going back to school full-time for a three-year college course to become a civil engineering technician. He will receive an education benefit of $20,000 per year for each of those three years. Depending on his family income, David could also be eligible to receive student grants and loans through the Canada Student Loans Program. In addition, David can access employment services such as career counselling and job-search training under the Career Transition Services Program to assist him in re-entering the labour force following the completion of his studies. |
| • | | Low-income Canadians will have improved access to adequate and affordable housing—a cornerstone of sustainable, inclusive communities and a Canadian economy where we can prosper and thrive. The Government is renewing federal leadership in housing with significant new long-term investments. The launch of the National Housing Strategy—a long-term investment of more than $11.2 billion over 11 years—will take place later this fall. One-third of social housing tenants in Canada are seniors. It is expected that the Strategy will have a more pronounced impact on senior women living alone, female-headed lone-parent families, and women with disabilities who currently experience high levels of housing need. |
|
A New Rental Construction Financing Initiative |
In April, the Government announced the launch of the Rental Construction Financing Initiative to help increase the supply of rental housing. Over the next four years, this initiative will offer more than $2.5 billion in low-cost loans to support the construction of new rental housing. These funds will be provided to municipalities, non-profit organizations and housing developers. Low-cost loans will help with the earliest, and most challenging, phases of development, including construction, lease-up and the early stages of property operations. These loans are expected to spur the construction of more than 10,000 new rental housing units across Canada. In exchange for these favourable loans, borrowers will be required to build housing projects that: • are more energy-efficient; • are accessible to Canadians with disabilities; and • have 20 per cent of their units set aside as affordable housing for moderate-income families. |
| | |
| | | RESULTS FOR MIDDLE CLASS CANADIANS 29 |
| • | | Newcomers to Canada will continue to play an important role in supplying Canada’s knowledge economy with innovative, highly skilled and specialized talent, as new permanent and temporary residents are welcomed to Canada to help drive our economic and shared growth. |
|
A Continued Focus on Gender Equality and Inclusiveness |
Since Budget 2017, the Government has continued to pursue policies and investments that support gender equality and inclusiveness. • The new Multilateral Early Learning and Child Care Framework will support access to child care for children of all backgrounds, and allow greater participation in work, education or training, particularly by mothers. • Canada’s new defence policy will promote diversity and inclusion as core institutional values across the Defence team. Gender-based Analysis Plus will be integrated in all Defence activities across the Canadian Armed Forces and the Department of National Defence. A new focus will be placed on recruiting and retaining under-represented populations within the Canadian Armed Forces, including, but not limited to, women, Indigenous Peoples and members of visible minorities, with a target to increase the representation of women to 25 per cent of the overall force. • The new Feminist International Assistance Policy will aim to reduce extreme poverty and build a more peaceful, inclusive and prosperous world—recognizing that promoting gender equality and empowering women and girls is the most effective approach to achieving this goal. • Stronger capacity at Status of Women Canada will support national and international engagement to help advance the Government’s gender equality objectives. The Government continues to work with civil society and international partners to improve how it includes Gender-based Analysis Plus as part of policy development and budget decision-making—and will build on Budget 2017’s Gender Statement to promote greater gender equality and inclusiveness as part of Budget 2018. |
A Renewed Relationship With Indigenous Peoples
The Government is taking concrete steps to achieve reconciliation with First Nations, Inuit and the Métis Nation. To support the renewal of the relationship, the Government announced the creation of two new departments: a Department of Crown-Indigenous Relations and Northern Affairs, and a Department of Indigenous Services. These changes mark an important shift away from historic colonial structures. The Government is also working with First Nations, Inuit and Métis to co-develop policy proposals that respond to their priorities. While significant work remains, progress is being made:
| • | | Budgets 2016 and 2017 invested $11.8 billion to improve quality of life and economic opportunities for Indigenous Peoples. |
| • | | The Canada-Métis Nation Accord was signed by the Prime Minister and the leaders of the Métis Nation. The Accord identifies a wide range of areas for collaboration including education, poverty, housing, health, and fiscal funding mechanisms. |
| • | | The Inuit-Crown Partnership Committee has developed a joint work plan to advance the socio-economic, cultural, and conditions of success for Inuit. |
| • | | The implementation of the United Nations Declaration on the Rights of Indigenous Peoples requires transformative change in the Government’s relationship with Indigenous Peoples. To this end, the Government has released 10 Principles that will guide the renewal of the relationship including through the ongoing work of the Working Group of Ministers on the Review of Laws and Policies Related to Indigenous Peoples. |
| • | | On August 16, 2017, the Government of Canada and 23 Anishinabek Nation First Nations signed an historic self-government agreement on education. Under the agreement, participating First Nations will create the Anishinabek Education System—an education system by Anishinabek First Nations for Anishinabek students. The Manitoba First Nations School System, the result of an Education Governance Agreement between the Government of Canada and the Manitoba First Nations Education Resource Centre, assumed responsibility in July 2017 for administering and managing elementary and secondary education programs and services for 10 participating First Nations. Strong, culturally rooted First Nations-led education will strengthen communities and open opportunities for First Nations students. |
| • | | In August 2017, the Government announced an investment of up to $60.2 million for Wataynikaneyap Power to construct a 117-kilometre power line from Red Lake, Ontario, into the local distribution systems at Pikangikum First Nation. The project will provide clean energy while making an important contribution to the health and safety of community members and boosting the First Nation’s economic development opportunities. |
| • | | Progress continues to be made in addressing long-term drinking water advisories. Since Budget 2016, $733.2 million has been provided to support 348 water and wastewater projects in 275 communities serving approximately 275,000 people. Since November 2015, 26 long-term drinking water advisories have been lifted. |
Combatting International Tax Evasion and Avoidance
To keep taxes low and ensure everyone pays their fair share, the Government of Canada is actively engaged with international partners to ensure that Canada’s tax system is functioning as intended and contributing to the objective of an economy that works for the middle class.
Canada has worked together with the other members of the Group of 20 (G20) and the Organisation for Economic Co-operation and Development (OECD) to develop recommendations that will address base erosion and profit shifting (BEPS). BEPS refers to international tax planning arrangements used by multinational enterprises to unfairly minimize their taxes. For example, some enterprises will shift their taxable profits away from the jurisdiction where the underlying economic activity has taken place in order to avoid paying their fair share.
| | |
| | | RESULTS FOR MIDDLE CLASS CANADIANS 31 |
|
Canada’s Progress—Base Erosion and Profit Shifting
(BEPS) Initiative |
| |
The Government remains firmly committed to protecting Canada’s tax system, and has implemented—or is in the process of implementing—the measures agreed to as minimum standards under the BEPS project: • Legislation was enacted in December 2016 that requires large multinational enterprises to file country-by-country reports. This information will give tax authorities in each country a clearer picture of where the operations of the group in their particular jurisdiction fit into the group’s global operations and assist in high-level risk assessments. • Canada participated in the development of a multilateral instrument to streamline the implementation of tax treaty-related BEPS recommendations. On June 7, 2017, Canada, along with 67 other countries, signed the multilateral instrument. The Government is now undertaking the necessary domestic processes for ratification. • Canada has committed to the effective and timely resolution of tax treaty-related disputes by improving the mutual agreement procedure in Canada’s tax treaties. • The Canada Revenue Agency (CRA) has begun the spontaneous exchange with other tax administrations of tax rulings. With respect to other BEPS recommendations: • Canada has robust “controlled foreign corporation” rules in the form of our foreign accrual property income regime, which helps prevent taxpayers from avoiding Canadian income tax by shifting income into foreign subsidiaries. • Canada has implemented requirements for the disclosure of specified tax avoidance transactions to the CRA. • The CRA is applying revised international guidance on transfer pricing by multinational enterprises. The Government will continue to work with its international partners to ensure a coherent and consistent response to fight tax avoidance through BEPS. The Government is also strengthening its efforts to combat international tax evasion through enhanced sharing of information between tax authorities. The automatic exchange of information with respect to financial accounts held by non-residents—under the framework of the Common Reporting Standard developed by the OECD—is an important tool to promote compliance, combat international tax evasion, and ensure that taxpayers are reporting their income from all sources. To date, more than 100 jurisdictions have committed to implement the new standard. |
Strengthening Corporate and Beneficial Ownership Transparency
The Government of Canada is committed to implementing strong standards for corporate and beneficial ownership transparency that provide safeguards against money laundering, terrorist financing, tax evasion and tax avoidance, while continuing to facilitate the ease of doing business in Canada. Understanding the ownership and control of corporations is vital for good corporate governance and to protect the integrity of the tax and financial systems.
As announced in Budget 2017, the Government is working with the provinces and territories to strengthen the transparency of legal persons and arrangements in order to address blind spots in the availability of beneficial ownership information.
The Government also announced in Budget 2017 that it will examine ways to enhance the tax reporting requirements for trusts in order to improve the collection of beneficial ownership information.
These actions will ensure that law enforcement and other authorities have timely access to the information needed to crack down on money laundering, terrorist financing and tax evasion and to combat aggressive tax avoidance.
AN INNOVATIVE, INCLUSIVE AND SUSTAINABLE ECONOMY
Recognizing the unique opportunities and challenges that a rapidly changing economy presents, the Government took definitive steps to foster innovation, equip Canadians with the skills they need to succeed, and introduce transformational investments in infrastructure.
SKILLS FOR THE NEW ECONOMY
The Government is making targeted investments to expand access to the education, work experiences and employment supports that Canadians need to get high-quality, well-paying jobs. Combining work experience with education ensures that recent graduates have the skills and knowledge employers need. Youth will be better-prepared as they enter the workforce and all workers will have the skills and supports to advance their career throughout their working lives.
Today, these investments are already translating into greater opportunities for students and workers.
Table 2.1
Measurable Impacts to Date
| | |
Post-Secondary Students |
| |
| Expanded student financial assistance for those from low-and middle-income families | | • 347,000 more students from low- and middle-income families and 16,000 more part-time students receive financial assistance each year |
| | • More students will be eligible for grants from expanded income thresholds starting in September 2017 |
| More work-ready students supported through work- integrated learning | | • 10,000 new placements over four years for post-secondary students in business and in science, technology, engineering and mathematics through the Student Work-Integrated Learning Program |
| | • Increasing the annual number of research internships offered by Mitacs from 3,750 to 10,000 over the next five years, providing more job-relevant experiences for students and helping businesses become more innovative |
Youth | | |
| |
| Created more jobs to support youth entering the labour force, through the Youth Employment Strategy | | • 65,800 Canada Summer Jobs, effectively doubling the program in 2016 |
| | • New green jobs are helping young Canadians learn about our natural environment and contribute to economic growth |
| | • Additional heritage sector jobs supported the lead-up to Canada’s 150th anniversary |
| | • Lowest youth unemployment rate on record, at 10.3 per cent |
Unemployed or Underemployed Canadians |
| |
Improved labour market attachment for new entrants and re-entrants to the labour force | | • More than 50,000 additional new entrants and re-entrants now have access to Employment Insurance regular benefits |
| | |
| | | RESULTS FOR MIDDLE CLASS CANADIANS 33 |
In addition, Labour Market Transfer Agreements are being reformed and consolidated in partnership with provincial and territorial governments. Employment and training programs currently supported by nearly $3 billion in annual federal investments will become more flexible, more client-focused and driven by results and innovation.
The Government is also boosting student financial assistance for low- and middle-income adult learners by providing additional funding through Canada Student Grants, and is currently working with provinces and territories to make Canada Students Grants more accessible to adult learners.
Additional investments of $2.7 billion over six years were announced in Budget 2017 and the Employment Insurance Act has been amended to expand eligibility for the Agreements funded through the Employment Insurance program as of April 1, 2018.
Table 2.2
Eligibility for Programs Under Part II of the Employment Insurance Act
| | | | |
| | | Current Labour Market Development
Agreements | | Expanded Labour Market Development
Agreements |
| | |
| Employment benefits (e.g., skills development, wage subsidies) | | Individuals currently receiving or having received Employment Insurance benefits in the past five years | | Expanded to include unemployed individuals who have made minimum Employment Insurance premium contributions above the premium refund threshold (i.e. $2,000) in at least five of the last 10 years |
| | |
| Employment assistance services under support measures (e.g., employment counselling, job search assistance) | | Unemployed Canadians | | Expanded to include employed Canadians |
| | |
| Employer-sponsored training under support measures (Labour Market Partnerships) | | Assistance to employers to support approved training activities for employees facing a loss of employment | | Expanded to include assistance to employers to support approved training activities for employees in order to maintain their employment. This may include employees impacted by technological or structural changes in the economy |
Note: Amendments to the Employment Insurance Act included in Budget Implementation Act, 2017, No. 1.
A More Skilled and Innovative Canada
The Government’s Innovation and Skills Plan is helping Canada realize its potential as a global leader in innovation. Since Budget 2017, the Government has taken steps to advance the Plan’s key measures:
| • | | Innovation Superclusters Initiative: Clusters are dense areas of business activity that bring together a critical mass of large and small companies and post-secondary and other research institutions. Superclusters build on the advantages of clusters, and comparatively these innovation hotbeds have stronger connections, a long-term competitive advantage, global brand recognition, and an outsized positive impact on jobs and growth. Launched in May 2017, this initiative will provide up to $950 million over five years in support of up to five business-led superclusters, on a competitive basis. The Government announced in October 2017 a shortlist of nine applicants invited to submit detailed supercluster proposals by November 24, 2017. These geographically diverse proposals focus on the highly innovative industries identified in Budget 2017, namely advanced manufacturing, agri-food, clean technology, digital technology, health/bio-sciences and clean resources, as well as infrastructure and transportation. It is expected that successful proposals will be announced by early 2018. |
| • | | Strategic Innovation Fund (SIF): Launched in July 2017, this new five-year $1.26 billion fund will attract and support high-quality business investments across all sectors of the economy. SIF projects are currently being assessed with the first announcements to occur imminently. |
| • | | Pan Canadian Artificial Intelligence Strategy: Artificial intelligence (AI) helps create and put to use knowledge that can improve the lives of Canadians through advances such as facilitating medical diagnosis and allowing farmers to maximize crop yields through precision farming. Announced in March 2017, the Government is providing $125 million over five years for an ambitious AI strategy to retain and attract top academic talent and to position Canada as a world-leading destination for companies seeking to invest in AI and innovation. Delivered through the Canadian Institute for Advanced Research (CIFAR), the strategy includes the launch of the Vector Institute, a new independent AI research facility affiliated with the University of Toronto. CIFAR will work with the Vector Institute to support its core activities, including the Canada CIFAR Chairs in AI Science, graduate training, and the participation of the Chairs and trainees in national AI activities. |
Clean Growth and Climate Change
The Pan-Canadian Framework on Clean Growth and Climate Change was adopted by First Ministers on December 9, 2016 to grow Canada’s economy while reducing emissions and building resilience to adapt to a changing climate. The Government has made significant progress in implementing the Framework:
| • | | Clean Technology Financing: The Government is moving ahead to implement the Budget 2017 commitment to make available nearly $1.4 billion in new financing to accelerate the growth of promising clean technology firms, positioning Canada as a leader in the global clean economy. New equity financing, working capital and project financing are being made available through the Business Development Bank of Canada and Export Development Canada, further expanding their business growth and export financing support to Canadian clean technology companies and building on their client-centric collaboration in the sector. Further details will be available later this fall. |
| • | | Oceans Protection Plan: In November 2016, the Government announced $1.5 billion for the Oceans Protection Plan—the most significant investment ever made to protect our oceans and coastlines while growing our economy. Since then, the Government has made progress on a series of measures that will protect the marine environment and coastal communities, such as supporting safer and more efficient Arctic resupply operations, and expanding the Community Participation Funding Program to help Indigenous and local communities take part in improving Canada’s marine transportation system. |
| • | | Low Carbon Economy Fund: In June 2017, the Government announced that this $2 billion fund will be divided into two parts. The Low Carbon Economy Leadership Fund will provide $1.4 billion to provinces and territories that have adopted the Pan-Canadian Framework to help them deliver on their commitments to reduce greenhouse gas emissions, including those that they identified in the Framework. The remainder will be allocated to the Low Carbon Economy Challenge to support projects and to implement the Pan-Canadian Framework. Following the review of proposals by the Government, funding agreements will be finalized and signed with provinces and territories in the coming months. The Low Carbon Economy Challenge is expected to be launched in the coming months to support ambitious projects that can be submitted by all provinces and territories, as well as municipalities, Indigenous governments and organizations, businesses and both not-for-profit and for-profit organizations. |
| • | | Carbon Pricing Backstop: On May 18, 2017, the Government released a technical paper on the proposed federal carbon pricing backstop for comment. The proposed backstop is comprised of a carbon levy on fossil fuels and an output-based pricing system for certain industrial facilities, and will apply in provinces and territories that do not implement their own carbon pricing systems that meet the federal benchmark. The Government is considering comments received as it develops legislation to implement the federal backstop. |
| | |
| | | RESULTS FOR MIDDLE CLASS CANADIANS 35 |
Infrastructure Investments for Communities
Investing in Canada, the Government’s plan to renew Canada’s infrastructure for a generation (over $180 billion over 12 years), has already achieved important results—investing in projects that matter to communities, and that will create jobs and keep Canada’s economy growing now and in the future. The results speak for themselves:
| • | | Ottawa Light Rail Stage 2 Project will become a reality: When construction of this project is completed in 2023, 70 per cent of Ottawa residents will live within five kilometres of light rail transit, helping mom and dad get home faster at the end of a long day. Along with support from the Province of Ontario and the City of Ottawa’s participation in the project, federal investments of $1.09 billion are helping build close to 40 kilometres of track and 23 new transit stations. |
| • | | New and improved YMCA community and recreation centre for Halifax: Serving as both a recreation facility and a community centre, the new building will include an aquatic centre, a gymnasium and indoor track, child care facilities, and a community resource centre for leadership, child and family development. The Government of Canada and the Government of Nova Scotia announced $10 million in joint federal-provincial funding for the construction of this YMCA facility in the Greater Halifax/Dartmouth region. |
| • | | Communities across Nunavut will benefit from faster Internet: Canadians in all 25 Nunavut communities will be able to do business online and participate in distance education because of investments in high-speed Internet. A nearly $50 million federal contribution through the Connect to Innovate program will improve high-speed coverage from Kugluktuk to Pangnirtung in Nunavut. As a result, all Nunavut communities will have access to Internet download speeds of 5 to 15 megabits per second. |
| • | | Brandon Airport Passenger Terminal Redevelopment Project: Thanks to funding from the Government of Canada, the Government of Manitoba and the City of Brandon, the passenger terminal at Brandon Municipal Airport was recently renovated and expanded to three times its former size. This redevelopment project will make travel more comfortable for passengers, allow airport services to be expanded in the future, and provide upgrades to support airport operations, including the installation of a fiber optic cable for fast and reliable broadband connectivity. |
| • | | Support for Montréal’s Réseau électrique métropolitain (REM): Investing in Canada will provide $1.283 billion to support the REM light rail network, subject to necessary due diligence. For the metropolitan area of Montréal, REM will be the largest public transportation project since the completion of the Montréal metro inaugurated in 1966, and one of the most ambitious public transit projects in the nation’s history. |
| • | | Improved service for the Expo, Millennium and Canada Lines: The Government is contributing $149 million through the Public Transit Infrastructure Fund announced in Budget 2016 for the purchase of new SkyTrain vehicles for the Expo, Millennium and Canada Lines. These new vehicles will help reduce wait times and crowding and improve overall customer experience for commuters in the Metro Vancouver area. |
The Government is working with its partners to deploy the initiatives announced in Budget 2017, including the launch of the Canada Infrastructure Bank, the Smart Cities Challenge, and bilateral agreements with provinces and territories. Budget 2017 investments include $25.3 billion for public transit, $21.9 billion for green infrastructure, $21.9 billion for social infrastructure, $10.1 billion for trade and transportation, and $2 billion dedicated to rural and northern communities.
| | | | | | |
| | Launch of the Canada Infrastructure Bank | | |
| | The Government is establishing the Canada Infrastructure Bank (CIB), an arm’s-length organization that will work with provincial, territorial, municipal, Indigenous and private sector investment partners to transform the way infrastructure is planned, funded and delivered in Canada. The CIB will be responsible for investing at least $35 billion in revenue-generating infrastructure projects that are in the public interest, and attracting private sector capital to those projects so that more infrastructure can be built across Canada. | | | | |
| | The implementation of the CIB is advancing on track. The Canada Infrastructure Bank Act is now in place. Earlier this year, the Government announced the appointment of the inaugural Chairperson, Janice Fukakusa, a highly qualified leader with extensive experience in finance and banking. The search process for the CIB’s board directors and its Chief Executive Officer is also well-advanced. The CIB’s headquarters are being established in Toronto, to take advantage of its status as a global financial hub with a vast network and critical mass of financial, legal and construction firms. | | | | |
| | By the end of this year, the CIB will begin work with its partners to bring new investment and transformative new ideas to Canada’s infrastructure landscape. | | | | |
| | |
| | | RESULTS FOR MIDDLE CLASS CANADIANS 37 |
Chapter 3
FAIRNESS FOR THE MIDDLE CLASS AND THOSE WORKING HARD TO JOIN IT
INTRODUCTION
When the economy works for the middle class and those working hard to join it, it works for everyone.
Canadians work hard and should be rewarded for that work with greater opportunities for themselves, and for their families. This sense of optimism is essential to growing our economy. Over the last several decades, however, the benefits of economic growth have not been evenly shared. Over the past 30 years, the median real wage income has barely risen, leaving many Canadians concerned for their future. In contrast, among the wealthiest 0.01 per cent of Canadians, after-tax after-transfer incomes have risen dramatically. Individuals earning more than $1.8 million per year have, on average, seen their incomes rise by nearly 156 per cent in that time (or 3.1 per cent per year on average) after inflation.
The Government of Canada is committed to an economy that works for the middle class. As the economy grows, we will ensure every Canadian pays their fair share, so that the benefits of that growth can be shared by more than just a wealthy few.
In December 2015, the Government raised taxes on the wealthiest one per cent, in order to cut taxes for the middle class, benefitting 9 million Canadians. In its first budget, the Government replaced the previous child benefit system with the Canada Child Benefit, which is simpler, more generous, and better targeted to those who need it most.
The Government also took strong steps to detect, audit and combat tax evasion and aggressive tax avoidance, both at home and around the world, by boosting funding to the Canada Revenue Agency (CRA). These measures are beginning to bear fruit, with the CRA on track to recover over $5 billion in additional federal revenues over six years.
In the Fall Economic Statement, the Government is confirming that it is moving forward on proposals to fix a tax system that encourages the wealthy to incorporate, so they can get a better tax rate.
Fixing unfairness in the tax system not only fulfills our fundamental promise to middle class Canadians, it is at the heart of our plan for long-term, sustainable economic growth. As we continue with this plan, including making smart, necessary investments in our people, our communities and our economy, we will make sure that the success we create together is shared, by reinvesting in Canada’s middle class, in those working hard to join it, and in programs and services that all Canadians benefit from.
| | |
| | | FAIRNESS FOR THE MIDDLE CLASS AND THOSE WORKING HARD TO JOIN IT 39 |
NEW MEASURES: STRENGTHENING SUPPORT FOR
CANADIAN FAMILIES AND WORKERS
In line with its commitment to strengthen the middle class, the Government is announcing measures in this Fall Economic Statement to further support Canadian families and workers. These investments will help to ensure the real value of benefits for families with children is maintained over time, and improve income security and quality of life for low-income working Canadians.
STRENGTHENING THE CANADA CHILD BENEFIT
In Budget 2016, the Government introduced one of the most important and innovative social policy measures in a generation. That budget replaced the previous child benefit system with the new Canada Child Benefit (CCB)—a simpler, more generous, better targeted benefit that is entirely tax-free. During the first benefit year, over 3.3 million families received more than $23 billion in CCB payments, and the nine out of 10 families better off under the CCB received on average almost $2,300 more in benefits, tax-free. The CCB has helped lift about 300,000 children out of poverty and, by the end of this year, child poverty will have been reduced by 40 per cent from what it was in 2013.
The CCB provides greater support to those who need it most: low- and middle-income families. It puts more money in their pockets for soccer cleats, or summer camps, or to put healthy food on the table. The CCB is particularly beneficial for families led by single parents. These families are most often led by single mothers and tend to have lower total incomes, and thus benefit more from a better-targeted CCB. About 65 per cent of families receiving the maximum CCB amounts are single parents, 90 per cent of whom are single mothers.
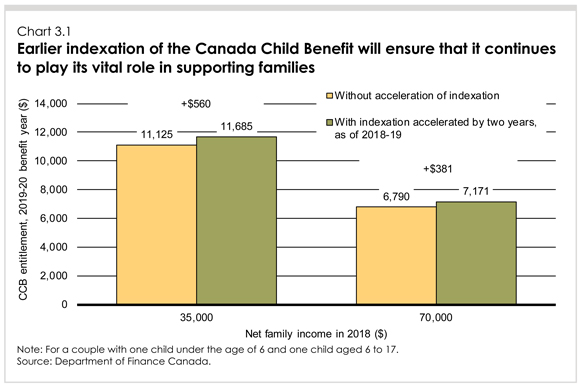
In the fall of 2016, the Government took further action to support Canadian families over the long term by announcing that, as of the 2020–21 benefit year, the CCB would be indexed to ensure it keeps pace with the rising cost of living.
A year later, Canada’s economy is growing faster than expected, thanks in part to the positive effects the CCB has had in improving consumer confidence and consumption. With this increased flexibility, and to ensure benefits of our strong growth are shared with the middle class and those working hard to join it, the Government proposes to accelerate the indexation of the CCB’s benefit amounts and phase-out thresholds by two years to July 2018.
This means better support sooner to ensure that the CCB continues to play a vital role in helping Canadian families and our economy.
Indexing the CCB sooner will provide an additional $5.6 billion in support to Canadian families over the 2018–19 to 2022–23 period.
| | | | | | |
| | Impact of Indexing the Canada Child Benefit Sooner | | |
| | For the 2019–20 benefit year, for a single parent with $35,000 of income and two children (one under the age of 6 and one aged 6 to 17), the accelerated indexation of the CCB will contribute $560 towards the increasing costs of raising their children. | | | | |
INCREASING THE WORKING INCOME TAX BENEFIT FOR THOSE
WORKING TO JOIN THE MIDDLE CLASS
Those working hard to join the middle class, including many low-income working Canadians, face financial barriers to joining or re-joining the workforce, including taxes, expenses, and the loss of supports such as social assistance. First proposed in 2005, the Working Income Tax Benefit (WITB) is a refundable tax credit that provides important income support and helps offset these barriers by supplementing the earnings of low-income workers (by up to $1,043 for single individuals without children and $1,894 for families under the federal design in 2017).
The WITB lets low-income workers keep more of their paycheque, encouraging people into the workforce, which has a long-term impact on income security and quality of life. In 2016, the WITB provided more than $1.1 billion in benefits to over 1.4 million Canadians.
To provide even more support and opportunity for those working to join the middle class, the Government proposes to further enhance the WITB by an additional $500 million annually, starting in 2019. This new enhancement will provide even greater support to current recipients by raising maximum benefit levels and will expand the income range of the WITB so that more workers can qualify.
Together with the increase of about $250 million annually already set to come into effect in 2019 as part of the enhancement of the Canada Pension Plan, these two actions will boost the total amount the Government spends on the WITB by about 65 per cent in 2019.
The Government will provide further details on the design of this new incremental enhancement in Budget 2018.
| | |
| | | FAIRNESS FOR THE MIDDLE CLASS AND THOSE WORKING HARD TO JOIN IT 41 |
In recognition of the important role played by provinces and territories in providing basic income support, the Government of Canada has allowed them to make province-specific changes to the design of the Benefit to better harmonize with their own programs. As such, the Government of Canada will be consulting with provinces and territories before the enhanced WITB takes effect in 2019.
| | | | | | |
| | Increased WITB as Part of the Canada Pension Plan Enhancement | | |
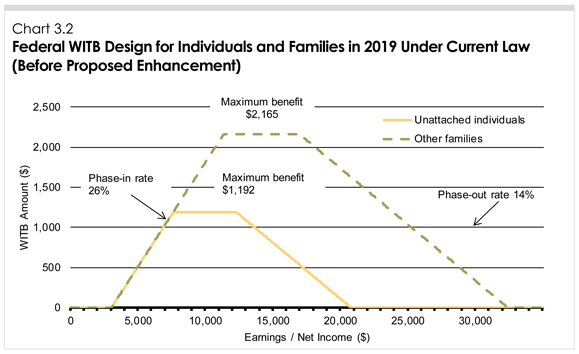
| | As part of the agreement to enhance the Canada Pension Plan, the Government increased benefits under the WITB, beginning in 2019, to roughly offset incremental employee contributions to the Plan. Under that enhancement, as of 2019, the WITB will provide a refundable tax credit of 26 per cent of each dollar of earned income in excess of $3,000, reaching a maximum benefit of $2,165 or $1,192 for families and individuals respectively. The benefit is reduced at a rate of 14 per cent of each additional dollar above the phase-out threshold (projected to be $16,925 and $12,256 for families and individuals respectively in 2019 after indexation with inflation). | | | | |
| | Individuals who are eligible for the Disability Tax Credit may also receive a WITB disability supplement, with a projected value of up to $540 in 2019. | | | | |
| | Chart 3.2 illustrates the maximum benefit, and phase-in and phase-out ranges for the WITB basic benefit for unattached individuals and other families in 2019 taking into account the enhancement associated with the CPP agreement. | | | | |
LOWERING TAXES FOR SMALL BUSINESS
Lower tax rates for small businesses allow them to keep more of their hard-earned money so that it can be reinvested to support growth and create jobs.
The Government’s commitment—to both reduce the small business tax rate and address tax planning advantages for high-income earners—is a commitment to invest in our economy while ensuring fairness for all taxpayers.
By fixing a system that encourages wealthy individuals to use private corporations as a tool to gain an unfair tax advantage over the middle class, the Government will ensure that Canada’s low corporate tax rates—including the lowest small business tax rate in the G7—are better focused on investments in the businesses themselves, in things like machinery, equipment, and job creation, rather than being used as a means to gain unfair tax advantages.
Having announced the next steps in its plan to provide fairness for the middle class by limiting tax advantages for the wealthy, the Government can now confidently propose to reduce the small business tax rate to 9 per cent from 11 per cent in 2015 over the next 14 months (10 per cent, effective January 1, 2018, and 9 per cent, effective January 1, 2019).3 The small business tax rate applies to the first $500,000 of active business income.
For the average small business this will leave an additional $1,600 per year for entrepreneurs and innovators to reinvest in their business, and create jobs.
With these reductions, Canada’s combined small business tax rate will decline from 14.4 per cent in 2017 to 12.9 per cent in 2019 (weighted-average federal-provincial-territorial) (Chart 3.3).
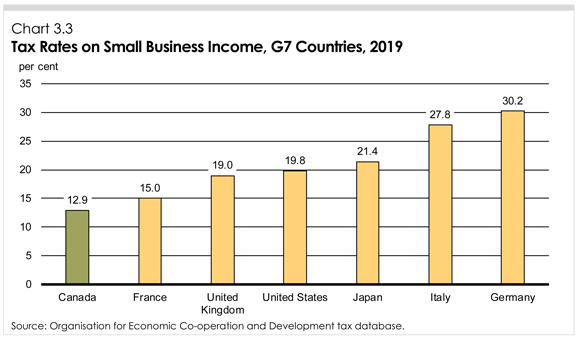
In addition to creating a beneficial tax environment for small businesses, the Government is advancing a number of initiatives that provide direct support for businesses. Budget 2017 announced that $400 million in new financing would be made available through the new Venture Capital Catalyst Initiative to increase the amount of venture capital available to firms and that nearly $1.4 billion in new financing would be made available through the Business Development Bank of Canada and Export Development Canada to help Canada’s clean technology businesses grow and expand. In addition, Budget 2017 invested over $950 million in support of a small number of business-led innovation “superclusters”, making it easier for innovators and potential customers to work closely together on research, development and demonstration activities to boost productivity, create jobs and drive economic growth.
| 3 | The taxation of non-eligible dividends will be adjusted to reflect the lower small business tax rate in order to maintain integration of corporate and personal taxes. |
| | |
| | | FAIRNESS FOR THE MIDDLE CLASS AND THOSE WORKING HARD TO JOIN IT 43 |
A SYSTEM THAT WORKS FOR THE MIDDLE CLASS
OUR COMMITMENT TO CANADIANS
| | |
| | “As we reduce the small business tax rate to 9 percent we will ensure that Canadian- Controlled Private Corporation (CCPC) status is not used to reduce personal income tax obligations for high-income earners rather than supporting small businesses.” |
The current tax system encourages wealthy individuals to incorporate in order to pay less tax. This means someone making $300,000, in some circumstances, can save about as much on tax as the average Canadian earns in a year—$48,000. That’s not fair, and we are going to fix it. The Government is making changes to address tax advantages that disproportionately benefit the wealthiest Canadians, so that taxes can be cut for the benefit of the middle class.
In its review of tax planning by private corporations, the Government identified significant recent growth in the number of CCPCs, and growth in their share of taxable active business income.
| • | Over the 2001 to 2015 period, the number of CCPCs has grown by 8.7 per cent per year, far surpassing a rate expected by economic growth. The number of active CCPCs has increased substantially, from 1.2 million in 2001 to 1.8 million in 2014. |
| • | CCPC taxable active income as a share of gross domestic product (GDP) doubled from 2002 to 2014 (Chart 3.4). Meanwhile, the share of non-incorporated self-employment income declined and there has been little change in the share of income from public corporations and private corporations other than CCPCs. |
The Government estimates that, in 2015, approximately $300 billion in passive investment assets were held by just 2 per cent of CCPCs.4 These assets, held by about 29,000 corporations, generated over $16 billion in passive investment income that year.
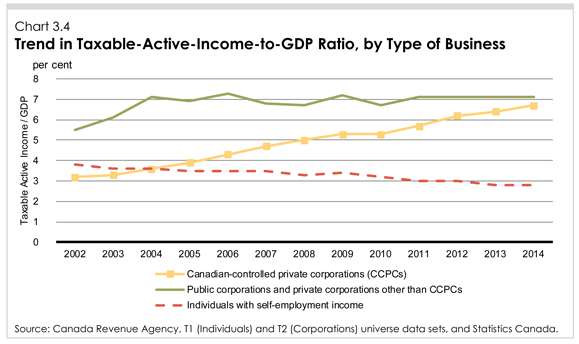
| 4 | No data is available on the value of passive assets held in private corporations. The $300 billion estimate is imputed from passive income reported by CCPCs for tax purposes, using a hypothetical rate of return of 5 per cent. The amounts include capital gains, portfolio dividends and other investment income, such as interest. |
|
A Need for Action Low tax rates designed to encourage investment have increased the rewards associated with tax planning in a private corporation, and have been partly used to opt out of higher personal income tax rates. • The move towards more competitive corporate income tax rates since 2000 has widened the gap with top personal income tax rates from about 26 percentage points in 2000 to over 37 percentage points today (Chart 3.5). The shift towards incorporation is gradually eroding Canada’s tax base and is expected to continue, particularly as the services sector is expected to account for more of our economy in future years. • The services sector now accounts for 71 per cent of GDP and 79 per cent of employment; in 2000 services accounted for 64 per cent of GDP. • A shift to incorporation has been especially acute in services industries (e.g., financial services), and particularly so among professional services (e.g., lawyers, accountants and physicians)—the annual growth in the number of professional corporations has been 14.9 per cent from 2001 to 2015. Chart 3.5 Federal-Provincial-Territorial Tax Rates 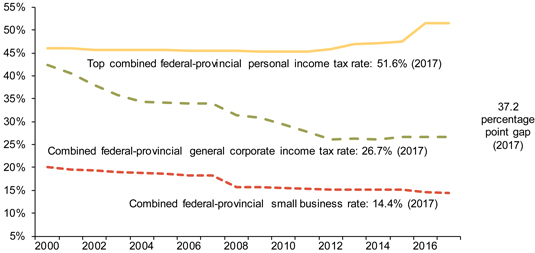
Action is needed to ensure that the tax rules apply in a fair manner and in a way that is consistent with their intent. If current trends continue, the significant growth in the use of CCPCs by high-income individuals will continue to weaken the tax base, increasing the tax burden on those who cannot benefit from incorporation. |
| | |
| | | FAIRNESS FOR THE MIDDLE CLASS AND THOSE WORKING HARD TO JOIN IT 45 |
As shown in Table 3.1, total taxable passive income is rapidly growing—at an average annual pace of almost 17 per cent over the 2010 to 2015 period. Annual growth in the number of new CCPCs over that period was 8.4 per cent.
Table 3.1
Annual Average Growth in the Number of CCPCs and Taxable Passive Income by Industrial
Sector—2001–2015
| | | | | | | | |
| | | 2010–2015 Period | | 2001–2015 Period |
| | | Growth in Number
of Corporations | | Growth in Total Taxable Passive
Income | | Growth in Number of Corporations | | Growth in Total Taxable Passive
Income |
Finance and insurance | | 7.4% | | 16.3% | | 8.6% | | 8.9% |
Real estate, rental and leasing | | 8.3% | | 16.4% | | 10.4% | | 15.8% |
Management of companies and enterprises | | 7.0% | | 15.8% | | 8.5% | | 8.6% |
Professionals1 | | 13.6% | | 28.9% | | 14.9% | | 19.5% |
Wholesale and retail trade | | 6.1% | | 21.7% | | 5.1% | | 7.0% |
Agriculture, forestry, fishing and hunting | | 7.5% | | 15.6% | | 6.9% | | 12.5% |
Construction | | 6.9% | | 16.4% | | 7.6% | | 13.0% |
Other | | 8.4% | | 16.1% | | 7.7% | | 9.8% |
| | | | |
All Sectors | | 8.4% | | 16.8% | | 8.7% | | 10.5% |
1 Professionals refer to lawyers, notaries, accountants, veterinarians, physicians, dentists and chiropractors.
Source: Canada Revenue Agency, T2 (Corporations) universe data set.
|
| Actions in This Fall Economic Statement |
In the 2017 Fall Economic Statement, the Government proposes to strengthen small business competitiveness in Canada by: • Fulfilling its commitment to reduce the federal small business tax rate to 9 per cent. The rate will be reduced to 10 per cent effective January 1, 2018, and to 9 per cent effective January 1, 2019. In addition, in keeping with its commitment to address unfair tax advantages for the wealthiest, the Government proposes to: • Move forward on restricting income sprinkling by private corporations, effective for the 2018 and subsequent taxation years, and to simplify the proposed measures and to provide greater certainty with respect to their application. Revised draft legislative proposals will be released later this fall. • Move forward to limit the benefit of investing passively in private corporations. The details of the proposed rules will be released in Budget 2018, and will include an annual threshold of $50,000 of passive income for future, go-forward investments (equivalent to $1 million in savings based on a nominal 5-per-cent rate of return). There will be no tax increase on passive income below this threshold. In light of feedback received from Canadians during recent consultations: • The Government will not move forward with the proposed measures that would limit access to the Lifetime Capital Gains Exemption (LCGE). • The Government will not move forward with the proposed measures relating to the conversion of income into capital gains. The Government commits to apply future revenues from these proposed measures to further measures to support the middle class. As announced on May 5, 2017, the Government also intends to bring forward legislative proposals to ensure that farmers and fishers are not inappropriately denied the small business deduction on income from sales to a cooperative. |
In Budget 2017, the Government announced that its review of federal tax expenditures highlighted a number of tax planning strategies using private corporations, which can result in high-income individuals gaining unfair tax advantages over the middle class. In July 2017, the Government launched consultations to hear from Canadians, including small business owners, farmers, fishers and experts, on proposals to limit these tax planning strategies. In the course of this consultation, many Canadians indicated their support for these proposals but also raised significant concerns and areas where improvements were required.
The Government has listened and is committed to addressing unintended consequences. The Government’s focus is on strengthening Canada’s hard-working, middle class small businesses, their growth and their job creation, while targeting unfair advantages that largely benefit the wealthiest of Canadians.
As it further develops these measures, the Government will follow five guiding principles:
| 1. | Support small businesses and their contributions to our communities and our economy. |
| 2. | Keep taxes low for small businesses, and support owners to actively invest in their growth, create jobs, strengthen entrepreneurship and grow our economy. |
| 3. | Avoid creating unnecessary red tape for hard-working small business owners. |
| 4. | Recognize the importance of maintaining family farms, and work with Canadians to ensure that the transfer of a family business to the next generation is not affected. |
| 5. | Conduct a gender-based analysis on finalized proposals, to ensure any changes to the tax system promote gender equity. |
INCOME SPRINKLING
Through income sprinkling, high-income individuals can (depending on family circumstances) save thousands of dollars in tax in a given year. In some cases, someone earning hundreds of thousands of dollars a year can pay a lower tax rate than a middle class Canadian earning far less. In others, a single mother with two children under 18 can pay a higher tax rate than a married professional with two adult children.
To address these inconsistencies, and unfairness in the tax system, the Government intends to move forward with measures to limit income sprinkling using private corporations, while ensuring that the rules will not impact businesses to the extent there are clear and meaningful contributions by spouses, children and other family members.
Throughout the consultation period, the Government received feedback on the complexity of the proposed measures and potential unintended consequences. The Government also received feedback that the measures could create uncertainty in relation to how amounts received from a family business would be taxed.
| | |
| | | FAIRNESS FOR THE MIDDLE CLASS AND THOSE WORKING HARD TO JOIN IT 47 |
|
Sprinkling Income Using a Private Corporation—Owners of Corporations With Exactly the Same Income but One Owner Pays $21,000 More in Tax Alicia and Brent are neighbours and business owners living in Nova Scotia. • Alicia is a single mother with two children under the age of 18. • Brent has a spouse and two children, ages 19 and 21; none of these family members has income. Alicia’s household pays about $21,000 more tax than Brent’s household under current rules. Both Alicia and Brent have incorporated businesses that earn $180,000 before salary and taxes in 2017. Each receives $100,000 in salary, and the remaining after-tax profits are paid out as dividends. The difference is that Alicia’s corporation pays all of the dividends to her. Total taxes (corporate income taxes plus personal income taxes) add up to $63,600 for Alicia’s household. Brent’s spouse and adult children have no involvement in the business. They own shares in the corporation, for which they paid very little. Brent’s corporation pays the remaining after-tax profits in equal amounts to these three family members as dividends. Total taxes paid by Brent’s household equal $42,600. Overall, Alicia’s household pays $21,000 more in taxes (roughly 50 per cent) than the amount paid by Brent’s household. Under the proposed rules, given that Brent’s family members do not contribute to his business, any dividends they receive would be taxed at higher marginal rates such that there would be no tax benefit to paying dividends to Brent’s family members. Brent could therefore decide to have all salary and dividends paid to him. As a result, his household would pay roughly the same amount of tax as Alicia’s household. 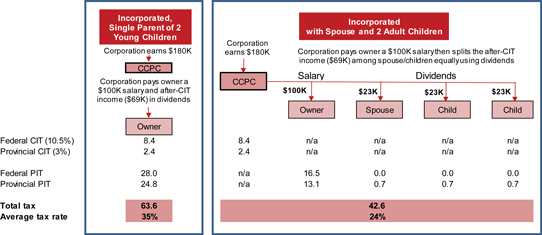
Notes: Tax parameters for 2017. Dollar amounts in thousands unless stated. CIT= corporate income tax. PIT= personal income tax. |
|
Income Sprinkling—Who’s Affected? • The vast majority of private corporations are not implicated. Only about 50,000 family-owned private businesses benefit annually from income sprinkling. This represents only a small fraction—roughly 3 per cent—of CCPCs. • About 80 per cent of these families earn more than $125,000 in total income; 50 per cent of these families earned more than $200,000 in total income. • Of the individuals that are sprinkling income, over 70 per cent are male. • Family businesses will be unaffected if the spouse or adult children are meaningfully contributing to the business. |
To address these concerns, the Government will simplify the proposed measures with the aim of providing greater certainty for family members who contribute to a family business. Specifically, the Government will introduce reasonableness tests for adult family members aged 18-24, as well as those 25 and older. These adults will be asked to demonstrate their contribution to the business based on four basic principles—whether they have made a contribution through any combination of the following:
| • | | Capital or equity contributions to the business; |
| • | | Financial risks of the business taken on, such as co-signing a loan or other debt; and/or |
| • | | Past contributions in respect of previous labour, capital or risks. |
Taking into account the submissions made to the consultation, this fall the Government will release revised draft legislative proposals outlining the proposed changes addressing income sprinkling, which will be proposed to be effective for the 2018 and subsequent taxation years.
A number of stakeholders also identified potential unintended consequences associated with the proposed measures to address the multiplication of the LCGE. For example, concerns were raised about the potential impact on intergenerational transfers of family businesses. The Government will not be moving forward with measures that would limit access to the LCGE.
|
Sprinkling Income Using a Private Corporation—Genuine Family Business Arrangements Not Affected Jacob owns a family farm in southwestern Ontario which he works with his wife Frieda and their adult son Herman. The farm is incorporated and earns $120,000 in net business income before salary. • The farm pays Jacob $65,000 in salary and dividends. • The farm pays Frieda, who does the farm’s accounting and helps out on the farm, $30,000 in salary and dividends. • Herman, who is 25 years old and works on the farm during the summer, on weekends and during breaks from university, receives $17,500 in salary and dividends. This family will not be affected by the proposed rules on dividend income sprinkling because dividend allocations to Frieda and Herman are reasonable compensation for their contributions to the farm. Once the small business tax reductions are fully implemented, the business will save an additional $750 which could be used to help pay for new farm equipment. |
| | |
| | | FAIRNESS FOR THE MIDDLE CLASS AND THOSE WORKING HARD TO JOIN IT 49 |
PASSIVE INVESTMENTS
During the consultation period, the Government heard from business owners that the flexibility afforded from savings accumulated in the corporation is important to their success. For example, savings can be held within a corporation to finance an upcoming business expansion or to save for a downturn. These savings are also sometimes used to provide flexibility to deal with personal circumstances such as for maternity leave, sick days or retirement—in such cases, savings held within the corporation can have both a business and personal component.
At the same time, Canadians pointed out that while there is a need for some flexibility, this needs to be provided in a manner that does not encourage wealthy individuals to have unlimited tax assisted savings over and above the RRSP and TFSA limits available to everyone else.
The Government will move forward with measures to limit tax deferral opportunities related to passive investments, while:
| 1. | Ensuring that investments already made by private corporations’ owners, including the future income earned from such investments, are protected. The measures will apply only on a go-forward basis; |
| 2. | Protecting the ability of businesses to save the funds they need for contingencies or future investments, such as the purchase of equipment, hiring and training of staff or business expansion; |
| 3. | Including an annual passive income threshold of $50,000 (equivalent to $1 million in savings based on a nominal 5-per-cent rate of return) to provide more flexibility for business owners to hold savings for multiple purposes, including savings that can later be used for personal benefits such as sick leave, maternity leave, or retirement. There will be no tax increase on passive income below this threshold. Further details will be released in Budget 2018, including a technical description of how the passive income threshold will be applied; and |
| 4. | Ensuring that as the Government moves forward with tax changes, incentives are maintained so that Canada’s venture capital and angel investors can continue to invest in the next generation of Canadian innovation. The Government will work with the venture capital and angel investment sectors to identify how this can be best achieved. |
The Government will also examine all deferral benefits from passive investments and will continue to assess key design aspects. For example, consideration will be given as to the appropriate scope of the new tax regime with respect to capital gains, including whether in certain circumstances the new rules should exclude capital gains realized on the sale of shares of a corporation engaged in an active business.
In this proposal, the Government remains committed to tax fairness, and the approach will ensure the measures are focused on a small number of high-income individuals who get the biggest advantage from existing rules. The Government will propose measures to limit tax deferral opportunities related to passive investments and release draft legislation as part of Budget 2018.
Of the 1.8 million active CCPCs in Canada in 2015, only about 325,000 reported passive income. Of this amount, it is estimated that 280,000 may have benefitted from deferral advantages. More frequently, CCPCs generate income from property that is considered incidental to their active business.5 In many cases, such income is not considered “passive” under current tax rules, and is not subject to the taxation regime that applies to passive income. This will not change. The object of the consultation is passive income that is over and above what is incidental to the business.
| 5 | Income from property “that is incident to or pertains to” the active business, or income from property “that is used or held principally for the purpose of gaining or producing income from an active business” may be included in active business income for tax purposes. Whether income can be included in “active business income” is a question of fact. |
Similarly, the proposed changes to passive investment will not apply to income from AgriInvest, which is a self-managed producer-government savings account that allows producers to set money aside that can be used to recover from small income shortfalls, or to make investments to reduce on-farm risks—under the current system, investment income in an AgriInvest account is treated as active business income. The Government’s intention is to maintain this approach.
Tax data show that:
| • | | Of the taxable passive income earned by the 280,000 corporations that may have benefitted from deferral advantages, 80 per cent is held by less than 2 per cent of CCPCs (Chart 3.6)—that group earned $16 billion in passive income in 2015, and held approximately $300 billion in passive assets.6 |
| • | | About 97 per cent of CCPCs reported taxable passive income below the proposed $50,000 threshold in 2015. The remaining 3 per cent, those that reported more than $50,000, accounted for about 88 per cent of passive income reported in 2015. |
| • | | Of the taxable passive income that can be effectively linked to individuals using tax data, 83 per cent is earned by those with incomes greater than $250,000 per year (Chart 3.7). |
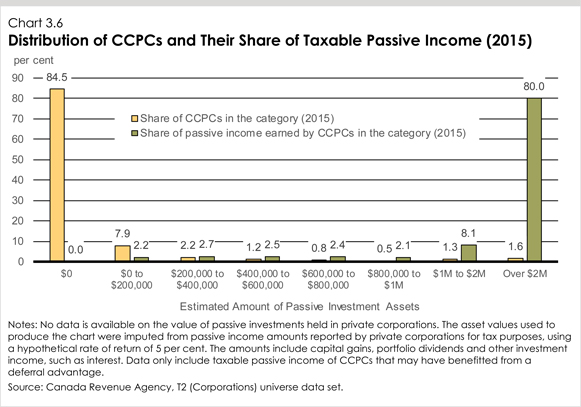
| 6 | No data is available on the value of passive assets held in private corporations. The $300 billion estimate is imputed from passive income reported by CCPCs for tax purposes, using a hypothetical rate of return of 5 per cent. The amounts include capital gains, portfolio dividends and other investment income, such as interest. |
| | |
| | | FAIRNESS FOR THE MIDDLE CLASS AND THOSE WORKING HARD TO JOIN IT 51 |
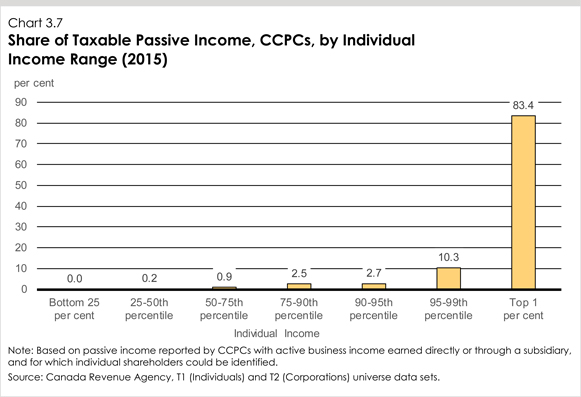
|
Benefits of Investing Passive Income A high-income individual can realize significant tax advantages from holding passive investments in his or her corporation. The chart below shows the cumulative after-tax returns a corporate owner would achieve from investing the after-tax proceeds on $100,000 of income, in an asset generating 3 per cent interest annually, held within their corporation for 10, 20 and 30 years, compared to the return from saving in a taxable personal savings account. By benefitting from a lower rate of tax on business income, the amount of after-tax income that can be invested passively is larger than what they would be able to invest if they had distributed the income to themselves as salary or dividends. A corporate owner is able to earn after-tax interest income that is about 1.8 times more than they could realize at the personal level after 10 years (after distribution). After 30 years, the additional after-tax interest income from saving in a corporation is more than double what they could have obtained by saving at the personal level. Chart 3.8 After-Tax Investment Returns for an Individual Investing Directly or Through a Corporation 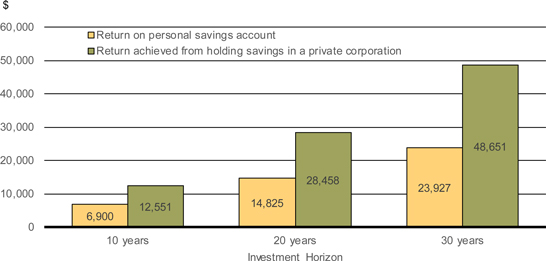
Notes: The chart shows the passive investment growth that an individual living in Ontario and paying the top marginal tax rate would realize on personal savings (interest income), compared to the benefit that would be realized if that same investment were held inside a private corporation. In each case, the investor makes a one-time passive investment (for 10, 20 or 30 years), using $100,000 of income, less the payment of either the combined top marginal federal-provincial personal income tax (at 53.53 per cent) or corporate income tax (at 15 per cent, the combined federal-provincial tax rate for qualifying small business corporations in Ontario). Comparisons assume that the corporate passive investment is distributed to the corporate owner at the end of the holding period, and takes into account all income taxes payable on dividend income. Additional returns from investing through the corporation reflect the impact of the higher initial passive investment, as well as the impact of annual refund of additional taxes payable on passive income. |
| | |
| | | FAIRNESS FOR THE MIDDLE CLASS AND THOSE WORKING HARD TO JOIN IT 53 |
|
Preserving Financial Flexibility Expanding the Business Victoria owns and operates a car dealership, and has aspirations of significantly expanding the repair and maintenance shop. She sets aside a portion of her profits every year and accumulates those savings inside her corporation. • After paying herself a salary of $90,000, Victoria’s corporation has taxable income of $180,000. • Her corporation pays $24,300 in corporate income tax, leaving $155,700 for savings each year. • Those savings accumulate inside the corporation and are invested in passive investment assets earning a 5 per cent rate of return. • The passive income is subject to tax at the corporate level. That passive income grows over time, to reach $41,000 in the fifth year. After five years, Victoria has accumulated some $840,000 in savings that she uses to buy equipment for her expansion. • Her savings consist of $778,500 in after-tax profits plus $61,500 in cumulative after-tax interest income earned on her passive investments. • The Government’s proposals will not affect the amount of savings she has to buy equipment. No tax is payable when she reinvests the proceeds in her corporation. Once fully implemented, the reduction in the small business tax rate to 9 per cent will enhance her ability to save for future business expansion. It will allow her corporation to save an additional $2,700 every year. Over five years, accounting for compounded returns, this translates into about $14,500. Saving for a Downturn Mohamed is a property surveyor who owns and runs his own surveying corporation. While he has been successful so far, he worries about the unexpected, and wishes to plan ahead for various eventualities. • After paying himself a salary of $110,000, Mohamed has $23,000 of pre-tax corporate income, leaving him with about $20,000 to save per year in his corporation after he pays corporate taxes. By saving inside his corporation, Mohamed has the flexibility to use the money in his business, as needed. He also benefits from the lower small business tax rate, which leaves him with more money to use in his business. Once fully implemented, the announced small business tax rate reduction will allow him to save $345 more annually. After five years, Mohamed managed to save $100,000 in his corporation, on which passive income is generated. These savings offer him the security of knowing he could manage short- term challenges to pay himself as well as pay for the salaries of his employees and other expenses for several months in case of a downturn. |
CONVERSION OF INCOME INTO CAPITAL GAINS
Canada’s federal Income Tax Act has rules intended to address the use of various transactions by some taxpayers to avoid paying their fair share of taxes. Section 84.1 is one such rule and it is intended to address the conversion of amounts that would otherwise be taxed as dividends into lower-taxed capital gains. In the consultation paper of July 18, 2017, the Government sought to strengthen the income tax rules to curb tax planning strategies that seek to circumvent the intent of the Income Tax Act with respect to “surplus stripping”.
The consultation raised issues with respect to unintended consequences and potential challenges with respect to intergenerational transfers of businesses, including farms. In particular, the Government in the consultation had asked Canadians for their views on how to better accommodate intergenerational transfers of businesses while protecting the fairness of the tax system.
Given these issues, the Government will not move forward with the proposed changes regarding the conversion of income into capital gains and the draft legislative proposals released with the consultation will not proceed, including the proposed effective date of July 18, 2017.
In the coming year, the Government will continue its outreach to farmers, fishers and other business owners to develop proposals to better accommodate intergenerational transfers of businesses while protecting the fairness of the tax system.
GENDER-BASED ANALYSIS—INCOME SPRINKLING AND PASSIVE INCOME
The Government is considering whether actions to limit unfair advantages available to high-income and wealthy Canadians would impact men and women differently. This question is not straightforward. On the one hand, tax data show that a majority of owners of private corporations are men, and that men receive a greater percentage of dividend income from the corporations they control. That said, these unfair advantages are likely to affect individuals other than the corporation’s controlling owner. For example, it is likely that existing tax benefits are shared with family members—the owner’s spouse and children—or in the case of the sprinkling of income, that family members are part of the tax planning strategy.
As noted in the consultation paper, with respect to direct corporate ownership, tax data show that:
| • | | Men reported 74 per cent of the net capital gains from the sale of qualified (private) small business corporation shares. |
| • | | Men received 66 per cent of small business dividends paid to individuals by CCPCs in 2014. |
While the incidence of the measures is difficult to ascertain, additional statistics may assist in the determination of any gender impacts from the proposed measures:
| • | | Data show that men represent over 70 per cent of higher-income earners initiating income sprinkling strategies. However, women are disproportionally represented among recipients of sprinkled dividends and income derived from trusts and partnerships (68 per cent and 58 per cent, respectively). While this income is of benefit for recipients, it also creates incentives that reduce female participation in the workforce. Increased participation of women in the workforce is a source of economic opportunity for individuals, but also a major driver of overall economic growth. |
| | |
| | | FAIRNESS FOR THE MIDDLE CLASS AND THOSE WORKING HARD TO JOIN IT 55 |
A detailed analysis of the gender impacts of the proposal that relates to passive income will be conducted before the Government decides on the final design of the new tax rules. That said, the measure will affect individuals that own and control private corporations and receive passive income, which are mostly men as noted in Table 3.2. The Government is committed to gender-based analysis, and will continue to refine its analysis of the gender impacts of the measures being contemplated with respect to passive income.
Table 3.2
Taxable Passive Income of CCPCs by Personal Income Range of Shareholders, 2015
| | | | | | | | |
| | | | | Share of Total |
| Income Range | | | | Taxable Passive
Income | | Male
Per cent of
income range | | Female Per cent of income range |
Less than $14,500 | | (bottom 25 percentile) | | 0.0% | | 38.4% | | 61.6% |
$14,500 - $31,500 | | (25-50th percentile) | | 0.2% | | 46.6% | | 53.4% |
$31,500 - $58,500 | | (50-75th percentile) | | 0.9% | | 51.3% | | 48.7% |
$58,500 - $93,500 | | (75-90th percentile) | | 2.5% | | 56.3% | | 43.7% |
$93,500 - $123,000 | | (90-95th percentile) | | 2.7% | | 58.6% | | 41.4% |
$123,000 - $250,000 | | (95-99th percentile) | | 10.3% | | 61.5% | | 38.5% |
More than $250,000 | | (top 1 percentile) | | 83.4% | | 74.4% | | 25.6% |
| | | | |
All | | | | 100.0% | | 71.9% | | 28.1% |
Note: Based on passive investment income reported by CCPCs with active business income earned directly or through a subsidiary, and for which individual shareholders could be identified.
Annex 1
DETAILS OF ECONOMIC AND
FISCAL PROJECTIONS
ECONOMIC PROJECTIONS
The average of private sector forecasts has been used as the basis for fiscal planning since 1994 and introduces an element of independence into the Government’s fiscal forecast. This practice has been supported by international organizations such as the International Monetary Fund.
The Department of Finance Canada regularly surveys private sector economists on their views on the outlook for the Canadian economy. The economic forecast presented in this section is based on a survey conducted in September 2017.
The September 2017 survey includes the views of 14 private sector economists:
| • | | Caisse de dépôt et placement du Québec, |
| • | | Canadian Federation of Independent Business, |
| • | | The Conference Board of Canada, |
| • | | Industrial Alliance Insurance and Financial Services Inc., |
| • | | Laurentian Bank Securities, |
| • | | National Bank Financial Markets, |
| • | | TD Bank Financial Group, and |
| • | | the University of Toronto (Policy and Economic Analysis Program). |
| | |
| | | DETAILS OF ECONOMIC AND FISCAL PROJECTIONS 57 |
Since the release of Budget 2017, the average private sector outlook has been revised up. Private sector economists now expect real gross domestic product (GDP) growth of 3.1 per cent in 2017 and 2.1 per cent in 2018, higher than the 2.0 per cent forecast in Budget 2017 for both years. Real GDP growth over the remaining years of the forecast is slightly lower than in the Budget 2017 forecast (Table A1.1).
Private sector economists assume West Texas Intermediate (WTI) crude oil prices will rise more gradually than in the Budget 2017 forecast, reaching US$59 per barrel in 2021, compared to US$64 per barrel in Budget 2017.
While the outlook for GDP inflation (the broadest measure of economy-wide price inflation) has been revised up in 2017 compared to the Budget 2017 forecast, it has been revised down somewhat in 2018 onwards reflecting a lower outlook for oil prices.
As a result of these developments, the level of nominal GDP (the broadest measure of the tax base) is higher by $30 billion on average per year over the forecast horizon.
In line with upward revisions to real GDP growth, the economists have revised down their outlook for the unemployment rate by about 0.3 percentage points on average over the forecast horizon. They now expect the unemployment rate to average 6.5 per cent in 2017 and 6.1 per cent in 2022.
The recent increases in the Bank of Canada’s target for the overnight rate have led the private sector economists to revise up the outlook for the 3-month treasury bill rate by 40 basis points per year, on average. As well, the outlook for the 10-year government bond rate is revised slightly up from 2018 onwards, by an average of about 10 basis points per year.
Table A1.1
Average Private Sector Forecasts
per cent, unless otherwise indicated
| | | | | | | | | | | | | | | | | | | | | | | | | | | | | | | | |
| | | 2016 | | | 2017 | | | 2018 | | | 2019 | | | 2020 | | | 2021 | | | 2022 | | | 2017–
2021 | |
Real GDP growth | | | | | | | | | | | | | | | | | | | | | | | | | | | | | | | | |
Budget 20161 | | | 1.4 | | | | 2.2 | | | | 2.2 | | | | 2.0 | | | | 1.9 | | | | – | | | | – | | | | – | |
Budget 20171 | | | 1.4 | | | | 2.0 | | | | 2.0 | | | | 1.7 | | | | 1.7 | | | | 1.8 | | | | – | | | | 1.8 | |
2017 Fall Economic Statement | | | 1.5 | | | | 3.1 | | | | 2.1 | | | | 1.6 | | | | 1.7 | | | | 1.7 | | | | 1.8 | | | | 2.0 | |
GDP inflation | | | | | | | | | | | | | | | | | | | | | | | | | | | | | | | | |
Budget 20161 | | | 0.9 | | | | 2.4 | | | | 2.1 | | | | 2.1 | | | | 2.1 | | | | – | | | | – | | | | – | |
Budget 20171 | | | 0.5 | | | | 2.1 | | | | 2.0 | | | | 1.8 | | | | 2.1 | | | | 2.0 | | | | – | | | | 2.0 | |
2017 Fall Economic Statement | | | 0.6 | | | | 2.4 | | | | 1.8 | | | | 1.8 | | | | 2.0 | | | | 1.9 | | | | 1.9 | | | | 2.0 | |
Nominal GDP growth | | | | | | | | | | | | | | | | | | | | | | | | | | | | | | | | |
Budget 20161 | | | 2.3 | | | | 4.6 | | | | 4.3 | | | | 4.2 | | | | 4.1 | | | | – | | | | – | | | | – | |
Budget 20171 | | | 1.9 | | | | 4.2 | | | | 4.0 | | | | 3.5 | | | | 3.8 | | | | 3.8 | | | | – | | | | 3.9 | |
2017 Fall Economic Statement | | | 2.1 | | | | 5.5 | | | | 4.0 | | | | 3.4 | | | | 3.7 | | | | 3.6 | | | | 3.8 | | | | 4.1 | |
Nominal GDP level (billions of dollars) | | | | | | | | | | | | | | | | | | | | | | | | | | | | | | | | |
Budget 20161 | | | 2,033 | | | | 2,126 | | | | 2,218 | | | | 2,310 | | | | 2,404 | | | | – | | | | – | | | | | |
Budget 20171 | | | 2,024 | | | | 2,109 | | | | 2,194 | | | | 2,271 | | | | 2,357 | | | | 2,447 | | | | – | | | | | |
2017 Fall Economic Statement | | | 2,028 | | | | 2,140 | | | | 2,226 | | | | 2,302 | | | | 2,388 | | | | 2,473 | | | | 2,568 | | | | | |
Difference between Budget 2016 and 2017 Fall Economic Statement | | | -5 | | | | 13 | | | | 8 | | | | -8 | | | | -16 | | | | – | | | | – | | | | – | |
Difference between Budget 2017 and 2017 Fall Economic Statement | | | 3 | | | | 30 | | | | 31 | | | | 31 | | | | 31 | | | | 26 | | | | – | | | | 30 | |
Table A1.1
Average Private Sector Forecasts
per cent, unless otherwise indicated
| | | | | | | | | | | | | | | | | | | | | | | | | | | | | | | | |
| | | 2016 | | | 2017 | | | 2018 | | | 2019 | | | 2020 | | | 2021 | | | 2022 | | | 2017–
2021 | |
3-month treasury bill rate | | | | | | | | | | | | | | | | | | | | | | | | | | | | | | | | |
Budget 2016 | | | 0.5 | | | | 0.7 | | | | 1.6 | | | | 2.4 | | | | 2.7 | | | | – | | | | – | | | | – | |
Budget 2017 | | | 0.5 | | | | 0.6 | | | | 0.9 | | | | 1.4 | | | | 1.8 | | | | 2.3 | | | | – | | | | 1.4 | |
2017 Fall Economic Statement | | | 0.5 | | | | 0.8 | | | | 1.5 | | | | 2.0 | | | | 2.3 | | | | 2.5 | | | | 2.7 | | | | 1.8 | |
10-year government bond rate | | | | | | | | | | | | | | | | | | | | | | | | | | | | | | | | |
Budget 2016 | | | 1.6 | | | | 2.3 | | | | 3.0 | | | | 3.4 | | | | 3.6 | | | | – | | | | – | | | | – | |
Budget 2017 | | | 1.3 | | | | 1.8 | | | | 2.3 | | | | 2.7 | | | | 3.0 | | | | 3.3 | | | | – | | | | 2.6 | |
2017 Fall Economic Statement | | | 1.3 | | | | 1.8 | | | | 2.5 | | | | 2.9 | | | | 3.1 | | | | 3.3 | | | | 3.5 | | | | 2.7 | |
Exchange rate (US cents/C$) | | | | | | | | | | | | | | | | | | | | | | | | | | | | | | | | |
Budget 2016 | | | 72.1 | | | | 75.9 | | | | 79.1 | | | | 81.5 | | | | 83.1 | | | | – | | | | – | | | | – | |
Budget 2017 | | | 75.5 | | | | 74.5 | | | | 76.1 | | | | 77.4 | | | | 79.3 | | | | 81.3 | | | | – | | | | 77.7 | |
2017 Fall Economic Statement | | | 75.5 | | | | 77.8 | | | | 81.3 | | | | 81.2 | | | | 81.4 | | | | 81.2 | | | | 82.4 | | | | 80.6 | |
Unemployment rate | | | | | | | | | | | | | | | | | | | | | | | | | | | | | | | | |
Budget 2016 | | | 7.1 | | | | 6.9 | | | | 6.5 | | | | 6.4 | | | | 6.3 | | | | – | | | | – | | | | – | |
Budget 2017 | | | 7.0 | | | | 6.9 | | | | 6.7 | | | | 6.7 | | | | 6.6 | | | | 6.4 | | | | – | | | | 6.6 | |
2017 Fall Economic Statement | | | 7.0 | | | | 6.5 | | | | 6.3 | | | | 6.3 | | | | 6.4 | | | | 6.3 | | | | 6.1 | | | | 6.3 | |
Consumer Price Index inflation | | | | | | | | | | | | | | | | | | | | | | | | | | | | | | | | |
Budget 2016 | | | 1.6 | | | | 2.0 | | | | 2.0 | | | | 2.0 | | | | 2.0 | | | | – | | | | – | | | | – | |
Budget 2017 | | | 1.5 | | | | 2.0 | | | | 2.0 | | | | 1.9 | | | | 1.9 | | | | 2.0 | | | | – | | | | 2.0 | |
2017 Fall Economic Statement | | | 1.4 | | | | 1.6 | | | | 1.9 | | | | 1.9 | | | | 1.9 | | | | 1.9 | | | | 2.0 | | | | 1.8 | |
U.S. real GDP growth | | | | | | | | | | | | | | | | | | | | | | | | | | | | | | | | |
Budget 2016 | | | 2.3 | | | | 2.4 | | | | 2.4 | | | | 2.2 | | | | 2.1 | | | | – | | | | – | | | | – | |
Budget 2017 | | | 1.6 | | | | 2.3 | | | | 2.3 | | | | 1.8 | | | | 1.9 | | | | 2.0 | | | | – | | | | 2.0 | |
2017 Fall Economic Statement | | | 1.5 | | | | 2.2 | | | | 2.3 | | | | 1.9 | | | | 1.9 | | | | 1.9 | | | | 1.9 | | | | 2.0 | |
WTI crude oil price ($US per barrel) | | | | | | | | | | | | | | | | | | | | | | | | | | | | | | | | |
Budget 2016 | | | 40 | | | | 52 | | | | 59 | | | | 63 | | | | 63 | | | | – | | | | – | | | | – | |
Budget 2017 | | | 43 | | | | 54 | | | | 59 | | | | 56 | | | | 59 | | | | 64 | | | | – | | | | 58 | |
2017 Fall Economic Statement | | | 43 | | | | 50 | | | | 53 | | | | 54 | | | | 56 | | | | 59 | | | | 62 | | | | 54 | |
| 1 | Figures have been restated to reflect the historical revisions to the Canadian System of National Accounts, which were published along with data for the second quarter of 2017, released on August 31, 2017. |
Sources: For Budget 2016, Department of Finance Canada February 2016 survey of private sector economists; for Budget 2017, Department of Finance Canada December 2016 survey of private sector economists; for the 2017 Fall Economic Statement, Department of Finance Canada September 2017 survey of private sector economists; Statistics Canada.
| | |
| | | DETAILS OF ECONOMIC AND FISCAL PROJECTIONS 59 |
FISCAL PROJECTIONS
The remainder of this annex reviews the major economic and fiscal developments since Budget 2017 and updates the Government’s fiscal projections for the 2017–18 to 2022–23 period. Changes in the fiscal outlook since Budget 2017 are shown in Table A1.2.
Table A1.2
Economic and Fiscal Developments Since Budget 2017
billions of dollars
| | | | | | | | | | | | | | | | | | | | | | | | | | | | |
| | | | | | Projection | |
| | | 2016–
2017 | | | 2017–
2018 | | | 2018–
2019 | | | 2019–
2020 | | | 2020–
2021 | | | 2021–
2022 | | | 2022–
2023 | |
Budget 2017 budgetary balance1, 2 | | | -23.0 | | | | -28.5 | | | | -27.4 | | | | -23.4 | | | | -21.7 | | | | -18.8 | | | | n/a | |
Adjustment for risk from Budget 2017 | | | | | | | 3.0 | | | | 3.0 | | | | 3.0 | | | | 3.0 | | | | 3.0 | | | | | |
Budget 2017 budgetary balance
(without forecast adjustment) | | | -23.0 | | | | -25.5 | | | | -24.4 | | | | -20.4 | | | | -18.7 | | | | -15.8 | | | | | |
Economic and fiscal developments | | | 5.3 | | | | 8.9 | | | | 10.4 | | | | 9.7 | | | | 8.9 | | | | 8.7 | | | | | |
Revised budgetary balance before policy actions and investments | | | -17.8 | | | | -16.6 | | | | -14.0 | | | | -10.7 | | | | -9.8 | | | | -7.1 | | | | -5.2 | |
Policy actions since Budget 20173 | | | | | | | | | | | | | | | | | | | | | | | | | | | | |
Investing in critical services for Canadians | | | | | | | -0.7 | | | | -0.6 | | | | -0.6 | | | | -0.8 | | | | -1.1 | | | | -1.5 | |
Actions to lower taxes for small business and achieve greater tax fairness | | | | | | | 0.1 | | | | 0.1 | | | | -0.5 | | | | -0.6 | | | | -0.4 | | | | -0.4 | |
Other policy actions since Budget 2017 | | | | | | | -1.3 | | | | -0.6 | | | | -1.0 | | | | -0.7 | | | | -0.5 | | | | -0.4 | |
Total | | | | | | | -1.8 | | | | -1.1 | | | | -2.1 | | | | -2.2 | | | | -2.0 | | | | -2.3 | |
Investments in this Fall Economic Statement | | | | | | | | | | | | | | | | | | | | | | | | | | | | |
Working Income Tax Benefit enhancement | | | | | | | | | | | -0.1 | | | | -0.5 | | | | -0.5 | | | | -0.5 | | | | -0.5 | |
Earlier indexation of the Canada Child Benefit | | | | | | | | | | | -0.4 | | | | -1.1 | | | | -1.3 | | | | -1.4 | | | | -1.4 | |
Total | | | | | | | | | | | -0.5 | | | | -1.6 | | | | -1.8 | | | | -1.9 | | | | -1.9 | |
Total policy actions and investments | | | | | | | -1.8 | | | | -1.6 | | | | -3.7 | | | | -4.0 | | | | -3.8 | | | | -4.2 | |
Budgetary balance (without risk adjustment) | | | -17.8 | | | | -18.4 | | | | -15.6 | | | | -14.3 | | | | -13.8 | | | | -10.9 | | | | -9.5 | |
Adjustment for risk | | | | | | | -1.5 | | | | -3.0 | | | | -3.0 | | | | -3.0 | | | | -3.0 | | | | -3.0 | |
Final budgetary balance | | | -17.8 | | | | -19.9 | | | | -18.6 | | | | -17.3 | | | | -16.8 | | | | -13.9 | | | | -12.5 | |
Economic and fiscal developments by component: | | | | | | | | | | | | | | | | | | | | | | | | | | | | |
Budgetary revenues | | | | | | | | | | | | | | | | | | | | | | | | | | | | |
Income taxes | | | 0.6 | | | | 5.0 | | | | 6.9 | | | | 6.9 | | | | 5.9 | | | | 5.2 | | | | | |
Excise taxes/duties | | | 0.7 | | | | 1.9 | | | | 1.4 | | | | 1.0 | | | | 0.8 | | | | 0.4 | | | | | |
Employment Insurance premiums | | | -0.2 | | | | -0.2 | | | | -0.4 | | | | -0.7 | | | | -0.8 | | | | -0.9 | | | | | |
Other revenues | | | 0.3 | | | | -0.7 | | | | -0.5 | | | | -1.2 | | | | -0.2 | | | | -0.8 | | | | | |
Total | | | 1.4 | | | | 5.9 | | | | 7.4 | | | | 6.1 | | | | 5.7 | | | | 4.0 | | | | | |
Program expenses | | | | | | | | | | | | | | | | | | | | | | | | | | | | |
Major transfers to persons | | | 0.3 | | | | 0.7 | | | | 0.7 | | | | 1.0 | | | | 0.8 | | | | 0.6 | | | | | |
Major transfers to other levels of government | | | 0.1 | | | | -0.2 | | | | -1.1 | | | | -1.6 | | | | -1.8 | | | | -2.0 | | | | | |
Direct program expenses | | | 3.4 | | | | 1.9 | | | | 3.6 | | | | 4.7 | | | | 4.0 | | | | 4.8 | | | | | |
Total | | | 3.7 | | | | 2.4 | | | | 3.2 | | | | 4.0 | | | | 3.1 | | | | 3.4 | | | | | |
Public debt charges | | | 0.1 | | | | 0.6 | | | | -0.3 | | | | -0.4 | | | | 0.2 | | | | 1.4 | | | | | |
Total economic and fiscal developments | | | 5.3 | | | | 8.9 | | | | 10.4 | | | | 9.7 | | | | 8.9 | | | | 8.7 | | | | | |
Note: Totals may not add due to rounding.
| | 1 | Budgetary balance includes adjustment for risk. |
| | 2 | A negative number implies a deterioration in the budgetary balance (lower revenues or higher spending). A positive number implies an improvement in the budgetary balance (higher revenues or lower spending). |
| | 3 | Table A1.3 provides a detailed list of policy actions since Budget 2017. |
IMPACT OF ECONOMIC AND FISCAL DEVELOPMENTS
Relative to Budget 2017, projected budgetary revenues are higher over the forecast horizon due to higher projected corporate and personal income tax revenues as well as excise taxes and duties. This improvement reflects the overall improvement in the economic outlook, particularly in the corporate sector, as well as the carry-forward of better-than-expected results in 2016–17.
Employment Insurance (EI) premium revenues are lower over the forecast horizon due to lower projected EI benefits as a result of the stronger economy, which leads to a decrease in the projected premium rate to $1.65 per $100 of insurable earnings (from $1.68 in Budget 2017).
Other revenues, such as those resulting from loans and investments, interest and penalties, Crown corporations’ revenues and assets held in the Exchange Fund Account, are lower in all years of the forecast horizon largely as a result of a downward revision to the projected revenue from consolidated Crown corporations (particularly the Canadian Commercial Corporation), which more than offsets improvements due to higher interest rates.
With respect to expenses, major transfers to persons are projected to be lower throughout the forecast horizon compared to Budget 2017, as the improved economic outlook leads to lower projected EI benefit expenses, and a small decrease in the expected number of recipients leads to lower projected Old Age Security benefit expenses.
Major transfers to other levels of government are higher than Budget 2017 projections due to the improved outlook for nominal GDP growth, to which the Canada Health Transfer and Equalization are pegged. In addition, home care and mental health transfers announced in Budget 2017 are now classified as major transfers to other levels of government rather than direct program expenses. While the value of these transfers is unchanged from Budget 2017, the reclassification leads to an increase in major transfers to other levels of government and a corresponding decrease to direct program expenses.
|
Increasing Transfers to Other Levels of Government |
The Government of Canada provides significant financial support to provincial and territorial governments on an ongoing basis to assist them in providing important programs and services for Canadians. Growth in the two largest transfers to other levels of government, the Canada Health Transfer and Equalization, is linked to a three-year moving average of nominal GDP growth. As a result of the improved outlook for nominal GDP, other governments are projected to receive an additional $1.2 billion over five years under the Canada Health Transfer and $0.6 billion over five years in Equalization payments relative to the Budget 2017 projections. |
Compared to Budget 2017, direct program expenses are lower, reflecting the carry-forward of 2016–17 results (notably lower bad debt expenses on tax receivables) and lower projected expenses for consolidated Crown corporations (particularly the Canadian Commercial Corporation). In addition, expenses related to pensions and employee future benefits are down, reflecting the actuarial gain on plan liabilities as a result of higher interest rates and the recent performance of plan assets.
Public debt charges are expected to be lower in 2017–18 as lower projected inflation results in lower expected Real Return Bond adjustments. Public debt charges are higher in 2018–19 and 2019–20 due to higher projected interest rates, but from 2020–21 onwards, the expected improvement in the federal debt stemming from significantly smaller deficits more than offsets the impact of projected rate increases.
| | |
| | | DETAILS OF ECONOMIC AND FISCAL PROJECTIONS 61 |
|
Accounting for Pension and Other Future Benefits and Their Interaction With Interest Rates |
The Government’s accumulated benefit obligations for public sector pensions and other employee and veteran future benefits, as well as the cost of benefits earned by employees during the year, are accounted for based on their estimated present, or discounted, value. The Government’s funded pension benefits relate mainly to benefits earned post-March 31, 2000 (the time at which the Government began funding certain plans on a go-forward basis) under its three main pension plans—the public service, Canadian Forces–Regular Force, and Royal Canadian Mounted Police (RCMP) pension plans. The discount rate for these funded pension benefits is based on the expected rates of return on invested funds. For unfunded benefits earned up to March 31, 2000 under the three plans, the discount rate is based on a weighted average of long-term Government of Canada bond rates. For the Government’s other future benefit plans, including veterans benefits, health and dental care benefits for retired employees, sick leave, severance and workers’ compensation, the discount rate reflects the expected long-term Government of Canada bond rate. A decrease in discount rates results in a higher present value of the Government’s obligations for pension and other future benefits, while an increase results in a lower present value. The Government is currently reviewing its discount rate methodology to assess the continued appropriateness of its practices and assumptions. This project includes a review of industry practices, trends in the public and private sectors, and emerging developments in accounting standards. The Government expects to complete its review in the coming months and will publicly share the results on or before tabling of the Public Accounts of Canada 2018. |
POLICY ACTIONS TAKEN SINCE BUDGET 2017
Investing in Critical Services for Canadians
Since Budget 2017, the Government has made significant investments in order to ensure an adequate level of mission-critical services to Canadians, and address critical health and safety needs. New investments total approximately $5.2 billion over six years, on a net basis, starting in 2017–18—and include:
Funding to Maintain Core Fisheries and Oceans Canada and Canadian Coast Guard Services
Fisheries and Oceans Canada and the Canadian Coast Guard deliver services that support the health, safety and security of our aquatic ecosystems, while providing for sustainable economic growth in the marine and fisheries sectors.
To maintain these mission-critical services to Canadians, funding of $1,240 million over six years, starting in 2017–18, and $353 million per year on an ongoing basis, has been provided to Fisheries and Oceans Canada and the Canadian Coast Guard. This funding will support fisheries management activities, and the maintenance of the fleet and other critical infrastructure, which are essential to fostering economic prosperity and providing for the continued safety and security of Canadian waters.
Increasing Capacity for Status of Women Canada
Status of Women Canada is a federal government agency that promotes equality between women and men in all aspects of Canadian life. The agency works to promote and advance equality for women and girls with a focus on: improving women’s and girls’ economic security and prosperity; ending violence against women and girls; and supporting the advancement and increased representation of women and girls in leadership and decision making roles.
Funding of $41 million over six years, starting in 2017–18, and $8 million per year ongoing, is being provided to Status of Women Canada to help advance the Government’s gender equality objectives.
Protecting Canada’s Missions and People Abroad
Our cadre of federal workers abroad serve as Canada’s face and voice around the world, and their work is critical to the success of Canada’s international goals—providing services for Canadians abroad, forging new export and business opportunities for Canadian firms, engaging with the international community, and helping those in need. Yet working abroad carries risks, especially in an increasingly dangerous and volatile global security environment.
To ensure the Government is fulfilling its duty of care obligations, funding of $760 million over six years, starting in 2017–18, and $127 million per year ongoing, is provided to Global Affairs Canada to ensure that our network of people and missions abroad can do their work in safety and security.
Supporting RCMP Front-Line Operations
The RCMP works to prevent and investigate crime; maintain peace and order; enforce laws; and contribute to the safety of Canadians and Canada. In this context, funding of $100 million over three years, starting in 2017–18, was provided to support existing policing operations, including in the areas of national security, serious and organized crime, and financial crime. This funding includes support for the RCMP’s Force Generation, which will help the organization meet demand for new front-line officers, ensuring that they are trained and equipped to maintain public safety. Funding also includes support for the RCMP External Review Committee.
Other Investments in Critical Services for Canadians
Services in other areas, including health care, local governance for First Nations, air transport security and seniors’ benefits, were enhanced as a result of investments since Budget 2017. These investments are highlighted in Table A1.3 below.
Altogether, investments in critical services for Canadians as well as all other investments made since Budget 2017 total approximately $11.4 billion over six years, on a net basis, starting in 2017–18.
Table A1.3
Policy Actions Taken Since Budget 20171
millions of dollars
| | | | | | | | | | | | | | | | | | | | | | |
| | | 2017–
2018 | | | 2018–
2019 | | | 2019–
2020 | | | 2020–
2021 | | | 2021–
2022 | | | 2022–
2023 |
Investing in Critical Services for Canadians | | | | | | | | | | | | | | | | | | | | | | |
| | | | | | |
Completing Government of Canada Information Technology Projects | | | 50 | | | | 91 | | | | 82 | | | | 74 | | | | 33 | | | 29 |
Funding provided to Shared Services Canada to support mission-critical information technology projects. |
Enhancing the Delivery of Health Canada’s Core Regulatory Activities | | | 36 | | | | 35 | | | | - | | | | - | | | | - | | | - |
Funding provided to Health Canada to support core regulatory operations related to drugs and medical devices. This measure will enhance Health Canada’s capacity to conduct scientific, efficacy and safety reviews related to pharmaceuticals and medical devices. |
Funding to Maintain Core Fisheries and Oceans Canada and Canadian Coast Guard Services | | | 154 | | | | 197 | | | | 240 | | | | 248 | | | | 258 | | | 269 |
| | | | | | |
Less: funds sourced from departmental resources | | | -16 | | | | -20 | | | | -22 | | | | -22 | | | | -22 | | | -22 |
Funding provided to Fisheries and Oceans Canada and the Canadian Coast Guard to maintain the fleet, navigational aids and communications equipment, as well as for training and equipment for Canadian Coast Guard personnel, upgrades to information networks and radio infrastructure, monitoring of fish stocks and icebreaking. |
Improving Delivery of Benefits for Seniors | | | 51 | | | | 48 | | | | 24 | | | | - | | | | - | | | - |
Funding provided to Service Canada to ensure that Canadians continue to receive timely and accurate Old Age Security benefits. |
| | |
| | | DETAILS OF ECONOMIC AND FISCAL PROJECTIONS 63 |
| | | | | | | | | | | | | | | | | | | | | | |
| | | 2017–
2018 | | | 2018–
2019 | | | 2019–
2020 | | | 2020–
2021 | | | 2021–
2022 | | | 2022–
2023 |
Improving Employee Pay | | | 93 | | | | 6 | | | | 6 | | | | 6 | | | | 6 | | | 6 |
Funding to address critical challenges with the Government of Canada’s pay system, including a one-time enhanced pay package to attract additional and retain current compensation advisors. |
Increasing Capacity for Status of Women Canada | | | 4 | | | | 7 | | | | 8 | | | | 8 | | | | 8 | | | 8 |
Funding provided to help support the Minister of Status of Women’s broad mandate and significant involvement in cross-cutting and overarching Government of Canada priorities. This will support the Minister of Status of Women to fulfill her mandate to advance gender equality. |
Investments in Federal Infrastructure | | | - | | | | - | | | | - | | | | - | | | | 4 | | | 8 |
Funding for Public Services and Procurement Canada to undertake major renovations to the Arthur Meighen Building in Toronto and Place du Portage Phase III in Gatineau to replace key building systems and upgrade the buildings to modern and efficient standards. |
Labour Standards Backlog | | | 1 | | | | 2 | | | | - | | | | - | | | | - | | | - |
Funding provided to Employment and Social Development Canada to address a backlog of approximately 2,000 labour standards complaints related to issues such as non-payment of wages and unjust dismissals in federally regulated industries. |
Maintaining the Security of Government of Canada IT Networks | | | 23 | | | | 47 | | | | 51 | | | | 52 | | | | 52 | | | 52 |
Funding provided to Shared Services Canada and the Communications Security Establishment for cyber security initiatives. This will ensure the Government can better defend its networks from cyber threats, malicious software and unauthorized access. |
Operating Funding for the Canadian Air Transport Security Authority | | | 25 | | | | - | | | | - | | | | - | | | | - | | | - |
Funding provided to the Canadian Air Transport Security Authority to support increased domestic and international passenger travel for Canada 150 celebrations and to reduce wait times for air travellers across major Canadian airports. |
Protecting Canada’s Missions and People Abroad | | | 106 | | | | 127 | | | | 156 | | | | 142 | | | | 111 | | | 118 |
Funding provided to Global Affairs Canada to enhance security at Canada’s international network of missions. This will enable the Government to continue to fulfill its core responsibilities, ensuring the safety and security of our government employees abroad. |
Supporting Canada’s International Engagement | | | 13 | | | | 13 | | | | 13 | | | | 13 | | | | 13 | | | 13 |
Funding provided to Global Affairs Canada to support Canada’s international engagement work, including Canada’s participation in the Organization for Security and Co-operation in Europe, and efforts at the United Nations. This will support Canada’s role in addressing major conflicts and crises around the world. |
Supporting Local First Nations Governance | | | 24 | | | | 24 | | | | - | | | | - | | | | - | | | - |
Funding provided to Indigenous and Northern Affairs Canada to provide additional support to local First Nations governance. This will help to support the cost of local governance and the administration of departmental programs. |
Supporting RCMP Front-Line Operations | | | 94 | | | | 3 | | | | 3 | | | | - | | | | - | | | - |
Funding provided to the RCMP for the delivery of policing operations and for the RCMP External Review Committee to address its growing caseload. |
Provision for Future Investments in Critical Programs and Services | | | - | | | | - | | | | - | | | | 300 | | | | 600 | | | 1,000 |
Ensuring that Canadians continue to receive the important programs and services they need is a core responsibility of government. In this spirit, the Fall Economic Statement establishes a fiscal provision in order to continue to address mission-critical program and service requirements. |
Net Fiscal Impact—Investing in Critical Services for Canadians | | | 657 | | | | 580 | | | | 561 | | | | 820 | | | | 1,061 | | | 1,480 |
Other Policy Actions Since Budget 2017 | | | | | | | | | | | | | | | | | | | | | | |
2017 Invictus Games | | | 8 | | | | - | | | | - | | | | - | | | | - | | | - |
Funding provided to Veterans Affairs Canada to support the 2017 Invictus Games, which were hosted by Toronto from September 23 to 30. The Invictus Games, which are an international sporting event for wounded, injured and sick service personnel, brought together more than 550 competitors from 17 nations for eight days of successful competition. |
Addressing Extraordinary Health Costs in Manitoba | | | 5 | | | | - | | | | - | | | | - | | | | - | | | - |
Funding provided to the Government of Manitoba to address extraordinary health costs, including ongoing efforts to respond to the opioid crisis and increased demand for medical transportation and dialysis. |
| | | | | | | | | | | | | | | | | | | | | | |
| | | 2017–
2018 | | | 2018–
2019 | | | 2019–
2020 | | | 2020–
2021 | | | 2021–
2022 | | | 2022–
2023 |
Advancing Justice for the LGBTQ2 Community | | | - | | | | 2 | | | | 2 | | | | 0 | | | | 0 | | | - |
Funding provided to Public Safety Canada to implement an expungement scheme for Canadians previously convicted of consensual sexual activity with same-sex partners. This will allow for the permanent destruction of criminal records. |
Connecting Pikangikum First Nation to Ontario’s Power Grid | | | 30 | | | | 30 | | | | - | | | | - | | | | - | | | - |
Less: funds sourced from departmental resources | | | - | | | | - | | | | -1 | | | | -1 | | | | -1 | | | -1 |
| | | | | | |
Less: funds existing in the fiscal framework | | | - | | | | -2 | | | | - | | | | - | | | | - | | | - |
Funding provided to Wataynikaneyap Power to build a 117-kilometre power line with associated infrastructure from Red Lake into the local distribution system at Pikangikum First Nation. The power line will eliminate Pikangikum’s dependence on diesel fuel by supporting a transition to more sustainable energy solutions. |
Defence Policy Review | | | 133 | | | | -184 | | | | 20 | | | | -104 | | | | -207 | | | -40 |
Fiscal impact of Canada’s new defence policy: Strong, Secure, Engaged. This long-term commitment will provide the Canadian Armed Forces with the resources required to meet Canada’s defence needs at home and abroad. |
Enhancing Canada’s National Security Framework | | | 2 | | | | 19 | | | | 26 | | | | 26 | | | | 25 | | | 22 |
| | | | | | |
Less: funds sourced from departmental resources | | | - | | | | -8 | | | | -7 | | | | -5 | | | | -5 | | | -5 |
| | | | | | |
Less: funds existing in the fiscal framework | | | - | | | | - | | | | - | | | | -2 | | | | -2 | | | -2 |
Funding provided to establish the National Security and Intelligence Review Agency, to create a quasi-judicial oversight body for specific intelligence activities, support the Government’s 6-point commitment to national security transparency, and help implement amendments to the Canadian Security Intelligence Service Act and the Security of Canada Information Sharing Act. |
Enhancing Transparency in Political Fundraising | | | 1 | | | | 0 | | | | 0 | | | | 0 | | | | 0 | | | 0 |
Funding provided to support greater access by Canadians to information on political fundraising and to enhance the transparency of fundraising activities. |
Ensuring the Continued Integrity of Canada’s Federal Courts | | | 4 | | | | - | | | | - | | | | - | | | | - | | | - |
Funding provided to the Courts Administration Service to help ensure the smooth functioning of the Courts and to promote greater access to justice for all Canadians. |
Federal Action to Support the Canadian Forest Sector | | | 53 | | | | 122 | | | | 87 | | | | 0 | | | | - | | | - |
| | | | | | |
Less: projected revenues | | | - | | | | -4 | | | | -11 | | | | -12 | | | | -12 | | | -13 |
Funding provided to Natural Resources Canada and Employment and Social Development Canada to implement measures under the Softwood Lumber Action Plan. This funding will support the companies, workers and communities that depend on the softwood lumber industry. |
Freight Rail 2030 | | | - | | | | 2 | | | | 2 | | | | 2 | | | | 2 | | | 2 |
Funding provided to the Canadian Transportation Agency to implement legislative and regulatory changes related to Canada’s freight rail system. These changes will help support rail customers and deliver continued investments in the freight rail system to help it be more competitive and efficient in the long term. |
Helping Those Affected by the British Columbia Wildfires | | | 50 | | | | - | | | | - | | | | - | | | | - | | | - |
Funding provided to the Canadian Red Cross to provide emergency lodging, clean-up assistance and financial assistance to thousands of families and local businesses. |
Investing in Canada Plan | | | 30 | | | | 258 | | | | 301 | | | | 282 | | | | 252 | | | 233 |
| | | | | | |
Less: funds existing in the fiscal framework | | | - | | | | -258 | | | | -301 | | | | -282 | | | | -252 | | | -264 |
Support for the Ottawa Light Rail Transit Stage 2 Project, the Toronto Port Lands project and other infrastructure measures receiving funding announced in Budget 2017. |
Modernizing the Canada-Israel Free Trade Agreement | | | 1 | | | | 3 | | | | 3 | | | | 3 | | | | 3 | | | 3 |
A modernized Canada-Israel Free Trade Agreement provides Canadian exporters with new market access and further strengthens Canada’s bilateral commercial relationship with Israel. This measure accounts for estimated foregone tariff revenues under this agreement. |
| | |
| | | DETAILS OF ECONOMIC AND FISCAL PROJECTIONS 65 |
| | | | | | | | | | | | | | | | | | | | | | |
| | | 2017–
2018 | | | 2018–
2019 | | | 2019–
2020 | | | 2020–
2021 | | | 2021–
2022 | | | 2022–
2023 |
New Legal Framework to Strictly Regulate and Restrict Access to Cannabis | | | 59 | | | | 98 | | | | 118 | | | | 128 | | | | 143 | | | - |
| | | | | | |
Less: funds sourced from departmental resources | | | -2 | | | | -2 | | | | -2 | | | | -2 | | | | -2 | | | - |
| | | | | | |
Less: funds existing in the fiscal framework | | | -2 | | | | -5 | | | | -1 | | | | -1 | | | | -1 | | | - |
Funding provided to Health Canada, the RCMP, the Canada Border Services Agency and Public Safety Canada to ensure there is appropriate capacity to license, inspect and enforce all aspects of the proposed Cannabis Act and to undertake robust public education and awareness activities. The implementation of a cost recovery scheme under the proposed Cannabis Act will reduce the overall fiscal profile of this initiative. |
Phase I Improvement to Access To Information | | | 2 | | | | 3 | | | | 3 | | | | 3 | | | | 3 | | | 3 |
| | | | | | |
Less: funds existing in the fiscal framework | | | -1 | | | | - | | | | - | | | | - | | | | - | | | - |
Funding for Phase I of the plan to achieve the Government’s commitment to improve access to information to ensure greater transparency for Canadians. |
Providing Health Care to Refugees and Asylum Seekers | | | 54 | | | | 90 | | | | - | | | | - | | | | - | | | - |
Funding provided to Immigration, Refugees and Citizenship Canada for the Interim Federal Health Program, which provides limited, temporary health care coverage to resettled refugees and asylum claimants until they become eligible for provincial or territorial health care coverage. |
Renewal of Operation ARTEMIS | | | 16 | | | | 37 | | | | 21 | | | | 49 | | | | 9 | | | - |
| | | | | | |
Less: funds sourced from departmental resources | | | -2 | | | | - | | | | -21 | | | | -49 | | | | -9 | | | - |
Funding provided for the two-year extension of Operation ARTEMIS, the Canadian Armed Force’s mission to help stop terrorism and to make Middle Eastern waters more secure. |
Renewal of Operation IMPACT | | | 173 | | | | 198 | | | | - | | | | - | | | | - | | | - |
Funding was provided for the two-year renewal of Operation IMPACT, Canada’s military contribution to the Global Coalition against Daesh. This measure reflects Canada’s sustained support for the people of Iraq, Syria and the region as well as our commitment to promoting security, stability and peace in the Middle East. |
Restricting the Use of Administrative Segregation | | | - | | | | 13 | | | | 14 | | | | 14 | | | | 14 | | | 14 |
Funding provided to Correctional Service Canada to improve accountability, transparency and oversight of the use of administrative segregation. This funding will help ensure that the rights of at-risk inmates are protected, while maintaining the safety of staff and other inmates. |
Safe and Secure Canada 150 Celebrations | | | 3 | | | | - | | | | - | | | | - | | | | - | | | - |
Funding provided to the Parliamentary Protective Service and the RCMP for enhanced security and screening during Canada 150 celebrations. |
Strengthening and Enforcing Drug-Impaired Driving | | | 21 | | | | 27 | | | | 31 | | | | 31 | | | | 28 | | | 12 |
Funding provided to Public Safety Canada, the RCMP and the Canada Border Services Agency to implement new and stronger laws to punish more severely those who drive while under the influence of drugs, including cannabis. |
Supporting Creative Leaders Through the Creative Export Strategy | | | - | | | | 25 | | | | 25 | | | | 25 | | | | 25 | | | 25 |
Funding provided to Canadian Heritage to implement the Creative Export Strategy. This measure will support creative entrepreneurs in keeping pace with international competitors. |
Supporting the Rideau Hall Foundation | | | 3 | | | | 7 | | | | - | | | | - | | | | - | | | - |
Funding of $3 million to the Rideau Hall Foundation as a legacy gift following Governor General David Johnston’s 7-year term as Canada’s 28th Governor General. Privately raised funds by the Foundation over the next 10 years will also be matched by the Government, up to $7 million. |
Supporting Victims of Quebec Floods | | | 1 | | | | - | | | | - | | | | - | | | | - | | | - |
Funding provided to the Canadian Red Cross to help thousands of people in need by providing emergency support (such as lodging, food and clothing) and direct financial assistance. |
Tax Relief for Canadian Forces and RCMP Personnel on International Operational Missions | | | 15 | | | | 15 | | | | 15 | | | | 20 | | | | 20 | | | 25 |
Forgone revenues from amending the Income Tax Act in order to extend the deduction for Canadian Forces personnel and police deployed to international high- and moderate-risk operational missions to those deployed to all operational missions outside Canada, and increase the maximum amount deductible to the maximum rate of pay of a Lieutenant-Colonel (general service officer), effective in 2017 and subsequent years. |
| | | | | | | | | | | | | | | | | | | | | | |
| | | 2017–
2018 | | | 2018–
2019 | | | 2019–
2020 | | | 2020–
2021 | | | 2021–
2022 | | | 2022–
2023 |
Transport Canada Funding | | | 3 | | | | 10 | | | | 20 | | | | 24 | | | | 32 | | | - |
| | | | | | |
Less: projected revenues | | | - | | | | -2 | | | | -2 | | | | -11 | | | | -32 | | | - |
Funding provided to Transport Canada to fund its modernization plan and the continuation and expansion of the Canadian Ballast Water Program. This will allow the Department to respond to the Government’s priorities for a strong transportation sector and the promotion of environmentally responsible transportation. |
| | | | | | |
(Net) fiscal impact of non-announced measures² | | | 611 | | | | 114 | | | | 707 | | | | 610 | | | | 449 | | | 377 |
| | | | | | |
Net Fiscal Impact—Other Policy Actions Since Budget 2017 | | | 1,271 | | | | 611 | | | | 1,048 | | | | 747 | | | | 479 | | | 389 |
Actions to lower taxes for small business and achieve greater tax fairness | | | | | | | | | | | | | | | | | | | | | | |
| | | | | | |
Income Sprinkling | | | -50 | | | | -215 | | | | -220 | | | | -230 | | | | -235 | | | -245 |
Net fiscal impact of proposed measures to limit income sprinkling using private corporations. |
Reducing the Small Business Tax Rate to 9 Per Cent | | | -45 | | | | 90 | | | | 685 | | | | 855 | | | | 655 | | | 675 |
Net cost of proposal to lower the federal small business tax rate to 10 per cent, effective January 1, 2018, and 9 per cent effective January 1, 2019. |
Net Fiscal Impact—Actions to lower taxes for small business and achieve greater tax fairness | | | -95 | | | | -125 | | | | 465 | | | | 625 | | | | 420 | | | 430 |
Net Fiscal Impact—Total Policy Actions Since Budget 2017 | | | 1,833 | | | | 1,065 | | | | 2,074 | | | | 2,192 | | | | 1,961 | | | 2,299 |
Note: Totals may not add due to rounding.
| 1 | The Government’s spending plans are generally laid out in the annual budget. Due to operational reasons, some funding decisions may be required between budgets. Consistent with the Government’s commitment to make Government spending more open and transparent, all such “off-cycle” funding decisions taken since Budget 2017 are detailed in this table. |
| 2 | The net fiscal impact of measures that are not announced is presented at the aggregate level, and would include provisions for anticipated Cabinet decisions not yet made and funding decisions related to national security, commercial sensitivity and litigation issues. |
| | |
| | | DETAILS OF ECONOMIC AND FISCAL PROJECTIONS 67 |
SUMMARY STATEMENT OF TRANSACTIONS
Table A1.4 summarizes the Government’s projected financial position over the forecast horizon. These projections are based on the average private sector forecast for the economy discussed above.
The budgetary balance is expected to show deficits of $19.9 billion in 2017–18 and $18.6 billion in 2018–19. Over the remainder of the forecast horizon, deficits are expected to decline significantly from $17.3 billion in 2019–20 to $12.5 billion in 2022–23. The federal debt-to-GDP ratio is projected to decline gradually over the forecast horizon, reaching 28.5 per cent in 2022–23. This outlook includes new policy actions taken since Budget 2017 and the new tax measures announced in this Fall Economic Statement.
Table A1.4
Summary Statement of Transactions
billions of dollars
| | | | | | | | | | | | | | | | | | | | | | | | | | | | |
| | | | | | Projection | |
| | | 2016–
2017 | | | 2017–
2018 | | | 2018–
2019 | | | 2019–
2020 | | | 2020–
2021 | | | 2021–
2022 | | | 2022–
2023 | |
| | | | | | | |
Budgetary revenues | | | 293.5 | | | | 310.7 | | | | 323.1 | | | | 333.3 | | | | 345.3 | | | | 359.6 | | | | 371.3 | |
| | | | | | | |
Program expenses | | | 287.2 | | | | 304.9 | | | | 312.2 | | | | 319.0 | | | | 328.9 | | | | 338.6 | | | | 347.9 | |
Public debt charges | | | 24.1 | | | | 24.2 | | | | 26.6 | | | | 28.7 | | | | 30.2 | | | | 31.9 | | | | 32.8 | |
| | | | | | | |
Total expenses | | | 311.3 | | | | 329.1 | | | | 338.8 | | | | 347.7 | | | | 359.1 | | | | 370.5 | | | | 380.7 | |
Adjustment for risk | | | | | | | -1.5 | | | | -3.0 | | | | -3.0 | | | | -3.0 | | | | -3.0 | | | | -3.0 | |
| | | | | | | |
Final budgetary balance | | | -17.8 | | | | -19.9 | | | | -18.6 | | | | -17.3 | | | | -16.8 | | | | -13.9 | | | | -12.5 | |
Federal debt1 | | | 631.9 | | | | 652.8 | | | | 671.5 | | | | 688.8 | | | | 705.6 | | | | 719.5 | | | | 732.0 | |
| | | | | | | |
Per cent of GDP | | | | | | | | | | | | | | | | | | | | | | | | | | | | |
Budgetary revenues | | | 14.5 | | | | 14.5 | | | | 14.5 | | | | 14.5 | | | | 14.5 | | | | 14.5 | | | | 14.5 | |
Program expenses | | | 14.2 | | | | 14.3 | | | | 14.0 | | | | 13.9 | | | | 13.8 | | | | 13.7 | | | | 13.5 | |
Public debt charges | | | 1.2 | | | | 1.1 | | | | 1.2 | | | | 1.2 | | | | 1.3 | | | | 1.3 | | | | 1.3 | |
Budgetary balance | | | -0.9 | | | | -0.9 | | | | -0.8 | | | | -0.8 | | | | -0.7 | | | | -0.6 | | | | -0.5 | |
Federal debt | | | 31.2 | | | | 30.5 | | | | 30.2 | | | | 29.9 | | | | 29.5 | | | | 29.1 | | | | 28.5 | |
Note: Totals may not add due to rounding.
| 1 | The projected level of federal debt for 2017–18 includes an estimate of other comprehensive income. |
OUTLOOK FOR BUDGETARY REVENUES
Table A1.5
The Revenue Outlook
billions of dollars
| | | | | | | | | | | | | | | | | | | | | | | | | | | | |
| | | | | | Projection | |
| | | 2016–
2017 | | | 2017–
2018 | | | 2018–
2019 | | | 2019–
2020 | | | 2020–
2021 | | | 2021–
2022 | | | 2022–
2023 | |
| | | | | | | |
Income taxes | | | | | | | | | | | | | | | | | | | | | | | | | | | | |
Personal income tax | | | 143.7 | | | | 152.7 | | | | 161.3 | | | | 168.4 | | | | 174.8 | | | | 182.3 | | | | 189.5 | |
Corporate income tax | | | 42.2 | | | | 47.1 | | | | 47.2 | | | | 47.4 | | | | 48.4 | | | | 50.6 | | | | 52.0 | |
Non-resident income tax | | | 7.1 | | | | 7.8 | | | | 7.8 | | | | 8.2 | | | | 8.4 | | | | 8.6 | | | | 8.8 | |
Total income tax | | | 193.0 | | | | 207.6 | | | | 216.3 | | | | 224.0 | | | | 231.6 | | | | 241.6 | | | | 250.3 | |
| | | | | | | |
Excise taxes/duties | | | | | | | | | | | | | | | | | | | | | | | | | | | | |
Goods and Services Tax | | | 34.4 | | | | 36.7 | | | | 37.6 | | | | 38.6 | | | | 39.8 | | | | 41.2 | | | | 42.7 | |
Custom import duties | | | 5.5 | | | | 5.1 | | | | 5.2 | | | | 5.3 | | | | 5.4 | | | | 5.5 | | | | 5.7 | |
Other excise taxes/duties | | | 11.5 | | | | 11.7 | | | | 11.9 | | | | 12.0 | | | | 12.3 | | | | 12.4 | | | | 12.4 | |
Total excise taxes/duties | | | 51.3 | | | | 53.6 | | | | 54.6 | | | | 55.8 | | | | 57.5 | | | | 59.1 | | | | 60.8 | |
| | | | | | | |
Total tax revenues | | | 244.3 | | | | 261.2 | | | | 271.0 | | | | 279.8 | | | | 289.1 | | | | 300.7 | | | | 311.1 | |
Employment Insurance premium revenues | | | 22.1 | | | | 21.0 | | | | 22.0 | | | | 22.5 | | | | 23.3 | | | | 24.2 | | | | 25.1 | |
| | | | | | | |
Other revenues | | | | | | | | | | | | | | | | | | | | | | | | | | | | |
Enterprise Crown corporations | | | 5.7 | | | | 6.0 | | | | 6.7 | | | | 7.3 | | | | 7.8 | | | | 8.4 | | | | 8.3 | |
Other programs | | | 19.3 | | | | 20.6 | | | | 21.4 | | | | 21.4 | | | | 22.4 | | | | 23.3 | | | | 23.5 | |
Net foreign exchange | | | 2.1 | | | | 1.9 | | | | 2.1 | | | | 2.4 | | | | 2.7 | | | | 3.0 | | | | 3.2 | |
Total other revenues | | | 27.1 | | | | 28.5 | | | | 30.2 | | | | 31.0 | | | | 32.9 | | | | 34.7 | | | | 35.0 | |
| | | | | | | |
Total budgetary revenues | | | 293.5 | | | | 310.7 | | | | 323.1 | | | | 333.3 | | | | 345.3 | | | | 359.6 | | | | 371.3 | |
| | | | | | | |
Per cent of GDP | | | | | | | | | | | | | | | | | | | | | | | | | | | | |
Personal income tax | | | 7.1 | | | | 7.1 | | | | 7.2 | | | | 7.3 | | | | 7.3 | | | | 7.4 | | | | 7.4 | |
Corporate income tax | | | 2.1 | | | | 2.2 | | | | 2.1 | | | | 2.1 | | | | 2.0 | | | | 2.0 | | | | 2.0 | |
Goods and Services Tax | | | 1.7 | | | | 1.7 | | | | 1.7 | | | | 1.7 | | | | 1.7 | | | | 1.7 | | | | 1.7 | |
Total tax revenues | | | 12.0 | | | | 12.2 | | | | 12.2 | | | | 12.2 | | | | 12.1 | | | | 12.2 | | | | 12.1 | |
Employment Insurance premium revenues | | | 1.1 | | | | 1.0 | | | | 1.0 | | | | 1.0 | | | | 1.0 | | | | 1.0 | | | | 1.0 | |
Other revenues | | | 1.3 | | | | 1.3 | | | | 1.4 | | | | 1.3 | | | | 1.4 | | | | 1.4 | | | | 1.4 | |
Total budgetary revenues | | | 14.5 | | | | 14.5 | | | | 14.5 | | | | 14.5 | | | | 14.5 | | | | 14.5 | | | | 14.5 | |
Note: Totals may not add due to rounding.
Table A1.5 sets out the Government’s projection for budgetary revenues. Overall, budgetary revenues are expected to increase by 5.9 per cent in 2017–18, reflecting strong economic growth. Over the remainder of the forecast horizon, revenues are projected to grow at an average annual rate of 3.6 per cent, roughly in line with projected growth in nominal GDP.
Personal income tax revenues—the largest component of budgetary revenues—are projected to increase by $9.0 billion, or 6.3 per cent, to $152.7 billion in 2017–18. The relatively strong growth in 2017–18 reflects an improved economic outlook and the unwinding of the impact of tax planning that held down revenues in 2016–17, whereby high-income individuals recognized additional income in the 2015 tax year and lower income in the 2016 tax year when the new 33 per cent tax rate came into effect. Over the remainder of the projection period, personal income tax revenues are forecast to increase faster than growth in nominal GDP, averaging 4.4 per cent annually, reflecting the progressive nature of the income tax system combined with projected real income gains.
| | |
| | | DETAILS OF ECONOMIC AND FISCAL PROJECTIONS 69 |
Corporate income tax revenues are projected to increase by $4.9 billion, or 11.7 per cent, to $47.1 billion in 2017–18, largely as a result of higher corporate profits and the associated strength in recent financial results. Over the remainder of the projection period, corporate income tax revenues are projected to grow at an average annual rate of 2.0 per cent, less than the rate of growth in nominal GDP, reflecting the projected outlook for profit growth, anticipated use of loss carry-forwards as well as the reduction of the small business tax rate to 9 per cent.
Non-resident income tax revenues are income taxes paid by non-residents on Canadian-sourced income, notably dividends and interest payments. For 2017–18, non-resident income tax revenues are projected to increase by $0.7 billion, or 9.9 per cent, owing to the expected increase in dividend, investment and interest income of non-residents, given stronger corporate profitability. Over the remainder of the forecast horizon, they are projected to grow at an average annual rate of 2.5 per cent, in line with projected growth in dividends, interest payments and profits.
Goods and Services Tax (GST) revenues are forecast to grow by 6.9 per cent in 2017–18 based on recent financial results and strong projected growth in taxable consumption over the rest of the year. Over the remainder of the projection period, GST revenues are forecast to grow by 3.0 per cent per year on average, based on projected growth in taxable consumption.
Customs import duties are projected to decline by $0.3 billion, or 6.3 per cent, in 2017–18, partly reflecting the introduction of the Canada-European Union Comprehensive Economic and Trade Agreement. Over the remainder of the projection horizon, annual growth in customs import duties is projected to average 2.2 per cent based on the projected growth in imports.
Other excise taxes and duties are projected to increase by $0.2 billion, or 1.9 per cent, to $11.7 billion in 2017–18. Over the remainder of the projection horizon, other excise taxes and duties are expected to grow at an average annual rate of 1.2 per cent based on historical consumption trends.
EI premium revenues are projected to decline by 4.9 per cent in 2017–18 due to a reduction in the EI premium rate to $1.63 per $100 of insurable earnings as a result of the introduction of the seven-year break-even mechanism in 2017. EI premium revenues are then expected to rebound in 2018–19 as the EI premium rate increases to $1.66 per $100 of insurable earnings for 2018 (as recently announced by the Canada Employment Insurance Commission). Over the remainder of the forecast horizon, EI premium revenues are expected to continue on their upward trend based on projected growth in insurable earnings and a projected EI premium rate for 2019 of $1.65 per $100 of insurable earnings resulting from a stronger economic outlook.
Other revenues are made up of three broad components: revenues from consolidated Crown corporations; net income from enterprise Crown corporations; other program revenues from returns on investments, proceeds from the sales of goods and services, and other miscellaneous revenues; and revenues in the Exchange Fund Account.
Enterprise Crown corporation revenues are projected to increase by 5.9 per cent in 2017–18, and grow at an average annual rate of 6.7 per cent over the remainder of the forecast horizon, reflecting the outlooks presented in respective enterprise Crown corporation corporate plans.
| | | | | | | | | | | | | | | | | | | | | | | | | | | | | | | | | | | | |
| | | Employment Insurance Operating Account | | | |
| | | |
| | | Employment Insurance Operating Account Projections | | | |
| | | billions of dollars | | | | | | | | | | | | | | | | | | | | | | | | | | | | | | | | | | |
| | | | | 2016– 2017 | | | 2017– 2018 | | | 2018– 2019 | | | 2019– 2020 | | | 2020– 2021 | | | 2021– 2022 | | | 2022– 2023 | | | | | | |
| | | | | | | | | | | |
| | | EI premium revenues | | | 22.1 | | | | 21.0 | | | | 22.0 | | | | 22.5 | | | | 23.3 | | | | 24.2 | | | | 25.1 | | | | | | | |
| | | EI benefits1 | | | 20.7 | | | | 21.2 | | | | 21.3 | | | | 21.8 | | | | 22.6 | | | | 23.4 | | | | 23.9 | | | | | | | |
| | | EI administration and other expenses2 | | | 1.8 | | | | 1.8 | | | | 1.7 | | | | 1.7 | | | | 1.7 | | | | 1.7 | | | | 1.7 | | | | | | | |
| | | | | | 2016 | 3 | | | 2017 | | | | 2018 | | | | 2019 | | | | 2020 | | | | 2021 | | | | 2022 | | | | (...) 2025 | | | |
| | | EI Operating Account annual balance | | | 1.6 | | | | -1.8 | | | | -0.4 | | | | -0.4 | | | | -0.5 | | | | -0.6 | | | | -0.1 | | | | 0.4 | | | |
| | | EI Operating Account cumulative balance | | | 2.5 | | | | 0.7 | | | | 0.3 | | | | -0.2 | | | | -0.7 | | | | -1.3 | | | | -1.3 | | | | -0.5 | 4 | | |
| | | Projected premium rate (per $100 of insurable earnings) | | | 1.88 | | | | 1.63 | | | | 1.66 | | | | 1.65 | | | | 1.65 | | | | 1.65 | | | | 1.65 | | | | 1.65 | | | |
| | | 1 EI benefits include regular EI benefits, sickness, maternity, parental, compassionate care, fishing and work sharing benefits, and employment benefits and support measures. These represent about 90 per cent of total EI program expenses. 2 The remaining EI costs relate mainly to administration and are included in direct program expenses. 3 Values for 2016 are actual data. Values for 2017 and future years are a projection. 4 The EI Operating Account cumulative balance does not reach exactly zero at the end of the seven-year period as projected EI rates are rounded to the nearest whole cent per $100 of insurable earnings, in accordance with the Employment Insurance Act. | | | |
| | | |
| | | The Employment Insurance Operating Account operates within the Consolidated Revenue Fund. As such, EI-related revenues and expenses that are credited and charged to the Account, respectively, in accordance with the Employment Insurance Act, are consolidated with those of the Government, and impact the budgetary balance. For consistency with the EI premium rate, which is set on a calendar-year basis with the objective of having the Account break even over time, the annual and cumulative balances of the Account are also presented on a calendar-year basis. | | | |
| | | |
| | | The EI Operating Account is expected to record an annual deficit of $1.8 billion in 2017, and a deficit of $0.4 billion in 2018, due to a reduction in the EI premium rate as a result of the recently introduced seven-year break-even mechanism. The estimated seven-year break-even rate for 2019 is $1.65 per $100 of insurable earnings, a slight decrease from the recently announced 2018 premium rate of $1.66 per $100 of insurable earnings, reflecting a stronger economic outlook. For fiscal planning purposes, an EI premium rate of $1.65 has been applied from 2019 onwards such that the EI Operating Account achieves cumulative balance by 2025. | | | |
Other program revenues are affected by consolidated Crown corporation revenues, interest and exchange rate movements (which affect the Canadian-dollar value of foreign-denominated assets), and flow-through items that give rise to an offsetting expense and therefore do not impact the budgetary balance. These revenues are projected to increase by 6.8 per cent in 2017–18. Over the remainder of the projection period, other program revenues are projected to increase at an average annual rate of only 2.7 per cent, reflecting a reduction in spectrum auction revenues after 2018–19 and the outlooks presented in consolidated Crown corporation corporate plans.
| | |
| | | DETAILS OF ECONOMIC AND FISCAL PROJECTIONS 71 |
Net foreign exchange revenues, which consist mainly of returns on investments held in the Exchange Fund Account, are volatile and sensitive to fluctuations in foreign exchange rates and foreign interest rates. These revenues are expected to decrease in 2017–18 by 11.4 per cent, due in large part to significant one-time gains on the sale of investments in the Exchange Fund Account in 2016–17, which are not expected to reoccur. Over the remainder of the projection period, net foreign exchange revenues are projected to grow at an average annual rate of 11.3 per cent, reflecting a projected increase in interest rates and the anticipated appreciation in the Canadian dollar by private sector forecasters.
OUTLOOK FOR PROGRAM EXPENSES
Table A1.6
The Program Expense Outlook
| | | | | | | | | | | | | | | | | | | | | | | | | | | | |
| billions of dollars | | | | | | | | | | | | | | | | | | | | | |
| | | | | | Projection | |
| | | 2016–
2017 | | | 2017–
2018 | | | 2018–
2019 | | | 2019–
2020 | | | 2020–
2021 | | | 2021–
2022 | | | 2022–
2023 | |
| | | | | | | |
Major transfers to persons | | | | | | | | | | | | | | | | | | | | | | | | | | | | |
Elderly benefits | | | 48.2 | | | | 50.9 | | | | 53.7 | | | | 56.7 | | | | 59.9 | | | | 63.3 | | | | 66.9 | |
Employment Insurance benefits1 | | | 20.7 | | | | 21.2 | | | | 21.3 | | | | 21.8 | | | | 22.6 | | | | 23.4 | | | | 23.9 | |
Children’s benefits | | | 22.1 | | | | 23.2 | | | | 23.5 | | | | 23.8 | | | | 24.2 | | | | 24.7 | | | | 25.2 | |
Total | | | 90.9 | | | | 95.4 | | | | 98.5 | | | | 102.3 | | | | 106.7 | | | | 111.4 | | | | 116.0 | |
| | | | | | | |
Major transfers to other levels of government | | | | | | | | | | | | | | | | | | | | | | | | | | | | |
Canada Health Transfer | | | 36.1 | | | | 37.1 | | | | 38.6 | | | | 40.3 | | | | 41.8 | | | | 43.3 | | | | 44.9 | |
Canada Social Transfer | | | 13.3 | | | | 13.7 | | | | 14.2 | | | | 14.6 | | | | 15.0 | | | | 15.5 | | | | 15.9 | |
Equalization | | | 17.9 | | | | 18.3 | | | | 19.0 | | | | 19.8 | | | | 20.5 | | | | 21.3 | | | | 22.0 | |
Territorial Formula Financing | | | 3.6 | | | | 3.7 | | | | 3.8 | | | | 3.8 | | | | 3.9 | | | | 4.1 | | | | 4.2 | |
Gas Tax Fund2 | | | 2.1 | | | | 2.1 | | | | 2.2 | | | | 2.2 | | | | 2.2 | | | | 2.3 | | | | 2.3 | |
Home care and mental health3 | | | 0.0 | | | | 0.3 | | | | 0.9 | | | | 1.1 | | | | 1.3 | | | | 1.5 | | | | 1.2 | |
Other fiscal arrangements4 | | | -4.3 | | | | -4.8 | | | | -4.9 | | | | -5.2 | | | | -5.4 | | | | -5.7 | | | | -5.9 | |
Total | | | 68.7 | | | | 70.4 | | | | 73.6 | | | | 76.5 | | | | 79.2 | | | | 82.1 | | | | 84.5 | |
| | | | | | | |
Direct program expenses | | | | | | | | | | | | | | | | | | | | | | | | | | | | |
Transfer payments | | | 41.6 | | | | 47.8 | | | | 48.4 | | | | 48.3 | | | | 49.3 | | | | 50.1 | | | | 50.6 | |
Capital amortization5 | | | 5.3 | | | | 5.7 | | | | 5.8 | | | | 6.1 | | | | 6.5 | | | | 6.8 | | | | 7.4 | |
Operating expenses | | | 80.7 | | | | 85.7 | | | | 85.9 | | | | 85.8 | | | | 87.1 | | | | 88.2 | | | | 89.3 | |
Total | | | 127.6 | | | | 139.1 | | | | 140.1 | | | | 140.2 | | | | 142.9 | | | | 145.1 | | | | 147.3 | |
| | | | | | | |
Total program expenses | | | 287.2 | | | | 304.9 | | | | 312.2 | | | | 319.0 | | | | 328.9 | | | | 338.6 | | | | 347.9 | |
Per cent of GDP | | | | | | | | | | | | | | | | | | | | | | | | | | | | |
Major transfers to persons | | | 4.5 | | | | 4.5 | | | | 4.4 | | | | 4.4 | | | | 4.5 | | | | 4.5 | | | | 4.5 | |
Major transfers to other levels of government | | | 3.4 | | | | 3.3 | | | | 3.3 | | | | 3.3 | | | | 3.3 | | | | 3.3 | | | | 3.3 | |
Direct program expenses | | | 6.3 | | | | 6.5 | | | | 6.3 | | | | 6.1 | | | | 6.0 | | | | 5.9 | | | | 5.7 | |
Total program expenses | | | 14.2 | | | | 14.3 | | | | 14.0 | | | | 13.9 | | | | 13.8 | | | | 13.7 | | | | 13.5 | |
Note: Totals may not add due to rounding.
| 1 | EI benefits include regular EI benefits, sickness, maternity, parental, compassionate care, fishing and work-sharing benefits, and employment benefits and support measures. These represent 90 per cent of total EI program expenses. The remaining EI costs relate mainly to administration and are part of operating expenses. |
| 2 | The Gas Tax Fund is a component of the Community Improvement Fund. |
| 3 | Funds for home care and mental health were originally classified as direct program transfer payments in Budget 2017. |
| 4 | Other fiscal arrangements include the Youth Allowances Recovery; Alternative Payments for Standing Programs, which represent a recovery from Quebec of a tax point transfer; statutory subsidies; payments under the 2005 Offshore Arrangements; and established terms for repayable floor loans. |
| 5 | This includes the capital amortization of consolidated Crown corporations and other consolidated entities. |
Table A1.6 provides an overview of the projections for program expenses by major component. Program expenses consist of major transfers to persons, major transfers to other levels of government and direct program expenses.
Major transfers to persons are projected to increase from $95.4 billion in 2017–18 to $116.0 billion in 2022–23. Major transfers to persons consist of elderly, EI and children’s benefits.
Elderly benefits, which are comprised of Old Age Security, Guaranteed Income Supplement and Allowance payments to qualifying seniors, are projected to grow from $50.9 billion in 2017–18 to $66.9 billion in 2022–23, or approximately 5.6 per cent per year. The expected increase in elderly benefits is due to projected consumer price inflation, to which benefits are fully indexed, and a projected increase in the population of seniors.
EI benefits are projected to increase by 2.5 per cent to $21.2 billion in 2017–18. This growth is in line with year-to-date results and the growth in average weekly benefits. Over the remainder of the projection period, EI benefits are projected to grow moderately, averaging 2.4 per cent annually as gains in average weekly benefits are largely offset by the expected improvement in the labour market.
Children’s benefits are projected to rise from $23.2 billion in 2017–18 to $25.2 billion in 2022–23, or approximately 1.6 per cent annually, largely reflecting the indexation of benefits beginning in 2018–19.
Major transfers to other levels of government, which include the Canada Health Transfer (CHT), the Canada Social Transfer (CST), Equalization, Territorial Formula Financing and the Gas Tax Fund, among others, are expected to increase over the forecast horizon, from $70.4 billion in 2017–18 to $84.5 billion in 2022–23.
The CHT is projected to grow from $37.1 billion in 2017–18 to $44.9 billion in 2022–23. The CHT grows in line with a three-year moving average of nominal GDP growth, with funding guaranteed to increase by at least 3.0 per cent per year. The CST is legislated to grow at 3.0 per cent per year. Gas Tax Fund payments are indexed at 2.0 per cent per year, with increases applied in $100 million increments. Announced in Budget 2017, home care and mental health transfers in support of provincial and territorial home care and mental health initiatives will grow from $0.3 billion in 2017–18 to $1.2 billion in 2022–23.
Direct program expenses are projected to rise to $139.1 billion in 2017–18 and further to $147.3 billion in 2022–23. Direct program expenses include operating expenses, transfer payments administered by departments and capital amortization.
The projected increase in direct program expenses is driven by an increase in transfer payments administered by departments over the forecast horizon, including transfers to provincial, municipal and Aboriginal governments and post-secondary institutions for investment in infrastructure. The increase in transfer payments also reflects enhancements to the Working Income Tax Benefit. Overall, transfer payments are projected to increase from $47.8 billion in 2017–18 to $50.6 billion in 2022–23.
Operating expenses reflect the cost of doing business for more than 100 government departments and agencies. Operating expenses are projected to increase from $85.7 billion in 2017–18 to $89.3 billion in 2022–23 due in part to measures announced in, and since, Budget 2017 and ordinary growth in operating expenses, mitigated by falling expenses related to pensions and employee future benefits due to the projected rise in long-term interest rates.
| | |
| | | DETAILS OF ECONOMIC AND FISCAL PROJECTIONS 73 |
Capital amortization is expected to increase from $5.7 billion in 2017–18 to $7.4 billion in 2022–23 as a result of recent and planned investments and upgrades to existing federal capital.
|
Budget and Estimates Alignment: Greater Clarity on Government Spending |
| |
| In the Fall Economic Statement of 2016, the Government proposed reforms to the Estimates process including changing the date when the Main Estimates are tabled in order to increase transparency and accountability. Upon the recommendation of the Standing Committee on Government Operations and Estimates, in June 2017, the House of Commons agreed to change its Standing Orders so that the tabling of the Main Estimates for the next two years can take place in April rather than in early March. This will ensure that more budget initiatives can be included in the Main Estimates on which Parliamentarians will vote. To this end, the Government will propose amendments to the Financial Administration Act in an upcoming bill. |