Exhibit D
DESCRIPTION OF CANADA
Table of Contents
| | | | |
| | | Page | |
| |
General Information | | | 3 | |
The Canadian Economy | | | 5 | |
External Trade | | | 11 | |
Balance of Payments | | | 13 | |
Foreign Exchange and International Reserves | | | 15 | |
Government Finances | | | 16 | |
Debt Record | | | 25 | |
Monetary and Banking System | | | 26 | |
Claims and Other | | | 31 | |
Tables and Supplementary Information | | | 32 | |
Unless otherwise indicated, dollar amounts hereafter in this document are expressed in Canadian dollars. On December 13, 2019, the daily average rate of the Bank of Canada for conversion of Canadian dollars (“$”) to United States dollars (“U.S.$”) was USD 1.00 = CAD 1.3183.
2
Certain information contained in the Exhibit has been extracted or compiled from public official documents of Canada, which include statistical data subject to revision. Canada is sometimes referred to as the “Government of Canada” or the “Government” in this Exhibit.
CANADA
GENERAL INFORMATION
Area and Population
Canada is the second largest country in the world, with an area of 9,984,670 square kilometers of which about 891,163 square kilometers are covered by fresh water. The occupied farm land is about 7% and the commercial forest land is about 30% of the total area. The population on July 1, 2019 was estimated to be 37.6 million. Over two thirds of Canada’s population lives in metropolitan areas of which Toronto, Montreal and Vancouver are the largest. Most of Canada’s population lives within 200 kilometers of the United States border.
Form of Government
Canada is a federal state composed of ten provinces and three territories. In 1867, the United Kingdom Parliament adopted the British North America Act, which established the Canadian federation comprised of, at that time, the Provinces of Ontario, Québec, Nova Scotia and New Brunswick. Since then, six additional provinces (Manitoba, British Columbia, Prince Edward Island, Saskatchewan, Alberta and Newfoundland and Labrador), along with the Yukon Territory, the Northwest Territories and the territory of Nunavut (which was carved out of the Northwest Territories on April 1, 1999), have become parts of Canada.
The British North America Act (which has been renamed the Constitution Act, 1867) gave the Parliament of Canada legislative power in relation to a number of matters including all matters not assigned exclusively to the legislatures of the provinces. These powers now include matters such as defense, the raising of money by any mode or system of taxation, the regulation of trade and commerce, the public debt, money and banking, interest, bills of exchange and promissory notes, navigation and shipping, extra-provincial transportation, aerial navigation and, with some exceptions, telecommunications. The provincial legislatures have exclusive jurisdiction in such areas as education, municipal institutions, property and civil rights, administration of justice, direct taxation for provincial purposes and other matters of purely provincial or local concern.
The executive power of the federal Government is vested in the Queen, represented by the Governor General, whose powers are exercised on the advice of the federal Cabinet, which is responsible to the House of Commons. The legislative branch at the federal level, Parliament, consists of the Crown, the Senate and the House of Commons. The Senate has 105 seats. There are 24 seats each for the Maritime Provinces (Prince Edward Island, Nova Scotia and New Brunswick), Québec, Ontario and the Western Provinces (Manitoba, Saskatchewan, Alberta and British Columbia), six for Newfoundland and Labrador and one each for the three territories (Nunavut, Northwest Territories and Yukon). Senators are appointed by the Governor General on the advice of the federal Cabinet and hold office until age 75. The House of Commons has 338 members, elected by voters in single-member constituencies. The leader of the political party that gains the most seats in each general election is usually invited by the Governor General to be Prime Minister and to form the Government. The Prime Minister selects the members of the federal Cabinet from among the members of the House of Commons and the Senate (in practice almost entirely from the former). The House of Commons is elected for a period of five years. Since May 2007, the Canada Elections Act requires that a general election be held on a fixed date: the third Monday of October in the fourth calendar year following the previous general election. However, the law does not prevent the Governor General from dissolving Parliament at another date. The date of a general election is set by the Governor in Council.
The most recent general election was held on October 21, 2019. As a result of that election the Liberal Party of Canada formed the Government. As of December 6, 2019, the distribution of seats in the House of Commons is as follows: the Liberal Party of Canada has 157 seats, the Conservative Party of Canada has 121 seats, the Bloc Québécois has 32 seats, the New Democratic Party has 24 seats, and the Green Party of Canada has three seats. There is one independent seat.
The executive power in each province is vested in the Lieutenant Governor, appointed by the Governor General on the advice of the federal Cabinet. The Lieutenant Governor’s powers are exercised on the advice of the provincial cabinet, which is responsible to the legislative assembly. Each provincial legislature is composed of a Lieutenant Governor and a legislative assembly and, depending on the province, members of provincial legislative assemblies are elected for four or five years. The practice of selecting the provincial premier and the provincial cabinet in each province follows that described for the federal level, as does dissolution of a legislature.
The judicial branch of government in Canada is composed of an integrated set of courts created by federal and provincial law. At the federal level there are two principal courts, the Supreme Court of Canada which is the highest appeal court in Canada and the Federal Court of Canada which, among other things, deals with federal revenue laws and claims involving the Government. Judges of the two federally constituted courts and those of the provincial superior and county courts are appointed by the Governor General on the advice of the federal Cabinet and hold office during good behavior until age 70 or 75. Judges of the magistrates courts (commonly known as provincial courts) are appointed by the provincial government and usually hold office until age 65 or 70.
3
Constitutional Reform
In April 1982, Her Majesty the Queen proclaimed the Constitution Act, 1982, terminating British legislative jurisdiction over Canada’s Constitution. The Constitution Act, 1982 provides that Canada’s Constitution may be amended pursuant to an amending formula contained therein and contains the Canadian Charter of Rights and Freedoms, including the linguistic rights of Canada’s two major language groups.
The government of Québec did not sign the constitutional agreement which led to the repatriation of the Canadian Constitution and the proclamation of the Constitution Act, 1982. Although Québec is legally bound by the Constitution Act, 1982, the government of Québec set out five conditions for accepting the legal legitimacy of the Act. Discussions on those principles led on April 30, 1987 at Meech Lake to a unanimous agreement by First Ministers on principles respecting each of Québec’s conditions.
A constitutional resolution to give effect to the Meech Lake Accord was adopted by Parliament and eight provinces before the deadline for ratification on June 23, 1990. In the absence of ratification by Newfoundland and Manitoba, the amendment was not adopted. In the wake of this event, the most extensive series of public consultations on constitutional matters ever to occur in Canada began through the work of both provincial and federal commissions and committees, among other things. Recommendations produced by this process were then assessed by a series of multilateral negotiations involving the federal, provincial and territorial governments and four national Aboriginal organizations, held from April to July 1992. Agreement was reached on a wide range of constitutional issues through the multilateral process which led to a First Ministers’ Conference held in Charlottetown in August 1992.
The Charlottetown Accord was an extensive package of reforms agreed upon by the federal, provincial and territorial governments and the four Aboriginal organizations. On October 26, 1992, Canadians were asked in a referendum if they agreed that the Constitution of Canada should be renewed on the basis of the Charlottetown agreement. A majority of Canadians in a majority of the provinces, including a majority in Québec and a majority of Status Indians living on reserves, declined to provide such a mandate. Consequently, governments set aside the constitutional issue and announced their intention to concentrate on social and economic initiatives that do not require constitutional change.
Québec
In September 1994, the Parti Québécois was elected, and its platform called for Québec’s accession to independence. On October 30, 1995, the government of Québec held a consultative referendum under provincial law, seeking a mandate to secede from Canada and proclaim Québec’s independence, after having made a formal offer of a new economic and political partnership between Québec and the rest of Canada. The government’s proposal was rejected by a vote of 50.6% against and 49.4% in favour, with a participation rate of 93%. While all sides accepted the 1995 referendum results, the Parti Québécois has not abandoned the goal of achieving independence for Québec.
In September 1996, the Government of Canada referred a series of legal questions to the Supreme Court of Canada with a view to clarifying, at both domestic and international law, whether the government of Québec has the right to secede from Canada unilaterally. On August 20, 1998, the Supreme Court rendered judgment, ruling that the government of Québec cannot, under either the Constitution of Canada or international law, legally effect the unilateral secession of Québec from Canada. The Supreme Court also stated that, if a clear majority of Québecers were to clearly and unambiguously express their will to secede, the federal and provincial governments in Canada would then have a constitutional obligation to enter into negotiations to address the potential act of secession as well as its possible terms should, in fact, secession proceed.
On June 29, 2000, the Government of Canada enacted a law to give effect to the requirement for clarity set out in the opinion of the Supreme Court. That law requires the House of Commons to assess, prior to any future referendum on the secession of a province, whether the referendum question made clear that the province would cease to be part of Canada and become an independent country. The law further requires that, after the vote itself, the House of Commons also assess whether there appeared to be a clear majority in support of the question. Only if both these conditions were met would the Government of Canada be authorized to enter into negotiations which might lead to the constitutional amendments required to effect secession.
In the provincial election of October 1, 2018, the Coalition avenir Québec party was elected, replacing the Quebec Liberal Party which had been in power (majority) since April 2014, and formed a majority government having obtained 74 out of 125 seats in Quebec’s National Assembly (37.4% of the votes cast), as compared to 31 seats (24.8% of the votes cast) for the official opposition Quebec Liberal Party, ten seats (17.1% of the votes cast) for the Parti Québécois party and ten seats (16.1% of the votes cast) for the Québec solidaire party.
4
THE CANADIAN ECONOMY1
General
The key economic indicators for the Canadian economy and the Government of Canada consolidated statement of operations and accumulated deficit are presented in the following tables.
KEY ECONOMIC INDICATORS
| | | | | | | | | | | | | | | | | | | | | | | | | | | | | | | | |
| | | For the 2019 quarter ended
(year-over-year) | | | | |
| | | September | | | June | | | March | | | 2018 | | | 2017 | | | 2016 | | | 2015 | | | 2014 | |
Real GDP annual percentage change (1) | | | 1.7 | | | | 1.9 | | | | 1.5 | | | | 2.0 | | | | 3.2 | | | | 1.0 | | | | 0.7 | | | | 2.9 | |
Nominal GDP annual percentage change (2) | | | 3.1 | | | | 3.8 | | | | 2.6 | | | | 3.9 | | | | 5.7 | | | | 1.8 | | | | -0.2 | | | | 4.9 | |
GDP Implicit Price Index (2)(3) | | | 1.4 | | | | 1.9 | | | | 1.1 | | | | 1.8 | | | | 2.5 | | | | 0.7 | | | | -0.8 | | | | 1.9 | |
Consumer Price Index (total items) (3)(4) | | | 1.9 | | | | 2.1 | | | | 1.6 | | | | 2.3 | | | | 1.6 | | | | 1.4 | | | | 1.1 | | | | 2.0 | |
Industrial Product Price Index (3) | | | -1.3 | | | | 0.1 | | | | 1.2 | | | | 3.9 | | | | 3.1 | | | | -0.2 | | | | -0.8 | | | | 2.5 | |
Unemployment Rate (percent) (5) | | | 5.6 | | | | 5.5 | | | | 5.8 | | | | 5.8 | | | | 6.3 | | | | 7.0 | | | | 6.9 | | | | 6.9 | |
Trade Balance (in millions of dollars) | | | -7,998 | | | | -5,583 | | | | -14,353 | | | | -43,564 | | | | -47,376 | | | | -47,776 | | | | -49,066 | | | | -18,064 | |
Source: Statistics Canada.
| (1) | At market prices, chained 2012 dollars, and seasonally adjusted. |
| (3) | Annual percentage changes. |
| (4) | Year-over-year growth rates for CPI are not based on seasonally adjusted data. |
| (5) | Unemployment levels are calculated using the difference between labor force and employment for the quarters. |
GOVERNMENTOF CANADA – CONSOLIDATED STATEMENTOF OPERATIONSAND ACCUMULATED DEFICIT
(in millions of dollars)
| | | | | | | | | | | | | | | | | | | | |
| | | For the years ended March 31, | |
| | | 2019 | | | 2018 | | | 2017 | | | 2016 | | | 2015 | |
Total Revenues | | | 332,218 | | | | 311,216 | | | | 290,868 | | | | 292,608 | | | | 279,905 | |
Total Program Expenses | | | 322,916 | | | | 308,288 | | | | 288,593 | | | | 273,632 | | | | 256,248 | |
Public Debt Charges | | | 23,266 | | | | 21,889 | | | | 21,232 | | | | 21,837 | | | | 24,207 | |
Total Expenses | | | 346,182 | | | | 330,177 | | | | 309,825 | | | | 295,469 | | | | 280,455 | |
Annual Deficit | | | -13,964 | | | | -18,961 | | | | -18,957 | | | | -2,861 | | | | -550 | |
Accumulated Deficit at End of Year | | | -685,450 | | | | -671,254 | | | | -651,540 | | | | -634,440 | | | | -628,910 | |
Source: Public Accounts of Canada 2019 (Volume 1, Table 1.1).
Note: see page 18 for additional details and information.
| 1 | Quarterly and semi-annual figures or changes are based upon seasonally adjusted data, except where otherwise indicated. All percentage changes are compounded at annual rates. For percentage changes over more than one year, the method of computation includes growth over the entire period indicated. Unless otherwise specified, all growth rates on page 7 are calculated using real GDP at basic prices, constant 2012 dollars. |
The chart below shows the distribution of real gross domestic product (“GDP”) at basic prices (2012 constant dollars) in 2018, which is indicative of the structure of the economy.
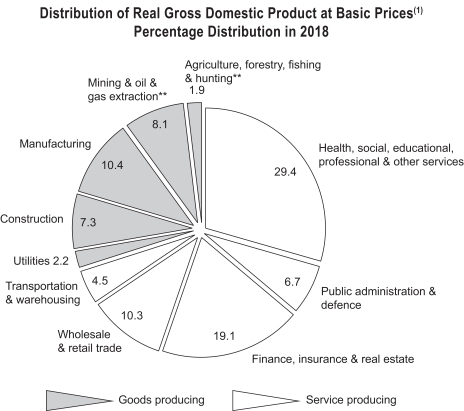
Source: Statistics Canada, Gross Domestic Product by Industry.
Note: Total may not add to 100% due to rounding and rebasing.
| (1) | GDP is a measure of production originating within the geographic boundaries of Canada, regardless of whether factors of production are Canadian or non-resident owned, whereas gross national product (“GNP”) measures the value of Canada’s total production of goods and services – that is, the earnings of all Canadian owned factors of production. Quantitatively, GDP is obtained from GNP by adding investment income paid to non-residents and deducting investment income received from non-residents. GDP at basic prices represents the value added by each of the factors of production and is equivalent to GDP at market prices less net taxes on products. These differences can cause discrepancies in levels and growth rates of GDP at basic prices on pages 5 and 6 and GDP at market prices on pages 7 and 8. |
| ** | The agriculture, forestry, fishing, and hunting; and mining and oil and gas extraction sectors both include support activities. |
The volume of industry and sector output in the following discussion provides “constant dollar” measures of the contribution of each industry to GDP at basic prices. The share of service-producing industries in real GDP was 70.0% in 2018 while the remaining 30.0% was attributed to goods-producing industries.
5
The following table shows the composition of Canada’s real GDP at basic prices (2012 constant dollars) by sector in 2018 and over the 2014-2018 period.
REAL GROSS DOMESTIC PRODUCT AT BASIC PRICES BY INDUSTRY
| | | | | | | | | | | | | | | | | | | | | | | | | | | | | | | | | | | | |
| | | (For the years ended December 31,) | |
| | | 2018 | | | 2017 | | | 2016 | | | 2015 | | | 2014 | | | 2009 | | | 2018 | | | 2014 | | | 2009 | |
| | | (millions of 2012 dollars) | | | (percentage distribution(3)) | |
| | | | | | | | | | | | | | | | | | | | | | | | | | | | |
Agriculture (1) | | | 32,696 | | | | 32,167 | | | | 31,698 | | | | 29,472 | | | | 27,843 | | | | 24,841 | | | | 1.7 | | | | 1.5 | | | | 1.6 | |
Forestry, fishing and hunting | | | 5,078 | | | | 5,099 | | | | 5,179 | | | | 5,520 | | | | 5,553 | | | | 4,356 | | | | 0.3 | | | | 0.3 | | | | 0.3 | |
Mining and oil and gas extraction | | | 158,617 | | | | 149,621 | | | | 137,737 | | | | 138,548 | | | | 141,409 | | | | 107,584 | | | | 8.1 | | | | 7.8 | | | | 6.8 | |
Manufacturing | | | 201,832 | | | | 196,503 | | | | 188,847 | | | | 189,177 | | | | 187,893 | | | | 167,055 | | | | 10.4 | | | | 10.4 | | | | 10.6 | |
Construction | | | 142,842 | | | | 141,275 | | | | 135,332 | | | | 141,540 | | | | 144,292 | | | | 112,031 | | | | 7.3 | | | | 8.0 | | | | 7.1 | |
Utilities | | | 43,155 | | | | 42,284 | | | | 41,355 | | | | 40,378 | | | | 40,238 | | | | 37,605 | | | | 2.2 | | | | 2.2 | | | | 2.4 | |
Transportation and warehousing | | | 88,165 | | | | 85,495 | | | | 81,232 | | | | 79,273 | | | | 77,026 | | | | 65,292 | | | | 4.5 | | | | 4.3 | | | | 4.2 | |
Wholesale and retail trade | | | 201,562 | | | | 199,375 | | | | 189,088 | | | | 185,806 | | | | 188,886 | | | | 158,459 | | | | 10.3 | | | | 10.5 | | | | 10.1 | |
Finance, insurance and real estate | | | 371,979 | | | | 365,241 | | | | 355,491 | | | | 345,895 | | | | 333,824 | | | | 288,915 | | | | 19.1 | | | | 18.5 | | | | 18.4 | |
Public administration | | | 130,451 | | | | 126,781 | | | | 124,344 | | | | 122,186 | | | | 121,392 | | | | 117,970 | | | | 6.7 | | | | 6.7 | | | | 7.5 | |
Health, social, educational, professional and other services | | | 573,210 | | | | 559,641 | | | | 549,311 | | | | 542,231 | | | | 535,280 | | | | 488,060 | | | | 29.4 | | | | 29.7 | | | | 31.0 | |
| | | | | | | | | | | | | | | | | | | | | | | | | | | | | | | | | | | | |
Total (2) | | | 1,949,587 | | | | 1,903,482 | | | | 1,839,614 | | | | 1,820,026 | | | | 1,803,636 | | | | 1,572,167 | | | | 100.0 | | | | 100.0 | | | | 100.0 | |
| | | | | | | | | | | | | | | | | | | | | | | | | | | | | | | | | | | | |
Source: Statistics Canada, Industry Accounts Division.
| (1) | Agriculture includes support activities for agriculture, forestry, fishing and hunting. |
| (2) | May not add to total due to rounding. |
| (3) | May not add to total due to rebasing. |
The share of service-producing industries in real GDP at basic prices decreased from 71.2% in 2009 to 70.0% in 2018, though this share was higher in 2009 partly due to the negative impact of the global financial crisis on goods-producing industries. The fastest growing industry in the services sector has been transportation and warehousing, which grew at an average annual growth rate of 3.4% between 2009 and 2018, compared to an average annual growth rate of 2.2% for total service sector real GDP at basic prices (2012 constant dollars). The goods-producing sector constituted 30.0% of real GDP at basic prices in 2018, up from 28.8% in 2009. The increase was most evident in mining and oil and gas extraction, with its share increasing from 6.8% in 2009 to 8.1% in 2018, as activity in this industry recovered following the financial crisis.
Real GDP at market prices grew by 2.9% in 2014, 0.7% in 2015, 1.0% in 2016, 3.2% in 2017 and 2.0% in 2018. The rebound since mid-2016 has been supported by stronger household consumption and investment. Canada’s real GDP registered year-over-year growth of 1.5%, 1.9% and 1.7% in the first three quarters of 2019, respectively.
Manufacturing was the largest goods-producing industry in Canada by GDP in 2018. Manufacturing output increased by 3.0% in 2014, 0.7% in 2015, then fell by 0.2% in 2016. In 2017 and 2018, manufacturing output rose by 4.1% and 2.7%, respectively. Growth in manufacturing output from 2014 to 2018 was the highest in electrical equipment, appliance and component manufacturing (a 27.1% increase), miscellaneous manufacturing (a 15.5% increase) and computer and electronic product manufacturing (a 15.2% increase) sectors. In 2019, the year-over-year growth in manufacturing output increased 1.3% in the first quarter and by 1.0% in the second quarter, followed by a loss of 0.4% in the third quarter.
Mining and oil and gas extraction was the second largest goods-producing industry by GDP in 2018. Output from mining and oil and gas extraction rose 7.9% in 2014, followed by declines of 2.0% and 0.6% in 2015 and 2016, respectively. In 2017, output from mining and oil and gas extraction rose 8.6%, followed by an increase of 6.0% in 2018. Over the 2014-2018 period, the sector’s real GDP increased by 12.2%, as oil and gas, which makes up almost 70% of the sector, increased by 21.3%. Mining and quarrying activities increased by 13.1%, while support activities for mining and oil and gas extraction decreased by 45.1% over the 2014-2018 period. On a year-over-year basis, output growth in the mining and oil and gas extraction sector decreased 2.2% in the first quarter of 2019, followed by an increase of 1.5% in the second quarter and a decrease of 4.6% in the third quarter.
The construction sector was the third largest goods-producing sector in Canada in 2018. Construction output increased by 2.5% in 2014, before falling 1.9% and 4.4% in 2015 and 2016, respectively. Construction output then gained 4.4% in 2017 and 1.1% in 2018. Construction growth from 2014 to 2018 was led by residential building construction and repair construction, which increased by 8.8% and 8.7%, respectively. Engineering and other construction activities declined 21.6% and non-residential building construction fell 7.5% over the same period. Overall construction output decreased on a year-over-year basis by 3.5% in the first quarter of 2019 and 2.5% in the second quarter, then rose 1.3% in the third quarter.
Although the share of agricultural output2 in total real GDP was only 1.7% in 2018, agriculture is a significant contributor to foreign exchange earnings. Wheat is Canada’s principal agricultural crop and one of its largest export products by value. The wheat crop was 29.4 million tonnes in 2014, 27.6 tonnes in 2015, 32.1 million tonnes in 2016, 30.4 million tonnes in 2017 and 32.2 million tonnes in 2018. Statistics Canada estimates wheat production will be 32.5 million tonnes in 2019.
| 2 | Agriculture includes support activities for agriculture and forestry, fishing and hunting. |
6
Gross Domestic Income and Expenditure3
Nominal GDP at market prices was about $2.2 trillion in 2018. Nominal GDP growth was 4.9% in 2014. After edging down 0.2% in 2015, nominal GDP returned to growth of 1.8% in 2016, 5.7% in 2017 and 3.9% in 2018. On a year-over-year basis, nominal GDP grew at 2.6%, 3.8% and 3.1% in each of the first three quarters of 2019, respectively.
GROSS DOMESTIC INCOME AND EXPENDITURE
| | | | | | | | | | | | | | | | | | | | | | | | | | | | |
| | | First 3 quarters (1) | | | For the years ended December 31, | |
| | | 2019 | | | 2018 | | | 2018 | | | 2017 | | | 2016 | | | 2015 | | | 2014 | |
| | | (millions of dollars) | |
Income | | | | | | | | | | | | | | | | | | | | | | | | | | | | |
Compensation of employees | | | 1,163,208 | | | | 1,115,381 | | | | 1,120,520 | | | | 1,069,956 | | | | 1,026,483 | | | | 1,026,846 | | | | 998,463 | |
Gross operating surplus | | | 600,404 | | | | 593,939 | | | | 590,510 | | | | 573,257 | | | | 526,024 | | | | 505,167 | | | | 557,244 | |
Gross mixed income | | | 275,347 | | | | 263,820 | | | | 265,147 | | | | 256,757 | | | | 244,403 | | | | 235,365 | | | | 227,166 | |
Taxes less subsidies and residual error | | | 253,685 | | | | 248,849 | | | | 247,679 | | | | 241,137 | | | | 228,625 | | | | 223,063 | | | | 212,025 | |
| | | | | | | | | | | | | | | | | | | | | | | | | | | | |
Gross Domestic Income | | | 2,292,644 | | | | 2,221,989 | | | | 2,223,856 | | | | 2,141,107 | | | | 2,025,535 | | | | 1,990,441 | | | | 1,994,898 | |
| | | | | | | | | | | | | | | | | | | | | | | | | | | | |
Expenditure | | | | | | | | | | | | | | | | | | | | | | | | | | | | |
Final consumption expenditure | | | 1,810,017 | | | | 1,746,672 | | | | 1,754,326 | | | | 1,684,563 | | | | 1,610,954 | | | | 1,566,215 | | | | 1,517,376 | |
Household final consumption | | | 1,290,791 | | | | 1,250,988 | | | | 1,255,327 | | | | 1,208,438 | | | | 1,153,668 | | | | 1,122,079 | | | | 1,086,253 | |
Government final consumption | | | 484,524 | | | | 462,656 | | | | 465,792 | | | | 444,149 | | | | 426,335 | | | | 415,561 | | | | 404,297 | |
Non-profit institution final consumption | | | 34,703 | | | | 33,028 | | | | 33,207 | | | | 31,976 | | | | 30,951 | | | | 28,575 | | | | 26,826 | |
Gross fixed capital formation | | | 508,032 | | | | 503,485 | | | | 501,247 | | | | 486,760 | | | | 461,262 | | | | 474,732 | | | | 486,542 | |
Business gross fixed capital formation | | | 415,239 | | | | 411,848 | | | | 409,835 | | | | 401,686 | | | | 382,196 | | | | 395,432 | | | | 410,591 | |
Residential structures | | | 165,785 | | | | 166,741 | | | | 165,833 | | | | 165,379 | | | | 154,961 | | | | 143,946 | | | | 135,230 | |
Non-residential structures and machinery and equipment | | | 211,212 | | | | 206,075 | | | | 204,996 | | | | 199,000 | | | | 190,851 | | | | 214,697 | | | | 235,764 | |
Intellectual property product | | | 38,241 | | | | 39,032 | | | | 39,006 | | | | 37,307 | | | | 36,384 | | | | 36,789 | | | | 39,597 | |
Government gross fixed capital formation | | | 90,407 | | | | 89,308 | | | | 89,087 | | | | 82,784 | | | | 76,854 | | | | 76,344 | | | | 72,806 | |
Non-profit institution gross fixed capital formation | | | 2,387 | | | | 2,329 | | | | 2,325 | | | | 2,290 | | | | 2,212 | | | | 2,956 | | | | 3,145 | |
Investment in inventories | | | 11,437 | | | | 12,096 | | | | 11,904 | | | | 17,088 | | | | -228 | | | | -577 | | | | 9,603 | |
Exports (goods and services) | | | 732,957 | | | | 716,056 | | | | 713,351 | | | | 672,533 | | | | 638,095 | | | | 633,955 | | | | 633,112 | |
Imports (goods and services) | | | 770,205 | | | | 756,009 | | | | 756,913 | | | | 719,909 | | | | 685,868 | | | | 683,019 | | | | 651,176 | |
Residual error and estimate | | | 405 | | | | -311 | | | | -59 | | | | 72 | | | | 1,320 | | | | -865 | | | | -559 | |
| | | | | | | | | | | | | | | | | | | | | | | | | | | | |
Gross Domestic Expenditure | | | 2,292,644 | | | | 2,221,989 | | | | 2,223,856 | | | | 2,141,107 | | | | 2,025,535 | | | | 1,990,441 | | | | 1,994,898 | |
| | | | | | | | | | | | | | | | | | | | | | | | | | | | |
Gross Domestic Expenditure in Chained 2012 Dollars | | | 2,088,674 | | | | 2,054,111 | | | | 2,058,117 | | | | 2,017,492 | | | | 1,955,488 | | | | 1,936,100 | | | | 1,923,422 | |
| | | | | | | | | | | | | | | | | | | | | | | | | | | | |
Source: Statistics Canada, National Income and Expenditure Accounts.
| (1) | Seasonally adjusted, annual rates. |
| 3 | Year-over-year growth rates for nominal GDP at market prices are based on seasonally adjusted data. |
7
Economic Developments and Main Risks to the Economy4
Real GDP grew by 2.9% in 2014, 0.7% in 2015, 1.0% in 2016, 3.2% in 2017 and 2.0% in 2018. The rebound since mid-2016 has been supported by stronger consumption and investment. Canada’s real GDP registered year-over-year growth of 1.5%, 1.9% and 1.7% in the first three quarters of 2019, respectively.
Real household spending rose 2.7% in 2014, 2.3% in 2015, 1.9% in 2016, 3.7% in 2017 and 2.2% in 2018. Year-over-year growth in household spending was 1.7%, 1.7% and 1.4% in the first three quarters of 2019, respectively.
Household savings as a percentage of personal disposable income was 3.9% in 2014, 4.5% in 2015, 2.0% in 2016, 2.1% in 2017 and 1.8% in 2018. The household saving rates were respectively 2.1%, 3.0% and 3.2% (annual rates) in the first three quarters of 2019.
Real non-residential structures, machinery and equipment investment grew by 4.7% in 2014, then fell by 11.3% and 12.3% in 2015 and 2016, respectively. Real non-residential structures, machinery and equipment investment then returned to growth of 3.9% in 2017 and 1.4% in 2018. On a year-over-year basis, non-residential structures, machinery and equipment investment decreased 1.2% and 2.9% in the first two quarters of 2019, before growing 3.4% in the third quarter. Real intellectual property products investment contracted edged up 0.8% in 2014 before decreasing 11.5% and 1.7% in 2015 and 2016 respectively. In 2017 and 2018, real intellectual property products investment rose 2.1% and 3.9%, respectively. On a year-over-year basis, intellectual property products investment decreased 6.6%, 4.3% and 2.7% in the first three quarters of 2019.
Housing starts were 189.3 thousand units in 2014, 195.5 thousand units in 2015, 197.9 thousand units in 2016, 219.8 thousand units in 2017 and 212.8 thousand units in 2018. Over the first three quarters of 2019, housing starts averaged an annual level of 211.8 thousand units.
Real government final consumption grew 0.6% in 2014, 1.4% in 2015, 1.8% in 2016, 2.3% in 2017 and 3.0% in 2018. The year-over-year growth in government spending on goods and services was 2.8%, 2.4% and 2.1% in the first three quarters of 2019, respectively.
In current dollar terms, the trade balance in goods and services (on a balance of payments basis) was a deficit of $18.1 billion in 2014 and increased to $49.1 billion in 2015. The deficit then decreased slightly over the next three years, to $47.8 billion in 2016, $47.4 billion in 2017, and $43.6 billion in 2018. In the first three quarters of 2019, the average trade deficit in goods and services was $37.2 billion at annual rates.
The key risks to the Canadian economic outlook are both global and domestic, and remain broadly balanced. Globally, stronger and more durable economic growth, particularly in advanced economies, could increase demand for Canadian goods and services. In contrast, a continued shift towards greater economic protectionism could exacerbate the slowdown in global economic activity by hampering global trade flows and investment, the effects of which could spill over into Canada. Domestically, household spending and business investment could be stronger than expected, especially in the context of tight labor market conditions. Conversely, high levels of household debt pose a key downside risk to the economy.
| 4 | In this section all figures, except the savings rates and the trade balance, are reported in real terms and growth rates are calculated from GDP at market prices, chained 2012 dollars, seasonally adjusted at annual rates unless otherwise noted. |
8
Prices and Costs
The GDP implicit price deflator increased 1.9% in 2014, declined by 0.8% in 2015, increased 0.7% in 2016, 2.5% in 2017 and 1.8% in 2018. The year-over-year change in the implicit price deflator was 1.1%, 1.9% and 1.4% in the first three quarters of 2019, respectively.
Since the introduction of inflation-targeting into monetary policy in 1991, annual increases in the consumer price index (“CPI”) have remained almost entirely within the 1% to 3% target range. Total CPI rose 2.0% in 2014, 1.1% in 2015, 1.4% in 2016, 1.6% in 2017 and 2.3% in 2018. On a year-over-year basis, total CPI increased 1.6%, 2.1% and 1.9% in the first three quarters of 2019, respectively5.
PRICE DEVELOPMENTS
| | | | | | | | | | | | | | | | | | | | | | | | | | | | | | | | |
| | | GDP
Implicit
Price Index
(1) | | | Consumer Price Index | | | Industrial
Product
Price
Index | |
For the years ended December 31, | | Total | | | Food | | | Total
excluding
Food | �� | | Energy | | | Total excluding
Food and
Energy | | | Shelter | |
| | | (annual percentage changes) | |
2014 | | | 1.9 | | | | 2.0 | | | | 2.3 | | | | 1.8 | | | | 3.6 | | | | 1.5 | | | | 2.6 | | | | 2.5 | |
2015 | | | -0.8 | | | | 1.1 | | | | 3.7 | | | | 0.6 | | | | -9.6 | | | | 1.8 | | | | 1.3 | | | | -0.8 | |
2016 | | | 0.7 | | | | 1.4 | | | | 1.5 | | | | 1.4 | | | | -3.0 | | | | 1.9 | | | | 1.6 | | | | -0.2 | |
2017 | | | 2.5 | | | | 1.6 | | | | 0.1 | | | | 1.9 | | | | 5.3 | | | | 1.6 | | | | 1.8 | | | | 3.1 | |
2018 | | | 1.8 | | | | 2.3 | | | | 1.8 | | | | 2.3 | | | | 6.7 | | | | 1.9 | | | | 1.8 | | | | 3.9 | |
| | | | | | | | |
2018Q4 | | | 0.4 | | | | 2.0 | | | | 2.4 | | | | 1.9 | | | | 0.9 | | | | 2.0 | | | | 2.4 | | | | 3.3 | |
2019Q1 | | | 1.1 | | | | 1.6 | | | | 3.2 | | | | 1.3 | | | | -4.6 | | | | 1.9 | | | | 2.5 | | | | 1.2 | |
2019Q2 | | | 1.9 | | | | 2.1 | | | | 3.3 | | | | 1.9 | | | | -1.2 | | | | 2.3 | | | | 2.6 | | | | 0.1 | |
2019Q3 | | | 1.4 | | | | 1.9 | | | | 3.7 | | | | 1.6 | | | | -4.2 | | | | 2.2 | | | | 2.4 | | | | -1.3 | |
Source: Statistics Canada.
| (1) | This implicit price index is based on seasonally adjusted data. |
| 5 | Year-over-year growth rates for CPI are not based on seasonally adjusted data. |
9
Labor Market
The following table shows labor market characteristics for the periods indicated.
LABOR MARKET CHARACTERISTICS(1) (2)
(thousands of persons)
| | | | | | | | | | | | | | | | | | | | | | | | | | | | | | | | | | | | |
| | | Canada | | | Atlantic Provinces | | | Quebec | |
For the years ended December 31, | | Labor
Force | | | Employ-
ment | | | Unemploy-
ment Rate | | | Labor
Force | | | Employ-
ment | | | Unemploy-
ment Rate | | | Labor
Force | | | Employ-
ment | | | Unemploy-
ment Rate | |
| | | (thousands) | | | (percent) | | | (thousands) | | | (percent) | | | (thousands) | | | (percent) | |
2014 | | | 19,125 | | | | 17,802 | | | | 6.9 | | | | 1,238 | | | | 1,114 | | | | 10.0 | | | | 4,400 | | | | 4,060 | | | | 7.7 | |
2015 | | | 19,278 | | | | 17,947 | | | | 6.9 | | | | 1,233 | | | | 1,109 | | | | 10.0 | | | | 4,434 | | | | 4,097 | | | | 7.6 | |
2016 | | | 19,441 | | | | 18,080 | | | | 7.0 | | | | 1,224 | | | | 1,102 | | | | 10.0 | | | | 4,448 | | | | 4,133 | | | | 7.1 | |
2017 | | | 19,663 | | | | 18,416 | | | | 6.3 | | | | 1,219 | | | | 1,100 | | | | 9.7 | | | | 4,496 | | | | 4,223 | | | | 6.1 | |
2018 | | | 19,813 | | | | 18,658 | | | | 5.8 | | | | 1,223 | | | | 1,111 | | | | 9.2 | | | | 4,510 | | | | 4,262 | | | | 5.5 | |
| | | | | | | | | |
2018Q4 | | | 19,905 | | | | 18,776 | | | | 5.7 | | | | 1,218 | | | | 1,114 | | | | 8.6 | | | | 4,518 | | | | 4,274 | | | | 5.4 | |
2019Q1 | | | 20,069 | | | | 18,909 | | | | 5.8 | | | | 1,233 | | | | 1,130 | | | | 8.3 | | | | 4,545 | | | | 4,305 | | | | 5.3 | |
2019Q2 | | | 20,165 | | | | 19,047 | | | | 5.5 | | | | 1,232 | | | | 1,129 | | | | 8.4 | | | | 4,557 | | | | 4,332 | | | | 4.9 | |
2019Q3 | | | 20,243 | | | | 19,102 | | | | 5.6 | | | | 1,234 | | | | 1,124 | | | | 8.9 | | | | 4,584 | | | | 4,364 | | | | 4.8 | |
| | | | | | | | | | | | | | | | | | | | | | | | | | | | | | | | | | | | |
| | | Ontario | | | Prairie Provinces | | | British Columbia | |
For the years ended December 31, | | Labor
Force | | | Employ-
ment | | | Unemploy-
ment Rate | | | Labor
Force | | | Employ-
ment | | | Unemploy-
ment Rate | | | Labor
Force | | | Employ-
ment | | | Unemploy-
ment Rate | |
| | | (thousands) | | | (percent) | | | (thousands) | | | (percent) | | | (thousands) | | | (percent) | |
2014 | | | 7,419 | | | | 6,878 | | | | 7.3 | | | | 3,642 | | | | 3,472 | | | | 4.7 | | | | 2,425 | | | | 2,278 | | | | 6.1 | |
2015 | | | 7,426 | | | | 6,923 | | | | 6.8 | | | | 3,727 | | | | 3,511 | | | | 5.8 | | | | 2,458 | | | | 2,306 | | | | 6.2 | |
2016 | | | 7,490 | | | | 7,000 | | | | 6.5 | | | | 3,746 | | | | 3,466 | | | | 7.5 | | | | 2,532 | | | | 2,380 | | | | 6.0 | |
2017 | | | 7,580 | | | | 7,128 | | | | 6.0 | | | | 3,768 | | | | 3,499 | | | | 7.2 | | | | 2,601 | | | | 2,467 | | | | 5.1 | |
2018 | | | 7,673 | | | | 7,242 | | | | 5.6 | | | | 3,791 | | | | 3,548 | | | | 6.4 | | | | 2,617 | | | | 2,494 | | | | 4.7 | |
| | | | | | | | | |
2018Q4 | | | 7,709 | | | | 7,284 | | | | 5.5 | | | | 3,817 | | | | 3,575 | | | | 6.3 | | | | 2,644 | | | | 2,529 | | | | 4.3 | |
2019Q1 | | | 7,814 | | | | 7,364 | | | | 5.8 | | | | 3,805 | | | | 3,561 | | | | 6.4 | | | | 2,673 | | | | 2,549 | | | | 4.6 | |
2019Q2 | | | 7,863 | | | | 7,429 | | | | 5.5 | | | | 3,821 | | | | 3,585 | | | | 6.2 | | | | 2,692 | | | | 2,572 | | | | 4.5 | |
2019Q3 | | | 7,911 | | | | 7,473 | | | | 5.5 | | | | 3,826 | | | | 3,580 | | | | 6.4 | | | | 2,688 | | | | 2,562 | | | | 4.7 | |
Source: Statistics Canada, The Labour Force Survey.
| (1) | Annual employment levels are based on not seasonally adjusted data, while quarterly employment levels are based on seasonnally adjusted data. |
| (2) | Unemployment levels are calculated using the difference between labor force and employment for the quarters. |
Employment increased by 0.6% in 2014, 0.8% in 2015, 0.7% in 2016, 1.9% in 2017 and 1.3% in 2018. Over the first three quarters of 2019, employment has grown 2.3% on an annualized basis. Meanwhile, the labor force increased by 0.5% in 2014, 0.8% in 2015, 0.8% in 2016, 1.1% in 2017 and 0.8% in 2018. Over the first three quarters of 2019, the labor force has grown 2.3% on an annualized basis. The unemployment rate was 6.9% in 2014, 6.9% in 2015, and 7.0% in 2016, then declined to 6.3% in 2017 and 5.8% in 2018. Over the first three quarters of 2019, the unemployment rate has averaged 5.6%. All provinces have seen significant decreases in unemployment rates since 2016. However, regional differences do exist; the unemployment rate in the Atlantic Provinces (currently 8.9%) has been consistently higher than the national average since 2014. In addition, the unemployment rate in the Prairie Provinces was relatively low in 2013 and 2014, then rose considerably during the oil price shock in 2015 and 2016, and remains above the national average in 2019.
Employment in the service sector accounts for 79.2% of total employment, up from 78.9% in 2018. Within the service sector, the largest employment subsectors are health care and social assistance, and retail trade. Employment in the goods sector, which makes up 20.8% of Canadian employment, is led by the manufacturing and construction subsectors. The subsector that grew the most in terms of employment share from 2014 to 2019 was professional, scientific and technical services, while manufacturing contracted the most in terms of employment share.
SHAREOF TOTAL EMPLOYMENTBY SECTOR
(in percentages)
| | | | | | | | | | | | | | | | | | | | |
| | | For the years ended December 31, | |
| | | 2019(1) | | | 2018 | | | 2017 | | | 2016 | | | 2015 | |
Total, all industries | | | 100.0 | | | | 100.0 | | | | 100.0 | | | | 100.0 | | | | 100.0 | |
Goods-producing sector | | | 20.8 | | | | 21.1 | | | | 21.0 | | | | 21.2 | | | | 21.6 | |
Agriculture | | | 1.5 | | | | 1.5 | | | | 1.5 | | | | 1.6 | | | | 1.6 | |
Forestry and logging with support activities | | | 0.3 | | | | 0.3 | | | | 0.3 | | | | 0.3 | | | | 0.3 | |
Fishing, hunting and trapping | | | 0.1 | | | | 0.1 | | | | 0.1 | | | | 0.1 | | | | 0.1 | |
Mining, quarrying, and oil and gas extraction | | | 1.4 | | | | 1.5 | | | | 1.4 | | | | 1.5 | | | | 1.6 | |
Utilities | | | 0.7 | | | | 0.8 | | | | 0.7 | | | | 0.8 | | | | 0.8 | |
Construction | | | 7.6 | | | | 7.7 | | | | 7.7 | | | | 7.7 | | | | 7.6 | |
Manufacturing | | | 9.2 | | | | 9.3 | | | | 9.4 | | | | 9.4 | | | | 9.5 | |
Services-producing sector | | | 79.2 | | | | 78.9 | | | | 79.0 | | | | 78.8 | | | | 78.4 | |
Wholesale trade | | | 3.3 | | | | 3.5 | | | | 3.7 | | | | 3.8 | | | | 3.7 | |
Retail trade | | | 11.5 | | | | 11.5 | | | | 11.6 | | | | 11.4 | | | | 11.5 | |
Transportation and warehousing | | | 5.5 | | | | 5.3 | | | | 5.1 | | | | 5.0 | | | | 5.1 | |
Finance, insurance, real estate and leasing | | | 6.3 | | | | 6.3 | | | | 6.4 | | | | 6.2 | | | | 6.1 | |
Professional, scientific and technical services | | | 8.2 | | | | 7.9 | | | | 7.9 | | | | 7.7 | | | | 7.6 | |
Business, building and other support services | | | 4.1 | | | | 4.2 | | | | 4.1 | | | | 4.2 | | | | 4.2 | |
Educational services | | | 7.1 | | | | 7.1 | | | | 7.0 | | | | 7.0 | | | | 7.1 | |
Health care and social assistance | | | 13.0 | | | | 12.9 | | | | 12.9 | | | | 12.9 | | | | 12.8 | |
Information, culture and recreation | | | 4.1 | | | | 4.2 | | | | 4.3 | | | | 4.3 | | | | 4.2 | |
Accommodation and food services | | | 6.4 | | | | 6.6 | | | | 6.6 | | | | 6.7 | | | | 6.7 | |
Other services | | | 4.3 | | | | 4.3 | | | | 4.2 | | | | 4.3 | | | | 4.2 | |
Public administration | | | 5.3 | | | | 5.2 | | | | 5.2 | | | | 5.1 | | | | 5.1 | |
| Source: | Statistics Canada, The Labour Force Survey. |
10
EXTERNAL TRADE
Canada has continued to work towards implementing its trade goals of freer and more open markets based on internationally agreed rules and practices at multilateral, regional and bilateral levels, and is now the only G7 country to have concluded trade agreements with all other G7 countries. At the multilateral level, Canada continues to be an active member of the World Trade Organization (“WTO”) and continues to fully participate in multilateral trade negotiations as well as ongoing discussions related to potential WTO reform initiatives. At the regional level, Canada is a member of the North American Free Trade Agreement (“NAFTA”) with both the United States and Mexico. Under NAFTA, as of January 1, 2003, virtually all tariffs for goods originating in Canada, the United States and Mexico (each a “Party,” and together, the “Parties”) have been eliminated. In August 2017, Canada, the U.S. and Mexico launched the renegotiation and modernization of NAFTA and, on November 30, 2018, the three Parties signed the new Canada-United States-Mexico Agreement (“CUSMA”). The CUSMA preserves the essential benefits of the NAFTA, including existing tariff commitments, and incorporates new and updated provisions that seek to address 21st century trade issues. Additionally, it preserves the use of binational panels to resolve disputes on countervailing and anti-dumping duty matters. However, under the CUSMA, the investor-state-dispute settlement (“ISDS”) mechanism (a mechanism that allows for a foreign investor from one party to file a claim against the host party when their investment has been affected in a manner that violates the protections under the agreement) will not apply between Canada and the U.S., and the current ISDS mechanism will be eliminated after a three-year transition period. Canada will continue to have an ISDS mechanism with Mexico via the Comprehensive and Progressive Agreement for Trans-Pacific Partnership (“CPTPP”). Separate side letters to the CUSMA, which took effect on November 30, 2018, limit the ability of the United States to impose tariffs on automobiles and auto parts from Canada and Mexico under Section 232 of the Trade Expansion Act of 1962. As of December 2019, Canada and the United States are currently undertaking the domestic process towards ratification and implementation of the CUSMA, while Mexico completed its ratification process in June 2019. Once it goes into effect, the Parties will review the Agreement every six years, to ensure it remains relevant, effective and beneficial for North America. After each review, the parties can agree to extend the agreement for further 16 years. To further ensure predictable North American trade, Canada and the United States reached an agreement on May 17, 2019, to eliminate all tariffs the United States imposed under Section 232 on Canadian imports of steel and aluminum, and all countermeasures Canada imposed in response to the Section 232 action taken by the United States.
The CPTPP is a free trade agreement among Canada and Australia, Brunei, Chile, Japan, Malaysia, Mexico, New Zealand, Peru, Singapore and Vietnam, which entered into force on December 30, 2018. Canada was among the first six countries to ratify the agreement, along with Australia, Japan, Mexico, New Zealand, and Singapore. On January 14, 2019, the CPTPP also became effective with respect to Vietnam. As a result, Canada now benefits from expanded preferential market access to CPTPP countries that have ratified the agreement.
At the bilateral level, Canada has implemented bilateral free trade agreements with the following countries: Chile, Columbia, Costa Rica, Honduras, Israel, Jordan, Korea, Panama, Peru, Ukraine, and the European Free Trade Association (Norway, Switzerland, Iceland and Liechtenstein). In addition, provisional application of the Comprehensive Economic and Trade Agreement (“CETA”) between Canada and the European Union, with its 28 Member States, began in September 2017. The CETA will enter definitively into force once all Member States of the EU ratify the text according to their respective domestic constitutional requirements. As of November 2019, 13 of the 28 Member States, including the United Kingdom, have ratified the agreement.
Canada is also committed to expanding and diversifying trade with large, fast-growing markets and regional groupings, such as the Pacific Alliance (Chile, Colombia, Mexico and Peru), the Mercosur trade bloc (Argentina, Brazil, Paraguay and Uruguay), and the 10 countries of the Association of Southeast Asian Nations (Brunei, Cambodia, Indonesia, Lao PDR, Malaysia, Myanmar, Philippines, Singapore, Thailand, Vietnam).
Merchandise and Service Trade
The following table sets forth the composition of Canadian trade for the periods indicated.
THE COMPOSITIONOF CANADIAN MERCHANDISE TRADE
(Balance of Payments Basis)
| | | | | | | | | | | | | | | | | | | | | | | | | | | | |
| | | First 3 quarters (1) | | | For the years ended December 31, | |
| | | 2019 | | | 2018 | | | 2018 | | | 2017 | | | 2016 | | | 2015 | | | 2014 | |
| | | ( in millions of dollars) | |
Value of Exports | | | | | | | | | | | | | | | | | | | | | | | | | | | | |
Farm, fishing & intermediate food products | | | 29,714 | | | | 29,568 | | | | 39,673 | | | | 38,924 | | | | 38,111 | | | | 38,476 | | | | 35,843 | |
Energy products | | | 86,585 | | | | 87,154 | | | | 111,070 | | | | 96,787 | | | | 74,133 | | | | 85,218 | | | | 130,151 | |
Metal ores & non-metallic minerals | | | 16,285 | | | | 13,903 | | | | 19,256 | | | | 16,082 | | | | 14,257 | | | | 16,785 | | | | 16,643 | |
Metal & non-metallic mineral products | | | 47,400 | | | | 48,963 | | | | 64,613 | | | | 61,654 | | | | 55,536 | | | | 56,057 | | | | 56,112 | |
Basic & industrial chemical, plastic & rubber products | | | 25,648 | | | | 26,277 | | | | 35,008 | | | | 32,780 | | | | 31,132 | | | | 32,702 | | | | 33,865 | |
Forestry products & building & packaging materials | | | 32,286 | | | | 35,764 | | | | 47,209 | | | | 43,804 | | | | 42,148 | | | | 39,919 | | | | 36,879 | |
Industrial machinery, equipment & parts | | | 31,238 | | | | 29,274 | | | | 39,391 | | | | 37,090 | | | | 35,209 | | | | 36,007 | | | | 32,943 | |
Electronic & electrical equipment & parts | | | 22,694 | | | | 21,853 | | | | 29,404 | | | | 28,401 | | | | 28,210 | | | | 27,586 | | | | 24,790 | |
Motor vehicles & parts | | | 70,608 | | | | 67,676 | | | | 90,470 | | | | 93,222 | | | | 98,477 | | | | 88,762 | | | | 73,589 | |
Aircraft & other transportation equipment & parts | | | 20,757 | | | | 19,078 | | | | 25,759 | | | | 22,854 | | | | 23,710 | | | | 25,359 | | | | 22,444 | |
Consumer goods | | | 53,622 | | | | 49,311 | | | | 66,554 | | | | 62,989 | | | | 66,231 | | | | 62,709 | | | | 53,476 | |
Other (2) | | | 12,967 | | | | 12,455 | | | | 16,850 | | | | 14,889 | | | | 14,348 | | | | 14,469 | | | | 12,599 | |
| | | | | | | | | | | | | | | | | | | | | | | | | | | | |
Total Exports (3) | | | 449,805 | | | | 441,274 | | | | 585,256 | | | | 549,476 | | | | 521,500 | | | | 524,046 | | | | 529,334 | |
| | | | | | | | | | | | | | | | | | | | | | | | | | | | |
Value of Imports | | | | | | | | | | | | | | | | | | | | | | | | | | | | |
Farm, fishing & intermediate food products | | | 16,021 | | | | 14,998 | | | | 20,297 | | | | 19,447 | | | | 19,257 | | | | 18,447 | | | | 16,882 | |
Energy products | | | 27,405 | | | | 28,912 | | | | 38,114 | | | | 33,383 | | | | 28,241 | | | | 32,280 | | | | 45,088 | |
Metal ores & non-metallic minerals | | | 10,771 | | | | 10,600 | | | | 14,375 | | | | 12,380 | | | | 9,951 | | | | 9,279 | | | | 10,302 | |
Metal & non-metallic mineral products | | | 29,737 | | | | 31,425 | | | | 41,467 | | | | 40,891 | | | | 41,580 | | | | 43,727 | | | | 43,279 | |
Basic & industrial chemical, plastic & rubber products | | | 33,803 | | | | 35,786 | | | | 47,323 | | | | 43,091 | | | | 39,664 | | | | 40,274 | | | | 40,687 | |
Forestry products & building & packaging materials | | | 20,282 | | | | 20,008 | | | | 26,877 | | | | 25,462 | | | | 24,528 | | | | 24,746 | | | | 22,836 | |
Industrial machinery, equipment & parts | | | 52,695 | | | | 50,568 | | | | 68,207 | | | | 62,711 | | | | 61,041 | | | | 62,688 | | | | 58,994 | |
Electronic & electrical equipment & parts | | | 53,962 | | | | 53,252 | | | | 71,300 | | | | 67,621 | | | | 64,506 | | | | 64,792 | | | | 60,383 | |
Motor vehicles & parts | | | 87,555 | | | | 86,176 | | | | 113,816 | | | | 113,575 | | | | 107,988 | | | | 101,296 | | | | 90,836 | |
Aircraft & other transportation equipment & parts | | | 20,420 | | | | 17,983 | | | | 23,788 | | | | 20,897 | | | | 19,230 | | | | 21,839 | | | | 17,468 | |
Consumer goods | | | 94,376 | | | | 90,494 | | | | 121,360 | | | | 115,693 | | | | 112,885 | | | | 111,048 | | | | 100,075 | |
Other (2) | | | 16,098 | | | | 15,081 | | | | 20,284 | | | | 18,970 | | | | 18,154 | | | | 18,267 | | | | 17,832 | |
| | | | | | | | | | | | | | | | | | | | | | | | | | | | |
Total Imports (3) | | | 463,125 | | | | 455,282 | | | | 607,205 | | | | 574,120 | | | | 547,024 | | | | 548,682 | | | | 524,661 | |
| | | | | | | | | | | | | | | | | | | | | | | | | | | | |
Source: Statistics Canada, Canadian International Merchandise Trade.
| (2) | Other includes special transactions trade and other balance of payments adjustments |
| (3) | May not add due to rounding. |
Canada is one of the world’s leading trading nations. Canada’s exports have always reflected the country’s high endowment in natural resources. While Canada’s exports have diversified over time, commodities still remain an important part of Canada’s exports. In 2018, energy products accounted for 19.0% of Canada’s merchandise exports, followed by both motor vehicles and parts at 15.5% and consumer goods at 11.4%. Together, these components represented 45.8% of total merchandise exports in 2018.
Canada and the United States are each other’s most important trading partners, reflecting the physical proximity of the two countries and their close economic and financial relationship. In 2018, trade with the United States accounted for 73.9% of the value of Canada’s merchandise exports and 64.4% of the value of Canada’s merchandise imports. According to the United States Census Bureau, trade with Canada accounted for 18.0% of the United States’ exports and 12.5% of its imports in 2018. These shares are little changed on a year-to-date basis up to and including September 2019.
11
The following table presents the geographical distribution of Canadian merchandise exports and merchandise imports for the periods indicated.
GEOGRAPHICAL DISTRIBUTIONOF CANADIAN MERCHANDISE TRADE
(Balance of Payments Basis)
| | | | | | | | | | | | | | | | | | | | | | | | | | | | |
| | | First 3 quarters | | | For the years ended December 31, | |
| | | 2019 | | | 2018 | | | 2018 | | | 2017 | | | 2016 | | | 2015 | | | 2014 | |
Exports(1) | | | | | | | | | | | | | | | | | | | | | | | | | | | | |
United States | | | 74.6 | | | | 74.2 | | | | 73.9 | | | | 74.7 | | | | 75.2 | | | | 75.7 | | | | 75.8 | |
Japan | | | 2.2 | | | | 2.2 | | | | 2.3 | | | | 2.2 | | | | 2.1 | | | | 1.9 | | | | 2.1 | |
United Kingdom | | | 3.2 | | | | 2.9 | | | | 2.9 | | | | 3.4 | | | | 3.4 | | | | 3.2 | | | | 3.0 | |
European Union(2) | | | 4.8 | | | | 5.1 | | | | 5.0 | | | | 4.5 | | | | 4.6 | | | | 4.3 | | | | 4.7 | |
Other | | | 15.3 | | | | 15.7 | | | | 15.9 | | | | 15.1 | | | | 14.6 | | | | 14.9 | | | | 14.5 | |
| | | | | | | | | | | | | | | | | | | | | | | | | | | | |
| | | 100.0 | % | | | 100.0 | % | | | 100.0 | % | | | 100.0 | % | | | 100.0 | % | | | 100.0 | % | | | 100.0 | % |
| | | | | | | | | | | | | | | | | | | | | | | | | | | | |
Imports(1) | | | | | | | | | | | | | | | | | | | | | | | | | | | | |
United States | | | 64.0 | | | | 64.3 | | | | 64.4 | | | | 64.6 | | | | 65.7 | | | | 66.3 | | | | 66.9 | |
Japan | | | 2.0 | | | | 2.2 | | | | 2.1 | | | | 2.4 | | | | 2.2 | | | | 2.0 | | | | 1.8 | |
United Kingdom | | | 1.3 | | | | 1.4 | | | | 1.4 | | | | 1.4 | | | | 1.4 | | | | 1.6 | | | | 1.6 | |
European Union(2) | | | 9.3 | | | | 9.2 | | | | 9.1 | | | | 8.5 | | | | 8.2 | | | | 8.1 | | | | 7.9 | |
Other | | | 23.5 | | | | 23.0 | | | | 23.1 | | | | 23.1 | | | | 22.5 | | | | 22.1 | | | | 21.9 | |
| | | | | | | | | | | | | | | | | | | | | | | | | | | | |
| | | 100.0 | % | | | 100.0 | % | | | 100.0 | % | | | 100.0 | % | | | 100.0 | % | | | 100.0 | % | | | 100.0 | % |
| | | | | | | | | | | | | | | | | | | | | | | | | | | | |
Source: Statistics Canada, Canadian International Merchandise Trade.
| (1) | May not add to total due to rounding. |
| (2) | Excludes the United Kingdom. |
The following table presents volume and price indices of Canada’s merchandise trade for the periods indicated.
MERCHANDISE TRADE INDICES
(Balance of Payments Basis)
| | | | | | | | | | | | | | | | | | | | | | | | | | | | |
| | | First 3 quarters | | | For the years ended December 31, | |
| | | 2019 | | | 2018 | | | 2018 | | | 2017 | | | 2016 | | | 2015 | | | 2014 | |
| | | ( 2012 = 100 ) | |
Indices of physical volume | | | | | | | | | | | | | | | | | | | | | | | | | | | | |
Exports | | | 119.2 | | | | 117.2 | | | | 117.5 | | | | 114.0 | | | | 113.2 | | | | 112.7 | | | | 109.0 | |
Imports | | | 114.6 | | | | 113.9 | | | | 113.5 | | | | 109.9 | | | | 105.1 | | | | 105.3 | | | | 105.0 | |
| | | | | | | |
| | | | | | | | | | | | | | | | | | | | | | | | | | | | |
Indices of prices | | | | | | | | | | | | | | | | | | | | | | | | | | | | |
Exports | | | 108.6 | | | | 108.4 | | | | 107.6 | | | | 104.3 | | | | 99.7 | | | | 100.7 | | | | 105.3 | |
Imports | | | 113.4 | | | | 112.2 | | | | 112.6 | | | | 110.0 | | | | 109.7 | | | | 109.7 | | | | 105.2 | |
Terms of trade(1) | | | 95.8 | | | | 96.7 | | | | 95.6 | | | | 94.8 | | | | 90.9 | | | | 91.8 | | | | 100.1 | |
Source: Statistics Canada, Canadian International Merchandise Trade.
| (1) | Index of price of exports divided by index of price of imports multiplied by 100. |
Over the first three quarters of 2019, the service sector accounted for 18.2% of total exports and 19.8% of total imports (seasonally adjusted at annual rates). Service exports are mainly comprised of commercial services (57.9%), travel services (26.9%), transportation services (13.9%) and general government services (1.3%). On the import side, commercial services, travel services, transportation services and general government services accounted for 48.0%, 30.1%, 21.0% and 0.9% of total service imports, respectively. In 2018, the United States was Canada’s largest services trading partner, accounting for 54.9% and 54.4% of total service exports and imports, respectively.
The following tables present respectively the shares of total service exports and imports by sector and by country for the periods indicated.
SHAREOF TOTAL SERVICE EXPORTSAND IMPORTSBY SECTOR (1)
(in percentages)
| | | | | | | | | | | | | | | | | | | | | | | | | | | | |
| | | First 3 quarters | | | For the years ended December 31, | |
| | | 2019 | | | 2018 | | | 2018 | | | 2017 | | | 2016 | | | 2015 | | | 2014 | |
Exports | | | | | | | | | | | | | | | | | | | | | | | | | | | | |
Travel services | | | 26.9 | | | | 26.7 | | | | 26.7 | | | | 26.5 | | | | 25.9 | | | | 23.9 | | | | 23.2 | |
Transportation services | | | 13.9 | | | | 14.2 | | | | 14.1 | | | | 14.2 | | | | 14.1 | | | | 14.3 | | | | 14.8 | |
Commercial services | | | 57.9 | | | | 57.9 | | | | 57.9 | | | | 57.9 | | | | 58.7 | | | | 60.3 | | | | 60.5 | |
General government services | | | 1.3 | | | | 1.3 | | | | 1.3 | | | | 1.4 | | | | 1.4 | | | | 1.4 | | | | 1.5 | |
| | | | | | | | | | | | | | | | | | | | | | | | | | | | |
| | | 100.0 | % | | | 100.0 | % | | | 100.0 | % | | | 100.0 | % | | | 100.0 | % | | | 100.0 | % | | | 100.0 | % |
| | | | | | | | | | | | | | | | | | | | | | | | | | | | |
Imports | | | | | | | | | | | | | | | | | | | | | | | | | | | | |
Travel services | | | 30.1 | | | | 29.8 | | | | 29.8 | | | | 30.9 | | | | 31.3 | | | | 32.3 | | | | 33.0 | |
Transportation services | | | 21.0 | | | | 21.3 | | | | 21.3 | | | | 19.9 | | | | 19.5 | | | | 19.7 | | | | 19.9 | |
Commercial services | | | 48.0 | | | | 48.1 | | | | 48.1 | | | | 48.3 | | | | 48.3 | | | | 47.1 | | | | 46.3 | |
General government services | | | 0.9 | | | | 0.9 | | | | 0.9 | | | | 0.9 | | | | 0.9 | | | | 0.9 | | | | 0.9 | |
| | | | | | | | | | | | | | | | | | | | | | | | | | | | |
| | | 100.0 | % | | | 100.0 | % | | | 100.0 | % | | | 100.0 | % | | | 100.0 | % | | | 100.0 | % | | | 100.0 | % |
| | | | | | | | | | | | | | | | | | | | | | | | | | | | |
Source: Statistics Canada.
| (1) | In current prices, seasonally adjusted at annual rates. May not add to total due to rounding. |
SHAREOF TOTAL SERVICE EXPORTSAND IMPORTSBY COUNTRY (1)
(in percentages)
| | | | | | | | | | | | | | | | | | | | |
| | | 2018 | | | 2017 | | | 2016 | | | 2015 | | | 2014 | |
Exports | | | | | | | | | | | | | | | | | | | | |
United States | | | 54.9 | | | | 55.0 | | | | 55.1 | | | | 54.9 | | | | 54.1 | |
Japan | | | 1.3 | | | | 1.5 | | | | 1.5 | | | | 1.8 | | | | 1.6 | |
Europe(2) | | | 18.0 | | | | 17.6 | | | | 18.8 | | | | 18.3 | | | | 19.2 | |
United Kingdom | | | 0.9 | | | | 0.9 | | | | 0.9 | | | | 0.9 | | | | 1.0 | |
Others | | | 24.9 | | | | 25.1 | | | | 23.6 | | | | 24.2 | | | | 24.1 | |
| | | | | | | | | | | | | | | | | | | | |
| | | 100.0 | % | | | 100.0 | % | | | 100.0 | % | | | 100.0 | % | | | 100.0 | % |
| | | | | | | | | | | | | | | | | | | | |
Imports | | | | | | | | | | | | | | | | | | | | |
United States | | | 54.4 | | | | 54.7 | | | | 54.8 | | | | 54.9 | | | | 55.8 | |
Japan | | | 1.7 | | | | 1.6 | | | | 1.8 | | | | 1.7 | | | | 1.7 | |
Europe(2) | | | 15.7 | | | | 15.5 | | | | 15.3 | | | | 15.0 | | | | 15.4 | |
United Kingdom | | | 5.0 | | | | 5.7 | | | | 5.4 | | | | 5.5 | | | | 4.8 | |
Others | | | 23.2 | | | | 22.6 | | | | 22.7 | | | | 23.0 | | | | 22.3 | |
| | | | | | | | | | | | | | | | | | | | |
| | | 100.0 | % | | | 100.0 | % | | | 100.0 | % | | | 100.0 | % | | | 100.0 | % |
| | | | | | | | | | | | | | | | | | | | |
Source: Statistics Canada.
| (1) | In current prices. May not add to total due to rounding. |
| (2) | Excludes United Kingdom. Includes Austria, Belgium, Denmark, France, Finland, Germany, Greece, Ireland, Italy, Luxembourg, Netherlands, Norway, Poland, Portugal, Russia, Spain, Sweden, Switzerland, Turkey, and Other Europe in and not in Organisation for Economic Co-operation and Development (OECD). |
12
BALANCE OF PAYMENTS
The following table presents the balance of international payments for the periods indicated.
CANADIAN BALANCEOF INTERNATIONAL PAYMENTS
| | | | | | | | | | | | | | | | | | | | | | | | | | | | |
| | | First 3 quarters (1) | | | For the years ended December 31, | |
| | | 2019 | | | 2018 | | | 2018 | | | 2017 | | | 2016 | | | 2015 | | | 2014 | |
| | | ( in millions of dollars ) | |
Current and Capital Account | | | | | | | | | | | | | | | | | | | | | | | | | | | | |
Current account receipts | | | | | | | | | | | | | | | | | | | | | | | | | | | | |
Goods and services | | | 548,850 | | | | 536,338 | | | | 713,350 | | | | 672,532 | | | | 638,093 | | | | 633,954 | | | | 633,112 | |
Goods | | | 447,407 | | | | 439,540 | | | | 585,199 | | | | 550,262 | | | | 522,301 | | | | 525,313 | | | | 530,629 | |
Services | | | 111,043 | | | | 96,459 | | | | 128,151 | | | | 122,270 | | | | 115,792 | | | | 108,641 | | | | 102,483 | |
Primary income | | | 101,444 | | | | 96,799 | | | | 132,761 | | | | 117,298 | | | | 97,904 | | | | 92,424 | | | | 86,043 | |
Secondary Income | | | 10,850 | | | | 10,135 | | | | 13,768 | | | | 11,972 | | | | 13,248 | | | | 10,928 | | | | 10,682 | |
| | | | | | | | | | | | | | | | | | | | | | | | | | | | |
Total receipts | | | 670,744 | | | | 642,932 | | | | 859,879 | | | | 801,802 | | | | 749,245 | | | | 737,306 | | | | 729,837 | |
| | | | | | | | | | | | | | | | | | | | | | | | | | | | |
| | | | | | | |
Current account payments | | | | | | | | | | | | | | | | | | | | | | | | | | | | |
Goods and services | | | 581,063 | | | | 569,788 | | | | 756,913 | | | | 719,909 | | | | 685,868 | | | | 683,020 | | | | 651,176 | |
Goods | | | 464,397 | | | | 456,750 | | | | 607,329 | | | | 574,405 | | | | 547,349 | | | | 549,065 | | | | 525,052 | |
Services | | | 116,665 | | | | 113,039 | | | | 149,584 | | | | 145,503 | | | | 138,519 | | | | 133,956 | | | | 126,124 | |
Primary income | | | 114,668 | | | | 104,289 | | | | 141,360 | | | | 125,744 | | | | 110,561 | | | | 108,733 | | | | 110,817 | |
Secondary income | | | 13,855 | | | | 12,893 | | | | 17,104 | | | | 16,342 | | | | 15,370 | | | | 15,122 | | | | 14,122 | |
| | | | | | | | | | | | | | | | | | | | | | | | | | | | |
Total payments | | | 709,585 | | | | 686,972 | | | | 915,377 | | | | 861,995 | | | | 811,799 | | | | 806,875 | | | | 776,115 | |
| | | | | | | | | | | | | | | | | | | | | | | | | | | | |
| | | | | | | |
Current account balance | | | | | | | | | | | | | | | | | | | | | | | | | | | | |
Goods and services | | | -32,211 | | | | -33,450 | | | | -43,563 | | | | -47,376 | | | | -47,776 | | | | -49,066 | | | | -18,064 | |
Goods | | | -16,990 | | | | -17,210 | | | | -22,131 | | | | -24,143 | | | | -25,048 | | | | -23,751 | | | | 5,577 | |
Services | | | -15,221 | | | | -16,240 | | | | -21,433 | | | | -23,233 | | | | -22,728 | | | | -25,315 | | | | -23,641 | |
Primary income | | | -3,624 | | | | -7,830 | | | | -8,599 | | | | -8,447 | | | | -12,656 | | | | -16,310 | | | | -24,774 | |
Secondary income | | | -3,005 | | | | -2,758 | | | | -3,336 | | | | -4,371 | | | | -2,121 | | | | -4,193 | | | | -3,440 | |
| | | | | | | | | | | | | | | | | | | | | | | | | | | | |
Total balance | | | -38,841 | | | | -44,039 | | | | -55,499 | | | | -60,194 | | | | -62,553 | | | | -69,569 | | | | -46,278 | |
| | | | | | | | | | | | | | | | | | | | | | | | | | | | |
| | | | | | | |
Capital account balance | | | -89 | | | | -76 | | | | -76 | | | | -76 | | | | -91 | | | | -106 | | | | 398 | |
| | | | | | | |
Financial Account (2) | | | | | | | | | | | | | | | | | | | | | | | | | | | | |
Net lending/net borrowing, from financial account | | | -32,528 | | | | -32,857 | | | | -45,849 | | | | -54,010 | | | | -60,130 | | | | -66,240 | | | | -47,643 | |
| | | | | | | |
Net acquisition of financial assets | | | 133,627 | | | | 77,465 | | | | 147,955 | | | | 226,729 | | | | 195,661 | | | | 211,100 | | | | 149,082 | |
Canadian direct investment abroad | | | 71,384 | | | | 55,565 | | | | 68,639 | | | | 104,747 | | | | 89,558 | | | | 106,456 | | | | 72,437 | |
Canadian portfolio investment | | | 11,710 | | | | 48,216 | | | | 57,532 | | | | 84,657 | | | | 12,885 | | | | 60,108 | | | | 56,433 | |
Foreign debt securities | | | 23,385 | | | | 45,789 | | | | 50,376 | | | | 16,028 | | | | -7,122 | | | | 34,745 | | | | 20,627 | |
Foreign equity and investment fund shares | | | -11,673 | | | | 2,426 | | | | 7,156 | | | | 68,629 | | | | 20,006 | | | | 25,363 | | | | 35,806 | |
Official international reserves | | | -1,184 | | | | -5,490 | | | | -2,004 | | | | 1,053 | | | | 7,481 | | | | 10,933 | | | | 5,887 | |
Other Canadian investment | | | 51,717 | | | | -20,826 | | | | 23,788 | | | | 36,272 | | | | 85,737 | | | | 33,602 | | | | 14,326 | |
| | | | | | | | | | | | | | | | | | | | | | | | | | | | |
Net incurrence of liabilities | | | 166,156 | | | | 110,322 | | | | 193,804 | | | | 280,739 | | | | 255,791 | | | | 277,340 | | | | 196,725 | |
Foreign direct investment in Canada | | | 47,990 | | | | 40,025 | | | | 60,319 | | | | 37,480 | | | | 45,215 | | | | 76,272 | | | | 71,039 | |
Foreign portfolio investment | | | 38,557 | | | | 63,484 | | | | 53,497 | | | | 183,808 | | | | 150,160 | | | | 106,351 | | | | 92,692 | |
Canadian debt securities | | | 36,219 | | | | 47,083 | | | | 27,283 | | | | 126,699 | | | | 98,767 | | | | 94,627 | | | | 67,476 | |
Canadian equity and investment fund shares | | | 2,339 | | | | 16,400 | | | | 26,213 | | | | 57,109 | | | | 51,393 | | | | 11,724 | | | | 25,216 | |
Other foreign investment | | | 79,606 | | | | 6,812 | | | | 79,989 | | | | 59,451 | | | | 60,417 | | | | 94,717 | | | | 32,994 | |
| | | | | | | |
Discrepancy (net errors and omissions) | | | 6,403 | | | | 11,258 | | | | 9,725 | | | | 6,260 | | | | 2,514 | | | | 3,435 | | | | -1,763 | |
Source: Statistics Canada, Canada’s Balance of International Payments.
| (1) | Year-to-date (not annualized). Current and capital account data are seasonally adjusted. Financial account data are not seasonally adjusted. |
| (2) | For the Financial Account, transactions are recorded on a net basis. A plus sign denotes an increase in investment and a minus sign denotes a decrease in investment. |
The current account deficit was $51.8 billion (seasonally adjusted, annualized level) in the first three quarters of 2019. Over the last five years, the three main components of the current account have evolved as follows:
| (1) | Merchandise trade registered a surplus of $5.6 billion in 2014, before returning to deficits of $23.8 billion in 2015, $25.0 billion in 2016, $24.1 billion in 2017 and $22.1 billion in 2018. In the first three quarters of 2019, merchandise trade showed an average deficit of $22.7 billion (annualized level). |
| (2) | The service account deficit narrowed from $23.6 billion in 2014 to $21.4 billion in 2018. The services deficit averaged $20.3 billion (annualized level) in the first three quarters of 2019. |
| (3) | The deficit on primary income narrowed from $24.8 billion in 2014 to $8.6 billion in 2018. The primary income deficit averaged $4.8 billion (annualized level) in the first three quarters of 2019. |
Canada registered a net financial account inflow (net borrowing) of $54.0 billion and $45.8 billion in 2017 and 2018, respectively. The net inflow was $43.4 billion in the first three quarters of 2019 (annualized level).
Non-resident net purchases of Canadian securities6 were $92.7 billion in 2014. The amount of Canadian securities purchased by non-residents since has decreased, reaching $53.5 billion in 2018. In the first three quarters of 2019, portfolio investment from abroad stood at $51.4 billion (annualized level). Foreign direct investment was $71.0 billion in 2014, $76.3 billion in 2015, $45.2 billion in 2016, $37.5 billion in 2017 and $60.3 billion in 2018.
Foreign direct investment in 2018 was led by manufacturing, trade and transportation, and other industries. In the first three quarters of 2019, foreign direct investment at annualized levels was $64.0 billion.
| 6 | Canadian securities include Canadian bonds, money market instruments, equity and investment fund shares. |
13
The table below provides a breakdown of foreign direct investment in Canada for the periods indicated.
FOREIGN DIRECT INVESTMENTIN CANADA
| | | | | | | | | | | | | | | | | | | | | | | | | | | | |
| | | First 3 quarters (1) | | | For the years ended December 31, | |
| | | 2019 | | | 2018 | | | 2018 | | | 2017 | | | 2016 | | | 2015 | | | 2014 | |
| | | (in millions of dollars) | |
All countries | | | 46,761 | | | | 37,325 | | | | 56,315 | | | | 34,424 | | | | 47,796 | | | | 56,057 | | | | 65,186 | |
United States | | | 29,039 | | | | 14,586 | | | | 23,713 | | | | 18,931 | | | | 24,744 | | | | 41,386 | | | | 20,789 | |
All other countries | | | 17,721 | | | | 22,739 | | | | 32,602 | | | | 15,493 | | | | 23,052 | | | | 14,672 | | | | 44,397 | |
All industries | | | 46,761 | | | | 37,325 | | | | 56,315 | | | | 34,424 | | | | 47,796 | | | | 56,057 | | | | 65,186 | |
Energy and mining (2) | | | 15,851 | | | | 5,999 | | | | 6,351 | | | | -4,927 | | | | 10,800 | | | | 3,030 | | | | 16,875 | |
Manufacturing | | | 14,140 | | | | 15,912 | | | | 18,349 | | | | 12,896 | | | | 4,356 | | | | 3,482 | | | | 12,359 | |
Trade and transportation (3) | | | 2,163 | | | | 5,333 | | | | 9,505 | | | | 13,383 | | | | 11,647 | | | | 9,230 | | | | 7,730 | |
Finance and Insurance | | | 4,467 | | | | 2,588 | | | | 4,820 | | | | 4,498 | | | | 9,183 | | | | 219 | | | | 3,323 | |
Management of companies and enterprises | | | 1,590 | | | | 1,880 | | | | 1,677 | | | | 1,348 | | | | 5,088 | | | | 13,971 | | | | 15,202 | |
Other industries (4) | | | 8,548 | | | | 5,613 | | | | 15,613 | | | | 7,225 | | | | 6,724 | | | | 26,125 | | | | 9,697 | |
Source: Statistics Canada, Canada’s Balance of International Payments.
Totals may not add up due to rounding.
| (1) | Year-to-date (not annualized). |
| (2) | This combines the North American Industry Classification System (NAICS) codes 21 and 22. |
| (3) | This combines the North American Industry Classification System (NAICS) codes 41, 44, 45, 48 and 49. |
| (4) | This combines the North American Industry Classification System (NAICS) codes 11, 23, 51, 53, 54, 56, 61, 62, 71, 72, 81 and 91. |
14
FOREIGN EXCHANGE AND INTERNATIONAL RESERVES
Since May 31, 1970, the Canadian dollar has been allowed to float so that the rate of exchange is determined by conditions of supply and demand in the market. Since then, the Canadian dollar has floated between a low of 61.79 U.S. cents in January 2002 and a high of 110.30 U.S. cents in November 2007. The Canadian dollar closed 2018 at an average rate price of 73.30 U.S. cents. From the beginning of 2019 through to September 30, the Canadian dollar average rate price ranged between 73.53 and 76.70 U.S. cents. The Canadian dollar average rate price on September 30, 2019 was 75.51 U.S. cents.
EXCHANGE RATE FOR THE CANADIAN DOLLAR
| | | | | | | | | | | | | | | | | | | | | | | | | | | | | | | | | | | | | | | | | | | | | | | | |
| | | 2019 through September 30 | | | | | | | | | | | | For the years ended December 31, | |
| | 2018 | | | 2017 | | | 2016 | | | 2015 | | | 2014 | | | 2013 | | | 2012 | | | 2011 | | | 2010 | | | 2009 | | | 2008 | |
| | | (in U.S. cents) | |
High | | | 76.70 | | | | 81.38 | | | | 82.45 | | | | 80.19 | | | | 85.62 | | | | 94.44 | | | | 101.88 | | | | 103.71 | | | | 106.30 | | | | 100.69 | | | | 97.55 | | | | 102.98 | |
Low | | | 73.53 | | | | 73.30 | | |
| 72.76
|
| | | 68.21 | | | | 71.41 | | | | 85.68 | | | | 93.14 | | | | 95.76 | | | | 93.83 | | | | 92.18 | | | | 76.53 | | | | 76.88 | |
Source: Bank of Canada.
Canada does not have foreign exchange controls. Foreign exchange operations conducted by the Bank of Canada on behalf of the Minister of Finance are directed toward the maintenance of orderly conditions in the foreign exchange market in Canada through the purchase or sale of United States dollars for Canadian dollars. The following table shows Canada’s official international reserves on the dates indicated.
CANADA’S OFFICIAL INTERNATIONAL RESERVES
| | | | | | | | | | | | | | | | | | | | | | | | | | | | | | | | | | | | | | | | | | | | | | | | |
| | | At
September 30,
2019 | | | | | | | | | At December 31, | |
| | 2018 | | | 2017 | | | 2016 | | | 2015 | | | 2014 | | | 2013 | | | 2012 | | | 2011 | | | 2010 | | | 2009 | | | 2008 | |
| | | (in millions of U.S. dollars) | |
Total | |
| 85,238
|
| | | 83,926 | | | | 86,625 | | | | 82,718 | | | | 79,753 | | | | 74,700 | | | | 71,937 | | | | 68,546 | | | | 65,819 | | | | 57,151 | | | | 54,357 | | | | 43,872 | |
Source: Department of Finance.
As of September 30, 2019, Canada’s official international reserves stood at U.S.$85,238 million equivalent. The total was composed of U.S.$49,662 million held in U.S. dollar denominated assets, U.S.$14,197 million equivalent in euro denominated assets, U.S.$7,269 million equivalent in pound sterling assets, U.S.$2,713 million equivalent in yen denominated assets, U.S.$8,277 million in Special Drawing Rights (“SDRs”) and U.S.$3,120 million in the form of the reserve position in the International Monetary Fund (“IMF”).
Beginning in 1978, transactions relating to foreign currency debt undertaken for reserve management purposes have had an important effect on the level of official reserves. The “Canada Bills” program was launched in October 1986. Under this program, U.S. dollar-denominated short-term notes are issued in the United States money market. There were U.S.$1,931 million of Canada Bills outstanding on September 30, 2019. The “Canada Notes” program was launched in June 2010. Canada Notes are interest-bearing marketable notes that mature not less than nine months from their date of issue. As of September 30, 2019, there were U.S.$1,000 million of Canada Notes outstanding. A Euro Medium-Term Notes (EMTN) program was launched in October 2011. EMTNs are interest bearing, foreign currency medium-term notes issued outside the United States and Canada and maturities can range from short-term to long-term. As of September 30, 2019, there were U.S.$250 million and Euro 150 million of EMTNs outstanding. As of September 30, 2019, U.S.$6,000 million and Euro 2,000 million in foreign currency denominated bonds remained outstanding comprised of three global bond issues (two U.S. dollar issues and one euro issue).
15
GOVERNMENT FINANCES
Introduction
The financial structure of the Government of Canada rests on a constitutional and statutory framework dating back to the British North America Act, 1867. That Act, which has been renamed the Constitution Act, 1867, gave constitutional foundation to the principles of financing that are basic to responsible government, while other necessary financial administrative machinery and procedures were established by subsequent legislation, most notably the Financial Administration Act. The proclamation in 1982 of the Constitution Act, 1982 terminated British legislative jurisdiction over Canada’s Constitution in accordance with an amending formula that permits amendment of the Constitution without resorting to the Parliament of the United Kingdom.
Within the confines of the Constitution, the authority of Parliament is supreme. Ultimate control of the public purse and the financial structure of the Government rests with Parliament. This is reflected in the fundamental principles that no tax shall be imposed and no money shall be spent without the authority of Parliament, and that expenditures shall be made only for the purposes authorized by Parliament.
Public money received by the Government is deposited in the Consolidated Revenue Fund of Canada. Withdrawals of public money out of the Consolidated Revenue Fund may not be made without the authority of Parliament.
The Government has two major sources of money: budgetary revenues and borrowing. The main sources of revenue are personal and corporate income taxes, employment insurance premiums and excise taxes and duties. These revenues are authorized by specific acts passed by Parliament. The Government’s revenues also include those of consolidated Crown corporations and other entities, net income/loss from enterprise Crown corporations (such as the Bank of Canada, Export Development Canada and the Canada Mortgage and Housing Corporation), foreign exchange revenues and other revenues (primarily revenues from the sales of goods and services). The other major source of money to finance Government operations is borrowing. Borrowing authority is established by acts of Parliament and borrowing limits are established by acts of Parliament and by Orders in Council. The Borrowing Authority Act, which recently entered into force by order of the Governor in Council on November 23, 2017, provides authorization for the borrowing of money on behalf of Her Majesty in right of Canada, by way of the issue and sale of securities. Such borrowings under the Borrowing Authority Act are not to exceed $1,168 billion; provided that such amount shall exclude any amounts borrowed for the purpose of refinancing existing debt and addressing contingent liabilities or in extraordinary circumstances, including in the event of a natural disaster or to promote the stability or maintain the efficiency of the financial system in Canada. The main sources of borrowing are marketable bonds and treasury bills.
Parliament authorizes the disbursement of moneys out of the Consolidated Revenue Fund by means of Appropriation Acts passed on an annual basis by Parliament and based on the Main Estimates submitted by the various departments. In addition to the Appropriation Acts, authority for payments may also be found in certain statutes which authorize certain payments out of the Consolidated Revenue Fund. Expenditures for public debt charges, social security payments and transfers to other levels of government are authorized in this way. Appropriations may also be made by the Governor in Council for urgent payments. Such appropriations may be made only when Parliament is not in session and must be laid before Parliament during the subsequent session.
Information on the Government’s planned revenues and expenditures is presented to Parliament primarily in two documents: the Budget and the Main Estimates, which are both presented in the House of Commons. The Budget, which may be delivered at any time during the fiscal year, provides the occasion on which the Minister of Finance generally brings under review the whole financial position of the Government, present and prospective, and announces the Government’s plans and proposals. The Main Estimates are tabled (i.e., introduced) once each year and outline the Parliamentary authority, either existing or required, for disbursements. Supplementary Estimates may also be tabled during the year to provide authority for spending as the need arises.
The considerations for overall resource availability and demands for new policies and programs are reconciled through the establishment of five year economic and fiscal projections reflecting Government priorities. The projections are released in an Economic and Fiscal Update in the fall for pre-budget consultation purposes. To incorporate objective economic assumptions, the fiscal projection is based on the average of private sector economic forecasts.
For financial reporting purposes, the Government of Canada includes all departments, agencies, corporations, organizations and funds which are controlled by the Government. For financial reporting purposes, control is defined as the power to govern the financial and operating policies of an organization with benefits from the organization’s activities being expected, or the risk of loss being assumed by the Government. All organizations that are defined as departments and as Crown corporations in the Financial Administration Act are included for financial reporting purposes. Other organizations not listed in the Financial Administration Act may also meet the definition of control and they are included in the Government’s reporting entity if their revenues, expenses, assets or liabilities are significant. The financial activities of all these entities are consolidated in the Government’s financial statements, except for enterprise Crown corporations and other government business enterprises, which are reported under the modified equity basis of accounting. Enterprise Crown corporations and other government business enterprises are defined as those entities which are not dependent on parliamentary appropriations and whose principal activity and source of revenue is the sale of goods and services to outside parties. The remaining Crown corporations, which rely on the Government for most of their financing, are classified as consolidated Crown corporations.
The primary source of information on all actual financial transactions of the Government is the Public Accounts of Canada, which is required by the Financial Administration Act to be tabled in Parliament each year. The other chief accountability reports are the statements of budgetary and non-budgetary financial transactions and of the Government’s cash position published monthly in The Fiscal Monitor and in the Annual Financial Report.
The financial statements of the Government of Canada are presented on an accrual basis of accounting, recording government revenues and expenses when they are earned or incurred, regardless of when the cash is received or paid. The Government’s main measure of financial performance is the budgetary balance, which provides the most comprehensive and up-to-date picture of the financial situation. The accumulated deficit, or federal debt, is equal to total liabilities less total assets – both financial and non-financial. Financial assets include cash and cash equivalents, accounts receivable, foreign exchange accounts, loans, investments and advances and public sector pension assets. Non-financial assets include tangible capital assets, such as land and buildings, inventories and prepaid expenses. The annual change in the accumulated deficit is equal to the budgetary balance plus other comprehensive income or loss. Net debt, which is a different measure of the Government’s financial position, represents total liabilities less financial assets.
16
Fiscal Policy
In 2018-19, the Government posted a budgetary deficit of $14.0 billion, compared to a budgetary deficit of $19.0 billion in 2017-18. Federal debt was 30.9% of GDP in fiscal 2018-19, down from 31.3% in the previous year and remaining well below its peak of 66.8% in fiscal 1995-96. Program expenses increased by $14.6 billion, or 4.7%, over the prior year. As a percentage of GDP, program expenses increased to 14.6% in fiscal 2018-19, up 0.2 percentage points from fiscal 2017-18. As a percentage of GDP, public debt charges were 1.0% in fiscal 2018-19.
The financial requirement/source measures the difference between cash coming in to the Government and cash going out. It differs from the budgetary balance in that it includes cash transactions in loans, investments and advances, pensions and other employee and veteran future benefits, other specified purpose accounts, foreign exchange activities, and changes in other financial assets, liabilities and non-financial assets. These activities are included as part of non-budgetary transactions. Adjustments for the effects of non-cash items included in the budgetary balance are also reflected in non-budgetary transactions.
There was a total financial requirement of $12.7 billion in 2018-19, compared to a financial requirement of $9.4 billion in 2017-18. The Government financed this financial requirement of $12.7 billion and increased its cash balances by $3.0 billion by increasing unmatured debt by $15.7 billion.
Unmatured debt as a percentage of GDP stood at 33.2% in fiscal 2018-19, down 23.2 percentage points from the peak of 56.4% in fiscal 1995-96.
Budgetary Revenue
The Government reports revenue on an accrual basis in the period in which the event that gave rise to the revenue took place. Income tax revenue is recognized when the taxpayer has earned the income subject to tax. Personal income taxes accounted for 49.3% of Government revenue in fiscal 2018-19 while corporate income taxes accounted for 15.2% of Government revenue.
There are currently five federal income tax brackets for individuals: 15%, 20.5%, 26%, 29% and 33%. For 2019, the taxable income thresholds at which the brackets apply, indexed annually to account for inflation, are as follows: 15% on taxable income up to $47,630, 20.5% on taxable income over $47,630 and up to $95,259, 26% on taxable income over $95,259 and up to $147,667, 29% on taxable income over $147,667 and up to $210,371 and 33% on taxable income above $210,371.
The general federal corporate income tax rate in 2019 is 15%. The small business deduction reduces the federal corporate income tax rate applied to the first $500,000 of qualifying active business income in a taxation year of a Canadian-controlled private corporation to 9%, effective January 1, 2019.
Capital gains are taxed at a preferred income tax rate under which only one-half of a realized gain is included in income, and then subject to tax at the applicable personal or corporate income tax rate.
The federal Goods and Services Tax (GST) is a broad-based value-added tax, which is applied to the sale of most goods and services at a rate of 5%. Basic groceries, prescription drugs, residential rents, sales of existing houses and educational and healthcare services are generally not subject to tax.
Federal excise taxes and duties are imposed on selected goods, including certain fuel, tobacco and alcohol products. Customs duties are imposed on a wide range of goods.
In addition, the Government obtains non-tax revenues in the form of revenues from consolidated Crown corporations and other entities, net income/loss from enterprise Crown corporations (such as the Bank of Canada, Export Development Canada and the Canada Mortgage and Housing Corporation), net foreign exchange revenues, employment insurance premium revenues and other revenues (primarily from the sale of goods and services).
Budgetary Expenses
Budgetary expenses encompass the cost of servicing the public debt, the operating expenses of Government departments and agencies, and transfer payments to other levels of government, organizations and individuals.
Transfer payments, which make up about two-thirds of the government’s total spending include a range of federal social spending programs designed to enhance the quality of life of Canadians, particularly those who have modest incomes or who are disadvantaged. Transfer payments include income support — most notably for the elderly and unemployed; transfers to the provinces for health, education and social assistance; and programs for aboriginal Canadians.
17
The following table sets forth budgetary revenues, budgetary expenses, the annual surplus/deficit and the accumulated deficit for the years shown.
GOVERNMENTOF CANADA – DETAILED CONSOLIDATED STATEMENTOF OPERATIONSAND ACCUMULATED DEFICIT
(in millions of dollars)
| | | | | | | | | | | | | | | | | | | | |
| | | Year ended March 311,2,3 | |
| | | 2019 | | | 2018 | | | 2017 | | | 2016 | | | 2015 | |
Revenues | | | | | | | | | | | | | | | | | | | | |
Tax revenues | | | | | | | | | | | | | | | | | | | | |
Income tax revenues | | | | | | | | | | | | | | | | | | | | |
Personal | | | 163,881 | | | | 153,619 | | | | 143,680 | | | | 144,897 | | | | 135,743 | |
Corporate | | | 50,368 | | | | 47,805 | | | | 42,216 | | | | 41,444 | | | | 39,447 | |
Non-resident | | | 9,370 | | | | 7,845 | | | | 7,071 | | | | 6,505 | | | | 6,216 | |
| | | 223,619 | | | | 209,269 | | | | 192,967 | | | | 192,846 | | | | 181,406 | |
Other taxes and duties | | | | | | | | | | | | | | | | | | | | |
Goods and services tax | | | 38,221 | | | | 36,751 | | | | 34,368 | | | | 32,952 | | | | 31,349 | |
Energy taxes | | | 5,802 | | | | 5,739 | | | | 5,634 | | | | 5,565 | | | | 5,528 | |
Customs import duties | | | 6,881 | | | | 5,416 | | | | 5,478 | | | | 5,372 | | | | 4,581 | |
Other excise taxes and duties | | | 6,323 | | | | 5,913 | | | | 5,868 | | | | 5,916 | | | | 5,724 | |
| | | 57,227 | | | | 53,819 | | | | 51,348 | | | | 49,805 | | | | 47,182 | |
| | | | | | | | | | | | | | | | | | | | |
Total tax revenues | | | 280,846 | | | | 263,088 | | | | 244,315 | | | | 242,651 | | | | 228,588 | |
| | | | | | | | | | | | | | | | | | | | |
Employment insurance premiums | | | 22,295 | | | | 21,140 | | | | 22,125 | | | | 23,070 | | | | 22,564 | |
Other revenues | | | | | | | | | | | | | | | | | | | | |
Enterprise Crown corporations and other government business enterprises | | | 7,101 | | | | 7,731 | | | | 5,655 | | | | 7,916 | | | | 9,306 | |
Other | | | 20,309 | | | | 17,784 | | | | 16,640 | | | | 16,649 | | | | 18,092 | |
Net foreign exchange | | | 1,667 | | | | 1,473 | | | | 2,133 | | | | 2,322 | | | | 1,355 | |
| | | | | | | | | | | | | | | | | | | | |
Total other revenues | | | 29,077 | | | | 26,988 | | | | 24,428 | | | | 26,887 | | | | 28,753 | |
| | | | | | | | | | | | | | | | | | | | |
Total revenues | | | 332,218 | | | | 311,216 | | | | 290,868 | | | | 292,608 | | | | 279,905 | |
| | | | | | | | | | | | | | | | | | | | |
Expenses | | | | | | | | | | | | | | | | | | | | |
Program expenses | | | | | | | | | | | | | | | | | | | | |
Transfer payments | | | | | | | | | | | | | | | | | | | | |
Old age security benefits, guaranteed income supplement and spouse’s allowance | | | 53,366 | | | | 50,644 | | | | 48,162 | | | | 45,461 | | | | 44,103 | |
Major transfer payments to other levels of government | | | | | | | | | | | | | | | | | | | | |
Canada health transfer | | | 38,568 | | | | 37,124 | | | | 36,057 | | | | 34,025 | | | | 32,114 | |
Canada social transfer | | | 14,161 | | | | 13,748 | | | | 13,348 | | | | 12,959 | | | | 12,582 | |
Fiscal arrangements | | | 17,929 | | | | 17,575 | | | | 17,145 | | | | 16,893 | | | | 16,271 | |
Other major transfers | | | 5,267 | | | | 2,072 | | | | 2,102 | | | | 1,973 | | | | 2,142 | |
| | | | | | | | | | | | | | | | | | | | |
| | | 75,925 | | | | 70,519 | | | | 68,652 | | | | 65,850 | | | | 63,109 | |
| | | | | | | | | | | | | | | | | | | | |
Employment insurance | | | 18,888 | | | | 19,715 | | | | 20,711 | | | | 19,419 | | | | 18,052 | |
Children’s benefits | | | 23,882 | | | | 23,432 | | | | 22,065 | | | | 18,025 | | | | 14,303 | |
Fuel charge proceeds returned | | | 664 | | | | – | | | | – | | | | – | | | | – | |
Other transfer payments | | | 51,753 | | | | 47,138 | | | | 41,580 | | | | 34,874 | | | | 35,126 | |
| | | | | | | | | | | | | | | | | | | | |
Total transfer payments | | | 224,478 | | | | 211,448 | | | | 201,170 | | | | 183,629 | | | | 174,693 | |
Other expenses | | | 98,438 | | | | 96,840 | | | | 87,423 | | | | 90,003 | | | | 81,555 | |
| | | | | | | | | | | | | | | | | | | | |
Total program expenses | | | 322,916 | | | | 308,288 | | | | 288,593 | | | | 273,632 | | | | 256,248 | |
Public debt charges | | | 23,266 | | | | 21,889 | | | | 21,232 | | | | 21,837 | | | | 24,207 | |
| | | | | | | | | | | | | | | | | | | | |
Total expenses | | | 346,182 | | | | 330,177 | | | | 309,825 | | | | 295,469 | | | | 280,455 | |
| | | | | | | | | | | | | | | | | | | | |
Annual surplus or deficit (–) | | | –13,964 | | | | –18,961 | | | | –18,957 | | | | –2,861 | | | | –550 | |
Accumulated deficit at beginning of year – as previously reported | | | –671,254 | | | | –631,899 | | | | –615,986 | | | | –612,330 | | | | –611,881 | |
Accounting change and restatement – Public sector pensions | | | – | | | | –19,641 | | | | –18,454 | | | | –16,580 | | | | –14,119 | |
Other comprehensive income or loss (–) | | | –232 | | | | –753 | | | | 1,857 | | | | –2,669 | | | | –2,360 | |
| | | | | | | | | | | | | | | | | | | | |
Accumulated deficit at end of year | | | –685,450 | | | | –671,254 | | | | –651,540 | | | | –634,440 | | | | –628,910 | |
| | | | | | | | | | | | | | | | | | | | |
Source: Public Accounts of Canada 2019 (Volume 1, Table 1.1).
| 1 | The figures up to 2018 have been restated to reflect the change in revenue recognition criteria for consolidated Crown corporations. Other than the 2018 restated figures, the restatements in the prior years have not been audited. |
| 2 | Certain other comparative figures have been reclassified to conform to the current year’s presentation. |
| 3 | The figures up to 2017 have been restated in the fiscal year 2018 to reflect the impact of the change in methodology for the determination of the discount rate for unfunded pension benefits. Other than the 2017 restated figures, the restatements in the prior years have not been audited. |
18
Loans, Investments and Advances
The Government’s financial assets include loans and advances to, or investments in, its enterprise Crown corporations, other governments and other individuals and organizations. Loans, investments and advances by the Government resulted in a net financial requirement of $7.8 billion in fiscal 2018-19.
Pension and Other Future Benefits
Public Sector Pensions. The Government is responsible for defined benefit pension plans covering substantially all of its employees (including the Public Service, Canadian Forces, Royal Canadian Mounted Police and certain Crown corporations) as well as federally appointed judges and Members of Parliament. Pension benefits are generally calculated by reference to the highest earnings for a specific period of time. They are related to years of service and are indexed to inflation. Until March 31, 2000, separate market invested funds were not set aside to provide for payment of these pension benefits. Beginning on April 1, 2000, new employer and employee contributions to the pension plans, less benefit payments and other charges, are transferred to the Public Sector Pension Investment Board. The Board’s goal is to achieve maximum rates of return on investments without undue risk, while respecting the requirements and financial obligations of each of the public sector pension plans. At March 31, 2019, the Government’s liability in respect of pensions net of public sector pension assets, totaled $166.4 billion. This net liability is mostly comprised of the accrued benefit obligation determined as of March 31, 2019, which amounted to $353.2 billion, less pension assets of $169.0 billion and unrecognized actuarial losses of $18.2 billion. In fiscal 2018-19, the net pension liability decreased by $2.4 billion.
Other Employee and Veteran Future Benefits. The Government also sponsors a variety of other future benefit plans from which employees and former employees can benefit, during or after employment or upon retirement. The cost of these benefits can accrue either during the service life of employees or upon occurrence of an event giving rise to the liability under the terms of the plans. The Government is liable for future payments for disability and other benefits paid to war veterans, as well as Canadian Forces retired veterans and still-serving members, their beneficiaries and dependants. Other significant benefits for which the Government is liable include the health care and dental plans available to retired employees and their dependants, severance benefits, accumulated sick leave entitlements, and workers’ compensation benefits. All these plans are unfunded. The health care and dental plans are contributory plans.
Other Liabilities
Canada Pension Plan Liability. The Canada Pension Plan (the “Plan”) was established in 1965 and is a federal-provincial program for compulsory and contributory social insurance. It operates in all parts of Canada, except for Quebec which has a comparable program. The Plan is excluded from the Government’s reporting entity because changes to the Plan require the agreement of two thirds of participating provinces and it is therefore not controlled by the Government. The Government administers the Plan under joint control with the participating provinces. Until 1997, the Plan was financed on an essentially pay-as-you-go basis, which means that pensions and benefits were paid out of current contributions (with some interest earned by the Canada Pension Plan Investment Fund). In December 1997, the Government passed legislation to ensure that the Plan remains sustainable over the long term and to allow fuller funding. Changes included a more rapid increase in contribution rates, a new investment policy, as well as changes to calculations of, and eligibility criteria to, some benefits. Under the new investment policy which came into effect April 1, 1998, the Plan’s funds are prudently invested by an independent Canada Pension Plan Investment Board in a diversified portfolio that includes equities, under generally the same rules that apply to other private and public pension funds. Following federal and provincial approval to enhance the Plan, legislation was enacted in March of 2017 to increase the income replacement rate from one-quarter to one-third of pensionable earnings and increase the amount of maximum pensionable earnings by 14%.
Contributions are paid equally by employers and employees, and self-employed workers pay the full amount. To fund the enhanced benefits, annual Canada Pension Plan contributions will increase modestly over 7 years, starting in 2019, from 9.9% to 11.9% up to the current yearly maximum pensionable earnings limit and 8% on earnings between 100% and 114% of this limit.
As administrator, the Government’s authority to spend is limited to the Plan’s net assets of $397.0 billion at March 31, 2019 ($361.0 billion at March 31, 2018). Of these assets, $144.4 billion was transferred to the Canada Pension Plan Investment Board and $0.2 billion was a direct liability of the Government. The balance of $252.5 billion represents accumulated net income from Canada Pension Plan Investment Board’s operations and net receivables. The Government’s liability to the Canada Pension Plan Account represents the Plan’s deposit with the Receiver General of Canada.
Other Liabilities. The Government acts as an insurer and/or administrator of a number of annuities and deposit and trust accounts, as well as specified purpose accounts. The balance outstanding of these accounts amounted to $5.7 billion at March 31, 2019.
Non-Financial Assets
Non-financial assets include the net book value of the Government’s tangible capital assets. Tangible capital assets include land, buildings, works and infrastructure such as roads and bridges, machinery and equipment, ships, aircraft and other vehicles. Non-financial assets also include inventories and prepaid expenses. Non-financial assets increased to $86.7 billion in fiscal 2018-19, up $5.0 billion from fiscal 2017-18.
Other Transactions
This category includes taxes receivable, other accounts receivable, the provincial, territorial and Aboriginal tax collection agreements account, amounts payable to taxpayers and other liabilities. These transactions, due to their nature, are subject to wide fluctuations. They resulted in a financial source of $9.9 billion in fiscal 2018-19, compared to a financial source of $4.3 billion in fiscal 2017-18.
Foreign Exchange Accounts
Foreign exchange accounts include all transactions in international reserves held in the Exchange Fund Account (“EFA”) and balances with the International Monetary Fund. The objectives of the EFA are to provide general foreign currency liquidity for the Government and promote orderly conditions in the foreign exchange market. The EFA includes foreign currency investments, and assets related to Canada’s commitment to the International Monetary Fund. Transactions in foreign exchange accounts resulted in a financial requirement of $2.8 billion in 2018-19, compared to a financial source of $1.9 billion in 2017-18.
19
DETAILED CONSOLIDATED STATEMENTOF NON-BUDGETARY TRANSACTIONS, NON-FINANCIAL ASSETSAND
FOREIGN EXCHANGE TRANSACTIONS
(in millions of dollars)
| | | | | | | | | | | | | | | | | | | | |
| | | Year ended March 311,2 | |
| | | 2019 | | | 2018 | | | 2017 | | | 2016 | | | 2015 | |
Loans, Investments and Advances | | | | | | | | | | | | | | | | | | | | |
Enterprise Crown corporations and other government business enterprises | | | | | | | | | | | | | | | | | | | | |
Loans and advances | | | | | | | | | | | | | | | | | | | | |
Canada Mortgage and Housing Corporation | | | 592 | | | | 1,124 | | | | 720 | | | | 177 | | | | 10,465 | |
Business Development Bank of Canada | | | –1,765 | | | | –1,659 | | | | –1,869 | | | | –1,266 | | | | –1,356 | |
Farm Credit Canada | | | –1,854 | | | | –2,324 | | | | –2,246 | | | | –747 | | | | –662 | |
Canadian Development Investment Corporation | | | –4,790 | | | | – | | | | – | | | | – | | | | – | |
Other | | | 14 | | | | –13 | | | | –115 | | | | –7 | | | | –185 | |
| | | –7,803 | | | | –2,872 | | | | –3,510 | | | | –1,843 | | | | 8,262 | |
Investments | | | | | | | | | | | | | | | | | | | | |
Share of annual profit | | | –5,920 | | | | –6,959 | | | | –4,920 | | | | –7,316 | | | | –8,365 | |
Other comprehensive loss or income (–) | | | 232 | | | | 753 | | | | –1,857 | | | | 2,669 | | | | 2,360 | |
Dividends | | | 6,427 | | | | 8,058 | | | | 2,320 | | | | 4,002 | | | | 2,341 | |
Capital | | | –125 | | | | –65 | | | | –125 | | | | 973 | | | | 1,030 | |
Transition adjustment and other | | | – | | | | – | | | | – | | | | – | | | | 143 | |
| | | 614 | | | | 1,787 | | | | –4,582 | | | | 328 | | | | –2,491 | |
| | | | | | | | | | | | | | | | | | | | |
Total | | | –7,189 | | | | –1,085 | | | | –8,092 | | | | –1,515 | | | | 5,771 | |
Less: | | | | | | | | | | | | | | | | | | | | |
Loans expected to be repaid from future appropriations | | | 204 | | | | 264 | | | | 218 | | | | 221 | | | | 353 | |
Unamortized discounts and premiums | | | 1 | | | | –1 | | | | 1 | | | | 5 | | | | –22 | |
| | | | | | | | | | | | | | | | | | | | |
Total | | | –7,394 | | | | –1,348 | | | | –8,311 | | | | –1,741 | | | | 5,440 | |
| | | | | | | | | | | | | | | | | | | | |
Other loans, investments and advances | | | | | | | | | | | | | | | | | | | | |
Portfolio investments | | | – | | | | 5 | | | | – | | | | 5 | | | | 10 | |
National governments, including developing countries | | | 55 | | | | 78 | | | | –49 | | | | 22 | | | | –606 | |
International organizations | | | –989 | | | | –888 | | | | –703 | | | | –972 | | | | –1,039 | |
Provincial and territorial governments | | | –16 | | | | –98 | | | | 126 | | | | 693 | | | | 765 | |
Other loans, investments and advances | | | –1,242 | | | | 760 | | | | 32 | | | | –1,352 | | | | –1,751 | |
| | | | | | | | | | | | | | | | | | | | |
Total | | | –2,192 | | | | –143 | | | | –594 | | | | –1,604 | | | | –2,621 | |
Less: allowance for valuation | | | –2,045 | | | | 874 | | | | –856 | | | | –1,069 | | | | –1,135 | |
| | | | | | | | | | | | | | | | | | | | |
Total | | | –147 | | | | –1,017 | | | | 262 | | | | –535 | | | | –1,486 | |
| | | | | | | | | | | | | | | | | | | | |
Total loans, investments & advances | | | –7,541 | | | | –2,365 | | | | –8,049 | | | | –2,276 | | | | 3,954 | |
| | | | | | | | | | | | | | | | | | | | |
Pensions and Other Future Benefits | | | | | | | | | | | | | | | | | | | | |
Public sector pensions | | | –2,414 | | | | –757 | | | | 505 | | | | 1,061 | | | | 1,638 | |
Other employee and veteran future benefits | | | 9,069 | | | | 11,225 | | | | 7,887 | | | | 9,541 | | | | 4,181 | |
| | | | | | | | | | | | | | | | | | | | |
Total pensions and other future benefits | | | 6,655 | | | | 10,468 | | | | 8,392 | | | | 10,602 | | | | 5,819 | |
| | | | | | | | | | | | | | | | | | | | |
Other Liabilities | | | | | | | | | | | | | | | | | | | | |
Canada Pension Plan Account | | | 131 | | | | –74 | | | | 71 | | | | –177 | | | | 72 | |
Other liabilities | | | 104 | | | | 55 | | | | 16 | | | | –223 | | | | 16 | |
| | | | | | | | | | | | | | | | | | | | |
Total other liabilities | | | 235 | | | | –19 | | | | 87 | | | | –400 | | | | 88 | |
| | | | | | | | | | | | | | | | | | | | |
Non-Financial Assets | | | | | | | | | | | | | | | | | | | | |
Tangible capital assets | | | –5,107 | | | | –4,159 | | | | –3,838 | | | | –2,491 | | | | –1,405 | |
Inventories | | | 78 | | | | 163 | | | | 379 | | | | 29 | | | | 66 | |
Prepaid expenses and other | | | –12 | | | | 77 | | | | –86 | | | | 96 | | | | –31 | |
| | | | | | | | | | | | | | | | | | | �� | |
Total non-financial assets | | | –5,041 | | | | –3,919 | | | | –3,545 | | | | –2,366 | | | | –1,370 | |
| | | | | | | | | | | | | | | | | | | | |
Other Transactions | | | | | | | | | | | | | | | | | | | | |
Taxes receivable | | | –4,526 | | | | –12,521 | | | | –4,666 | | | | –7,349 | | | | –6,010 | |
Other accounts receivable | | | 2,535 | | | | –4,064 | | | | –177 | | | | –7,108 | | | | 675 | |
Provincial, Territorial and Aboriginal Tax Agreements Account | | | –351 | | | | 5,034 | | | | –1,942 | | | | 2,780 | | | | 951 | |
Amounts payable related to tax | | | 3,324 | | | | 6,799 | | | | 1,380 | | | | –2,501 | | | | 3,598 | |
Other liabilities | | | 8,936 | | | | 9,016 | | | | 3,386 | | | | 3,208 | | | | 5,309 | |
| | | | | | | | | | | | | | | | | | | | |
Total other transactions | | | 9,918 | | | | 4,264 | | | | –2,019 | | | | –10,970 | | | | 4,523 | |
| | | | | | | | | | | | | | | | | | | | |
Foreign Exchange Accounts | | | | | | | | | | | | | | | | | | | | |
International reserves held in the Exchange Fund Account | | | –1,770 | | | | 1,238 | | | | –5,289 | | | | –9,418 | | | | –14,596 | |
International Monetary Fund — Subscriptions | | | 198 | | | | –755 | | | | 278 | | | | –9,041 | | | | –246 | |
International Monetary Fund — Loans | | | 229 | | | | 350 | | | | 153 | | | | 75 | | | | 312 | |
| | | –1,343 | | | | 833 | | | | –4,858 | | | | –18,384 | | | | –14,530 | |
Less: International Monetary Fund | | | | | | | | | | | | | | | | | | | | |
Special drawing rights allocations | | | 107 | | | | –409 | | | | 150 | | | | –493 | | | | –231 | |
Notes payable | | | 1,300 | | | | –617 | | | | 250 | | | | –9,370 | | | | –1,543 | |
| | | 1,407 | | | | –1,026 | | | | 400 | | | | –9,863 | | | | –1,774 | |
| | | | | | | | | | | | | | | | | | | | |
Total foreign exchange accounts | | | –2,750 | | | | 1,859 | | | | –5,258 | | | | –8,521 | | | | –12,756 | |
| | | | | | | | | | | | | | | | | | | | |
Source: Public Accounts of Canada 2019 (Volume 1, Tables 1.5, 1.6).
| 1 | The figures up to 2018 have been restated to reflect the change in revenue recognition criteria for consolidated Crown corporations. Other than the 2018 restated figures, the restatements in the prior years have not been audited. |
| 2 | The figures up to 2017 have been restated in the fiscal year 2018 to reflect the impact of the change in methodology for the determination of the discount rate for unfunded pension benefits. Other than the 2017 restated figures, the restatements in the prior years have not been audited. |
20
Unmatured Market Debt
The Government’s unmatured market debt represents financial obligations resulting from the sale of marketable bonds, treasury bills, Canada Savings Bonds, Canada Premium Bonds, Canada Bills, Canada Notes, Euro-Medium Term Notes and global foreign currency marketable bonds.
Borrowing is one of the two major sources of money available to the Government to finance its operations. The changes in unmatured market debt payable in Canadian currency have been broadly consistent with changes in financial requirements. The changes in unmatured market debt payable in foreign currency have been associated with developments in foreign exchange markets and related requirements to supplement foreign exchange reserves through foreign borrowing.
UNMATURED MARKET DEBT
(Principal Amount Outstanding)
| | | | | | | | | | | | | | | | | | | | | | | | |
| | | At Sept. 30,
2019 | | | At March 31, | |
| | 2019 | | | 2018 | | | 2017 | | | 2016 | | | 2015 | |
| | | (in millions) | |
Canadian Currency: | | | | | | | | | | | | | | | | | | | | | | | | |
Marketable bonds | | $ | 583,730 | | | $ | 569,169 | | | $ | 575,796 | | | $ | 535,861 | | | $ | 504,121 | | | $ | 487,413 | |
Treasury bills | | | 134,200 | | | | 134,300 | | | | 110,700 | | | | 136,700 | | | | 138,100 | | | | 135,700 | |
Canada Savings Bonds | | | 705 | | | | 749 | | | | 1,628 | | | | 3,266 | | | | 3,612 | | | | 3,910 | |
Canada Premium Bonds | | | 440 | | | | 487 | | | | 957 | | | | 1,267 | | | | 1,464 | | | | 1,750 | |
| | | | | | | | | | | | | | | | | | | | | | | | |
Total Canadian currency | | | 719,074 | | | | 704,706 | | | | 689,082 | | | | 677,094 | | | | 647,297 | | | | 628,773 | |
| | | | | | | | | | | | | | | | | | | | | | | | |
Foreign Currency:(1) | | | | | | | | | | | | | | | | | | | | | | | | |
Canada Bills | | | 2,557 | | | | 2,699 | | | | 2,591 | | | | 3,521 | | | | 4,747 | | | | 3,789 | |
Canada Notes | | | 1,324 | | | | 1,737 | | | | 1,675 | | | | 1,729 | | | | 1,558 | | | | 1,203 | |
Euro Medium-Term Notes | | | 548 | | | | 559 | | | | 882 | | | | 878 | | | | 871 | | | | 521 | |
Other marketable bonds(2) | | | 10,834 | | | | 11,020 | | | | 10,926 | | | | 11,508 | | | | 15,362 | | | | 14,823 | |
| | | | | | | | | | | | | | | | | | | | | | | | |
Total foreign currency | | | 15,263 | | | | 16,015 | | | | 16,074 | | | | 17,636 | | | | 22,539 | | | | 20,336 | |
| | | | | | | | | | | | | | | | | | | | | | | | |
Total Unmatured Market Debt | | $ | 734,337 | | | $ | 720,721 | | | $ | 705,156 | | | $ | 694,731 | | | $ | 669,835 | | | $ | 649,109 | |
| | | | | | | | | | | | | | | | | | | | | | | | |
Source: Bank of Canada, Department of Finance.
Note: Amounts may not add due to rounding.
| (1) | Foreign currency debt is converted to Canadian dollars using the following closing exchange rate levels: |
| | | | | | | | | | | | | | | | | | | | | | | | |
| | | At Sept. 30,
2019 | | | At March 31, | |
| | 2019 | | | 2018 | | | 2017 | | | 2016 | | | 2015 | |
United States Dollar | | | 1.3244 | | | | 1.3362 | | | | 1.2884 | | | | 1.3299 | | | | 1.2987 | | | | 1.2666 | |
Euro | | | 1.4437 | | | | 1.4989 | | | | 1.5853 | | | | 1.4189 | | | | 1.4777 | | | | 1.3615 | |
| (2) | Excludes Canada Notes and Euro Medium-Term Notes. Other global foreign currency marketable bonds are comprised of the following amounts (before conversion to Canadian dollars): |
| | | | | | | | | | | | | | | | | | | | | | | | |
| | | At Sept. 30,
2019 | | | At March 31, | |
| | 2019 | | | 2018 | | | 2017 | | | 2016 | | | 2015 | |
| | | (in millions) | |
United States Dollars | | | 6,000 | | | | 6,004 | | | | 6,020 | | | | 6,520 | | | | 9,553 | | | | 9,553 | |
Euro | | | 2,000 | | | | 2,000 | | | | 2,000 | | | | 2,000 | | | | 2,000 | | | | 2,000 | |
21
Total Canadian currency unmatured market debt was $719,074 million on September 30, 2019, an increase of $14,368 million from March 31, 2019. The increase resulted from an increase in outstanding marketable bonds.
Marketable bonds are interest-bearing obligations generally available to all investors. In the period April 1, 2019 to September 30, 2019, the Government issued an aggregate of $60,400 million of marketable bonds in Canadian currency and redeemed $47,469 million (including $14,033 million in repurchased and cancelled bonds), for a net increase of $12,931 million. This was further increased by $1,630 million for the inflation compensation on Real Return Bonds, which resulted in an overall net increase of $14,560 million in marketable bonds.
Treasury bills are obligations issued at a discount with maturities generally of three months, six months and one year. In the period April 1, 2019 to September 30, 2019, the amount of treasury bills outstanding decreased by $100 million.
In Budget 2017, released on March 22, 2017, the Government announced its decision to discontinue the sales of new Canada Savings Bonds and Canada Premium Bonds. All outstanding bonds will continue to be honoured. In the period April 1, 2019 to September 30, 2019, the amount of unmatured Canada Savings Bonds outstanding decreased by $44 million and the amount of unmatured Canada Premium Bonds outstanding decreased by $47 million.
Total foreign currency unmatured market debt was $15,263 million on September 30, 2019, a decrease of $752 million from March 31, 2019. Canada Bills are short-term U.S. dollar-denominated unsecured obligations issued in the U.S. money market with a term to maturity of not more than 270 days. Canada Notes are usually U.S. dollar-denominated interest-bearing marketable notes that mature not less than nine months from their date of issue. Euro Medium Term Notes are medium-term notes issued outside the United States and Canada. Notes issued under this program can be denominated in a range of currencies and structured to meet investor demand. The other marketable bonds are comprised of three global bond issues denominated in U.S. dollars and euros.
In 1996, Canada implemented the EFA foreign currency swap program. Under these foreign exchange swaps, Canadian dollar liabilities are swapped into liabilities in foreign currencies, allowing Canada to raise foreign exchange reserves cost effectively. As of September 30, 2019, $49,939 million of Canadian dollars have been swapped for USD 42,635 million, $14,773 million of Canadian dollars have been swapped for EUR 10,189 million, $10,123 million of Canadian dollars have been swapped for GBP 5,448 million and $3,366 million Canadian dollars have been swapped for JPY 286,000 million. As of September 30, 2019, $133 million Canadian dollars have been swapped for USD 102 million through foreign exchange swaps which mature in less than one year.
The average rates of interest paid on the unmatured debt outstanding by instrument are set out below.
AVERAGE RATESOF INTEREST (%)
| | | | | | | | | | | | | | | | | | | | |
| | | At March 31 | |
| | | 2019 | | | 2018 | | | 2017 | | | 2016 | | | 2015 | |
Marketable bonds(1) | | | 2.28 | | | | 2.18 | | | | 2.25 | | | | 2.47 | | | | 2.70 | |
Treasury bills | | | 1.79 | | | | 1.16 | | | | 0.54 | | | | 0.50 | | | | 0.81 | |
Retail debt | | | 0.71 | | | | 0.63 | | | | 0.66 | | | | 0.67 | | | | 0.71 | |
Canada bills | | | 2.44 | | | | 1.61 | | | | 0.77 | | | | 0.43 | | | | 0.08 | |
Medium-term notes | | | 2.23 | | | | 1.70 | | | | 1.06 | | | | 0.67 | | | | 0.35 | |
Total market debt | | | 2.18 | | | | 2.01 | | | | 1.89 | | | | 2.03 | | | | 2.27 | |
Source: Public Accounts of Canada 2019 (Volume 1, Table 6.8).
| (1) | Includes foreign currency marketable bonds. |
22
The following table shows the scheduled repayments in respect of principal and interest on the marketable bonds and notes outstanding at September 30, 2019.
SCHEDULEOF MARKETABLE BONDAND NOTE REPAYMENTS
(in millions)
| | | | | | | | |
| | | Total Principal and
Interest(1) | |
For years ended December 31, | | Canadian
Currency
Debt(2) | | | Foreign
Currency
Debt(3) | |
2019 | | | 17,905 | | | | 181 | |
2020 | | | 102,102 | | | | 4,644 | |
2021 | | | 116,948 | | | | 468 | |
2022 | | | 65,935 | | | | 8,078 | |
2023 | | | 51,571 | | | | — | |
2024-2028 | | | 138,600 | | | | — | |
2029-2033 | | | 63,809 | | | | — | |
2034-2038 | | | 32,235 | | | | — | |
2039-2043 | | | 30,493 | | | | — | |
2044-2048 | | | 52,038 | | | | — | |
2049-2053 | | | 15,218 | | | | — | |
2054-2058 | | | 653 | | | | — | |
2059-2063 | | | 653 | | | | — | |
2064-2068 | | | 4,881 | | | | — | |
Source: Bank of Canada.
| (1) | Does not include Canada Bills and excludes the effect of interest rate swaps and cross currency swaps. |
| (2) | Only includes domestic marketable bonds, excluding inflation compensation component on Real Return Bonds. |
| (3) | Converted at USD 1.00 = CAD 1.3244, EUR 1.00 = CAD 1.4437; the closing rates on September 30, 2019. |
23
Crown Corporations
Except for enterprise Crown corporations and other government business enterprises, which are reported under the modified equity basis of accounting, all Government organizations are consolidated in the Government’s financial statements.
The payment of all money borrowed by agent enterprise Crown corporations is a charge on and payable out of the Consolidated Revenue Fund. Such borrowings constitute unconditional obligations of the Government and are recorded as such in the accounts of Canada, net of borrowings expected to be repaid directly by these corporations. Borrowings expected to be repaid by agent enterprise Crown corporations amounted to $294,734 million as at March 31, 2019. Since fiscal 2007-08, the Government has met all of the borrowing needs of the Business Development Bank of Canada, Canada Mortgage and Housing Corporation and Farm Credit Canada through direct lending. The following table summarizes the unaudited financial information of consolidated Crown corporations, other entities and enterprise Crown corporations as at March 31, 2019.
FINANCIAL INFORMATION REGARDING CROWN CORPORATIONSAND OTHER ENTITIES
(in millions)
| | | | | | | | | | | | | | | | |
| | | Consolidated
Crown
corporations | | | Other
entities | | | Enterprise
Crown
corporations | | | Total | |
Assets | | | | | | | | | | | | | | | | |
Total assets | | $ | 13,162 | | | $ | 859 | | | $ | 548,957 | | | $ | 562,978 | |
| | | | | | | | | | | | | | | | |
Liabilities | | | | | | | | | | | | | | | | |
Liabilities to other than Government | | | | | | | | | | | | | | | | |
Borrowings | | | 360 | | | | 0 | | | | 295,013 | | | | 295,373 | |
Other | | | 10,663 | | | | 172 | | | | 117,786 | | | | 128,621 | |
| | | | | | | | | | | | | | | | |
| | | 11,023 | | | | 172 | | | | 412,799 | | | | 423,994 | |
| | | | | | | | | | | | | | | | |
Net assets | | $ | 2,138 | | | $ | 687 | | | $ | 136,158 | | | $ | 138,984 | |
| | | | | | | | | | | | | | | | |
Financial interest of the Government | | | | | | | | | | | | | | | | |
Obligations to the Government | | $ | 291 | | | $ | 13 | | | $ | 90,497 | | | $ | 90,802 | |
Net equity of the Government | | | 1,847 | | | | 674 | | | | 45,661 | | | | 48,182 | |
| | | | | | | | | | | | | | | | |
Total financial interest | | $ | 2,138 | | | $ | 687 | | | $ | 136,158 | | | $ | 138,984 | |
| | | | | | | | | | | | | | | | |
Contingent liabilities | | $ | (1) | | | $ | (1) | | | $ | 3,877 | | | $ | 3,877 | |
| | | | | | | | | | | | | | | | |
Source: Public Accounts of Canada 2019 (Volume 1, Tables 4.1, 4.4, 9.3, 9.7).
| (1) | Contingent liabilities of consolidated Crown corporations and other entities are included in the Government’s financial statements as follows: claims and pending and threatened litigation - provision accrued: $36.0 million; disclosure only: $22.5 million. |
Note: Amounts may not add due to rounding.
Contingent Liabilities (with respect to Guarantees provided by the Government)
The contingent liabilities of the Government with respect to guarantees provided by the Government as at March 31, 2019 are summarized as follows.
CONTINGENT LIABILITIES (WITH RESPECT TO NET EXPOSURE UNDER GUARANTEES)
(in millions)
| | | | |
Guarantees provided by the Government | | | | |
Guaranteed borrowings of enterprise Crown corporations and other government business enterprises | | $ | 294,734 | |
Loan guarantees | | | 14,837 | |
Insurance programs managed by the Government | | | 241,765 | |
Other explicit guarantees | | | — | |
| | | | |
Total gross guarantees | | | 551,336 | |
Less: allowance for guarantees | | | 277 | |
| | | | |
Net exposure under guarantees | | $ | 551,059 | |
| | | | |
Source: Public Accounts of Canada 2019 (Volume 1, Table 11.6).
Note: Amounts may not add due to rounding.
24
Insurance Programs
Certain agent enterprise Crown corporations operate insurance programs. In the event that such corporations have insufficient funds to meet their obligations, the Government would provide the required financing through appropriations, either budgetary or non-budgetary.
The following table summarizes the unaudited information regarding such insurance programs as at March 31, 2019.
AGENT ENTERPRISE CROWN CORPORATIONS INSURANCE PROGRAMS
(in millions)
| | | | | | | | | | | | | | |
| | | Insurance
in force | | Net
claims(1) | | | 5-year
average
of net
claims
paid | | | Closing
balance
of
Fund | |
Canada Deposit Insurance Corporation | | 807,398 | | | — | | | | — | | | | 2,985 | |
| | | | |
Canada Mortgage and Housing Corporation: | | | | | | | | | | | | | | |
| | | | |
Mortgage Insurance Fund | | 442,000 | | | 248 | | | | 334 | | | | 12,042 | |
Mortgage-Backed Securities Guarantee Fund | | 494,000 | | | — | | | | — | | | | 2,437 | |
| | | | |
Export Development Canada: | | | | | | | | | | | | | | |
Export insurance contracts entered into on its own behalf | | 24,069 | | | 336 | | | | 153 | | | | — | |
| | | | |
Farm Credit Canada | | 5,318 | | | 5 | | | | 7 | | | | 21 | |
Source: Public Accounts of Canada 2019 (Volume 1, Table 11.8).
| (1) | Refers to the difference between claims and amounts received from sales of related assets and other recoveries. |
DEBT RECORD
Canada has always paid the full face amount of the principal and interest on every direct obligation issued by it and every indirect obligation on which it has been required to implement its guarantee, promptly when due. During war, where such payment would have violated laws or regulations forbidding trading with the enemy, payment was made to a custodian of enemy property.
25
MONETARY AND BANKING SYSTEM
Bank of Canada
The Bank of Canada (the “Bank”) was incorporated in 1934 under the Bank of Canada Act (in this section referred to as the “Act”) as Canada’s central bank. All of the capital stock of the Bank is owned by the Government. The Act gives the Bank the responsibility for the conduct of monetary policy and confers specific powers for discharging that responsibility.
The Bank has the sole right to issue notes for circulation in Canada. The Bank acts as the fiscal agent of the Government of Canada and, in this role, the Bank participates in the management of the public debt. Specifically, the Bank is responsible for handling the Government’s new market debt borrowings, administering its outstanding market debt and making payments for interest and market debt redemption on its behalf.
The Bank may buy or sell various types of securities, including securities issued or guaranteed by Canada or any province, securities issued or guaranteed by the Government of the United States of America or Japan or the government of a country in the European Union. For purposes of conducting monetary policy or promoting the stability of the Canadian financial system, the Bank may buy or sell from or to any person securities and any other financial instruments other than instruments that evidence an ownership interest or right in or to an entity, that comply with the policy established by the Governor and published in the Canada Gazette. The Bank may buy and sell foreign currencies, SDRs issued by the IMF, coin and gold and silver bullion. The Bank may open accounts with other central banks, at the Bank for International Settlements (“BIS”) and at commercial banks. The Bank may accept deposits from the Government or any of its corporations or agencies, any province, any chartered bank or any member of Payments Canada as well as financial market infrastructure. The Bank pays interest to the Government on deposits held at the Bank and may pay interest to member institutions of Payments Canada on deposits accepted for certain specified purposes. It may also accept deposits from other central banks and official international financial organizations and may pay interest on such deposits. The Bank does not accept deposits from individuals nor does it compete with the chartered banks in the commercial banking field. The Bank is not required to maintain gold or foreign exchange reserves against its liabilities.
The Bank may, on the pledge of certain classes of securities or property, make loans or advances for periods not exceeding six months to chartered banks, and to any other members of Payments Canada. The Bank Rate is the minimum rate at which the Bank is prepared to make loans or advances. Although the Bank has the power to make loans or advances under certain conditions and for limited periods to the Government or any province, such loans are extremely rare and no such loans have been made in over 35 years.
The framework for the implementation of monetary policy by the Bank was changed considerably on two occasions during the 1990s, first as a result of the phased elimination of reserve requirements between June 1992 and July 1994, and second, with the introduction of a real-time large-value settlement system (the “Large Value Transfer System” or “LVTS”) in February 1999.
The central mechanisms through which the Bank currently implements monetary policy are the LVTS and a 50-basis-point operating band for the overnight interest rate adopted by the Bank in mid 1994. Currently, the Bank targets the level of excess settlement balances in the LVTS at a minimum of $250 million. Any participant in the LVTS with a deficit funds position should therefore be aware that there will be one or more participants with offsetting surplus positions that are potential counterparties for transactions at market rates. The Bank encourages these transactions by paying an interest rate on positive balances held overnight by LVTS participants at the lower limit of its operating band and charging an interest rate on overdraft loans to LVTS participants at the upper limit of the band (which is also the Bank Rate). Thus the overnight rate should stay within the operating band since participants are aware that they can earn at least the lower limit of the band on positive balances and need not pay more than the upper limit to cover shortfalls. Moreover, the Bank is prepared to enter into overnight buyback transactions to reinforce its target rate through a competitive single rate auction with midpoint being the minimum rate if lending funds or maximum rate if borrowing funds. Through its influence on the interest rate for overnight funds, the Bank is able to influence other short-term interest rates, the exchange rate, aggregate demand and, ultimately, inflation.
The Bank controls the level of LVTS settlement balances available to the financial system by adjusting the level of Government deposits held at financial institutions through twice-daily auctions of Government cash balances.
The Act provides for regular consultation between the Governor of the Bank and the Minister of Finance as well as for a formal procedure whereby, in the event of a disagreement between the Government and the Bank which cannot be resolved, the Government may issue a directive to the Bank as to the monetary policy that it is to follow. The directive must be in writing, in specific terms, applicable for a specified period and published forthwith. This provision in the Act makes it clear that the Government must take the ultimate responsibility for monetary policy, but the Bank is in no way relieved of its responsibility for monetary policy and its execution so long as a directive is not in effect. No directive has ever been issued.
The Payment Clearing and Settlement Act gives the Bank formal responsibility for the regulatory oversight of major clearing and settlement systems. Specifically, the Bank will review all eligible systems and identify their potential to cause systemic or payment system risk. Systems with this potential are subject to designation under the Payment Clearing and Settlement Act. Designated systems will have to satisfy the Bank that they have appropriate risk-control mechanisms in place. The Bank may carry out examinations and, in situations where it is judged that systemic or payment risk is being inadequately controlled, the Governor of the Bank may issue directives to a designated system.
The Payment Clearing and Settlement Act also gives the Bank new powers to provide certain services. In particular, the Bank can provide a guarantee of settlement to the participants of designated systems. Furthermore, the Payment Clearing and Settlement Act establishes the Bank’s role as the resolution authority for Canadian designated systems. This new role came into force in 2019. The resolution regime’s main objectives are to promote financial stability, maintain the availability of critical financial services and minimize the potential exposure of public funds to a loss. To achieve this, the Bank is developing plans on how to respond to the unlikely failure of a designated system in Canada. The Bank also now has the power to provide the operator of a failing system with temporary liquidity on an uncollateralized basis, and also the power to take temporary control of the system.
26
Other Government Financial Institutions
Export Development Canada (“EDC”) was established on October 1, 1969 for the purpose of facilitating and developing trade between Canada and other countries. EDC is the successor to the Export Credits Insurance Corporation which commenced operations in 1944. Activities were originally limited to insuring Canadian exporters against non-payment of credits extended to foreign buyers. To further enhance Canada’s growing export trade, EDC has introduced an export loans program, a foreign investment guarantees program and a surety risk protection insurance program. The Federal Business Development Bank was established in 1975 as the successor to the Industrial Development Bank which was established in 1944 as a subsidiary of the Bank of Canada. In 1995, the Federal Business Development Bank was continued as the Business Development Bank of Canada (“BDC”). The purpose of the BDC is to provide financial and management services to Canadian businesses, with a focus on small and medium-sized enterprises in Canada. The Canada Deposit Insurance Corporation, established in 1967, insures deposits payable in Canada and in Canadian currency at banks and other financial institutions up to $100,000 per depositor. Farm Credit Canada, established in 1959, provides financial and management services to farms and agrifood businesses. The Canada Mortgage and Housing Corporation (formerly the Central Mortgage and Housing Corporation, or “CMHC”) was incorporated in 1945 to insure mortgage loans made by approved lenders and to make direct mortgage loans. Since then, CMHC’s role in the housing market has expanded beyond mortgage loan insurance to include the provision of mortgage-backed securities and related guarantees, housing policy and advice, and housing research.
Chartered Banks
Canada’s banks are all federally incorporated and are regulated under the Bank Act. The Bank Act sets out the rules for the structure and operation of these institutions. The Office of the Superintendent of Financial Institutions (“OSFI”) is the federal agency responsible for supervising banks.
Under the Bank Act, foreign banks are permitted to incorporate Canadian banks by letters patent. In June 1999, legislation was passed to allow foreign banks to establish branches in Canada. Foreign banks can operate full-service branches or lending branches. As at November 13, 2019, the banking system consisted of 37 domestic banks, 18 foreign bank subsidiaries, 28 full-service foreign bank branches and four foreign bank lending branches. Foreign branches are permitted to raise wholesale deposits (not insured by the Canada Deposit Insurance Corporation). Moreover, foreign branches are not subject to the capital requirements of domestic banks; however, they are required to maintain a minimum capital equivalent deposit amount with a domestic federal financial institution.
Financial Sector Initiatives
The Government of Canada is responsible for ensuring the federal financial sector regulatory framework operates efficiently and effectively for consumers and businesses while maintaining the safety of institutions and soundness of the sector. The five-year sunset clause in the financial institutions statutes, which include the Bank Act, the Insurance Companies Act and the Trust and Loan Companies Act, encourages regular review of the federal financial sector framework to ensure that it continues to meet changing needs of its users. In the most recent review, through 2016 and 2017, the Department of Finance consulted stakeholders regarding initiatives to improve the stability, efficiency and utility of the framework in the context of current trends and emerging risks. Stakeholders indicated that the financial sector legislative framework is functioning well, but called for targeted updates to adapt to innovations and sectoral developments.
In 2018, priority amendments were adopted to implement targeted proposals from the review. These included: providing greater flexibility for financial institutions to undertake and leverage broader fintech activities that enable the delivery of financial services in new and innovative ways; permitting life and health insurance companies to make long-term and predictable investments in infrastructure; providing prudentially regulated deposit-taking institutions, such as credit unions, flexibility to use generic bank terms, subject to disclosure; and renewing the sunset date in the federal financial institutions statutes. A second phase of measures introduced a number of targeted and technical amendments to enhance the stability, efficiency, and utility of the financial sector. A third phase of measures was adopted in 2019 and introduced amendments to provide members of federal credit unions with more options for voting prior to and at annual general meetings.
27
The Government of Canada continues to work with the governments of British Columbia, Ontario, Saskatchewan, New Brunswick, Nova Scotia, Prince Edward Island, and Yukon to develop the Cooperative Capital Markets Regulatory System that will better protect investors, foster efficiency and innovation, and enhance capacity to identify and manage systemic risk in capital markets, in a manner that fully respects provincial and territorial jurisdiction.
The Government has acted repeatedly since 2008 to protect the financial security of borrowers and increase discipline in mortgage funding markets. Successive rounds of macroprudential policy tightening were implemented to ensure that government-backed programs support safer forms of lending. Notably, in October 2016, the Government required lenders to test a borrower’s ability to make their mortgage payments at a higher interest rate for all insured mortgages. The Government has also prohibited the use of insured mortgages in securitization vehicles not sponsored by the Canada Mortgage and Housing Corporation, and restricted the use of optional portfolio insurance to government-sponsored securitization. In January 2018, OSFI implemented changes to its underwriting guidelines, affecting all mortgages underwritten by Federally Regulated Financial Institutions (“FRFIs”), which include a mortgage rate stress test for uninsured mortgage borrowers. OSFI has also adjusted its capital framework for mortgage insurers, increasing requirements and ensuring they are more sensitive to local risks. Evidence to date suggests improvements in the quality of new mortgage loans, including higher average credit scores and lower average loan-to-value at mortgage origination.
Monetary Policy and Interest Rate Developments
The ultimate objective of Canadian monetary policy is to promote good overall economic performance, namely by keeping inflation low, stable and predictable.
In February 1991, the Government and the Bank of Canada (the “Bank”) jointly announced a series of targets for reducing total CPI inflation to the mid-point of a range of 1% to 3% by the end of 1995. This inflation-control target range has been extended a number of times. In October 2016, the Government and the Bank renewed Canada’s inflation-control framework for a further five-year period. Monetary policy will continue to aim at keeping inflation at the 2% target mid-point, both to maximize the likelihood that inflation stays within the target range and to increase the predictability of inflation over the longer term.
The policy instrument the Bank uses to influence monetary conditions is the overnight rate target, which is the mid-point of the Bank’s operating band for overnight financing. The Bank constantly reassesses the level of the overnight rate target necessary to achieve the inflation-control targets.
Since November 2000, the Bank has moved to eight fixed announcement dates for the overnight rate target to make monetary policy more effective. Fixed dates have reduced the uncertainty in financial markets associated with not knowing exactly when changes in the overnight rate target may be announced, and contributed to the improved functioning of financial markets. Fixed dates have provided a regular opportunity to emphasize the medium-term perspective of monetary policy and increased the Bank’s transparency, accountability and dialogue with the public.
Between January 2008 and April 2009, the ongoing turmoil in financial markets and the resulting deterioration in real economic activity both domestically and abroad led the Bank of Canada to lower its overnight rate target by a total of 400 basis points to 0.25 percent. The Bank of Canada committed, conditional on the inflation outlook, to maintain this rate until the end of the second quarter of 2010. In addition, the Bank undertook a series of operations to reinforce its overnight target rate and to support market liquidity. The Bank’s initiatives came in the context of unprecedented coordinated actions across major central banks to support market liquidity and stabilize global financial markets. The Bank left the overnight rate target unchanged at 0.25 percent for the remainder of 2009 as well as the beginning of 2010.
In 2017, as the global economy strengthened and domestic growth was broadening across industries and regions, the Bank started to normalize the interest rates by raising the overnight target rate by 25 basis points on both July 12 and September 6. Over 2018, the Bank raised its target for the overnight rate three times (January 17, July 11 and October 24) with the overnight rate target reaching 1.75% at the end of 2018. Amid increasing trade policy uncertainty, the overnight rate has since remained at that level.
Based on the press release of October 30, 2019, the Bank expects growth to remain close to potential over the next two years, with real GDP expanding at 1.5% in 2019, 1.7% in 2020, and 1.8% in 2021. The resilience of Canada’s economy will be increasingly tested as trade conflicts and uncertainty persist. In considering the appropriate path for monetary policy, the Bank will be monitoring the extent to which the global slowdown spreads beyond manufacturing and investment and will pay close attention to the sources of resilience in the Canadian economy – notably consumer spending and housing activity – as well as to fiscal policy developments.
In the press release dated December 4, 2019, the Bank stated that inflation will increase temporarily in the coming months due to year-over-year movements in gasoline prices. Overall, the Bank expects inflation to track close to the 2 percent target over the projection horizon, consistent with an economy that has been operating close to its capacity.
28
Selected Interest Rates
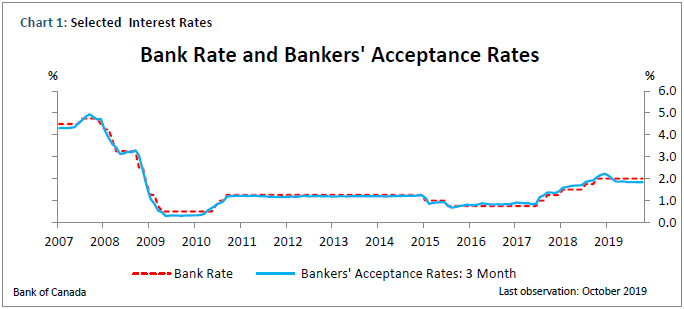
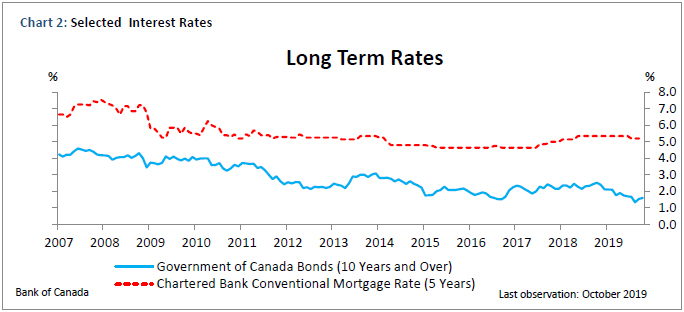
29
Membership in International Economic Organizations
As of September 30, 2019, Canada’s paid-up quota in the IMF is SDR 11,023.9 million. On September 30, 2019, one SDR equaled $1.805.
Canada also participates in the New Arrangements to Borrow (the “NAB”) which provides special financial resources to the IMF. Canada’s NAB commitment amounts to SDR 3,873.7 million. As of September 30, 2019, SDR 394.6 million had been drawn from Canada’s NAB and SDR 253.6 million remained outstanding. The NAB is subject to periodic renewal by the IMF’s Executive Board, and was last renewed for five years from November 2017.
Alongside a number of G7, G20 and other partner countries, Canada also participates in the global undertaking to extend the IMF’s access to bilateral resources under the 2016 bilateral borrowing agreements between the IMF and participating countries. As part of this international effort, Canada has extended an SDR 8.2 billion time-bound precautionary credit line to the IMF, the terms of which will end on December 31, 2020.
Canada is also a member of the Organization for Economic Cooperation and Development, a party to the World Trade Organization and a shareholder (through the Bank) of the BIS. Canada’s participation in other international development institutions is summarized in the table below.
PARTICIPATION IN OTHER INTERNATIONAL DEVELOPMENT INSTITUTIONS
| | | | | | | | |
| | | At September 30, 2019 | |
| | | Subscription | |
| | | Total | | | Paid-in(1) | |
| | | (in millions of
U.S. dollars) | |
International Bank for Reconstruction and Development | | $ | 8,499.3 | | | $ | 619.5 | |
International Finance Corporation | | | 81.3 | | | | 81.3 | |
Multilateral Investment Guarantee Agency | | | 56.5 | | | | 10.7 | |
Asian Development Bank | | | 7,907.6 | | | | 395.5 | |
Inter-American Development Bank | | | 7,024.3 | | | | 241.7 | |
Caribbean Development Bank | | | 156.9 | | | | 34.4 | |
African Development Bank | | | 3,424.0 | | | | 250.0 | |
European Bank for Reconstruction and Development | | | 1,112.6 | | | | 232.0 | |
Asian Infrastructure Investment Bank | | | 995.4 | | | | 199.1 | |
Source: Department of Finance. Data derived from the annual statements/reports of the above-mentioned institutions. Where applicable, subscription amounts were converted to U.S. dollar amounts using closing exchange rates as of September 30, 2019.
| (1) | Balance of subscription payable only in the unlikely event that there is a call on the institution’s capital. |
30
CLAIMS AND OTHER
Contingent liabilities arise in the normal course of operations and their ultimate disposition is unknown. Contingent liabilities are potential liabilities, which may become actual liabilities when one or more future events not wholly within the Government’s control occur or fail to occur. The following table presents the different components of the Government’s provision for contingent liabilities as at March 31, 2019.
| | | | |
| | | 2019
(in millions) | |
Claims | | | | |
Pending and threatened litigation and other claims | | | 11,192 | |
Specific claims | | | 9,099 | |
Comprehensive land claims | | | 5,879 | |
Provision for guarantees provided by the Government | | | 277 | |
| | | | |
Total provision recorded | | | 26,447 | |
Source: Public Accounts of Canada 2019 (Volume 1, Section 2).
Claims
The Government’s estimated provision for claims is determined using relevant historical experience, facts and circumstances. In situations where the estimate of loss is based on a range of amounts, the amount accrued within the range is the Government’s best estimate of the potential loss, which may be at an amount lesser than the maximum of the range. Significant exposure to a liability could exist in excess of what has been accrued. As of March 31, 2019, claims for which the outcome was not determinable and for which an amount had not been accrued were estimated at approximately $8,528 million ($10,053 million in 2018).
Pending and threatened litigation and other claims: There are thousands of pending and threatened litigation cases as well as claims outstanding against the Government. These claims include items with pleading amounts and items where an amount is not specified. While the total amount claimed in these actions is significant, their outcomes are not known in all cases. As a result, provisions are recorded based on the Government’s best estimate of the potential loss.
Specific claims: Specific claims deal with the past grievances of First Nations related to Canada’s obligations under historic treaties or the way it managed First Nations’ funds or other assets. The past grievances may be proceeding via the legal system or via the specific claims program. The Government of Canada will pursue a settlement agreement with the First Nation when a claim demonstrates an outstanding lawful obligation. As of March 31, 2019, there were 567 (545 in 2018) specific claims under negotiation, accepted for negotiation or under review. A liability is estimated and recorded for claims that have progressed to a point where quantification is possible. This estimate also includes projections based on historical rates and costs of settlement for similar claims and includes an estimate for claims which have been filed but not yet assessed.
Comprehensive land claims: Comprehensive land claims arise in areas of the country where Aboriginal rights and title have not been resolved by treaty or by other legal means. As of March 31, 2019, there were 74 (73 in 2018) comprehensive land claims under negotiation, accepted for negotiation or under review. A liability is estimated and recorded for claims that have progressed to a point where quantification is possible. This estimate also includes projections based on historical rates and costs of settlement for similar claims.
Other
Assessed taxes under appeal: Contingent liabilities include previously assessed federal taxes where amounts are being appealed to the Tax Court of Canada, the Federal Court of Canada, or the Supreme Court of Canada. As of March 31, 2019, $4,467 million ($5,404 million in 2018) was being appealed to the courts. The Government has recorded, in the amounts payable related to tax or in reduction of the amounts receivable from taxpayers, as applicable, the estimated amount of appeals that are considered likely to be lost and that can be reasonably estimated.
31
TABLES AND SUPPLEMENTARY INFORMATION
The tables and supplementary information under the headings Unmatured Market Debt, Other Obligations (with Respect to Money Borrowed) and Supplementary Information have been provided by the Department of Finance and the Bank of Canada.
Unmatured Market Debt
All debt obligations listed below are direct obligations of the Government of Canada and constitute a charge on the Consolidated Revenue Fund of Canada.
| (A) | PAYABLEIN CANADAIN CANADIAN DOLLARS |
MARKETABLE BONDS(1)
| | | | | | | | | | | | |
Maturity date | | Coupon% | | Issue date(s) | | Series | | | Outstanding at September 30, 2019 | |
2019 — Nov. 1 | | 1.25 | | 2017: Aug. 11, Sep. 1, Sep. 25, Oct. 13 | | | H318 | | | | 13,173,055,000 | |
2020 — Feb. 1 | | 1.25 | | 2017: Nov. 6, Nov. 24, Dec. 18; 2018: Jan. 12 | | | H565 | | | | 7,744,436,000 | |
2020 — Mar. 1 | | 1.50 | | 2014: Oct. 14, Dec. 1; 2015: Feb. 23; 2016: Oct. 25, Nov. 21; 2017: Jan. 30, Mar. 10 | | | D929 | | | | 18,019,713,000 | |
2020 — May 1 | | 1.75 | | 2018: Feb. 9, Mar. 2, Mar. 29, Apr. 23 | | | H805 | | | | 7,996,383,000 | |
2020 — Jun. 1 | | 3.50 | | 2009: Sep. 8, Oct.14, Nov.10; 2010: Feb. 8, May 3 | | | YZ11 | | | | 10,642,426,000 | |
2020 — Aug. 1 | | 1.75 | | 2018: May 11, Jun. 8, Jul. 3, Jul. 20 | | | J215 | | | | 10,931,191,000 | |
2020 — Sep. 1 | | 0.75 | | 2015: Apr. 13, May 11, Jul. 27, Oct. 5; 2017: May 9, Jun. 20, Jul. 18, Sep. 11 | | | E596 | | | | 24,007,000,000 | |
2020 — Nov. 1 | | 2.00 | | 2018: Aug. 10, Sep. 4, Sep. 21, Oct.12 | | | J470 | | | | 10,889,000,000 | |
2021 — Feb. 1 | | 2.25 | | 2018: Nov. 9, Nov. 23, Dec. 14; 2019: Jan. 14 | | | J629 | | | | 11,856,364,000 | |
2021 — Mar. 1 | | 0.75 | | 2015: Oct. 19, Nov. 9; 2016: Jan. 18, Feb. 22; 2017: Oct. 20, Nov. 17; 2018: Jan. 26, Mar. 16 | | | F254 | | | | 25,083,636,000 | |
2021 — Mar. 15 | | 10.50 | | 1990: Dec. 15; 1991: Jan. 9, Feb. 1 | | | A39 | | | | 567,361,000 | |
2021 — May 1 | | 1.75 | | 2019: Feb. 11, Mar. 1, Mar. 25, Apr. 12 | | | J884 | | | | 12,000,000,000 | |
2021 — Jun. 1 | | 3.25 | | 2010: Jul. 19, Oct. 12; 2011: Feb. 7, May 9 | | | ZJ69 | | | | 11,500,000,000 | |
2021 — Jun. 1 | | 9.75 | | 1991: May 9, Jun. 1, Jul. 1, Aug. 1, Sep. 1, Oct. 17 | | | A43 | | | | 286,188,000 | |
2021 — Aug. 1 | | 1.50 | | 2019: May 6, Jun. 7, Jun. 28, Jul. 19 | | | K296 | | | | 12,000,000,000 | |
2021 — Sep. 1 | | 0.75 | | 2016: Apr. 11, May 16, Jul. 11, Aug. 22; 2018: Apr. 13, Oct. 1 | | | F585 | | | | 19,200,000,000 | |
2021 — Nov. 1 | | 1.25 | | 2019: Aug. 9, Aug. 30, Sep. 23 | | | K452 | | | | 9,000,000,000 | |
2021 — Dec. 1 | | 4.25 | | 1991: Dec. 10; 1992: Oct. 14; 1993: May 1, Dec. 1; 1994: Feb. 22, Jun. 21, Sep. 15, Dec. 15; 1995: Feb. 2, May 8, Aug. 4 | | | L25 | | | | 8,532,488,250 | |
2022 — Mar. 1 | | 0.50 | | 2016: Oct. 11, Nov. 15; 2017: Jan. 24, Feb. 21; 2018: Dec. 24; 2019: Mar. 29 | | | G328 | | | | 19,000,000,000 | |
2022 — Jun. 1 | | 2.75 | | 2011: Aug. 2, Oct. 11; 2012: Feb. 6, May 7, Jun. 11 | | | ZU15 | | | | 12,700,000,000 | |
2022 — Jun. 1 | | 9.25 | | 1991: Dec. 16; 1992: Jan. 3, May 15 | | | A49 | | | | 206,022,000 | |
2022 — Sep. 1 | | 1.00 | | 2017: Apr. 10, May 30, Jul. 10, Aug. 28; 2019: May 17, Jun. 14, Aug. 6, Sep. 27 | | | G732 | | | | 25,200,000,000 | |
2023 — Mar. 1 | | 1.75 | | 2017: Oct. 6, Nov. 10; 2018: Jan. 22, Feb. 16 | | | H490 | | | | 15,000,000,000 | |
2023 — Jun. 1 | | 1.50 | | 2012: Jul. 30, Oct. 22; 2013: Feb. 4, Apr. 2, May 6 | | | A610 | | | | 14,200,000,000 | |
2023 — Jun. 1 | | 8.00 | | 1992: Aug. 17; 1993: Feb. 1, Apr. 1, Jul. 26, Oct. 15; 1994: Feb. 1, May 2 | | | A55 | | | | 2,358,552,000 | |
2023 — Sep. 1 | | 2.00 | | 2018: Apr. 6, May 22, Jul. 9, Aug. 24 | | | H987 | | | | 12,000,000,000 | |
2024 — Mar. 1 | | 2.25 | | 2018: Oct. 5, Nov. 16; 2019: Jan. 18, Feb. 15 | | | J546 | | | | 12,000,000,000 | |
2024 — Jun. 1 | | 2.50 | | 2013: Jul. 2, Aug. 19, Oct. 7; 2014: Feb. 10, Apr. 28 | | | B451 | | | | 13,800,000,000 | |
2024 — Sep. 1 | | 1.50 | | 2019: Apr. 5, May 10, Jul. 5, Aug. 23 | | | J967 | | | | 16,200,000,000 | |
2025 — Jun. 1 | | 2.25 | | 2014: Jun. 30, Jul. 28, Oct. 20; 2015: Jan. 27, Apr. 21 | | | D507 | | | | 13,100,000,000 | |
2025 — Jun. 1 | | 9.00 | | 1994: Aug. 2, Nov. 1; 1995: Feb. 1, May 1, Aug. 1, Nov. 1; 1996: Feb. 1 | | | A76 | | | | 2,303,156,000 | |
2026 — Jun. 1 | | 1.50 | | 2015: Jul. 21, Oct. 27; 2016: Jan. 26, Apr. 25, Jun. 27 | | | E679 | | | | 13,500,000,000 | |
2026 — Dec. 1 | | 4.25 | | 1995: Dec. 7; 1996: Mar. 6, Jun. 6, Sep. 6, Dec. 6; 1997: Mar. 12, Jun. 9, Sep. 8, Dec. 8; 1998: Mar. 9, Jun. 8, Sep. 8, Dec. 7 | | | VS05 | | | | 8,188,110,000 | |
2027 — Jun. 1 | | 1.00 | | 2016: Oct. 31; 2017: Mar. 7, May 1, Jun. 26 | | | F825 | | | | 15,000,000,000 | |
2027 — Jun. 1 | | 8.00 | | 1996: May 1, Aug. 1, Nov. 1; 1997: Feb. 3, May 1, Aug. 1, Nov. 3 | | | VW17 | | | | 4,035,975,000 | |
2028 — Jun. 1 | | 2.00 | | 2017: Aug. 1, Oct. 30; 2018: Feb. 23, Apr. 27, Jun. 22 | | | H235 | | | | 13,500,000,000 | |
2029 — Jun. 1 | | 2.25 | | 2018: Jul. 27, Oct. 19; 2019: Jan. 25, Apr. 22 | | | J397 | | | | 12,300,000,000 | |
2029 — Jun. 1 | | 5.75 | | 1998: Feb. 2, May 1, Nov. 2; 1999: May 3, Oct. 15; 2000: Apr. 24, Oct. 16; 2001: Apr. 23 | | | WL43 | | | | 10,883,378,000 | |
2030 — Jun. 1 | | 1.25 | | 2019: Jul. 26 | | | K379 | | | | 3,000,000,000 | |
2031 — Dec. 1 | | 4.00 | | 1999: Mar. 8, Jun. 8, Sep. 7, Dec. 6; 2000: Mar. 6, Jun. 5, Sep. 5, Dec. 11; 2001: Mar. 5, Jun. 11, Sep. 24, Dec. 10; 2002: Mar. 18, Jun. 10, Sep. 16, Dec. 9; 2003: Mar. 17 | | | WV25 | | | | 8,693,852,000 | |
2033 — Jun. 1 | | 5.75 | | 2001: Oct. 15; 2002: Jan. 21, Mar. 4, May 6, Jul. 15, Nov. 25; 2003: Jan. 20, Mar. 3, Apr. 14, Jul. 14, Aug. 25, Nov. 10; 2004: Jan. 19, Mar. 1 | | | XG49 | | | | 12,273,905,000 | |
2036 — Dec. 1 | | 3.00 | | 2003: Jun. 9, Sep. 15, Dec. 8; 2004: Mar. 8, Jun. 7, Sep. 7, Dec. 6; 2005: Mar. 7, Jun. 6, Sep. 6, Dec. 5; 2006: Mar. 06, Jun. 5, Oct. 2, Dec. 4; 2007: Mar. 5 | | | XQ21 | | | | 7,780,383,000 | |
2037 — Jun. 1 | | 5.00 | | 2004: Jul. 19, Sep. 14, Nov. 8; 2005: Jan. 17, Apr. 11, Jul. 11, Oct. 18; 2006: Jan. 16, May 1, Jul. 24, Oct. 31; 2007: Jan. 15, Jun. 11, Jul. 23, Oct. 9; 2008: Jan. 21; 2009: Jan. 12 | | | XW98 | | | | 12,500,774,000 | |
2041 — Jun. 1 | | 4.00 | | 2008: Jun. 9, Sep. 15, Dec. 15; 2009: Mar. 23, May 19, Jul. 14, Aug. 5, Oct. 20; 2010: Feb. 22, Mar. 22, May 25, Sep. 7, Nov. 22; 2011: Mar. 21 | | | YQ12 | | | | 14,483,928,000 | |
2041 — Dec. 1 | | 2.00 | | 2007: Jun. 4, Sep. 4, Dec. 10; 2008: Mar. 3, Jun. 2, Sep. 2, Dec. 8; 2009: Mar. 9, Jun. 2, Aug. 31, Dec. 7; 2010: Mar. 1 | | | YK42 | | | | 8,066,980,000 | |
2044 — Dec. 1 | | 1.50 | | 2010: May 31, Aug. 30, Dec. 6; 2011: Feb. 28, Jun. 6, Sep. 6, Dec. 5; 2012: Feb. 27, Jun. 4, Sep. 17, Dec. 10, 2013: Feb. 25, Jun. 10, Sep. 16 | | | ZH04 | | | | 9,123,884,000 | |
2045 — Dec. 1 | | 3.50 | | 2011: Jun. 13, Aug. 29, Nov. 21; 2012: Mar. 26, May 28, Jul. 24, Sep. 24, Dec. 3; 2013: Feb. 5, Mar. 18, May 27, Aug. 6, Nov. 18; 2014: Feb. 18, Mar. 11 | | | ZS68 | | | | 16,400,000,000 | |
2047 — Dec. 1 | | 1.25 | | 2013: Dec. 2; 2014: Mar. 3, Jun. 16, Aug. 25, Dec. 15; 2015: Mar. 16, Jun. 8, Sep. 8, Dec. 8; 2016: Mar. 7, Jun. 6, Sep. 19, Dec. 13; 2017: Feb. 13 | | | B949 | | | | 8,554,777,000 | |
2048 — Dec. 1 | | 2.75 | | 2014: Jun. 2, Sep. 3, Nov. 17; 2015: Feb. 9, May 25, Aug. 24, Nov. 30; 2016: May 24, Oct. 3, Nov. 28; 2017: Jan. 31, May 23, Aug. 21, Oct. 2 | | | D358 | | | | 14,900,000,000 | |
2050 — Dec. 1 | | 0.50 | | 2017: Jun. 5, Sep. 15, Dec. 1; 2018: Mar. 5, Jun. 18, Sep. 14, Nov. 30; 2019: Feb. 22, May 24, Sep. 13 | | | G997 | | | | 5,796,670,000 | |
2051 — Dec. 1 | | 2.00 | | 2017: Dec. 22; 2018: Jan. 29, May 25, Aug. 17, Sep. 24, Nov. 2; 2019: Jan. 21, Apr. 29, Aug. 16, Sep. 30 | | | H722 | | | | 8,500,000,000 | |
2064 — Dec. 1 | | 2.75 | | 2014: May 1, Jul. 15, Nov. 25; 2017: Sep. 1, Nov. 20 | | | C939 | | | | 4,750,000,000 | |
| | | | | | | | |
Total Unmatured Marketable Bonds Payable in Canadian Dollars: | | | | | | | 583,729,587,250 | |
| | | | | | | | |
32
Unmatured Market Debt (Continued)
TREASURY BILLS
| | | | | | | | | | |
Maturity date(s) | | Yield % | | | | Issue dates | | Outstanding at September 30, 2019 | |
Various maturity dates from Oct. 2, 2019 to Sept. 17, 2020 | | 1.543 to 2.171 | | | | Various issue dates from Oct. 18, 2018 to Sept. 25, 2019 | | $ | 134,200,000,000 | |
| | | | | | | | | | |
CANADA SAVINGS BONDS(3)
| | | | | | | | | | |
Maturity date | | Annual Coupons % | | Issue date | | Series | | Outstanding at September 30, 2019 | |
2019 — Nov. 1(4) | | 0.40 – 4.85 | | 1999 — Nov. 1 | | S060 | | | $ 28,232,174 | |
2019 — Dec. 1(4) | | 0.40 – 4.85 | | 1999 — Dec. 1 | | S061 | | | 2,316,966 | |
2020 — Jan. 1(4) | | 0.40 – 4.85 | | 2000 — Jan. 1 | | S062 | | | 1,129,043 | |
2020 — Feb. 1(4) | | 0.40 – 4.60 | | 2000 — Feb. 1 | | S063 | | | 633,947 | |
2020 — Mar. 1(4) | | 0.40 – 4.75 | | 2000 — Mar. 1 | | S064 | | | 1,022,368 | |
2020 — Apr. 1(4) | | 0.40 – 4.75 | | 2000 — Apr. 1 | | S065 | | | 1,015,344 | |
2019 — Nov. 1 | | 0.40 – 0.65 | | 2009 — Nov. 1 | | S120 | | | 67,252,021 | |
2019 — Dec. 1 | | 0.40 – 0.65 | | 2009 — Dec. 1 | | S121 | | | 4,637,650 | |
2020 — Jan. 1 | | 0.40 – 0.65 | | 2010 — Jan. 1 | | S122 | | | 1,029,977 | |
2020 — Feb. 1 | | 0.40 – 0.65 | | 2010 — Feb. 1 | | S123 | | | 1,045,007 | |
2020 — Mar. 1 | | 0.40 – 0.65 | | 2010 — Mar. 1 | | S124 | | | 1,285,165 | |
2020 — Apr. 1 | | 0.40 – 0.65 | | 2010 — Apr. 1 | | S125 | | | 1,105,900 | |
2020 — Nov. 1 | | 0.50 – 0.65 | | 2010 — Nov. 1 | | S126 | | | 98,940,026 | |
2020 — Dec. 1 | | 0.50 – 0.65 | | 2010 — Dec. 1 | | S127 | | | 8,637,392 | |
2021 — Nov. 1 | | 0.50 | | 2011 — Nov. 1 | | S128 | | | 116,688,614 | |
2021 — Dec. 1 | | 0.50 | | 2011 — Dec. 1 | | S129 | | | 6,844,807 | |
2019 — Nov. 1 | | 0.50 | | 2016 — Nov. 1 | | S134 | | | 318,619,814 | |
2021 — Nov. 1 | | 0.50 | | 2017 — Nov. 1 | | S500 | | | 16,818,292 | |
2021 — Nov. 1 | | 0.50 | | 2018 — Nov. 1 | | S501 | | | 27,937,081 | |
| | | | | | | | | | |
Total | | | | | | | | $ | 705,191,588 | |
| | | | | | | | | | |
CANADA PREMIUM BONDS(5)
| | | | | | | | | | | | | | | | |
Maturity date | | Annual Coupons % | | | Issue date | | | Series | | | Outstanding at September 30, 2019 | |
2019 — Nov. 1(4) | | | 0.70 – 6.00 | | | | 1999 — Nov. 1 | | | | P009 | | | | $ 28,430,810 | |
2019 — Dec. 1(4) | | | 0.70 – 6.00 | | | | 1999 — Dec. 1 | | | | P010 | | | | 8,745,952 | |
2020 — Jan. 1(4) | | | 0.70 – 6.00 | | | | 2000 — Jan. 1 | | | | P011 | | | | 3,647,166 | |
2020 — Feb. 1(4) | | | 0.70 – 6.00 | | | | 2000 — Feb. 1 | | | | P012 | | | | 2,947,504 | |
2020 — Mar. 1(4) | | | 0.70 – 6.25 | | | | 2000 — Mar. 1 | | | | P013 | | | | 6,009,603 | |
2020 — Apr. 1(4) | | | 0.70 – 6.25 | | | | 2000 — Apr. 1 | | | | P014 | | | | 6,531,479 | |
2019 — Nov. 1 | | | 0.70 – 1.80 | | | | 2009 —Nov. 1 | | | | P070 | | | | 29,504,797 | |
2019 — Dec. 1 | | | 0.70 – 1.80 | | | | 2009 — Dec. 1 | | | | P071 | | | | 18,993,540 | |
2020 — Jan. 1 | | | 0.70 – 1.80 | | | | 2010 — Jan. 1 | | | | P072 | | | | 7,013,528 | |
2020 — Feb. 1 | | | 0.70 – 1.80 | | | | 2010 — Feb. 1 | | | | P073 | | | | 6,668,192 | |
2020 — Mar. 1 | | | 0.70 – 1.80 | | | | 2010 — Mar. 1 | | | | P074 | | | | 4,937,430 | |
2020 — Apr. 1 | | | 0.70 – 1.80 | | | | 2010 — Apr. 1 | | | | P075 | | | | 4,847,707 | |
2020 — Nov. 1 | | | 0.80 – 1.70 | | | | 2010 — Nov. 1 | | | | P076 | | | | 42,154,736 | |
2020 — Dec. 1 | | | 0.80 – 1.70 | | | | 2010 — Dec. 1 | | | | P077 | | | | 31,176,307 | |
2021 — Nov. 1 | | | 0.80 – 1.40 | | | | 2011 — Nov. 1 | | | | P078 | | | | 53,491,108 | |
2021 — Dec. 1 | | | 0.80 – 1.40 | | | | 2011 — Dec. 1 | | | | P079 | | | | 24,997,298 | |
2019 — Nov. 1 | | | 0.80 – 1.00 | | | | 2016 — Nov. 1 | | | | P088 | | | | 70,505,542 | |
2019 — Dec. 1 | | | 0.80 – 1.00 | | | | 2016 — Dec. 1 | | | | P089 | | | | 32,269,717 | |
2021 — Nov. 1 | | | 0.80 – 1.00 | | | | 2017 — Nov. 1 | | | | P550 | | | | 27,305,221 | |
2021 — Dec. 1 | | | 0.80 – 1.00 | | | | 2017 — Dec. 1 | | | | P551 | | | | 1,221,524 | |
2021 — Nov. 1 | | | 1.10 – 1.30 | | | | 2018 — Nov. 1 | | | | P552 | | | | 25,742,404 | |
2021 — Dec. 1 | | | 1.25 – 1.45 | | | | 2018 — Dec. 1 | | | | P553 | | | | 2,385,868 | |
| | | | | | | | | | | | | | | | |
Total | | | | | | | | | | | | | | $ | 439,527,433 | |
| | | | | | | | | | | | | | | | |
| | | | | | | | |
| |
| Total Unmatured Market Debt Payable in Canadian Dollars | | $
| 719,074,306,271
|
|
| | | | | | | | |
| | | | | | | | |
33
Unmatured Market Debt (Continued)
(B) PAYABLE IN FOREIGN CURRENCY (1) (6)
CANADA BILLS
| | | | | | | | | | |
Maturity date(s) | | Yield(s) % | | Original issue amount | | Issue date(s) | | Outstanding at September 30, 2019 | |
Various maturity dates from Oct. 1, 2019 to May 1, 2020 | | 1.77 to 2.47 | | USD 1,930,870,000 | | Various issue dates
from Feb. 5, 2019 to
Sep. 27, 2019 | | $ | 2,557,244,228 | |
| | | | | | | | | | |
CANADA NOTES
| | | | | | | | | | |
Maturity date | | Coupon % / Basis | | Original amount at issue | | Issue date | | Outstanding at
September 30, 2019 | |
2019 — Dec. 10 | | 1.85 | | USD 50,000,000 | | 2013 — Dec. 10 | | $ | 66,220,000 | |
2019 — Dec. 13 | | 3 month LIBOR | | USD 50,000,000 | | 2013 — Dec. 13 | | | 66,220,000 | |
2020 — Jan. 13 | | 3 month LIBOR | | USD 250,000,000 | | 2017 — Jan. 13 | | | 331,100,000 | |
2020 — Feb. 10 | | 1.276 | | USD 150,000,000 | | 2016 — Feb.10 | | | 198,660,000 | |
2020 — Jun. 10 | | 3 month LIBOR | | USD 100,000,000 | | 2014 — Jun. 10 | | | 132,440,000 | |
2020 — Sep. 10 | | 3 month LIBOR | | USD 250,000,000 | | 2014 — Sep. 10 | | | 331,100,000 | |
2020 — Sep. 15 | | 3 month LIBOR | | USD 50,000,000 | | 2014 — Sep. 15 | | | 66,220,000 | |
2020 — Dec. 20 | | 2.30 | | USD 50,000,000 | | 2013 — Dec. 20 | | | 66,220,000 | |
2021 — Aug. 24 | | 3 month LIBOR | | USD 50,000,000 | | 2015 — Aug. 24 | | | 66,220,000 | |
| | | | | | | | | | |
Total | | $ | 1,324,400,000 | |
| | | | | | | | | | |
EURO MEDIUM TERM NOTES
| | | | | | | | | | |
Maturity date | | Coupon % / Basis | | Original amount at issue | | Issue date | | Outstanding at
September 30, 2019 | |
2020 — Mar. 19 | | 3 month LIBOR | | USD 125,000,000 | | 2014 — Mar. 19 | | $ | 165,550,000 | |
2020 — May 8 | | 3 month LIBOR | | USD 125,000,000 | | 2014 — May 8 | | | 165,550,000 | |
2021 — Jan. 15 | | 0.15 | | EUR 150,000,000 | | 2015 — Jan. 15 | | | 216,550,000 | |
| | | | | | | | | | |
Total | | | | | | | | $ | 547,650,000 | |
| | | | | | | | | | |
OTHER MARKETABLE BONDS PAYABLE IN FOREIGN CURRENCIES
| | | | | | | | | | |
Maturity date | | Coupon % | | Original amount at issue or assumption | | Issue or assumption date | | Outstanding at September 30, 2019 | |
2020 — Jan. 13 | | 3.50 | | EUR 2,000,000,000 | | 2010 — Jan. 13 | | $ | 2,887,400,000 | |
2022 — Jan. 25 | | 2.625 | | USD 3,000,000,000 | | 2019 — Jan. 25 | | | 3,973,200,000 | |
2022 — Nov. 15 | | 2.00 | | USD 3,000,000,000 | | 2017 — Nov. 15 | | | 3,973,200,000 | |
| | | | | | | | | | |
Total | | $ | 10,833,800,000 | |
| | | | | | | | | | |
| |
| Total Unmatured Market Debt Payable in Foreign Currency | | $ | 15,263,094,228 | |
| | | | | | | | | | |
| |
| Total Unmatured Market Debt | | $ | 734,337,400,499 | |
| | | | | | | | | | |
34
Unmatured Market Debt (Continued)
(C) CROSS CURRENCY SWAPS
For the cross currency swaps listed below (outstanding as of September 30, 2019), the Government’s Canadian dollar liability has been swapped into a U.S. dollar liability.
| | | | | | | | |
| | | Canadian dollar liability | | U.S. dollar liability |
Maturity date | | Coupon % | | Notional amount | | Basis | | Notional amount |
| | | | | | | | |
2019 – Oct. 11 | | 2.48210 | | 154,470,000 | | 3 month LIBOR | | 150,000,000 |
Oct. 28 | | 1.97740 | | 24,890,000 | | 3 month LIBOR | | 25,000,000 |
Oct. 29 | | 2.04640 | | 100,140,000 | | 3 month LIBOR | | 100,000,000 |
Oct. 20 | | 3.5067 | | $ 54,964,000 | | 3 month LIBOR | | USD 52,000,000 |
Nov. 20 | | 3.4095 | | 110,400,000 | | Fixed | | 100,000,000 |
Nov. 20 | | 3.4625 | | 110,000,000 | | Fixed | | 100,000,000 |
Nov. 23 | | 3.4101 | | 53,445,000 | | 3 month LIBOR | | 50,000,000 |
Nov. 25 | | 3.4055 | | 66,316,800 | | 3 month LIBOR | | 62,800,000 |
Nov. 27 | | 3.2949 | | 52,750,000 | | 3 month LIBOR | | 50,000,000 |
2020 — Jan. 20 | | 3.2663 | | 106,000,000 | | 3 month LIBOR | | 100,000,000 |
Jan. 20 | | 3.3197 | | 52,750,000 | | 3 month LIBOR | | 50,000,000 |
Jan. 20 | | 3.3747 | | 52,600,000 | | 3 month LIBOR | | 50,000,000 |
Jan. 20 | | 3.4990 | | 15,427,500 | | 3 month LIBOR | | 15,000,000 |
Jan. 20 | | 3.5145 | | 18,562,536 | | 3 month LIBOR | | 17,995,672 |
Feb. 20 | | 3.3900 | | 53,130,000 | | 3 month LIBOR | | 50,000,000 |
Feb. 20 | | 3.4030 | | 53,500,000 | | Fixed | | 50,000,000 |
Mar. 20 | | 3.3910 | | 53,500,000 | | Fixed | | 50,000,000 |
Mar. 20 | | 3.4221 | | 106,570,000 | | Fixed | | 100,000,000 |
Mar. 20 | | 3.4370 | | 157,050,000 | | Fixed | | 150,000,000 |
Mar. 20 | | 3.4761 | | 103,300,000 | | Fixed | | 100,000,000 |
Mar. 20 | | 3.4944 | | 105,750,000 | | Fixed | | 100,000,000 |
Mar. 20 | | 3.5531 | | 205,600,000 | | Fixed | | 200,000,000 |
Mar. 20 | | 3.5577 | | 103,050,000 | | Fixed | | 100,000,000 |
Apr. 20 | | 3.3537 | | 96,450,000 | | 3 month LIBOR | | 100,000,000 |
Apr. 20 | | 3.3554 | | 95,800,000 | | 3 month LIBOR | | 100,000,000 |
Apr. 20 | | 3.4263 | | 95,750,000 | | 3 month LIBOR | | 100,000,000 |
Apr. 20 | | 3.4551 | | 105,450,000 | | Fixed | | 100,000,000 |
Apr. 20 | | 3.4945 | | 104,580,000 | | Fixed | | 100,000,000 |
Apr. 20 | | 3.5241 | | 104,250,000 | | Fixed | | 100,000,000 |
Apr. 20 | | 3.5363 | | 157,305,000 | | Fixed | | 150,000,000 |
May 20 | | 3.1879 | | 95,000,000 | | 3 month LIBOR | | 100,000,000 |
35
Unmatured Market Debt (Continued)
| | | | | | | | |
| | | Canadian dollar liability | | U.S. dollar liability |
Maturity date | | Coupon % | | Notional amount | | Basis | | Notional amount |
May 20 | | 3.21258 | | $ 95,200,000 | | 3 month LIBOR | | USD 100,000,000 |
May 20 | | 3.2304 | | 96,700,000 | | 3 month LIBOR | | 100,000,000 |
May 20 | | 3.2708 | | 95,600,000 | | 3 month LIBOR | | 100,000,000 |
May 20 | | 3.2899 | | 95,500,000 | | 3 month LIBOR | | 100,000,000 |
May 20 | | 3.2931 | | 96,350,000 | | 3 month LIBOR | | 100,000,000 |
May 20 | | 3.4123 | | 96,350,000 | | 3 month LIBOR | | 100,000,000 |
May 20 | | 3.6560 | | 50,895,000 | | Fixed | | 50,000,000 |
May 20 | | 3.7121 | | 100,500,000 | | Fixed | | 100,000,000 |
Jun. 20 | | 2.9176 | | 49,040,000 | | 3 month LIBOR | | 50,000,000 |
Jun. 20 | | 2.9730 | | 98,000,000 | | 3 month LIBOR | | 100,000,000 |
Jun. 20 | | 3.0377 | | 96,770,000 | | 3 month LIBOR | | 100,000,000 |
Jun. 20 | | 3.0730 | | 96,070,000 | | 3 month LIBOR | | 100,000,000 |
Jun. 20 | | 3.2828 | | 79,792,500 | | Fixed | | 75,000,000 |
Jun. 20 | | 3.2970 | | 53,090,000 | | Fixed | | 50,000,000 |
Jun. 20 | | 3.3006 | | 53,425,000 | | Fixed | | 50,000,000 |
Jun. 20 | | 3.4058 | | 51,700,000 | | Fixed | | 50,000,000 |
Jun. 20 | | 3.4655 | | 51,825,000 | | Fixed | | 50,000,000 |
Jun. 20 | | 3.5847 | | 51,000,000 | | Fixed | | 50,000,000 |
Jun. 22 | | 3.2882 | | 52,550,000 | | Fixed | | 50,000,000 |
Jun. 22 | | 3.3000 | | 105,600,000 | | Fixed | | 100,000,000 |
Jun. 22 | | 3.3118 | | 52,525,000 | | Fixed | | 50,000,000 |
Jun. 22 | | 3.3315 | | 104,000,000 | | Fixed | | 100,000,000 |
Jun. 22 | | 3.3647 | | 104,150,000 | | Fixed | | 100,000,000 |
Jul. 20 | | 2.7559 | | 49,050,000 | | 3 month LIBOR | | 50,000,000 |
Jul. 20 | | 2.8281 | | 48,635,000 | | 3 month LIBOR | | 50,000,000 |
Jul. 20 | | 2.8550 | | 48,800,000 | | 3 month LIBOR | | 50,000,000 |
Jul. 20 | | 3.2942 | | 51,060,000 | | Fixed | | 50,000,000 |
Jul. 20 | | 3.3248 | | 51,250,000 | | Fixed | | 50,000,000 |
Aug. 20 | | 2.7655 | | 47,280,000 | | 3 month LIBOR | | 50,000,000 |
Aug. 20 | | 2.7806 | | 47,250,000 | | 3 month LIBOR | | 50,000,000 |
Aug. 20 | | 2.7943 | | 47,265,000 | | 3 month LIBOR | | 50,000,000 |
Aug. 20 | | 2.8200 | | 48,000,000 | | 3 month LIBOR | | 50,000,000 |
Aug. 20 | | 2.8275 | | 47,525,000 | | 3 month LIBOR | | 50,000,000 |
Aug. 20 | | 2.8339 | | 47,400,000 | | 3 month LIBOR | | 50,000,000 |
Aug. 20 | | 2.9470 | | 47,925,000 | | 3 month LIBOR | | 50,000,000 |
Aug. 20 | | 3.0731 | | 103,950,000 | | 3 month LIBOR | | 100,000,000 |
Aug. 20 | | 3.0789 | | 98,393,300 | | 3 month LIBOR | | 94,700,000 |
Aug. 20 | | 3.0890 | | 51,200,000 | | Fixed | | 50,000,000 |
Aug. 20 | | 3.1462 | | 52,740,000 | | Fixed | | 50,000,000 |
Aug. 20 | | 3.1601 | | 52,750,000 | | Fixed | | 50,000,000 |
Aug. 20 | | 3.1857 | | 52,000,000 | | Fixed | | 50,000,000 |
Aug. 20 | | 3.2031 | | 104,000,000 | | Fixed | | 100,000,000 |
Aug. 20 | | 3.2298 | | 51,600,000 | | Fixed | | 50,000,000 |
Aug. 20 | | 3.2321 | | 103,100,000 | | Fixed | | 100,000,000 |
Aug. 20 | | 3.2555 | | 103,620,000 | | Fixed | | 100,000,000 |
Sep. 20 | | 2.3180 | | 49,200,000 | | 3 month LIBOR | | 50,000,000 |
Sep. 20 | | 2.3302 | | 49,450,000 | | 3 month LIBOR | | 50,000,000 |
Sep. 20 | | 2.7500 | | 47,445,000 | | 3 month LIBOR | | 50,000,000 |
Sep. 20 | | 2.8800 | | 18,358,980 | | 3 month LIBOR | | 17,560,000 |
Oct. 20 | | 3.0142 | | 51,425,000 | | Fixed | | 50,000,000 |
Oct. 20 | | 2.9630 | | 62,502,178 | | 3 month LIBOR | | 60,593,483 |
Oct. 20 | | 2.9735 | | 51,180,000 | | Fixed | | 50,000,000 |
Dec. 20 | | 3.3038 | | 50,550,000 | | Fixed | | 50,000,000 |
Dec. 20 | | 3.3429 | | 50,375,000 | | Fixed | | 50,000,000 |
2021 — Jan. 20 | | 3.1781 | | 74,625,000 | | Fixed | | 75,000,000 |
Jan. 20 | | 3.2328 | | 74,265,000 | | Fixed | | 75,000,000 |
Jan. 20 | | 3.2631 | | 74,077,500 | | Fixed | | 75,000,000 |
Jan. 20 | | 3.3126 | | 76,256,630 | | Fixed | | 76,371,187 |
Feb. 20 | | 3.2877 | | 99,500,000 | | Fixed | | 100,000,000 |
Feb. 20 | | 3.2954 | | 100,170,000 | | Fixed | | 100,000,000 |
Feb. 20 | | 3.3000 | | 100,000,000 | | Fixed | | 100,000,000 |
Feb. 20 | | 3.3143 | | 49,900,000 | | Fixed | | 50,000,000 |
Feb. 20 | | 3.3231 | | 99,420,000 | | Fixed | | 100,000,000 |
Feb. 20 | | 3.3345 | | 99,500,000 | | Fixed | | 100,000,000 |
Feb. 20 | | 3.3442 | | 99,500,000 | | Fixed | | 100,000,000 |
Feb. 20 | | 3.3500 | | 99,300,000 | | Fixed | | 100,000,000 |
Feb. 20 | | 3.3500 | | 99,410,000 | | Fixed | | 100,000,000 |
Feb. 20 | | 3.3511 | | 49,715,000 | | Fixed | | 50,000,000 |
Feb. 20 | | 3.3627 | | 99,000,000 | | Fixed | | 100,000,000 |
Feb. 20 | | 3.4051 | | 107,334,370 | | 3 month LIBOR | | 108,309,152 |
Feb. 20 | | 3.4160 | | 49,495,000 | | Fixed | | 50,000,000 |
Feb. 20 | | 3.4208 | | 99,120,000 | | Fixed | | 100,000,000 |
Feb. 20 | | 3.4616 | | 98,750,000 | | Fixed | | 100,000,000 |
Mar. 20 | | 3.3035 | | 98,150,000 | | Fixed | | 100,000,000 |
Mar. 20 | | 3.3072 | | 97,200,000 | | Fixed | | 100,000,000 |
36
Unmatured Market Debt (Continued)
| | | | | | | | |
| | | Canadian dollar liability | | U.S. dollar liability |
Maturity date | | Coupon % | | Notional amount | | Basis | | Notional amount |
Mar. 20 | | 3.3100 | | $ 97,600,000 | | Fixed | | USD 100,000,000 |
Mar. 20 | | 3.3131 | | 49,160,000 | | Fixed | | 50,000,000 |
Mar. 20 | | 3.3300 | | 49,100,000 | | Fixed | | 50,000,000 |
Mar. 20 | | 3.3331 | | 49,620,000 | | Fixed | | 50,000,000 |
Mar. 20 | | 3.3832 | | 98,600,000 | | Fixed | | 100,000,000 |
Mar. 20 | | 3.4756 | | 98,500,000 | | Fixed | | 100,000,000 |
Mar. 20 | | 3.4874 | | 197,200,000 | | Fixed | | 200,000,000 |
Mar. 20 | | 3.5177 | | 98,600,000 | | Fixed | | 100,000,000 |
Apr. 20 | | 3.1875 | | 141,932,739 | | 3 month LIBOR | | 144,167,333 |
Apr. 20 | | 3.1939 | | 147,750,000 | | 3 month LIBOR | | 150,000,000 |
Apr. 20 | | 3.4312 | | 96,050,000 | | 3 month LIBOR | | 100,000,000 |
Apr. 20 | | 3.4540 | | 105,782,464 | | 3 month LIBOR | | 110,443,166 |
May 9 | | 0.76270 | | 97,706,146 | | 3 month LIBOR | | 76,243,579 |
May 20 | | 3.3030 | | 4,889,148 | | 3 month LIBOR | | 5,135,660 |
May 20 | | 3.3703 | | 133,206,690 | | 3 month LIBOR | | 138,324,704 |
Jul. 20 | | 3.0571 | | 135,617,347 | | 3 month LIBOR | | 140,028,236 |
2022 — Feb. 6 | | 0.9446 | | 188,295,000 | | Fixed | | 150,000,000 |
Feb. 12 | | 1.0430 | | 125,250,000 | | Fixed | | 100,000,000 |
Feb. 20 | | 1.98960 | | 48,066,474 | | 3 month LIBOR | | 47,216,576 |
Mar. 16 | | 0.90400 | | 132,750,000 | | Fixed | | 100,000,000 |
Mar. 20 | | 2.06980 | | 67,549,554 | | 3 month LIBOR | | 67,414,725 |
Apr. 20 | | 2.16100 | | 118,258,207 | | 3 month LIBOR | | 119,392,436 |
Apr. 20 | | 2.22240 | | 13,045,854 | | 3 month LIBOR | | 13,144,437 |
May 20 | | 2.01810 | | 150,480,000 | | 3 month LIBOR | | 150,000,000 |
May 20 | | 2.04090 | | 49,715,000 | | 3 month LIBOR | | 50,000,000 |
May 20 | | 2.04640 | | 100,200,000 | | 3 month LIBOR | | 100,000,000 |
May 20 | | 2.07870 | | 24,737,500 | | 3 month LIBOR | | 25,000,000 |
May 20 | | 2.09420 | | 24,762,500 | | 3 month LIBOR | | 25,000,000 |
May 20 | | 2.12000 | | 49,265,000 | | 3 month LIBOR | | 50,000,000 |
May 20 | | 2.16300 | | 24,905,000 | | 3 month LIBOR | | 25,000,000 |
Jun. 10 | | 1.3449 | | 124,140,000 | | 3 month LIBOR | | 100,000,000 |
Jun. 11 | | 1.3584 | | 52,649,285 | | 3 month LIBOR | | 42,631,000 |
Jun. 16 | | 1.3669 | | 123,150,000 | | 3 month LIBOR | | 100,000,000 |
Jun. 20 | | 1.85000 | | 86,606,176 | | 3 month LIBOR | | 84,551,573 |
Jun. 20 | | 1.85060 | | 102,290,000 | | 3 month LIBOR | | 100,000,000 |
Jun. 20 | | 1.91050 | | 50,150,000 | | 3 month LIBOR | | 50,000,000 |
Jun. 20 | | 2.08300 | | 24,622,500 | | 3 month LIBOR | | 25,000,000 |
Jun. 20 | | 2.08520 | | 150,084,800 | | 3 month LIBOR | | 152,000,000 |
Jun. 20 | | 2.08950 | | 98,720,000 | | 3 month LIBOR | | 100,000,000 |
Jul. 10 | | 1.0632 | | 159,819,000 | | 3 month LIBOR | | 125,250,000 |
Jul. 20 | | 1.1167 | | 129,300,000 | | 3 month LIBOR | | 100,000,000 |
Jul. 20 | | 1.72730 | | 51,300,000 | | 3 month LIBOR | | 50,000,000 |
Jul. 20 | | 1.73460 | | 51,325,000 | | 3 month LIBOR | | 50,000,000 |
Jul. 20 | | 1.74000 | | 51,425,000 | | 3 month LIBOR | | 50,000,000 |
Jul. 20 | | 1.77550 | | 77,325,000 | | 3 month LIBOR | | 75,000,000 |
Jul. 20 | | 1.78200 | | 51,325,000 | | 3 month LIBOR | | 50,000,000 |
Jul. 20 | | 1.79420 | | 51,000,000 | | 3 month LIBOR | | 50,000,000 |
Jul. 20 | | 1.80000 | | 102,550,000 | | 3 month LIBOR | | 100,000,000 |
Jul. 20 | | 1.80300 | | 102,600,000 | | 3 month LIBOR | | 100,000,000 |
Aug. 20 | | 1.58000 | | 101,805,000 | | 3 month LIBOR | | 100,000,000 |
Aug. 20 | | 1.58950 | | 50,915,000 | | 3 month LIBOR | | 50,000,000 |
Aug. 20 | | 1.59990 | | 50,800,000 | | 3 month LIBOR | | 50,000,000 |
Aug. 20 | | 1.64840 | | 50,400,000 | | 3 month LIBOR | | 50,000,000 |
Aug. 20 | | 1.66000 | | 51,025,000 | | 3 month LIBOR | | 50,000,000 |
Aug. 20 | | 1.66700 | | 69,052,452 | | 3 month LIBOR | | 67,566,000 |
Aug. 20 | | 1.66700 | | 71,470,000 | | 3 month LIBOR | | 70,000,000 |
Aug. 25 | | 0.8909 | | 131,250,000 | | 3 month LIBOR | | 100,000,000 |
Sep. 15 | | 1.0770 | | 66,290,000 | | 3 month LIBOR | | 50,000,000 |
Sep. 20 | | 1.71520 | | 100,200,000 | | 3 month LIBOR | | 100,000,000 |
Sep. 20 | | 1.71640 | | 100,400,000 | | 3 month LIBOR | | 100,000,000 |
Sep. 20 | | 1.80800 | | 98,940,000 | | 3 month LIBOR | | 100,000,000 |
Sep. 20 | | 1.83510 | | 49,750,000 | | 3 month LIBOR | | 50,000,000 |
Sep. 20 | | 1.92480 | | 49,475,000 | | 3 month LIBOR | | 50,000,000 |
Sep. 24 | | 1.0867 | | 132,820,000 | | 3 month LIBOR | | 100,000,000 |
Oct. 16 | | 1.06380 | | 133,714,600 | | 3 month LIBOR | | 103,000,000 |
Oct. 20 | | 1.85500 | | 97,620,000 | | 3 month LIBOR | | 100,000,000 |
Oct. 20 | | 1.90450 | | 97,600,000 | | 3 month LIBOR | | 100,000,000 |
Oct. 20 | | 1.92060 | | 97,500,000 | | 3 month LIBOR | | 100,000,000 |
2023 — Feb. 20 | | 1.93800 | | 19,832,670 | | 3 month LIBOR | | 20,100,000 |
Feb. 20 | | 1.94000 | | 51,027,900 | | 3 month LIBOR | | 51,700,000 |
Feb. 20 | | 1.93900 | | 49,400,000 | | 3 month LIBOR | | 50,000,000 |
Feb. 20 | | 1.92890 | | 49,680,000 | | Fixed | | 50,000,000 |
Feb. 20 | | 1.93350 | | 99,420,000 | | Fixed | | 100,000,000 |
Feb. 20 | | 1.91400 | | 50,135,000 | | Fixed | | 50,000,000 |
37
Unmatured Market Debt (Continued)
| | | | | | | | |
| | | Canadian dollar liability | | U.S. dollar liability |
Maturity date | | Coupon % | | Notional amount | | Basis | | Notional amount |
Feb. 20 | | 1.99700 | | $ 100,900,000 | | Fixed | | USD 100,000,000 |
Mar. 20 | | 2.03160 | | 50,150,000 | | Fixed | | 50,000,000 |
Mar. 20 | | 2.02700 | | 99,900,000 | | Fixed | | 100,000,000 |
Mar. 20 | | 1.98480 | | 50,150,000 | | Fixed | | 50,000,000 |
Mar. 20 | | 1.98480 | | 100,700,000 | | Fixed | | 100,000,000 |
Mar. 20 | | 1.97830 | | 50,325,000 | | Fixed | | 50,000,000 |
Mar. 20 | | 2.04710 | | 100,420,000 | | Fixed | | 100,000,000 |
Mar. 20 | | 2.04400 | | 150,465,000 | | Fixed | | 150,000,000 |
Mar. 20 | | 2.02500 | | 100,100,000 | | Fixed | | 100,000,000 |
Mar. 20 | | 2.02830 | | 100,100,000 | | Fixed | | 100,000,000 |
Mar. 20 | | 2.03100 | | 100,120,000 | | Fixed | | 100,000,000 |
Mar. 20 | | 2.02000 | | 101,250,000 | | Fixed | | 100,000,000 |
Mar. 20 | | 2.01680 | | 101,200,000 | | Fixed | | 100,000,000 |
Mar. 20 | | 2.04500 | | 101,680,000 | | Fixed | | 100,000,000 |
Apr. 20 | | 1.89700 | | 102,970,000 | | Fixed | | 100,000,000 |
Apr. 20 | | 1.90510 | | 103,030,000 | | Fixed | | 100,000,000 |
Apr. 20 | | 1.95880 | | 102,800,000 | | Fixed | | 100,000,000 |
Apr. 20 | | 1.95380 | | 102,760,000 | | Fixed | | 100,000,000 |
Apr. 20 | | 1.94200 | | 102,600,000 | | Fixed | | 100,000,000 |
Apr. 20 | | 1.94100 | | 102,650,000 | | Fixed | | 100,000,000 |
Apr. 20 | | 1.95070 | | 205,700,000 | | Fixed | | 200,000,000 |
Apr. 20 | | 1.97460 | | 102,650,000 | | Fixed | | 100,000,000 |
Apr. 20 | | 1.97110 | | 205,420,000 | | Fixed | | 200,000,000 |
Apr. 20 | | 1.88460 | | 78,771,000 | | 3 month LIBOR | | 77,000,000 |
Apr. 20 | | 1.83980 | | 204,900,000 | | Fixed | | 200,000,000 |
May 3 | | 1.13630 | | 125,100,000 | | Fixed | | 100,000,000 |
May 20 | | 1.71930 | | 114,307,200 | | 3 month LIBOR | | 112,000,000 |
May 20 | | 1.71930 | | 89,812,800 | | 3 month LIBOR | | 88,000,000 |
May 20 | | 1.69580 | | 101,720,000 | | 3 month LIBOR | | 100,000,000 |
Jun. 20 | | 1.93050 | | 103,100,000 | | 3 month LIBOR | | 100,000,000 |
Jun. 22 | | 1.4896 | | 121,550,000 | | 3 month LIBOR | | 100,000,000 |
Jul. 20 | | 2.17690 | | 102,000,000 | | 3 month LIBOR | | 100,000,000 |
Jul. 20 | | 2.19500 | | 101,900,000 | | 3 month LIBOR | | 100,000,000 |
Jul. 20 | | 2.16600 | | 101,700,000 | | 3 month LIBOR | | 100,000,000 |
Jul. 20 | | 2.15000 | | 102,070,000 | | 3 month LIBOR | | 100,000,000 |
Jul. 20 | | 2.28700 | | 207,000,000 | | 3 month LIBOR | | 200,000,000 |
Jul. 20 | | 2.28950 | | 103,690,000 | | 3 month LIBOR | | 100,000,000 |
Jul. 20 | | 2.49090 | | 48,650,400 | | 3 month LIBOR | | 46,400,000 |
Aug. 20 | | 1.1344 | | 130,900,000 | | 3 month LIBOR | | 100,000,000 |
Aug. 20 | | 2.49150 | | 105,850,000 | | 3 month LIBOR | | 100,000,000 |
Aug. 20 | | 2.47400 | | 130,055,150 | | 3 month LIBOR | | 123,100,000 |
Aug. 20 | | 2.42970 | | 104,000,000 | | 3 month LIBOR | | 100,000,000 |
Sep. 18 | | 1.3032 | | 38,309,000 | | 3 month LIBOR | | 29,000,000 |
Sep. 20 | | 2.55970 | | 205,800,000 | | 3 month LIBOR | | 200,000,000 |
Sep. 20 | | 2.51030 | | 104,300,000 | | 3 month LIBOR | | 100,000,000 |
Oct. 20 | | 2.74130 | | 207,880,000 | | 3 month LIBOR | | 200,000,000 |
Oct. 20 | | 2.61040 | | 103,000,000 | | 3 month LIBOR | | 100,000,000 |
Oct. 20 | | 2.61040 | | 51,500,000 | | 3 month LIBOR | | 50,000,000 |
Oct. 20 | | 2.61040 | | 25,750,000 | | 3 month LIBOR | | 25,000,000 |
Oct. 20 | | 2.61040 | | 25,750,000 | | 3 month LIBOR | | 25,000,000 |
Dec. 13 | | 1.3323 | | 197,550,000 | | Fixed | | 150,000,000 |
2024 — Jan. 20 | | 2.53160 | | 78,345,000 | | 3 month LIBOR | | 75,000,000 |
Jan. 20 | | 2.58780 | | 105,250,000 | | 3 month LIBOR | | 100,000,000 |
Jan. 20 | | 2.63700 | | 104,850,000 | | 3 month LIBOR | | 100,000,000 |
Jan. 20 | | 2.64000 | | 104,900,000 | | 3 month LIBOR | | 100,000,000 |
Feb. 20 | | 2.44240 | | 78,120,000 | | 3 month LIBOR | | 70,000,000 |
Feb. 20 | | 2.57680 | | 117,390,000 | | 3 month LIBOR | | 107,500,000 |
Feb. 20 | | 2.61220 | | 109,600,000 | | 3 month LIBOR | | 100,000,000 |
Mar. 20 | | 2.36450 | | 111,100,000 | | 3 month LIBOR | | 100,000,000 |
Mar. 20 | | 2.40440 | | 111,350,000 | | 3 month LIBOR | | 100,000,000 |
38
Unmatured Market Debt (Continued)
| | | | | | | | | | | | |
| | | Canadian dollar liability | | | U.S. dollar liability | |
Maturity date | | Coupon % | | Notional amount | | | Basis | | Notional amount | |
Apr. 20 | | 2.49320 | | | $ 84,000,000 | | | 3 month LIBOR | | | USD 75,000,000 | |
May 20 | | 2.38680 | | | 65,899,650 | | | 3 month LIBOR | | | 60,100,000 | |
May 20 | | 2.44830 | | | 137,212,500 | | | 3 month LIBOR | | | 125,000,000 | |
May 20 | | 2.47500 | | | 50,458,500 | | | 3 month LIBOR | | | 45,000,000 | |
Jun. 20 | | 2.34430 | | | 109,740,000 | | | Fixed | | | 100,000,000 | |
Jun. 20 | | 2.36750 | | | 81,757,500 | | | Fixed | | | 75,000,000 | |
Jun. 20 | | 2.40570 | | | 109,640,000 | | | Fixed | | | 100,000,000 | |
Aug. 20 | | 2.11200 | | | 135,137,500 | | | Fixed | | | 125,000,000 | |
Aug. 20 | | 2.11420 | | | 136,813,205 | | | 3 month LIBOR | | | 126,550,000 | |
Aug. 20 | | 2.11440 | | | 107,360,000 | | | Fixed | | | 100,000,000 | |
Aug. 20 | | 2.14130 | | | 107,370,000 | | | 3 month LIBOR | | | 100,000,000 | |
Aug. 20 | | 2.21890 | | | 107,320,000 | | | Fixed | | | 100,000,000 | |
Aug. 20 | | 2.25360 | | | 106,750,000 | | | Fixed | | | 100,000,000 | |
Aug. 20 | | 2.25940 | | | 106,730,000 | | | Fixed | | | 100,000,000 | |
Sep. 20 | | 2.07730 | | | 109,370,000 | | | 3 month LIBOR | | | 100,000,000 | |
Sep. 20 | | 2.08840 | | | 109,380,000 | | | 3 month LIBOR | | | 100,000,000 | |
Sep. 20 | | 2.10840 | | | 109,150,000 | | | 3 month LIBOR | | | 100,000,000 | |
Oct. 20 | | 2.08440 | | | 54,375,000 | | | 3 month LIBOR | | | 50,000,000 | |
Nov. 20 | | 2.02720 | | | 111,800,000 | | | 3 month LIBOR | | | 100,000,000 | |
Nov. 20 | | 1.95800 | | | 112,300,000 | | | 3 month LIBOR | | | 100,000,000 | |
Nov. 20 | | 1.88120 | | | 113,080,000 | | | 3 month LIBOR | | | 100,000,000 | |
Nov. 20 | | 1.98340 | | | 112,240,000 | | | 3 month LIBOR | | | 100,000,000 | |
Nov. 20 | | 2.00210 | | | 113,040,000 | | | Fixed | | | 100,000,000 | |
Dec. 2 | | 1.90520 | | | 113,790,000 | | | 3 month LIBOR | | | 100,000,000 | |
Dec. 3 | | 1.85390 | | | 113,780,000 | | | 3 month LIBOR | | | 100,000,000 | |
Dec. 11 | | 1.87030 | | | 114,180,000 | | | 3 month LIBOR | | | 100,000,000 | |
Dec. 15 | | 2.01060 | | | 13,745,295 | | | 3 month LIBOR | | | 12,150,000 | |
2025 — Jan. 16 | | 1.5504 | | | 119,390,000 | | | 3 month LIBOR | | | 100,000,000 | |
Jan. 20 | | 2.04600 | | | 114,150,000 | | | Fixed | | | 100,000,000 | |
Jan. 22 | | 1.4957 | | | 121,050,000 | | | 3 month LIBOR | | | 100,000,000 | |
Jan. 22 | | 1.6175 | | | 59,780,000 | | | Fixed | | | 50,000,000 | |
Jan. 30 | | 1.3553 | | | 124,490,000 | | | 3 month LIBOR | | | 100,000,000 | |
Feb. 5 | | 1.2298 | | | 125,240,000 | | | Fixed | | | 100,000,000 | |
May 11 | | 1.20510 | | | 64,925,000 | | | Fixed | | | 50,000,000 | |
May 31 | | 1.23740 | | | 258,800,000 | | | Fixed | | | 200,000,000 | |
Jun. 2 | | 1.20030 | | | 262,000,000 | | | Fixed | | | 200,000,000 | |
Jun. 3 | | 1.18618 | | | 196,275,000 | | | Fixed | | | 150,000,000 | |
Jun. 6 | | 1.17250 | | | 196,710,000 | | | Fixed | | | 150,000,000 | |
Jun. 7 | | 1.07010 | | | 64,745,000 | | | Fixed | | | 50,000,000 | |
Jun. 13 | | 1.03840 | | | 127,300,000 | | | Fixed | | | 100,000,000 | |
Jun. 14 | | 1.02860 | | | 127,110,000 | | | Fixed | | | 100,000,000 | |
Jun. 14 | | 1.03916 | | | 127,400,000 | | | Fixed | | | 100,000,000 | |
Dec. 8 | | 1.61800 | | | 133,730,000 | | | Fixed | | | 100,000,000 | |
Dec. 10 | | 1.54170 | | | 271,120,000 | | | Fixed | | | 200,000,000 | |
Dec. 14 | | 1.50160 | | | 271,800,000 | | | Fixed | | | 200,000,000 | |
Dec. 17 | | 1.48580 | | | 274,800,000 | | | Fixed | | | 200,000,000 | |
Dec. 18 | | 1.52620 | | | 275,720,000 | | | Fixed | | | 200,000,000 | |
2026 — Feb. 4 | | 1.15570 | | | 140,450,000 | | | Fixed | | | 100,000,000 | |
Mar. 3 | | 1.18280 | | | 202,290,000 | | | Fixed | | | 150,000,000 | |
Apr. 18 | | 1.28570 | | | 128,420,000 | | | Fixed | | | 100,000,000 | |
Apr. 18 | | 1.30940 | | | 128,400,000 | | | Fixed | | | 100,000,000 | |
Apr. 19 | | 1.28480 | | | 160,662,500 | | | Fixed | | | 125,000,000 | |
Apr. 21 | | 1.31760 | | | 127,180,000 | | | Fixed | | | 100,000,000 | |
Apr. 22 | | 1.31360 | | | 633,750,000 | | | Fixed | | | 500,000,000 | |
Jul. 18 | | 1.03600 | | | 258,440,000 | | | Fixed | | | 200,000,000 | |
Jul. 18 | | 1.03940 | | | 129,310,000 | | | Fixed | | | 100,000,000 | |
Jul. 21 | | 1.08950 | | | 195,555,000 | | | Fixed | | | 150,000,000 | |
Aug. 5 | | 1.07810 | | | 262,000,000 | | | Fixed | | | 200,000,000 | |
Aug. 11 | | 1.00290 | | | 262,340,000 | | | Fixed | | | 200,000,000 | |
Aug. 12 | | 0.99620 | | | 260,960,000 | | | Fixed | | | 200,000,000 | |
Aug. 22 | | 1.04870 | | | 255,320,000 | | | Fixed | | | 200,000,000 | |
Sep. 1 | | 1.02180 | | | 130,620,000 | | | Fixed | | | 100,000,000 | |
Sep. 1 | | 1.02170 | | | 156,960,000 | | | Fixed | | | 120,000,000 | |
Sep. 7 | | 1.06050 | | | 162,687,500 | | | Fixed | | | 125,000,000 | |
Sep. 19 | | 1.21390 | | | 198,045,000 | | | Fixed | | | 150,000,000 | |
Sep. 21 | | 1.19880 | | | 131,690,000 | | | Fixed | | | 100,000,000 | |
Sep. 30 | | 0.97050 | | | 132,190,000 | | | Fixed | | | 100,000,000 | |
Sep. 30 | | 0.96630 | | | 66,290,000 | | | Fixed | | | 50,000,000 | |
Sep. 30 | | 0.95990 | | | 132,470,000 | | | Fixed | | | 100,000,000 | |
Oct. 3 | | 0.97690 | | | 196,485,000 | | | Fixed | | | 150,000,000 | |
Oct. 4 | | 0.99950 | | | 131,250,000 | | | Fixed | | | 100,000,000 | |
Oct. 5 | | 0.99060 | | | 164,000,000 | | | Fixed | | | 125,000,000 | |
Oct. 17 | | 1.18900 | | | 131,930,000 | | | Fixed | | | 100,000,000 | |
Oct. 24 | | 1.17710 | | | 230,982,500 | | | Fixed | | | 175,000,000 | |
Oct. 25 | | 1.13570 | | | 99,922,500 | | | Fixed | | | 75,000,000 | |
Oct. 26 | | 1.13800 | | | 133,480,000 | | | Fixed | | | 100,000,000 | |
Oct. 26 | | 1.15210 | | | 133,870,000 | | | Fixed | | | 100,000,000 | |
Oct. 28 | | 1.16070 | | | 133,660,000 | | | Fixed | | | 100,000,000 | |
Nov. 1 | | 1.23170 | | | 334,900,000 | | | Fixed | | | 250,000,000 | |
Nov. 2 | | 1.21510 | | | 200,955,000 | | | Fixed | | | 150,000,000 | |
Nov. 3 | | 1.24200 | | | 267,740,000 | | | Fixed | | | 200,000,000 | |
Nov. 8 | | 1.18440 | | | 147,664,000 | | | Fixed | | | 110,000,000 | |
Nov. 8 | | 1.17350 | | | 100,822,500 | | | Fixed | | | 75,000,000 | |
Nov. 21 | | 1.52660 | | | 201,195,000 | | | Fixed | | | 150,000,000 | |
Nov. 25 | | 1.55800 | | | 200,925,000 | | | Fixed | | | 150,000,000 | |
2027 — Jan. 6 | | 1.74140 | | | 133,350,000 | | | Fixed | | | 100,000,000 | |
Jan. 9 | | 1.69530 | | | 265,720,000 | | | Fixed | | | 200,000,000 | |
Apr. 7 | | 1.60600 | | | 133,800,000 | | | Fixed | | | 100,000,000 | |
Apr. 7 | | 1.60600 | | | 133,960,000 | | | Fixed | | | 100,000,000 | |
Apr. 7 | | 1.59640 | | | 268,000,000 | | | Fixed | | | 200,000,000 | |
Apr. 7 | | 1.59330 | | | 134,130,000 | | | Fixed | | | 100,000,000 | |
Apr. 11 | | 1.55040 | | | 133,720,000 | | | Fixed | | | 100,000,000 | |
Apr. 21 | | 1.48350 | | | 67,350,000 | | | Fixed | | | 50,000,000 | |
Apr. 24 | | 1.50090 | | | 134,670,000 | | | Fixed | | | 100,000,000 | |
Apr. 28 | | 1.52590 | | | 339,500,000 | | | Fixed | | | 250,000,000 | |
Apr. 28 | | 1.51570 | | | 204,000,000 | | | Fixed | | | 150,000,000 | |
May 9 | | 1.5340 | | | 137,500,000 | | | Fixed | | | 100,000,000 | |
May 9 | | 1.53290 | | | 274,200,000 | | | Fixed | | | 200,000,000 | |
Jun. 5 | | 1.43600 | | | 134,990,000 | | | Fixed | | | 100,000,000 | |
Jun. 5 | | 1.43380 | | | 134,900,000 | | | Fixed | | | 100,000,000 | |
Jun. 26 | | 1.49080 | | | 132,600,000 | | | Fixed | | | 100,000,000 | |
Jun. 26 | | 1.49860 | | | 99,165,000 | | | Fixed | | | 75,000,000 | |
2028 — Feb. 26 | | 2.3080 | | | 63,570,000 | | | Fixed | | | 50,000,000 | |
Feb. 27 | | 2.2790 | | | 126,670,000 | | | Fixed | | | 100,000,000 | |
Feb. 28 | | 2.2200 | | | 126,880,000 | | | Fixed | | | 100,000,000 | |
Mar. 6 | | 2.1774 | | | 128,900,000 | | | Fixed | | | 100,000,000 | |
Mar. 6 | | 2.1799 | | | 128,890,000 | | | Fixed | | | 100,000,000 | |
Mar. 12 | | 2.2198 | | | 258,420,000 | | | Fixed | | | 200,000,000 | |
Mar. 13 | | 2.2420 | | | 257,280,000 | | | Fixed | | | 200,000,000 | |
Mar. 26 | | 2.1820 | | | 129,060,000 | | | Fixed | | | 100,000,000 | |
Apr. 9 | | 2.1858 | | | 191,700,000 | | | Fixed | | | 150,000,000 | |
Apr. 10 | | 2.1570 | | | 191,250,000 | | | Fixed | | | 150,000,000 | |
Apr. 18 | | 2.2807 | | | 188,775,000 | | | Fixed | | | 150,000,000 | |
Apr. 23 | | 2.3155 | | | 126,100,000 | | | Fixed | | | 100,000,000 | |
Apr. 27 | | 2.3482 | | | 128,800,000 | | | Fixed | | | 100,000,000 | |
Jun. 4 | | 2.2153 | | | 64,915,000 | | | Fixed | | | 50,000,000 | |
Jun. 7 | | 2.2416 | | | 130,020,000 | | | Fixed | | | 100,000,000 | |
Jun. 8 | | 2.3135 | | | 64,575,000 | | | Fixed | | | 50,000,000 | |
Jun. 12 | | 2.3047 | | | 64,900,000 | | | Fixed | | | 50,000,000 | |
Jun. 14 | | 2.2945 | | | 64,935,000 | | | Fixed | | | 50,000,000 | |
Jun. 22 | | 2.1720 | | | 66,575,000 | | | Fixed | | | 50,000,000 | |
Jun. 22 | | 2.1697 | | | 133,210,000 | | | Fixed | | | 100,000,000 | |
Jun. 25 | | 2.1213 | | | 133,060,000 | | | Fixed | | | 100,000,000 | |
Jun. 25 | | 2.1262 | | | 133,040,000 | | | Fixed | | | 100,000,000 | |
Jun. 26 | | 2.1200 | | | 66,650,000 | | | Fixed | | | 50,000,000 | |
Jun. 28 | | 2.1010 | | | 133,100,000 | | | Fixed | | | 100,000,000 | |
Jun. 28 | | 2.0955 | | | 66,500,000 | | | Fixed | | | 50,000,000 | |
Jul. 3 | | 2.1035 | | | 132,870,000 | | | Fixed | | | 100,000,000 | |
Jul. 9 | | 2.1297 | | | 65,660,000 | | | Fixed | | | 50,000,000 | |
Jul. 10 | | 2.1274 | | | 131,000,000 | | | Fixed | | | 100,000,000 | |
Jul. 16 | | 2.1629 | | | 197,475,000 | | | Fixed | | | 150,000,000 | |
Jul. 16 | | 2.1561 | | | 131,720,000 | | | Fixed | | | 100,000,000 | |
Jul. 16 | | 2.1549 | | | 98,752,500 | | | Fixed | | | 75,000,000 | |
Jul. 17 | | 2.1402 | | | 65,885,000 | | | Fixed | | | 50,000,000 | |
Jul. 17 | | 2.1310 | | | 65,835,000 | | | Fixed | | | 50,000,000 | |
Jul. 17 | | 2.1334 | | | 65,830,000 | | | Fixed | | | 50,000,000 | |
Jul. 18 | | 2.1618 | | | 131,300,000 | | | Fixed | | | 100,000,000 | |
Jul. 19 | | 2.1017 | | | 131,900,000 | | | Fixed | | | 100,000,000 | |
Jul. 20 | | 2.1210 | | | 132,260,000 | | | Fixed | | | 100,000,000 | |
Jul. 23 | | 2.1222 | | | 66,240,000 | | | Fixed | | | 50,000,000 | |
Jul. 24 | | 2.1723 | | | 65,645,000 | | | Fixed | | | 50,000,000 | |
Jul. 25 | | 2.2136 | | | 131,570,000 | | | Fixed | | | 100,000,000 | |
Jul. 26 | | 2.2344 | | | 131,660,000 | | | Fixed | | | 100,000,000 | |
Jul. 26 | | 2.2298 | | | 131,460,000 | | | Fixed | | | 100,000,000 | |
Jul. 27 | | 2.2229 | | | 65,630,000 | | | Fixed | | | 50,000,000 | |
Jul. 30 | | 2.2773 | | | 65,345,000 | | | Fixed | | | 50,000,000 | |
Sep. 25 | | 2.4299 | | | 129,200,000 | | | Fixed | | | 100,000,000 | |
Oct. 2 | | 2.42330 | | | 129,230,000 | | | Fixed | | | 100,000,000 | |
Oct. 3 | | 2.48300 | | | 128,200,000 | | | Fixed | | | 100,000,000 | |
Oct. 5 | | 2.48930 | | | 128,260,000 | | | Fixed | | | 100,000,000 | |
Oct. 16 | | 2.48760 | | | 260,400,000 | | | Fixed | | | 200,000,000 | |
Oct. 22 | | 2.51600 | | | 130,340,000 | | | Fixed | | | 100,000,000 | |
Oct. 22 | | 2.51630 | | | 130,350,000 | | | Fixed | | | 100,000,000 | |
Oct. 29 | | 2.44760 | | | 130,520,000 | | | Fixed | | | 100,000,000 | |
Oct. 29 | | 2.43550 | | | 130,920,000 | | | Fixed | | | 100,000,000 | |
Oct. 30 | | 2.40560 | | | 131,510,000 | | | Fixed | | | 100,000,000 | |
Oct. 30 | | 2.40100 | | | 131,460,000 | | | Fixed | | | 100,000,000 | |
Oct. 31 | | 2.39760 | | | 131,050,000 | | | Fixed | | | 100,000,000 | |
Nov. 1 | | 2.40860 | | | 65,660,000 | | | Fixed | | | 50,000,000 | |
Nov. 19 | | 2.37805 | | | 132,310,000 | | | Fixed | | | 100,000,000 | |
Dec. 3 | | 2.30050 | | | 132,650,000 | | | Fixed | | | 100,000,000 | |
Dec. 3 | | 2.30070 | | | 132,700,000 | | | Fixed | | | 100,000,000 | |
Dec. 4 | | 2.27470 | | | 133,040,000 | | | Fixed | | | 100,000,000 | |
Dec. 4 | | 2.26650 | | | 133,170,000 | | | Fixed | | | 100,000,000 | |
Dec. 4 | | 2.26180 | | | 133,040,000 | | | Fixed | | | 100,000,000 | |
Dec. 10 | | 2.05280 | | | 134,220,000 | | | Fixed | | | 100,000,000 | |
Dec. 10 | | 2.03550 | | | 268,400,000 | | | Fixed | | | 200,000,000 | |
Dec. 11 | | 2.10190 | | | 132,960,000 | | | Fixed | | | 100,000,000 | |
Dec. 11 | | 2.10530 | | | 132,750,000 | | | Fixed | | | 100,000,000 | |
Dec. 12 | | 2.05570 | | | 133,550,000 | | | Fixed | | | 100,000,000 | |
Dec. 18 | | 2.11600 | | | 133,880,000 | | | Fixed | | | 100,000,000 | |
Dec. 18 | | 2.11250 | | | 133,850,000 | | | Fixed | | | 100,000,000 | |
2029 — Jan. 8 | | 1.89320 | | | 134,320,000 | | | Fixed | | | 100,000,000 | |
Jan. 16 | | 1.93840 | | | 132,680,000 | | | Fixed | | | 100,000,000 | |
Jan. 22 | | 1.98840 | | | 132,950,000 | | | Fixed | | | 100,000,000 | |
Jan. 25 | | 1.96490 | | | 133,650,000 | | | Fixed | | | 100,000,000 | |
Feb. 7 | | 1.93640 | | | 131,400,000 | | | Fixed | | | 100,000,000 | |
Mar. 13 | | 1.76100 | | | 134,190,000 | | | Fixed | | | 100,000,000 | |
Apr. 5 | | 1.70510 | | | 133,310,000 | | | Fixed | | | 100,000,000 | |
Apr. 8 | | 1.69880 | | | 133,610,000 | | | Fixed | | | 100,000,000 | |
Apr. 10 | | 1.72730 | | | 133,230,000 | | | Fixed | | | 100,000,000 | |
Apr. 17 | | 1.79980 | | | 133,150,000 | | | Fixed | | | 100,000,000 | |
Apr. 17 | | 1.75810 | | | 133,780,000 | | | Fixed | | | 100,000,000 | |
Apr. 18 | | 1.78000 | | | 133,720,000 | | | Fixed | | | 100,000,000 | |
Apr. 18 | | 1.78280 | | | 133,490,000 | | | Fixed | | | 100,000,000 | |
Apr. 18 | | 1.77920 | | | 133,560,000 | | | Fixed | | | 100,000,000 | |
Apr. 24 | | 1.76000 | | | 133,860,000 | | | Fixed | | | 100,000,000 | |
Apr. 29 | | 1.67900 | | | 135,030,000 | | | Fixed | | | 100,000,000 | |
Apr. 29 | | 1.69380 | | | 135,030,000 | | | Fixed | | | 100,000,000 | |
Apr. 30 | | 1.69280 | | | 134,920,000 | | | Fixed | | | 100,000,000 | |
May 6 | | 1.71920 | | | 134,680,000 | | | Fixed | | | 100,000,000 | |
May 8 | | 1.72130 | | | 134,560,000 | | | Fixed | | | 100,000,000 | |
May 8 | | 1.71700 | | | 134,470,000 | | | Fixed | | | 100,000,000 | |
May 16 | | 1.68930 | | | 134,580,000 | | | Fixed | | | 100,000,000 | |
May 17 | | 1.63650 | | | 134,800,000 | | | Fixed | | | 100,000,000 | |
May 22 | | 1.64400 | | | 134,910,000 | | | Fixed | | | 100,000,000 | |
May 22 | | 1.67090 | | | 134,740,000 | | | Fixed | | | 100,000,000 | |
May 23 | | 1.73500 | | | 134,240,000 | | | Fixed | | | 100,000,000 | |
May 23 | | 1.74300 | | | 134,120,000 | | | Fixed | | | 100,000,000 | |
May 28 | | 1.67270 | | | 134,880,000 | | | Fixed | | | 100,000,000 | |
May 28 | | 1.64800 | | | 134,860,000 | | | Fixed | | | 100,000,000 | |
Jul. 15 | | 1.59960 | | | 130,250,000 | | | Fixed | | | 100,000,000 | |
Jul. 26 | | 1.45170 | | | 131,270,000 | | | Fixed | | | 100,000,000 | |
| | | | | | | | | | | | |
| | | | | $ 49,938,704,000 | | | | | | USD 42,635,438,919 | |
| | | | | | | | | | | | |
39
Unmatured Market Debt (Continued)
For the cross currency swaps listed below (outstanding as of September 30, 2019), the Government’s Canadian dollar liability has been swapped into a euro liability.
| | | | | | | | | | | | |
| | | Canadian dollar liability | | | Euro liability | |
Maturity date | | Coupon % | | Notional amount | | | Basis | | Notional amount | |
2020 — Jul. 20 | | 3.1415 | | $ | 66,750,000 | | | Fixed | | | EUR 50,000,000 | |
Oct. 9 | | 0.82070 | | | 131,355,000 | | | Fixed | | | 90,000,000 | |
Oct. 27 | | 0.85380 | | | 131,130,000 | | | Fixed | | | 90,000,000 | |
Nov. 13 | | 1.03480 | | | 135,004,500 | | | Fixed | | | 95,000,000 | |
Nov. 17 | | 0.96830 | | | 200,340,000 | | | Fixed | | | 140,000,000 | |
Nov. 23 | | 0.96350 | | | 133,997,000 | | | Fixed | | | 94,000,000 | |
Dec. 15 | | 0.79040 | | | 278,642,930 | | | Fixed | | | 185,000,000 | |
2021 — Jan. 8 | | 0.72690 | | | 196,625,000 | | | Fixed | | | 130,000,000 | |
Jan. 15 | | 0.61670 | | | 308,600,000 | | | Fixed | | | 200,000,000 | |
Jan. 20 | | 0.54390 | | | 158,300,000 | | | Fixed | | | 100,000,000 | |
Feb. 20 | | 2.31660 | | | 146,970,000 | | | Fixed | | | 100,000,000 | |
Apr. 18 | | 0.75580 | | | 216,975,000 | | | Fixed | | | 150,000,000 | |
Apr. 26 | | 0.88020 | | | 199,262,000 | | | Fixed | | | 140,000,000 | |
May 10 | | 0.71785 | | | 199,165,500 | | | Fixed | | | 135,000,000 | |
May 16 | | 0.73240 | | | 189,813,000 | | | Fixed | | | 130,000,000 | |
May 19 | | 0.70040 | | | 329,310,000 | | | Fixed | | | 225,000,000 | |
May 20 | | 3.1250 | | | 144,092,256 | | | Fixed | | | 100,000,000 | |
May 20 | | 3.1335 | | | 71,190,000 | | | Fixed | | | 50,000,000 | |
Jun. 20 | | 3.1880 | | | 137,710,900 | | | Fixed | | | 100,000,000 | |
Sep. 20 | | 2.3200 | | | 71,095,000 | | | Fixed | | | 50,000,000 | |
Sep. 20 | | 2.4000 | | | 71,110,000 | | | Fixed | | | 50,000,000 | |
Sep. 20 | | 2.4000 | | | 72,100,000 | | | Fixed | | | 50,000,000 | |
Sep. 20 | | 2.4580 | | | 106,212,673 | | | Fixed | | | 75,000,000 | |
Sep. 30 | | 0.9691 | | | 134,010,000 | | | Fixed | | | 90,000,000 | |
40
Unmatured Market Debt (Continued)
| | | | | | | | | | | | |
| | | Canadian dollar liability | | | Euro liability | |
Maturity date | | Coupon % | | Notional amount | | | Basis | | Notional amount | |
Oct. 15 | | 2.0739 | | | $ 69,275,000 | | | Fixed | | | EUR 50,000,000 | |
Oct. 15 | | 2.2247 | | | 69,430,000 | | | Fixed | | | 50,000,000 | |
Oct. 15 | | 2.21410 | | | 104,550,000 | | | Fixed | | | 75,000,000 | |
Oct. 15 | | 2.22390 | | | 34,787,500 | | | Fixed | | | 25,000,000 | |
Oct. 20 | | 2.1210 | | | 67,920,000 | | | Fixed | | | 50,000,000 | |
Oct. 20 | | 2.1350 | | | 68,000,000 | | | Fixed | | | 50,000,000 | |
Oct. 20 | | 2.1880 | | | 67,750,000 | | | Fixed | | | 50,000,000 | |
Oct. 20 | | 2.2051 | | | 67,500,000 | | | Fixed | | | 50,000,000 | |
Oct. 20 | | 2.2399 | | | 138,800,000 | | | Fixed | | | 100,000,000 | |
Oct. 20 | | 2.2448 | | | 68,925,375 | | | Fixed | | | 50,000,000 | |
Oct. 20 | | 2.2580 | | | 101,775,000 | | | Fixed | | | 75,000,000 | |
Oct. 20 | | 2.2805 | | | 68,470,000 | | | Fixed | | | 50,000,000 | |
Oct. 20 | | 2.3960 | | | 70,880,760 | | | Fixed | | | 50,000,000 | |
Oct. 20 | | 2.4163 | | | 70,220,000 | | | Fixed | | | 50,000,000 | |
Nov. 20 | | 2.14000 | | | 69,775,000 | | | Fixed | | | 50,000,000 | |
Nov. 20 | | 2.24090 | | | 70,400,000 | | | Fixed | | | 50,000,000 | |
Nov. 20 | | 2.27080 | | | 69,618,275 | | | Fixed | | | 50,000,000 | |
Nov. 20 | | 2.28610 | | | 69,800,000 | | | Fixed | | | 50,000,000 | |
Nov. 20 | | 2.29830 | | | 105,075,000 | | | Fixed | | | 75,000,000 | |
Nov. 20 | | 2.32660 | | | 69,865,000 | | | Fixed | | | 50,000,000 | |
Nov. 20 | | 2.33160 | | | 104,700,000 | | | Fixed | | | 75,000,000 | |
Nov. 20 | | 2.36460 | | | 70,050,000 | | | Fixed | | | 50,000,000 | |
Nov. 20 | | 2.39230 | | | 105,375,000 | | | Fixed | | | 75,000,000 | |
Nov. 20 | | 2.40280 | | | 140,800,000 | | | Fixed | | | 100,000,000 | |
Dec. 20 | | 2.20560 | | | 139,270,000 | | | Fixed | | | 100,000,000 | |
Dec. 20 | | 2.20800 | | | 140,000,000 | | | Fixed | | | 100,000,000 | |
Dec. 20 | | 2.21440 | | | 139,800,000 | | | Fixed | | | 100,000,000 | |
Dec. 20 | | 2.43430 | | | 140,990,000 | | | Fixed | | | 100,000,000 | |
2022 — Jan. 20 | | 2.02240 | | | 67,825,000 | | | Fixed | | | 50,000,000 | |
Feb. 20 | | 2.48200 | | | 147,510,000 | | | Fixed | | | 100,000,000 | |
Aug. 21 | | 1.0148 | | | 129,915,000 | | | Fixed | | | 90,000,000 | |
Sep. 16 | | 1.0469 | | | 134,595,000 | | | Fixed | | | 90,000,000 | |
2023 — Jun. 18 | | 1.4465 | | | 138,600,000 | | | Fixed | | | 100,000,000 | |
Sep. 20 | | 2.69480 | | | 137,000,000 | | | Fixed | | | 100,000,000 | |
Oct. 20 | | 2.69570 | | | 138,800,000 | | | Fixed | | | 100,000,000 | |
Oct. 20 | | 2.81850 | | | 68,750,000 | | | Fixed | | | 50,000,000 | |
2024 — May 20 | | 2.37900 | | | 114,270,000 | | | Fixed | | | 75,000,000 | |
May 20 | | 2.38450 | | | 151,950,000 | | | Fixed | | | 100,000,000 | |
Jul. 20 | | 2.29210 | | | 147,100,000 | | | Fixed | | | 100,000,000 | |
Jul. 20 | | 2.29750 | | | 110,602,500 | | | Fixed | | | 75,000,000 | |
Aug. 20 | | 2.25000 | | | 109,312,500 | | | Fixed | | | 75,000,000 | |
Aug. 28 | | 1.2983 | | | 136,170,000 | | | Fixed | | | 90,000,000 | |
Sep. 1 | | 1.2937 | | | 134,550,000 | | | Fixed | | | 90,000,000 | |
Sep. 4 | | 1.3479 | | | 134,586,000 | | | Fixed | | | 90,000,000 | |
Oct. 20 | | 2.12130 | | | 105,652,500 | | | Fixed | | | 75,000,000 | |
Oct. 20 | | 2.18500 | | | 42,672,000 | | | Fixed | | | 30,000,000 | |
Oct. 20 | | 2.19030 | | | 85,056,000 | | | Fixed | | | 60,000,000 | |
Oct. 20 | | 2.20090 | | | 99,449,000 | | | Fixed | | | 70,000,000 | |
Oct. 20 | | 2.21480 | | | 128,925,000 | | | Fixed | | | 90,000,000 | |
Nov. 28 | | 1.99800 | | | 139,900,000 | | | Fixed | | | 100,000,000 | |
Dec. 10 | | 1.94890 | | | 140,550,000 | | | Fixed | | | 100,000,000 | |
Dec. 15 | | 2.03960 | | | 105,825,000 | | | Fixed | | | 75,000,000 | |
2025 — Feb. 9 | | 1.2820 | | | 142,380,000 | | | Fixed | | | 100,000,000 | |
Sep. 3 | | 1.4661 | | | 133,425,000 | | | Fixed | | | 90,000,000 | |
2026 — Feb. 8 | | 1.17530 | | | 153,574,400 | | | Fixed | | | 100,000,000 | |
Apr. 8 | | 1.6290 | | | 149,880,096 | | | Fixed | | | 100,000,000 | |
Aug. 15 | | 1.70460 | | | 244,125,000 | | | Fixed | | | 175,000,000 | |
2027 — Jan. 13 | | 1.69020 | | | 138,700,000 | | | Fixed | | | 100,000,000 | |
Jan. 17 | | 1.72790 | | | 139,550,000 | | | Fixed | | | 100,000,000 | |
Jan. 17 | | 1.72220 | | | 139,530,000 | | | Fixed | | | 100,000,000 | |
Jan. 23 | | 1.74670 | | | 141,050,000 | | | Fixed | | | 100,000,000 | |
Jan. 23 | | 1.76540 | | | 141,250,000 | | | Fixed | | | 100,000,000 | |
Jan. 25 | | 1.71050 | | | 143,000,000 | | | Fixed | | | 100,000,000 | |
Jan. 27 | | 1.80010 | | | 140,720,000 | | | Fixed | | | 100,000,000 | |
Feb. 6 | | 1.74160 | | | 140,560,000 | | | Fixed | | | 100,000,000 | |
Apr. 28 | | 1.52260 | | | 295,440,000 | | | Fixed | | | 200,000,000 | |
Jul. 18 | | 1.87360 | | | 145,300,000 | | | Fixed | | | 100,000,000 | |
2028 — Jan. 15 | | 2.1719 | | | 150,950,000 | | | Fixed | | | 100,000,000 | |
Jan. 23 | | 2.2310 | | | 76,155,000 | | | Fixed | | | 50,000,000 | |
Jan. 24 | | 2.2238 | | | 152,510,000 | | | Fixed | | | 100,000,000 | |
Feb. 1 | | 2.2880 | | | 153,130,000 | | | Fixed | | | 100,000,000 | |
Feb. 2 | | 2.2815 | | | 76,505,000 | | | Fixed | | | 50,000,000 | |
Feb. 7 | | 2.3681 | | | 309,800,000 | | | Fixed | | | 200,000,000 | |
Feb. 13 | | 2.3452 | | | 154,400,000 | | | Fixed | | | 100,000,000 | |
Feb. 14 | | 2.3418 | | | 154,270,000 | | | Fixed | | | 100,000,000 | |
2019 — Feb. 20 | | 1.93070 | | | 149,710,000 | | | Fixed | | | 100,000,000 | |
May 16 | | 1.67350 | | | 150,990,000 | | | Fixed | | | 100,000,000 | |
Jun. 17 | | 1.47780 | | | 150,300,000 | | | Fixed | | | 100,000,000 | |
Jun. 27 | | 1.45330 | | | 299,820,000 | | | Fixed | | | 200,000,000 | |
Jul. 5 | | 1.45600 | | | 44,373,000 | | | Fixed | | | 30,000,000 | |
Jul. 15 | | 1.57600 | | | 147,190,000 | | | Fixed | | | 100,000,000 | |
Jul. 16 | | 1.61500 | | | 146,730,000 | | | Fixed | | | 100,000,000 | |
Aug. 23 | | 1.19040 | | | 147,360,000 | | | Fixed | | | 100,000,000 | |
Aug. 28 | | 1.21000 | | | 148,160,000 | | | Fixed | | | 100,000,000 | |
Aug. 30 | | 1.11080 | | | 147,590,000 | | | Fixed | | | 100,000,000 | |
Aug. 30 | | 1.12240 | | | 147,300,000 | | | Fixed | | | 100,000,000 | |
Sep. 23 | | 1.40310 | | | 293,740,000 | | | Fixed | | | 200,000,000 | |
| | | | | | | | | | | | |
| | | | | $14,772,595,665 | | | | | | EUR 10,189,000,000 | |
| | | | | | | | | | | | |
41
Unmatured Market Debt (Continued)
For the cross currency swaps listed below (outstanding as of September 30, 2019), the Government’s Canadian dollar liability has been swapped into a yen liability.
| | | | | | | | | | | | |
| | | Canadian dollar liability | | | Yen liability | |
Maturity date | | Coupon % | | Notional amount | | | Basis | | Notional amount | |
2022 — Mar. 9 | | 1.15570 | | | $ 58,844,298 | | | Fixed | | | JPY 5,000,000,000 | |
Mar. 21 | | 1.28990 | | | 70,320,000 | | | Fixed | | | 6,000,000,000 | |
Mar. 21 | | 1.30530 | | | 70,440,000 | | | Fixed | | | 6,000,000,000 | |
Mar. 21 | | 1.26930 | | | 70,380,000 | | | Fixed | | | 6,000,000,000 | |
Mar. 22 | | 1.23920 | | | 70,440,000 | | | Fixed | | | 6,000,000,000 | |
Mar. 23 | | 1.22920 | | | 70,680,000 | | | Fixed | | | 6,000,000,000 | |
Mar. 24 | | 1.20030 | | | 71,160,000 | | | Fixed | | | 6,000,000,000 | |
Mar. 27 | | 1.14480 | | | 72,420,000 | | | Fixed | | | 6,000,000,000 | |
2023 — Sep. 10 | | 2.15160 | | | 59,311,981 | | | Fixed | | | 5,000,000,000 | |
Oct. 18 | | 2.39750 | | | 115,473,441 | | | Fixed | | | 10,000,000,000 | |
Oct. 19 | | 2.38740 | | | 115,685,844 | | | Fixed | | | 10,000,000,000 | |
Oct. 19 | | 2.38300 | | | 231,722,860 | | | Fixed | | | 20,000,000,000 | |
Oct. 22 | | 2.42600 | | | 115,828,685 | | | Fixed | | | 10,000,000,000 | |
Oct. 31 | | 2.35370 | | | 116,672,500 | | | Fixed | | | 10,000,000,000 | |
Nov. 1 | | 2.34760 | | | 139,809,626 | | | Fixed | | | 12,000,000,000 | |
Nov. 7 | | 2.43020 | | | 196,875,470 | | | Fixed | | | 17,000,000,000 | |
Nov. 9 | | 2.44630 | | | 115,377,515 | | | Fixed | | | 10,000,000,000 | |
Nov. 13 | | 2.44080 | | | 115,227,286 | | | Fixed | | | 10,000,000,000 | |
Nov. 14 | | 2.43410 | | | 115,944,718 | | | Fixed | | | 10,000,000,000 | |
Nov. 15 | | 2.39570 | | | 116,292,592 | | | Fixed | | | 10,000,000,000 | |
Nov. 16 | | 2.38700 | | | 116,191,251 | | | Fixed | | | 10,000,000,000 | |
Nov. 19 | | 2.31140 | | | 116,890,707 | | | Fixed | | | 10,000,000,000 | |
Nov. 19 | | 2.31300 | | | 116,814,242 | | | Fixed | | | 10,000,000,000 | |
Dec. 10 | | 1.98690 | | | 119,260,584 | | | Fixed | | | 10,000,000,000 | |
Dec. 10 | | 1.97030 | | | 119,431,506 | | | Fixed | | | 10,000,000,000 | |
2024 — Jan. 24 | | 1.91490 | | | 121,943,784 | | | Fixed | | | 10,000,000,000 | |
Jan. 25 | | 1.90120 | | | 121,614,555 | | | Fixed | | | 10,000,000,000 | |
Jan. 31 | | 1.88340 | | | 60,580,360 | | | Fixed | | | 5,000,000,000 | |
Jul. 18 | | 1.53040 | | | 121,921,483 | | | Fixed | | | 10,000,000,000 | |
Jul. 26 | | 1.36560 | | | 121,472,735 | | | Fixed | | | 10,000,000,000 | |
Aug. 1 | | 1.41820 | | | 121,315,055 | | | Fixed | | | 10,000,000,000 | |
| | | | | | | | | | | | |
| | | | | $ 3,366,343,079 | | | | | | JPY 286,000,000,000 | |
| | | | | | | | | | | | |
42
Unmatured Market Debt (Continued)
For the cross currency swaps listed below (outstanding as of September 30, 2019), the Government’s Canadian dollar liability has been swapped into a pound sterling liability.
| | | | | | | | | | | | |
| | | Canadian dollar liability | | | Pound sterling liability | |
Maturity date | | Coupon % | | Notional amount | | | Basis | | Notional amount | |
2019 — Oct. 20 | | 1.58240 | | | $ 132,382,500 | | | Fixed | | | GBP 75,000,000 | |
Oct. 20 | | 1.64920 | | | 150,875,000 | | | Fixed | | | 85,000,000 | |
Oct. 20 | | 1.65240 | | | 98,781,250 | | | Fixed | | | 54,500,000 | |
Oct. 20 | | 1.67110 | | | 159,660,000 | | | Fixed | | | 90,000,000 | |
Oct. 20 | | 1.67800 | | | 152,209,500 | | | Fixed | | | 85,000,000 | |
Oct. 20 | | 1.75660 | | | 152,796,000 | | | Fixed | | | 85,000,000 | |
Dec. 4 | | 1.42900 | | | 142,496,000 | | | Fixed | | | 80,000,000 | |
Dec. 12 | | 1.43100 | | | 144,400,000 | | | Fixed | | | 80,000,000 | |
2020 — Jan. 20 | | 1.1042 | | | 154,045,500 | | | Fixed | | | 85,000,000 | |
Jan. 28 | | 0.8453 | | | 168,444,000 | | | Fixed | | | 90,000,000 | |
Jan. 29 | | 0.7295 | | | 160,140,000 | | | Fixed | | | 85,000,000 | |
Feb. 3 | | 0.6887 | | | 134,309,000 | | | Fixed | | | 70,000,000 | |
2023 — Sep. 8 | | 1.2519 | | | 167,535,000 | | | Fixed | | | 85,000,000 | |
2024 — Sep. 8 | | 1.3753 | | | 133,510,000 | | | Fixed | | | 65,000,000 | |
Sep. 8 | | 1.4063 | | | 132,223,000 | | | Fixed | | | 65,000,000 | |
2025 — Sep. 8 | | 1.4788 | | | 131,690,000 | | | Fixed | | | 65,000,000 | |
Sep. 8 | | 1.4817 | | | 132,795,000 | | | Fixed | | | 65,000,000 | |
Sep. 8 | | 1.4982 | | | 132,632,500 | | | Fixed | | | 65,000,000 | |
Sep. 8 | | 1.5052 | | | 133,009,500 | | | Fixed | | | 65,000,000 | |
Sep. 8 | | 1.5578 | | | 131,787,500 | | | Fixed | | | 65,000,000 | |
Sep. 8 | | 1.5955 | | | 123,825,000 | | | Fixed | | | 65,000,000 | |
Sep. 8 | | 1.6630 | | | 153,120,000 | | | Fixed | | | 80,000,000 | |
Sep. 8 | | 1.7711 | | | 104,208,500 | | | Fixed | | | 55,000,000 | |
Sep. 8 | | 1.7750 | | | 142,905,000 | | | Fixed | | | 75,000,000 | |
Sep. 8 | | 1.7984 | | | 165,180,500 | | | Fixed | | | 85,000,000 | |
Sep. 8 | | 1.8166 | | | 98,587,800 | | | Fixed | | | 54,000,000 | |
Sep. 8 | | 1.8258 | | | 164,900,000 | | | Fixed | | | 85,000,000 | |
Sep. 8 | | 1.45800 | | | 198,950,000 | | | Fixed | | | 100,000,000 | |
Sep. 8 | | 1.46210 | | | 202,120,000 | | | Fixed | | | 100,000,000 | |
Sep. 8 | | 1.45290 | | | 131,365,000 | | | Fixed | | | 65,000,000 | |
Sep. 8 | | 1.68360 | | | 131,625,000 | | | Fixed | | | 65,000,000 | |
Sep. 8 | | 1.66710 | | | 131,950,000 | | | Fixed | | | 65,000,000 | |
Sep. 8 | | 1.61080 | | | 140,777,000 | | | Fixed | | | 70,000,000 | |
Sep. 8 | | 1.58350 | | | 200,970,000 | | | Fixed | | | 100,000,000 | |
Sep. 8 | | 1.57250 | | | 203,300,000 | | | Fixed | | | 100,000,000 | |
Sep. 8 | | 1.45380 | | | 207,800,000 | | | Fixed | | | 100,000,000 | |
Sep. 8 | | 1.32500 | | | 133,835,000 | | | Fixed | | | 65,000,000 | |
Sep. 8 | | 1.33340 | | | 288,174,000 | | | Fixed | | | 140,000,000 | |
Sep. 8 | | 1.31470 | | | 204,800,000 | | | Fixed | | | 100,000,000 | |
Sep. 8 | | 1.18950 | | | 101,650,000 | | | Fixed | | | 50,000,000 | |
Sep. 8 | | 1.25740 | | | 141,225,000 | | | Fixed | | | 70,000,000 | |
Sep. 8 | | 1.25510 | | | 282,940,000 | | | Fixed | | | 140,000,000 | |
Sep. 8 | | 1.17710 | | | 99,760,000 | | | Fixed | | | 50,000,000 | |
Sep. 8 | | 1.22870 | | | 281,848,000 | | | Fixed | | | 140,000,000 | |
Sep. 8 | | 1.13580 | | | 101,385,000 | | | Fixed | | | 50,000,000 | |
2026 — Mar. 7 | | 1.26820 | | | 142,327,500 | | | Fixed | | | 75,000,000 | |
Mar. 22 | | 1.31940 | | | 131,383,000 | | | Fixed | | | 70,000,000 | |
Mar. 24 | | 1.29830 | | | 93,100,000 | | | Fixed | | | 50,000,000 | |
May 19 | | 1.37420 | | | 264,510,000 | | | Fixed | | | 150,000,000 | |
Dec. 2 | | 1.58030 | | | 200,280,000 | | | Fixed | | | 120,000,000 | |
2027 — Jan. 12 | | 1.67990 | | | 160,640,000 | | | Fixed | | | 100,000,000 | |
Jan. 24 | | 1.74510 | | | 164,350,000 | | | Fixed | | | 100,000,000 | |
Feb. 1 | | 1.79150 | | | 164,200,000 | | | Fixed | | | 100,000,000 | |
Feb. 3 | | 1.80000 | | | 165,500,000 | | | Fixed | | | 100,000,000 | |
Feb. 6 | | 1.73900 | | | 163,300,000 | | | Fixed | | | 100,000,000 | |
Feb. 13 | | 1.64020 | | | 247,050,000 | | | Fixed | | | 150,000,000 | |
Feb. 21 | | 1.77800 | | | 81,550,000 | | | Fixed | | | 50,000,000 | |
Feb. 22 | | 1.71720 | | | 162,680,000 | | | Fixed | | | 100,000,000 | |
Mar. 6 | | 1.70010 | | | 164,070,000 | | | Fixed | | | 100,000,000 | |
Mar. 6 | | 1.70730 | | | 164,080,000 | | | Fixed | | | 100,000,000 | |
Mar. 15 | | 1.83300 | | | 327,000,000 | | | Fixed | | | 200,000,000 | |
Mar. 16 | | 1.85790 | | | 343,665,000 | | | Fixed | | | 210,000,000 | |
| | | | | | | | | | | | |
| | | | | $ 10,122,607,550 | | | | | | GBP 5,448,500,000 | |
| | | | | | | | | | | | |
43
Unmatured Market Debt (Continued)
(D) FOREIGN EXCHANGE SWAPS(6)
For the foreign exchange swaps listed below (outstanding as of September 30, 2019), the Government swapped Canadian dollars for U.S. dollars.
| | | | | | | | |
| | | Canadian dollar | | | U.S. dollar | |
Maturity date | | Notional amount | | | Notional amount | |
2019 — Oct. 4 | | $ | 112,644,092 | | | | USD 86,302,102 | |
2020 — Jan. 7 | | | 20,231,178 | | | | 15,284,156 | |
| | | | | | | | |
| | $ | 132,875,270 | | | | USD 101,586,258 | |
| | | | | | | | |
(E) FOREIGN EXCHANGE FORWARDS
The Government entered into transactions to purchase (outstanding as of September 30, 2019): USD 1,086,336,709 in exchange for EUR 972,626,000; USD 262,883,764 in exchange for GBP 216,165,000; USD 282,804,684 in exchange for JPY 29,930,200,000; and USD 361,043,978 in exchange for CNH 2,558,900,000.
Notes:
| (1) | Non-callable except as otherwise noted. |
| (2) | Real Return Bonds bear interest adjusted in relation to the CPI for Canada. At maturity, a final payment equal to the sum of inflation compensation from the original issue date to maturity and principal will be made. All amounts shown for these issues include the inflation compensation accrued to date. |
| (3) | Canada Savings Bonds offer minimum guaranteed annual interest rates and are non-callable. They can only be assigned or transferred under certain conditions. Canada Savings Bonds are redeemable on demand at any time with accrued interest. |
| (4) | For these series of Canada Savings Bonds and Canada Premium Bonds the original maturity date was extended by 10 years, at the option of the holder. |
| (5) | Canada Premium Bonds are non-callable. They can only be assigned or transferred under certain conditions. Issues are available in compound interest or regular interest form. |
| (6) | Converted at USD 1.00 = CAD 1.3244, EUR 1.00 = CAD 1.4437 the closing rates on September 30, 2019. |
44
Unmatured Market Debt (Continued)
Other Obligations (with Respect to Money Borrowed)
DIRECT OBLIGATIONS (1)
The borrowings listed below are direct obligations of agent enterprise Crown corporations which are agents of Canada and as such constitute direct obligations of the Government of Canada and are a charge on and payable out of the Consolidated Revenue Fund of Canada.
BORROWINGSBY AGENT ENTERPRISE CROWN CORPORATIONS
| | | | | | | | | | | | |
| | | Outstanding at March 31, 2019 | |
| | | Canadian
dollar
borrowings | | | Foreign
currency
borrowings (2) | | | Total
borrowings | |
| | | (in millions) | |
Business Development Bank of Canada | | $ | 133 | | | $ | 4 | | | $ | 137 | |
Canada Mortgage and Housing Corporation | | | 237,516 | | | | — | | | | 237,516 | |
Canada Post Corporation | | | 997 | | | | — | | | | 997 | |
Export Development Canada | | | 499 | | | | 54,717 | | | | 55,217 | |
Farm Credit Canada | | | 308 | | | | 509 | | | | 818 | |
Freshwater Fish Marketing Corporation | | | 37 | | | | — | | | | 37 | |
Royal Canadian Mint | | | 12 | | | | — | | | | 12 | |
| | | | | | | | | | | | |
Total | | $ | 239,502 | | | $ | 55,230 | | | $ | 294,734 | |
| | | | | | | | | | | | |
Source: Public Accounts of Canada 2019 (Volume 1, Table 9.5) and Public Services and Procurement Canada.
Note: Amounts may not add due to rounding.
| (1) | The payment of all money borrowed by agent enterprise Crown corporations and interest thereon is a charge on and payable out of the Consolidated Revenue Fund. Such borrowings therefore constitute obligations of the Government and are recorded as such net of borrowings expected to be repaid directly by these corporations. In practice, with few exceptions, all borrowings have been repaid by the agent enterprise Crown corporations. |
| (2) | Foreign currency equivalent in Canadian dollars. |
CONTINGENT LIABILITIES
| | | | |
| | | Principal amount
outstanding | |
GUARANTEES PROVIDEDBYTHE GOVERNMENTASAT MARCH 31, 2019 (INMILLIONSOFDOLLARS) | | | | |
| |
Guaranteed borrowings of enterprise Crown corporations and other government business enterprises | | | | |
Agent enterprise Crown corporations | | | 294,734 | |
| |
Other guarantees provided by the Government | | | | |
Loan guarantees | | | | |
Agriculture and Agri-Food | | | | |
Department of Agriculture and Agri-Food | | | | |
Advance Payments Program—Agricultural Marketing Programs Act | | | 1,675 | |
Farm Improvement Loans Act and Canadian Agricultural Loans Act | | | 98 | |
Families, Children and Social Development | | | | |
Department of Employment and Social Development | | | | |
Canada Student Loans Act | | | 2 | |
Finance | | | | |
Department of Finance | | | | |
Coast Capital Savings and Federal Credit Union | | | 1,500 | |
International Bank for Reconstruction and Development | | | 158 | |
Indigenous Services | | | | |
Department of Indigenous Services | | | | |
Indian Economic Development Guarantee Program | | | 1 | |
On-Reserve Housing Guarantee Program | | | | |
Canada Mortgage and Housing Corporation | | | 1,509 | |
Other approved lenders | | | 281 | |
Innovation, Science and Economic Development | | | | |
Department of Industry | | | | |
Canada Small Business Financing Act | | | 946 | |
Regional Aircraft Credit Facility | | | 17 | |
Natural Resources | | | | |
Department of Natural Resources | | | | |
Lower Churchill Hydro Electric Projects | | | 8,650 | |
| | | | |
Total—Loan guarantees | | | 14,837 | |
| | | | |
| |
Insurance programs managed by the Government | | | | |
Canadian Heritage | | | | |
Department of Canadian Heritage | | | | |
Canada Travelling Exhibitions Indemnification Act | | | — | |
Finance | | | | |
Department of Finance | | | | |
Mortgage or Hypothecary Insurance Protection | | | 241,676 | |
Global Affairs | | | | |
Department of Foreign Affairs, Trade and Development | | | | |
Accounts administered for the Government by Export Development Canada | | | 89 | |
Natural Resources | | | | |
Department of Natural Resources | | | | |
Nuclear Liability Account | | | — | |
| | | | |
Total—Insurance programs managed by the Government | | | 241,765 | |
| | | | |
Other explicit guarantees | | | | |
Agriculture and Agri-Food | | | | |
Department of Agriculture and Agri-Food | | | | |
National Biomass Ethanol Program | | | — | |
Price Pooling Program—Agricultural Marketing Programs Act | | | — | |
| | | | |
Total—Other explicit guarantees | | | — | |
| | | | |
Total—Gross guarantees | | | 551,336 | |
| |
Less: allowance for guarantees | | | 277 | |
| | | | |
Net exposure under guarantees | | | 551,059 | |
| | | | |
Source: Public Accounts of Canada 2019 (Volume 1, Table 11.6).
Note: Amounts may not add due to rounding.
45
Supplementary Information
MARKETABLE BONDS (DOMESTIC)
From October 1, 2019 through November 30, 2019, Government of Canada domestic marketable bonds outstanding increased by $10,392 million to $578,909 million. New issues and retirements during this period are detailed below.
| | | | | | | | | | | | | | | | |
Issue or Maturity Date | | Coupon (%) | | | Maturity Date | | | Issue Amount | | | Maturing Amount | |
October 4, 2019 | | | 1.25 | | | | June 1, 2030 | | | $ | 3,300,000,000 | | | | | |
October 11, 2019 | | | 1.25 | | | | March 1, 2025 | | | | 4,200,000,000 | | | | | |
October 18, 2019 | | | 1.25 | | | | November 1, 2021 | | | | 3,000,000,000 | | | | | |
October 25, 2019 | | | 1.75 | | | | March 1, 2023 | | | | 2,400,000,000 | | | | | |
November 1, 2019 | | | 1.25 | | | | | | | | | | | $ | 13,099,055,000 | |
November 4, 2019 | | | 1.50 | | | | February 1, 2022 | | | | 3,000,000,000 | | | | | |
November 8, 2019 | | | 1.25 | | | | March 1, 2025 | | | | 4,200,000,000 | | | | | |
November 15, 2019 | | | 1.75 | | | | March 1, 2023 | | | | 2,400,000,000 | | | | | |
November 18, 2019 | | | 2.00 | | | | December 1, 2051 | | | | 1,400,000,000 | | | | | |
November 22, 2019 | | | 1.50 | | | | February 1, 2022 | | | | 3,000,000,000 | | | | | |
November 29, 2019 | | | 0.50 | | | | December 1, 2050 | | | | 700,000,000 | | | | | |
| | | | | | | | | | | | | | | | |
| | | | | | | $ | 27,600,000,000 | | | $ | 13,099,055,000 | |
| | | | | | | | | | | | | | | | |
From October 1, 2019 through November 30, 2019, eight repurchase operations were held and the following bonds were purchased by the Government. Repurchased bonds are typically cancelled shortly after their settlement.
| | | | | | | | | | | | |
Repurchase Settlement Date | | Coupon (%) | | | Maturity Day | | | Amount Repurchased | |
October 3, 2019 | | | 1.50 | | | | March 1, 2020 | | | $ | 165,000,000 | |
| | | | | | | | | | | | |
October 10, 2019 | | | 0.75 | | | | September 1, 2020 | | | $ | 340,000,000 | |
| | | | | | | | | | | | |
October 24, 2019 | | | 3.50 | | | | June 1, 2020 | | | | 50,000,000 | |
| | | 1.75 | | | | August 1, 2020 | | | | 180,000,000 | |
| | | 0.75 | | | | September 1, 2020 | | | | 200,000,000 | |
| | | 2.00 | | | | November 1, 2020 | | | | 400,000,000 | |
| | | | | | | | | | | | |
| | | | | | | | | | $ | 830,000,000 | |
October 31, 2019 | | | 1.25 | | | | November 1, 2019 | | | | 74,000,000 | |
| | | 2.00 | | | | November 1, 2020 | | | | 200,000,000 | |
| | | 2.25 | | | | February 1, 2021 | | | | 40,000,000 | |
| | | 0.75 | | | | March 1, 2021 | | | | 22,000,000 | |
| | | | | | | | | | | | |
| | | | | | | | | | $ | 336,000,000 | |
November 7, 2019 | | | 1.50 | | | | March 1, 2020 | | | | 10,000,000 | |
| | | 0.75 | | | | September 1, 2020 | | | | 85,000,000 | |
| | | 2.00 | | | | November 1, 2020 | | | | 375,000,000 | |
| | | 0.75 | | | | March 1, 2021 | | | | 90,000,000 | |
| | | 1.75 | | | | May 1, 2021 | | | | 195,000,000 | |
| | | | | | | | | | | | |
| | | | | | | | | | $ | 755,000,000 | |
November 14, 2019 | | | 1.75 | | | | August 1, 2020 | | | | 8,000,000 | |
| | | 0.75 | | | | September 1, 2020 | | | | 250,000,000 | |
| | | | | | | | | | | | |
| | | | | | | | | | $ | 258,000,000 | |
November 21, 2019 | | | 0.75 | | | | September 1, 2020 | | | | 150,000,000 | |
| | | 2.00 | | | | November 1, 2020 | | | | 200,000,000 | |
| | | 0.75 | | | | March 1, 2021 | | | | 100,000,000 | |
| | | | | | | | | | | | |
| | | | | | | | | | $ | 450,000,000 | |
November 28, 2019 | | | 1.50 | | | | March 1, 2020 | | | $ | 480,000,000 | |
| | | | | | | | | | | | |
Total repurchased amount for Period | | | | | | | | | | $ | 3,614,000,000 | |
| | | | | | | | | | | | |
46
TREASURY BILLS
From October 1, 2019 through November 30, 2019, treasury bills outstanding decreased by $4,300 million to $129,900 million.
CANADA BILLS
From October 1, 2019 through November 30, 2019, Canada Bills outstanding decreased by U.S.$13,765,000 to U.S.$1,917,105,000.
CROSS CURRENCY SWAPS
From October 1, 2019 through November 30, 2019, Canadian dollar liabilities of $395,550,000 were swapped into liabilities of USD 300,000,000; Canadian dollar liabilities of $643,346,000 were swapped into liabilities of EUR 442,000,000; and Canadian dollar liabilities of $241,506,740 were swapped into liabilities of JPY 20,000,000,000.
FOREIGN EXCHANGE FORWARDS
As of November 30, 2019, the Government had outstanding transactions to purchase: USD 1,133,045,343 in exchange for EUR 1,016,518,000; USD 293,190,795 in exchange for GBP 225,920,000; USD 289,674,947 in exchange for JPY 31,280,900,000; USD 379,532,580 in exchange for CNH 2,674,400,000; EUR 13,651,000 in exchange for USD 15,121,895; GBP 3,034,000 in exchange for USD 3,927,210; JPY 420,100,000 in exchange for USD 3,879,577; and CNH 35,900,000 in exchange for USD 5,093,860.
FOREIGN EXCHANGE SWAPS
As of November 30, 2019, the Government had the following foreign exchange swaps (Canadian dollars swapped for U.S. dollars) outstanding:
| | | | | | | | |
| | | Canadian dollar | | | U.S. dollar | |
Maturity date | | Notional amount | | | Notional amount | |
2020 – Jan. 7 | | $ | 135,125,166 | | | | USD 101,586,257 | |
47