The Economic
and
Fiscal Update
CANADA’S NEW GOVERNMENT
| | | | | |
| | Department of Finance
Canada | | Ministère des Finances
Canada |
© Her Majesty the Queen in Right of Canada (2006)
All rights reserved
All requests for permission to reproduce this document
or any part thereof shall be addressed to Public Works
and Government Services Canada.
Available from the
Distribution Centre
Department of Finance Canada
Room P-135, West Tower
300 Laurier Avenue West
Ottawa, Ontario K1A 0G5
Tel: 613-995-2855
Fax: 613-996-0518
Also on the Internet at www.fin.gc.ca
Cette publication est aussi disponible en français.
Cat. No.: F2-105/2006-1E
ISBN 0-662-44504-X
1
Economic Developments
and Prospects
Highlights
| ü | | Private sector forecasters expect Canadian real gross domestic product (GDP) to grow around 2 3/4per cent in both 2006 and 2007. They expect nominal GDP in 2006 to be somewhat lower than they expected at the time of the May 2006 budget, primarily because of a lower forecast for GDP inflation. |
| |
| ü | | Real GDP growth moderated in the second quarter of 2006 after strong growth in the first quarter. Net exports have continued to be a drag on growth, but domestic demand growth has remained strong, supported by a healthy labour market. |
| |
| ü | | In the United States economic growth has slowed, primarily due to a sharp decline in housing activity and slower consumer spending. |
| |
| ü | | Despite slower growth in the U.S., the global expansion is projected to remain broadly on track, supported by strengthening activity in Europe, the ongoing recovery in Japan and continuing strong growth in emerging markets such as China. |
| |
| ü | | The risks to the Canadian economic outlook remain largely external. |
| | – | | The correction to the U.S. housing market and its impact could be more severe than expected, resulting in a more pronounced slowdown of the U.S. economy. |
| |
| | – | | The prices of many commodities are well above historical norms, leading to the possibility of a significant correction. This poses a significant downside risk to Canadian nominal GDP growth. As well, a sharper than expected U.S. slowdown or a deceleration of growth in China from its current rapid pace would also pose a downside risk to commodity prices. |
| |
| | – | | There is also a risk that the U.S. dollar could depreciate further against floating currencies such as the Canadian dollar in response to global current account imbalances. This would pose additional challenges to Canada’s export sector. |
Note: This chapter incorporates data available up to November 3, 2006.
6
Introduction
This chapter reviews recent economic developments and prospects. It first discusses recent developments and the outlook for the U.S. and overseas economies, followed by a review of recent developments in the Canadian economy. It then describes the economic-planning assumptions that underlie the Government’s budget plan and notes a number of risks and uncertainties associated with the private sector economic outlook.
U.S. and Overseas Economic Developments and Outlook
Recent U.S. Economic Developments
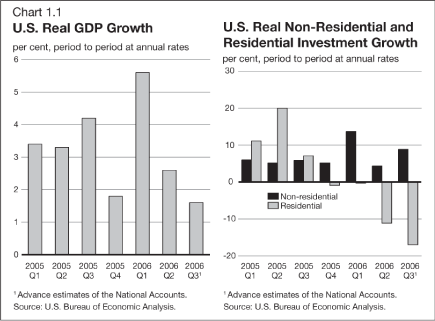
In 2005, U.S. real GDP grew 3.2 per cent. Real GDP growth slowed to 2.6 per cent in the second quarter of 2006, following strong growth of 5.6 per cent in the first quarter (Chart 1.1). The slowdown primarily reflected weaker growth in consumer spending as well as a large decline in residential investment. Advance National Accounts estimates show that third-quarter growth moderated to just 1.6 per cent due largely to a further contraction in residential investment, weaker net exports and a slower pace of inventory accumulation.
Recent data reveal a growing dichotomy within fixed investment. Non-residential investment remained healthy in the second quarter, growing 4.4 per cent. However, residential investment dropped over 10 per cent in the second quarter. According to advance estimates of the National Accounts, non-residential investment grew 8.6 per cent in the third quarter, while residential investment contracted by 17.4 per cent.
7
The correction in residential investment follows several years of rapid growth. Low interest rates and the development of attractive unconventional mortgage products, such as interest-only mortgages and non-prime lending, made housing more affordable, boosting housing demand and construction activity.
8
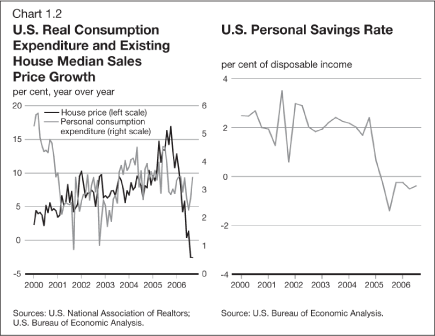
These factors led to a significant appreciation of house prices in the U.S. over the past few years (Chart 1.2). House prices grew rapidly and likely exceeded values warranted by fundamentals in many markets. Strong growth in house prices also fuelled expectations of continued rapid price gains, which in turn added a speculative component to housing demand. Soaring house prices boosted household wealth, allowing households to increase spending from current income as well as withdraw equity from their houses. This has translated into higher consumer spending and a lower personal savings rate.
9
The removal of monetary stimulus by the Federal Reserve since mid-2004 has led to a tightening of credit conditions and lowered the attractiveness of purchasing houses, thereby reducing demand and slowing house price appreciation. This in turn has reined in expectations of future house price inflation. A high past level of construction also led to an inventory overhang, putting additional downward pressure on housing prices and leading to an abrupt correction in housing starts.
The realignment of house prices to their fundamental values is negatively affecting wealth and likely played a role in the weakening in consumer expenditure growth in the second quarter. Partly offsetting this, however, has been a recent decline in gasoline prices, which frees up household income for other purchases.
U.S. Economic Outlook
Moderating domestic demand, driven by a cooling housing market, is expected to lower economic growth to below potential in the second half of 2006 and into 2007. However, solid wage growth and lower energy prices should support household expenditures. Strong business investment, reflecting an ongoing catch-up in non-residential structures spending from the protracted weakness that followed September 11th, should also help prevent a sharper slowdown of the U.S. economy. As well, strengthening growth abroad and the past depreciation of the U.S. dollar should support export growth.
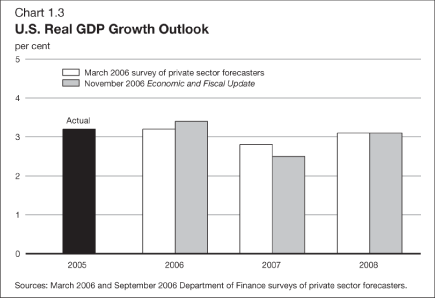
For 2006 as a whole, private sector forecasters expect U.S. real GDP to increase 3.4 per cent, up from 3.2 per cent expected in March 2006 and unchanged from the April 2006 Blue Chip Economic Indicators forecast presented in the May 2006 budget (Chart 1.3). Private sector forecasters expect 2007 growth of 2.5 per cent, down from 2.8 per cent expected in March 2006. They expect 2008 growth to strengthen to 3.1 per cent.
10
Overseas Economies
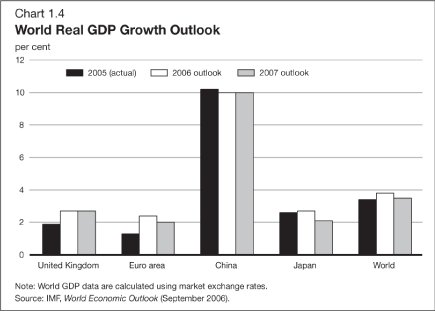
Despite the expected slowdown in U.S. economic growth next year, the global expansion is projected to remain broadly on track, supported by solid economic activity in Europe, the ongoing recovery in Japan and continuing strong growth in emerging markets such as China. Overall, the International Monetary Fund (IMF) expects world real GDP growth (calculated at market exchange rates) to pick up from 3.4 per cent in 2005 to 3.8 per cent in 2006, before moderating to 3.5 per cent in 2007 (Chart1.4).
11
In Japan, the recovery is now well established, with the economy growing in each of the past six quarters, supported by a solid expansion of domestic demand. The IMF expects the expansion to remain firmly on track, as strong profits and a rebound in bank credit bolster private investment, while consumer spending remains steady. Real GDP growth is expected to edge up to 2.7 per cent in 2006 before moderating to 2.1 per cent in 2007.
Economic activity remains strong in China, spurred on by a renewed pickup in investment and surging exports. Despite a series of measures to cool down the economy, the pace of expansion is expected to remain rapid at 10 per cent in both 2006 and 2007. There is potential for the economy to overheat, raising the risk of an investment boom-bust cycle. A sharper than expected U.S. slowdown would likely put downward pressure on exports and investment.
12
In the euro area, economic growth is strengthening, with growth increasingly driven by domestic demand, in particular business investment. The IMF expects business investment to continue to support economic activity in the second half of this year, with economic growth for 2006 projected to be 2.4 per cent, up from 1.3 per cent in 2005. Growth is expected to moderate to 2.0 per cent in 2007, largely reflecting a slower pace of consumer spending in Germany due to planned tax increases.
Growth has been solid in the United Kingdom over the first half of the year, as healthy employment gains have supported consumer spending, and investment has remained strong. Economic activity is expected to remain solid in the near term, with real GDP growth of 2.7 per cent in both 2006 and 2007.
Commodity Prices
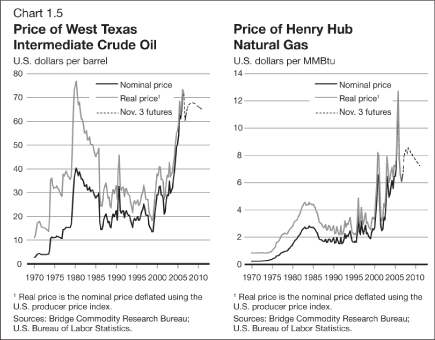
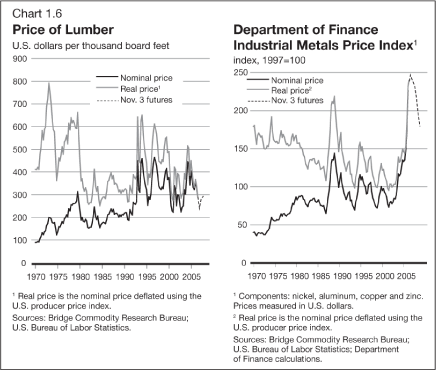
Prices for key Canadian commodities have remained volatile in recent months. Crude oil and industrial metals prices remain at historically elevated levels despite recent declines, reflecting ongoing strong global demand growth and tight supply conditions. At the same time, higher inventory levels have resulted in sharply lower prices for natural gas, while lumber prices have dropped significantly in response to slowing U.S. housing demand.
Crude oil prices rose from US$72 per barrel at the time of the May 2006 budget to daily highs of close to US$77 in mid-summer, before dropping to under US$60 in recent weeks. The recent decline reflects easing geopolitical tensions, higher inventory levels and expectations of increased production capacity. However, despite a slowing U.S. economy, global oil demand is expected to remain strong, led by continued solid growth in China. Moreover, the risk of further geopolitical disruptions remains. As a result, private sector forecasters expect only a modest decline in oil prices from 2005 levels over the medium term.
After adjusting for inflation, this would leave crude oil prices close to record highs reached in the late 1970s over the near term, and well above their average over the last 35 years (Chart 1.5). However, industrialized economies are far less exposed to the negative impacts of higher oil prices than in the 1970s, using only approximately half as much oil, relative to GDP, as they did then.
13
Natural gas prices fell sharply over the past year, as a warmer than normal winter and the absence of hurricane-related disruptions pushed inventory levels well above recent historical averages. Private sector forecasters expect prices to rebound moderately over the near term, however, reflecting growing substitution away from relatively more expensive oil for home heating and electricity generation. While forecasters expect prices to remain below the record levels seen in 2005, they expect prices to remain significantly above their historical average.
Lumber prices, which have fallen by more than one-third since early 2005, are expected to remain at or below current levels over the near term, reflecting ongoing weakness in U.S. housing demand (Chart 1.6). Industrial metals prices are expected to moderate from current record highs but remain above historical trend levels, fuelled by continued strong demand from China.
14
Canadian Economic Developments
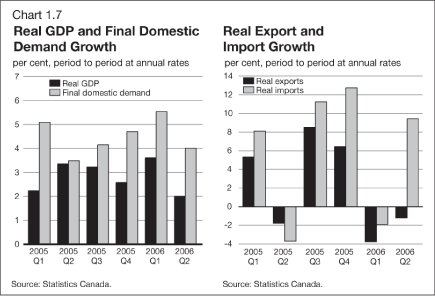
Canadian real GDP growth softened to 2.0 per cent in the second quarter of 2006 from 3.6 per cent in the first quarter and 2.9 per cent in 2005, as net exports weakened significantly. Growth in final domestic demand also moderated but remained solid in the second quarter (Chart 1.7).
Net exports have been a drag on growth in every quarter over the past year. The strength of the Canadian dollar and a slowing U.S. economy in the second quarter led to a decline in exports in the first half of 2006. The strong dollar has also contributed to strong import growth by reducing the prices of foreign goods and services.
15
Solid growth in final domestic demand has been supported by a healthy labour market. In the first five months of 2006, employment rose at a solid pace, pushing the employment rate to a record high of 63.2 per cent in May and the unemployment rate to 6.1 per cent, the lowest level since December 1974. Employment then fell between June and August, before increasing at a healthy pace in September and October. The unemployment rate remained close to its over 31-year low at 6.2 per cent in October.
16
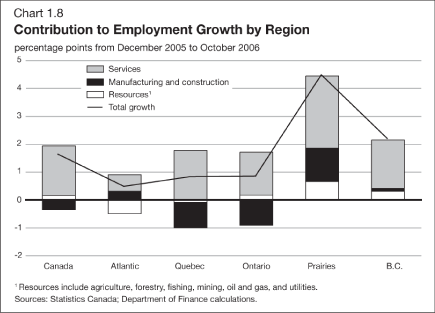
So far in 2006, the Canadian economy has created over 260,000 new jobs, almost all of which are full-time. All regions of the country have benefited from the gain, with western Canada experiencing the strongest growth. In Ontario and Quebec, losses in manufacturing employment that are in part due to the stronger Canadian dollar have been more than offset by widespread gains in the services sector (Chart 1.8).
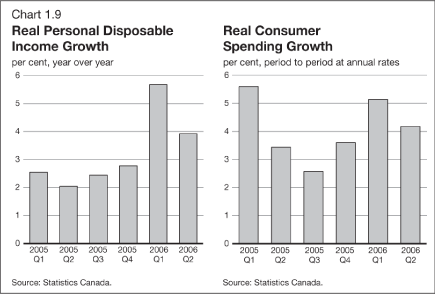
The high rate of job creation, combined with recent tax cuts, has contributed to strong income growth, which in turn has supported consumer spending. Consumer spending rose a solid 4.2 per cent in the second quarter of 2006 following growth of 5.1 per cent in the first quarter (Chart 1.9). In particular, spending on durable and semi-durable goods continued to grow strongly in the second quarter after surging in the first.
17
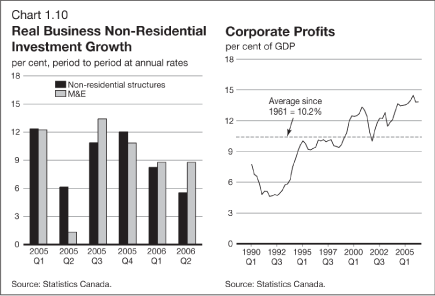
Growth in business non-residential investment has also remained solid, despite some moderation from the double-digit increases seen during most of 2005. Real investment in machinery and equipment (M&E) rose 8.8 per cent in both the first and second quarters of 2006, while real investment in non-residential structures increased 5.5 per cent in the second quarter following growth of 8.2 per cent in the first (Chart 1.10). The continuing strength in investment partly reflects the appreciation of the Canadian dollar, which has lowered the costs of imported M&E. As well, strong profit growth has boosted investment, particularly in the oil and gas sector, which accounts for about a quarter of total non-residential investment in Canada. In the second quarter of 2006, corporate profits stood at 13.7 per cent of GDP, near the record high of 14.3 per cent reached in the fourth quarter of 2005 (Chart 1.10).
18
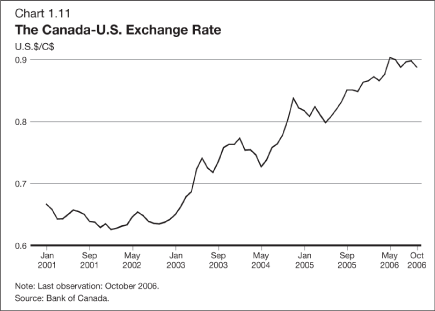
Strong corporate profits have been supported by significant improvements in Canada’s export prices. Continued increases in world demand have driven up the prices of Canadian-produced commodities, which, combined with ongoing adjustments to global current account imbalances, has led the Canadian dollar to appreciate since the beginning of 2003 (Chart 1.11).
Rising prices of commodity exports, particularly oil, have led to strong growth in commodity-producing provinces, especially Alberta. Wages in Alberta have jumped in response to a tight labour market in the province, with average hourly wages of employees in October 5.6 per cent higher than a year earlier, compared with growth of 3.1 per cent for all of Canada over the same period.
19
An influx of workers from other parts of the country has resulted in strong demand for housing in Alberta, causing house prices to soar. Prices of resale housing in Alberta were 39 per cent higher in September than a year earlier—more than four times the increase for Canada as a whole. While the housing market remains very active in British Columbia and Alberta, growth in house prices has moderated in most other regions of the country.
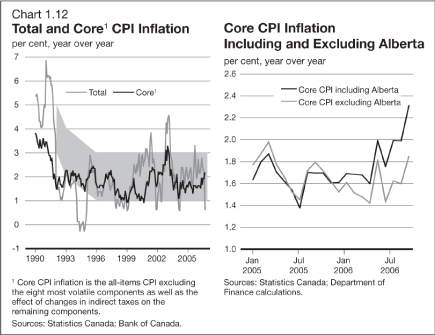
As a result of strong increases in house prices as well as in the prices of many services, Alberta accounted for more than one-quarter of core Consumer Price Index (CPI) inflation in Canada in September. Core CPI inflation in Canada had remained at or below 2 per cent since the beginning of 2004 before rising to 2.3 per cent in September. However, core CPI inflation excluding Alberta has continued to be below 2 per cent (Chart 1.12).
20
In September, total CPI inflation eased to 0.7 per cent, the slowest rate since March 2004. Lower inflation in September mainly reflected a fall in gasoline prices. The 1-percentage-point reduction in the goods and services tax rate has also helped to reduce total CPI inflation since July.
The Bank of Canada left its key policy rate unchanged in its July, September and October fixed action dates after seven consecutive 25-basis-point increases over nine months. The Bank expects that the small amount of excess demand currently in the economy will unwind over the coming months, with core CPI inflation returning to 2 per cent by the middle of 2007.
21
Private Sector Economic Forecasts
The Department of Finance surveys private sector economic forecasters on a quarterly basis regarding their outlook for the Canadian economy. The economic forecasts reported here reflect the survey conducted by the Department following the release of the second-quarter National Income and Expenditure Accounts by Statistics Canada on August 31. A total of 15 forecasters responded to the latest survey. Their responses form the basis for economic assumptions that underlie the five-year status quo fiscal projections reported in the next chapter.
Short-Term Outlook
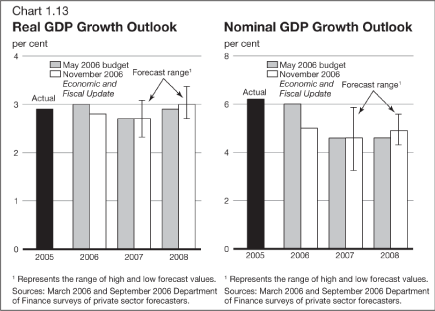
Chart 1.13 provides a summary of the forecasts of real and nominal GDP growth for the period 2006 to 2008. The key change to the outlook since the May 2006 budget is that private sector forecasters expect nominal GDP growth to be weaker in 2006, primarily as a result of weaker GDP inflation.
Private sector forecasters expect real GDP to grow by 2.8 per cent in 2006, down slightly from 3.0 per cent anticipated at the time of the 2006 budget (Chart 1.13). Growth is expected to slow modestly to 2.7 per cent in 2007, identical to the budget forecast. The forecasts of real GDP growth in 2007 range from 2.3 per cent to 3.1 per cent, reflecting differing views regarding the U.S. outlook. In 2008, growth is expected to pick up to 3.0 per cent, slightly stronger than the 2.9 per cent anticipated at the time of the budget. According to the IMF, Canada is expected to have the second fastest growth rate in 2006 among Group of Seven (G7) countries, second only to the United States. For 2007, the IMF expects Canada to be the fastest-growing economy among the G7.
Private sector forecasters have lowered their forecast for GDP inflation in 2006 from 2.9 per cent to 2.1 per cent, reflecting lower than expected energy prices in the first half of the year (Table 1.1). For 2007, forecasters expect GDP inflation of 1.9 per cent, slightly higher than anticipated at the time of the budget. Private sector forecasts for GDP inflation in 2007 range from 0.9 per cent to 2.8 per cent. Forecasters expect GDP inflation of 1.9 per cent in 2008.
22
As a result, nominal GDP is projected to grow 5.0 per cent this year and 4.6 per cent in 2007, compared to 6.0 per cent and 4.6 per cent, respectively, in the budget forecast (Chart 1.13). Private sector forecasts of nominal GDP growth range from 3.2 per cent to 5.9 per cent in 2007. For 2008, nominal GDP growth of 4.9 per cent is projected, higher than the 4.6 per cent anticipated at the time of the budget.
Based on private sector forecasts, the level of nominal GDP in 2006 is projected to be about $13.5 billion lower than expected at the time of the 2006 budget, after adjusting for historical revisions. The level of nominal GDP is projected to be approximately $14.2 billion lower in 2007 and $10.2 billion lower in 2008 than expected at the time of the budget.
23
Short-term interest rates are projected to average 4.1 per cent in 2006, slightly higher than the 4.0 per cent in the budget forecast. Forecasters expect that short-term rates will average 3.9 per cent in 2007 and 4.2 per cent in 2008, both slightly lower than expected at the time of the 2006 budget.
Private sector forecasters expect Canadian long-term interest rates to average 4.3 per cent in 2006 and 2007—about 15 basis points lower, on average, over this period than forecast in the budget. For 2008, private sector forecasters expect long-term interest rates to average 4.6 per cent, 50 basis points lower than expected at the time of the budget.
Private sector forecasters expect the Canadian labour market to remain healthy. The unemployment rate is forecast to average 6.4 per cent in 2006 and 6.5 per cent in both 2007 and 2008, slightly lower than anticipated at the time of the budget. Forecasters have raised their outlook for employment growth in 2006 from 1.5 per cent in the budget to 1.8 per cent. Employment growth is expected to slow somewhat from this strong pace to 1.2 per cent in 2007 and 2008.
Medium-Term Outlook
Private sector forecasters have not significantly revised their medium-term economic outlook for 2009 to 2011 since the budget survey. Real GDP growth is expected to average 3.0 per cent over 2009 to 2011. Forecasters expect GDP inflation to average 1.7 per cent over the period, leaving average annual growth in nominal GDP unchanged at 4.7 per cent. Short-term and long-term interest rates are expected to rise very gradually from their 2006 levels to 4.4 per cent and 5.1 per cent, respectively, by 2011. The unemployment rate is expected to average 6.4 per cent over 2009 to 2011 and employment growth is forecast to average 1.2 per cent over the period.
24
Table 1.1
Private Sector Forecasts for 2006–2011
| | | | | | | | | | | | | | | | | |
| | | | | | | | | | | | | | | Average | |
| | | 2006 | | | 2007 | | | 2008 | | | 2009–2011 | |
| | | (per cent, unless otherwise indicated) | |
Real GDP growth | | | | | | | | | | | | | | | | |
| May 2006 budget | | | 3.0 | | | | 2.7 | | | | 2.9 | | | | 2.9 | |
November 2006 Economic and Fiscal Update | | | 2.8 | | | | 2.7 | | | | 3.0 | | | | 3.0 | |
| | | | | | | | | | | | | | | | | |
GDP inflation | | | | | | | | | | | | | | | | |
| May 2006 budget | | | 2.9 | | | | 1.8 | | | | 1.6 | | | | 1.8 | |
November 2006 Economic and Fiscal Update | | | 2.1 | | | | 1.9 | | | | 1.9 | | | | 1.7 | |
| | | | | | | | | | | | | | | | | |
Nominal GDP growth | | | | | | | | | | | | | | | | |
| May 2006 budget | | | 6.0 | | | | 4.6 | | | | 4.6 | | | | 4.7 | |
November 2006 Economic and Fiscal Update | | | 5.0 | | | | 4.6 | | | | 4.9 | | | | 4.7 | |
| | | | | | | | | | | | | | | | | |
Nominal GDP level (billions of dollars) | | | | | | | | | | | | | | | | |
May 2006 budget1 | | | 1,454 | | | | 1,520 | | | | 1,590 | | | | n/a | |
November 2006 Economic and Fiscal Update | | | 1,440 | | | | 1,506 | | | | 1,580 | | | | n/a | |
| | | | | | | | | | | | | | | | | |
3-month treasury bill rate | | | | | | | | | | | | | | | | |
| May 2006 budget | | | 4.0 | | | | 4.1 | | | | 4.3 | | | | 4.4 | |
November 2006 Economic and Fiscal Update | | | 4.1 | | | | 3.9 | | | | 4.2 | | | | 4.3 | |
| | | | | | | | | | | | | | | | | |
10-year government bond rate | | | | | | | | | | | | | | | | |
| May 2006 budget | | | 4.4 | | | | 4.5 | | | | 5.1 | | | | 5.2 | |
November 2006 Economic and Fiscal Update | | | 4.3 | | | | 4.3 | | | | 4.6 | | | | 5.0 | |
| | | | | | | | | | | | | | | | | |
Unemployment rate | | | | | | | | | | | | | | | | |
| May 2006 budget | | | 6.6 | | | | 6.6 | | | | 6.7 | | | | 6.5 | |
November 2006 Economic and Fiscal Update | | | 6.4 | | | | 6.5 | | | | 6.5 | | | | 6.4 | |
| | | | | | | | | | | | | | | | | |
Employment growth | | | | | | | | | | | | | | | | |
| May 2006 budget | | | 1.5 | | | | 1.2 | | | | 1.4 | | | | 1.2 | |
November 2006 Economic and Fiscal Update | | | 1.8 | | | | 1.2 | | | | 1.2 | | | | 1.2 | |
| | | | | | | | | | | | | | | | | |
U.S. real GDP growth | | | | | | | | | | | | | | | | |
| March 2006 survey of private sector forecasters | | | 3.2 | | | | 2.8 | | | | 3.1 | | | | 3.1 | |
November 2006 Economic and Fiscal Update | | | 3.4 | | | | 2.5 | | | | 3.1 | | | | 3.1 | |
| | | | | | | | | | | | | | | | | |
Addendum | | | | | | | | | | | | | | | | |
U.S. real GDP growth | | | | | | | | | | | | | | | | |
May 2006 budget (April 2006 Blue Chip Economic Indicators) | | | 3.4 | | | | 3.0 | | | | n/a | | | | n/a | |
October 2006 Blue Chip Economic Indicators | | | 3.4 | | | | 2.6 | | | | 3.1 | | | | 3.0 | |
| |
| | |
| 1 | | Nominal GDP levels have been adjusted to reflect May 2006 revisions to Canada’s National Income and Expenditure Accounts. |
Sources: March 2006 and September 2006 Department of Finance surveys of private sector forecasters; April 2006 and October 2006 Blue Chip Economic Indicators.
25
Risks and Uncertainties
The main risks to the Canadian economic outlook continue to be external. Recent developments suggest that the correction in the U.S. housing market could be sharper than previously expected. There is also a risk of a significant drop in the prices of certain commodities, which are well above historical norms. As well, global imbalances remain large and continue to pose a medium-term risk to the outlook.
U.S. Housing Market
The private sector forecast for the U.S. economy is consistent with a significant further correction in the U.S. housing market. However, there is a risk that this correction could be greater than expected. A larger than expected house price correction would negatively affect consumer wealth and have negative implications for consumer demand. There is also a risk of a sharper than expected contraction in residential investment. Weaker than expected U.S. consumer spending and residential investment would have negative implications for Canadian growth.
Commodity Prices
Uncertainty over the future path of commodity prices remains a key risk to the outlook. Although the possibility of further price increases remains, the risk of greater than expected declines has risen recently. Indeed, the unexpected recent sharp decline in crude oil prices, the bulk of which occurred since the September Department of Finance survey of private sector forecasters, means that there is a risk that GDP inflation in the second half of 2006 could be below expectations. This would have negative implications for the level of nominal GDP for both 2006 and 2007.
Prices for several key commodities remain well above historical levels, in real terms, leading to the possibility of a significant correction in the near term. Real industrial metals prices are currently approximately 75 per cent above their average levels since the early 1970s, almost entirely due to strong demand from China. Similarly, real crude oil prices remain close to twice their average level over the same period, despite recent declines, in large measure due to strong growth in demand from China and the United States. Natural gas prices are also close to double their average over the period as a result of strong U.S. demand and higher oil prices.
A sharper than expected slowdown in U.S. growth, as well as a deceleration of growth in China from its current rapid pace, could cause commodity prices to fall more than anticipated, translating into lower than expected Canadian nominal GDP over the medium term.
26
Resolution of Global Imbalances
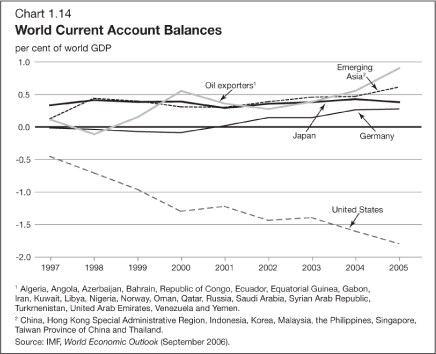
Global current account imbalances remain large (Chart 1.14). In 2005, the U.S. current account deficit grew to 6.4 per cent of U.S. GDP (almost 2 per cent of world GDP) and was matched by growing surpluses in China, oil-exporting countries and Germany. Current account surpluses remained large in Japan and the rest of emerging Asia as well.
Although the U.S. has thus far been able to finance its current account deficit, it is unlikely that deficits of this magnitude can be maintained indefinitely. Sustained large U.S. current account deficits have meant that U.S. net foreign indebtedness has steadily risen, reaching 21 per cent of GDP in 2005. The U.S. current account deficit must fall from its current high level if further substantial increases in net foreign debt are to be avoided.
Slowing growth in the U.S., strengthening growth in the euro area and solid growth in Japan will help to reduce imbalances, though the impact is likely to be small. Greater currency flexibility in emerging Asia and a reduction in the U.S. fiscal deficit would also help to correct global imbalances. However, there is a risk that the main channel of adjustment could be a further depreciation of the U.S. dollar against floating currencies such as the Canadian dollar, and this would pose additional challenges to Canada’s export sector.
27
2
Five-Year Fiscal
Projections
Highlights
| ü | | The fiscal outlook has improved since the May 2006 budget, largely due to lower than expected program expenses and stronger than expected personal income tax revenues. After accounting for the cost of measures announced since the budget and the Government’s minimum tax and debt reduction commitments, the Government projects a planning surplus of $4.2 billion for 2006-07, $3.5 billion for 2007-08, $2.4 billion for 2008-09, $2.0 billion for 2009-10, $3.6 billion for 2010-11 and $2.9 billion for 2011-12. These surpluses are available for new spending and debt and tax reduction initiatives. |
| |
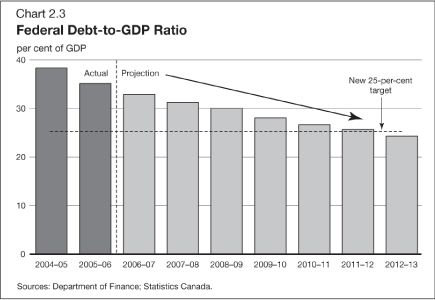
| ü | | The Government believes that we should aim as a country to eliminate Canada’s total government net debt in less than a generation. The federal government will do its part by continuing to plan for annual debt reduction of $3 billion. Further, it is advancing its commitment to reduce the federal debt-to-GDP (gross domestic product) ratio to 25 per cent by one year, to 2012-13, from 35 per cent today. |
| |
| ü | | Lower debt will mean lower taxes. To ensure that Canadians benefit directly from reductions in Canada’s debt, the Government will dedicate the effective interest savings from federal debt reduction each year to personal income tax reductions. To the extent that the Government realizes unanticipated surpluses, it will accelerate debt and personal income tax reductions. |
| |
| ü | | The Government is committed to keeping the growth of program expenses below the growth of the economy over the medium term. The Government took an important step in meeting this objective in 2005-06, when program expenses fell for the first time in nine years. For 2006-07 and 2007-08, program expenses are projected to be lower than estimated in the May 2006 budget. Keeping the growth of spending below the rate of growth of the economy will contribute to further reductions in public debt and in taxes. |
30

| ü | | Revenues as a share of GDP are projected to decline from 16.2 per cent in 2005-06 to 15.3 per cent in 2011-12, reflecting the ongoing implementation of tax reduction measures, including the reductions announced in the Tax Fairness Plan. |
| |
| ü | | The Canada Employment Insurance Commission has set the 2007 premium rate at $1.80 per $100 of insurable earnings, down from the 2006 rate of $1.87. The premium rate reduction, combined with an increase in the maximum insurable earnings to $40,000, will save employers and employees $420 million. |
| |
| ü | | This Economic and Fiscal Update builds on the changes made in Budget 2006 to improve the transparency and accountability of budget planning. It includes the Government’s own estimate of the surplus as well as the estimates of four leading private sector forecasting organizations to allow comparison between different views on the fiscal outlook. |
| |
| ü | | The fiscal projections are subject to risks associated with the economic outlook and changes in the relationship between economic growth and tax revenues, particularly personal and corporate income tax revenues. For 2006-07, the level of departmental spending is also an important variable. The projections of the Government’s fiscal position for the current and the next two fiscal years will be updated in the budget. |
31
New Approach to Budget Planning and Fiscal Forecasting
Budget 2006 introduced a new approach to budget planning. Under this new approach:
| • | | The Government will plan on achieving annual debt reduction of $3 billion. |
| |
| • | | The former practice of adjusting the budget projections for economic prudence has been discontinued. |
| |
| • | | Quarterly updates of the fiscal outlook for the current year are now provided. |
| |
| • | | The focus of budget planning will be on the near term, where uncertainties are fewer and the Government can reasonably be held to account. |
This Economic and Fiscal Update builds on the changes made in Budget 2006.
| • | | Canada’s New Government believes that we should aim as a country to eliminate Canada’s total government net debt by 2021 at the latest. |
| |
| • | | The federal government will show leadership by continuing to plan on annual debt reduction of $3 billion. |
| |
| • | | The federal government is also advancing its commitment to reduce the federal debt-to-GDP ratio to 25 per cent by one year, to 2012–13. This will bring the federal debt burden to its lowest level since the late 1970s. |
| |
| • | | To ensure that Canadians benefit directly from reductions in the federal debt, the Government will dedicate the effective interest savings from debt reduction each year to personal income tax reductions. |
| |
| • | | To the extent that the Government realizes unanticipated surpluses, it will accelerate debt and personal income tax reductions. |
| |
| • | | For planning purposes and to show the medium-term implications of current policies, The Economic and Fiscal Update presents fiscal projections for the current and the next five years. However, since a short planning horizon is appropriate for budgetary decisions, the budget will continue to focus on a two-year horizon. |
32
| • | | In this Update, the Government’s fiscal projection is presented alongside those of four private sector organizations. While the Government’s projection is the basis for fiscal planning, presenting the four private sector fiscal projections separately allows comparison between different views on the fiscal outlook. |
| • | | To incorporate objective economic assumptions, the Government’s fiscal projection is based on the average of private sector economic forecasts, consistent with past practice. A total of 15 economic forecasters responded to the latest survey by the Department of Finance. The four private sector organizations used their own economic assumptions to prepare their fiscal projections. |
33
Changes in the Fiscal Outlook Since the May 2006 Budget
Table 2.1
Summary of Changes in the Fiscal Outlook Since the May 2006 Budget
| | | | | | | | | | | | | |
| | | Actual | | | Projection | |
| | | 2005–06 | | | 2006–07 | | | 2007–08 | |
| | | (billions of dollars) | |
May 2006 budget underlying surplus | | | 8.0 | | | | 3.6 | | | | 4.4 | |
Impact of economic and fiscal developments | | | | | | | | | | | | |
| Budgetary revenues | | | | | | | | | | | | |
| Personal income tax | | | 0.7 | | | | 2.9 | | | | 2.9 | |
| Corporate income tax | | | -2.8 | | | | -2.6 | | | | -1.8 | |
| Goods and services tax | | | 1.1 | | | | 1.1 | | | | 1.1 | |
| Other revenues | | | 2.3 | | | | 0.4 | | | | 0.6 | |
| | | |
| Total revenues | | | 1.3 | | | | 1.9 | | | | 2.8 | |
| |
| Program expenses | | | | | | | | | | | | |
| Transfer payments | | | 0.0 | | | | 0.2 | | | | 0.0 | |
| Direct program expenses | | | 3.9 | | | | 2.2 | | | | 1.2 | |
| | | |
| Total program expenses | | | 3.9 | | | | 2.4 | | | | 1.2 | |
| |
| Public debt charges | | | -0.1 | | | | 0.2 | | | | 0.2 | |
| |
| Total economic and fiscal developments | | | 5.2 | | | | 4.4 | | | | 4.1 | |
| | | | | | | | | | | | | |
Impact of policy changes | | | | | | | | | | | | |
| |
Net impact of measures announced since the budget1 | | | | | | | -0.8 | | | | -1.2 | |
| | | | | | | | | | | | | |
Revised underlying surplus | | | 13.2 | | | | 7.2 | | | | 7.3 | |
| |
| | |
| Notes: A positive number implies an improvement in the budgetary balance. |
| A negative number implies a deterioration in the budgetary balance. |
| Totals may not add due to rounding. |
| |
| 1 | | A detailed list of the measures is provided in Table 2.2. |
Table 2.1 shows the changes to the Government’s fiscal position as a result of economic and fiscal developments since the May 2006 budget. The Government’s fiscal situation is now stronger than projected at the time of the budget, primarily due to lower than expected program expenses and higher than expected personal income tax revenues.
34
In Budget 2006, the underlying surplus was estimated at $8.0 billion for 2005–06, $3.6 billion for 2006–07 and $4.4 billion for 2007–08. The final budget surplus for 2005–06 was larger than expected primarily because of lower than expected program expenses. Program expenses were $3.9 billion lower while revenues were $1.3 billion higher than projected in the budget, largely reflecting one-time accounting adjustments. The surplus resulted in a corresponding reduction in the federal debt.
Going forward, revenues are projected to be $1.9 billion higher in 2006–07 and $2.8 billion higher in 2007–08. The increase in 2006–07 is largely driven by an upward revision to projected personal income tax revenues, which have grown at roughly twice the rate of growth in personal income in the first six months of 2006–07. The higher level of personal income tax revenues in 2006–07 carries forward to 2007–08.
In contrast, corporate income tax revenues in 2006–07 are projected to be $2.6 billion lower than projected at the time of the May 2006 budget. This revision reflects the carry-forward of the lower than expected 2005–06 outcome, when corporate income tax revenues grew more slowly than corporate profits. The impact of the lower 2005–06 outcome is expected to be mitigated somewhat in 2007–08, due to stronger forecast growth in corporate profits relative to the budget projection.
Goods and services tax (GST) revenues are projected to be higher than projected at the time of the budget, reflecting the carry-forward of higher than expected GST revenues in 2005–06.
Before the cost of measures announced since the budget, program expenses are expected to be $2.4 billion lower in 2006–07 and $1.2 billion lower in 2007–08 than expected at the time of the budget, largely reflecting the Government’s commitment to implement new programs only when they are ready. Spending on a number of programs announced in the May 2006 budget, as well as programs announced by the previous government, will be lower than projected at the time of the budget. This is in addition to the $1 billion of savings this year and next announced in Budget 2006 and confirmed by the President of the Treasury Board in September.
35
In the 2005 budget, the previous government launched a reform of government procurement. Savings from this initiative were estimated at $204 million for 2006–07, rising to $888 million per year for 2009–10 and subsequent years.
After taking office, Canada’s New Government undertook an assessment of the procurement reform initiative and has determined that the projected savings were significantly over-estimated. The Government currently estimates that the shortfall will be $1.4 billion over the 2007–08 to 2011–12 period. This revised fiscal target is reflected in the spending projections. Additional work is required and the Government will report on progress in the 2007 budget.
The net impact of new measures announced since Budget 2006 is $0.8 billion in 2006–07 and $1.2 billion in 2007–08. A detailed list of the measures is provided in Table 2.2. Spending measures include costs associated with extending Canada’s mission in Afghanistan, the evacuation of citizens from Lebanon, as well as funding for the 2010 Olympic Games in Vancouver. On the revenue side, tax reduction measures include the increase of the age credit and pension income splitting announced as part of the Government’s Tax Fairness Plan. The Canada-United States Softwood Lumber Agreement will lead to higher revenues and expenses, but it will have no net fiscal impact as the revenue and expense flows are offsetting.
These developments result in a revised underlying surplus of $7.2 billion in 2006–07 and $7.3 billion in 2007–08.
36
Table 2.2
Measures Announced Since the May 2006 Budget
| | | | | | | | | |
| | | 2006–07 | | | 2007–08 | |
| | | (millions of dollars) | |
Spending measures | | | | | | | | |
| Afghanistan mission | | | 206 | | | | 515 | |
| Lebanon evacuation | | | 94 | | | | | |
| 2010 Olympic Games | | | | | | | 50 | |
Extension of employment insurance (EI) pilots— additional five weeks1 | | | 14 | | | | 92 | |
| Meteorological services in Newfoundland and Labrador | | | 2 | | | | 2 | |
| Older workers in vulnerable communities | | | 21 | | | | 38 | |
| Eastern Ontario Development Program | | | 10 | | | | | |
Extension of transitional measures for EI1 | | | 13 | | | | 25 | |
| Recognition programs for ethnocultural groups | | | | | | | 6 | |
| Transformational Plan—Department of Fisheries and Oceans | | | 57 | | | | 59 | |
| City of Québec airport | | | 15 | | | | | |
| Egmont Group secretariat | | | | | | | 2 | |
| | | |
| Subtotal | | | 432 | | | | 788 | |
Less | | | | | | | | |
| Funding included in the fiscal framework | | | 218 | | | | 603 | |
Revenue measures | | | | | | | | |
| Increase of the age credit | | | 405 | | | | 345 | |
| Pension income splitting | | | 165 | | | | 675 | |
| Beer and wine excise duty reduction | | | 6 | | | | 8 | |
| | | |
| Subtotal | | | 576 | | | | 1,028 | |
Canada-United States Softwood Lumber Agreement (SLA) | | | | | | | | |
| Spending impact | | | | | | | | |
| Remittance to provinces of export charge revenue | | | 482 | | | | 516 | |
| Transfer of revenue to U.S. interests under terms of SLA | | | 500 | | | | | |
| Revenue impact | | | | | | | | |
| Export charge | | | -482 | | | | -516 | |
| Special charge | | | -500 | | | | | |
| | | |
| Net cost | | | 0 | | | | 0 | |
Net cost of measures announced since the May 2006 budget | | | 790 | | | | 1,213 | |
| |
| Note: Totals may not add due to rounding. |
| |
| 1 | | Fully reflected in the EI rate. |
37
Summary of Five-Year Fiscal Projection
Table 2.3
Summary Statement of Transactions
| | | | | | | | | | | | | | | | | | | | | | | | | | | | | |
| | | Actual | | | Projection | |
| | | 2005–06 | | | 2006–07 | | | 2007–08 | | | 2008–09 | | | 2009–10 | | | 2010–11 | | | 2011–12 | |
| | | (billions of dollars) | |
Budgetary revenues | | | 222.2 | | | | 229.4 | | | | 238.0 | | | | 245.4 | | | | 253.9 | | | | 264.6 | | | | 276.8 | |
| Program expenses | | | 175.2 | | | | 187.6 | | | | 196.1 | | | | 204.4 | | | | 213.1 | | | | 220.7 | | | | 228.6 | |
| Public debt charges | | | 33.8 | | | | 34.6 | | | | 34.7 | | | | 34.6 | | | | 34.7 | | | | 34.6 | | | | 34.6 | |
Total expenses | | | 209.0 | | | | 222.2 | | | | 230.8 | | | | 239.1 | | | | 247.8 | | | | 255.2 | | | | 263.1 | |
| | | | | | | | | | | | | | | | | | | | | | | | | | | | | |
Underlying surplus | | | 13.2 | | | | 7.2 | | | | 7.3 | | | | 6.4 | | | | 6.1 | | | | 9.4 | | | | 13.7 | |
| | | | | | | | | | | | | | | | | | | | | | | | | | | | | |
Government fiscal commitments | | | | | | | | | | | | | | | | | | | | | | | | | | | | |
| Planned debt reduction | | | | | | | 3.0 | | | | 3.0 | | | | 3.0 | | | | 3.0 | | | | 3.0 | | | | 3.0 | |
| Reduce GST to 5 per cent | | | | | | | | | | | | | | | | | | | | | | | 1.5 | | | | 6.4 | |
| Interest savings dedicated to personal income tax reductions | | | | | | | | | | | | | | | | | | | | | | | | | | | | |
| $13.2-billion debt reduction in 2005–06 | | | | | | | | | | | 0.7 | | | | 0.7 | | | | 0.7 | | | | 0.7 | | | | 0.7 | |
$3-billion-per-year debt
reduction starting in 2006–07 | | | | | | | | | | | 0.2 | | | | 0.3 | | | | 0.5 | | | | 0.6 | | | | 0.8 | |
| | | |
| Total | | | | | | | | | | | 0.8 | | | | 1.0 | | | | 1.1 | | | | 1.3 | | | | 1.4 | |
| | | | | | | | | | | | | | | | | | | | | | | | | | | | | |
Planning surplus1 | | | | | | | 4.2 | | | | 3.5 | | | | 2.4 | | | | 2.0 | | | | 3.6 | | | | 2.9 | |
Federal debt2 | | | 481.5 | | | | 478.5 | | | | 475.5 | | | | 472.5 | | | | 469.5 | | | | 466.5 | | | | 463.5 | |
| | | | | | | | | | | | | | | | | | | | | | | | | | | | | |
Per cent of GDP3 | | | | | | | | | | | | | | | | | | | | | | | | | | | | |
| Budgetary revenues | | | 16.2 | | | | 15.9 | | | | 15.8 | | | | 15.5 | | | | 15.3 | | | | 15.3 | | | | 15.3 | |
| Program expenses | | | 12.8 | | | | 13.0 | | | | 13.0 | | | | 12.9 | | | | 12.9 | | | | 12.7 | | | | 12.6 | |
| Public debt charges | | | 2.5 | | | | 2.4 | | | | 2.3 | | | | 2.2 | | | | 2.1 | | | | 2.0 | | | | 1.9 | |
| Total expenses | | | 15.2 | | | | 15.4 | | | | 15.3 | | | | 15.1 | | | | 15.0 | | | | 14.7 | | | | 14.5 | |
| Federal debt | | | 35.1 | | | | 33.2 | | | | 31.6 | | | | 29.9 | | | | 28.4 | | | | 26.9 | | | | 25.6 | |
| Nominal GDP (billions of dollars, calendar year) | | | 1,371 | | | | 1,440 | | | | 1,506 | | | | 1,580 | | | | 1,655 | | | | 1,734 | | | | 1,813 | |
| |
| | |
| Note: Totals may not add due to rounding. |
| |
| 1 | | The remaining surplus of $4.2 billion in 2006–07 will be used to reduce federal debt and fund other priorities. |
| |
| 2 | | For planning purposes, federal debt is assumed to be reduced by $3 billion per year. |
| |
| 3 | | These calculations do not reflect the commitment to dedicate interest savings to personal income tax reductions and the reduction of the GST to 5 per cent. |
38
Table 2.3 summarizes the Government’s fiscal projections for the current and the next five years.
Budgetary revenues are expected to increase by $7.2 billion in 2006–07, $8.6 billion in 2007–08, $7.4 billion in 2008–09 and $8.5 billion in 2009–10. Thereafter, revenues increase by $10.7 billion in 2010–11 and $12.2 billion in 2011–12. This takes into account the measures announced since the budget, including tax reductions announced in the Tax Fairness Plan.
In 2005–06, program expenses fell $1.1 billion, the first decline in nine years. With this decline, program expenses in 2005–06 were $3.9 billion lower than projected in the May 2006 budget. Reflecting the Government’s diligent approach to expenditure management, program expenses in 2006–07 and 2007–08 are also projected to be lower than estimated in the budget by $1.2 billion and $0.5 billion respectively. This takes into account the cost of measures announced since the budget, including the Canada-United States Softwood Lumber Agreement, where the federal government acts as a financial intermediary, with incremental spending offset by additional revenues.
From 2008–09 to 2011–12, growth in program expenses is expected to average 3.9 per cent, well below average GDP growth over that period.
The increase in interest rates over the past year is expected to raise public debt charges by $0.8 billion in 2006–07. Thereafter, public debt charges are expected to remain relatively unchanged over the five-year horizon.
Accounting for planned annual debt reduction of $3 billion, the reduction of the GST to 5 per cent and the commitment to dedicate interest savings to personal income tax reductions (see box on interest savings from debt reduction) leaves a planning surplus of $4.2 billion in
2006–07, $3.5 billion in 2007–08, $2.4 billion in 2008–09 and $2.0 billion in 2009–10. The planning surplus rises in the following two years, to $3.6 billion and $2.9 billion. These surpluses are available for new spending and debt and tax reduction initiatives.
39

Interest Savings From Debt Reduction
| • | | To ensure that Canadians benefit directly from reductions in the federal debt, the Government will dedicate the effective interest savings from debt reduction each year to personal income tax reductions. |
| • | | The effective interest savings resulting from debt reduction will be calculated as the annual reduction in federal debt multiplied by the average effective interest rate on the Government’s unmatured debt, currently 5 per cent. |
| • | | Annual reductions in the federal debt are reflected in both decreases in the Government’s interest-bearing debt, which directly reduce interest costs, as well as increases in the Government’s net assets. Most of these net assets generate immediate returns or can be converted to cash in the future to pay down interest-bearing debt. |
| • | | The commitment will apply to debt reduction for 2005–06 and subsequent fiscal years. Combined with the interest savings from the $13.2-billion surplus realized in 2005–06, the Government’s planned debt reduction of $3 billion per year will create room for personal income tax reductions of about $800 million in 2007–08, rising to $1.4 billion per year by 2011–12. |
40
Revenue Ratio Declining Due to Tax Reductions
A useful perspective on movements in tax revenues can be obtained by examining the revenue ratio—total revenues collected by the federal government in relation to total income in the economy (GDP). This ratio can be thought of as a proxy for the overall federal “tax burden” imposed on the economy.
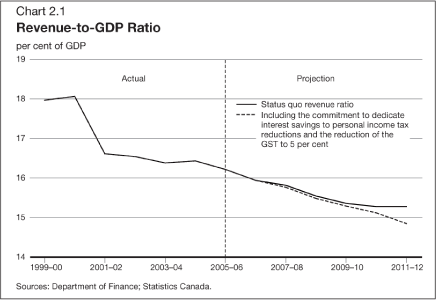
The status quo revenue ratio is projected to decline from 16.2 per cent in 2005–06 to 15.9 per cent in 2006–07, reflecting the impact of tax reduction measures, principally the 1-percentage-point reduction to the GST rate. Over the medium term, revenues are projected to grow more slowly than the economy, reflecting the ongoing implementation of tax reduction measures, including the reductions announced in the Tax Fairness Plan and increases to the basic personal amount. The commitment to dedicate interest savings to personal income tax reductions and the reduction of the GST to 5 per cent would lower the revenue ratio further to 14.8 per cent by 2011–12.
41

New Tax Reduction Measures Since Budget 2006
Since Budget 2006, the Government has demonstrated that tax relief is a priority by announcing and committing to tax reductions, totalling $22.2 billion over six years, that will benefit all Canadians.
| • | | The Tax Fairness Plan, announced on October 31, will reduce taxes by restoring balance and fairness to the federal tax system. Under this Plan, the Government will: |
| | – | | Enhance the age credit by increasing it by $1,000 to $5,066, effective January 1, 2006. |
| |
| | – | | Introduce a new mechanism for pension income splitting by allowing Canadian residents to allocate to their resident spouse (or common-law partner) up to one-half of income qualifying for the existing pension income tax credit. |
| |
| | – | | Introduce a distribution tax on distributions from publicly traded income trusts and limited partnerships. |
| |
| | – | | Reduce the general corporate income tax rate by one-half percentage point, to 18.5 per cent, beginning in 2011. |
| • | | In addition, the employment insurance (EI) premium rate will be reduced in 2007 to $1.80 per $100 of insurable earnings, from $1.87 in 2006. This premium rate is forecast by the Human Resources and Social Development (HRSD) Chief Actuary to generate just enough premium revenue in 2007 to cover EI program costs for that year. The HRSD Chief Actuary has also calculated the maximum insurable earnings (MIE) for 2007 as being $40,000, up $1,000 from its 2006 level. Taking into account the additional contributions associated with the rise in the MIE, the reduction in the rate will save employers and employees $420 million compared to the 2006 premium rate and MIE. |
| • | | To ensure that Canadians benefit directly from reductions in the federal debt, the Government will dedicate the effective interest savings from debt reduction each year to personal income tax reductions. Combined with the interest savings from the $13.2-billion surplus realized in 2005–06, the Government’s planned debt reduction of $3 billion per year will create room for personal income tax reductions of about $800 million in 2007–08, rising to $1.4 billion per year by 2011–12. |
| • | | In addition, the Government will reduce the GST rate to 5 per cent starting no later than January 1, 2011, leading to additional savings for Canadians of about $7.9 billion. |
| | | | | | | | | | | | | | | | | | | | | | | | | | | | | |
| | | 2006–07 | | | 2007–08 | | | 2008–09 | | | 2009–10 | | | 2010–11 | | | 2011–12 | | | Total | |
| | | (millions of dollars) | |
| Tax Fairness Plan | | | 570 | | | | 1,020 | | | | 1,065 | | | | 1,105 | | | | 1,240 | | | | 1,545 | | | | 6,545 | |
| EI premiums | | | 125 | | | | 420 | | | | 420 | | | | 420 | | | | 420 | | | | 420 | | | | 2,225 | |
| Interest savings | | | | | | | 810 | | | | 960 | | | | 1,110 | | | | 1,260 | | | | 1,410 | | | | 5,550 | |
| GST | | | | | | | | | | | | | | | | | | | 1,500 | | | | 6,370 | | | | 7,870 | |
| | | |
| Total tax relief commitments since Budget 2006 | | | 695 | | | | 2,250 | | | | 2,445 | | | | 2,635 | | | | 4,420 | | | | 9,745 | | | | 22,190 | |
42
Program Expenses-to-GDP Ratio Lower Than Projected in Budget 2006
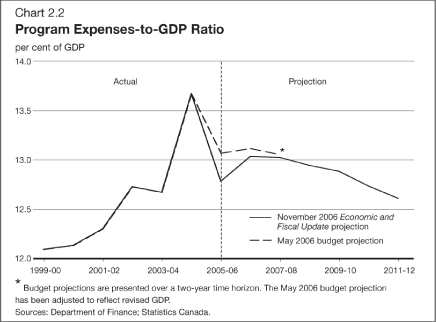
Following unsustainable increases between 1999–2000 and 2004–05, program expenses as a share of GDP declined significantly in 2005–06 to 12.8 per cent from 13.7 per cent in 2004–05. For 2006–07 and 2007–08, program expenses as a percentage of GDP are lower than projected in Budget 2006, reflecting tight control over the implementation of programs announced in the 2006 and previous budgets. In 2008–09 and beyond, program expenses are projected to decline as a proportion of GDP on a status quo basis.
In some years, growth in program expenses may exceed the rate of growth of the economy, for example because economic growth is lower than expected or because unforeseen factors require a temporary increase in spending. In general, and as a matter of principle, the Government is committed to keeping the growth of program expenses below the growth of the economy over the medium term. The Government took an important step in meeting this objective in 2005–06, when program expenses fell for the first time in nine years. To the extent spending growth is kept below the growth in the economy, this will contribute to further reductions in public debt and in taxes given the commitment to dedicate interest savings to tax reductions.
43
Debt-to-GDP Ratio Falling
The federal debt-to-GDP ratio (accumulated deficit) stood at 38.3 per cent in 2004–05. As a result of the $13.2-billion surplus in 2005–06 the ratio dropped to 35.1 per cent, its lowest level in 24 years. For planning purposes, federal debt is assumed to be reduced by $3 billion each year. Taking into account planned debt reduction, along with the projected growth of the economy, the debt-to-GDP ratio is expected to fall to 25.6 per cent in 2011–12, on target to meeting the new medium-term objective of 25 per cent by 2012–13. This will bring the federal debt burden to its lowest level since the late 1970s and will contribute towards the elimination of total government net debt in less than a generation.
This goal of eliminating total government net debt can be achieved by 2021 if provincial-territorial governments maintain balanced budgets and the Canada Pension Plan/Quebec Pension Plan continue to build assets as currently projected. For its part, Canada’s New Government will continue to plan for an annual debt reduction of $3 billion. Any surpluses recorded by provincial-territorial governments and federal surpluses in excess of $3 billion will contribute to accelerate the elimination of Canada’s total government net debt.
44
The falling debt burden is expected to result in declines in the share of revenues devoted to public debt charges. To ensure that Canadians benefit directly from reductions in the federal debt, the Government will dedicate the effective interest savings from debt reduction each year to personal income tax reductions.
Federal Debt (Accumulated Deficit) and Total
Government Net Debt
Federal Debt (Accumulated Deficit)
Since 2002–03, the financial statements of the Government of Canada have been presented on a full accrual basis of accounting. Under the previous accounting standard—modified accrual accounting—net debt and the accumulated deficit were identical. Under the new standard, net debt now includes a comprehensive costing for financial liabilities but excludes non-financial assets. The accumulated deficit includes both. It is the sum of all surpluses and deficits in the past.
Federal debt, referred to in the budget documents and in the Annual Financial Report of the Government of Canada , is the accumulated deficit. It is the federal government’s main measure of debt, as annual changes in this measure correspond to the budgetary balance.
Total Government Net Debt
The full impact of public debt on the economy includes not only the federal government’s debt, but also debt of provincial-territorial and local governments, and the assets of the Canada Pension Plan and Quebec Pension Plan. That is why a standard measure of debt used by organizations such as the Organisation for Economic Co-operation and Development (OECD) is total government net debt.
The OECD definition of total government net debt allows for comparisons across countries. It is calculated on a National Accounts basis. As such, the OECD definition is not directly comparable to federal debt (accumulated deficit) and excludes government employee unfunded pension liabilities, which are fully accounted for in federal debt (accumulated deficit). The annex contains more details.
45
Outlook for Budgetary Revenues
Table 2.4
Revenue Outlook
| | | | | | | | | | | | | | | | | | | | | | | | | | | | | |
| | | Actual | | | Projection | |
| | | 2005–06 | | | 2006–07 | | | 2007–08 | | | 2008–09 | | | 2009–10 | | | 2010–11 | | | 2011–12 | |
| | | (millions of dollars) | |
Tax revenues | | | | | | | | | | | | | | | | | | | | | | | | | | | | |
Income tax | | | | | | | | | | | | | | | | | | | | | | | | | | | | |
| Personal income tax | | | 103,691 | | | | 111,630 | | | | 117,390 | | | | 123,355 | | | | 129,260 | | | | 136,850 | | | | 144,405 | |
| Corporate income tax | | | 31,724 | | | | 32,780 | | | | 35,005 | | | | 33,890 | | | | 33,720 | | | | 33,690 | | | | 35,400 | |
| Other income tax | | | 4,529 | | | | 4,340 | | | | 4,315 | | | | 4,545 | | | | 4,680 | | | | 4,655 | | | | 4,420 | |
| | | |
| Total income tax | | | 139,944 | | | | 148,750 | | | | 156,710 | | | | 161,790 | | | | 167,660 | | | | 175,195 | | | | 184,225 | |
Excise taxes/duties | | | | | | | | | | | | | | | | | | | | | | | | | | | | |
| Goods and services tax | | | 33,020 | | | | 30,970 | | | | 30,895 | | | | 32,150 | | | | 33,595 | | | | 35,320 | | | | 37,005 | |
| Customs import duties | | | 3,330 | | | | 3,530 | | | | 3,710 | | | | 3,885 | | | | 4,045 | | | | 4,195 | | | | 4,360 | |
| Other excise taxes/ duties | | | 9,806 | | | | 10,165 | | | | 10,245 | | | | 10,205 | | | | 10,235 | | | | 10,050 | | | | 9,915 | |
| | | |
| Total excise taxes/ duties | | | 46,156 | | | | 44,665 | | | | 44,850 | | | | 46,240 | | | | 47,875 | | | | 49,565 | | | | 51,280 | |
| Total tax revenues | | | 186,100 | | | | 193,415 | | | | 201,560 | | | | 208,030 | | | | 215,535 | | | | 224,760 | | | | 235,505 | |
| Employment insurance premium revenues | | | 16,535 | | | | 16,155 | | | | 16,140 | | | | 16,655 | | | | 17,105 | | | | 17,730 | | | | 18,370 | |
| Other revenues | | | 19,568 | | | | 19,860 | | | | 20,335 | | | | 20,745 | | | | 21,280 | | | | 22,110 | | | | 22,925 | |
Total budgetary revenues | | | 222,203 | | | | 229,430 | | | | 238,035 | | | | 245,430 | | | | 253,920 | | | | 264,600 | | | | 276,800 | |
Per cent of GDP | | | | | | | | | | | | | | | | | | | | | | | | | | | | |
| Personal income tax | | | 7.6 | | | | 7.8 | | | | 7.8 | | | | 7.8 | | | | 7.8 | | | | 7.9 | | | | 8.0 | |
| Corporate income tax | | | 2.3 | | | | 2.3 | | | | 2.3 | | | | 2.1 | | | | 2.0 | | | | 1.9 | | | | 2.0 | |
| Goods and services tax | | | 2.4 | | | | 2.2 | | | | 2.1 | | | | 2.0 | | | | 2.0 | | | | 2.0 | | | | 2.0 | |
| Total tax revenues | | | 13.6 | | | | 13.4 | | | | 13.4 | | | | 13.2 | | | | 13.0 | | | | 13.0 | | | | 13.0 | |
| Employment insurance premium revenues | | | 1.2 | | | | 1.1 | | | | 1.1 | | | | 1.1 | | | | 1.0 | | | | 1.0 | | | | 1.0 | |
| Other revenues | | | 1.4 | | | | 1.4 | | | | 1.4 | | | | 1.3 | | | | 1.3 | | | | 1.3 | | | | 1.3 | |
| Total | | | 16.2 | | | | 15.9 | | | | 15.8 | | | | 15.5 | | | | 15.3 | | | | 15.3 | | | | 15.3 | |
| |
Note: Totals may not add due to rounding
46
Table 2.4 provides an overview of the Government’s fiscal projections for budgetary revenues. Budgetary revenues are expected to grow by 3.3 per cent in 2006–07, 3.8 per cent in 2007–08 and 3.1 per cent in 2008–09. Revenue growth averages 4.1 per cent per year in the three years to 2011–12. These growth rates are lower than average growth in the past two years of 5.8 per cent, reflecting the expected slowing in nominal GDP growth and the implementation of tax reduction measures.
Personal income tax revenues—the largest component of budgetary revenues—are projected to increase by $7.9 billion, or 7.7 per cent, in 2006–07, significantly higher than the 4.7-per cent growth in the underlying personal income tax base. This updated projection is consistent with the strong growth in personal income tax revenues recorded last year and through the first half of this fiscal year. The projection incorporates the cost of the recently announced increase in the age credit, retroactive to January 1, 2006, and the introduction of pension income splitting, effective January 1, 2007. In the following three years, personal income tax revenues are projected to grow more in line with GDP, reflecting the impact of tax measures offsetting the upward drift in tax revenues due to projected real income gains.
In 2006–07, corporate income tax revenues are expected to increase 3.3 per cent, following a gain of 5.9 per cent in the previous year. The more modest growth reflects smaller gains in profitability in 2006, the elimination of the corporate capital tax as of January 1, 2006, and the ongoing reduction in the corporate surtax. Absent policy changes, corporate income tax revenues are projected to grow largely in line with profit growth over the remainder of the projection period. From 2008–09 to 2010–11, corporate income tax revenues are projected to decline, reflecting the elimination of the corporate surtax and the legislated reductions in the general tax rate, including the recently announced 0.5-percentage-point reduction in the general corporate income tax rate effective in 2011. The projection of corporate tax revenues reflects the tax on distributions from publicly traded flow-through entities, effective in 2011, introduced under the Government’s Tax Fairness Plan, although this is offset in part by lower personal income taxes and lower non-resident withholding taxes.
47
Other income tax revenues—largely withholding taxes levied on nonresidents—are expected to decline by 4.2 per cent in 2006–07, following a 27.2-per-cent increase last year, which was attributable to strong growth in dividend payments to non-residents. Other income tax revenues are projected to decline by 0.5 per cent in 2010–11 and by 5.0 per cent in 2011–12 with the introduction of the tax on publicly traded flow-through entities under the Tax Fairness Plan. Under the new regime, certain distributions of these entities will be subject to tax, thereby reducing distributions to non-residents.
GST revenues are expected to decline by 6.2 per cent in 2006–07, reflecting the 1-percentage-point reduction in the GST rate, effective July 1, 2006. GST revenues decline by a further 0.2 per cent in 2007–08, the first fiscal year in which the lower GST rate is fully reflected. Thereafter, GST revenues grow in line with the underlying consumption base.
After a decline of 2.0 per cent in 2005–06, other excise taxes and duties are projected to rise 3.7 per cent in 2006–07, largely reflecting the introduction of an export charge on softwood lumber exports to the U.S. effective October 12, 2006, consistent with the Canada-United States Softwood Lumber Agreement. The new export charge is determined in part by the price of softwood lumber, the volume of Canadian exports by region and the border measure that a province selects. The new export charge will have no net impact on the budgetary balance as export charge revenues collected by the Government of Canada, net of the costs of administering the agreement, will be distributed to provincial governments.
EI premium revenues are expected to decline 2.3 per cent in 2006–07, reflecting the decline in the premium rate from $1.95 to $1.87 per $100 of insurable earnings effective January 1, 2006, a further reduction to $1.80 per $100 of insurable earnings in January 2007, as well as the transfer to the province of Quebec of the responsibility for delivering maternity and parental benefits in that province along with the associated premium room, effective January 1, 2006. Consistent with the EI premium rate-setting mechanism, implemented in 2005, EI premiums are assumed to match projected EI program costs in the outer years of the projection.
48
Starting in 2007, insurable earnings covered by EI will increase because of the indexation of annual maximum insurable earnings to the growth in the average industrial wage. In 1996, the maximum level of insurable earnings, or the level of employment income on which EI premiums are payable, under the EI legislation was frozen at $39,000 until the average industrial wage reached that level. This will occur in 2007, with the result that annual maximum insurable earnings will increase to $40,000, rising thereafter in line with the average industrial wage. This change affects future growth in both premium revenues and benefits.
Other revenues include those of consolidated Crown corporations, net gains/losses from enterprise Crown corporations, foreign exchange revenues, returns on investments and proceeds from the sales of goods and services. These revenues are volatile, owing partly to the impact of exchange rate movements on the Canadian-dollar value of foreign-denominated interest-bearing assets and to net gains/losses from enterprise Crown corporations. In 2006–07, other revenues are expected to increase by 1.5 per cent. This weak growth reflects lower expected foreign exchange revenues, which were boosted last year by the change in the accounting treatment of the Government’s subscriptions with the International Monetary Fund.
49
Outlook for Program Expenses
Table 2.5
Program Expenses Outlook
| | | | | | | | | | | | | | | | | | | | | | | | | | | | | |
| | | Actual | | | Projection | |
| | | 2005–06 | | | 2006–07 | | | 2007–08 | | | 2008–09 | | | 2009–10 | | | 2010–11 | | | 2011–12 | |
| | | (millions of dollars) | |
| Major transfers to persons Elderly benefits | | | 28,992 | | | | 30,615 | | | | 32,060 | | | | 33,435 | | | | 34,915 | | | | 36,505 | | | | 38,270 | |
Employment insurance benefits1 | | | 14,417 | | | | 14,375 | | | | 15,075 | | | | 15,565 | | | | 15,980 | | | | 16,560 | | | | 17,150 | |
| Children’s benefits | | | 9,200 | | | | 11,120 | | | | 11,875 | | | | 11,880 | | | | 11,915 | | | | 11,960 | | | | 12,005 | |
| | | |
| Total | | | 52,609 | | | | 56,110 | | | | 59,010 | | | | 60,880 | | | | 62,810 | | | | 65,025 | | | | 67,425 | |
| Major transfers to other levels of government | | | | | | | | | | | | | | | | | | | | | | | | | | | | |
| Federal transfers in support of health and other programs | | | 27,225 | | | | 28,640 | | | | 30,150 | | | | 31,430 | | | | 33,035 | | | | 34,475 | | | | 36,000 | |
| Fiscal arrangements | | | 15,739 | | | | 13,055 | | | | 13,190 | | | | 13,640 | | | | 14,105 | | | | 14,580 | | | | 15,065 | |
| Alternative Payments for Standing Programs | | | -2,731 | | | | -2,870 | | | | -3,010 | | | | -3,165 | | | | -3,325 | | | | -3,525 | | | | -3,750 | |
| Early learning and child care | | | | | | | 650 | | | | | | | | | | | | | | | | | | | | | |
| Canada’s cities and communities | | | 582 | | | | 600 | | | | 800 | | | | 1,000 | | | | 2,000 | | | | 2,000 | | | | 2,000 | |
| | | |
| Total | | | 40,815 | | | | 40,075 | | | | 41,130 | | | | 42,905 | | | | 45,815 | | | | 47,530 | | | | 49,315 | |
| Direct program expenses | | | 81,789 | | | | 91,430 | | | | 95,935 | | | | 100,650 | | | | 104,480 | | | | 108,100 | | | | 111,825 | |
Total program expenses | | | 175,213 | | | | 187,615 | | | | 196,075 | | | | 204,435 | | | | 213,105 | | | | 220,655 | | | | 228,565 | |
Per cent of GDP | | | | | | | | | | | | | | | | | | | | | | | | | | | | |
| Major transfers to persons | | | 3.8 | | | | 3.9 | | | | 3.9 | | | | 3.9 | | | | 3.8 | | | | 3.8 | | | | 3.7 | |
| Major transfers to other levels of government | | | 3.0 | | | | 2.8 | | | | 2.7 | | | | 2.7 | | | | 2.8 | | | | 2.7 | | | | 2.7 | |
| Direct program expenses | | | 6.0 | | | | 6.3 | �� | | | 6.4 | | | | 6.4 | | | | 6.3 | | | | 6.2 | | | | 6.2 | |
| Total program expenses | | | 12.8 | | | | 13.0 | | | | 13.0 | | | | 12.9 | | | | 12.9 | | | | 12.7 | | | | 12.6 | |
| |
Note: Totals may not add due to rounding.
| 1 | | EI benefits include regular, sickness, maternity, parental, compassionate care, fishing and work-sharing benefits, as well as employment benefits and support measures. These represent 90 per cent of total EI program expenses. The remaining EI program costs (amounting to $1.6 billion in 2005–06) relate to administration costs. |
50
Table 2.5 provides an overview of the Government’s projections for program expenses. Program expenses are expected to grow by 7.1 per cent in 2006–07 and 4.5 per cent in 2007–08. This growth reflects both lower expenses in 2005–06 and the slower than anticipated implementation of programs announced in the 2006 and previous budgets. Indeed, for 2006–07 and 2007–08, program expenses are lower than projected in Budget 2006. Growth in the following four years averages 3.9 per cent, well below growth of the economy over that period.
Program expenses consist of three major components: major transfers to persons, major transfers to other levels of government and direct program expenses—the latter includes subsidies and other transfers, as well as National Defence and all other departmental operating expenses.
Major transfers to persons consist of elderly, EI and children’s benefits.
| • | | Elderly benefits grow by $1.6 billion, or 5.6 per cent, in 2006–07, reflecting the $18-per-month increases in the Guaranteed Income Supplement in January 2006 and January 2007. In the following five years, elderly benefits grow by an average of 4.6 per cent per year, reflecting the growth in the elderly population and changes in consumer prices, to which benefits are fully indexed. |
| • | | EI benefits are estimated to decline slightly in 2006–07, reflecting improved labour market conditions as well as the transfer to the province of Quebec of the responsibility for delivering maternity and parental benefits in that province under the new Quebec Parental Insurance Plan starting January 1, 2006. This is partly offset by the first full-year impact of the labour market pilot projects, relating to high-unemployment regions, announced in 2005–06. The projected increase in 2007–08 reflects a rise in the private sector forecast of the number of unemployed (see Chapter 1). Furthermore, starting in 2007, EI benefits are projected to increase because of the indexation of annual maximum insurable earnings to the growth in the average industrial wage in 2007. |
| • | | Children’s benefits, including the Canada Child Tax Benefit (CCTB) and the Universal Child Care Benefit (UCCB), are expected to rise by $1.9 billion in 2006–07 and $0.8 billion in 2007–08, primarily reflecting the introduction of the UCCB on July 1, 2006. Starting in 2008–09, the growth in children’s benefits is largely determined by the growth in the number of children and changes in consumer prices, to which the CCTB is indexed. |
51
Major transfers to other levels of government in 2006–07 are $0.7 billion, or 1.8 per cent, lower than in 2005–06, reflecting one-time payments made to the provinces and territories for post-secondary education infrastructure, public transit and affordable housing. Over the medium term, transfers increase from just over $40 billion in 2006–07 to almost $50 billion in 2011–12, averaging 4.2 per cent growth per year. This growth reflects the impact of rising transfers for health, equalization and Territorial Formula Financing, as well as growing support for cities and communities. For planning purposes, this Update assumes the continuation of support for Canada’s cities and communities of $2 billion for 2010–11 and 2011–12.
Direct program expenses include expenses for National Defence, Crown corporations, transfers administered by departments (for example transfers for farm income support and Aboriginal programming) and departmental operating costs. In 2005–06, direct program expenses declined by 1.6 per cent. For 2006–07 and 2007–08, including measures announced since the May 2006 budget, the total amount of direct program expenses is $1.0 billion and $0.5 billion lower than expected at the time of the budget, reflecting tight control over the implementation of programs announced in the 2006 and previous budgets. For planning purposes, this Update assumes that support for all infrastructure-related projects is maintained through 2011–12. Starting in 2008–09, growth in direct program expenses is projected to average less than 4 per cent per year.
52
Private Sector Five-Year Fiscal Projections
Table 2.6
Private Sector Projections of Underlying
Surplus on a Public Accounts Basis
| | | | | | | | | | | | | | | | | | | | | | | | | |
| | | 2006–07 | | | 2007–08 | | | 2008–09 | | | 2009–10 | | | 2010–11 | | | 2011–12 | |
| | | (billions of dollars) | |
| Conference Board of Canada | | | 5.3 | | | | 4.4 | | | | 7.2 | | | | 7.6 | | | | 10.8 | | | | 15.3 | |
| University of Toronto | | | 7.0 | | | | 4.5 | | | | 5.4 | | | | 6.6 | | | | 9.9 | | | | 13.1 | |
| Global Insight | | | 6.7 | | | | 5.4 | | | | 6.5 | | | | 7.2 | | | | 9.7 | | | | 11.9 | |
| Centre for Spatial Economics | | | 6.9 | | | | 7.6 | | | | 7.9 | | | | 7.2 | | | | 9.5 | | | | 13.8 | |
| | | |
| Average of private sector projections | | | 6.5 | | | | 5.5 | | | | 6.8 | | | | 7.2 | | | | 10.0 | | | | 13.5 | |
| Range of private sector projections | | | 1.7 | | | | 3.2 | | | | 2.5 | | | | 0.9 | | | | 1.3 | | | | 3.5 | |
| Government projection based on private sector economic assumptions | | | 7.2 | | | | 7.3 | | | | 6.4 | | | | 6.1 | | | | 9.4 | | | | 13.7 | |
| Difference between government projection and the average of private sector projections | | | 0.7 | | | | 1.8 | | | | -0.4 | | | | -1.1 | | | | -0.6 | | | | 0.2 | |
| |
Note: Numbers may not add due to rounding.
To provide context for the Government’s fiscal projections, four private sector organizations developed their own fiscal projections. The four organizations are the Conference Board of Canada, the Institute for Policy Analysis of the University of Toronto, Global Insight and the Centre for Spatial Economics.
Under the new approach, the four organizations each provided their own fiscal projections on both a National Accounts and a Public Accounts basis. The process involved three key steps.
| • | | Each of the four private sector forecasters developed projections of the federal budget balance on a National Accounts basis, based on their own economic forecasts and on tax and spending policies in place at the time of the May 2006 budget. |
| • | | These projections were then translated to a Public Accounts basis. The conversions were largely prepared by the Department of Finance, subject to review and approval by the private sector organizations. |
| • | | Finally, the Department of Finance adjusted the private sector Public Accounts projections to reflect the cost of initiatives announced since the budget and the updated projection of direct program expenses. |
53
These figures can be directly compared to the Government’s projection of the underlying surplus presented in Table 2.3. For reference, the projections on a National Accounts basis prepared by each organization are provided at the end of this chapter.
The four private sector organizations prepared their fiscal projections based on information publicly available as of the end of September. In preparing its fiscal projections, the Government had access to financial results for August and September 2006, which were not available to the four private sector organizations when they completed their projections.
Table 2.6 presents the four private sector forecasting organizations’ projections of the underlying surplus. On average, the four private sector organizations project a surplus of $6.5 billion in 2006–07 and $5.5 billion in 2007–08, rising thereafter to $6.8 billion in 2008–09, $7.2 billion in 2009–10, $10.0 billion in 2010–11 and $13.5 billion in 2011–12.
The range between the lowest and highest projection is $1.7 billion in the first year of the planning period. It rises to above $3 billion in 2007–08 and falls to below $3 billion in the following three years. In the last year of the projection, where uncertainty is greatest, the range widens to $3.5 billion. Compared to the sum of revenues and expenses, (over $430 billion in 2005–06 and growing), the range of private sector projections is very small.
When compared to the private sector average, the Government’s projection of the underlying surplus is larger in the first two years but lower in subsequent years, with the exception of 2011–12, when the Government’s projection is slightly higher. In 2006–07 and 2007–08, the Government projects budgetary surpluses that are $0.7 billion and $1.8 billion larger than the private sector average. While underlying assumptions for GDP growth are similar in the Government and private sector fiscal projections, the Government expects a higher tax yield in these years. The higher tax yield in the Government’s projection reflects a view that the conditions that led to a high tax yield in 2005–06 and in the first half of the current fiscal year will persist over the near term.
The differences between the Government’s projection and the average private sector projection are relatively small in relation to combined federal revenues and expenses. In 2007–08, the year in which the difference is largest, the $1.8-billion difference represents 0.4 per cent of the combined revenues and expenses projected by the Government for that year.
54
Given the inherent uncertainty underlying economic and fiscal projections, the differences between the five projections presented are remarkably small. This should not be interpreted as an indication that the underlying uncertainty is negligible. Rather, it should be viewed as a sign that, overall, the various views converge to similar outcomes, in spite of the underlying uncertainty. The following section discusses the risks and uncertainties underlying the fiscal projections.
Risks to the Fiscal Projections
Risks associated with the fiscal projections primarily relate to risks to the Canadian economic outlook and volatility in the relationship between fiscal variables and the underlying activity to which they relate.
Risks to the Canadian Economic Outlook
As detailed in Chapter 1, forecasts of the economic outlook contain an unavoidable level of uncertainty. Key economic concerns for the fiscal projections are provided below.
| • | | Economic developments since September point to lower commodity prices, which could lead to slower than expected nominal GDP growth for the current year. Going forward, a larger than expected decline in commodity prices, which are currently well above their historical levels, would translate into lower than expected Canadian nominal GDP over the medium term and put downward pressure on budgetary revenues. |
| • | | The ongoing correction in the U.S. housing market could be greater than expected, leading to weaker than expected U.S. consumer spending and residential investment. This would have negative implications for Canadian economic growth. |
| • | | Global current account imbalances remain large and continue to pose a medium-term risk to the economic outlook. While several factors could help reduce imbalances, there is a risk that the main channel of adjustment could be a further depreciation of the U.S. dollar against floating currencies such as the Canadian dollar. |
Tables illustrating the sensitivity of the budget balance to a number of economic shocks are provided later in this chapter. These tables are generalized rules of thumb that provide a guide to the impact of changes in economic assumptions on the fiscal projections.
55
Risks to the Fiscal Projections
Even if the economic outlook were known with certainty, there would still be risks associated with the fiscal projections because of the uncertainty in the translation of economic developments into spending and tax revenues. Growth in tax bases does not always translate in a predictable way into tax revenues.
The following are the key near-term risks to the projections.
| • | | Growth in personal income tax revenues was almost twice the rate of growth in the personal income tax base through the first six months of 2006–07, a faster rate of growth relative to the tax base than would normally be expected. The sensitivity of personal income tax revenues to changes in the personal income tax base is summarized by a measure called the income elasticity of personal income tax revenues. This captures the change in tax revenues resulting from a 1-per-cent change in personal income. A 1-per-cent increase in personal income generally translates into an increase of more than 1 per cent in personal income tax revenues, due to the progressivity of the tax system—taxpayers pay progressively higher tax rates as their earned real income rises. In a “normal” year, where income gains are distributed evenly across income groups and all sources of income increase at roughly the same rate, the elasticity is about 1.2. However, in any given year this relationship may not hold. For example, during years when real income gains are particularly strong or capital gains realizations are high, the elasticity will be higher. Conversely, declines in real incomes and capital losses considerably lower the elasticity. In 2001–02, following the stock market correction, the elasticity was just 0.3. Every 0.1-percentage-point change in the elasticity translates into about a $500-million change in revenues. The personal income tax elasticity is assumed to be about 1.8 in 2006–07, before falling to its historical average of 1.2 in 2007–08. Given the recent slowing in nominal GDP growth from unusually high rates of growth in 2004 and 2005, the assumed drop in the personal income tax elasticity is warranted. |
| • | | Corporate income tax revenues for the first six months of 2006–07 are up 11.7 per cent, compared to profit growth of 7.9 per cent. Growth in corporate income tax revenues for a given year can differ substantially from growth in corporate profits for the same year due to provisions in the Income Tax Act that allow corporations to smooth taxable income from year to year by shifting losses backward or forward. In addition, reassessments, which generally pertain to past tax years, may contribute to a divergence between growth in corporate tax revenues and the tax base. |
56
| | | Furthermore, year-to-date profit growth in 2006–07 masks a divergence between very strong profit growth in the energy sector and a decline in manufacturing sector profits. The outcome for corporate income tax revenues in 2006–07 will depend heavily on energy prices and how these will affect profitability in the various sectors of the economy. |
| |
| • | | On the expense side, the extent to which departments and agencies do not fully use all of the resources appropriated by Parliament varies from year to year and can materially affect the fiscal outcome. In addition, during the course of the fiscal year, departments and agencies often incur liabilities for which no payments are made. These liabilities are recognized throughout the year and are updated following the close of the fiscal year as part of the normal year-end accrual adjustments. Changes in estimates of liabilities can be significant. |
Sensitivity of the Budget Balance to Economic Shocks
Changes in economic assumptions affect the size of projected tax bases and expenditures that are sensitive to economic factors, such as EI benefits and public debt charges.
The following tables illustrate the sensitivity of the budget balance to a number of economic shocks:
| | 1. | | A one-year, 1-percentage-point decrease in real GDP growth driven equally by lower productivity and employment growth. |
| |
| | 2. | | A decrease in nominal GDP growth resulting solely from a one-year, 1-percentage-point decrease in the rate of GDP inflation. |
| |
| | 3. | | A sustained 100-basis-point decrease in all interest rates. |
These sensitivities are generalized rules of thumb that assume any decrease in economic activity is proportional across income and expenditure components. EI premium rates are assumed to be fixed during the first calendar year in which the shock occurs, and to adjust for subsequent years, such that EI revenues exactly offset program expenses, consistent with the new EI rate-setting legislation introduced in 2005. Equal and opposite impacts would result from an increase of equal magnitude in real or nominal GDP growth and interest rates.
57
Table 2.7
Estimated Impact of a One-Year, 1-Percentage-Point Decrease in Real GDP Growth on Federal Revenues, Expenses and Budgetary Balance
| | | | | | | | | | | | | |
| | | Year 1 | | | Year 2 | | | Year 5 | |
| | | (billions of dollars) | |
Federal revenues | | | | | | | | | | | | |
| Tax revenues | | | | | | | | | | | | |
| Personal income tax | | | -1.0 | | | | -1.3 | | | | -1.6 | |
| Corporate income tax | | | -0.4 | | | | -0.4 | | | | -0.5 | |
| Goods and services tax | | | -0.3 | | | | -0.3 | | | | -0.4 | |
| Other tax revenues | | | -0.2 | | | | -0.2 | | | | -0.2 | |
| | | |
| Total tax revenues | | | -1.9 | | | | -2.3 | | | | -2.7 | |
| Employment insurance premium revenues | | | -0.1 | | | | 0.7 | | | | 0.8 | |
| Other revenues | | | 0.0 | | | | 0.0 | | | | 0.0 | |
| Total budgetary revenues | | | -2.1 | | | | -1.6 | | | | -1.8 | |
Federal expenses | | | | | | | | | | | | |
| Major transfers to persons | | | | | | | | | | | | |
| Elderly benefits | | | 0.0 | | | | 0.0 | | | | 0.0 | |
| Employment insurance benefits | | | 0.6 | | | | 0.6 | | | | 0.8 | |
| | | |
| Total | | | 0.6 | | | | 0.6 | | | | 0.8 | |
| Other program expenses | | | -0.1 | | | | -0.1 | | | | -0.3 | |
| Public debt charges | | | 0.0 | | | | 0.1 | | | | 0.4 | |
| Total expenses | | | 0.6 | | | | 0.7 | | | | 0.9 | |
Budgetary balance | | | -2.6 | | | | -2.2 | | | | -2.7 | |
| |
| | |
| Note: | | Totals may not add due to rounding. |
A 1-percentage-point decrease in real GDP growth reduces the budgetary balance by $2.6 billion in the first year, $2.2 billion in the second year and $2.7 billion in the fifth year.
Tax revenues from all sources fall by a total of $1.9 billion in the first year, $2.3 billion in the second year and $2.7 billion by the fifth year. Personal income tax revenues decrease as employment and wages and salaries fall. Furthermore, due to the progressivity of the tax system, as individuals earn lower real incomes, they pay proportionally less of their income in taxes. Corporate income tax revenues fall as output and profits decrease. GST revenues decrease as a result of lower consumer spending associated with the fall in employment and personal income.
58
Since EI premium rates for a given year are set based on projections carried out in October of the previous year, EI premium revenues decline marginally in the first year of the shock (reflecting lower wages and salaries), but rise thereafter, reflecting the upward adjustment to the break-even rate necessary to meet increased program costs. For the purpose of the simulations, it is assumed that EI premium rates are increased as a result of the weaker economy. This is consistent with the legislation governing rate setting. However, the legislation also provides the Government with the option to leave rates unchanged if it believes this to be appropriate.
Expenses rise, mainly reflecting higher EI benefits (due to an increase in the level of unemployment) and higher public debt charges (reflecting a higher stock of debt due to the lower budgetary balance).
Table 2.8
Estimated Impact of a One-Year, 1-Percentage-Point Decrease in GDP Inflation on Federal Revenues, Expenses and Budgetary Balance
| | | | | | | | | | | | | |
| | | Year 1 | | | Year 2 | | | Year 5 | |
| | | (billions of dollars) | |
Federal revenues | | | | | | | | | | | | |
| Tax revenues | | | | | | | | | | | | |
| Personal income tax | | | -1.3 | | | | -1.3 | | | | -1.4 | |
| Corporate income tax | | | -0.4 | | | | -0.4 | | | | -0.5 | |
| Goods and services tax | | | -0.3 | | | | -0.3 | | | | -0.4 | |
| Other tax revenues | | | -0.2 | | | | -0.2 | | | | -0.2 | |
| | | |
| Total tax revenues | | | -2.3 | | | | -2.3 | | | | -2.5 | |
| Employment insurance premium revenues | | | -0.1 | | | | -0.1 | | | | -0.1 | |
| Other revenues | | | -0.1 | | | | -0.1 | | | | -0.1 | |
| Total budgetary revenues | | | -2.4 | | | | -2.4 | | | | -2.7 | |
Federal expenses | | | | | | | | | | | | |
| Major transfers to persons | | | | | | | | | | | | |
| Elderly benefits | | | -0.2 | | | | -0.3 | | | | -0.4 | |
| Employment insurance benefits | | | -0.1 | | | | -0.1 | | | | -0.1 | |
| | | |
| Total | | | -0.3 | | | | -0.4 | | | | -0.5 | |
| Other program expenses | | | -0.3 | | | | -0.3 | | | | -0.7 | |
| Public debt charges | | | 0.0 | | | | 0.1 | | | | 0.3 | |
| Total expenses | | | -0.5 | | | | -0.6 | | | | -0.9 | |
Budgetary balance | | | -1.9 | | | | -1.8 | | | | -1.8 | |
| |
| | |
| Note: | | Totals may not add due to rounding. |
59
A 1-percentage-point decrease in nominal GDP growth resulting solely from lower GDP inflation (assuming that the Consumer Price Index moves in line with GDP inflation) lowers the budgetary balance by $1.9 billion in the first year and $1.8 billion in the second and fifth year.
Lower prices result in lower nominal income and, as a result, personal income tax, corporate income tax and GST revenues all decrease, reflecting declines in the underlying nominal tax bases. Compared to the impacts of the real GDP shock, the effects on personal income tax revenues are more pronounced in the initial year, due to the lag with which changes in the inflation rate are reflected in the tax system (tax brackets are indexed to the percentage change in the Consumer Price Index for the 12-month period ending September 30 of the previous year). For the other sources of tax revenue, the negative impacts are similar under either the real or nominal GDP shocks. EI premium revenues decrease marginally in the price shock in response to lower earnings. However, unlike the real GDP shock, EI benefits do not rise since unemployment is unaffected by price changes.
Partly offsetting lower revenues are the declines in the cost of statutory programs that are indexed to inflation, such as elderly benefit payments and the Canada Child Tax Benefit, as well as federal wage and non-wage expenses. Payments under these programs are smaller if inflation is lower. Public debt charges rise due to the higher stock of debt.
Table 2.9
Estimated Impact of a Sustained 100-Basis-Point Decrease in All Interest Rates on Federal Revenues, Expenses and Budgetary Balance
| | | | | | | | | | | | | |
| | | Year 1 | | | Year 2 | | | Year 5 | |
| | | (billions of dollars) | |
| Federal revenues | | | -0.4 | | | | -0.5 | | | | -0.8 | |
| Federal expenses | | | -1.4 | | | | -2.0 | | | | -2.7 | |
| | | |
Budgetary balance | | | 1.0 | | | | 1.5 | | | | 1.8 | |
| |
| | |
| Note: | | Totals may not add due to rounding |
A decrease in interest rates raises the budgetary balance by $1.0 billion in the first year, $1.5 billion in the second and $1.8 billion in the fifth. The improvement stems entirely from decreased expenses associated with public debt charges. The impact on debt charges rises through time as longer-term debt matures and is refinanced at lower rates. Moderating the overall impact is a fall in revenues associated with the decrease in the rate of return on the Government’s interest-bearing assets, which are recorded as part of non-tax revenues.
60
Private Sector National Accounts Projections
Table 2.10
Private Sector Surplus Projections on a National Accounts Basis
| | | | | | | | | | | | | | | | | | | | | | | | | |
| | | 2006–07 | | | 2007–08 | | | 2008–09 | | | 2009–10 | | | 2010–11 | | | 2011–12 | |
| | | (billions of dollars) | |
| Conference Board of Canada | | | -5.5 | | | | -0.6 | | | | 3.0 | | | | 3.5 | | | | 5.9 | | | | 10.9 | |
| University of Toronto | | | -3.8 | | | | -0.5 | | | | 0.9 | | | | 2.1 | | | | 4.4 | | | | 7.7 | |
| Global Insight | | | -3.9 | | | | 0.4 | | | | 2.2 | | | | 3.2 | | | | 4.6 | | | | 7.2 | |
| Centre for Spatial Economics | | | -3.9 | | | | 2.6 | | | | 3.4 | | | | 2.8 | | | | 4.0 | | | | 8.7 | |
| | | |
| Average | | | -4.3 | | | | 0.5 | | | | 2.4 | | | | 2.9 | | | | 4.7 | | | | 8.6 | |
| |
Table 2.10 provides the private sector fiscal projections on a National Accounts basis. The projections are based on their own economic forecasts and on tax and spending policies in place at the time of the May 2006 budget.
�� On average, the four forecasting organizations project a deficit of $4.3 billion in 2006–07. Thereafter, they project a surplus of $0.5 billion in 2007–08 and $2.4 billion in 2008–09, rising to $8.6 billion by 2011–12.
To translate the National Accounts surplus projections to a Public Accounts basis, several adjustments are required. These include adjustments to reflect:
| • | | Differences in the definition of the government sector in the two accounting systems. |
| |
| • | | Inclusion of certain revenues in the Public Accounts that are not accounted for in the National Accounts, such as revenues from asset sales and the impact of revaluations of financial assets, as well as some payables and receivables. |
Making these adjustments and incorporating the cost of initiatives announced since the budget and the updated projection of direct program expenses leads to the fiscal projections on a Public Accounts basis presented in Table 2.6.
61
Annex
Canada’S Financial Performance
IN AN International Context
Summary
This annex reviews Canada’s financial position on a comparable basis with those of the other Group of Seven (G7) countries (United States, United Kingdom, France, Germany, Japan and Italy) as well as several other countries in the Organisation for Economic Co-operation and Development (OECD). For Canada, this includes the federal, provincial-territorial and local government sectors, as well as the Canada Pension Plan (CPP) and the Quebec Pension Plan (QPP).
| | | On a total government, National Accounts basis: |
| |
| • | | Canada is currently the only G7 country in surplus. |
| |
| • | | The OECD expects that Canada will be the only G7 country to record a surplus in both 2006 and 2007. |
| |
| • | | Canada’s debt burden has declined from the second highest to the lowest among G7 countries. |
| |
| • | | Canada’s net debt declined to 30.2 per cent of gross domestic product (GDP) in 2005, compared to an average of 52.7 per cent for the G7.1 The OECD expects Canada’s net debt to continue to decline. |
| |
| • | | While Canada’s net debt is low relative to that of other G7 nations, some OECD countries have moved to net asset positions in recent years. |
| |
| | | This annex also compares the fiscal situation of the federal governments in Canada and the United States: |
| |
| • | | In 2005–06, the Canadian federal government posted a surplus of C$13.2 billion, or 1.0 per cent of GDP, while the U.S. federal government incurred an “on-budget” deficit of US$434 billion, or 3.3 per cent of GDP. |
| |
| • | | For 2006–07, the Canadian federal government is forecasting a surplus of C$4.2 billion, or 0.3 per cent of GDP. On the other hand, the U.S. Administration does not project a return to balanced budgets for at least the next five years. |
| |
| • | | The federal market debt-to-GDP ratio in Canada has been below the U.S. figure since 2003–04, with the gap expected to widen further in coming years. |
| | |
| 1 | | These figures are on a National Accounts basis for the total government sector and as such are not directly comparable to the Government of Canada’s target of reducing its debt burden (accumulated deficit) to 25 per cent of GDP by 2012–13, which is on a Public Accounts basis and covers only the federal government. More details on the breakdown of Canada’s total government net debt by level of government are provided later in this annex. |
64
In 2005, all levels of government contributed to Canada’s total government surplus
| • | | Two important factors need to be taken into account in making international comparisons: differences in accounting methods among countries, which affect the comparability of data, and differences in financial responsibilities among levels of government within countries. |
| |
| • | | For these reasons, international comparisons rely on the standardized System of National Accounts estimates for the total government sector (i.e. the combined national and subnational levels). The OECD produces a complete series of estimates based on this system. |
| |
| • | | According to the OECD, Canada’s total government sector, which includes the federal, provincial-territorial and local governments, as well as the CPP and QPP, recorded a surplus of 1.7 per cent of GDP in 2005. |
65
| • | | The provincial-territorial-local government sector recorded a surplus of 0.7 per cent of GDP compared to 0.4 per cent at the federal level. |
| |
| • | | The combined CPP/QPP sector also recorded a surplus in 2005. This sector has consistently recorded surpluses since the pension reforms of the late 1990s, which ensured partial pre-funding of the Canadian public pension system, placing it on a sustainable path in advance of the aging of the population. |
66
Canada is again expected to be the only G7 country in surplus in 2006 and 2007
| • | | Canada was the only G7 country to record a surplus in 2005. |
| |
| • | | The OECD expects that Canada will continue to be the only G7 country to post a surplus both this year and next. |
| |
| • | | Canada’s surplus is expected to be 2.2 per cent of GDP in 2006 and 1.8 per cent of GDP in 2007, compared to an average deficit of about 3.5 per cent in the G7 countries. |
67
Canada’s debt burden has declined from the second highest to the lowest among G7 countries
| • | | Given Canada’s strong fiscal performance at all levels of government, Canada has had the lowest ratio of total government net financial liabilities to GDP among G7 countries since 2004. |
| |
| • | | Canada’s ratio declined to 30.2 per cent of GDP in 2005 compared to an estimated average of 52.7 per cent for all G7 countries. Canada’s debt burden has dropped by more than 40 percentage points from its peak in 1995, when it was the second highest in the G7. According to the OECD, this ratio is expected to fall further in coming years. |
| |
| • | | In contrast, the debt burdens of all other G7 countries, except the United States, have increased since 1995 and are expected to remain near their current levels for at least the next two years. |
68
However, other major industrialized countries have also significantly reduced their debt burdens or have moved to net asset positions
| • | | Similar to Canada, other OECD countries have significantly reduced their debt levels as a share of GDP over the past decade and some countries, including Australia, New Zealand and Sweden, have recently moved into total government net asset positions. |
| |
| • | | Sweden, which had a total government net debt of 25.9 per cent of GDP in 1995, recorded a net asset position of 12.4 per cent of GDP in 2005. This represents an estimated improvement of more than 38 percentage points, slightly below that of Canada over the same period. Australia and New Zealand, which in 1995 had net debt-to-GDP ratios of 26.5 and 38.1 per cent respectively, recorded modest net asset positions in 2005. |
| |
| • | | Denmark and Ireland have also significantly reduced their debt burdens and have net debt-to-GDP ratios below that of Canada. |
69
The largest portion of Canada’s total government net debt is attributable to the federal government
| • | | Based on the OECD definition of net debt, Canada’s total government net debt was 30.2 per cent of GDP in 2005, most of which reflected debt held at the federal government level. At 25.8 per cent of GDP, federal net debt was more than twice the aggregate net debt of the provincial-territorial and local governments. |
| |
| • | | However, on a Public Accounts basis, the federal debt burden (accumulated deficit) amounted to 35.1 per cent of GDP in 2005–06, almost 10 percentage points higher than the federal net debt calculated using the OECD definition. This discrepancy mainly reflects the exclusion of government employee unfunded pension liabilities from the National Accounts measure of net debt used by the OECD (the Government of Canada fully accounts for these liabilities in its Public Accounts). |
70
| • | | On a total government basis, debt burdens at the three levels of government were partially offset by the significant net assets that are building up in the CPP/QPP to cope with future pressures from population aging. |
71
The federal government in Canada has maintained a budgetary surplus since 1997–98, unlike the U.S.
| • | | There are certain fundamental differences in the accounting practices and expenditure responsibilities of the Canadian and U.S. federal governments. For example, the U.S. federal budgetary balance includes the substantial surpluses in the Social Security system, whereas surpluses in the CPP are not included in the Canadian federal figures. For this reason, the Canadian federal budgetary balance is more comparable with the “on-budget” balance in the U.S. (excluding Social Security). |
| |
| • | | Like the Canadian federal budgetary balance, the U.S. federal on-budget balance moved from large deficits to surpluses in the latter half of the 1990s. However, since 2000–01 the U.S. has returned to deficits whereas Canada has continued to record surpluses. |
72
| • | | The Canadian federal government posted a surplus of C$13.2 billion, or1.0 per cent of GDP, in 2005–06, while the U.S. federal government incurred an on-budget deficit of US$434 billion, or 3.3 per cent of GDP. Even when Social Security surpluses are included, the U.S. “unified budget” deficit was US$248 billion, or 1.9 per cent of GDP, in 2005–06. |
| |
| • | | While the Canadian federal government is forecasting a surplus of C$4.2 billion, or 0.3 per cent of GDP, in 2006–07, the U.S. Administration projects another large deficit for this fiscal year. In fact,the Administration does not project a return to balanced budgets for at least the next five years. |
73
The federal market debt-to-GDP ratio is lower in Canada than in the U.S., and the gap is widening
| • | | For reasons similar to those for the budgetary balance comparisons, Canadian federal market debt (rather than the accumulated deficit) and U.S. federal debt held by the public are the most comparable measures of the federal debt burden in the two countries. |
| |
| • | | As a result of continued surpluses at the federal level in Canada and the deterioration in U.S. federal finances, the federal market debt-to-GDP ratio in Canada fell below the comparable U.S. figure in 2003–04. |
| |
| • | | The Canadian ratio fell to 31.2 per cent in 2005–06, compared to an estimated 37.3 per cent in the U.S. The gap is expected to widen further in coming years. |
74


