UNITED STATES
SECURITIES AND EXCHANGE COMMISSION
Washington, D.C. 20549
FORM N-CSR
CERTIFIED SHAREHOLDER REPORT OF REGISTERED MANAGEMENT
INVESTMENT COMPANIES
Investment Company Act file number: 811-02809
Name of Fund: BlackRock Advantage SMID Cap Fund, Inc. (Formerly BlackRock Advantage U.S. Total Market
Fund, Inc.)
Fund Address: 100 Bellevue Parkway, Wilmington, DE 19809
Name and address of agent for service: John M. Perlowski, Chief Executive Officer, BlackRock Advantage SMID
Cap Fund, Inc. (Formerly BlackRock Advantage U.S. Total Market Fund, Inc.), 55 East 52nd Street,
New York, NY 10055
Registrants’ telephone number, including area code: (800) 441-7762
Date of fiscal year end: 03/31/2021
Date of reporting period: 03/31/2021
| Item 1 – | Report to Stockholders |
(a) The Report to Shareholders is attached herewith.
| | |

| | MARCH 31, 2021 |
BlackRock Advantage SMID Cap Fund, Inc.
|
| Not FDIC Insured • May Lose Value • No Bank Guarantee |
The Markets in Review
Dear Shareholder,
The 12-month reporting period as of March 31, 2021 reflected a remarkable period of disruption and adaptation, as the global economy dealt with the implications of the coronavirus (or “COVID-19”) pandemic. As the period began, the response to the virus’s spread was well underway, and countries around the world instituted economically disruptive countermeasures. Stay-at-home orders and closures of non-essential businesses became widespread, many workers were laid off, and unemployment claims spiked, causing a global recession and a sharp fall in equity prices.
As April 2020 began, stocks were near their lowest point since the beginning of the pandemic. However, a steady recovery began, as businesses started re-opening and governments learned to adapt to life with the virus. Equity prices continued to rise throughout the summer, fed by strong fiscal and monetary support and improving economic indicators. Many equity indices neared or surpassed all-time highs late in the reporting period following the implementation of mass vaccination campaigns and passage of an additional $1.9 trillion of fiscal stimulus. In the United States, both large- and small-capitalization stocks posted a significant advance. International equities also gained, as both developed countries and emerging markets rebounded substantially.
The 10-year U.S. Treasury yield (which is inversely related to bond prices) was near all-time lows as the period began, reflecting a reduced investor appetite for risk. However, inflation concerns from a rapidly expanding economy raised yields late in the reporting period, leading to a negative overall return for most U.S. Treasuries. In the corporate bond market, support from the U.S. Federal Reserve (the “Fed”) assuaged credit concerns and led to positive returns for corporate bonds, particularly high-yield corporates, which gained substantially.
The Fed remained committed to accommodative monetary policy by maintaining near zero interest rates and by announcing that inflation could exceed its 2% target for a sustained period without triggering a rate increase. To stabilize credit markets, the Fed also continued purchasing significant quantities of bonds, as did other influential central banks around the world, including the European Central Bank and the Bank of Japan.
Looking ahead, while coronavirus-related disruptions have clearly hindered worldwide economic growth, we believe that the global expansion will continue to accelerate as vaccination efforts ramp up and pent-up consumer demand leads to higher spending. In early 2021, President Biden signed one of the largest economic rescue packages in U.S. history, which should provide a solid tailwind for economic growth. In our view, inflation is likely to increase somewhat as the expansion continues, but moderate inflation is less likely to be followed by interest rate hikes that could threaten the economic expansion due to the change in Fed policy.
Overall, we favor a positive stance toward risk, with an overweight in equities. We see U.S. and Asian equities outside of Japan benefiting from structural growth trends in technology, while emerging markets should be particularly helped by a vaccine-led economic expansion. While we are neutral overall on credit, rising inflation should provide tailwinds for inflation-protected bonds, and global high-yield and Asian bonds also present attractive opportunities. We believe that international diversification and a focus on sustainability can help provide portfolio resilience, and the disruption created by the coronavirus appears to be accelerating the shift toward sustainable investments.
In this environment, our view is that investors need to think globally, extend their scope across a broad array of asset classes, and be nimble as market conditions change. We encourage you to talk with your financial advisor and visit blackrock.com for further insight about investing in today’s markets.
Sincerely,

Rob Kapito
President, BlackRock Advisors, LLC

Rob Kapito
President, BlackRock Advisors, LLC
| | | | |
| Total Returns as of March 31, 2021 |
| | | 6-Month | | 12-Month |
| | |
U.S. large cap equities
(S&P 500® Index) | | 19.07% | | 56.35% |
| | |
U.S. small cap equities
(Russell 2000® Index) | | 48.05 | | 94.85 |
| | |
International equities
(MSCI Europe, Australasia, Far East Index) | | 20.08 | | 44.57 |
| | |
Emerging market equities (MSCI Emerging Markets Index) | | 22.43 | | 58.39 |
| | |
3-month Treasury bills
(ICE BofA 3-Month U.S. Treasury Bill Index) | | 0.06 | | 0.12 |
| | |
U.S. Treasury securities
(ICE BofA 10-Year U.S. Treasury Index) | | (8.88) | | (8.23) |
| | |
U.S. investment grade bonds (Bloomberg Barclays U.S. Aggregate Bond Index) | | (2.73) | | 0.71 |
| | |
Tax-exempt municipal bonds (S&P Municipal Bond Index) | | 1.46 | | 5.29 |
| | |
U.S. high yield bonds
(Bloomberg Barclays U.S. Corporate High Yield 2% Issuer Capped Index) | | 7.35 | | 23.65 |
|
Past performance is not an indication of future results. Index performance is shown for illustrative purposes only. You cannot invest directly in an index. |
| | |
| 2 | | THIS PAGE IS NOT PART OF YOUR FUND REPORT |
Table of Contents

| | |
| Fund Summary as of March 31, 2021 | | BlackRock Advantage SMID Cap Fund, Inc. |
Investment Objective
BlackRock Advantage SMID Cap Fund, Inc.’s (the “Fund”) (formerly known as BlackRock Advantage U.S. Total Market Fund, Inc.) investment objective is to seek long-term capital appreciation.
On November 11, 2020, the Board of Directors of the Fund (the “Board”) approved a proposal to change the name of BlackRock Advantage U.S. Total Market Fund, Inc. to BlackRock Advantage SMID Cap Fund, Inc. The Board also approved certain changes to the Fund’s investment strategies and the investment adviser has changed the benchmark indices against which the Fund compares its performance. These changes became effective on February 9, 2021.
On March 1, 2021, the Fund ceased to invest in Master Advantage SMID Cap LLC (the “Master LLC”) (formerly known as Master Advantage U.S. Total Market LLC) as part of a “master-feeder” structure and began to operate as a stand-alone fund.
Portfolio Management Commentary
How did the Fund perform?
For the 12-month period ended March 31, 2021, the Fund underperformed its new benchmark, the Russell 2500TM Index as well as its former benchmark, the Russell 3000® Index.
What factors influenced performance?
The Fund delivered mixed results through the sharp market rotations observed during the period. Markets began to recover early in the period from the broad-based selloff in the first quarter of 2020, as the easing of lockdown restrictions, accommodative monetary policy from the Fed, and improving prospects for a COVID-19 vaccine led equities higher throughout the first half of the period. However, in October, the shift in investor attention away from quarterly earnings results to focus on macroeconomic headlines detracted from relative performance early in the period, as the combination of the U.S. election, adverse trends in COVID-19 case counts, and expectations for further fiscal policy support became dominant themes. The market suffered a sharp rotation starting in November as vaccine developers revealed clinical trial data showing strong efficacy in preventing COVID-19. This led to stronger belief in an economic recovery that in turn motivated a robust cyclical rally. The subsequent rotation out of momentum-driven stocks, which had previously led the market, was one of the strongest on record as investors moved toward market laggards. Only later in the period, however, did the rally based on expectations of reflationary economic conditions fully gain steam. Fiscal policy support from the new administration in Washington and aggressive vaccine distribution efforts led to a strong investor preference for cyclical and valuation-based stock exposure as the economy reopened in a more robust manner.
Weakness in trend-based sentiment measures was the primary detractor from performance, most notably during the fourth quarter of 2020. These insights struggled during the sharp rotation away from past market leaders caused by positive vaccine development news. Insights using machine reading of text to evaluate fundamental trends underperformed, as investors focused on macroeconomic events rather than stock-specific fundamentals. Insights that evaluate company conference call transcripts similarly struggled. Losses among trend measures widened in November as momentum-driven styles fell out of favor, and the generic momentum factor continued its weakness through the first quarter of 2021. A style timing insight that evaluates the momentum factor weighed on aggregate performance for the period.
Select sentiment insights seeking to capture COVID-19 related trends, particularly those evaluating work-from-home indicators, also struggled late in the period. In addition to the broader economic reopening trend, several employers made forward-looking comments expressing their desire for employees to return to office work.
By contrast, nontraditional measures of quality, such as environmental, social and governance (“ESG”) related insights, provided much-needed ballast and contributed to relative performance. Specifically, an insight that looks to capture investor flows into ESG-related positions was one of the best-performing insights, as it was able to follow the broader sustainability trend in the market. These proprietary ESG insights continued to demonstrate differentiation and resilience across different market environments. In addition, select sentiment-related insights were also relative contributors. Insights capturing firms most likely to benefit from the economic recovery were the most additive. Measuring mobile app usage and using labor data to evaluate how companies navigated fast-changing consumer habits and the emergence from lockdown proved most effective. The real-time nature of these measures was helpful in tracking the quickly evolving marketplace. Finally, an insight with a preference for lower-volatility stocks was a top contributor for the period amid volatile market conditions.
The change in the Fund’s benchmark from the Russell 3000® Index to the Russell 2500TM Index weighed on performance during the first quarter of 2021. The Russell 3000® Index has a considerable allocation to large-cap stocks, while the Russell 2500TM Index concentrates more on small- and mid-cap stocks. Stocks with smaller market capitalizations soundly outperformed their larger counterparts in the beginning of 2021 due to expectations of a stronger economic recovery. However, this performance difference should normalize in future periods.
| | |
| 4 | | 2 0 2 1 BLACK ROCK ANNUAL REPORT TO SHAREHOLDERS |
| | |
| Fund Summary as of March 31, 2021 (continued) | | BlackRock Advantage SMID Cap Fund, Inc. |
Describe recent portfolio activity.
The Fund maintained a balanced allocation of risk across all major drivers of return during the period. However, there were several new stock selection insights added to the Fund. The Fund built upon its existing alternative data capabilities by adding an insight capturing brand sentiment from consumers, most notably around retail names. Additionally, given the dynamic nature of the current market environment, the Fund instituted enhanced signal constructs to identify emerging trends, such as “work-from-home,” vaccine development, and the resulting impact on economic reopening.
Describe portfolio positioning at period end.
As the Fund changed its benchmark during the period, this move resulted in a shift in primary exposure to stocks with lower primary market capitalizations. Relative to the Russell 2500TM Index, the Fund’s positioning remained largely sector neutral. The Fund maintained slight overweight positions to consumer discretionary and industrial stocks, and maintained slight underweight positions in the consumer staples and utility sectors.
The views expressed reflect the opinions of BlackRock as of the date of this report and are subject to change based on changes in market, economic or other conditions. These views are not intended to be a forecast of future events and are no guarantee of future results.
| | |
| Fund Summary as of March 31, 2021 (continued) | | BlackRock Advantage SMID Cap Fund, Inc. |
TOTAL RETURN BASED ON A $10,000 INVESTMENT
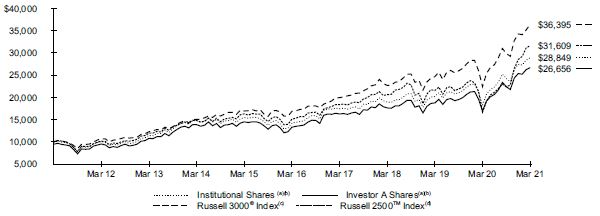
| | (a) | Assuming maximum sales charges, if any, transaction costs and other operating expenses, including investment advisory fees and administration fees, if any. Institutional Shares do not have a sales charge. | |
| | (b) | Under normal circumstances, the Fund seeks to invest at least 80% of its net assets, plus the amount of any borrowings for investment purposes, in equity securities of U.S. small and medium capitalization companies, and derivatives that have similar economic characteristics to such securities. The Fund primarily intends to invest in equity securities or other financial instruments that are components of, or have characteristics similar to, the securities included in the Russell 2500™ Index. The Fund’s total returns for the period between December 15, 2017 and February 8, 2021 are the returns of the Fund when it followed different investment strategies under the name “BlackRock Advantage U.S. Total Market Fund, Inc.” The Fund’s total returns for the period prior to December 15, 2017 are the returns of the Fund when it followed a different investment objective and different investment strategies under the name “BlackRock Value Opportunities Fund, Inc.” | |
| | (c) | A float-adjusted, market capitalization–weighted index of the 3,000 largest U.S. companies based on total market capitalization that represents about 98% of the investable U.S. equity market. | |
| | (d) | An index that measures the performance of the small to mid-cap segment of the U.S. equity universe. | |
Performance Summary for the Period Ended March 31, 2021
| | | | | | | | | | | | | | | | | | | | | | | | | | | | |
| | | | | | Average Annual Total Returns(a)(b) | |
| | | | | | 1 Year | | | 5 Years | | | 10 Years | |
| | | 6-Month Total Returns | | | Without Sales Charge | | | With Sales Charge | | | Without Sales Charge | | | With Sales Charge | | | Without Sales Charge | | | With Sales Charge | |
Institutional | | | 19.25 | % | | | 58.11 | % | | | N/A | | | | 15.23 | % | | | N/A | | | | 11.18 | % | | | N/A | |
Investor A | | | 19.10 | | | | 57.69 | | | | 49.42 | % | | | 14.94 | | | | 13.71 | % | | | 10.90 | | | | 10.30 | % |
Investor C | | | 18.67 | | | | 56.51 | | | | 55.51 | | | | 14.06 | | | | 14.06 | | | | 10.15 | | | | 10.15 | |
Class K | | | 19.26 | | | | 58.16 | | | | N/A | | | | 15.25 | | | | N/A | | | | 11.19 | | | | N/A | |
Class R | | | 18.91 | | | | 57.23 | | | | N/A | | | | 14.63 | | | | N/A | | | | 10.58 | | | | N/A | |
Russell 3000® Index | | | 21.96 | | | | 62.53 | | | | N/A | | | | 16.64 | | | | N/A | | | | 13.79 | | | | N/A | |
Russell 2500TM Index | | | 41.33 | | | | 89.40 | | | | N/A | | | | 15.93 | | | | N/A | | | | 12.20 | | | | N/A | |
| | (a) | Assuming maximum sales charges, if any. Average annual total returns with and without sales charges reflect reductions for distribution and service fees. See “About Fund Performance” for a detailed description of share classes, including any related sales charges and fees, and how performance was calculated for certain share classes. | |
| | (b) | Under normal circumstances, the Fund seeks to invest at least 80% of its net assets, plus the amount of any borrowings for investment purposes, in equity securities of U.S. small and medium capitalization companies, and derivatives that have similar economic characteristics to such securities. The Fund primarily intends to invest in equity securities or other financial instruments that are components of, or have characteristics similar to, the securities included in the Russell 2500™ Index. The Fund’s total returns for the period between December 15, 2017 and February 8, 2021 are the returns of the Fund when it followed different investment strategies under the name “BlackRock Advantage U.S. Total Market Fund, Inc.” The Fund’s total returns for the period prior to December 15, 2017 are the returns of the Fund when it followed a different investment objective and different investment strategies under the name “BlackRock Value Opportunities Fund, Inc.” | |
N/A - Not applicable as share class and index do not have a sales charge.
Past performance is not an indication of future results.
Performance results may include adjustments made for financial reporting purposes in accordance with U.S. generally accepted accounting principles.
| | |
| 6 | | 2 0 2 1 BLACK ROCK ANNUAL REPORT TO SHAREHOLDERS |
| | |
| Fund Summary as of March 31, 2021 (continued) | | BlackRock Advantage SMID Cap Fund, Inc. |
Expense Example
| | | | | | | | | | | | | | | | | | | | | | | | | | | | |
| | | Actual | | | Hypothetical(a) | | | | |
| | | | | | | |
| | |
| Beginning
Account Value (10/01/20) |
| |
| Ending
Account Value (03/31/21) |
| |
| Expenses
Paid During the Period |
(b) | |
| Beginning
Account Value (10/01/20) |
| |
| Ending
Account Value (03/31/21) |
| |
| Expenses
Paid During the Period |
(b) | |
| Annualized
Expense Ratio |
|
Institutional | | | $ 1,000.00 | | | | $ 1,192.50 | | | | $ 2.62 | | | | $ 1,000.00 | | | | $ 1,022.54 | | | | $ 2.42 | | | | 0.48 | % |
Investor A | | | 1,000.00 | | | | 1,191.00 | | | | 3.99 | | | | 1,000.00 | | | | 1,021.29 | | | | 3.68 | | | | 0.73 | |
Investor C | | | 1,000.00 | | | | 1,186.70 | | | | 8.05 | | | | 1,000.00 | | | | 1,017.57 | | | | 7.43 | | | | 1.48 | |
Class K | | | 1,000.00 | | | | 1,192.60 | | | | 2.35 | | | | 1,000.00 | | | | 1,022.79 | | | | 2.17 | | | | 0.43 | |
Class R | | | 1,000.00 | | | | 1,189.10 | | | | 5.35 | | | | 1,000.00 | | | | 1,020.05 | | | | 4.93 | | | | 0.98 | |
| | (a) | Hypothetical 5% annual return before expenses is calculated by prorating the number of days in the most recent fiscal half year divided by 365. | |
| | (b) | For each class of the Fund, expenses are equal to the annualized expense ratio for the class, multiplied by the average account value over the period, multiplied by 182/365 (to reflect the one-half year period shown). Because the Fund invested all of its assets in the Master LLC prior to March 1, 2021, the expense examples reflect the net expenses of both the Fund and the Master LLC in which it invested for a portion of the period. | |
See “Disclosure of Expenses” for further information on how expenses were calculated.
Portfolio Information
TEN LARGEST HOLDINGS
| | | | |
| | |
| Security(a) | | Percent of Net Assets | |
| |
Reliance Steel & Aluminum Co. | | | 1 | % |
| |
SiteOne Landscape Supply, Inc. | | | 1 | |
| |
Voya Financial, Inc. | | | 1 | |
| |
Bruker Corp. | | | 1 | |
| |
Kilroy Realty Corp. | | | 1 | |
| |
HubSpot, Inc. | | | 1 | |
| |
Timken Co. | | | 1 | |
| |
Zendesk, Inc. | | | 1 | |
| |
Bank of Hawaii Corp. | | | 1 | |
| |
HB Fuller Co. | | | 1 | |
SECTOR ALLOCATION
| | | | |
| | |
| Sector(b) | | Percent of Net Assets | |
| |
Industrials | | | 17 | % |
| |
Information Technology | | | 16 | |
| |
Financials | | | 15 | |
| |
Consumer Discretionary | | | 14 | |
| |
Health Care | | | 14 | |
| |
Real Estate | | | 7 | |
| |
Materials | | | 5 | |
| |
Energy | | | 3 | |
| |
Consumer Staples | | | 2 | |
| |
Communication Services | | | 2 | |
| |
Utilities | | | 2 | |
| |
Short-Term Securities | | | 3 | |
| (a) | Excludes short-term investments. |
| (b) | For Fund compliance purposes, the Fund’s sector classifications refer to one or more of the sector sub-classifications used by one or more widely recognized market indexes or ratings group indexes, and/or as defined by the investment adviser. These definitions may not apply for purposes of this report, which may combine such sector sub-classifications for reporting ease. |
About Fund Performance
Institutional and Class K Shares are not subject to any sales charge. These shares bear no ongoing distribution or service fees and are available only to certain eligible investors. Class K Shares performance shown prior to the Class K Shares inception date of January 25, 2018 is that of Institutional Shares. The performance of the Fund’s Class K Shares would be substantially similar to Institutional Shares because Class K Shares and Institutional Shares invest in the same portfolio of securities and performance would only differ to the extent that Class K Shares and Institutional Shares have different expenses. The actual returns of Class K Shares would have been higher than those of the Institutional Shares because Class K Shares have lower expenses than the Institutional Shares.
Investor A Shares are subject to a maximum initial sales charge (front-end load) of 5.25% and a service fee of 0.25% per year (but no distribution fee). Certain redemptions of these shares may be subject to a contingent deferred sales charge (“CDSC”) where no initial sales charge was paid at the time of purchase. These shares are generally available through financial intermediaries.
Investor C Shares are subject to a 1.00% CDSC if redeemed within one year of purchase. In addition, these shares are subject to a distribution fee of 0.75% per year and a service fee of 0.25% per year. These shares are generally available through financial intermediaries. These shares automatically convert to Investor A Shares after approximately eight years.
Class R Shares are not subject to any sales charge. These shares are subject to a distribution fee of 0.25% per year and a service fee of 0.25% per year. These shares are available only to certain employer-sponsored retirement plans.
Past performance is not an indication of future results. Financial markets have experienced extreme volatility and trading in many instruments has been disrupted. These circumstances may continue for an extended period of time, and may continue to affect adversely the value and liquidity of the fund’s investments. As a result, current performance may be lower or higher than the performance data quoted. Refer to blackrock.com to obtain performance data current to the most recent month-end. Performance results do not reflect the deduction of taxes that a shareholder would pay on Fund distributions or the redemption of Fund shares. Figures shown in the performance table on the previous page assume reinvestment of all distributions, if any, at net asset value (“NAV”) on the ex-dividend date or payable date, as applicable. Investment return and principal value of shares will fluctuate so that shares, when redeemed, may be worth more or less than their original cost. Distributions paid to each class of shares will vary because of the different levels of service, distribution and transfer agency fees applicable to each class, which are deducted from the income available to be paid to shareholders.
BlackRock Advisors, LLC (the “Manager”), the Fund’s investment adviser, has contractually and/or voluntarily agreed to waive and/or reimburse a portion of the Fund’s expenses. Without such waiver(s) and/or reimbursement(s), the Fund’s performance would have been lower. With respect to the Fund’s voluntary waiver(s), if any, the Manager is under no obligation to waive and/or reimburse or to continue waiving and/or reimbursing its fees and such voluntary waiver(s) may be reduced or discontinued at any time. With respect to the Fund’s contractual waiver(s), if any, the Manager is under no obligation to continue waiving and/or reimbursing its fees after the applicable termination date of such agreement. See the Notes to Financial Statements for additional information on waivers and/or reimbursements.
Disclosure of Expenses
Shareholders of the Fund may incur the following charges: (a) transactional expenses, such as sales charges; and (b) operating expenses, including administration fees, service and distribution fees, including 12b-1 fees, acquired fund fees and expenses, and other fund expenses. The expense example shown on the previous page (which is based on a hypothetical investment of $1,000 invested on October 1, 2020 and held through March 31, 2021) is intended to assist shareholders both in calculating expenses based on an investment in the Fund and in comparing these expenses with similar costs of investing in other mutual funds.
The expense example provides information about actual account values and actual expenses. In order to estimate the expenses a shareholder paid during the period covered by this report, shareholders can divide their account value by $1,000 and then multiply the result by the number corresponding to their share class under the heading entitled “Expenses Paid During the Period.”
The expense example also provides information about hypothetical account values and hypothetical expenses based on the Fund’s actual expense ratio and an assumed rate of return of 5% per year before expenses. In order to assist shareholders in comparing the ongoing expenses of investing in the Fund and other funds, compare the 5% hypothetical example with the 5% hypothetical examples that appear in shareholder reports of other funds.
The expenses shown in the expense example are intended to highlight shareholders’ ongoing costs only and do not reflect transactional expenses, such as sales charges, if any. Therefore, the hypothetical example is useful in comparing ongoing expenses only, and will not help shareholders determine the relative total expenses of owning different funds. If these transactional expenses were included, shareholder expenses would have been higher.
Derivative Financial Instruments
The Fund may invest in various derivative financial instruments. These instruments are used to obtain exposure to a security, commodity, index, market, and/or other assets without owning or taking physical custody of securities, commodities and/or other referenced assets or to manage market, equity, credit, interest rate, foreign currency exchange rate, commodity and/or other risks. Derivative financial instruments may give rise to a form of economic leverage and involve risks, including the imperfect correlation between the value of a derivative financial instrument and the underlying asset, possible default of the counterparty to the transaction or illiquidity of the instrument. The Fund’s successful use of a derivative financial instrument depends on the investment adviser’s ability to predict pertinent market movements accurately, which cannot be assured. The use of these instruments may result in losses greater than if they had not been used, may limit the amount of appreciation the Fund can realize on an investment and/or may result in lower distributions paid to shareholders. The Fund’s investments in these instruments, if any, are discussed in detail in the Notes to Financial Statements.
| | |
| 8 | | 2 0 2 1 BLACK ROCK ANNUAL REPORT TO SHAREHOLDERS |
| | |
Schedule of Investments March 31, 2021 | | BlackRock Advantage SMID Cap Fund, Inc. (Percentages shown are based on Net Assets) |
| | | | | | | | |
| Security | | Shares | | | Value | |
| |
| | |
Common Stocks | | | | | | | | |
| | |
Aerospace & Defense — 1.1% | | | | | | | | |
Aerojet Rocketdyne Holdings, Inc. | | | 4,237 | | | $ | 198,970 | |
Astronics Corp.(a) | | | 13,185 | | | | 237,857 | |
Axon Enterprise, Inc.(a) | | | 7,320 | | | | 1,042,514 | |
Cubic Corp. | | | 1,573 | | | | 117,299 | |
Maxar Technologies, Inc. | | | 3,314 | | | | 125,335 | |
Mercury Systems, Inc.(a) | | | 35,346 | | | | 2,497,195 | |
PAE, Inc.(a) | | | 3,689 | | | | 33,275 | |
| | | | | | | | |
| | |
| | | | | | | 4,252,445 | |
| | |
| Air Freight & Logistics — 0.2% | | | | | | |
Echo Global Logistics, Inc.(a) | | | 1,544 | | | | 48,497 | |
Hub Group, Inc., Class A(a) | | | 7,787 | | | | 523,909 | |
| | | | | | | | |
| | |
| | | | | | | 572,406 | |
| | |
| Airlines — 0.3% | | | | | | |
Mesa Air Group, Inc.(a) | | | 10,925 | | | | 146,941 | |
Spirit Airlines, Inc.(a) | | | 13,713 | | | | 506,010 | |
United Airlines Holdings, Inc.(a)(b) | | | 10,084 | | | | 580,233 | |
| | | | | | | | |
| | |
| | | | | | | 1,233,184 | |
| | |
| Auto Components — 0.8% | | | | | | |
BorgWarner, Inc. | | | 52,489 | | | | 2,433,390 | |
Cooper-Standard Holdings, Inc.(a) | | | 8,966 | | | | 325,645 | |
Fox Factory Holding Corp.(a) | | | 1,776 | | | | 225,659 | |
| | | | | | | | |
| | |
| | | | | | | 2,984,694 | |
| | |
| Automobiles — 0.1% | | | | | | |
Winnebago Industries, Inc. | | | 7,234 | | | | 554,920 | |
| | | | | | | | |
| | |
| Banks — 5.7% | | | | | | |
Amerant Bancorp, Inc.(a) | | | 6,531 | | | | 121,281 | |
Bancorp, Inc.(a) | | | 14,046 | | | | 291,033 | |
Bank of Hawaii Corp. | | | 44,956 | | | | 4,023,112 | |
Bank of Princeton | | | 941 | | | | 26,931 | |
Bank OZK | | | 7,038 | | | | 287,502 | |
BankFinancial Corp. | | | 6,721 | | | | 69,361 | |
C&F Financial Corp. | | | 798 | | | | 35,343 | |
Capital City Bank Group, Inc. | | | 1,564 | | | | 40,695 | |
CIT Group, Inc. | | | 903 | | | | 46,513 | |
Citizens & Northern Corp. | | | 2,187 | | | | 52,007 | |
Comerica, Inc. | | | 3,294 | | | | 236,312 | |
Eagle Bancorp Montana, Inc. | | | 1,756 | | | | 42,706 | |
First Busey Corp. | | | 2,855 | | | | 73,231 | |
First Business Financial Services, Inc. | | | 1,681 | | | | 41,571 | |
First Hawaiian, Inc. | | | 73,888 | | | | 2,022,315 | |
First Interstate BancSystem, Inc., Class A | | | 45,559 | | | | 2,097,536 | |
First Northwest Bancorp | | | 4,537 | | | | 75,405 | |
First Western Financial, Inc.(a) | | | 61 | | | | 1,526 | |
Heartland Financial USA, Inc. | | | 11,844 | | | | 595,279 | |
Heritage Commerce Corp. | | | 38,113 | | | | 465,741 | |
HomeTrust Bancshares, Inc. | | | 7,666 | | | | 186,667 | |
Independent Bank Corp. | | | 13,562 | | | | 320,606 | |
Investar Holding Corp. | | | 1,354 | | | | 27,825 | |
Lakeland Bancorp, Inc. | | | 9,674 | | | | 168,618 | |
Level One Bancorp, Inc. | | | 6,954 | | | | 179,274 | |
Macatawa Bank Corp. | | | 10,241 | | | | 101,898 | |
Mercantile Bank Corp. | | | 5,359 | | | | 174,007 | |
Mid Penn Bancorp, Inc. | | | 293 | | | | 7,855 | |
Midland States Bancorp, Inc. | | | 13,230 | | | | 367,000 | |
Oak Valley Bancorp | | | 837 | | | | 14,355 | |
OceanFirst Financial Corp. | | | 16,669 | | | | 399,056 | |
Peapack-Gladstone Financial Corp. | | | 3,906 | | | | 120,617 | |
Pinnacle Financial Partners, Inc. | | | 7,388 | | | | 655,020 | |
PNC Financial Services Group, Inc. | | | 880 | | | | 154,361 | |
| | | | | | | | |
| Security | | Shares | | | Value | |
| |
| | |
| Banks (continued) | | | | | | |
Popular, Inc. | | | 527 | | | $ | 37,059 | |
Republic Bancorp, Inc., Class A | | | 1,949 | | | | 86,321 | |
Republic First Bancorp, Inc.(a) | | | 62,158 | | | | 234,336 | |
SVB Financial Group(a) | | | 1,351 | | | | 666,935 | |
TriState Capital Holdings, Inc.(a) | | | 10,789 | | | | 248,794 | |
Truist Financial Corp. | | | 26,859 | | | | 1,566,417 | |
U.S. Bancorp | | | 14,173 | | | | 783,909 | |
Umpqua Holdings Corp. | | | 76,375 | | | | 1,340,381 | |
United Security Bancshares | | | 1,779 | | | | 14,570 | |
Wells Fargo & Co. | | | 22,879 | | | | 893,882 | |
Wintrust Financial Corp. | | | 25,459 | | | | 1,929,792 | |
| | | | | | | | |
| | |
| | | | | | | 21,324,955 | |
| | |
| Beverages — 0.1% | | | | | | |
Brown-Forman Corp., Class B | | | 2,031 | | | | 140,078 | |
NewAge, Inc.(a) | | | 11,190 | | | | 32,003 | |
Primo Water Corp. | | | 12,852 | | | | 208,974 | |
| | | | | | | | |
| | |
| | | | | | | 381,055 | |
| | |
| Biotechnology — 4.0% | | | | | | |
ACADIA Pharmaceuticals, Inc.(a) | | | 24,144 | | | | 622,915 | |
Affimed NV(a) | | | 39,391 | | | | 311,583 | |
Agios Pharmaceuticals, Inc.(a) | | | 1,368 | | | | 70,644 | |
Akouos, Inc.(a) | | | 2,192 | | | | 30,403 | |
Alector, Inc.(a) | | | 5,742 | | | | 115,644 | |
Amicus Therapeutics, Inc.(a) | | | 8,035 | | | | 79,386 | |
Applied Therapeutics, Inc.(a) | | | 3,395 | | | | 63,673 | |
Arcus Biosciences, Inc.(a) | | | 8,300 | | | | 233,064 | |
Arcutis Biotherapeutics, Inc.(a) | | | 4,617 | | | | 133,570 | |
Atara Biotherapeutics, Inc.(a) | | | 6,527 | | | | 93,728 | |
Avidity Biosciences, Inc.(a) | | | 4,099 | | | | 89,399 | |
Beyondspring, Inc.(a) | | | 12,040 | | | | 133,283 | |
BioCryst Pharmaceuticals, Inc.(a) | | | 10,493 | | | | 106,714 | |
Biogen, Inc.(a) | | | 1,478 | | | | 413,470 | |
Black Diamond Therapeutics, Inc.(a) | | | 11,601 | | | | 281,440 | |
Bluebird Bio, Inc.(a) | | | 8,586 | | | | 258,868 | |
Bridgebio Pharma, Inc.(a) | | | 1,950 | | | | 120,120 | |
C4 Therapeutics, Inc.(a) | | | 1,407 | | | | 52,045 | |
Cabaletta Bio, Inc.(a) | | | 2,897 | | | | 32,157 | |
Dynavax Technologies Corp.(a) | | | 6,313 | | | | 62,057 | |
Editas Medicine, Inc.(a) | | | 3,825 | | | | 160,650 | |
Emergent BioSolutions, Inc.(a) | | | 9,735 | | | | 904,479 | |
Enochian Biosciences, Inc.(a) | | | 11,004 | | | | 38,954 | |
Foghorn Therapeutics, Inc.(a) | | | 5,132 | | | | 67,640 | |
Frequency Therapeutics, Inc.(a) | | | 1,318 | | | | 12,521 | |
G1 Therapeutics, Inc.(a) | | | 8,819 | | | | 212,185 | |
Galera Therapeutics, Inc.(a) | | | 5,796 | | | | 51,121 | |
Global Blood Therapeutics, Inc.(a) | | | 974 | | | | 39,690 | |
GlycoMimetics, Inc.(a) | | | 8,547 | | | | 25,726 | |
Gossamer Bio, Inc.(a) | | | 532 | | | | 4,921 | |
Halozyme Therapeutics, Inc.(a) | | | 15,285 | | | | 637,232 | |
Humanigen, Inc.(a) | | | 6,089 | | | | 116,300 | |
Ideaya Biosciences, Inc.(a) | | | 3,823 | | | | 89,840 | |
Infinity Pharmaceuticals, Inc.(a) | | | 9,578 | | | | 30,937 | |
Inovio Pharmaceuticals, Inc.(a) | | | 9,407 | | | | 87,297 | |
Inozyme Pharma, Inc.(a) | | | 3,382 | | | | 66,964 | |
Invitae Corp.(a) | | | 8,400 | | | | 320,964 | |
Ionis Pharmaceuticals, Inc.(a) | | | 3,612 | | | | 162,395 | |
Karyopharm Therapeutics, Inc.(a) | | | 30,723 | | | | 323,206 | |
MacroGenics, Inc.(a) | | | 13,204 | | | | 420,547 | |
Metacrine, Inc.(a) | | | 10,531 | | | | 65,292 | |
Mirum Pharmaceuticals, Inc.(a) | | | 8,195 | | | | 162,425 | |
Moderna, Inc.(a) | | | 1,137 | | | | 148,890 | |
Natera, Inc.(a) | | | 13,547 | | | | 1,375,562 | |
| | |
SCHEDULE OF INVESTMENTS | | 9 |
| | |
Schedule of Investments (continued) March 31, 2021 | | BlackRock Advantage SMID Cap Fund, Inc. (Percentages shown are based on Net Assets) |
| | | | | | | | |
| Security | | Shares | | | Value | |
| |
| | |
| Biotechnology (continued) | | | | | | |
NextCure, Inc.(a) | | | 13,482 | | | $ | 134,955 | |
Novavax, Inc.(a) | | | 3,657 | | | | 663,051 | |
Oncorus, Inc.(a) | | | 2,294 | | | | 31,932 | |
OPKO Health, Inc.(a) | | | 19,982 | | | | 85,723 | |
Organogenesis Holdings, Inc.(a) | | | 9,558 | | | | 174,147 | |
Oyster Point Pharma, Inc.(a) | | | 2,997 | | | | 54,785 | |
Passage Bio, Inc.(a) | | | 10,196 | | | | 178,226 | |
PMV Pharmaceuticals, Inc.(a) | | | 4,170 | | | | 137,151 | |
Poseida Therapeutics, Inc.(a) | | | 25,143 | | | | 240,116 | |
Puma Biotechnology, Inc.(a) | | | 4,939 | | | | 48,007 | |
Sage Therapeutics, Inc.(a) | | | 3,634 | | | | 272,005 | |
Sana Biotechnology, Inc.(a) | | | 12,610 | | | | 422,057 | |
Seres Therapeutics, Inc.(a) | | | 8,435 | | | | 173,677 | |
Solid Biosciences, Inc.(a) | | | 10,839 | | | | 59,940 | |
Spruce Biosciences, Inc.(a) | | | 690 | | | | 11,454 | |
SQZ Biotechnologies Co.(a) | | | 1,031 | | | | 14,104 | |
Sutro Biopharma, Inc.(a) | | | 9,302 | | | | 211,713 | |
Taysha Gene Therapies, Inc.(a) | | | 4,256 | | | | 86,397 | |
Twist Bioscience Corp.(a) | | | 942 | | | | 116,676 | |
Ultragenyx Pharmaceutical, Inc.(a) | | | 7,980 | | | | 908,603 | |
UroGen Pharma Ltd.(a) | | | 2,783 | | | | 54,213 | |
Veracyte, Inc.(a) | | | 15,698 | | | | 843,767 | |
Vertex Pharmaceuticals, Inc.(a) | | | 4,280 | | | | 919,729 | |
Vincerx Pharma, Inc.(a) | | | 7,676 | | | | 148,147 | |
Vir Biotechnology, Inc.(a) | | | 3,180 | | | | 163,039 | |
X4 Pharmaceuticals, Inc.(a) | | | 10,064 | | | | 86,651 | |
| | | | | | | | |
| | |
| | | | | | | 15,070,166 | |
| | |
| Building Products — 2.0% | | | | | | |
A O Smith Corp. | | | 932 | | | | 63,012 | |
Allegion PLC | | | 2,700 | | | | 339,174 | |
Fortune Brands Home & Security, Inc. | | | 1,158 | | | | 110,959 | |
Lennox International, Inc. | | | 10,640 | | | | 3,315,318 | |
Resideo Technologies, Inc.(a) | | | 6,175 | | | | 174,444 | |
Trex Co., Inc.(a) | | | 39,035 | | | | 3,573,264 | |
| | | | | | | | |
| | |
| | | | | | | 7,576,171 | |
| | |
| Capital Markets — 2.0% | | | | | | |
Ameriprise Financial, Inc. | | | 1,701 | | | | 395,398 | |
Ares Management Corp., Class A | | | 13,279 | | | | 744,022 | |
AssetMark Financial Holdings, Inc.(a) | | | 10,791 | | | | 251,862 | |
B Riley Financial, Inc. | | | 7,479 | | | | 421,666 | |
Bank of New York Mellon Corp. | | | 6,436 | | | | 304,358 | |
Cowen, Inc., Class A | | | 4,233 | | | | 148,790 | |
Donnelley Financial Solutions, Inc.(a) | | | 6,631 | | | | 184,541 | |
Hamilton Lane, Inc., Class A | | | 19,688 | | | | 1,743,569 | |
Houlihan Lokey, Inc. | | | 1,475 | | | | 98,102 | |
Invesco Ltd. | | | 55,811 | | | | 1,407,553 | |
Moelis & Co., Class A | | | 3,236 | | | | 177,592 | |
Morningstar, Inc. | | | 4,080 | | | | 918,163 | |
State Street Corp. | | | 3,912 | | | | 328,647 | |
Virtus Investment Partners, Inc. | | | 1,981 | | | | 466,526 | |
| | | | | | | | |
| | |
| | | | | | | 7,590,789 | |
| | |
| Chemicals — 2.3% | | | | | | |
Amyris, Inc.(a) | | | 4,530 | | | | 86,523 | |
Axalta Coating Systems Ltd.(a) | | | 103,537 | | | | 3,062,624 | |
Hawkins, Inc. | | | 2,260 | | | | 75,755 | |
HB Fuller Co. | | | 60,680 | | | | 3,817,379 | |
Livent Corp.(a) | | | 52,729 | | | | 913,266 | |
Trinseo SA | | | 10,404 | | | | 662,423 | |
| | | | | | | | |
| | |
| | | | | | | 8,617,970 | |
|
| Commercial Services & Supplies — 1.4% | |
ABM Industries, Inc. | | | 25,868 | | | | 1,319,527 | |
| | | | | | | | |
| Security | | Shares | | | Value | |
| |
|
| Commercial Services & Supplies (continued) | |
Brink’s Co. | | | 1,422 | | | $ | 112,665 | |
Cimpress PLC(a) | | | 2,302 | | | | 230,499 | |
Herman Miller, Inc. | | | 21,279 | | | | 875,631 | |
IAA, Inc.(a) | | | 18,637 | | | | 1,027,644 | |
Kimball International, Inc., Class B | | | 11,278 | | | | 157,892 | |
Matthews International Corp., Class A | | | 5,080 | | | | 200,914 | |
MSA Safety, Inc. | | | 3,511 | | | | 526,720 | |
Quad/Graphics, Inc. | | | 13,209 | | | | 46,628 | |
Steelcase, Inc., Class A | | | 13,162 | | | | 189,401 | |
Tetra Tech, Inc. | | | 4,270 | | | | 579,525 | |
VSE Corp. | | | 2,520 | | | | 99,540 | |
| | | | | | | | |
| | |
| | | | | | | 5,366,586 | |
| | |
| Communications Equipment — 0.1% | | | | | | |
Applied Optoelectronics, Inc.(a) | | | 7,689 | | | | 64,280 | |
Calix, Inc.(a) | | | 9,016 | | | | 312,495 | |
Casa Systems, Inc.(a) | | | 8,689 | | | | 82,806 | |
| | | | | | | | |
| | |
| | | | | | | 459,581 | |
| | |
| Construction & Engineering — 1.7% | | | | | | |
Ameresco, Inc., Class A(a) | | | 3,784 | | | | 184,016 | |
EMCOR Group, Inc. | | | 20,142 | | | | 2,259,126 | |
MasTec, Inc.(a) | | | 15,343 | | | | 1,437,639 | |
MYR Group, Inc.(a) | | | 2,240 | | | | 160,541 | |
Primoris Services Corp. | | | 7,980 | | | | 264,377 | |
Quanta Services, Inc. | | | 2,859 | | | | 251,535 | |
Tutor Perini Corp.(a) | | | 9,681 | | | | 183,455 | |
WillScot Mobile Mini Holdings Corp.(a) | | | 54,085 | | | | 1,500,859 | |
| | | | | | | | |
| | |
| | | | | | | 6,241,548 | |
| | |
| Construction Materials — 0.3% | | | | | | |
U.S. Concrete, Inc.(a) | | | 13,968 | | | | 1,024,134 | |
| | | | | | | | |
| | |
| Consumer Finance — 1.0% | | | | | | |
Ally Financial, Inc. | | | 81,799 | | | | 3,698,133 | |
| | | | | | | | |
| | |
| Containers & Packaging — 0.4% | | | | | | |
Sealed Air Corp. | | | 34,461 | | | | 1,579,003 | |
| | | | | | | | |
| | |
| Distributors — 0.8% | | | | | | |
Pool Corp. | | | 8,710 | | | | 3,007,040 | |
| | | | | | | | |
| | |
| Diversified Consumer Services — 2.1% | | | | | | |
Bright Horizons Family Solutions, Inc.(a) | | | 11,973 | | | | 2,052,771 | |
Chegg, Inc.(a) | | | 32,204 | | | | 2,758,595 | |
Franchise Group, Inc. | | | 4,238 | | | | 153,034 | |
frontdoor, Inc.(a) | | | 4,524 | | | | 243,165 | |
H&R Block, Inc. | | | 99,490 | | | | 2,168,882 | |
Strategic Education, Inc. | | | 1,909 | | | | 175,456 | |
Terminix Global Holdings, Inc.(a) | | | 10,420 | | | | 496,721 | |
| | | | | | | | |
| | |
| | | | | | | 8,048,624 | |
| | |
| Diversified Financial Services — 1.9% | | | | | | |
Jefferies Financial Group, Inc. | | | 86,092 | | | | 2,591,369 | |
Voya Financial, Inc. | | | 69,487 | | | | 4,422,153 | |
| | | | | | | | |
| | |
| | | | | | | 7,013,522 | |
|
| Diversified Telecommunication Services — 0.0% | |
Radius Global Infrastructure, Inc.,
Class A(a)(b) | | | 9,953 | | | | 146,309 | |
| | | | | | | | |
| | |
| Electric Utilities — 0.7% | | | | | | |
Alliant Energy Corp. | | | 17,441 | | | | 944,604 | |
Eversource Energy | | | 6,279 | | | | 543,699 | |
IDACORP, Inc. | | | 6,148 | | | | 614,615 | |
Pinnacle West Capital Corp. | | | 6,685 | | | | 543,825 | |
Spark Energy, Inc., Class A | | | 13,344 | | | | 142,514 | |
| | | | | | | | |
| | |
| | | | | | | 2,789,257 | |
| | |
| 10 | | 2 0 2 1 BLACK ROCK ANNUAL REPORT TO SHAREHOLDERS |
| | |
Schedule of Investments (continued) March 31, 2021 | | BlackRock Advantage SMID Cap Fund, Inc. (Percentages shown are based on Net Assets) |
| | | | | | | | |
| Security | | Shares | | | Value | |
| | |
| Electrical Equipment — 2.0% | | | | | | |
Acuity Brands, Inc. | | | 8,797 | | | $ | 1,451,505 | |
Bloom Energy Corp., Class A(a)(b) | | | 5,764 | | | | 155,916 | |
Generac Holdings, Inc.(a) | | | 3,546 | | | | 1,161,138 | |
Hubbell, Inc. | | | 10,513 | | | | 1,964,774 | |
Plug Power, Inc.(a) | | | 23,802 | | | | 853,064 | |
Sunrun, Inc.(a) | | | 22,252 | | | | 1,345,801 | |
TPI Composites, Inc.(a) | | | 10,419 | | | | 587,944 | |
| | | | | | | | |
| | |
| | | | | | | 7,520,142 | |
|
| Electronic Equipment, Instruments & Components — 2.9% | |
Avnet, Inc. | | | 24,866 | | | | 1,032,188 | |
Benchmark Electronics, Inc. | | | 9,687 | | | | 299,522 | |
Cognex Corp. | | | 11,220 | | | | 931,148 | |
ePlus, Inc.(a) | | | 2,598 | | | | 258,865 | |
FARO Technologies, Inc.(a) | | | 5,687 | | | | 492,324 | |
Insight Enterprises, Inc.(a) | | | 10,754 | | | | 1,026,147 | |
Jabil, Inc. | | | 25,534 | | | | 1,331,853 | |
National Instruments Corp. | | | 54,476 | | | | 2,352,546 | |
OSI Systems, Inc.(a) | | | 994 | | | | 95,523 | |
PAR Technology Corp.(a) | | | 5,764 | | | | 377,023 | |
ScanSource, Inc.(a) | | | 11,774 | | | | 352,631 | |
SYNNEX Corp. | | | 20,578 | | | | 2,363,177 | |
| | | | | | | | |
| | |
| | | | | | | 10,912,947 | |
|
| Energy Equipment & Services — 0.8% | |
Newpark Resources, Inc.(a) | | | 49,018 | | | | 153,917 | |
Oceaneering International, Inc.(a) | | | 42,881 | | | | 489,701 | |
Schlumberger NV | | | 75,551 | | | | 2,054,232 | |
Seadrill Ltd.(a) | | | 74 | | | | 15 | |
TechnipFMC PLC | | | 16,921 | | | | 130,630 | |
U.S. Silica Holdings, Inc.(a) | | | 23,696 | | | | 291,224 | |
| | | | | | | | |
| | |
| | | | | | | 3,119,719 | |
| | |
| Entertainment — 0.4% | | | | | | |
Chicken Soup For The Soul Entertainment,
Inc.(a) | | | 1,730 | | | | 41,624 | |
Gaia, Inc.(a) | | | 3,340 | | | | 39,713 | |
IMAX Corp.(a) | | | 9,951 | | | | 200,015 | |
Lions Gate Entertainment Corp., Class A(a) | | | 8,515 | | | | 127,299 | |
Lions Gate Entertainment Corp., Class B(a) | | | 33,218 | | | | 428,512 | |
LiveXLive Media, Inc.(a) | | | 15,930 | | | | 69,136 | |
Zynga, Inc., Class A(a) | | | 43,326 | | | | 442,359 | |
| | | | | | | | |
| | |
| | | | | | | 1,348,658 | |
|
| Equity Real Estate Investment Trusts (REITs) — 6.7% | |
Alexander & Baldwin, Inc. | | | 33,593 | | | | 564,026 | |
Alpine Income Property Trust, Inc. | | | 6,880 | | | | 119,437 | |
Apartment Investment and Management Co., Class A | | | 315,773 | | | | 1,938,846 | |
Boston Properties, Inc. | | | 12,006 | | | | 1,215,728 | |
Braemar Hotels & Resorts, Inc.(a) | | | 72,159 | | | | 438,005 | |
Brixmor Property Group, Inc. | | | 8,749 | | | | 176,992 | |
Broadstone Net Lease, Inc. | | | 33,713 | | | | 616,948 | |
Clipper Realty, Inc. | | | 6,618 | | | | 52,415 | |
Colony Capital, Inc.(a) | | | 212,816 | | | | 1,379,048 | |
CorEnergy Infrastructure Trust, Inc. | | | 20,185 | | | | 142,708 | |
CorePoint Lodging, Inc.(a) | | | 62,550 | | | | 564,827 | |
Equity LifeStyle Properties, Inc. | | | 3,057 | | | | 194,547 | |
Equity Residential | | | 8,768 | | | | 628,052 | |
First Industrial Realty Trust, Inc. | | | 48,213 | | | | 2,207,673 | |
Kilroy Realty Corp. | | | 63,985 | | | | 4,199,336 | |
Macerich Co. | | | 67,831 | | | | 793,623 | |
One Liberty Properties, Inc. | | | 8,286 | | | | 184,529 | |
Outfront Media, Inc.(a) | | | 25,486 | | | | 556,359 | |
Postal Realty Trust, Inc., Class A | | | 4,165 | | | | 71,555 | |
QTS Realty Trust, Inc., Class A | | | 13,725 | | | | 851,499 | |
Regency Centers Corp. | | | 26,427 | | | | 1,498,675 | |
| | | | | | | | |
| Security | | Shares | | | Value | |
|
| Equity Real Estate Investment Trusts (REITs) (continued) | |
Retail Value, Inc. | | | 41,881 | | | $ | 783,594 | |
Rexford Industrial Realty, Inc. | | | 33,061 | | | | 1,666,274 | |
RPT Realty | | | 7,953 | | | | 90,744 | |
Seritage Growth Properties, Class A(a) | | | 21,392 | | | | 392,543 | |
Simon Property Group, Inc. | | | 8,343 | | | | 949,183 | |
Terreno Realty Corp. | | | 973 | | | | 56,210 | |
VICI Properties, Inc. | | | 67,150 | | | | 1,896,316 | |
Welltower, Inc. | | | 12,716 | | | | 910,847 | |
| | | | | | | | |
| | |
| | | | | | | 25,140,539 | |
|
| Food & Staples Retailing — 0.8% | |
Albertsons Cos., Inc., Class A | | | 67,557 | | | | 1,288,312 | |
Chefs’ Warehouse, Inc.(a)(b) | | | 14,726 | | | | 448,554 | |
Performance Food Group Co.(a) | | | 9,042 | | | | 520,910 | |
Rite Aid Corp.(a) | | | 18,174 | | | | 371,840 | |
Sysco Corp. | | | 2,246 | | | | 176,850 | |
United Natural Foods, Inc.(a) | | | 3,430 | | | | 112,984 | |
| | | | | | | | |
| | |
| | | | | | | 2,919,450 | |
|
| Food Products — 0.7% | |
Beyond Meat, Inc.(a) | | | 2,219 | | | | 288,736 | |
Bunge Ltd. | | | 4,730 | | | | 374,947 | |
Freshpet, Inc.(a) | | | 1,347 | | | | 213,917 | |
JM Smucker Co. | | | 3,094 | | | | 391,484 | |
McCormick & Co., Inc. | | | 1,449 | | | | 129,193 | |
Mission Produce, Inc.(a) | | | 2,342 | | | | 44,522 | |
Seneca Foods Corp., Class A(a) | | | 3,599 | | | | 169,477 | |
Vital Farms, Inc.(a) | | | 39,810 | | | | 869,450 | |
| | | | | | | | |
| | |
| | | | | | | 2,481,726 | |
|
| Gas Utilities — 0.5% | |
Brookfield Infrastructure Corp., Class A | | | 5,055 | | | | 386,050 | |
New Jersey Resources Corp. | | | 22,495 | | | | 896,876 | |
Southwest Gas Holdings, Inc. | | | 7,400 | | | | 508,454 | |
| | | | | | | | |
| | |
| | | | | | | 1,791,380 | |
|
| Health Care Equipment & Supplies — 2.9% | |
Accuray, Inc.(a) | | | 28,307 | | | | 140,120 | |
Alphatec Holdings, Inc.(a) | | | 15,866 | | | | 250,524 | |
Cantel Medical Corp.(a) | | | 2,220 | | | | 177,245 | |
CONMED Corp. | | | 2,452 | | | | 320,207 | |
DENTSPLY SIRONA, Inc. | | | 1,457 | | | | 92,971 | |
Envista Holdings Corp.(a) | | | 21,211 | | | | 865,409 | |
Globus Medical, Inc., Class A(a) | | | 11,982 | | | | 738,930 | |
Heska Corp.(a) | | | 4,268 | | | | 718,987 | |
Hill-Rom Holdings, Inc. | | | 24,182 | | | | 2,671,627 | |
Inogen, Inc.(a) | | | 850 | | | | 44,642 | |
Natus Medical, Inc.(a) | | | 8,137 | | | | 208,389 | |
Nevro Corp.(a) | | | 14,461 | | | | 2,017,309 | |
Novocure Ltd.(a) | | | 7,600 | | | | 1,004,568 | |
OraSure Technologies, Inc.(a) | | | 4,364 | | | | 50,928 | |
Penumbra, Inc.(a) | | | 1,636 | | | | 442,669 | |
Quidel Corp.(a) | | | 3,952 | | | | 505,579 | |
Tandem Diabetes Care, Inc.(a) | | | 6,556 | | | | 578,567 | |
| | | | | | | | |
| | |
| | | | | | | 10,828,671 | |
|
| Health Care Providers & Services — 1.3% | |
1Life Healthcare, Inc.(a) | | | 20,890 | | | | 816,381 | |
AMN Healthcare Services, Inc.(a) | | | 2,396 | | | | 176,585 | |
Anthem, Inc. | | | 5,112 | | | | 1,834,953 | |
Cardinal Health, Inc. | | | 13,416 | | | | 815,022 | |
Henry Schein, Inc.(a) | | | 1,624 | | | | 112,446 | |
Innovage Holding Corp.(a) | | | 9,544 | | | | 246,140 | |
LHC Group, Inc.(a) | | | 1,440 | | | | 275,342 | |
Owens & Minor, Inc. | | | 1,675 | | | | 62,963 | |
| | |
SCHEDULE OF INVESTMENTS | | 11 |
| | |
Schedule of Investments (continued) March 31, 2021 | | BlackRock Advantage SMID Cap Fund, Inc. (Percentages shown are based on Net Assets) |
| | | | | | | | |
| Security | | Shares | | | Value | |
|
| Health Care Providers & Services (continued) | |
Patterson Cos., Inc. | | | 20,368 | | | $ | 650,758 | |
SOC Telemed, Inc.(a) | | | 6,466 | | | | 40,671 | |
| | | | | | | | |
| | |
| | | | | | | 5,031,261 | |
|
| Health Care Technology — 0.6% | |
Allscripts Healthcare Solutions, Inc.(a) | | | 7,510 | | | | 112,763 | |
Inovalon Holdings, Inc., Class A(a) | | | 25,097 | | | | 722,292 | |
Omnicell, Inc.(a) | | | 2,192 | | | | 284,675 | |
Phreesia, Inc.(a) | | | 8,153 | | | | 424,771 | |
Tabula Rasa HealthCare, Inc.(a) | | | 1,787 | | | | 82,291 | |
Vocera Communications, Inc.(a) | | | 11,361 | | | | 436,944 | |
| | | | | | | | |
| | |
| | | | | | | 2,063,736 | |
| | |
| Hotels, Restaurants & Leisure — 2.5% | | | | | | |
Accel Entertainment, Inc.(a) | | | 8,961 | | | | 97,944 | |
Aramark | | | 18,482 | | | | 698,250 | |
Bloomin’ Brands, Inc.(a) | | | 1,251 | | | | 33,839 | |
Cheesecake Factory, Inc.(a) | | | 1,825 | | | | 106,781 | |
Churchill Downs, Inc. | | | 437 | | | | 99,382 | |
Dine Brands Global, Inc.(a) | | | 13,221 | | | | 1,190,287 | |
International Game Technology PLC(a) | | | 122,360 | | | | 1,963,878 | |
MGM Resorts International | | | 1,342 | | | | 50,983 | |
Penn National Gaming, Inc.(a) | | | 8,301 | | | | 870,277 | |
PlayAGS, Inc.(a) | | | 6,553 | | | | 52,948 | |
Rush Street Interactive, Inc.(a) | | | 2,566 | | | | 41,928 | |
SeaWorld Entertainment, Inc.(a) | | | 21,693 | | | | 1,077,491 | |
Shake Shack, Inc., Class A(a) | | | 8,914 | | | | 1,005,232 | |
Wendy’s Co. | | | 4,822 | | | | 97,694 | |
Wingstop, Inc. | | | 11,632 | | | | 1,479,241 | |
Wynn Resorts Ltd.(a) | | | 5,264 | | | | 659,948 | |
| | | | | | | | |
| | |
| | | | | | | 9,526,103 | |
| | |
| Household Durables — 2.2% | | | | | | |
Green Brick Partners, Inc.(a) | | | 25,988 | | | | 589,408 | |
iRobot Corp.(a) | | | 11,218 | | | | 1,370,615 | |
KB Home | | | 49,940 | | | | 2,323,708 | |
LGI Homes, Inc.(a) | | | 5,497 | | | | 820,757 | |
MDC Holdings, Inc. | | | 5,873 | | | | 348,856 | |
PulteGroup, Inc. | | | 8,275 | | | | 433,941 | |
Taylor Morrison Home Corp.(a) | | | 4,472 | | | | 137,782 | |
Tempur Sealy International, Inc. | | | 55,926 | | | | 2,044,655 | |
| | | | | | | | |
| | |
| | | | | | | 8,069,722 | |
| | |
| Household Products — 0.2% | | | | | | |
Central Garden & Pet Co., Class A(a) | | | 9,234 | | | | 479,152 | |
Spectrum Brands Holdings, Inc. | | | 919 | | | | 78,115 | |
| | | | | | | | |
| | |
| | | | | | | 557,267 | |
|
| Independent Power and Renewable Electricity Producers — 0.4% | |
Brookfield Renewable Corp., Class A | | | 8,390 | | | | 392,652 | |
Clearway Energy, Inc., Class A | | | 23,435 | | | | 621,262 | |
Sunnova Energy International, Inc.(a) | | | 9,887 | | | | 403,587 | |
Vistra Corp. | | | 6,206 | | | | 109,722 | |
| | | | | | | | |
| | |
| | | | | | | 1,527,223 | |
| | |
| Insurance — 2.0% | | | | | | |
Aflac, Inc. | | | 3,450 | | | | 176,571 | |
Athene Holding Ltd., Class A(a) | | | 38,365 | | | | 1,933,596 | |
Crawford & Co., Class A | | | 2,123 | | | | 22,610 | |
First American Financial Corp. | | | 41,688 | | | | 2,361,625 | |
Hanover Insurance Group, Inc. | | | 16,676 | | | | 2,158,875 | |
Investors Title Co. | | | 140 | | | | 23,240 | |
Reinsurance Group of America, Inc. | | | 6,958 | | | | 877,056 | |
Trupanion, Inc.(a) | | | 1,766 | | | | 134,587 | |
| | | | | | | | |
| | |
| | | | | | | 7,688,160 | |
| | | | | | | | |
| Security | | Shares | | | Value | |
|
| Interactive Media & Services — 0.4% | |
Bumble, Inc., Class A(a) | | | 4,194 | | | $ | 261,622 | |
Liberty TripAdvisor Holdings, Inc., Class A(a) | | | 8,198 | | | | 52,303 | |
Pinterest, Inc., Class A(a) | | | 1,290 | | | | 95,499 | |
Zillow Group, Inc., Class A(a) | | | 1,840 | | | | 241,739 | |
Zillow Group, Inc., Class C(a) | | | 6,920 | | | | 897,109 | |
| | | | | | | | |
| | |
| | | | | | | 1,548,272 | |
|
| Internet & Direct Marketing Retail — 1.1% | |
1-800-Flowers.com, Inc., Class A(a) | | | 21,575 | | | | 595,686 | |
CarParts.com, Inc.(a) | | | 5,779 | | | | 82,524 | |
Etsy, Inc.(a) | | | 10,514 | | | | 2,120,358 | |
Lands’ End, Inc.(a) | | | 6,319 | | | | 156,774 | |
Magnite, Inc.(a) | | | 2,584 | | | | 107,520 | |
Overstock.com, Inc.(a) | | | 9,822 | | | | 650,806 | |
Qurate Retail, Inc., Class A | | | 12,588 | | | | 148,035 | |
RealReal, Inc.(a) | | | 2,420 | | | | 54,765 | |
Stitch Fix, Inc., Class A(a) | | | 5,803 | | | | 287,481 | |
| | | | | | | | |
| | |
| | | | | | | 4,203,949 | |
| | |
| IT Services — 1.7% | | | | | | |
Cardtronics PLC, Class A(a) | | | 2,072 | | | | 80,394 | |
Conduent, Inc.(a) | | | 39,812 | | | | 265,148 | |
CSG Systems International, Inc. | | | 1,227 | | | | 55,080 | |
Genpact Ltd. | | | 83,686 | | | | 3,583,434 | |
Globant SA(a) | | | 5,519 | | | | 1,145,800 | |
Limelight Networks, Inc.(a) | | | 20,664 | | | | 73,770 | |
MAXIMUS, Inc. | | | 5,840 | | | | 519,994 | |
MongoDB, Inc.(a) | | | 433 | | | | 115,797 | |
StoneCo Ltd., Class A(a) | | | 7,283 | | | | 445,865 | |
Wix.com Ltd.(a) | | | 766 | | | | 213,883 | |
| | | | | | | | |
| | |
| | | | | | | 6,499,165 | |
| | |
| Leisure Products — 0.3% | | | | | | |
Brunswick Corp. | | | 1,693 | | | | 161,462 | |
Malibu Boats, Inc., Class A(a) | | | 6,704 | | | | 534,175 | |
YETI Holdings, Inc.(a) | | | 8,397 | | | | 606,347 | |
| | | | | | | | |
| | |
| | | | | | | 1,301,984 | |
|
| Life Sciences Tools & Services — 3.6% | |
Adaptive Biotechnologies Corp.(a) | | | 9,118 | | | | 367,091 | |
Avantor, Inc.(a) | | | 30,660 | | | | 886,994 | |
Berkeley Lights, Inc.(a) | | | 11,557 | | | | 580,508 | |
Bruker Corp. | | | 68,440 | | | | 4,399,323 | |
Luminex Corp. | | | 3,201 | | | | 102,112 | |
Medpace Holdings, Inc.(a) | | | 2,077 | | | | 340,732 | |
Mettler-Toledo International, Inc.(a) | | | 118 | | | | 136,371 | |
NanoString Technologies, Inc.(a) | | | 11,043 | | | | 725,635 | |
NeoGenomics, Inc.(a) | | | 40,320 | | | | 1,944,634 | |
Pacific Biosciences of California, Inc.(a) | | | 5,266 | | | | 175,410 | |
Personalis, Inc.(a) | | | 2,326 | | | | 57,243 | |
Repligen Corp.(a) | | | 13,978 | | | | 2,717,463 | |
Syneos Health, Inc.(a) | | | 9,918 | | | | 752,280 | |
Waters Corp.(a) | | | 751 | | | | 213,412 | |
| | | | | | | | |
| | |
| | | | | | | 13,399,208 | |
| | |
| Machinery — 4.2% | | | | | | |
AGCO Corp. | | | 17,237 | | | | 2,476,095 | |
Donaldson Co., Inc. | | | 6,460 | | | | 375,714 | |
Gates Industrial Corp. PLC(a) | | | 9,591 | | | | 153,360 | |
Graco, Inc. | | | 25,768 | | | | 1,845,504 | |
Hurco Cos., Inc. | | | 1,727 | | | | 60,963 | |
Manitowoc Co., Inc.(a) | | | 12,312 | | | | 253,873 | |
Oshkosh Corp. | | | 6,162 | | | | 731,183 | |
Snap-on, Inc. | | | 9,496 | | | | 2,191,107 | |
Timken Co. | | | 50,274 | | | | 4,080,740 | |
| | |
| 12 | | 2 0 2 1 BLACK ROCK ANNUAL REPORT TO SHAREHOLDERS |
| | |
Schedule of Investments (continued) March 31, 2021 | | BlackRock Advantage SMID Cap Fund, Inc. (Percentages shown are based on Net Assets) |
| | | | | | | | |
| Security | | Shares | | | Value | |
| | |
| Machinery (continued) | | | | | | |
Toro Co. | | | 18,970 | | | $ | 1,956,566 | |
Woodward, Inc. | | | 12,563 | | | | 1,515,475 | |
| | | | | | | | |
| | |
| | | | | | | 15,640,580 | |
| | |
| Media — 1.1% | | | | | | |
Cardlytics, Inc.(a) | | | 6,329 | | | | 694,291 | |
comScore, Inc.(a) | | | 12,160 | | | | 44,506 | |
Discovery, Inc., Class A(a) | | | 8,833 | | | | 383,882 | |
Discovery, Inc., Class C(a) | | | 3,126 | | | | 115,318 | |
Hemisphere Media Group, Inc.(a) | | | 2,895 | | | | 33,727 | |
iHeartMedia, Inc., Class A(a) | | | 32,847 | | | | 596,173 | |
Meredith Corp.(a) | | | 13,125 | | | | 390,863 | |
New York Times Co., Class A | | | 15,970 | | | | 808,401 | |
Nexstar Media Group, Inc., Class A | | | 6,375 | | | | 895,241 | |
| | | | | | | | |
| | |
| | | | | | | 3,962,402 | |
| | |
| Metals & Mining — 1.9% | | | | | | |
Materion Corp. | | | 624 | | | | 41,334 | |
Reliance Steel & Aluminum Co. | | | 29,438 | | | | 4,483,113 | |
Royal Gold, Inc. | | | 2,626 | | | | 282,610 | |
Ryerson Holding Corp.(a) | | | 8,993 | | | | 153,241 | |
Schnitzer Steel Industries, Inc., Class A | | | 22,917 | | | | 957,701 | |
Steel Dynamics, Inc. | | | 13,977 | | | | 709,473 | |
Worthington Industries, Inc. | | | 9,780 | | | | 656,140 | |
| | | | | | | | |
| | |
| | | | | | | 7,283,612 | |
|
| Mortgage Real Estate Investment Trusts (REITs) — 0.4% | |
Arbor Realty Trust, Inc. | | | 6,705 | | | | 106,610 | |
Ellington Financial, Inc. | | | 16,295 | | | | 260,883 | |
Hannon Armstrong Sustainable Infrastructure Capital, Inc. | | | 18,725 | | | | 1,050,472 | |
| | | | | | | | |
| | |
| | | | | | | 1,417,965 | |
| | |
| Multiline Retail — 0.5% | | | | | | |
Kohl’s Corp. | | | 6,510 | | | | 388,061 | |
Nordstrom, Inc.(a) | | | 40,954 | | | | 1,550,928 | |
| | | | | | | | |
| | |
| | | | | | | 1,938,989 | |
|
| Oil, Gas & Consumable Fuels — 2.0% | |
Antero Midstream Corp. | | | 22,969 | | | | 207,410 | |
Ardmore Shipping Corp.(a) | | | 9,801 | | | | 44,496 | |
Brigham Minerals, Inc., Class A | | | 31,673 | | | | 463,693 | |
Continental Resources, Inc.(a) | | | 14,942 | | | | 386,549 | |
Delek U.S. Holdings, Inc. | | | 23,064 | | | | 502,334 | |
EOG Resources, Inc. | | | 16,998 | | | | 1,232,865 | |
Extraction Oil & Gas, Inc.(a) | | | 4,770 | | | | 171,434 | |
Falcon Minerals Corp. | | | 40,656 | | | | 182,545 | |
Goodrich Petroleum Corp.(a) | | | 548 | | | | 5,184 | |
Laredo Petroleum, Inc.(a) | | | 1,943 | | | | 58,407 | |
Navigator Holdings Ltd.(a) | | | 4,818 | | | | 42,880 | |
Nordic American Tankers Ltd. | | | 31,351 | | | | 101,891 | |
Northern Oil and Gas, Inc.(a) | | | 5,747 | | | | 69,424 | |
PBF Energy, Inc., Class A(a) | | | 9,617 | | | | 136,081 | |
Penn Virginia Corp.(a) | | | 6,234 | | | | 83,536 | |
Phillips 66 | | | 33,000 | | | | 2,690,820 | |
REX American Resources Corp.(a) | | | 983 | | | | 82,739 | |
Scorpio Tankers, Inc. | | | 18,764 | | | | 346,383 | |
Valero Energy Corp. | | | 11,042 | | | | 790,607 | |
| | | | | | | | |
| | |
| | | | | | | 7,599,278 | |
| | |
| Personal Products — 0.3% | | | | | | |
Nature’s Sunshine Products, Inc. | | | 2,994 | | | | 59,760 | |
Nu Skin Enterprises, Inc., Class A | | | 19,133 | | | | 1,011,945 | |
USANA Health Sciences, Inc.(a) | | | 2,182 | | | | 212,963 | |
| | | | | | | | |
| | |
| | | | | | | 1,284,668 | |
| | | | | | | | |
| Security | | Shares | | | Value | |
| | |
| Pharmaceuticals — 1.4% | | | | | | |
Catalent, Inc.(a) | | | 9,699 | | | $ | 1,021,402 | |
Horizon Therapeutics PLC(a) | | | 1,404 | | | | 129,224 | |
Jazz Pharmaceuticals PLC(a) | | | 3,119 | | | | 512,670 | |
Perrigo Co. PLC | | | 35,077 | | | | 1,419,566 | |
Zoetis, Inc. | | | 13,524 | | | | 2,129,760 | |
| | | | | | | | |
| | |
| | | | | | | 5,212,622 | |
|
| Professional Services — 1.3% | |
Booz Allen Hamilton Holding Corp. | | | 1,895 | | | | 152,604 | |
Franklin Covey Co.(a) | | | 4,892 | | | | 138,395 | |
Insperity, Inc. | | | 15,218 | | | | 1,274,355 | |
Kelly Services, Inc., Class A(a) | | | 18,508 | | | | 412,173 | |
Kforce, Inc. | | | 7,892 | | | | 423,011 | |
ManpowerGroup, Inc. | | | 5,545 | | | | 548,401 | |
Mistras Group, Inc.(a) | | | 18,739 | | | | 213,812 | |
Robert Half International, Inc. | | | 11,735 | | | | 916,152 | |
TriNet Group, Inc.(a) | | | 8,502 | | | | 662,816 | |
| | | | | | | | |
| | |
| | | | | | | 4,741,719 | |
|
| Real Estate Management & Development — 0.7% | |
CBRE Group, Inc., Class A(a) | | | 11,033 | | | | 872,821 | |
Kennedy-Wilson Holdings, Inc. | | | 14,336 | | | | 289,731 | |
Marcus & Millichap, Inc.(a) | | | 11,399 | | | | 384,146 | |
RE/MAX Holdings, Inc., Class A | | | 1,070 | | | | 42,147 | |
Realogy Holdings Corp.(a) | | | 57,212 | | | | 865,617 | |
| | | | | | | | |
| | |
| | | | | | | 2,454,462 | |
| | |
| Road & Rail — 1.2% | | | | | | |
Covenant Logistics Group, Inc.(a) | | | 6,407 | | | | 131,920 | |
HyreCar, Inc.(a) | | | 12,514 | | | | 122,637 | |
Landstar System, Inc. | | | 10,893 | | | | 1,797,999 | |
PAM Transportation Services, Inc.(a) | | | 1,024 | | | | 63,181 | |
Ryder System, Inc. | | | 12,853 | | | | 972,329 | |
Schneider National, Inc., Class B | | | 58,574 | | | | 1,462,593 | |
| | | | | | | | |
| | |
| | | | | | | 4,550,659 | |
|
| Semiconductors & Semiconductor Equipment — 3.8% | |
Cirrus Logic, Inc.(a) | | | 15,283 | | | | 1,295,845 | |
Cree, Inc.(a) | | | 2,956 | | | | 319,632 | |
Enphase Energy, Inc.(a) | | | 8,663 | | | | 1,404,792 | |
First Solar, Inc.(a) | | | 111 | | | | 9,690 | |
Ichor Holdings Ltd.(a) | | | 19,645 | | | | 1,056,901 | |
Lattice Semiconductor Corp.(a) | | | 836 | | | | 37,637 | |
Monolithic Power Systems, Inc. | | | 6,722 | | | | 2,374,278 | |
Power Integrations, Inc. | | | 6,810 | | | | 554,879 | |
Silicon Laboratories, Inc.(a) | | | 21,784 | | | | 3,073,069 | |
SolarEdge Technologies, Inc.(a) | | | 1,236 | | | | 355,276 | |
Synaptics, Inc.(a) | | | 804 | | | | 108,878 | |
Ultra Clean Holdings, Inc.(a) | | | 887 | | | | 51,481 | |
Universal Display Corp. | | | 15,845 | | | | 3,751,621 | |
| | | | | | | | |
| | |
| | | | | | | 14,393,979 | |
| | |
| Software — 6.7% | | | | | | |
2U, Inc.(a) | | | 5,980 | | | | 228,615 | |
8x8, Inc.(a) | | | 38,697 | | | | 1,255,331 | |
Appian Corp.(a) | | | 3,139 | | | | 417,330 | |
Aspen Technology, Inc.(a) | | | 3,274 | | | | 472,536 | |
Avalara, Inc.(a) | | | 1,702 | | | | 227,098 | |
Avaya Holdings Corp.(a) | | | 5,712 | | | | 160,107 | |
Bill.com Holdings, Inc.(a) | | | 226 | | | | 32,883 | |
Blackline, Inc.(a) | | | 2,241 | | | | 242,924 | |
Box, Inc., Class A(a) | | | 32,368 | | | | 743,169 | |
Cloudflare, Inc., Class A(a) | | | 16,106 | | | | 1,131,608 | |
Domo, Inc., Class B(a) | | | 1,306 | | | | 73,515 | |
Everbridge, Inc.(a) | | | 6,856 | | | | 830,810 | |
| | |
SCHEDULE OF INVESTMENTS | | 13 |
| | |
Schedule of Investments (continued) March 31, 2021 | | BlackRock Advantage SMID Cap Fund, Inc. (Percentages shown are based on Net Assets) |
| | | | | | | | |
| Security | | Shares | | | Value | |
|
| Software (continued) | |
Five9, Inc.(a) | | | 5,285 | | | $ | 826,204 | |
Guidewire Software, Inc.(a) | | | 1,698 | | | | 172,568 | |
HubSpot, Inc.(a) | | | 9,090 | | | | 4,128,769 | |
JFrog Ltd.(a) | | | 2,427 | | | | 107,686 | |
LivePerson, Inc.(a) | | | 15,902 | | | | 838,671 | |
Medallia, Inc.(a) | | | 12,456 | | | | 347,398 | |
Model N, Inc.(a) | | | 1,780 | | | | 62,709 | |
New Relic, Inc.(a) | | | 1,522 | | | | 93,573 | |
Olo, Inc., Class A(a) | | | 5,675 | | | | 149,763 | |
ON24, Inc.(a) | | | 4,568 | | | | 221,594 | |
PagerDuty, Inc.(a) | | | 10,969 | | | | 441,283 | |
PROS Holdings, Inc.(a) | | | 2,228 | | | | 94,690 | |
PTC, Inc.(a) | | | 1,289 | | | | 177,431 | |
QAD, Inc., Class A | | | 2,774 | | | | 184,693 | |
Rapid7, Inc.(a) | | | 15,455 | | | | 1,153,098 | |
ServiceNow, Inc.(a) | | | 5,936 | | | | 2,968,653 | |
Sprout Social, Inc., Class A(a) | | | 10,948 | | | | 632,356 | |
Varonis Systems, Inc.(a) | | | 29,337 | | | | 1,506,162 | |
Yext, Inc.(a) | | | 9,526 | | | | 137,936 | |
Zendesk, Inc.(a) | | | 30,413 | | | | 4,033,372 | |
Zscaler, Inc.(a) | | | 6,394 | | | | 1,097,658 | |
| | | | | | | | |
| | |
| | | | | | | 25,192,193 | |
|
| Specialty Retail — 1.9% | |
Aaron’s Co., Inc. | | | 13,459 | | | | 345,627 | |
American Eagle Outfitters, Inc. | | | 21,935 | | | | 641,379 | |
At Home Group, Inc.(a) | | | 13,780 | | | | 395,486 | |
AutoNation, Inc.(a) | | | 11,802 | | | | 1,100,182 | |
Camping World Holdings, Inc., Class A | | | 12,042 | | | | 438,088 | |
Container Store Group, Inc.(a) | | | 11,103 | | | | 184,754 | |
Group 1 Automotive, Inc. | | | 956 | | | | 150,847 | |
Hibbett Sports, Inc.(a) | | | 1,682 | | | | 115,873 | |
Lithia Motors, Inc., Class A | | | 1,344 | | | | 524,281 | |
MarineMax, Inc.(a) | | | 30,328 | | | | 1,496,990 | |
Michaels Cos., Inc.(a) | | | 4,290 | | | | 94,123 | |
Rent-A-Center, Inc. | | | 3,831 | | | | 220,896 | |
Signet Jewelers Ltd.(a) | | | 5,412 | | | | 313,788 | |
Sonic Automotive, Inc., Class A | | | 7,084 | | | | 351,154 | |
Urban Outfitters, Inc.(a) | | | 2,695 | | | | 100,227 | |
Williams-Sonoma, Inc. | | | 3,230 | | | | 578,816 | |
| | | | | | | | |
| | |
| | | | | | | 7,052,511 | |
|
| Technology Hardware, Storage & Peripherals — 0.6% | |
Hewlett Packard Enterprise Co. | | | 54,633 | | | | 859,924 | |
Pure Storage, Inc., Class A(a) | | | 60,306 | | | | 1,298,991 | |
Xerox Holdings Corp. | | | 2,604 | | | | 63,199 | |
| | | | | | | | |
| | |
| | | | | | | 2,222,114 | |
|
| Textiles, Apparel & Luxury Goods — 2.0% | |
Carter’s, Inc.(a) | | | 21,538 | | | | 1,915,374 | |
Crocs, Inc.(a) | | | 15,636 | | | | 1,257,916 | |
Deckers Outdoor Corp.(a) | | | 9,421 | | | | 3,112,887 | |
Kontoor Brands, Inc. | | | 879 | | | | 42,658 | |
Rocky Brands, Inc. | | | 4,285 | | | | 231,647 | |
Skechers U.S.A., Inc., Class A(a) | | | 16,568 | | | | 691,051 | |
Unifi, Inc.(a) | | | 3,146 | | | | 86,704 | |
| | | | | | | | |
| | |
| | | | | | | 7,338,237 | |
| | | | | | | | |
| Security | | Shares | | | Value | |
|
| Thrifts & Mortgage Finance — 2.1% | |
Essent Group Ltd. | | | 21,997 | | | $ | 1,044,638 | |
Federal Agricultural Mortgage Corp., Class C | | | 6,502 | | | | 654,881 | |
Flagstar Bancorp, Inc. | | | 2,819 | | | | 127,137 | |
Merchants Bancorp | | | 1,346 | | | | 56,451 | |
Meridian Bancorp, Inc. | | | 6,530 | | | | 120,283 | |
MGIC Investment Corp. | | | 19,779 | | | | 273,939 | |
New York Community Bancorp, Inc. | | | 146,664 | | | | 1,850,900 | |
Radian Group, Inc. | | | 27,647 | | | | 642,793 | |
Security National Financial Corp., Class A(a) | | | 4,589 | | | | 42,907 | |
Southern Missouri Bancorp, Inc. | | | 779 | | | | 30,708 | |
TFS Financial Corp. | | | 73,068 | | | | 1,488,395 | |
Walker & Dunlop, Inc. | | | 7,044 | | | | 723,701 | |
Washington Federal, Inc. | | | 17,977 | | | | 553,692 | |
Waterstone Financial, Inc. | | | 2,122 | | | | 43,331 | |
Western New England Bancorp, Inc. | | | 15,317 | | | | 129,122 | |
| | | | | | | | |
| | |
| | | | | | | 7,782,878 | |
| | |
| Tobacco — 0.1% | | | | | | |
Vector Group Ltd. | | | 27,966 | | | | 390,126 | |
| | | | | | | | |
|
| Trading Companies & Distributors — 1.5% | |
MRC Global, Inc.(a) | | | 10,709 | | | | 96,702 | |
SiteOne Landscape Supply, Inc.(a) | | | 26,119 | | | | 4,459,558 | |
Triton International Ltd. | | | 15,201 | | | | 835,903 | |
Veritiv Corp.(a) | | | 2,060 | | | | 87,633 | |
Watsco, Inc. | | | 859 | | | | 223,984 | |
| | | | | | | | |
| | |
| | | | | | | 5,703,780 | |
|
| Wireless Telecommunication Services — 0.2% | |
Telephone & Data Systems, Inc. | | | 9,578 | | | | 219,911 | |
United States Cellular Corp.(a) | | | 9,791 | | | | 357,176 | |
| | | | | | | | |
| | |
| | | | | | | 577,087 | |
| | | | | | | | |
| |
Total Long-Term Investments — 96.9%
(Cost: $354,729,151) | | | | 363,751,635 | |
| | | | | | | | |
|
| Short-Term Securities(c)(d) | |
| | |
| Money Market Funds — 3.1% | | | | | | |
BlackRock Liquidity Funds, T-Fund, Institutional Class, 0.01% | | | 11,210,927 | | | | 11,210,927 | |
SL Liquidity Series, LLC, Money Market Series, 0.16%(e) | | | 537,011 | | | | 537,172 | |
| | | | | | | | |
| | |
Total Short-Term Securities — 3.1%
(Cost: $11,748,099) | | | | | | | 11,748,099 | |
| | | | | | | | |
| |
Total Investments — 100.0%
(Cost: $366,477,250) | | | | 375,499,734 | |
| |
Liabilities in Excess of Other Assets — (0.0)% | | | | (24,330 | ) |
| | | | | | | | |
| |
Net Assets — 100.0% | | | $ | 375,475,404 | |
| | | | | | | | |
| (a) | Non-income producing security. |
| (b) | All or a portion of this security is on loan. |
| (c) | Affiliate of the Fund. |
| (d) | Annualized 7-day yield as of period end. |
| (e) | All or a portion of this security was purchased with the cash collateral from loaned securities. |
| | |
| 14 | | 2 0 2 1 BLACK ROCK ANNUAL REPORT TO SHAREHOLDERS |
| | |
Schedule of Investments ��(continued) March 31, 2021 | | BlackRock Advantage SMID Cap Fund, Inc. |
Affiliates
Investments in issuers considered to be affiliate(s) of the Fund during the year ended March 31, 2021 for purposes of Section 2(a)(3) of the Investment Company Act of 1940, as amended, were as follows:
| | | | | | | | | | | | | | | | | | | | | | | | | | | | | | | | | | | | | | | | | | | | | | | | |
| | | | | | | | | | |
| Affiliated Issuer | | Value at 03/31/20 | | | Purchases at Cost | | | Proceeds from Sale | | | Net Realized Gain (Loss)
| | | Change in Unrealized Appreciation (Depreciation) | | | Value at 03/31/21 | | | Shares Held at 03/31/21 | | | Income | | | Capital Gain Distributions from Underlying Funds | |
BlackRock Liquidity Funds, | | | | | | | | | | | | | | | | | | | | | | | | | | | | | | | | | | | | | | | | | | | | | | | | |
T-Fund, Institutional Class | | $ | 8,072,097 | (a) | | $ | 3,138,830 | (b) | | $ | — | | | | | | | $ | — | | | | | | | $ | — | | | $ | 11,210,927 | | | | 11,210,927 | | | $ | 5,721 | | | | | | | $ | — | |
SL Liquidity Series, LLC, | | | | | | | | | | | | | | | | | | | | | | | | | | | | | | | | | | | | | | | | | | | | | | | | |
Money Market Series | | | 16,026,420 | (a) | | | — | | | | (15,489,977 | )(b) | | | | | | | 2,297 | | | | | | | | (1,568 | ) | | | 537,172 | | | | 537,011 | | | | 56,321 | (c) | | | | | | | — | |
| | | | | | | | | | | | | | | | | | | | | | | | | | | | | | | | | | | | | | | | | | | | | | | | |
| | | | | | | | | | | | | | | | | | $ | 2,297 | | | | | | | $ | (1,568 | ) | | $ | 11,748,099 | | | | | | | $ | 62,042 | | | | | | | $ | — | |
| | | | | | | | | | | | | | | | | | | | | | | | | | | | | | | | | | | | | | | | | | | | | | | | |
| | (a) | Represents value held by the Master LLC as of March 31, 2020. | |
| | (b) | Represents net amount purchased (sold) by the Fund and the Master LLC. | |
| | (c) | All or a portion represents securities lending income earned from the reinvestment of cash collateral from loaned securities, net of fees and collateral investment expenses, and other payments to and from borrowers of securities. | |
For Fund compliance purposes, the Fund’s industry classifications refer to one or more of the industry sub-classifications used by one or more widely recognized market indexes or rating group indexes, and/or as defined by the investment adviser. These definitions may not apply for purposes of this report, which may combine such industry sub-classifications for reporting ease.
Derivative Financial Instruments Outstanding as of Period End
Futures Contracts
| | | | | | | | | | | | | | | | | | | | |
| | | | | |
| Description | | Number of Contracts | | Expiration Date | | Notional Amount (000) | | Value/ Unrealized Appreciation (Depreciation) |
Long Contracts | | | | | | | | | | | | | | | | | | | | |
S&P 500 E-Mini Index | | | | 61 | | | | | 06/18/21 | | | | $ | 12,101 | | | | | $ 102,370 | |
| | | | | | | | | | | | | | | | | | | | |
Derivative Financial Instruments Categorized by Risk Exposure
As of period end, the fair values of derivative financial instruments located in the Statement of Assets and Liabilities were as follows:
| | | | | | | | | | | | | | | | | | | | | | | | | | | | | | | | | | | |
| | | Commodity Contracts | | Credit Contracts | | Equity Contracts
| | Foreign Currency Exchange Contracts | | Interest Rate Contracts | | Other Contracts | | Total |
Assets — Derivative Financial Instruments | | | | | | | | | | | | | | | | | | | | | | | | | | | | | | | | | | | |
Futures contracts | | | | | | | | | | | | | | | | | | | | | | | | | | | | | | | | | | | |
Unrealized appreciation(a) | | | | $ — | | | | | $ — | | | | | $ 102,370 | | | | | $ — | | | | | $ — | | | | | $ — | | | | | $ 102,370 | |
| | | | | | | | | | | | | | | | | | | | | | | | | | | | | | | | | | | |
| | (a) | Net cumulative unrealized appreciation (depreciation) on futures contracts, if any, are reported in the Schedule of Investments. In the Statement of Assets and Liabilities, only current day’s variation margin is reported in receivables or payables and the net cumulative unrealized appreciation (depreciation) is included in accumulated earnings (loss). | |
For the year ended March 31, 2021, the effect of derivative financial instruments in the Statement of Operations was as follows:
| | | | | | | | | | | | | | | | | | | | | | | | | | | | | | | | | | | |
| | | Commodity Contracts | | Credit Contracts | | Equity Contracts | | Foreign Currency Exchange Contracts | | Interest Rate Contracts | | Other Contracts | | Total |
Net Realized Gain (Loss) from | | | | | | | | | | | | | | | | | | | | | | | | | | | | | | | | | | | |
Futures contracts | | | | $ — | | | | | $ — | | | | | $ 5,327,332 | (a) | | | | $ — | | | | | $ — | | | | | $ — | | | | | $ 5,327,332 | |
| | | | | | | | | | | | | | | | | | | | | | | | | | | | | | | | | | | |
Net Change in Unrealized Appreciation (Depreciation) on | | | | | | | | | | | | | | | | | | | | | | | | | | | | | | | | | | | |
Futures contracts | | | | $ — | | | | | $ — | | | | | $ (560,265 | )(a) | | | | $ — | | | | | $ — | | | | | $ — | | | | | $ (560,265 | ) |
| | | | | | | | | | | | | | | | | | | | | | | | | | | | | | | | | | | |
| | (a) | Includes $5,042,647 and $(783,020) in realized gain/loss and unrealized appreciation (depreciation), respectively, allocated from the Master LLC through February 28, 2021. | |
| | |
SCHEDULE OF INVESTMENTS | | 15 |
| | |
Schedule of Investments (continued) March 31, 2021 | | BlackRock Advantage SMID Cap Fund, Inc. |
Average Quarterly Balances of Outstanding Derivative Financial Instruments
| | | | |
Futures contracts | | | | |
Average notional value of contracts — long | | $ | 11,233,773 | |
For more information about the Fund’s investment risks regarding derivative financial instruments, refer to the Notes to Financial Statements.
Fair Value Hierarchy as of Period End
Various inputs are used in determining the fair value of financial instruments. For a description of the input levels and information about the Fund’s policy regarding valuation of financial instruments, refer to the Notes to Financial Statements.
The following table summarizes the Fund’s investments categorized in the fair value hierarchy. The breakdown of the Fund’s investments into major categories is disclosed in the Schedule of Investments above.
| | | | | | | | | | | | | | | | | | | | | | | | | | |
| | | Level 1 | | | | Level 2 | | | | Level 3 | | | | Total |
| | | | | | | |
Assets | | | | | | | | | | | | | | | | | | | | | | | | | | |
Investments | | | | | | | | | | | | | | | | | | | | | | | | | | |
Long-Term Investments | | | | | | | | | | | | | | | | | | | | | | | | | | |
Common Stocks | | | $ | 363,751,635 | | | | | | | $ — | | | | | | | $ — | | | | | | $ | 363,751,635 | |
Short-Term Securities | | | | | | | | | | | | | | | | | | | | | | | | | | |
Money Market Funds | | | | 11,210,927 | | | | | | | — | | | | | | | — | | | | | | | 11,210,927 | |
| | | | | | | | | | | | | | | | | | | | | | | | | | |
| | | | | | | |
| | | $ | 374,962,562 | | | | | | | $ — | | | | | | | $ — | | | | | | | 374,962,562 | |
| | | | | | | | | | | | | | | | | | | | | | | | | | |
| | | | | | | |
Investments Valued at NAV(a) | | | | | | | | | | | | | | | | | | | | | | | | | 537,172 | |
| | | | | | | | | | | | | | | | | | | | | | | | | | |
| | | | | | | |
| | | | | | | | | | | | | | | | | | | | | | | | $ | 375,499,734 | |
| | | | | | | | | | | | | | | | | | | | | | | | | | |
| | | | | | | |
Derivative Financial Instruments(b) | | | | | | | | | | | | | | | | | | | | | | | | | | |
Assets | | | | | | | | | | | | | | | | | | | | | | | | | | |
Equity Contracts | | | $ | 102,370 | | | | | | | $ — | | | | | | | $ — | | | | | | $ | 102,370 | |
| | | | | | | | | | | | | | | | | | | | | | | | | | |
| | (a) | Certain investments of the Fund were fair valued using NAV per share as no quoted market value is available and therefore have been excluded from the fair value hierarchy. | |
| | (b) | Derivative financial instruments are futures contracts. Futures contracts are valued at the unrealized appreciation (depreciation) on the instrument. | |
See notes to financial statements.
| | |
| 16 | | 2 0 2 1 BLACK ROCK ANNUAL REPORT TO SHAREHOLDERS |
Statement of Assets and Liabilities
March 31, 2021
| | | | |
| | | BlackRock Advantage SMID Cap Fund, Inc. | |
| |
ASSETS | | | | |
Investments at value — unaffiliated(a)(b) | | $ | 363,751,635 | |
Investments at value — affiliated(c) | | | 11,748,099 | |
Cash | | | 18,385 | |
Cash pledged for futures contracts | | | 656,000 | |
Receivables: | | | | |
Investments sold | | | 3,610,211 | |
Securities lending income — affiliated | | | 68 | |
Capital shares sold | | | 101,273 | |
Dividends — affiliated | | | 233 | |
Dividends — unaffiliated | | | 271,293 | |
From the Manager | | | 20,472 | |
Variation margin on futures contracts | | | 58,225 | |
Prepaid expenses | | | 49,087 | |
| | | | |
| |
Total assets | | | 380,284,981 | |
| | | | |
| |
LIABILITIES | | | | |
Collateral on securities loaned at value | | | 537,172 | |
Payables: | | | | |
Investments purchased | | | 3,583,682 | |
Administration fees | | | 13,220 | |
Capital shares redeemed | | | 316,625 | |
Investment advisory fees | | | 90,277 | |
Directors’ and Officer’s fees | | | 4,345 | |
Other accrued expenses | | | 200,904 | |
Other affiliate fees | | | 1,163 | |
Service and distribution fees | | | 62,189 | |
| | | | |
| |
Total liabilities | | | 4,809,577 | |
| | | | |
| |
NET ASSETS | | $ | 375,475,404 | |
| | | | |
| |
NET ASSETS CONSIST OF | | | | |
Paid-in capital | | $ | 264,275,422 | |
Accumulated earnings | | | 111,199,982 | |
| | | | |
| |
NET ASSETS | | $ | 375,475,404 | |
| | | | |
| |
(a) Investments at cost — unaffiliated | | $ | 354,729,151 | |
(b) Securities loaned at value | | $ | 535,006 | |
(c) Investments at cost — affiliated | | $ | 11,748,099 | |
Statement of Assets and Liabilities (continued)
March 31, 2021
| | | | |
| | | BlackRock Advantage SMID Cap Fund, Inc. | |
| |
| NET ASSET VALUE | | | |
| |
| Institutional | | | |
| |
Net assets | | $ | 103,266,202 | |
| | | | |
| |
Shares outstanding | | | 2,844,198 | |
| | | | |
| |
Net asset value | | $ | 36.31 | |
| | | | |
| |
Shares authorized | | | 100 million | |
| | | | |
| |
Par value | | $ | 0.10 | |
| | | | |
| |
| Investor A | | | |
| |
Net assets | | $ | 259,636,662 | |
| | | | |
| |
Shares outstanding | | | 7,502,697 | |
| | | | |
| |
Net asset value | | $ | 34.61 | |
| | | | |
| |
Shares authorized | | | 100 million | |
| | | | |
| |
Par value | | $ | 0.10 | |
| | | | |
| |
| Investor C | | | |
| |
Net assets | | $ | 4,321,612 | |
| | | | |
| |
Shares outstanding | | | 200,583 | |
| | | | |
| |
Net asset value | | $ | 21.55 | |
| | | | |
| |
Shares authorized | | | 100 million | |
| | | | |
| |
Par value | | $ | 0.10 | |
| | | | |
| |
| Class K | | | |
| |
Net assets | | $ | 2,372,299 | |
| | | | |
| |
Shares outstanding | | | 65,370 | |
| | | | |
| |
Net asset value | | $ | 36.29 | |
| | | | |
| |
Shares authorized | | | 2 billion | |
| | | | |
| |
Par value | | $ | 0.10 | |
| | | | |
| |
| Class R | | | |
| |
Net assets | | $ | 5,878,629 | |
| | | | |
| |
Shares outstanding | | | 239,310 | |
| | | | |
| |
Net asset value | | $ | 24.56 | |
| | | | |
| |
Shares authorized | | | 100 million | |
| | | | |
| |
Par value | | $ | 0.10 | |
| | | | |
See notes to financial statements.
| | |
| 18 | | 2 0 2 1 BLACK ROCK ANNUAL REPORT TO SHAREHOLDERS |
Statement of Operations
Year Ended March 31, 2021
| | | | |
| | | BlackRock Advantage SMID Cap Fund, Inc. | |
| |
INVESTMENT INCOME | | | | |
| |
Dividends — unaffiliated | | $ | 455,023 | |
| |
Dividends — affiliated | | | 222 | |
| |
Securities lending income — affiliated — net | | | 68 | |
| |
Foreign taxes withheld | | | (193 | ) |
| |
Net investment income allocated from the Master LLC: | | | | |
| |
Dividends — unaffiliated | | | 4,722,272 | |
| |
Dividends — affiliated | | | 5,499 | |
| |
Securities lending income — affiliated — net | | | 56,253 | |
| |
Foreign taxes withheld | | | (944 | ) |
| |
Expenses | | | (1,715,645 | ) |
| |
Fees waived | | | 374,240 | |
| | | | |
| |
Total investment income | | | 3,896,795 | |
| | | | |
| |
EXPENSES | | | | |
| |
Administration | | | 798,494 | |
| |
Service and distribution — class specific | | | 742,509 | |
| |
Transfer agent — class specific | | | 418,241 | |
| |
Investment advisory | | | 170,004 | |
| |
Registration | | | 84,219 | |
| |
Professional | | | 82,927 | |
| |
Printing and postage | | | 33,574 | |
| |
Accounting services | | | 11,842 | |
| |
Custodian | | | 7,783 | |
| |
Administration — class specific | | | 6,394 | |
| |
Directors and Officer | | | 9 | |
| |
Miscellaneous | | | 8,174 | |
| | | | |
| |
Total expenses | | | 2,364,170 | |
| |
Less: | | | | |
| |
Fees waived and/or reimbursed by the Manager | | | (1,051,173 | ) |
| |
Administration fees waived — class specific | | | (6,324 | ) |
| |
Transfer agent fees waived and/or reimbursed — class specific | | | (245,160 | ) |
| | | | |
| |
Total expenses after fees waived and/or reimbursed | | | 1,061,513 | |
| | | | |
| |
Net investment income | | | 2,835,282 | |
| | | | |
Statement of Operations (continued)
Year Ended March 31, 2021
| | | | |
| | | BlackRock Advantage SMID Cap Fund, Inc. | |
| |
REALIZED AND UNREALIZED GAIN (LOSS) | | | | |
| |
Net realized gain (loss) from: | | | | |
| |
Investments — unaffiliated | | $ | 156,099 | |
| |
Futures contracts | | | 284,685 | |
| |
Foreign currency transactions | | | (12 | ) |
| |
Net realized gain from investments, futures contracts and foreign currency transactions allocated from the Master LLC | | | 119,292,344 | |
| | | | |
| |
| | | 119,733,116 | |
| | | | |
| |
Net change in unrealized appreciation (depreciation) on: | | | | |
| |
Investments — unaffiliated | | | 5,280,523 | |
| |
Futures contracts | | | 222,755 | |
| |
Foreign currency translations | | | 20 | |
| |
Net change in unrealized appreciation (depreciation) on investments, futures contracts and foreign currency translations allocated from the Master LLC | | | 24,661,474 | |
| | | | |
| |
| | | 30,164,772 | |
| | | | |
| |
Net realized and unrealized gain | | | 149,897,888 | |
| | | | |
| |
NET INCREASE IN NET ASSETS RESULTING FROM OPERATIONS | | $ | 152,733,170 | |
| | | | |
See notes to financial statements.
| | |
| 20 | | 2 0 2 1 BLACK ROCK ANNUAL REPORT TO SHAREHOLDERS |
Statements of Changes in Net Assets
| | | | | | | | | | | | |
| | | BlackRock Advantage SMID Cap Fund, Inc. | |
| |
| | | Year Ended March 31, | |
| | |
| | | 2021 | | | 2020 | |
| | | |
INCREASE (DECREASE) IN NET ASSETS | | | | | | | | | | | | |
| | | |
OPERATIONS | | | | | | | | | | | | |
Net investment income | | | $ 2,835,282 | | | | | | | | $ 4,660,350 | |
Net realized gain | | | 119,733,116 | | | | | | | | 11,003,449 | |
Net change in unrealized appreciation (depreciation) | | | 30,164,772 | | | | | | | | (42,147,877 | ) |
| | | | | | | | | | | | |
| | | |
Net increase (decrease) in net assets resulting from operations | | | 152,733,170 | | | | | | | | (26,484,078 | ) |
| | | | | | | | | | | | |
| | | |
DISTRIBUTIONS TO SHAREHOLDERS(a) | | | | | | | | | | | | |
Institutional | | | (4,624,873 | ) | | | | | | | (2,474,052 | ) |
Investor A | | | (11,652,714 | ) | | | | | | | (6,870,694 | ) |
Investor C | | | (247,076 | ) | | | | | | | (1,136,201 | ) |
Class K | | | (104,502 | ) | | | | | | | (63,090 | ) |
Class R | | | (371,011 | ) | | | | | | | (431,408 | ) |
| | | | | | | | | | | | |
| | | |
Decrease in net assets resulting from distributions to shareholders | | | (17,000,176 | ) | | | | | | | (10,975,445 | ) |
| | | | | | | | | | | | |
| | | |
CAPITAL SHARE TRANSACTIONS | | | | | | | | | | | | |
| | | |
Net decrease in net assets derived from capital share transactions | | | (51,749,196 | ) | | | | | | | (96,398,671 | ) |
| | | | | | | | | | | | |
| | | |
NET ASSETS | | | | | | | | | | | | |
Total increase (decrease) in net assets | | | 83,983,798 | | | | | | | | (133,858,194 | ) |
Beginning of year | | | 291,491,606 | | | | | | | | 425,349,800 | |
| | | | | | | | | | | | |
End of year | | | $ 375,475,404 | | | | | | | | $ 291,491,606 | |
| | | | | | | | | | | | |
| (a) | Distributions for annual periods determined in accordance with U.S. federal income tax regulations. |
See notes to financial statements.
Financial Highlights
(For a share outstanding throughout each period)
| | | | | | | | | | | | | | | | | | | | | | | | | | |
| | | BlackRock Advantage SMID Cap Fund, Inc. | |
| | |
| | | | | Institutional | |
| | |
| | | | | Year Ended March 31, | |
| | | | | |
| | | 2021 | | | 2020 | | | 2019 | | | 2018 | | | 2017 | |
| | | | | | | |
Net asset value, beginning of year | | | | $ | 24.09 | | | | | | | $ | 27.40 | | | $ | 32.34 | | | $ | 34.88 | | | $ | 29.38 | |
| | | | | | | | | | | | | | | | | | | | | | | | | | |
| | | | | | | |
Net investment income(a) | | | | | 0.33 | | | | | | | | 0.41 | | | | 0.40 | | | | 0.17 | (b) | | | 0.06 | (c) |
Net realized and unrealized gain (loss) | | | | | 13.54 | | | | | | | | (2.89 | ) | | | 1.34 | | | | 2.66 | | | | 6.62 | |
| | | | | | | | | | | | | | | | | | | | | | | | | | |
| | | | | | | |
Net increase (decrease) from investment operations | | | | | 13.87 | | | | | | | | (2.48 | ) | | | 1.74 | | | | 2.83 | | | | 6.68 | |
| | | | | | | | | | | | | | | | | | | | | | | | | | |
| | | | | | | |
Distributions(d) | | | | | | | | | | | | | | | | | | | | | | | | | | |
From net investment income | | | | | (0.28 | ) | | | | | | | (0.38 | ) | | | (0.45 | ) | | | (0.09 | ) | | | — | |
From net realized gain | | | | | (1.37 | ) | | | | | | | (0.45 | ) | | | (6.23 | ) | | | (5.28 | ) | | | (1.18 | ) |
| | | | | | | | | | | | | | | | | | | | | | | | | | |
| | | | | | | |
Total distributions | | | | | (1.65 | ) | | | | | | | (0.83 | ) | | | (6.68 | ) | | | (5.37 | ) | | | (1.18 | ) |
| | | | | | | | | | | | | | | | | | | | | | | | | | |
| | | | | | | |
Net asset value, end of year | | | | $ | 36.31 | | | | | | | $ | 24.09 | | | $ | 27.40 | | | $ | 32.34 | | | $ | 34.88 | |
| | | | | | | | | | | | | | | | | | | | | | | | | | |
| | | | | | | |
Total Return(e) | | | | | | | | | | | | | | | | | | | | | | | | | | |
Based on net asset value | | | | | 58.11 | % | | | | | | | (9.60 | )% | | | 6.76 | % | | | 8.48 | % | | | 22.72 | % |
| | | | | | | | | | | | | | | | | | | | | | | | | | |
| | | | | | | |
Ratios to Average Net Assets | | | | | | | | | | | | | | | | | | | | | | | | | | |
Total expenses | | | | | 0.86 | %(f) | | | | | | | 0.85 | %(g) | | | 0.98 | %(g) | | | 1.07 | %(h) | | | 0.94 | %(h) |
| | | | | | | | | | | | | | | | | | | | | | | | | | |
| | | | | | | |
Total expenses after fees waived and/or reimbursed | | | | | 0.48 | %(f) | | | | | | | 0.48 | %(g) | | | 0.48 | %(g) | | | 0.92 | %(h) | | | 0.94 | %(h) |
| | | | | | | | | | | | | | | | | | | | | | | | | | |
| | | | | | | |
Net investment income | | | | | 1.03 | %(f) | | | | | | | 1.44 | %(g) | | | 1.48 | %(g) | | | 0.52 | %(b)(h) | | | 0.19 | %(c)(h) |
| | | | | | | | | | | | | | | | | | | | | | | | | | |
| | | | | | | |
Supplemental Data | | | | | | | | | | | | | | | | | | | | | | | | | | |
Net assets, end of year (000) | | | | $ | 103,266 | | | | | | | $ | 72,044 | | | $ | 87,248 | | | $ | 113,466 | | | $ | 155,558 | |
| | | | | | | | | | | | | | | | | | | | | | | | | | |
| | | | | | | |
Portfolio turnover rate | | | | | 208 | %(i) | | | | | | | 123 | % | | | 142 | % | | | 147 | % | | | 68 | % |
| | | | | | | | | | | | | | | | | | | | | | | | | | |
| (a) | Based on average shares outstanding. |
| (b) | Net investment income per share and the ratio of net investment income to average net assets includes $0.06 per share and 0.20%, respectively, resulting from a special dividend. |
| (c) | Net investment income per share and the ratio of net investment income to average net assets includes $0.03 per share and 0.08%, respectively, resulting from a special dividend. |
| (d) | Distributions for annual periods determined in accordance with U.S. federal income tax regulations. |
| (e) | Where applicable, assumes the reinvestment of distributions. |
| (f) | From April 1, 2020 through February 28, 2021, the Fund invested in the Master LLC as part of a master-feeder structure and received its corresponding allocated fees waived and expenses and/or net investment income from the Master LLC. Includes the Fund’s share of the Master LLC’s allocated fees waived of 0.11%. |
| (g) | Includes the Fund’s share of the Master LLC’s allocated fees waived and expenses and/or net investment income. Includes the Fund’s share of the Master LLC’s allocated fees waived of 0.12%. |
| (h) | Includes the Fund’s share of the Master LLC’s allocated fees waived and expenses and/or net investment income. Includes the Fund’s share of the Master LLC’s allocated fees waived of less than 0.01%. |
| (i) | Portfolio turnover rate includes transactions from the Master LLC prior to March 1, 2021. |
See notes to financial statements.
| | |
| 22 | | 2 0 2 1 BLACK ROCK ANNUAL REPORT TO SHAREHOLDERS |
Financial Highlights (continued)
(For a share outstanding throughout each period)
| | | | | | | | | | | | | | | | | | | | | | | | | | |
| | | BlackRock Advantage SMID Cap Fund, Inc. (continued) | |
| | |
| | | | | Investor A | |
| | |
| | | | | Year Ended March 31, | |
| | | | | | |
| | | | | 2021 | | | 2020 | | | 2019 | | | 2018 | | | 2017 | |
| | | | | | | |
Net asset value, beginning of year | | | | $ | 23.02 | | | | | | | $ | 26.22 | | | $ | 31.22 | | | $ | 33.76 | | | $ | 28.55 | |
| | | | | | | | | | | | | | | | | | | | | | | | | | |
| | | | | | | |
Net investment income (loss)(a) | | | | | 0.24 | | | | | | | | 0.33 | | | | 0.32 | | | | 0.08 | (b) | | | (0.03 | )(c) |
Net realized and unrealized gain (loss) | | | | | 12.93 | | | | | | | | (2.76 | ) | | | 1.30 | | | | 2.58 | | | | 6.42 | |
| | | | | | | | | | | | | | | | | | | | | | | | | | |
| | | | | | | |
Net increase (decrease) from investment operations | | | | | 13.17 | | | | | | | | (2.43 | ) | | | 1.62 | | | | 2.66 | | | | 6.39 | |
| | | | | | | | | | | | | | | | | | | | | | | | | | |
| | | | | | | |
Distributions(d) | | | | | | | | | | | | | | | | | | | | | | | | | | |
From net investment income | | | | | (0.21 | ) | | | | | | | (0.32 | ) | | | (0.39 | ) | | | (0.02 | ) | | | — | |
From net realized gain | | | | | (1.37 | ) | | | | | | | (0.45 | ) | | | (6.23 | ) | | | (5.18 | ) | | | (1.18 | ) |
| | | | | | | | | | | | | | | | | | | | | | | | | | |
| | | | | | | |
Total distributions | | | | | (1.58 | )�� | | | | | | | (0.77 | ) | | | (6.62 | ) | | | (5.20 | ) | | | (1.18 | ) |
| | | | | | | | | | | | | | | | | | | | | | | | | | |
| | | | | | | |
Net asset value, end of year | | | | $ | 34.61 | | | | | | | $ | 23.02 | | | $ | 26.22 | | | $ | 31.22 | | | $ | 33.76 | |
| | | | | | | | | | | | | | | | | | | | | | | | | | |
| | | | | | | |
Total Return(e) | | | | | | | | | | | | | | | | | | | | | | | | | | |
Based on net asset value | | | | | 57.69 | % | | | | | | | (9.79 | )% | | | 6.52 | % | | | 8.20 | % | | | 22.36 | % |
| | | | | | | | | | | | | | | | | | | | | | | | | | |
| | | | | | | |
Ratios to Average Net Assets | | | | | | | | | | | | | | | | | | | | | | | | | | |
Total expenses | | | | | 1.10 | %(f) | | | | | | | 1.12 | %(g) | | | 1.25 | %(g) | | | 1.33 | %(h) | | | 1.24 | %(h) |
| | | | | | | | | | | | | | | | | | | | | | | | | | |
| | | | | | | |
Total expenses after fees waived and/or reimbursed | | | | | 0.73 | %(f) | | | | | | | 0.73 | %(g) | | | 0.73 | %(g) | | | 1.19 | %(h) | | | 1.24 | %(h) |
| | | | | | | | | | | | | | | | | | | | | | | | | | |
| | | | | | | |
Net investment income (loss) | | | | | 0.78 | %(f) | | | | | | | 1.19 | %(g) | | | 1.24 | %(g) | | | 0.23 | %(b)(h) | | | (0.10 | )%(c)(h) |
| | | | | | | | | | | | | | | | | | | | | | | | | | |
| | | | | | | |
Supplemental Data | | | | | | | | | | | | | | | | | | | | | | | | | | |
Net assets, end of year (000) | | | | $ | 259,637 | | | | | | | $ | 188,164 | | | $ | 279,014 | | | $ | 309,125 | | | $ | 366,669 | |
| | | | | | | | | | | | | | | | | | | | | | | | | | |
| | | | | | | |
Portfolio turnover rate | | | | | 208 | %(i) | | | | | | | 123 | % | | | 142 | % | | | 147 | % | | | 68 | % |
| | | | | | | | | | | | | | | | | | | | | | | | | | |
| (a) | Based on average shares outstanding. |
| (b) | Net investment income per share and the ratio of net investment income to average net assets includes $0.06 per share and 0.20%, respectively, resulting from a special dividend. |
| (c) | Net investment income per share and the ratio of net investment income to average net assets includes $0.03 per share and 0.08%, respectively, resulting from a special dividend. |
| (d) | Distributions for annual periods determined in accordance with U.S. federal income tax regulations. |
| (e) | Where applicable, excludes the effects of any sales charges and assumes the reinvestment of distributions. |
| (f) | From April 1, 2020 through February 28, 2021, the Fund invested in the Master LLC as part of a master-feeder structure and received its corresponding allocated fees waived and expenses and/or net investment income from the Master LLC. Includes the Fund’s share of the Master LLC’s allocated fees waived of 0.11%. |
| (g) | Includes the Fund’s share of the Master LLC’s allocated fees waived and expenses and/or net investment income. Includes the Fund’s share of the Master LLC’s allocated fees waived of 0.12%. |
| (h) | Includes the Fund’s share of the Master LLC’s allocated fees waived and expenses and/or net investment income. Includes the Fund’s share of the Master LLC’s allocated fees waived of less than 0.01%. |
| (i) | Portfolio turnover rate includes transactions from the Master LLC prior to March 1, 2021. |
See notes to financial statements.
Financial Highlights (continued)
(For a share outstanding throughout each period)
| | | | | | | | | | | | | | | | | | | | | | | | | | |
| | | BlackRock Advantage SMID Cap Fund, Inc. (continued) | |
| | |
| | | | | Investor C | |
| | |
| | | | | Year Ended March 31, | |
| | | | | | | |
| | | | | 2021 | | | | | | 2020 | | | 2019 | | | 2018 | | | 2017 | |
| | | | | | | |
Net asset value, beginning of year | | | | $ | 14.52 | | | | | | | $ | 16.83 | | | $ | 22.38 | | | $ | 25.28 | | | $ | 21.80 | |
| | | | | | | | | | | | | | | | | | | | | | | | | | |
| | | | | | | |
Net investment income (loss)(a) | | | | | 0.02 | | | | | | | | 0.08 | | | | 0.08 | | | | (0.12 | )(b) | | | (0.22 | )(c) |
Net realized and unrealized gain (loss) | | | | | 8.11 | | | | | | | | (1.72 | ) | | | 0.83 | | | | 1.91 | | | | 4.88 | |
| | | | | | | | | | | | | | | | | | | | | | | | | | |
| | | | | | | |
Net increase (decrease) from investment operations | | | | | 8.13 | | | | | | | | (1.64 | ) | | | 0.91 | | | | 1.79 | | | | 4.66 | |
| | | | | | | | | | | | | | | | | | | | | | | | | | |
| | | | | | | |
Distributions(d) | | | | | | | | | | | | | | | | | | | | | | | | | | |
From net investment income | | | | | — | | | | | | | | (0.22 | ) | | | (0.23 | ) | | | — | | | | — | |
From net realized gain | | | | | (1.10 | ) | | | | | | | (0.45 | ) | | | (6.23 | ) | | | (4.69 | ) | | | (1.18 | ) |
| | | | | | | | | | | | | | | | | | | | | | | | | | |
| | | | | | | |
Total distributions | | | | | (1.10 | ) | | | | | | | (0.67 | ) | | | (6.46 | ) | | | (4.69 | ) | | | (1.18 | ) |
| | | | | | | | | | | | | | | | | | | | | | | | | | |
| | | | | | | |
Net asset value, end of year | | | | $ | 21.55 | | | | | | | $ | 14.52 | | | $ | 16.83 | | | $ | 22.38 | | | $ | 25.28 | |
| | | | | | | | | | | | | | | | | | | | | | | | | | |
| | | | | | | |
Total Return(e) | | | | | | | | | | | | | | | | | | | | | | | | | | |
Based on net asset value | | | | | 56.51 | % | | | | | | | (10.45 | )% | | | 5.73 | % | | | 7.35 | % | | | 21.33 | % |
| | | | | | | | | | | | | | | | | | | | | | | | | | |
| | | | | | | |
Ratios to Average Net Assets | | | | | | | | | | | | | | | | | | | | | | | | | | |
Total expenses | | | | | 1.92 | %(f) | | | | | | | 1.98 | %(g) | | | 2.12 | %(g) | | | 2.16 | %(h) | | | 2.07 | %(h) |
| | | | | | | | | | | | | | | | | | | | | | | | | | |
| | | | | | | |
Total expenses after fees waived and/or reimbursed | | | | | 1.48 | %(f) | | | | | | | 1.48 | %(g) | | | 1.48 | %(g) | | | 2.00 | %(h) | | | 2.07 | %(h) |
| | | | | | | | | | | | | | | | | | | | | | | | | | |
| | | | | | | |
Net investment income (loss) | | | | | 0.13 | %(f) | | | | | | | 0.44 | %(g) | | | 0.46 | %(g) | | | (0.52 | )%(b)(h) | | | (0.93 | )%(c)(h) |
| | | | | | | | | | | | | | | | | | | | | | | | | | |
| | | | | | | |
Supplemental Data | | | | | | | | | | | | | | | | | | | | | | | | | | |
Net assets, end of year (000) | | | | $ | 4,322 | | | | | | | $ | 21,376 | | | $ | 39,413 | | | $ | 59,781 | | | $ | 130,476 | |
| | | | | | | | | | | | | | | | | | | | | | | | | | |
| | | | | | | |
Portfolio turnover rate | | | | | 208 | %(i) | | | | | | | 123 | % | | | 142 | % | | | 147 | % | | | 68 | % |
| | | | | | | | | | | | | | | | | | | | | | | | | | |
| (a) | Based on average shares outstanding. |
| (b) | Net investment income per share and the ratio of net investment income to average net assets includes $0.06 per share and 0.20%, respectively, resulting from a special dividend. |
| (c) | Net investment income per share and the ratio of net investment income to average net assets includes $0.03 per share and 0.08%, respectively, resulting from a special dividend. |
| (d) | Distributions for annual periods determined in accordance with U.S. federal income tax regulations. |
| (e) | Where applicable, excludes the effects of any sales charges and assumes the reinvestment of distributions. |
| (f) | From April 1, 2020 through February 28, 2021, the Fund invested in the Master LLC as part of a master-feeder structure and received its corresponding allocated fees waived and expenses and/or net investment income from the Master LLC. Includes the Fund’s share of the Master LLC’s allocated fees waived of 0.11%. |
| (g) | Includes the Fund’s share of the Master LLC’s allocated fees waived and expenses and/or net investment income. Includes the Fund’s share of the Master LLC’s allocated fees waived of 0.12%. |
| (h) | Includes the Fund’s share of the Master LLC’s allocated fees waived and expenses and/or net investment income. Includes the Fund’s share of the Master LLC’s allocated fees waived of less than 0.01%. |
| (i) | Portfolio turnover rate includes transactions from the Master LLC prior to March 1, 2021. |
See notes to financial statements.
| | |
| 24 | | 2 0 2 1 BLACK ROCK ANNUAL REPORT TO SHAREHOLDERS |
Financial Highlights (continued)
(For a share outstanding throughout each period)
| | | | | | | | | | | | | | | | | | | | |
| | | BlackRock Advantage SMID Cap Fund, Inc. (continued) | |
| | |
| | | | | | Class K | |
| | | |
| | | | | | | | | Period from | |
| | | | | | | Year Ended March 31, | | | | 01/25/18 | (a) |
| | | | | |
| | | | | | 2021 | | | 2020 | | | 2019 | | | to 03/31/18 | |
| | | | | |
Net asset value, beginning of period | | | | | | $ | 24.08 | | | $ | 27.38 | | | $ | 32.34 | | | $ | 34.28 | |
| | | | | | | | | | | | | | | | | | | | |
| | | | | |
Net investment income (loss)(b) | | | | | | | 0.34 | | | | 0.43 | | | | 0.42 | | | | (0.06 | ) |
Net realized and unrealized gain (loss) | | | | | | | 13.54 | | | | (2.89 | ) | | | 1.32 | | | | (1.88 | ) |
| | | | | | | | | | | | | | | | | | | | |
| | | | | |
Net increase (decrease) from investment operations | | | | | | | 13.88 | | | | (2.46 | ) | | | 1.74 | | | | (1.94 | ) |
| | | | | | | | | | | | | | | | | | | | |
| | | | | |
Distributions(c) | | | | | | | | | | | | | | | | | | | | |
From net investment income | | | | | | | (0.30 | ) | | | (0.39 | ) | | | (0.47 | ) | | | — | |
From net realized gain | | | | | | | (1.37 | ) | | | (0.45 | ) | | | (6.23 | ) | | | — | |
| | | | | | | | | | | | | | | | | | | | |
| | | | | |
Total distributions | | | | | | | (1.67 | ) | | | (0.84 | ) | | | (6.70 | ) | | | — | |
| | | | | | | | | | | | | | | | | | | | |
| | | | | |
Net asset value, end of period | | | | | | $ | 36.29 | | | $ | 24.08 | | | $ | 27.38 | | | $ | 32.34 | |
| | | | | | | | | | | | | | | | | | | | |
| | | | | |
Total Return(d) | | | | | | | | | | | | | | | | | | | | |
Based on net asset value | | | | | | | 58.16 | % | | | (9.53 | )% | | | 6.74 | % | | | (5.66 | )%(e) |
| | | | | | | | | | | | | | | | | | | | |
| | | | | |
Ratios to Average Net Assets | | | | | | | | | | | | | | | | | | | | |
Total expenses | | | | | | | 0.76 | %(f) | | | 0.77 | %(g) | | | 0.90 | %(g) | | | 0.87 | %(h)(i) |
| | | | | | | | | | | | | | | | | | | | |
| | | | | |
Total expenses after fees waived and/or reimbursed | | | | | | | 0.43 | %(f) | | | 0.43 | %(g) | | | 0.43 | %(g) | | | 0.43 | %(h)(i) |
| | | | | | | | | | | | | | | | | | | | |
| | | | | |
Net investment income (loss) | | | | | | | 1.08 | %(f) | | | 1.49 | %(g) | | | 1.53 | %(g) | | | (1.06 | )%(h)(i) |
| | | | | | | | | | | | | | | | | | | | |
| | | | | |
Supplemental Data | | | | | | | | | | | | | | | | | | | | |
Net assets, end of period (000) | | | | | | $ | 2,372 | | | $ | 1,549 | | | $ | 2,241 | | | $ | 2,736 | |
| | | | | | | | | | | | | | | | | | | | |
| | | | | |
Portfolio turnover rate | | | | | | | 208 | %(j) | | | 123 | % | | | 142 | % | | | 147 | % |
| | | | | | | | | | | | | | | | | | | | |
| (a) | Commencement of operations. |
| (b) | Based on average shares outstanding. |
| (c) | Distributions for annual periods determined in accordance with U.S. federal income tax regulations. |
| (d) | Where applicable, assumes the reinvestment of distributions. |
| (e) | Aggregate total return. |
| (f) | From April 1, 2020 through February 28, 2021, the Fund invested in the Master LLC as part of a master-feeder structure and received its corresponding allocated fees waived and expenses and/or net investment income from the Master LLC. Includes the Fund’s share of the Master LLC’s allocated fees waived of 0.11%. |
| (g) | Includes the Fund’s share of the Master LLC’s allocated fees waived and expenses and/or net investment income. Includes the Fund’s share of the Master LLC’s allocated fees waived of 0.12%. |
| (i) | Includes the Fund’s share of the Master LLC’s allocated net expenses and/or net investment income. |
| (j) | Portfolio turnover rate includes transactions from the Master LLC prior to March 1, 2021. |
See notes to financial statements.
Financial Highlights (continued)
(For a share outstanding throughout each period)
| | | | | | | | | | | | | | | | | | | | | | | | | | |
| | | BlackRock Advantage SMID Cap Fund, Inc. (continued) | |
| | |
| | | | | Class R | |
| |
| | | Year Ended March 31, | |
| | | | | |
| | | 2021 | | | 2020 | | | 2019 | | | 2018 | | | 2017 | |
| | | | | | | |
Net asset value, beginning of year | | | | $ | 16.66 | | | | | | | $ | 19.18 | | | $ | 24.61 | | | $ | 27.65 | | | $ | 23.63 | |
| | | | | | | | | | | | | | | | | | | | | | | | | | |
| | | | | | | |
Net investment income (loss)(a) | | | | | 0.12 | | | | | | | | 0.19 | | | | 0.19 | | | | (0.00 | )(b)(c) | | | (0.11 | )(d) |
Net realized and unrealized gain (loss) | | | | | 9.31 | | | | | | | | (1.98 | ) | | | 0.95 | | | | 2.07 | | | | 5.31 | |
| | | | | | | | | | | | | | | | | | | | | | | | | | |
| | | | | | | |
Net increase (decrease) from investment operations | | | | | 9.43 | | | | | | | | (1.79 | ) | | | 1.14 | | | | 2.07 | | | | 5.20 | |
| | | | | | | | | | | | | | | | | | | | | | | | | | |
| | | | | | | |
Distributions(e) | | | | | | | | | | | | | | | | | | | | | | | | | | |
From net investment income | | | | | (0.16 | ) | | | | | | | (0.28 | ) | | | (0.34 | ) | | | — | | | | — | |
From net realized gain | | | | | (1.37 | ) | | | | | | | (0.45 | ) | | | (6.23 | ) | | | (5.11 | ) | | | (1.18 | ) |
| | | | | | | | | | | | | | | | | | | | | | | | | | |
| | | | | | | |
Total distributions | | | | | (1.53 | ) | | | | | | | (0.73 | ) | | | (6.57 | ) | | | (5.11 | ) | | | (1.18 | ) |
| | | | | | | | | | | | | | | | | | | | | | | | | | |
| | | | | | | |
Net asset value, end of year | | | | $ | 24.56 | | | | | | | $ | 16.66 | | | $ | 19.18 | | | $ | 24.61 | | | $ | 27.65 | |
| | | | | | | | | | | | | | | | | | | | | | | | | | |
| | | | | | | |
Total Return(f) | | | | | | | | | | | | | | | | | | | | | | | | | | |
Based on net asset value | | | | | 57.23 | % | | | | | | | (10.00 | )% | | | 6.31 | % | | | 7.87 | % | | | 21.97 | % |
| | | | | | | | | | | | | | | | | | | | | | | | | | |
| | | | | | | |
Ratios to Average Net Assets | | | | | | | | | | | | | | | | | | | | | | | | | | |
Total expenses | | | | | 1.40 | %(g) | | | | | | | 1.41 | %(h) | | | 1.54 | %(h) | | | 1.60 | %(i) | | | 1.55 | %(i) |
| | | | | | | | | | | | | | | | | | | | | | | | | | |
| | | | | | | |
Total expenses after fees waived and/or reimbursed | | | | | 0.98 | %(g) | | | | | | | 0.98 | %(h) | | | 0.98 | %(h) | | | 1.44 | %(i) | | | 1.55 | %(i) |
| | | | | | | | | | | | | | | | | | | | | | | | | | |
| | | | | | | |
Net investment income (loss) | | | | | 0.56 | %(g) | | | | | | | 0.94 | %(h) | | | 0.98 | %(h) | | | (0.01 | )%(c)(i) | | | (0.42 | )%(d)(i) |
| | | | | | | | | | | | | | | | | | | | | | | | | | |
| | | | | | | |
Supplemental Data | | | | | | | | | | | | | | | | | | | | | | | | | | |
Net assets, end of year (000) | | | | $ | 5,879 | | | | | | | $ | 8,359 | | | $ | 17,433 | | | $ | 22,726 | | | $ | 26,004 | |
| | | | | | | | | | | | | | | | | | | | | | | | | | |
| | | | | | | |
Portfolio turnover rate | | | | | 208 | %(j) | | | | | | | 123 | % | | | 142 | % | | | 147 | % | | | 68 | % |
| | | | | | | | | | | | | | | | | | | | | | | | | | |
| (a) | Based on average shares outstanding. |
| (b) | Amount is greater than $(0.005) per share. |
| (c) | Net investment income per share and the ratio of net investment income to average net assets includes $0.06 per share and 0.20%, respectively, resulting from a special dividend. |
| (d) | Net investment income per share and the ratio of net investment income to average net assets includes $0.03 per share and 0.08%, respectively, resulting from a special dividend. |
| (e) | Distributions for annual periods determined in accordance with U.S. federal income tax regulations. |
| (f) | Where applicable, assumes the reinvestment of distributions. |
| (g) | From April 1, 2020 through February 28, 2021, the Fund invested in the Master LLC as part of a master-feeder structure and received its corresponding allocated fees waived and expenses and/or net investment income from the Master LLC. Includes the Fund’s share of the Master LLC’s allocated fees waived of 0.11%. |
| (h) | Includes the Fund’s share of the Master LLC’s allocated fees waived and expenses and/or net investment income. Includes the Fund’s share of the Master LLC’s allocated fees waived of 0.12%. |
| (i) | Includes the Fund’s share of the Master LLC’s allocated fees waived and expenses and/or net investment income. Includes the Fund’s share of the Master LLC’s allocated fees waived of less than 0.01%. |
| (j) | Portfolio turnover rate includes transactions from the Master LLC prior to March 1, 2021. |
See notes to financial statements.
| | |
| 26 | | 2 0 2 1 BLACK ROCK ANNUAL REPORT TO SHAREHOLDERS |
Notes to Financial Statements
BlackRock Advantage SMID Cap Fund, Inc. (the “Fund”) (formerly known as BlackRock Advantage U.S. Total Market Fund, Inc.) is registered under the Investment Company Act of 1940, as amended (the “1940 Act”), as an open-end management investment company. The Fund is organized as a Maryland corporation. The Fund is classified as diversified.
The Fund offers multiple classes of shares. All classes of shares have identical voting, dividend, liquidation and other rights and are subject to the same terms and conditions, except that certain classes bear expenses related to the shareholder servicing and distribution of such shares. Institutional and Class K Shares are sold only to certain eligible investors. Investor A, Investor C and Class R Shares bear certain expenses related to shareholder servicing of such shares, and Investor C and Class R Shares also bear certain expenses related to the distribution of such shares. Investor A and Investor C Shares are generally available through financial intermediaries. Class R Shares are sold only to certain employer-sponsored retirement plans. Each class has exclusive voting rights with respect to matters relating to its shareholder servicing and distribution expenditures (except that Investor C shareholders may vote on material changes to the Investor A Shares distribution and service plan).
| | | | | | | | |
| | | | |
| Share Class | | Initial Sales Charge | | CDSC | | | Conversion Privilege |
| | | |
Institutional, Class K and Class R Shares | | No | | | No | | | None |
Investor A Shares | | Yes | | | No | (a) | | None |
Investor C Shares | | No | | | Yes | (b) | | To Investor A Shares after approximately 8 years |
|
| | (a) | Investor A Shares may be subject to a contingent deferred sales charge (“CDSC”) for certain redemptions where no initial sales charge was paid at the time of purchase. | |
| | (b) | A CDSC of 1.00% is assessed on certain redemptions of Investor C Shares made within one year after purchase. | |
Prior to March 1, 2021, the Fund invested all of its assets in Master Advantage SMID Cap LLC (the “Master LLC”) (formerly known as Master Advantage U.S. Total Market LLC), an affiliate of the Fund, which had the same investment objective and strategies as the Fund. The value of the Fund’s investment in the Master LLC reflected the Fund’s proportionate interest in the net assets of the Master LLC. The performance of the Fund was directly affected by the performance of the Master LLC. As of February 28, 2021, the Fund owned 100% of the Master LLC. For the period April 1, 2020 to February 28, 2021, the Master LLC allocated $3,441,675, $119,292,344, and $24,661,474 from net investment income, net realized gains and net change in unrealized appreciation (depreciation), respectively, to the Fund.
On March 1, 2021, the Fund ceased to invest in the Master LLC as part of a “master-feeder” structure and began to operate as a stand-alone fund. In connection with this change, the Fund entered into a management agreement with BlackRock Advisors, LLC (the “Manager”), the terms of which are substantially the same as the management agreement between the Manager and the Master LLC, including the management fee rate. The Fund received net assets of $372,271,250 which included net unrealized appreciation of $3,621,564 in exchange for its ownership in the Master LLC. The cost basis for the investments received from the Master LLC was carried forward to align ongoing reporting of the Fund’s realized and unrealized gains and losses with amounts distributable to shareholders for tax purposes.
The Fund, together with certain other registered investment companies advised by the Manager or its affiliates, is included in a complex of equity, multi-asset, index and money market funds referred to as the BlackRock Multi-Asset Complex.
| 2. | SIGNIFICANT ACCOUNTING POLICIES |
The financial statements are prepared in conformity with accounting principles generally accepted in the United States of America (“U.S. GAAP”), which may require management to make estimates and assumptions that affect the reported amounts of assets and liabilities in the financial statements, disclosure of contingent assets and liabilities at the date of the financial statements and the reported amounts of increases and decreases in net assets from operations during the reporting period. Actual results could differ from those estimates. The Fund is considered an investment company under U.S. GAAP and follows the accounting and reporting guidance applicable to investment companies. Below is a summary of significant accounting policies:
Investment Transactions and Income Recognition: For financial reporting purposes, investment transactions are recorded on the dates the transactions are executed. Realized gains and losses on investment transactions are determined using the specific identification method. Dividend income and capital gain distributions, if any, are recorded on the ex-dividend dates. Non-cash dividends, if any, are recorded on the ex-dividend dates at fair value. Dividends from foreign securities where the ex-dividend dates may have passed are subsequently recorded when the Fund is informed of the ex-dividend dates. Under the applicable foreign tax laws, a withholding tax at various rates may be imposed on capital gains, dividends and interest. Upon notification from issuers, a portion of the dividend income received from a real estate investment trust may be redesignated as a reduction of cost of the related investment and/or realized gain. Interest income, including amortization and accretion of premiums and discounts on debt securities, is recognized daily on an accrual basis. Income, expenses and realized and unrealized gains and losses are allocated daily to each class based on its relative net assets.
Prior to March 1, 2021, the Fund’s, for financial reporting purposes, contributions to and withdrawals from the Master LLC were accounted for on a trade date basis. The Fund recorded its proportionate share of the Master LLC’s income, expenses and realized and unrealized gains and losses on a daily basis. In addition, the Fund accrued its own expenses. Income, expenses and realized and unrealized gains and losses were allocated daily to each class based on its relative net assets.
Foreign Currency Translation: The Fund’s books and records are maintained in U.S. dollars. Securities and other assets and liabilities denominated in foreign currencies are translated into U.S. dollars using exchange rates determined as of the close of trading on the New York Stock Exchange (“NYSE”). Purchases and sales of investments are recorded at the rates of exchange prevailing on the respective dates of such transactions. Generally, when the U.S. dollar rises in value against a foreign currency, the investments denominated in that currency will lose value; the opposite effect occurs if the U.S. dollar falls in relative value.
The Fund does not isolate the effect of fluctuations in foreign exchange rates from the effect of fluctuations in the market prices of investments for financial reporting purposes. Accordingly, the effects of changes in exchange rates on investments are not segregated in the Statement of Operations from the effects of changes in market prices of those
| | |
NOTES TO FINANCIAL STATEMENTS | | 27 |
Notes to Financial Statements (continued)
investments, but are included as a component of net realized and unrealized gain (loss) from investments. The Fund reports realized currency gains (losses) on foreign currency related transactions as components of net realized gain (loss) for financial reporting purposes, whereas such components are generally treated as ordinary income for U.S. federal income tax purposes.
Foreign Taxes: The Fund may be subject to foreign taxes (a portion of which may be reclaimable) on income, stock dividends, capital gains on investments, or certain foreign currency transactions. All foreign taxes are recorded in accordance with the applicable foreign tax regulations and rates that exist in the foreign jurisdictions in which the Fund invests. These foreign taxes, if any, are paid by the Fund and are reflected in its Statement of Operations as follows: foreign taxes withheld at source are presented as a reduction of income, foreign taxes on securities lending income are presented as a reduction of securities lending income, foreign taxes on stock dividends are presented as “Foreign taxes withheld”, and foreign taxes on capital gains from sales of investments and foreign taxes on foreign currency transactions are included in their respective net realized gain (loss) categories. Foreign taxes payable or deferred as of March 31, 2021, if any, are disclosed in the Statement of Assets and Liabilities.
The Fund files withholding tax reclaims in certain jurisdictions to recover a portion of amounts previously withheld. The Fund may record a reclaim receivable based on collectability, which includes factors such as the jurisdiction’s applicable laws, payment history and market convention. The Statement of Operations includes tax reclaims recorded as well as professional and other fees, if any, associated with recovery of foreign withholding taxes.
Segregation and Collateralization: In cases where the Fund enters into certain investments (e.g., futures contracts) that would be treated as “senior securities” for 1940 Act purposes, the Fund may segregate or designate on its books and records cash or liquid assets having a market value at least equal to the amount of its future obligations under such investments. Doing so allows the investment to be excluded from treatment as a “senior security.” Furthermore, if required by an exchange or counterparty agreement, the Fund may be required to deliver/deposit cash and/or securities to/with an exchange, or broker-dealer or custodian as collateral for certain investments or obligations.
Distributions: Distributions paid by the Fund are recorded on the ex-dividend dates. The character and timing of distributions are determined in accordance with U.S. federal income tax regulations, which may differ from U.S. GAAP.
Indemnifications: In the normal course of business, the Fund enters into contracts that contain a variety of representations that provide general indemnification. The Fund’s maximum exposure under these arrangements is unknown because it involves future potential claims against the Fund, which cannot be predicted with any certainty.
Other: Expenses directly related to the Fund or its classes are charged to the Fund or the applicable class. Expenses directly related to the Fund and other shared expenses prorated to the Fund are allocated daily to each class based on its relative net assets or other appropriate methods. Other operating expenses shared by several funds, including other funds managed by the Administrator, are prorated among those funds on the basis of relative net assets or other appropriate methods.
The Fund has an arrangement with its custodian whereby credits are earned on uninvested cash balances, which could be used to reduce custody fees and/or overdraft charges. The Fund may incur charges on overdrafts, subject to certain conditions.
| 3. | INVESTMENT VALUATION AND FAIR VALUE MEASUREMENTS |
Investment Valuation Policies: The Fund’s investments are valued at fair value (also referred to as “market value” within the financial statements) each day that the Fund is open for business and, for financial reporting purposes, as of the report date. U.S. GAAP defines fair value as the price a fund would receive to sell an asset or pay to transfer a liability in an orderly transaction between market participants at the measurement date. The Fund determines the fair values of its financial instruments using various independent dealers or pricing services under policies approved by the Board of Directors of the Fund (the “Board”). If a security’s market price is not readily available or does not otherwise accurately represent the fair value of the security, the security will be valued in accordance with a policy approved by the Board as reflecting fair value. The BlackRock Global Valuation Methodologies Committee (the “Global Valuation Committee”) is the committee formed by management to develop global pricing policies and procedures and to oversee the pricing function for all financial instruments. Prior to March 1, 2021, the Fund recorded its investment in the Master LLC at fair value based on the Fund’s proportionate interest in the net assets of the Master LLC.
Fair Value Inputs and Methodologies: The following methods and inputs are used to establish the fair value of the Fund’s assets and liabilities:
| | • | | Equity investments traded on a recognized securities exchange are valued at that day’s official closing price, as applicable, on the exchange where the stock is primarily traded. Equity investments traded on a recognized exchange for which there were no sales on that day may be valued at the last available bid (long positions) or ask (short positions) price. |
Generally, trading in foreign instruments is substantially completed each day at various times prior to the close of trading on the NYSE. Occasionally, events affecting the values of such instruments may occur between the foreign market close and the close of trading on the NYSE that may not be reflected in the computation of the Fund’s net assets. Each business day, the Fund uses a pricing service to assist with the valuation of certain foreign exchange-traded equity securities and foreign exchange-traded and over-the-counter (“OTC”) options (the “Systematic Fair Value Price”). Using current market factors, the Systematic Fair Value Price is designed to value such foreign securities and foreign options at fair value as of the close of trading on the NYSE, which follows the close of the local markets.
| | • | | Investments in open-end U.S. mutual funds (including money market funds) are valued at that day’s published net asset value (“NAV”). |
| | • | | The Fund values its investment in SL Liquidity Series, LLC, Money Market Series (the “Money Market Series”) at fair value, which is ordinarily based upon its pro rata ownership in the underlying fund’s net assets. |
| | • | | Futures contracts are valued based on that day’s last reported settlement or trade price on the exchange where the contract is traded. |
If events (e.g., a market closure, market volatility, company announcement or a natural disaster) occur that are expected to materially affect the value of such investment, or in the event that application of these methods of valuation results in a price for an investment that is deemed not to be representative of the market value of such investment, or if a price is not available, the investment will be valued by the Global Valuation Committee, or its delegate, in accordance with a policy approved by the Board as reflecting fair value (“Fair Valued Investments”). The fair valuation approaches that may be used by the Global Valuation Committee include market approach, income approach and cost
| | |
| 28 | | 2 0 2 1 BLACK ROCK ANNUAL REPORT TO SHAREHOLDERS |
Notes to Financial Statements (continued)
approach. Valuation techniques such as discounted cash flow, use of market comparables and matrix pricing are types of valuation approaches and are typically used in determining fair value. When determining the price for Fair Valued Investments, the Global Valuation Committee, or its delegate, seeks to determine the price that the Fund might reasonably expect to receive or pay from the current sale or purchase of that asset or liability in an arm’s-length transaction. Fair value determinations shall be based upon all available factors that the Global Valuation Committee, or its delegate, deems relevant and consistent with the principles of fair value measurement. The pricing of all Fair Valued Investments is subsequently reported to the Board or a committee thereof on a quarterly basis.
Fair Value Hierarchy: Various inputs are used in determining the fair value of financial instruments. These inputs to valuation techniques are categorized into a fair value hierarchy consisting of three broad levels for financial reporting purposes as follows:
| | • | | Level 1 – Unadjusted price quotations in active markets/exchanges for identical assets or liabilities that the Fund has the ability to access; |
| | • | | Level 2 – Other observable inputs (including, but not limited to, quoted prices for similar assets or liabilities in markets that are active, quoted prices for identical or similar assets or liabilities in markets that are not active, inputs other than quoted prices that are observable for the assets or liabilities (such as interest rates, yield curves, volatilities, prepayment speeds, loss severities, credit risks and default rates) or other market–corroborated inputs); and |
| | • | | Level 3 – Unobservable inputs based on the best information available in the circumstances, to the extent observable inputs are not available (including the Global Valuation Committee’s assumptions used in determining the fair value of financial instruments). |
The hierarchy gives the highest priority to unadjusted quoted prices in active markets for identical assets or liabilities (Level 1 measurements) and the lowest priority to unobservable inputs (Level 3 measurements). Accordingly, the degree of judgment exercised in determining fair value is greatest for instruments categorized in Level 3. The inputs used to measure fair value may fall into different levels of the fair value hierarchy. In such cases, for disclosure purposes, the fair value hierarchy classification is determined based on the lowest level input that is significant to the fair value measurement in its entirety. Investments classified within Level 3 have significant unobservable inputs used by the Global Valuation Committee in determining the price for Fair Valued Investments. Level 3 investments include equity or debt issued by Private Companies that may not have a secondary market and/or may have a limited number of investors. The categorization of a value determined for financial instruments is based on the pricing transparency of the financial instruments and is not necessarily an indication of the risks associated with investing in those securities.
As of March 31, 2021, certain investments of the Fund were fair valued using NAV per share as no quoted market value is available and therefore have been excluded from the fair value hierarchy.
| 4. | SECURITIES AND OTHER INVESTMENTS |
Securities Lending: The Fund may lend its securities to approved borrowers, such as brokers, dealers and other financial institutions. The borrower pledges and maintains with the Fund collateral consisting of cash, an irrevocable letter of credit issued by a bank, or securities issued or guaranteed by the U.S. Government. The initial collateral received by the Fund is required to have a value of at least 102% of the current value of the loaned securities for securities traded on U.S. exchanges and a value of at least 105% for all other securities. The collateral is maintained thereafter at a value equal to at least 100% of the current market value of the securities on loan. The market value of the loaned securities is determined at the close of each business day of the Fund and any additional required collateral is delivered to the Fund, or excess collateral returned by the Fund, on the next business day. During the term of the loan, the Fund is entitled to all distributions made on or in respect of the loaned securities, but does not receive interest income on securities received as collateral. Loans of securities are terminable at any time and the borrower, after notice, is required to return borrowed securities within the standard time period for settlement of securities transactions.
As of period end, any securities on loan were collateralized by cash and/or U.S. Government obligations. Cash collateral invested by the securities lending agent, BlackRock Investment Management, LLC (“BIM”), if any, is disclosed in the Schedule of Investments. Any non-cash collateral received cannot be sold, re-invested or pledged by the Fund, except in the event of borrower default. The securities on loan, if any, are disclosed in the Fund’s Schedule of Investments. The market value of any securities on loan and the value of any related collateral are shown separately in the Statement of Assets and Liabilities as a component of investments at value – unaffiliated and collateral on securities loaned at value, respectively.
Securities lending transactions are entered into by the Fund under Master Securities Lending Agreements (each, an “MSLA”), which provide the right, in the event of default (including bankruptcy or insolvency), for the non-defaulting party to liquidate the collateral and calculate a net exposure to the defaulting party or request additional collateral. In the event that a borrower defaults, the Fund, as lender, would offset the market value of the collateral received against the market value of the securities loaned. When the value of the collateral is greater than that of the market value of the securities loaned, the lender is left with a net amount payable to the defaulting party. However, bankruptcy or insolvency laws of a particular jurisdiction may impose restrictions on or prohibitions against such a right of offset in the event of an MSLA counterparty’s bankruptcy or insolvency. Under the MSLA, absent an event of default, the borrower can resell or re-pledge the loaned securities, and the Fund can reinvest cash collateral received in connection with loaned securities. Upon an event of default, the parties’ obligations to return the securities or collateral to the other party are extinguished, and the parties can resell or re-pledge the loaned securities or the collateral received in connection with the loaned securities in order to satisfy the defaulting party’s net payment obligation for all transactions under the MSLA. The defaulting party remains liable for any deficiency.
| | |
NOTES TO FINANCIAL STATEMENTS | | 29 |
Notes to Financial Statements (continued)
As of period end, the following table is a summary of the Fund’s securities on loan by counterparty which are subject to offset under an MSLA:
| | | | | | | | | | | | | | | | | | | | | | | | | | |
| | | | | | | |
| | | Securities | | | | | | | | | | Cash | | | | | | | | Net | |
Counterparty | | | Loaned at Value | | | | | | | Collateral Received(a) | | | | Amount | (b) |
| | | | | | | |
Credit Suisse Securities (USA) LLC | | | | | | $ | 299,187 | | | | | | | | | $ | (296,151 | ) | | | | | | $ | 3,036 | |
State Street Bank & Trust Co | | | | | | | 235,819 | | | | | | | | | | (235,819 | ) | | | | | | | — | |
| | | | | | | | | | | | | | | | | | | | | | | | | | |
| | | | | | $ | 535,006 | | | | | | | | | $ | (531,970 | ) | | | | | | $ | 3,036 | |
| | | | | | | | | | | | | | | | | | | | | | | | | | |
| | (a) | Collateral received in excess of the market value of securities on loan is not presented in this table. The total cash collateral received by the Fund is disclosed in the Fund’s Statement of Assets and Liabilities. | |
| | (b) | The market value of the loaned securities is determined as of March 31, 2021. Additional collateral is delivered to the Fund on the next business day in accordance with the MSLA. The net amount would be subject to the borrower default indemnity in the event of default by the counterparty. | |
The risks of securities lending include the risk that the borrower may not provide additional collateral when required or may not return the securities when due. To mitigate these risks, the Fund benefits from a borrower default indemnity provided by BIM. BIM’s indemnity allows for full replacement of the securities loaned to the extent the collateral received does not cover the value on the securities loaned in the event of borrower default. The Fund could incur a loss if the value of an investment purchased with cash collateral falls below the market value of loaned securities or if the value of an investment purchased with cash collateral falls below the value of the original cash collateral received. Such losses are borne entirely by the Fund.
| 5. | DERIVATIVE FINANCIAL INSTRUMENTS |
The Fund engages in various portfolio investment strategies using derivative contracts both to increase the returns of the Fund and/or to manage its exposure to certain risks such as credit risk, equity risk, interest rate risk, foreign currency exchange rate risk, commodity price risk or other risks (e.g., inflation risk). Derivative financial instruments categorized by risk exposure are included in the Schedule of Investments. These contracts may be transacted on an exchange or OTC.
Futures Contracts: Futures contracts are purchased or sold to gain exposure to, or manage exposure to, changes in interest rates (interest rate risk) and changes in the value of equity securities (equity risk) or foreign currencies (foreign currency exchange rate risk).
Futures contracts are exchange-traded agreements between the Fund and a counterparty to buy or sell a specific quantity of an underlying instrument at a specified price and on a specified date. Depending on the terms of a contract, it is settled either through physical delivery of the underlying instrument on the settlement date or by payment of a cash amount on the settlement date. Upon entering into a futures contract, the Fund is required to deposit initial margin with the broker in the form of cash or securities in an amount that varies depending on a contract’s size and risk profile. The initial margin deposit must then be maintained at an established level over the life of the contract. Amounts pledged, which are considered restricted, are included in cash pledged for futures contracts in the Statement of Assets and Liabilities.
Securities deposited as initial margin are designated in the Schedule of Investments and cash deposited, if any, are shown as cash pledged for futures contracts in the Statement of Assets and Liabilities. Pursuant to the contract, the Fund agrees to receive from or pay to the broker an amount of cash equal to the daily fluctuation in market value of the contract (“variation margin”). Variation margin is recorded as unrealized appreciation (depreciation) and, if any, shown as variation margin receivable (or payable) on futures contracts in the Statement of Assets and Liabilities. When the contract is closed, a realized gain or loss is recorded in the Statement of Operations equal to the difference between the notional amount of the contract at the time it was opened and the notional amount at the time it was closed. The use of futures contracts involves the risk of an imperfect correlation in the movements in the price of futures contracts and interest rates, foreign currency exchange rates or underlying assets.
| 6. | INVESTMENT ADVISORY AGREEMENT AND OTHER TRANSACTIONS WITH AFFILIATES |
Investment Advisory: Prior to March 1, 2021, the Master LLC entered into an Investment Advisory Agreement with the Manager, the Master LLC’s investment adviser and an indirect, wholly-owned subsidiary of BlackRock, Inc. (“BlackRock”), to provide investment advisory and administrative services. The Manager was responsible for the management of the Master LLC’s portfolio and provided the personnel, facilities, equipment and certain other services necessary to the operations of the Master LLC.
On March 1, 2021, the Fund entered into an Investment Advisory Agreement with the Manager, the terms of which are substantially the same as the Investment Advisory Agreement between Manager and the Master LLC, including the investment advisory fee rate.
For such services, the Manager is paid a monthly fee at an annual rate equal to the following percentages of the average daily value of the net assets:
| | | | |
| | |
| Average Daily Net Assets | | Investment Advisory Fees | |
| |
First $1 billion | | | 0.500 | % |
$1 billion - $1.5 billion | | | 0.475 | |
Greater than $1.5 billion | | | 0.450 | |
For the year ended March 31, 2021, the Fund reimbursed the Manager $3,709 for certain accounting services, which is included in accounting services in the Statement of Operations.
| | |
| 30 | | 2 0 2 1 BLACK ROCK ANNUAL REPORT TO SHAREHOLDERS |
Notes to Financial Statements (continued)
Service and Distribution Fees: The Fund entered into a Distribution Agreement and Distribution and Service Plans with BlackRock Investments, LLC (“BRIL”), an affiliate of the Manager. Pursuant to the Distribution and Service Plans and in accordance with Rule 12b-1 under the 1940 Act, the Fund pays BRIL ongoing service and distribution fees. The fees are accrued daily and paid monthly at annual rates based upon the average daily net assets of the relevant share class of the Fund as follows:
| | | | | | | | |
| | | |
| Share Class | | Service Fees | | | Distribution Fees | |
| | |
Investor A | | | 0.25 | % | | | N/A | |
Investor C | | | 0.25 | | | | 0.75 | % |
Class R | | | 0.25 | | | | 0.25 | |
BRIL and broker-dealers, pursuant to sub-agreements with BRIL, provide shareholder servicing and distribution services to the Fund. The ongoing service and/or distribution fee compensates BRIL and each broker-dealer for providing shareholder servicing and/or distribution related services to shareholders.
For the year ended March 31, 2021, the following table shows the class specific service and distribution fees borne directly by each share class of the Fund:
| | | | | | | | | | | | | | | | |
| | | | | |
| | | Investor A | | | Investor C | | | Class R | | | Total | |
| | | | |
Service and distribution fees — class specific | | | $ 580,753 | | | | $ 128,004 | | | | $ 33,752 | | | | $ 742,509 | |
Administration: Effective March 1, 2021, the Fund entered into an Administration Agreement with the Manager, an indirect, wholly-owned subsidiary of BlackRock, to provide administrative services. For these services, the Manager receives an administration fee computed daily and payable monthly, based on a percentage of the average daily net assets of the Fund. The administration fee, which is shown as administration in the Statement of Operations, is paid at the annual rates below.
| | | | |
| | |
| Average Daily Net Assets | | Administration Fees | |
| |
First $500 million | | | 0.0425 | % |
$500 million - $1 billion | | | 0.0400 | |
$1 billion - $2 billion | | | 0.0375 | |
$2 billion - $4 billion | | | 0.0350 | |
$4 billion - $13 billion | | | 0.0325 | |
Greater than $13 billion | | | 0.0300 | |
Prior to March 1, 2021, the Fund entered into an Administration Agreement with the Manager to provide administrative services (other than investment advice and related portfolio activities). For such services, the Fund paid the Manager a monthly fee at an annual rate of 0.25% of the average daily net assets of the Fund. This fee is shown as administration in the Statement of Operations.
In addition, effective March 1, 2021, the Manager charges each of the share classes an administration fee, which is shown as administration - class specific in the Statement of Operations, at an annual rate of 0.02% of the average daily net assets of each respective class.
For the period from March 1, 2021 through March 31, 2021, the Fund paid the following to the Manager in return for these services, which are included in administration - class specific in the Statement of Operations:
| | | | | | | | | | | | | | | | | | | | | | | | |
| | | | | | | |
| | | Institutional | | | Investor A | | | Investor C | | | Class K | | | Class R | | | Total | |
| | | | | | |
Administration fees — class specific | | | $ 1,754 | | | | $ 4,423 | | | | $ 75 | | | | $ 40 | | | | $ 102 | | | | $ 6,394 | |
Transfer Agent: Pursuant to written agreements, certain financial intermediaries, some of which may be affiliates, provide the Fund with sub-accounting, recordkeeping, sub-transfer agency and other administrative services with respect to servicing of underlying investor accounts. For these services, these entities receive an asset-based fee or an annual fee per shareholder account, which will vary depending on share class and/or net assets. For the year ended March 31, 2021, the Fund did not pay any amounts to affiliates in return for these services.
The Manager maintains a call center that is responsible for providing certain shareholder services to the Fund. Shareholder services include responding to inquiries and processing purchases and sales based upon instructions from shareholders. For the year ended March 31, 2021, the Fund reimbursed the Manager the following amounts for costs incurred in running the call center, which are included in transfer agent — class specific in the Statement of Operations:
| | | | | | | | | | | | | | | | | | | | |
| | | | | | |
| | | Institutional | | | Investor A | | | Investor C | | | Class R | | | Total | |
| | | | | |
Reimbursed amounts | | | $ 5,027 | | | | $ 3,946 | | | | $ 803 | | | | $ 135 | | | | $ 9,911 | |
For the year ended March 31, 2021, the following table shows the class specific transfer agent fees borne directly by each share class of the Fund:
| | | | | | | | | | | | | | | | | | | | | | | | |
| | | | | | | |
| | | Institutional | | | Investor A | | | Investor C | | | Class K | | | Class R | | | Total | |
| | | | | | |
Transfer agent fees — class specific | | | $ 117,041 | | | | $ 269,279 | | | | $ 20,289 | | | | $ 635 | | | | $ 10,997 | | | | $ 418,241 | |
Other Fees: For the year ended March 31, 2021, affiliates earned underwriting discounts, direct commissions and dealer concessions on sales of the Fund’s Investor A Shares of $2,464.
| | |
NOTES TO FINANCIAL STATEMENTS | | 31 |
Notes to Financial Statements (continued)
For the year ended March 31, 2021, affiliates received CDSCs as follows:
| | |
| | |
| Share Class | | Amounts |
| |
Investor A | | $ 71 |
Investor C | | 16 |
| | $ 87 |
Expense Limitations, Waivers and Reimbursements: Effective March 1, 2021, the Manager contractually agreed to waive its investment advisory fees by the amount of investment advisory fees the Fund pays to the Manager indirectly through its investment in affiliated money market funds (the “affiliated money market fund waiver”) through June 30, 2023. The contractual agreement may be terminated upon 90 days’ notice by a majority of the directors who are not “interested persons” of the Fund, as defined in the 1940 Act (“Independent Directors”), or by a vote of a majority of the outstanding voting securities of the Fund. The amount of waivers and/or reimbursements of fees and expenses made pursuant to the expense limitation described below will be reduced by the amount of the affiliated money market fund waiver. This waiver was voluntary until July 29, 2020 and thereafter became contractual until February 28, 2021. This amount is included in fees waived and/or reimbursed by the Manager in the Statement of Operations. For the year ended March 31, 2021, the amount waived was $441.
Effective March 1, 2021, the Manager has contractually agreed to waive its investment advisory fee with respect to any portion of the Fund’s assets invested in affiliated equity and fixed-income mutual funds and affiliated exchange-traded funds that have a contractual management fee through June 30, 2023. The contractual agreement may be terminated upon 90 days’ notice by a majority of the Independent Directors, or by a vote of a majority of the outstanding voting securities of the Fund. For the year ended March 31, 2021, there were no fees waived and/or reimbursed by the Manager pursuant to this arrangement.
The Manager contractually agreed to waive and/or reimburse fees or expenses in order to limit expenses, excluding interest expense, dividend expense, tax expense, acquired fund fees and expenses, and certain other fund expenses, which constitute extraordinary expenses not incurred in the ordinary course of the Fund’s business (“expense limitation”). The expense limitations as a percentage of average daily net assets are as follows:
| | | | |
| | |
| Share Class | | Expense Limitations | |
| |
Institutional | | | 0.48 | % |
Investor A | | | 0.73 | |
Investor C | | | 1.48 | |
Class K | | | 0.43 | |
Class R | | | 0.98 | |
The Manager has agreed not to reduce or discontinue these contractual expense limitations through June 30, 2023, unless approved by the Board, including a majority of the Independent Directors, or by a vote of a majority of the outstanding voting securities of the Fund. For the year ended March 31, 2021, the Manager waived and/or reimbursed $1,050,732, which is included in fees waived and/or reimbursed by the Manager in the Statement of Operations.
In addition, these amounts waived and/or reimbursed by the Manager are included in administration fees waived — class specific and transfer agent fees waived and/or reimbursed — class specific, respectively, in the Statement of Operations. For the year ended March 31, 2021, class specific expense waivers and/or reimbursements are as follows:
| | | | | | | | | | | | | | | | | | | | | | |
| | | | | | | |
| | | Institutional | | | Investor A | | | Investor C | | | Class K | | | Class R | | | Total |
| | | | | | |
Administration fees waived — class specific | | | $ 1,754 | | | | $ 4,423 | | | | $ 5 | | | | $ 40 | | | | $ 102 | | | $ 6,324 |
Transfer agent fees waived and/or reimbursed — class specific | | | 71,202 | | | | 152,282 | | | | 13,548 | | | | 635 | | | | 7,493 | | | 245,160 |
Securities Lending: The U.S. Securities and Exchange Commission (“SEC”) has issued an exemptive order which permits BIM, an affiliate of the Manager, to serve as securities lending agent for the Fund, subject to applicable conditions. As securities lending agent, BIM bears all operational costs directly related to securities lending. The Fund is responsible for expenses in connection with the investment of cash collateral received for securities on loan (the “collateral investment expenses”). The cash collateral is invested in a private investment company, Money Market Series, managed by the Manager or its affiliates. However, BIM has agreed to cap the collateral investment expenses of the Money Market Series to an annual rate of 0.04%. The investment adviser to the Money Market Series will not charge any advisory fees with respect to shares purchased by the Fund. The Money Market Series may, under certain circumstances, impose a liquidity fee of up to 2% of the value withdrawn or temporarily restrict withdrawals for up to 10 business days during a 90 day period, in the event that the private investment company’s weekly liquid assets fall below certain thresholds. The Money Market Series seeks current income consistent with maintaining liquidity and preserving capital. Although the Money Market Series is not registered under the 1940 Act, its investments may follow the parameters of investments by a money market fund that is subject to Rule 2a-7 under the 1940 Act.
Securities lending income is equal to the total of income earned from the reinvestment of cash collateral, net of fees and other payments to and from borrowers of securities, and less the collateral investment expenses. The Fund retains a portion of securities lending income and remits a remaining portion to BIM as compensation for its services as securities lending agent.
Pursuant to the current securities lending agreement, the Fund retains 77% of securities lending income (which excludes collateral investment expenses), and this amount retained can never be less than 70% of the total of securities lending income plus the collateral investment expenses.
In addition, commencing the business day following the date that the aggregate securities lending income earned across the BlackRock Multi-Asset Complex in a calendar year exceeds a specified threshold, the Fund, pursuant to the securities lending agreement, will retain for the remainder of that calendar year securities lending income in an amount equal to 81% of securities lending income (which excludes collateral investment expenses), and this amount retained can never be less than 70% of the total of securities lending income plus the collateral investment expenses.
| | |
| 32 | | 2 0 2 1 BLACK ROCK ANNUAL REPORT TO SHAREHOLDERS |
Notes to Financial Statements (continued)
Prior to January 1, 2021, the Fund retained 75% of securities lending income (which excluded collateral investment expenses) and the amount retained could never be less than 70% of the total of securities lending income plus the collateral investment expenses. In addition, commencing the business day following the date that the aggregate securities lending income earned across the BlackRock Multi-Asset Complex in a calendar year exceeded a specified threshold, the Fund would retain for the remainder of that calendar year 80% of securities lending income (which excluded collateral investment expenses), and the amount retained could never be less than 70% of the total of securities lending income plus the collateral investment expenses.
The share of securities lending income earned by the Fund is shown as securities lending income — affiliated — net in the Statement of Operations. For the year ended March 31, 2021, the Fund paid BIM $16,033 for securities lending agent services.
Interfund Lending: In accordance with an exemptive order (the “Order”) from the SEC, the Fund may participate in a joint lending and borrowing facility for temporary purposes (the “Interfund Lending Program”), subject to compliance with the terms and conditions of the Order, and to the extent permitted by the Fund’s investment policies and restrictions. The Fund is currently permitted to borrow and lend under the Interfund Lending Program.
A lending BlackRock fund may lend in aggregate up to 15% of its net assets, but may not lend more than 5% of its net assets to any one borrowing fund through the Interfund Lending Program. A borrowing BlackRock fund may not borrow through the Interfund Lending Program or from any other source more than 33 1/3% of its total assets (or any lower threshold provided for by the fund’s investment restrictions). If a borrowing BlackRock fund’s total outstanding borrowings exceed 10% of its total assets, each of its outstanding interfund loans will be subject to collateralization of at least 102% of the outstanding principal value of the loan. All interfund loans are for temporary or emergency purposes and the interest rate to be charged will be the average of the highest current overnight repurchase agreement rate available to a lending fund and the bank loan rate, as calculated according to a formula established by the Board.
During the year ended March 31, 2021, the Fund did not participate in the Interfund Lending Program.
Directors and Officers: Certain directors and/or officers of the Fund are directors and/or officers of BlackRock or its affiliates. The Fund reimburses the Administrator for a portion of the compensation paid to the Fund’s Chief Compliance Officer, which is included in Directors and Officer in the Statement of Operations.
For the year ended March 31, 2021, purchases and sales of investments, excluding short-term investments, were $689,964,998 and $754,321,992, respectively. These amounts include purchases and sales of investments from the Master LLC for the period from April 1, 2020 to February 28, 2021 of $637,442,455 and $699,756,837, respectively.
It is the Fund’s policy to comply with the requirements of the Internal Revenue Code of 1986, as amended, applicable to regulated investment companies, and to distribute substantially all of its taxable income to its shareholders. Therefore, no U.S. federal income tax provision is required.
The Fund files U.S. federal and various state and local tax returns. No income tax returns are currently under examination. The statute of limitations on the Fund’s U.S. federal tax returns generally remains open for a period of three fiscal years after they are filed. The statutes of limitations on the Fund’s state and local tax returns may remain open for an additional year depending upon the jurisdiction.
Management has analyzed tax laws and regulations and their application to the Fund as of March 31, 2021, inclusive of the open tax return years, and does not believe that there are any uncertain tax positions that require recognition of a tax liability in the Fund’s financial statements.
The tax character of distributions paid was as follows:
| | | | | | |
| | | | |
| | | 03/31/21 | | | | 03/31/20 |
| | | |
Ordinary income | | $ 7,724,847 | | | | $ 4,573,856 |
Long-term capital gains | | 9,275,329 | | | | 6,401,589 |
| | $ 17,000,176 | | | | $ 10,975,445 |
| | |
NOTES TO FINANCIAL STATEMENTS | | 33 |
Notes to Financial Statements (continued)
As of period end, the tax components of accumulated net earnings were as follows:
| | | | |
| |
| |
| | | Amounts | |
| |
| |
Undistributed ordinary income | | | $ 39,115,325 | |
Undistributed long-term capital gains | | | 64,355,898 | |
Net unrealized gains(a) | | | 7,728,759 | |
| | | | |
| |
| | $ | 111,199,982 | |
| | | | |
| | (a) | The difference between book-basis and tax-basis net unrealized gains was attributable primarily to the tax deferral of losses on wash sales, the realization for tax purposes of unrealized gain on investments in passive foreign investment companies, the timing and recognition of partnership income and the realization for tax purposes of unrealized gains/losses on certain futures contracts. | |
As of March 31, 2021, gross unrealized appreciation and depreciation based on cost of investments (including short positions and derivatives, if any) for U.S. federal income tax purposes were as follows:
| | | | |
| |
| |
| | | Amounts | |
| |
| |
Tax cost | | $ | 367,772,180 | |
| | | | |
| |
Gross unrealized appreciation | | $ | 27,804,865 | |
Gross unrealized depreciation | | | (20,077,311 | ) |
| | | | |
| |
Net unrealized appreciation (depreciation) | | $ | 7,727,554 | |
| | | | |
The Fund, along with certain other funds managed by the Manager and its affiliates (“Participating Funds”), is a party to a 364-day, $2.25 billion credit agreement with a group of lenders. Under this agreement, the Fund may borrow to fund shareholder redemptions. Excluding commitments designated for certain individual funds, the Participating Funds, including the Fund, can borrow up to an aggregate commitment amount of $1.75 billion at any time outstanding, subject to asset coverage and other limitations as specified in the agreement. The credit agreement has the following terms: a fee of 0.10% per annum on unused commitment amounts and interest at a rate equal to the higher of (a) one-month LIBOR (but, in any event, not less than 0.00%) on the date the loan is made plus 0.80% per annum or (b) the Fed Funds rate (but, in any event, not less than 0.00%) in effect from time to time plus 0.80% per annum on amounts borrowed. The agreement expires in April 2021 unless extended or renewed. These fees were allocated among such funds based upon portions of the aggregate commitment available to them and relative net assets of Participating Funds. During the year ended March 31, 2021, the Fund did not borrow under the credit agreement.
In the normal course of business, the Fund invests in securities or other instruments and may enter into certain transactions, and such activities subject the Fund to various risks, including among others, fluctuations in the market (market risk) or failure of an issuer to meet all of its obligations. The value of securities or other instruments may also be affected by various factors, including, without limitation: (i) the general economy; (ii) the overall market as well as local, regional or global political and/or social instability; (iii) regulation, taxation or international tax treaties between various countries; or (iv) currency, interest rate and price fluctuations. Local, regional or global events such as war, acts of terrorism, the spread of infectious illness or other public health issues, recessions, or other events could have a significant impact on the Fund and its investments. The Fund’s prospectus provides details of the risks to which the Fund is subject.
The Fund may be exposed to additional risks when reinvesting cash collateral in money market funds that do not seek to maintain a stable NAV per share of $1.00, which may be subject to redemption gates or liquidity fees under certain circumstances.
Market Risk: An outbreak of respiratory disease caused by a novel coronavirus has developed into a global pandemic and has resulted in closing borders, quarantines, disruptions to supply chains and customer activity, as well as general concern and uncertainty. The impact of this pandemic, and other global health crises that may arise in the future, could affect the economies of many nations, individual companies and the market in general in ways that cannot necessarily be foreseen at the present time. This pandemic may result in substantial market volatility and may adversely impact the prices and liquidity of a fund’s investments. The duration of this pandemic and its effects cannot be determined with certainty.
Valuation Risk: The market values of equities, such as common stocks and preferred securities or equity related investments, such as futures and options, may decline due to general market conditions which are not specifically related to a particular company. They may also decline due to factors which affect a particular industry or industries. The Fund may invest in illiquid investments. An illiquid investment is any investment that the Fund reasonably expects cannot be sold or disposed of in current market conditions in seven calendar days or less without the sale or disposition significantly changing the market value of the investment. The Fund may experience difficulty in selling illiquid investments in a timely manner at the price that it believes the investments are worth. Prices may fluctuate widely over short or extended periods in response to company, market or economic news. Markets also tend to move in cycles, with periods of rising and falling prices. This volatility may cause the Fund’s NAV to experience significant increases or decreases over short periods of time. If there is a general decline in the securities and other markets, the NAV of the Fund may lose value, regardless of the individual results of the securities and other instruments in which the Fund invests.
Counterparty Credit Risk: The Fund may be exposed to counterparty credit risk, or the risk that an entity may fail to or be unable to perform on its commitments related to unsettled or open transactions, including making timely interest and/or principal payments or otherwise honoring its obligations. The Fund manages counterparty credit risk by entering into transactions only with counterparties that the Manager believes have the financial resources to honor their obligations and by monitoring the financial stability of
| | |
| 34 | | 2 0 2 1 BLACK ROCK ANNUAL REPORT TO SHAREHOLDERS |
Notes to Financial Statements (continued)
those counterparties. Financial assets, which potentially expose the Fund to market, issuer and counterparty credit risks, consist principally of financial instruments and receivables due from counterparties. The extent of the Fund’s exposure to market, issuer and counterparty credit risks with respect to these financial assets is approximately their value recorded in the Statement of Assets and Liabilities, less any collateral held by the Fund.
A derivative contract may suffer a mark-to-market loss if the value of the contract decreases due to an unfavorable change in the market rates or values of the underlying instrument. Losses can also occur if the counterparty does not perform under the contract.
With exchange-traded futures, there is less counterparty credit risk to the Fund since the exchange or clearinghouse, as counterparty to such instruments, guarantees against a possible default. The clearinghouse stands between the buyer and the seller of the contract; therefore, credit risk is limited to failure of the clearinghouse. While offset rights may exist under applicable law, the Fund does not have a contractual right of offset against a clearing broker or clearinghouse in the event of a default (including the bankruptcy or insolvency). Additionally, credit risk exists in exchange-traded futures with respect to initial and variation margin that is held in a clearing broker’s customer accounts. While clearing brokers are required to segregate customer margin from their own assets, in the event that a clearing broker becomes insolvent or goes into bankruptcy and at that time there is a shortfall in the aggregate amount of margin held by the clearing broker for all its clients, typically the shortfall would be allocated on a pro rata basis across all the clearing broker’s customers, potentially resulting in losses to the Fund.
Concentration Risk: A diversified portfolio, where this is appropriate and consistent with a fund’s objectives, minimizes the risk that a price change of a particular investment will have a material impact on the NAV of a fund. The investment concentrations within the Fund’s portfolio are disclosed in its Schedule of Investments.
LIBOR Transition Risk: The United Kingdom’s Financial Conduct Authority announced a phase out of the London Interbank Offered Rate (“LIBOR”). Although many LIBOR rates will be phased out by the end of 2021, a selection of widely used USD LIBOR rates will continue to be published through June 2023 in order to assist with the transition. The Fund may be exposed to financial instruments tied to LIBOR to determine payment obligations, financing terms, hedging strategies or investment value. The transition process away from LIBOR might lead to increased volatility and illiquidity in markets for, and reduce the effectiveness of new hedges placed against, instruments whose terms currently include LIBOR. The ultimate effect of the LIBOR transition process on the Fund is uncertain.
| 11. | CAPITAL SHARE TRANSACTIONS |
Transactions in capital shares for each class were as follows:
| | | | | | | | | | | | | | | | | | | | |
| | | | |
| | | Year Ended 03/31/21 | | | Year Ended 03/31/20 | | | | |
| | | | | |
| Share Class | | Shares | | | Amounts | | | Shares | | | Amounts | | | | |
| | | | | |
Institutional | | | | | | | | | | | | | | | | | | | | |
| | | | | |
Shares sold | | | 253,870 | | | $ | 8,000,129 | | | | 255,642 | | | $ | 7,368,654 | | | | | |
| | | | | |
Shares issued in reinvestment of distributions | | | 119,827 | | | | 4,043,705 | | | | 74,303 | | | | 2,169,640 | | | | | |
| | | | | |
Shares redeemed | | | (519,691 | ) | | | (16,219,893 | ) | | | (524,498 | ) | | | (14,883,270 | ) | | | | |
| | | | | | | | | | | | | | | | | | | | |
| | | | | |
| | | (145,994 | ) | | $ | (4,176,059 | ) | | | (194,553 | ) | | $ | (5,344,976 | ) | | | | |
| | | | | | | | | | | | | | | | | | | | |
| | | | | |
Investor A | | | | | | | | | | | | | | | | | | | | |
| | | | | |
Shares sold and automatic conversion of shares | | | 859,423 | | | $ | 25,837,122 | | | | 537,991 | | | $ | 14,529,303 | | | | | |
| | | | | |
Shares issued in reinvestment of distributions | | | 330,812 | | | | 10,661,900 | | | | 227,881 | | | | 6,362,419 | | | | | |
| | | | | |
Shares redeemed | | | (1,861,664 | ) | | | (55,323,150 | ) | | | (3,232,568 | ) | | | (88,221,118 | ) | | | | |
| | | | | | | | | | | | | | | | | | | | |
| | | | | |
| | | (671,429 | ) | | $ | (18,824,128 | ) | | | (2,466,696 | ) | | $ | (67,329,396 | ) | | | | |
| | | | | | | | | | | | | | | | | | | | |
| | | | | |
Investor C | | | | | | | | | | | | | | | | | | | | |
| | | | | |
Shares sold | | | 131,548 | | | $ | 2,443,287 | | | | 240,150 | | | $ | 4,126,718 | | | | | |
| | | | | |
Shares issued in reinvestment of distributions | | | 12,558 | | | | 252,531 | | | | 63,635 | | | | 1,123,166 | | | | | |
| | | | | |
Shares redeemed and automatic conversion of shares | | | (1,415,905 | ) | | | (26,109,534 | ) | | | (1,172,927 | ) | | | (20,351,182 | ) | | | | |
| | | | | | | | | | | | | | | | | | | | |
| | | | | |
| | | (1,271,799 | ) | | $ | (23,413,716 | ) | | | (869,142 | ) | | $ | (15,101,298 | ) | | | | |
| | | | | | | | | | | | | | | | | | | | |
| | | | | |
Class K | | | | | | | | | | | | | | | | | | | | |
| | | | | |
Shares sold | | | 10,737 | | | $ | 336,862 | | | | 9,277 | | | $ | 266,308 | | | | | |
| | | | | |
Shares issued in reinvestment of distributions | | | 3,099 | | | | 104,502 | | | | 1,957 | | | | 57,105 | | | | | |
| | | | | |
Shares redeemed | | | (12,775 | ) | | | (411,911 | ) | | | (28,792 | ) | | | (836,810 | ) | | | | |
| | | | | | | | | | | | | | | | | | | | |
| | | | | |
| | | 1,061 | | | $ | 29,453 | | | | (17,558 | ) | | $ | (513,397 | ) | | | | |
| | | | | | | | | | | | | | | | | | | | |
| | |
NOTES TO FINANCIAL STATEMENTS | | 35 |
Notes to Financial Statements (continued)
| | | | | | | | | | | | | | | | | | | | |
| | | | |
| | | Year Ended 03/31/21 | | | Year Ended 03/31/20 | | | | |
| | | | | |
| Share Class | | Shares | | | Amounts | | | Shares | | | Amounts | | | | |
| | | | | |
Class R | | | | | | | | | | | | | | | | | | | | |
| | | | | |
Shares sold | | | 42,825 | | | $ | 941,957 | | | | 101,711 | | | $ | 1,999,457 | | | | | |
| | | | | |
Shares issued in reinvestment of distributions | | | 16,199 | | | | 370,966 | | | | 21,336 | | | | 431,405 | | | | | |
| | | | | |
Shares redeemed | | | (321,487 | ) | | | (6,677,669 | ) | | | (530,086 | ) | | | (10,540,466 | ) | | | | |
| | | | | | | | | | | | | | | | | | | | |
| | | | | |
| | | (262,463 | ) | | $ | (5,364,746 | ) | | | (407,039 | ) | | $ | (8,109,604 | ) | | | | |
| | | | | | | | | | | | | | | | | | | | |
| | | | | |
| | | (2,350,624 | ) | | $ | (51,749,196 | ) | | | (3,954,988 | ) | | $ | (96,398,671 | ) | | | | |
| | | | | | | | | | | | | | | | | | | | |
Management’s evaluation of the impact of all subsequent events on the Fund’s financial statements was completed through the date the financial statements were issued and the following item was noted:
Effective April 15, 2021, the credit agreement was extended until April 2022 under substantially the same terms.
On February 9-10, 2021, the Board approved a special distribution of the Fund on ex-dividend date April 7, 2021 and payable date April 8, 2021. The special distribution rates are as follows:
| | | | | | | | |
| | | | |
| Share Class | | Net
Investment
Income | | | Short-Term
Capital
Gain | | Long-Term
Capital
Gain |
| | | |
Investor A Shares | | | 0.044523 | | | 3.582286 | | 5.975687 |
Investor C Shares | | | 0.010283 | | | 3.582286 | | 5.975687 |
Institutional Shares | | | 0.065512 | | | 3.582286 | | 5.975687 |
Class R Shares | | | 0.036091 | | | 3.582286 | | 5.975687 |
Class K Shares | | | 0.070072 | | | 3.582286 | | 5.975687 |
| | |
| 36 | | 2 0 2 1 BLACK ROCK ANNUAL REPORT TO SHAREHOLDERS |
Report of Independent Registered Public Accounting Firm
To the Shareholders and the Board of Directors of BlackRock Advantage SMID Cap Fund, Inc.:
Opinion on the Financial Statements and Financial Highlights
We have audited the accompanying statement of assets and liabilities of BlackRock Advantage SMID Cap Fund, Inc. (formerly, BlackRock Advantage U.S. Total Market Fund, Inc.) (the “Fund”), including the schedule of investments, as of March 31, 2021, the related statement of operations for the year then ended, the statements of changes in net assets for each of the two years in the period then ended, the financial highlights for each of the five years in the period then ended, and the related notes. In our opinion, the financial statements and financial highlights present fairly, in all material respects, the financial position of the Fund as of March 31, 2021, and the results of its operations for the year then ended, the changes in its net assets for each of the two years in the period then ended, and the financial highlights for each of the five years in the period then ended, in conformity with accounting principles generally accepted in the United States of America.
Basis for Opinion
These financial statements and financial highlights are the responsibility of the Fund’s management. Our responsibility is to express an opinion on the Fund’s financial statements and financial highlights based on our audits. We are a public accounting firm registered with the Public Company Accounting Oversight Board (United States) (PCAOB) and are required to be independent with respect to the Fund in accordance with the U.S. federal securities laws and the applicable rules and regulations of the Securities and Exchange Commission and the PCAOB.
We conducted our audits in accordance with the standards of the PCAOB. Those standards require that we plan and perform the audit to obtain reasonable assurance about whether the financial statements and financial highlights are free of material misstatement, whether due to error or fraud. The Fund is not required to have, nor were we engaged to perform, an audit of its internal control over financial reporting. As part of our audits we are required to obtain an understanding of internal control over financial reporting but not for the purpose of expressing an opinion on the effectiveness of the Fund’s internal control over financial reporting. Accordingly, we express no such opinion.
Our audits included performing procedures to assess the risks of material misstatement of the financial statements and financial highlights, whether due to error or fraud, and performing procedures that respond to those risks. Such procedures included examining, on a test basis, evidence regarding the amounts and disclosures in the financial statements and financial highlights. Our audits also included evaluating the accounting principles used and significant estimates made by management, as well as evaluating the overall presentation of the financial statements and financial highlights. Our procedures included confirmation of securities owned as of March 31, 2021, by correspondence with the custodian and brokers; when replies were not received from brokers, we performed other auditing procedures. We believe that our audits provide a reasonable basis for our opinion.
Deloitte & Touche LLP
Boston, Massachusetts
May 21, 2021
We have served as the auditor of one or more BlackRock investment companies since 1992.
| | |
REPORT OF INDEPENDENT REGISTERED PUBLIC ACCOUNTING FIRM | | 37 |
| | |
| Important Tax Information (unaudited) | | |
For corporate shareholders, the percentage of ordinary income distributions paid during the fiscal year ended March 31, 2021 that qualified for the dividends-received deduction were as follows:
| | | | |
| |
| |
| Fund Name | | Dividends-Received
Deduction | |
| |
| |
BlackRock Advantage SMID Cap Fund, Inc. | | | 9.92 | % |
| |
The following maximum amounts are hereby designated as qualified dividend income for individuals for the fiscal year ended March 31, 2021:
| | | | |
| |
| |
| Fund Name | | Qualified Dividend
Income | |
| |
| |
BlackRock Advantage SMID Cap Fund, Inc. | | | $ 4,695,350 | |
| |
The following maximum amounts are hereby designated as qualified business income for individuals for the fiscal year ended March 31, 2021:
| | | | |
| |
| |
| Fund Name | | Qualified Business
Income | |
| |
| |
BlackRock Advantage SMID Cap Fund, Inc. | | | $ 432,655 | |
| |
The following distribution amounts are hereby designated for the fiscal year ended March 31, 2021:
| | | | | | | | |
| |
| | |
| Fund Name | | Short-Term
Capital Gain
Dividends | | | 20% Rate
Long-Term
Capital Gain
Dividends | |
| |
| | |
BlackRock Advantage SMID Cap Fund, Inc. | | | $ 5,334,676 | | | | $ 9,275,329 | |
| |
| | |
| 38 | | 2 0 2 1 BLACK ROCK ANNUAL REPORT TO SHAREHOLDERS |
Disclosure of Investment Advisory Agreement
At a meeting on November 9-11, 2020 (the “November Meeting”), the Board of Directors of BlackRock Advantage SMID Cap Fund, Inc. (formerly known as BlackRock Advantage U.S. Total Market Fund, Inc.) (the “Fund”) and the Board of Directors of Master Advantage U.S. Total Market LLC (the “Master Fund”) approved the conversion of the Fund from a feeder fund that invests its assets into the Master Fund into a stand-alone fund that makes direct investments. In connection with the conversion, the Board of Directors of the Master Fund also approved the termination of the Master Fund.
At the November Meeting, the Board of Directors of the Fund considered the initial approval of the proposed investment advisory agreement between BlackRock Advisors, LLC (the “Manager”) and the Fund (the “Agreement”). The Board of Directors of the Fund was informed that the Agreement was substantively the same as the investment advisory agreement in place at that time between the Manager and the Master Fund (the “Existing Agreement”).
On the date of the November Meeting, the Board of Directors of the Fund consisted of fourteen individuals, twelve of whom were not “interested persons” of the Trust as defined in the Investment Company Act of 1940, as amended (the “1940 Act”) (the “Independent Board Members”). Pursuant to the 1940 Act, the Board of Directors of the Fund is required to consider the initial approval of the Agreement.
The Board of Directors of the Master Portfolio met in person on April 7, 2020 (the “April Meeting”) and on May 11-13, 2020 (the “May Meeting”) to consider the approval of the Existing Agreement. Because the Fund was a “feeder” fund that invested all of its investable assets in the Master Fund, the Board of Directors of the Master Fund also considered the approval of the Existing Agreement with respect to the Fund. At the May Meeting, the Board of Directors of the Master Fund, including the independent board members, approved the continuation of the Existing Agreement for a one-year term ending June 30, 2021. The Board of Directors of the Fund, including the Independent Board Members, also considered the continuation of the Existing Agreement and found the Existing Agreement to be satisfactory.
The materials reviewed and the factors considered by the Board of Directors of the Fund at the November Meeting in connection with approval of the proposed Agreement were substantially the same as the materials reviewed and the factors the Board of Directors of the Fund considered at the April Meeting and the May Meeting with respect to consideration of the approval of the Existing Agreement with respect to the Fund. A discussion of the basis for the Board of Directors of Master Fund’s approval and the Board of Directors of the Fund’s consideration of the Existing Agreement at the May Meeting is included in the semi-annual shareholder report of each Fund for the period ended September 30, 2020.
Following discussion, at the November Meeting the Board of Directors of the Fund, including the Independent Board Members, approved the Agreement between the Manager and the Fund for a two-year term beginning on the effective date of the Agreement. Based upon its evaluation of all of the aforementioned factors in their totality, the Board of Directors of the Fund, including the Independent Board Members, was satisfied that the terms of the Agreement were fair and reasonable and in the best interest of the Fund and its shareholders. In arriving at its decision to approve the Agreement, the Board of Directors of the Fund did not identify any single factor or group of factors as all-important or controlling, but considered all factors together, and different Board members may have attributed different weights to the various factors considered. The Independent Board Members were also assisted by the advice of independent legal counsel in making this determination.
| | |
DISCLOSURE OF INVESTMENT ADVISORY AGREEMENT | | 39 |
Statement Regarding Liquidity Risk Management Program
In compliance with Rule 22e-4 under the Investment Company Act of 1940, as amended (the “Liquidity Rule”), BlackRock Advantage SMID Cap Fund, Inc. (the “Fund”) has adopted and implemented a liquidity risk management program (the “Program”), which is reasonably designed to assess and manage the Fund’s liquidity risk.
The Board of Directors (the “Board”) of the Fund, met on November 10-11, 2020 (the “Meeting”) to review the Program. The Board previously appointed BlackRock Advisors, LLC or BlackRock Fund Advisors (“BlackRock”), each an investment adviser to certain funds, as the program administrator for the Fund’s Program, as applicable. BlackRock also previously delegated oversight of the Program to the 40 Act Liquidity Risk Management Committee (the “Committee”). At the Meeting, the Committee, on behalf of BlackRock, provided the Board with a report that addressed the operation of the Program and assessed its adequacy and effectiveness of implementation, including the management of the Fund’s Highly Liquid Investment Minimum (“HLIM”) where applicable, and any material changes to the Program (the “Report”). The Report covered the period from October 1, 2019 through September 30, 2020 (the “Program Reporting Period”).
The Report described the Program’s liquidity classification methodology for categorizing a Fund’s investments (including derivative transactions) into one of four liquidity buckets. It also referenced the methodology used by BlackRock to establish a Fund’s HLIM and noted that the Committee reviews and ratifies the HLIM assigned to the Fund no less frequently than annually. The Report also discussed notable events affecting liquidity over the Program Reporting Period, including the impact of the coronavirus outbreak on the Fund and the overall market.
The Report noted that the Program complied with the key factors for consideration under the Liquidity Rule for assessing, managing and periodically reviewing a Fund’s liquidity risk, as follows:
| | a) | The Fund’s investment strategy and liquidity of portfolio investments during both normal and reasonably foreseeable stressed conditions. During the Program Reporting Period, the Committee reviewed whether each Fund’s strategy is appropriate for an open-end fund structure with a focus on Funds with more significant and consistent holdings of less liquid and illiquid assets. The Committee also factored a Fund’s concentration in an issuer into the liquidity classification methodology by taking issuer position sizes into account. Where a Fund participated in borrowings for investment purposes (such as tender option bonds and reverse repurchase agreements), such borrowings were factored into the Program’s calculation of a Fund’s liquidity bucketing. Derivative exposure was also considered in such calculation. |
| | b) | Short-term and long-term cash flow projections during both normal and reasonably foreseeable stressed conditions. During the Program Reporting Period, the Committee reviewed historical net redemption activity and used this information as a component to establish each Fund’s reasonably anticipated trading size (“RATS”). Each Fund has adopted an in-kind redemption policy which may be utilized to meet larger redemption requests. The Committee may also take into consideration a Fund’s shareholder ownership concentration (which, depending on product type and distribution channel, may or may not be available), a Fund’s distribution channels, and the degree of certainty associated with a Fund’s short-term and long-term cash flow projections. |
| | c) | Holdings of cash and cash equivalents, as well as borrowing arrangements. The Committee considered the terms of the credit facility committed to the Funds, the financial health of the institution providing the facility and the fact that the credit facility is shared among multiple Funds (including that a portion of the aggregate commitment amount is specifically designated for BlackRock Floating Rate Income Portfolio, a series of BlackRock Funds V). The Committee also considered other types of borrowing available to the Funds, such as the ability to use reverse repurchase agreements and interfund lending, as applicable. |
There were no material changes to the Program during the Program Reporting Period. The Report provided to the Board stated that the Committee concluded that based on the operation of the functions, as described in the Report, the Program is operating as intended and is effective in implementing the requirements of the Liquidity Rule.
| | |
| 40 | | 2 0 2 1 BLACK ROCK ANNUAL REPORT TO SHAREHOLDERS |
Director and Officer Information
| | | | | | | | |
| Independent Directors(a) |
| | | | | |
Name Year of Birth(b) | | Position(s) Held
(Length of Service)(c) | | Principal Occupation(s) During Past Five Years | | Number of BlackRock-Advised Registered Investment Companies (“RICs”) Consisting of Investment Portfolios (“Portfolios”) Overseen | | Public Company and Other
Investment
Company
Directorships Held During Past Five Years |
| | | | |
Mark Stalnecker 1951 | | Chair of the Board and Director (Since 2019) | | Chief Investment Officer, University of Delaware from 1999 to 2013; Trustee and Chair of the Finance and Investment Committees, Winterthur Museum and Country Estate from 2005 to 2016; Member of the Investment Committee, Delaware Public Employees’ Retirement System since 2002; Member of the Investment Committee, Christiana Care Health System from 2009 to 2017; Member of the Investment Committee, Delaware Community Foundation from 2013 to 2014; Director and Chair of the Audit Committee, SEI Private Trust Co. from 2001 to 2014. | | 30 RICs consisting of
150 Portfolios | | None |
| | | | |
Bruce R. Bond 1946 | | Director (Since 2007) | | Board Member, Amsphere Limited (software) since 2018; Trustee and Member of the Governance Committee, State Street Research Mutual Funds from 1997 to 2005; Board Member of Governance, Audit and Finance Committee, Avaya Inc. (computer equipment) from 2003 to 2007. | | 30 RICs consisting of
150 Portfolios | | None |
| | | | |
Susan J. Carter 1956 | | Director (Since 2019) | | Director, Pacific Pension Institute from 2014 to 2018; Advisory Board Member, Center for Private Equity and Entrepreneurship at Tuck School of Business since 1997; Senior Advisor, Commonfund Capital, Inc. (“CCI”) (investment adviser) in 2015; Chief Executive Officer, CCI from 2013 to 2014; President & Chief Executive Officer, CCI from 1997 to 2013; Advisory Board Member, Girls Who Invest from 2015 to 2018 and Board Member thereof since 2018; Advisory Board Member, Bridges Fund Management since 2016; Trustee, Financial Accounting Foundation since 2017; Practitioner Advisory Board Member, Private Capital Research Institute (“PCRI”) since 2017. Lecturer in the Practice of Management, Yale School of Management since 2019. Advisor to Finance Committee, Altman Foundation since 2020. | | 30 RICs consisting of
150 Portfolios | | None |
| | | | |
Collette Chilton 1958 | | Director (Since 2019) | | Chief Investment Officer, Williams College since 2006; Chief Investment Officer, Lucent Asset Management Corporation from 1998 to 2006; Director, Boys and Girls Club of Boston since 2017; Director, B1 Capital since 2018; Director, David and Lucile Packard Foundation since 2020. | | 30 RICs consisting of
150 Portfolios | | None |
| | | | |
Neil A. Cotty 1954 | | Director (Since 2019) | | Bank of America Corporation from 1996 to 2015, serving in various senior finance leadership roles, including Chief Accounting Officer from 2009 to 2015, Chief Financial Officer of Global Banking, Markets and Wealth Management from 2008 to 2009, Chief Accounting Officer from 2004 to 2008, Chief Financial Officer of Consumer Bank from 2003 to 2004, Chief Financial Officer of Global Corporate Investment Bank from 1999 to 2002. | | 30 RICs consisting of
150 Portfolios | | None |
| | | | |
Lena G. Goldberg 1949 | | Director (Since 2016) | | Senior Lecturer, Harvard Business School, since 2008; Director, Charles Stark Draper Laboratory, Inc. since 2013; FMR LLC/Fidelity Investments (financial services) from 1996 to 2008, serving in various senior roles including Executive Vice President - Strategic Corporate Initiatives and Executive Vice President and General Counsel; Partner, Sullivan & Worcester LLP from 1985 to 1996 and Associate thereof from 1979 to 1985. | | 30 RICs consisting of
150 Portfolios | | None |
| | | | |
Henry R. Keizer 1956 | | Director (Since 2016) | | Director, Park Indemnity Ltd. (captive insurer) since 2010; Director, MUFGAmericas Holdings Corporation and MUFG Union Bank, N.A. (financial and bank holding company) from 2014 to 2016; Director, American Institute of Certified Public Accountants from 2009 to 2011; Director, KPMG LLP (audit, tax and advisory services) from 2004 to 2005 and 2010 to 2012; Director, KPMG International in 2012, Deputy Chairman and Chief Operating Officer thereof from 2010 to 2012 and U.S. Vice Chairman of Audit thereof from 2005 to 2010; Global Head of Audit, KPMGI (consortium of KPMG firms) from 2006 to 2010; Director, YMCA of Greater New York from 2006 to 2010. | | 30 RICs consisting of
150 Portfolios | | Hertz Global Holdings (car rental); WABCO (commercial vehicle safety systems) from 2015 to 2020; Montpelier Re Holdings, Ltd. (publicly held property and casualty reinsurance) from 2013 until 2015; Sealed Air Corp. (packaging) |
| | |
DIRECTOR AND OFFICER INFORMATION | | 41 |
Director and Officer Information (continued)
| | | | | | | | |
| Independent Directors(a) |
| | | | | |
Name Year of Birth(b) | | Position(s) Held (Length of Service)(c) | | Principal Occupation(s) During Past Five Years | | Number of BlackRock-Advised Registered Investment Companies (“RICs”) Consisting of Investment Portfolios (“Portfolios”) Overseen | | Public Company
and Other
Investment
Company
Directorships
Held During
Past Five Years |
| | | | |
Cynthia A. Montgomery 1952 | | Director
(Since 2019) | | Professor, Harvard Business School since 1989. | | 30 RICs consisting of
150 Portfolios | | Newell Rubbermaid, Inc. (manufacturing) from 1995 to 2016. |
| | | | |
Donald C. Opatrny 1952 | | Director
(Since 2015) | | Trustee, Vice Chair, Member of the Executive Committee and Chair of the Investment Committee, Cornell University from 2004 to 2019; President, Trustee and Member of the Investment Committee, The Aldrich Contemporary Art Museum from 2007 to 2014; Member of the Board and Investment Committee, University School from 2007 to 2018; Member of the Investment Committee, Mellon Foundation from 2009 to 2015; Trustee, Artstor (a Mellon Foundation affiliate) from 2010 to 2015; President and Trustee, the Center for the Arts, Jackson Hole from 2011 to 2018; Director, Athena Capital Advisors LLC (investment management firm) since 2013; Trustee and Chair of the Investment Committee, Community Foundation of Jackson Hole since 2014; Member of Affordable Housing Supply Board of Jackson, Wyoming since 2017; Member, Investment Funds Committee, State of Wyoming since 2017; Trustee, Phoenix Art Museum since 2018; Trustee, Arizona Community Foundation and Member of Investment Committee since 2020. | | 30 RICs consisting of
150 Portfolios | | None |
| | | | |
Joseph P. Platt 1947 | | Director
(Since 2019) | | General Partner, Thorn Partners, LP (private investments) since 1998; Director, WQED Multi-Media (public broadcasting not-for-profit) since 2001; Chair, Basic Health International (non-profit) since 2015. | | 30 RICs consisting of
150 Portfolios | | Greenlight Capital Re, Ltd. (reinsurance company); Consol Energy Inc. |
| | | | |
Kenneth L. Urish 1951 | | Director (Since 2019) | | Managing Partner, Urish Popeck & Co., LLC (certified public accountants and consultants) since 1976; Past-Chairman of the Professional Ethics Committee of the Pennsylvania Institute of Certified Public Accountants and Committee Member thereof since 2007; Member of External Advisory Board, The Pennsylvania State University Accounting Department since founding in 2001; Principal, UP Strategic Wealth Investment Advisors, LLC since 2013; Trustee, The Holy Family Institute from 2001 to 2010; President and Trustee, Pittsburgh Catholic Publishing Associates from 2003 to 2008; Director, Inter-Tel from 2006 to 2007; Member Advisory Board, ESG Competent Boards since 2020. | | 30 RICs consisting of
150 Portfolios | | None |
| | | | |
Claire A. Walton 1957 | | Director
(Since 2019) | | Chief Operating Officer and Chief Financial Officer of Liberty Square Asset Management, LP from 1998 to 2015; General Partner of Neon Liberty Capital Management, LLC since 2003; Director, Boston Hedge Fund Group from 2009 to 2018; Director, Woodstock Ski Runners since 2013; Director, Massachusetts Council on Economic Education from 2013 to 2015. | | 30 RICs consisting of
150 Portfolios | | None |
| | |
| 42 | | 2 0 2 1 BLACK ROCK ANNUAL REPORT TO SHAREHOLDERS |
Director and Officer Information (continued)
| | | | | | | | |
| Interested Directors(a)(d) |
| | | | | |
Name Year of Birth(b) | | Position(s) Held (Length of Service)(c) | | Principal Occupation(s) During Past Five Years | | Number of BlackRock-Advised Registered Investment Companies (“RICs”) Consisting of Investment Portfolios (“Portfolios”) Overseen | | Public Company
and Other
Investment
Company
Directorships
Held During Past
Five Years |
| | | | |
Robert Fairbairn 1965 | | Director
(Since 2015) | | Vice Chairman of BlackRock, Inc. since 2019; Member of BlackRock’s Global Executive and Global Operating Committees; Co-Chair of BlackRock’s Human Capital Committee; Senior Managing Director of BlackRock, Inc. from 2010 to 2019; oversaw BlackRock’s Strategic Partner Program and Strategic Product Management Group from 2012 to 2019; Member of the Board of Managers of BlackRock Investments, LLC from 2011 to 2018; Global Head of BlackRock’s Retail and iShares® businesses from 2012 to 2016. | | 113 RICs consisting of
258 Portfolios | | None |
| | | | |
John M. Perlowski(e) 1964 | | Director (Since 2015) President and Chief Executive Officer (Since 2010) | | Managing Director of BlackRock, Inc. since 2009; Head of BlackRock Global Accounting and Product Services since 2009; Advisory Director of Family Resource Network (charitable foundation) since 2009. | | 115 RICs consisting of
260 Portfolios | | None |
(a) The address of each Director is c/o BlackRock, Inc., 55 East 52nd Street, New York, New York 10055. (b) Each Independent Director holds office until his or her successor is duly elected and qualifies or until his or her earlier death, resignation, retirement or removal as provided by the Fund’s by-laws or charter or statute, or until December 31 of the year in which he or she turns 75. Directors who are “interested persons,” as defined in the 1940 Act, serve until their successor is duly elected and qualifies or until their earlier death, resignation, retirement or removal as provided by the Fund’s by-laws or statute, or until December 31 of the year in which they turn 72. The Board may determine to extend the terms of Independent Directors on a case-by-case basis, as appropriate. (c) Following the combination of Merrill Lynch Investment Managers, L.P. (“MLIM”) and BlackRock, Inc. in September 2006, the various legacy MLIM and legacy BlackRock fund boards were realigned and consolidated into three new fund boards in 2007. In addition, effective January 1, 2019, three BlackRock Fund Complexes were realigned and consolidated into two BlackRock Fund Complexes. As a result, although the chart shows the year that each Independent Director joined the Board, certain Independent Directors first became members of the boards of other BlackRock-advised Funds, legacy MLIM funds or legacy BlackRock funds as follows: Bruce R. Bond, 2005; Susan J. Carter, 2016; Collette Chilton, 2015; Neil A. Cotty, 2016; Cynthia A. Montgomery, 1994; Joseph P. Platt, 1999; Mark Stalnecker, 2015; Kenneth L. Urish, 1999; Claire A. Walton, 2016. (d) Mr. Fairbairn and Mr. Perlowski are both “interested persons,” as defined in the 1940 Act, of the Fund based on their positions with BlackRock, Inc. and its affiliates. Mr. Fairbairn and Mr. Perlowski are also board members of the BlackRock Fixed-Income Complex. (e) Mr. Perlowski is also a trustee of the BlackRock Credit Strategies Fund and BlackRock Private Investments Fund. |
| | |
DIRECTOR AND OFFICER INFORMATION | | 43 |
Director and Officer Information (continued)
| | | | |
| Officers Who Are Not Directors(a) |
| | | |
Name
Year of Birth(b) | | Position(s) Held (Length of Service) | | Principal Occupation(s) During Past Five Years |
| | |
Jennifer McGovern 1977 | | Vice President
(Since 2014) | | Managing Director of BlackRock, Inc. since 2016; Director of BlackRock, Inc. from 2011 to 2015; Head of Americas Product Development and Governance for BlackRock’s Global Product Group since 2019; Head of Product Structure and Oversight for BlackRock’s U.S. Wealth Advisory Group from 2013 to 2019. |
| | |
Trent Walker 1974 | | Chief Financial Officer
(Since 2021) | | Managing Director of BlackRock, Inc. since September 2019; Executive Vice President of PIMCO from 2016 to 2019; Senior Vice President of PIMCO from 2008 to 2015; Treasurer from 2013 to 2019 and Assistant Treasurer from 2007 to 2017 of PIMCO Funds, PIMCO Variable Insurance Trust, PIMCO ETF Trust, PIMCO Equity Series, PIMCO Equity Series VIT, PIMCO Managed Accounts Trust, 2 PIMCO-sponsored interval funds and 21 PIMCO-sponsored closed-end funds. |
| | |
Jay M. Fife 1970 | | Treasurer
(Since 2007) | | Managing Director of BlackRock, Inc. since 2007. |
| | |
Charles Park 1967 | | Chief Compliance Officer
(Since 2014) | | Anti-Money Laundering Compliance Officer for certain BlackRock-advised Funds from 2014 to 2015; Chief Compliance Officer of BlackRock Advisors, LLC and the BlackRock-advised Funds in the BlackRock Multi-Asset Complex and the BlackRock Fixed-Income Complex since 2014; Principal of and Chief Compliance Officer for iShares® Delaware Trust Sponsor LLC since 2012 and BlackRock Fund Advisors (“BFA”) since 2006; Chief Compliance Officer for the BFA-advised iShares® exchange traded funds since 2006; Chief Compliance Officer for BlackRock Asset Management International Inc. since 2012. |
| | |
Lisa Belle 1968 | | Anti-Money Laundering Compliance Officer
(Since 2019) | | Managing Director of BlackRock, Inc. since 2019; Global Financial Crime Head for Asset and Wealth Management of JP Morgan from 2013 to 2019; Managing Director of RBS Securities from 2012 to 2013; Head of Financial Crimes for Barclays Wealth Americas from 2010 to 2012. |
| | |
Janey Ahn 1975 | | Secretary
(Since 2019) | | Managing Director of BlackRock, Inc. since 2018; Director of BlackRock, Inc. from 2009 to 2017. |
|
(a) The address of each Officer is c/o BlackRock, Inc., 55 East 52nd Street, New York, New York 10055. (b) Officers of the Fund serve at the pleasure of the Board. |
Further information about the Fund’s Directors and Officers is available in the Fund’s Statement of Additional Information, which can be obtained without charge by calling (800) 441-7762.
|
| |
Neal J. Andrews retired as the Chief Financial Officer effective December 31, 2020, and Trent Walker was elected as the Chief Financial Officer effective January 1, 2021. |
| | |
| 44 | | 2 0 2 1 BLACK ROCK ANNUAL REPORT TO SHAREHOLDERS |
Additional Information
Regulation Regarding Derivatives
On October 28, 2020, the Securities and Exchange Commission (the “SEC”) adopted new regulations governing the use of derivatives by registered investment companies (“Rule 18f-4”). The Fund will be required to implement and comply with Rule 18f-4 by August 19, 2022. Once implemented, Rule 18f-4 will impose limits on the amount of derivatives a fund can enter into, eliminate the asset segregation framework currently used by funds to comply with Section 18 of the 1940 Act, treat derivatives as senior securities and require funds whose use of derivatives is more than a limited specified exposure amount to establish and maintain a comprehensive derivatives risk management program and appoint a derivatives risk manager.
General Information
Quarterly performance, semi-annual and annual reports, current net asset value and other information regarding the Fund may be found on BlackRock’s website, which can be accessed at blackrock.com. Any reference to BlackRock’s website in this report is intended to allow investors public access to information regarding the Fund and does not, and is not intended to, incorporate BlackRock’s website in this report.
Householding
The Fund will mail only one copy of shareholder documents, including prospectuses, annual and semi-annual reports, Rule 30e-3 notices and proxy statements, to shareholders with multiple accounts at the same address. This practice is commonly called “householding” and is intended to reduce expenses and eliminate duplicate mailings of shareholder documents. Mailings of your shareholder documents may be householded indefinitely unless you instruct us otherwise. If you do not want the mailing of these documents to be combined with those for other members of your household, please call the Fund at (800) 441-7762.
Availability of Quarterly Schedule of Investments
The Fund files its complete schedule of portfolio holdings with the SEC for the first and third quarters of each fiscal year as an exhibit to its reports on Form N-PORT. The Fund’s Form N-PORT is available on the SEC’s website at sec.gov. Additionally, the Fund makes its portfolio holdings for the first and third quarters of each fiscal year available at blackrock.com/fundreports.
Availability of Proxy Voting Policies, Procedures and Voting Records
A description of the policies and procedures that the Fund uses to determine how to vote proxies relating to portfolio securities and information about how the Fund voted proxies relating to securities held in the Fund’s portfolios during the most recent 12-month period ended June 30 is available without charge, upon request (1) by calling (800) 441-7762; (2) on the BlackRock website at blackrock.com; and (3) on the SEC’s website at sec.gov.
BlackRock’s Mutual Fund Family
BlackRock offers a diverse lineup of open-end mutual funds crossing all investment styles and managed by experts in equity, fixed-income and tax-exempt investing. Visit blackrock.com for more information.
Shareholder Privileges
Account Information
Call us at (800) 441-7762 from 8:00 AM to 6:00 PM ET on any business day to get information about your account balances, recent transactions and share prices. You can also visit blackrock.com for more information.
Automatic Investment Plans
Investor class shareholders who want to invest regularly can arrange to have $50 or more automatically deducted from their checking or savings account and invested in any of the BlackRock funds.
Systematic Withdrawal Plans
Investor class shareholders can establish a systematic withdrawal plan and receive periodic payments of $50 or more from their BlackRock funds, as long as their account balance is at least $10,000.
Retirement Plans
Shareholders may make investments in conjunction with Traditional, Rollover, Roth, Coverdell, Simple IRAs, SEP IRAs and 403(b) Plans.
| | |
ADDITIONAL INFORMATION | | 45 |
Additional Information (continued)
BlackRock Privacy Principles
BlackRock is committed to maintaining the privacy of its current and former fund investors and individual clients (collectively, “Clients”) and to safeguarding their non-public personal information. The following information is provided to help you understand what personal information BlackRock collects, how we protect that information and why in certain cases we share such information with select parties.
If you are located in a jurisdiction where specific laws, rules or regulations require BlackRock to provide you with additional or different privacy-related rights beyond what is set forth below, then BlackRock will comply with those specific laws, rules or regulations.
BlackRock obtains or verifies personal non-public information from and about you from different sources, including the following: (i) information we receive from you or, if applicable, your financial intermediary, on applications, forms or other documents; (ii) information about your transactions with us, our affiliates, or others; (iii) information we receive from a consumer reporting agency; and (iv) from visits to our websites.
BlackRock does not sell or disclose to non-affiliated third parties any non-public personal information about its Clients, except as permitted by law or as is necessary to respond to regulatory requests or to service Client accounts. These non-affiliated third parties are required to protect the confidentiality and security of this information and to use it only for its intended purpose.
We may share information with our affiliates to service your account or to provide you with information about other BlackRock products or services that may be of interest to you. In addition, BlackRock restricts access to non-public personal information about its Clients to those BlackRock employees with a legitimate business need for the information. BlackRock maintains physical, electronic and procedural safeguards that are designed to protect the non-public personal information of its Clients, including procedures relating to the proper storage and disposal of such information.
Fund and Service Providers
Investment Adviser and Administrator
BlackRock Advisors, LLC
Wilmington, DE 19809
Accounting Agent and Transfer Agent
BNY Mellon Investment Servicing (US) Inc.
Wilmington, DE 19809
Custodian
The Bank of New York Mellon
New York, NY 10286
Independent Registered Public Accounting Firm
Deloitte & Touche LLP
Boston, MA 02116
Distributor
BlackRock Investments, LLC
New York, NY 10022
Legal Counsel
Sidley Austin LLP
New York, NY 10019
Address of the Fund
100 Bellevue Parkway
Wilmington, DE 19809
| | |
| 46 | | 2 0 2 1 BLACK ROCK ANNUAL REPORT TO SHAREHOLDERS |
Glossary of Terms Used in this Report
| | |
| Portfolio Abbreviation |
| |
| S&P | | Standard & Poor’s |
| | |
GLOSSARY OF TERMS USED IN THIS REPORT | | 47 |
Want to know more?
blackrock.com | 800-441-7762
This report is intended for current holders. It is not authorized for use as an offer of sale or a solicitation of an offer to buy shares of the Fund unless preceded or accompanied by the Fund’s current prospectus. Past performance results shown in this report should not be considered a representation of future performance. Investment returns and principal value of shares will fluctuate so that shares, when redeemed, may be worth more or less than their original cost. Statements and other information herein are as dated and are subject to change.
VO-3/21-AR
(b) Not Applicable
| Item 2 – | Code of Ethics – The registrant (or the “Fund”) has adopted a code of ethics, as of the end of the period covered by this report, applicable to the registrant’s principal executive officer, principal financial officer, principal accounting officer or controller, or persons performing similar functions. During the period covered by this report, the code of ethics was amended to update certain information and to make other non-material changes. During the period covered by this report, there have been no waivers granted under the code of ethics. The registrant undertakes to provide a copy of the code of ethics to any person upon request, without charge, who calls 1-800-441-7762. |
| Item 3 – | Audit Committee Financial Expert – The registrant’s board of directors (the “board of directors”), has determined that (i) the registrant has the following audit committee financial experts serving on its audit committee and (ii) each audit committee financial expert is independent: |
Neil A. Cotty
Henry R. Keizer
Kenneth L. Urish
Under applicable securities laws, a person determined to be an audit committee financial expert will not be deemed an “expert” for any purpose, including without limitation for the purposes of Section 11 of the Securities Act of 1933, as a result of being designated or identified as an audit committee financial expert. The designation or identification of a person as an audit committee financial expert does not impose on such person any duties, obligations, or liabilities greater than the duties, obligations, and liabilities imposed on such person as a member of the audit committee and board of directors in the absence of such designation or identification. The designation or identification of a person as an audit committee financial expert does not affect the duties, obligations, or liability of any other member of the audit committee or board of directors.
| Item 4 – | Principal Accountant Fees and Services |
The following table presents fees billed by Deloitte & Touche LLP (“D&T”) in each of the last two fiscal years for the services rendered to the Fund:
| | | | | | | | | | | | | | | | |
| | | (a) Audit Fees | | (b) Audit-Related Fees1 | | (c) Tax Fees2 | | (d) All Other Fees |
| Entity Name | | Current
Fiscal Year
End | | Previous
Fiscal Year
End | | Current
Fiscal Year
End | | Previous
Fiscal Year
End | | Current
Fiscal Year
End | | Previous
Fiscal Year
End | | Current
Fiscal Year
End | | Previous Fiscal Year
End |
| BlackRock Advantage SMID Cap Fund, Inc. (Formerly BlackRock Advantage U.S. Total Market Fund, Inc.) | | $29,694 | | $30,600 | | $4,000 | | $0 | | $12,700 | | $13,900 | | $0 | | $0 |
The following table presents fees billed by D&T that were required to be approved by the registrant’s audit committee (each a “Committee”) for services that relate directly to the operations or financial reporting of the Fund and that are rendered on behalf of BlackRock Advisors, LLC (the “Investment Adviser” or “BlackRock”) and entities controlling, controlled by, or under common control with BlackRock (not including any sub-adviser whose role is primarily portfolio management and is subcontracted with or overseen by another investment adviser) that provide ongoing services to the Fund (“Affiliated Service Providers”):
| | | | |
| | | Current Fiscal Year End | | Previous Fiscal Year End |
| (b) Audit-Related Fees1 | | $0 | | $0 |
| (c) Tax Fees2 | | $0 | | $0 |
| (d) All Other Fees3 | | $2,032,000 | | $1,984,000 |
1 The nature of the services includes assurance and related services reasonably related to the performance of the audit or review of financial statements not included in Audit Fees, including accounting consultations, agreed-upon procedure reports, attestation reports, comfort letters, out-of-pocket expenses and internal control reviews not required by regulators.
2 The nature of the services includes tax compliance and/or tax preparation, including services relating to the filing or amendment of federal, state or local income tax returns, regulated investment company qualification reviews, taxable income and tax distribution calculations.
3 Non-audit fees of $2,032,000 and $1,984,000 for the current fiscal year and previous fiscal year, respectively, were paid to the Fund’s principal accountant in their entirety by BlackRock, in connection with services provided to the Affiliated Service Providers of the Fund and of certain other funds sponsored and advised by BlackRock or its affiliates for a service organization review and an accounting research tool subscription. These amounts represent aggregate fees paid by BlackRock and were not allocated on a per fund basis.
(e)(1) Audit Committee Pre-Approval Policies and Procedures:
The Committee has adopted policies and procedures with regard to the pre-approval of services. Audit, audit-related and tax compliance services provided to the registrants on an annual basis require specific pre-approval by the Committee. The Committee also must approve other non-audit services provided to the registrants and those non-audit services provided to the Investment Adviser and Affiliated Service Providers that relate directly to the operations and the financial reporting of the registrants. Certain of these non-audit services that the Committee believes are (a) consistent with the SEC’s auditor independence rules and (b) routine and recurring services that will not impair the independence of the independent accountants may be approved by the Committee without consideration on a specific case-by-case basis (“general pre-approval”). The term of any general pre-approval is 12 months from the date of the pre-approval, unless the Committee provides for a different period. Tax or other non-audit services provided to the registrants which have a direct impact on the operations or financial reporting of the registrants will only be deemed pre-approved provided that any individual project does not exceed $10,000 attributable to the registrants or $50,000 per project. For this purpose, multiple projects will be aggregated to determine if they exceed the previously mentioned cost levels.
Any proposed services exceeding the pre-approved cost levels will require specific pre-approval by the Committee, as will any other services not subject to general pre-approval (e.g., unanticipated but permissible services). The Committee is informed of each service approved subject to general pre-approval at the next regularly scheduled in-person board meeting. At this meeting, an analysis of such services is presented to the Committee for ratification. The Committee may delegate to the Committee Chairman the authority to approve the provision of and fees for any specific engagement of permitted non-audit services, including services exceeding pre-approved cost levels.
(e)(2) None of the services described in each of Items 4(b) through (d) were approved by the Committee pursuant to the de minimis exception in paragraph (c)(7)(i)(C) of Rule 2-01 of Regulation S-X.
(f) Not Applicable
(g) The aggregate non-audit fees, defined as the sum of the fees shown under “Audit-Related Fees,” “Tax Fees” and “All Other Fees,” paid to the accountant for services rendered by the accountant to the registrants, the Investment Adviser and the Affiliated Service Providers were:
| | | | |
| Entity Name | | Current Fiscal Year End | | Previous Fiscal Year End |
| BlackRock Advantage SMID Cap Fund, Inc. (Formerly BlackRock Advantage U.S. Total Market Fund, Inc.) | | $16,700 | | $13,900 |
Additionally, the amounts billed by D&T in connection with services provided to the Affiliated Service Providers of the Fund and of other funds sponsored and advised by BlackRock or its affiliates during the current and previous fiscal years for a service organization review and an accounting research tool subscription were:
| | |
Current Fiscal Year End | | Previous Fiscal Year End |
$2,032,000 | | $1,984,000 |
These amounts represent aggregate fees paid by BlackRock and were not allocated on a per fund basis.
(h) The Committee has considered and determined that the provision of non-audit services that were rendered to the Investment Adviser and the Affiliated Service Providers that were not pre-approved pursuant to paragraph (c)(7)(ii) of Rule 2-01 of Regulation S-X is compatible with maintaining the principal accountant’s independence.
| Item 5 – | Audit Committee of Listed Registrant – Not Applicable |
(a) The registrant’s Schedule of Investments are included as part of the Report to Stockholders filed under Item 1 of this Form.
(b) Not Applicable due to no such divestments during the semi-annual period covered since the previous Form N-CSR filing.
| Item 7 – | Disclosure of Proxy Voting Policies and Procedures for Closed-End Management Investment Companies – Not Applicable |
| Item 8 – | Portfolio Managers of Closed-End Management Investment Companies – Not Applicable |
| Item 9 – | Purchases of Equity Securities by Closed-End Management Investment Company and Affiliated Purchasers – Not Applicable |
| Item 10 – | Submission of Matters to a Vote of Security Holders – There have been no material changes to these procedures. |
| Item 11 – | Controls and Procedures |
(a) The registrant’s principal executive and principal financial officers, or persons performing similar functions, have concluded that the registrant’s disclosure controls and procedures (as defined in Rule 30a-3(c) under the Investment Company Act of 1940, as amended (the “1940 Act”)) are effective as of a date within 90 days of the filing of this report based on the evaluation of these controls and procedures required
by Rule 30a-3(b) under the 1940 Act and Rule 15d-15(b) under the Securities Exchange Act of 1934, as amended.
(b) There were no changes in the registrant’s internal control over financial reporting (as defined in Rule 30a-3(d) under the 1940 Act) that occurred during the period covered by this report that have materially affected, or are reasonably likely to materially affect, the registrant’s internal control over financial reporting.
| Item 12 – | Disclosure of Securities Lending Activities for Closed-End Management Investment |
Companies – Not Applicable
| Item 13 – | Exhibits attached hereto |
(a)(1) Code of Ethics – See Item 2
(a)(2) Section 302 Certifications are attached
(a)(3) Not Applicable
(a)(4) Not Applicable
(b) Section 906 Certifications are attached
Pursuant to the requirements of the Securities Exchange Act of 1934 and the Investment Company Act of 1940, the registrant has duly caused this report to be signed on its behalf by the undersigned, thereunto duly authorized.
BlackRock Advantage SMID Cap Fund, Inc. (Formerly BlackRock Advantage U.S. Total Market Fund, Inc.)
| | |
| |
| By: | | /s/ John M. Perlowski |
| | John M. Perlowski |
| | Chief Executive Officer (principal executive officer) of |
| | BlackRock Advantage SMID Cap Fund, Inc. (Formerly BlackRock Advantage U.S. Total Market Fund, Inc.) |
Date: June 3, 2021
Pursuant to the requirements of the Securities Exchange Act of 1934 and the Investment Company Act of 1940, this report has been signed below by the following persons on behalf of the registrant and in the capacities and on the dates indicated.
| | |
| |
| By: | | /s/ John M. Perlowski |
| | John M. Perlowski |
| | Chief Executive Officer (principal executive officer) of |
| | BlackRock Advantage SMID Cap Fund, Inc. (Formerly BlackRock Advantage U.S. Total Market Fund, Inc.) |
Date: June 3, 2021
| | |
| |
| By: | | /s/ Trent Walker |
| | Trent Walker |
| | Chief Financial Officer (principal financial officer) of |
| | BlackRock Advantage SMID Cap Fund, Inc. (Formerly BlackRock Advantage U.S. Total Market Fund, Inc.) |
Date: June 3, 2021