Exhibit 99.1
J.P. Morgan Diversified Industries Conference June 8, 2011
Cautionary Statement Regarding Forward-Looking Information This document contains forward-looking statements within the meaning of the Private Securities Litigation Reform Act of 1995.Forward-looking statements are typically identified by words or phrases such as “may,” “will,” “anticipate,” “estimate,” “expect,” “project,” “intend,” “plan,” “believe,” “target,” “forecast,” and other words and term sof similar meaning.Forward-looking statements involve estimates, expectations, projections, goals, forecasts, assumptions, risks and uncertainties. RockTenn cautions readers that any forward looking statement is not a guarantee of future performance and that actual results could differ materially from those contained in the forward-looking statement.Such forward-looking statements include, but are not limited to,statements regarding the successful integration of Smurfit-Stone as well as opportunities for operational improvement including bu tnot limited to cost reduction and capital investment,the strategi copportunity and perceived value to RockTenn and shareholders of the transaction,the opportunity to recognize benefits from Smurfit-Stone‟sNOLs,the transactions impact on, among other things, RockTenn’s business mix, margins, transitional costs and integration to achieve the synergies and the timing of such costs and synergies and earnings.With respect to these statements, RockTennhasmade assumptions regarding,amongother things,the resultsand impacts of the acquisition; economic,competitive and market conditions generally;volumes and price levels of purchases by customers; competitiveconditions inRockTenn‟s business and possible adverse actions of our respective customers, competitors and suppliers. Further, Rock-Tenn‟s business is subject to a number of general risks that would affect any such forward-looking statement including, among others,decreases in demand for their products;increases in energy,raw materials,shipping andcapital equipment costs;reduced supply of raw materials;fluctuations in selling prices and volumes; intense competition;the potential loss of certain customers;and adverse changes in general market and industry conditions.Such risks andother factors that may impact management‟s Assumptions are more particularly described in RockTenn‟sandSmurfit-Stone‟sfilings with the Securities and Exchange Commission,including under the caption“Business–Forward-Looking Information” and “RiskFactors” in RockTenn‟s AnnualReportonForm10-Kforthemostrecentlyendedfiscalyearand“Business–RiskFactors”and“Forward-Looking Information”in Smurfit-Stone‟s Annual Report on Form10-K for the most recently ended fiscal year.The information contained herein speaks asof the date here of and RockTenn does not under take any obligation to up date or revise its forward-looking statements,whether as a result of new information, future events or otherwise.
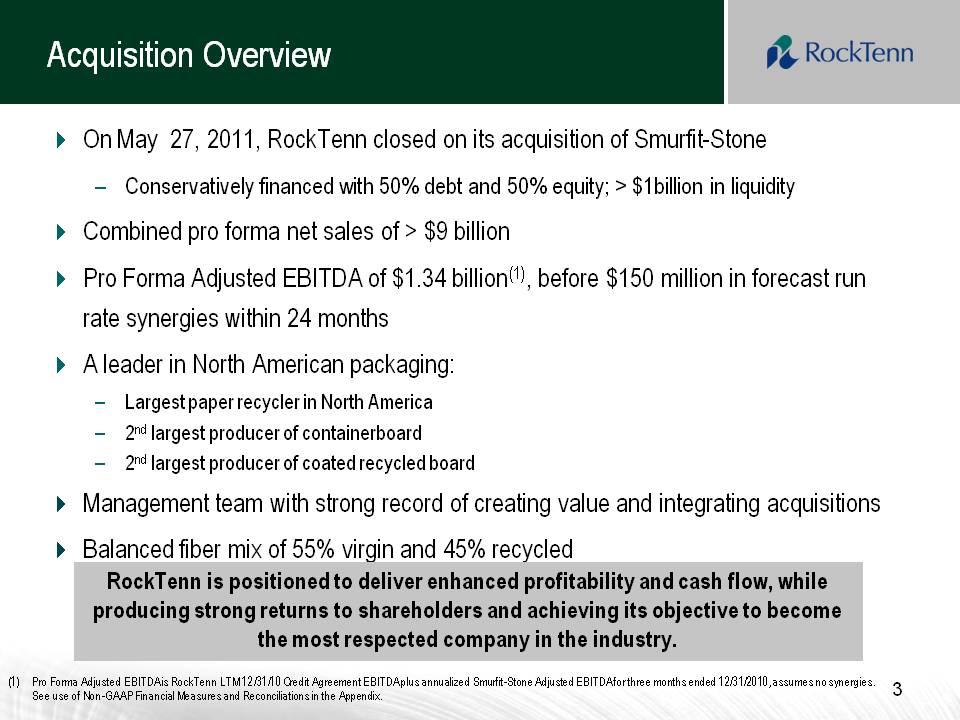
Acquisition Overview On May 27, 2011, RockTenn closed on its acquisition of Smurfit-Stone –Conservatively financed with 50% debt and 50% equity; > $1billion in liquidity Combined pro forma net sales of > $9 billion Pro Forma Adjusted EBITDA of $1.34 billion(1), before $150 million in forecast run rate synergies within 24 months A leader in North American packaging: –Largest paper recycler in North America –2ndlargest producer of containerboard –2ndlargest producer of coated recycled board Management team with strong record of creating value and integrating acquisitions Balanced fiber mix of 55% virgin and 45% recycled 3RockTennis positioned to deliver enhanced profitability and cash flow, while producing strong returns to shareholders and achieving its objective to become the most respected company in the industry. (1)Pro Forma Adjusted EBITDA is RockTenn LTM 12/31/10 Credit Agreement EBITDA plus annualized Smurfit-Stone Adjusted EBITDA for three months ended 12/31/2010, assumes no synergies. See use of Non-GAAP Financial Measures and Reconciliations in the Appendix.
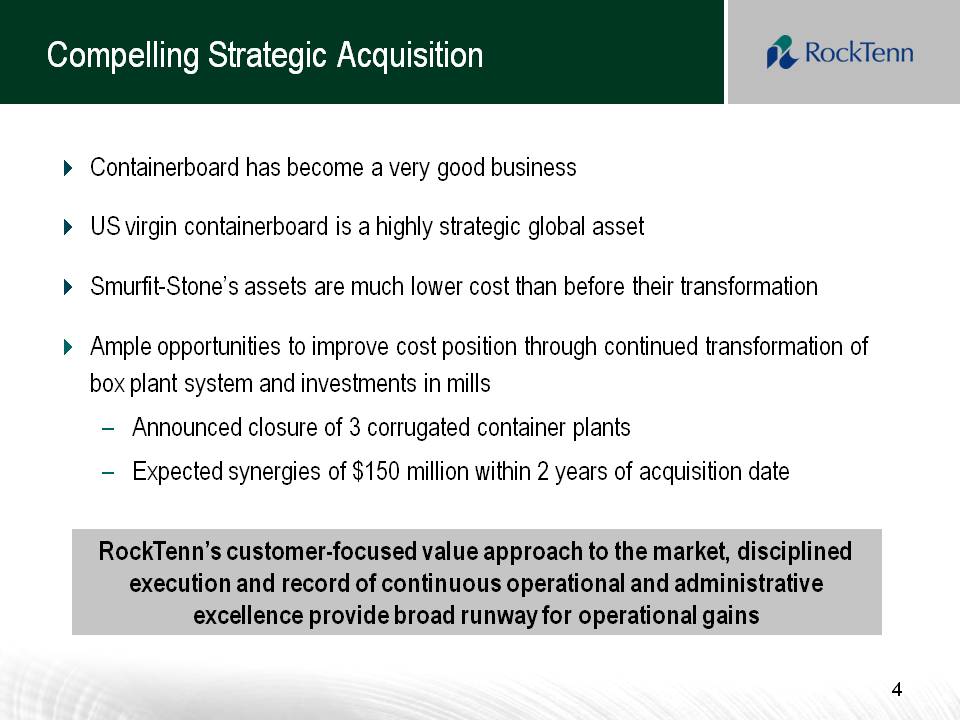
Compelling Strategic Acquisition Containerboard has become a very good business US virgin containerboard is a highly strategic global asset Smurfit-Stone‟s assets are much lower cost than before their transformation Ample opportunities to improve cost position through continued transformation of box plant system and investments in mills –Announced closure of 3 corrugated container plants –Expected synergies of $150 million within 2 years of acquisition date 4
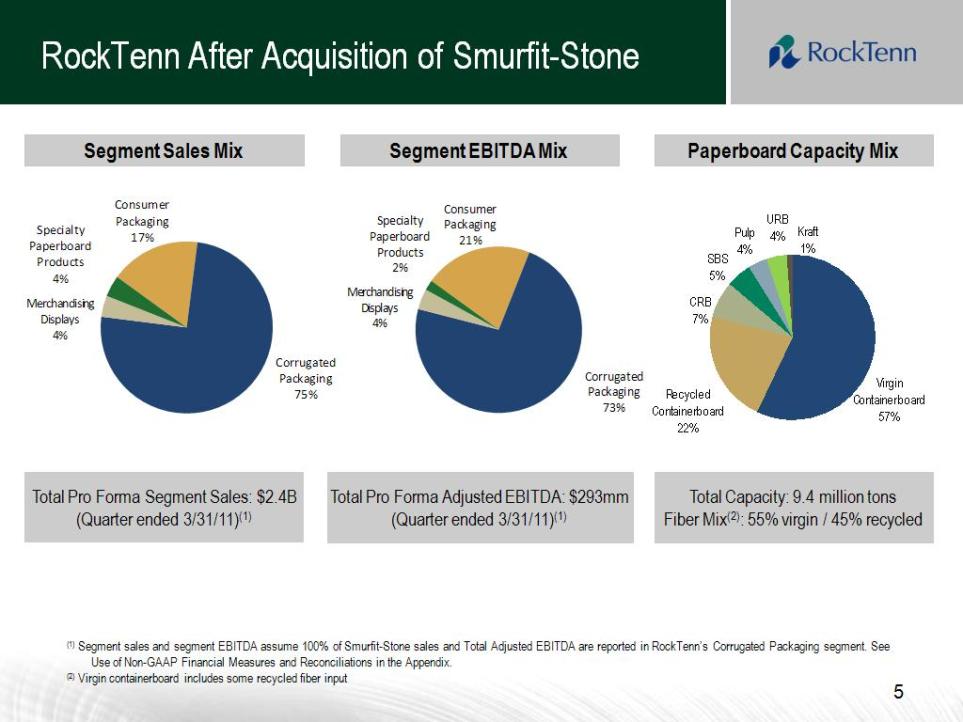
RockTennAfter Acquisition of Smurfit-Stone5 Total Pro Forma Adjusted EBITDA: $293mm (Quarter ended 3/31/11)(1)Total Capacity: 9.4 million tonsFiber Mix(2): 55% virgin / 45% recycled Total Pro Forma Segment Sales: $2.4B (Quarter ended 3/31/11)(1)(1)Segment sales and segment EBITDA assume 100% of Smurfit-Stone sales and Total Adjusted EBITDA are reported in RockTenn‟s Corrugated Packaging segment. See Use of Non-GAAP Financial Measures and Reconciliations in the Appendix.(2)Virgin containerboard includes some recycled fiber input Segment Sales Mix Segment EBITDA MixPaperboard Capacity Mix
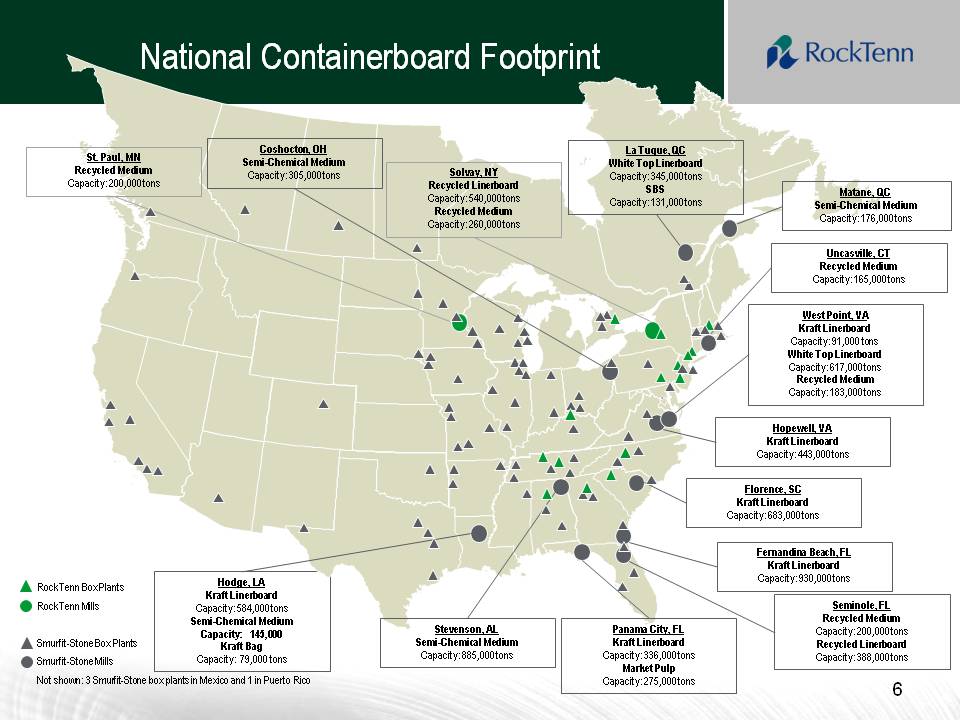
National Containerboard Footprint RockTenn Box Plants RockTenn Mills Smurfit-Stone Box Plants Smurfit-Stone Mills Not shown: 3 Smurfit-Stone box plants in Mexico and 1 in Puerto Rico Hodge, LA Kraft Linerboard Capacity: 584,000 tons Semi-Chemical Medium Capacity: 145,000Kraft Bag Capacity: 79,000 tons Seminole, FL Recycled Medium Capacity: 200,000 tons Recycled Linerboard Capacity: 388,000 tons Fernandina Beach, FL Kraft Linerboard Capacity: 930,000 tons Stevenson, AL Semi-Chemical Medium Capacity: 885,000 tons Florence, SC Kraft Linerboard Capacity: 683,000 tons Hopewell, VA Kraft Linerboard Capacity: 443,000 tons West Point, VA Kraft Linerboard Capacity: 91,000 tons White Top Linerboard Capacity: 617,000 tons Recycled Medium Capacity: 183,000 tons Uncasville, CT Recycled Medium Capacity: 165,000 tons Coshocton, OH Semi-Chemical Medium Capacity: 305,000 tons Solvay, NY Recycled Linerboard Capacity: 540,000 tons Recycled Medium Capacity: 260,000 tons St. Paul, MN Recycled Medium Capacity: 200,000 tons Matane, QC Semi-Chemical Medium Capacity: 176,000 tons La Tuque, QC White Top Linerboard Capacity: 345,000 tons SBS Capacity: 131,000 tons Panama City, FL Kraft Linerboard Capacity: 336,000 tons Market Pulp Capacity: 275,000 tons
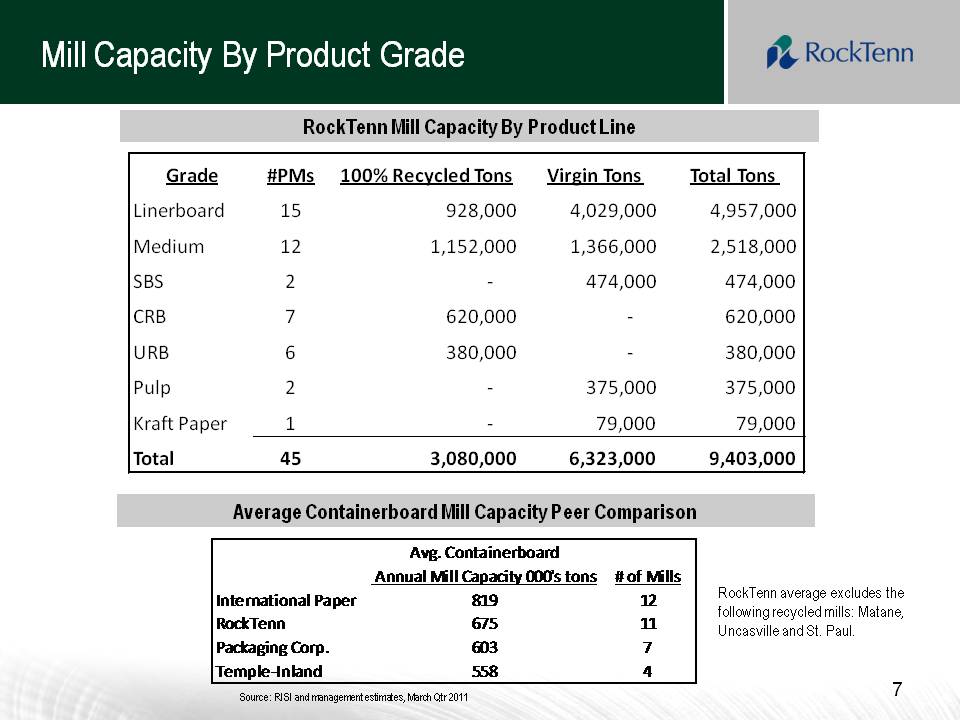
Mill Capacity By Product Grade 7Avg. Containerboard Annual Mill Capacity 000's tons# of Mills International Paper81912RockTenn67511Packaging Corp.6037Temple-Inland5584Source: RISI and management estimates, March Qtr 2011RockTenn average excludes the following recycled mills: Matane, Uncasville and St. Paul.Average Containerboard Mill Capacity Peer Comparison RockTenn Mill Capacity By Product LineGrade#PMs100% Recycled Tons Virgin Tons Total Tons Linerboard 15928,000 4,029,000 4,957,000 Medium 121,152,000 1,366,000 2,518,000 SBS2-474,000 474,000 CRB7 620,000-620,000 URB6 380,000-380,000 Pulp2-375,000 375,000 Kraft Paper1-79,000 79,000 Total 453,080,000 6,323,000 9,403,000
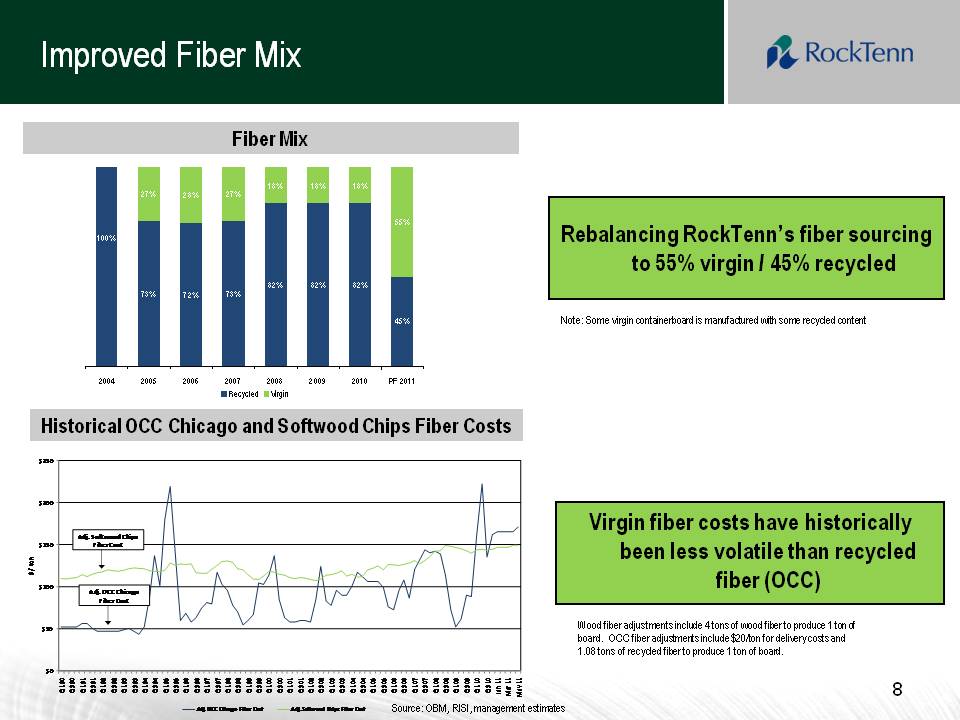
Improved Fiber Mix8Rebalancing RockTenn’s fiber sourcing to 55% virgin / 45% recycled Note: Some virgin containerboard is manufactured with some recycled content Source: OBM, RISI, management estimates Wood fiber adjustments include 4 tons of wood fiber to produce 1 ton of board. OCC fiber adjustments include $20/ton for delivery costs and 1.08 tons of recycled fiber to produce 1 ton of board. 73% 72% 73% 82% 82% 82% 45% 27% 28% 27% 18% 18% 18% 55% 100% 2004 2005 2006 2007 2008 2009 2010 PF 2011 Recycled Virgin Fiber Mix Historical OCC Chicago and Softwood Chips Fiber Costs$0 $50 $100 $150 $200 $250 Q1 90 Q3 90 Q1 91 Q3 91 Q1 92 Q3 92 Q1 93 Q3 93 Q1 94 Q3 94 Q1 95 Q3 95 Q1 96 Q3 96 Q1 97 Q3 97 Q1 98 Q3 98 Q1 99 Q3 99 Q1 00 Q3 00 Q1 01 Q3 01 Q1 02 Q3 02 Q1 03 Q3 03 Q1 04 Q3 04 Q1 05 Q3 05 Q1 06 Q3 06 Q1 07 Q3 07 Q1 08 Q3 08 Q1 09 Q3 09 Q1 10 Q3 10Jan 11Mar 11May 11$ / ton Adj. OCC Chicago Fiber Cost Adj. Softwood Chips Fiber Cost Adj. Softwood Chips Fiber Cost Adj. OCC Chicago Fiber Cost Virgin fiber costs have historically been less volatile than recycled Source: OBM, RISI, management estimates
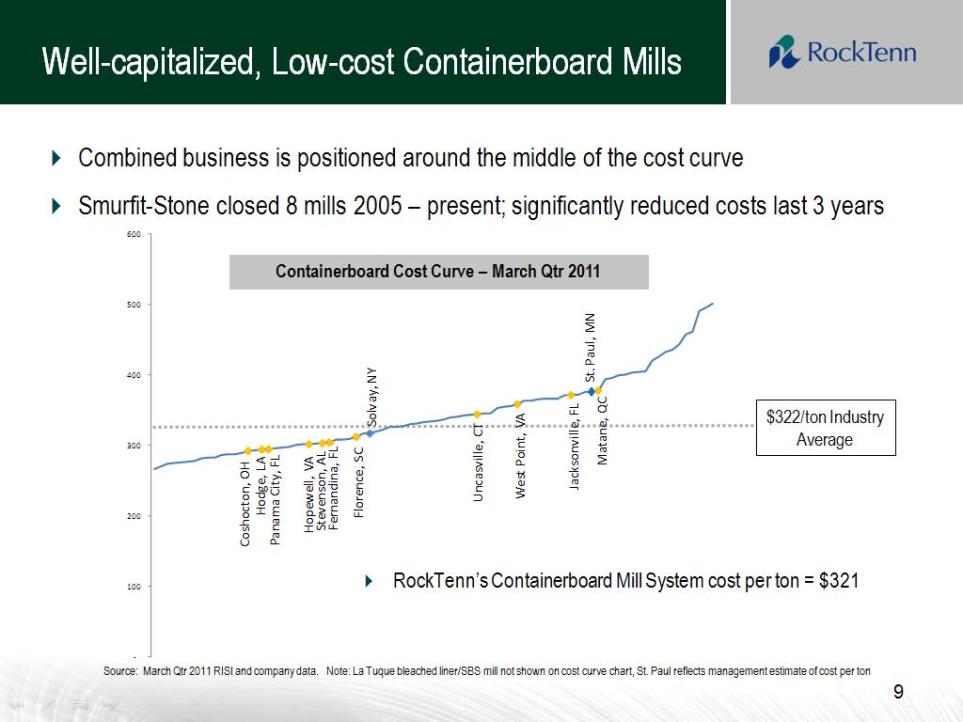
ton Containerboard Cost Curve –March Qtr 2011 RockTenn‟s Containerboard Mill System cost per ton = $321 $322/ton Industry Average 9$322/ton Industry Average Source: March Qtr 2011 RISI and company data. Note: La Tuque bleached liner/SBS mill not shown on cost curve chart, St. Paul reflects management estimate of cost per ton Combined business is positioned around the middle of the cost curve Smurfit-Stone closed 8 mills 2005 –present; significantly reduced costs last 3 years Well-capitalized, Low-cost Containerboard Mills
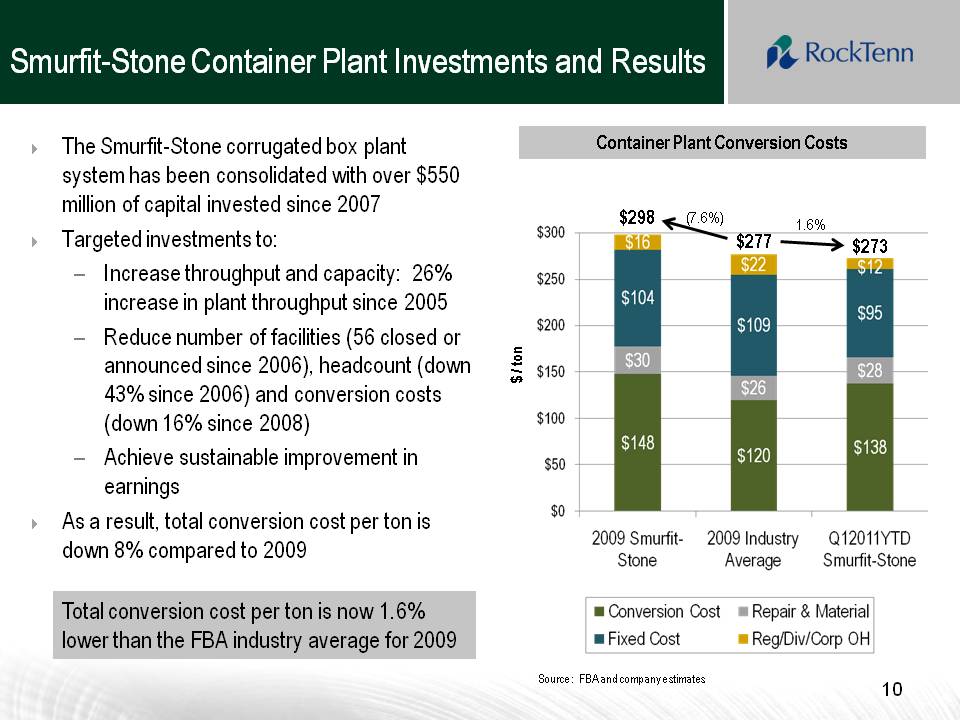
Smurfit-Stone Container Plant Investments and Results10The Smurfit-Stone corrugated box plant system has been consolidated with over $550 million of capital invested since 2007Targeted investments to:–Increase throughput and capacity: 26% increase in plant throughput since 2005–Reduce number of facilities (56 closed or announced since 2006), headcount (down 43% since 2006) and conversion costs (down 16%since 2008) –Achieve sustainable improvement in earnings As a result, total conversion cost per ton is down 8% compared to 2009 $277 $298 $273 Container Plant Conversion Costs(7.6%)1.6% Total conversion cost per ton is now 1.6% lower than the FBA industry average for 2009 Source: FBA and company estimates $300 $250 $200 $150 $100 $50 $0 Conversion Cost Fixed Cost Repair & Material Reg/Div/Corp OH $16 $104 $30 $148 $22 $109 $26 $120 $138 $28 $95 $12
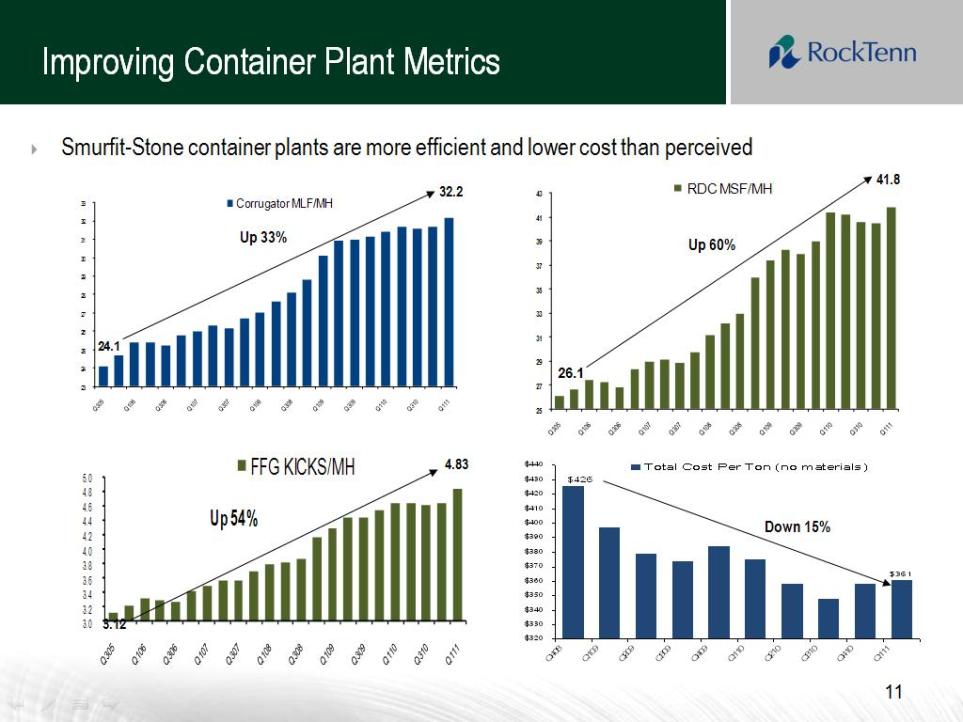
232425 262728 2930313233 Corrugator MLF/MH24.1 $ 361 $ 426 $ 320 $ 330 $ 340 $ 350 $ 360 $ 370 $ 380 $ 390 $ 400 $ 410 $ 420 $ 430 $ 440 Q408 Q109 Q209 Q309 Q409 Q110 Q210 Q310 Q410 Q111Total Cost Per Ton (no materials)11Improving Container Plant Metrics 25272931 333537394143 RDC MSF/MH32.241.826.1 Up 60%Up 33%Down 15% Smurfit-Stone container plants are more efficient and lower cost than perceived 3.0 3.2 3.4 3.6 3.8 4.0 4.2 4.4 4.6 4.8 5.0 FFG KICKS/MHUp 54% 4.83
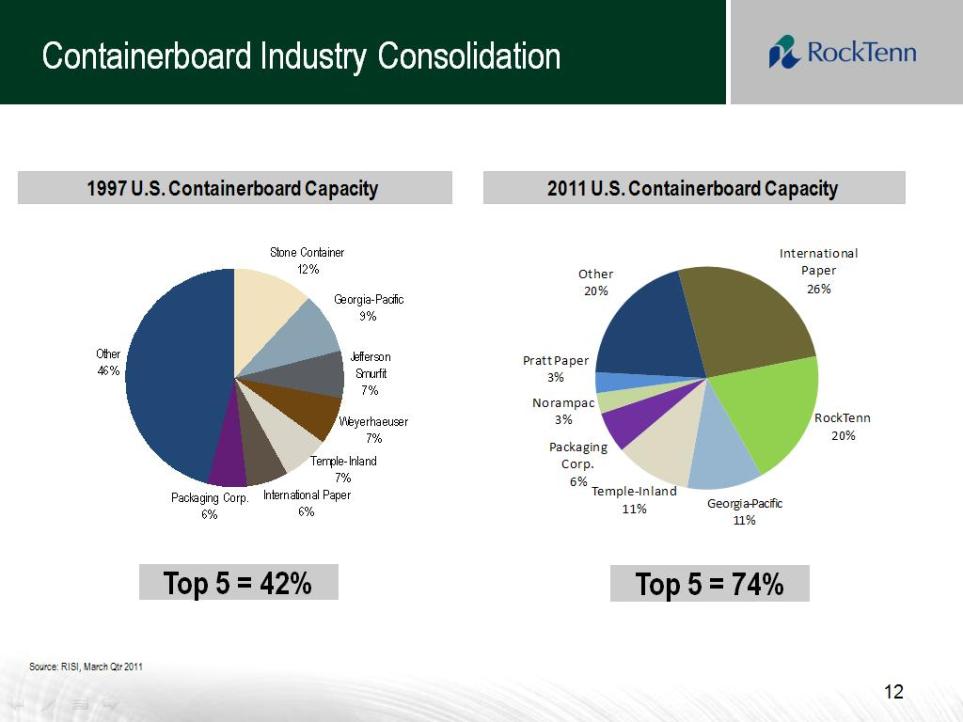
Containerboard Industry Consolidation 12Source: RISI, March Qtr 20111997 U.S. Containerboard Capacity 2011 U.S. Containerboard Capacity Top 5 = 42% Top 5 = 74%
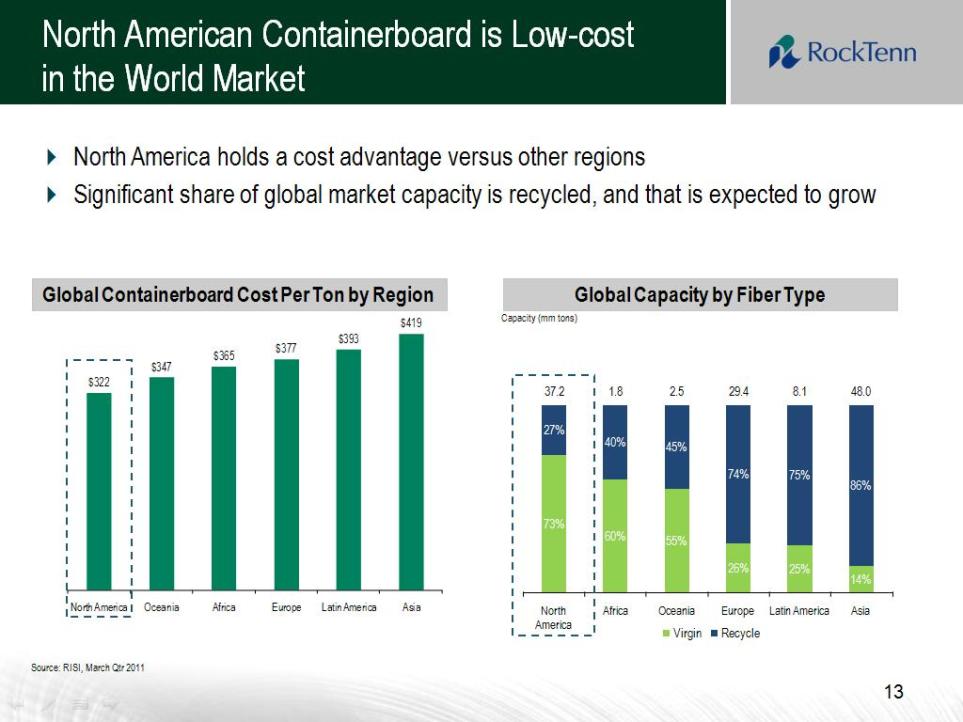
North American Containerboard is Low-costin the World Market13 Global Capacity by Fiber Type Global Containerboard Cost Per Ton by Region North America holds a cost advantage versus other regions Significant share of global market capacity is recycled, and that is expected to grow Source: RISI, March Qtr 2011 Capacity (mm tons) % 60% 55% 26% 25% 14% 27% 40% 45% 74% 75% 86% 37.21.82.529.48.148.0North America Africa Oceania Europe Latin America Asia Virgin Recycle
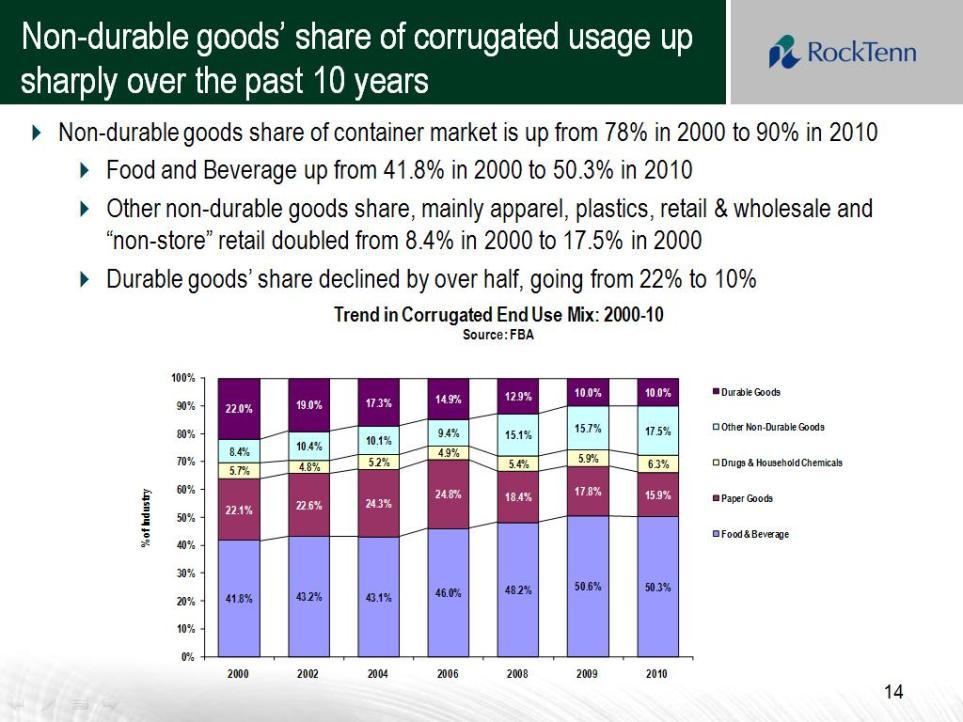
Non-durable goods‟ share of corrugated usage up sharply over the past 10 years 14 Non-durable goods share of container market is up from 78% in 2000 to 90% in 2010 Food and Beverage up from 41.8% in 2000 to 50.3% in 2010 Other non-durable goods share, mainly apparel, plastics, retail & wholesale and “non-store” retail doubled from 8.4% in 2000 to 17.5% in 2000 Durable goods‟ share declined by over half, going from 22% to 10%
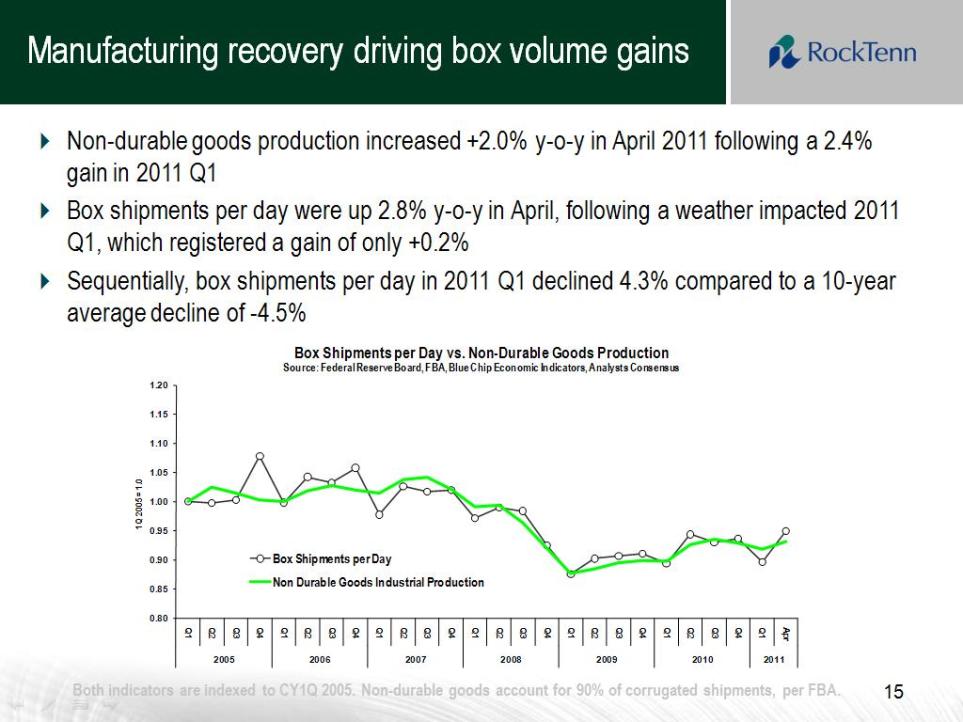
Manufacturing recovery driving box volume gains15 Non-durable goods production increased +2.0% y-o-y in April 2011 following a 2.4% gain in 2011 Q1 Box shipments per day were up 2.8% y-o-y in April, following a weather impacted 2011 Q1, which registered a gain of only +0.2% Sequentially, box shipments per day in 2011 Q1 declined 4.3% compared to a 10-year average decline of -4.5%
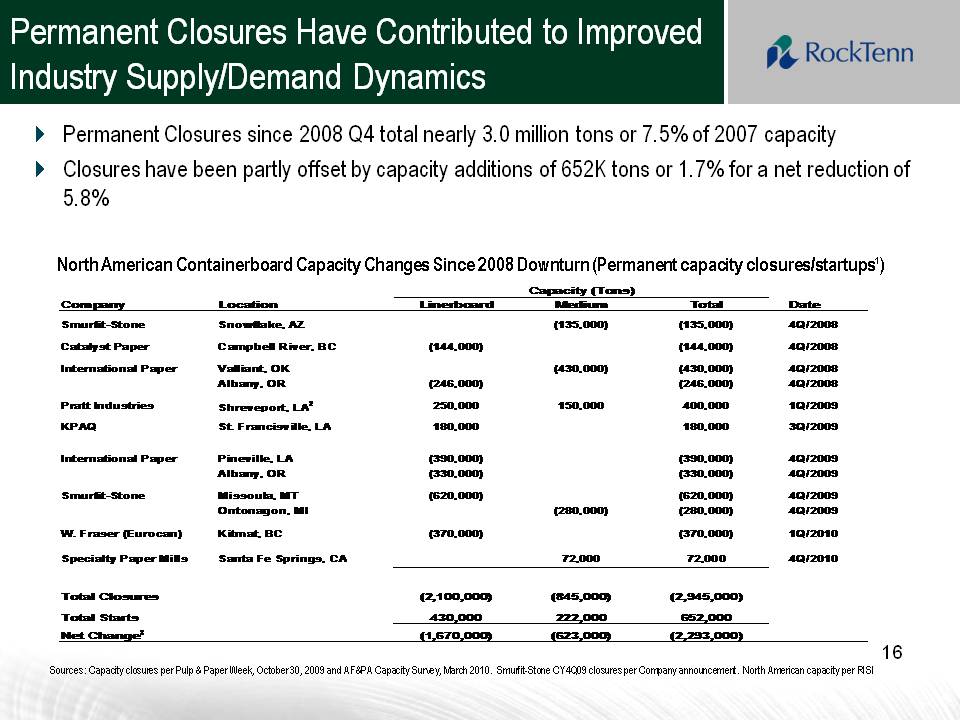
Permanent Closures Have Contributed to Improved Industry Supply/Demand Dynamics Sources: Capacity closures per Pulp & Paper Week, October 30, 2009 and AF&PA Capacity Survey, March 2010. Smurfit-Stone CY4Q09 closures per Company announcement. North American capacity per RISI North American Containerboard Capacity Changes Since 2008 Downturn (Permanent capacity closures/startups¹)16 Permanent Closures since 2008 Q4 total nearly 3.0 million tons or 7.5% of 2007 capacity Closures have been partly offset by capacity additions of 652K tons or 1.7% for a net reduction of 5.8%
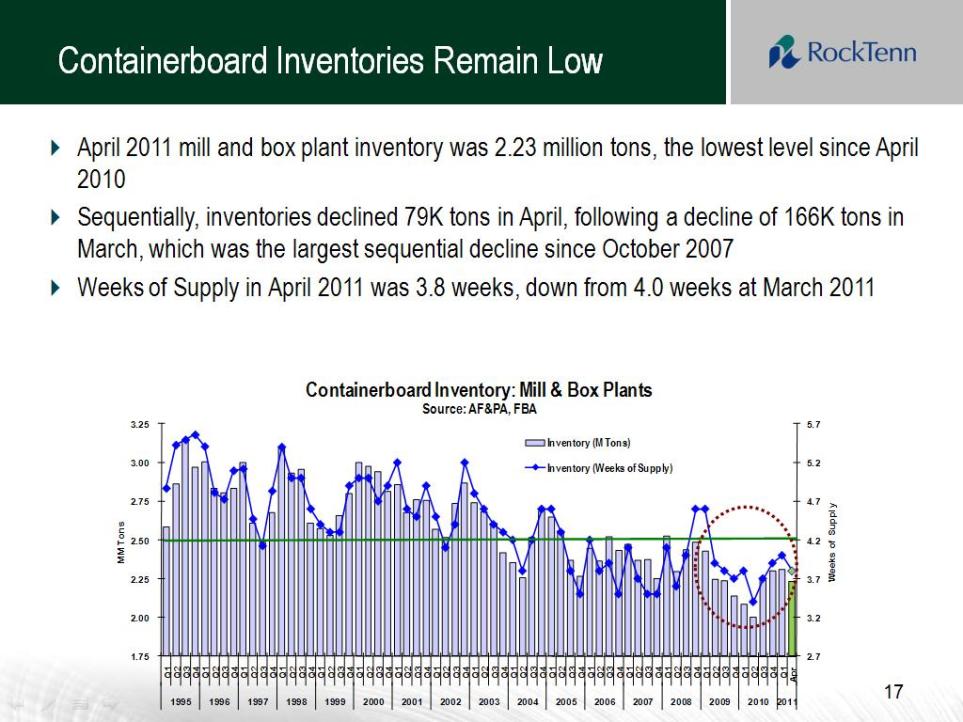
Containerboard Inventories Remain Low2.7 3.2 3.7 4.2 4.7 5.2 5.7 1.75 2.00 2.25 2.50 2.75 3.00 3.25 Q1 Q2 Q3 Q4 Q1 Q2 Q3 Q4 Q1 Q2 Q3 Q4 Q1 Q2 Q3 Q4 Q1 Q2 Q3 Q4 Q1 Q2 Q3 Q4 Q1 Q2 Q3 Q4 Q1 Q2 Q3 Q4 Q1 Q2 Q3 Q4 Q1 Q2 Q3 Q4 Q1 Q2 Q3 Q4 Q1 Q2 Q3 Q4 Q1 Q2 Q3 Q4 Q1 Q2 Q3 Q4 Q1 Q2 Q3 Q4 Q1 Q2 Q3 Q Q1Apr19951996 1997 1998 1999 2000 2001 2002 2003 2004 2005 2006 2007 2008 2009 2010 2011 Weeks of Supply MM TonsContainerboard Inventory: Mill & Box PlantsSource: AF&PA, FBAInventory (M Tons)Inventory (Weeks of Supply)17 April 2011 mill and box plant inventory was 2.23 million tons, the lowest level since April 2010 Se Quentially, inventories declined 79K tons in April, following a decline of 166K tons in March, which was the largest se Quential decline since October 2007 Weeks of Supply in April 2011 was 3.8 weeks, down from 4.0 weeks at March 2011
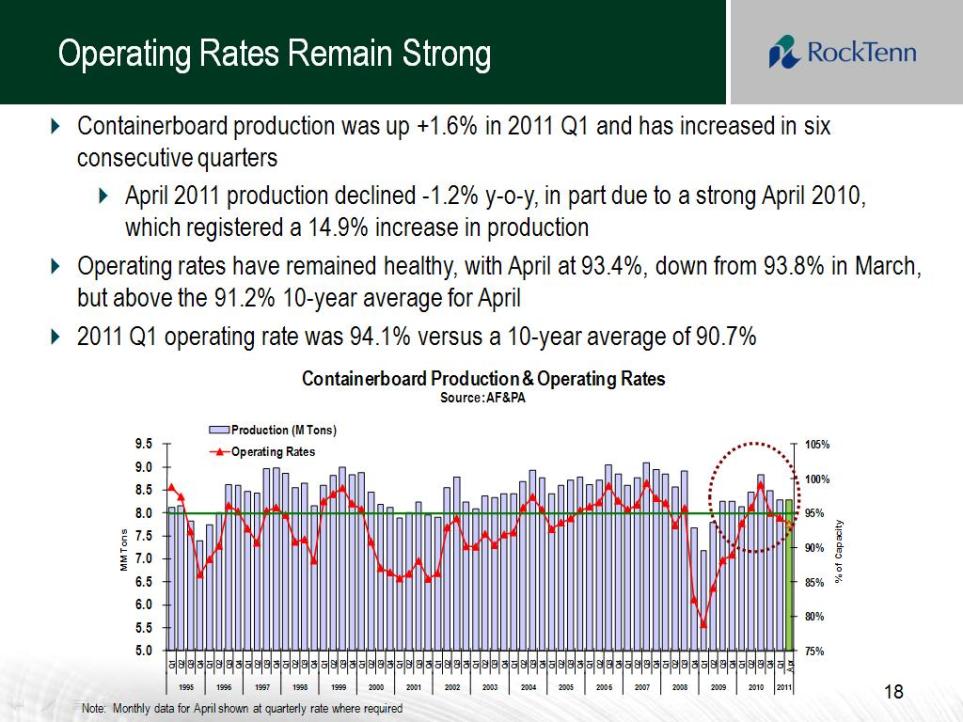
Operating Rates Remain Strong75%80%85%90%95%100%105%5.0 5.5 6.0 6.5 7.0 7.5 8.0 8.5 9.0 9.5 Q1 Q2 Q3 Q4 Q1 Q2 Q3 Q4 Q1 Q2 Q3 Q4 Q1 Q2 Q3 Q4 Q1 Q2 Q3 Q4 Q1 Q2 Q3 Q4 Q1 Q2 Q3 Q4 Q1 Q2 Q3 Q4 Q1 Q2 Q3 Q4 Q1 Q2 Q3 Q4 Q1 Q2 Q3 Q4 Q1 Q2 Q3 Q4 Q1 Q2 Q3 Q4 Q1 Q2 Q3 Q4 Q1 Q2 Q3 Q4 Q1 Q2 Q3 Q Q1Apr1995 1996 1997 1998 1999 2000 2001 2002 2003 2004 2005 2006 2007 2008 2009 2010 2011% of Capacity MM Tons Containerboard Production & Operating Rates Source: AF&PA Production (M Tons)Operating RatesNote: Monthly data for April shown at Quarterly rate where re Quired18 Containerboard production was up +1.6% in 2011 Q1 and has increased in six consecutive Quarters April 2011 production declined -1.2% y-o-y, in part due to a strong April 2010, which registered a 14.9% increase in production Operating rates have remained healthy, with April at 93.4%, down from 93.8% in March, but above the 91.2% 10-year average for April 2011 Q1 operating rate was 94.1% versus a 10-year average of 90.7%
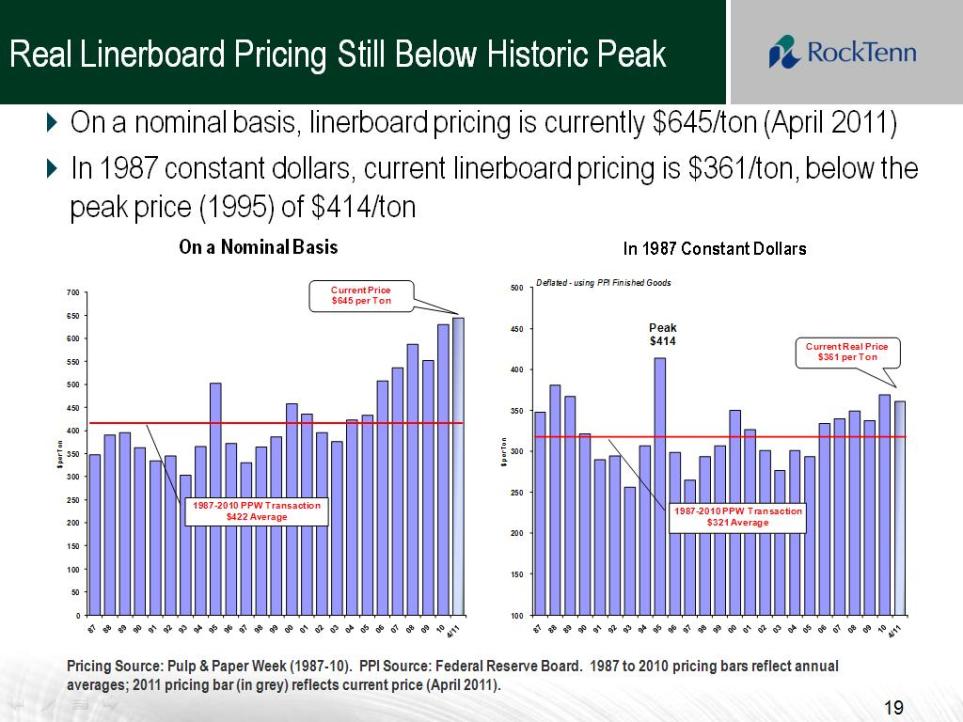
Real Linerboard Pricing Still Below Historic Peak 050100150200250300350400450500550600650700 $ per Ton On a Nominal Basis1987-2010 PPW Transaction$422 Average Current Price$645 per Ton100 150 200 250 300 350 400 450 500 $ per Ton In 1987 Constant Dollars1987-2010 PPW Transaction$321 Average Current Real Price$361 per Ton Deflated -using PPI Finished Goods Peak $41419 On a nominal basis, linerboard pricing is currently $645/ton (April 2011)In 1987 constant dollars, current linerboard pricing is $361/ton, below the peak price (1995) of $414/ton Pricing Source: Pulp & Paper Week (1987-10). PPI Source: Federal Reserve Board. 1987 to 2010 pricing bars reflect annual averages; 2011 pricing bar (in grey) reflects current price (April 2011).Real Linerboard Pricing Still Below Historic Peak
Real Linerboard Pricing Still Below Historic Peak 050100150200250300350400450500550600650700 $ per Ton On a Nominal Basis1987-2010 PPW Transaction$422 Average Current Price$645 per Ton100 150 200 250 300 350 400 450 500 $ per Ton In 1987 Constant Dollars1987-2010 PPW Transaction$321 Average Current Real Price$361 per Ton Deflated -using PPI Finished Goods Peak $41419On a nominal basis, linerboard pricing is currently $645/ton (April 2011)In 1987 constant dollars, current linerboard pricing is $361/ton, below the peak price (1995) of $414/ton Pricing Source: Pulp & Paper Week (1987-10). PPI Source: Federal Reserve Board. 1987 to 2010 pricing bars reflect annual averages; 2011 pricing bar (in grey) reflects current price (April 2011).Real Linerboard Pricing Still Below Historic Peak
Management‟s Successful Execution Track Record Extensive operational and industry experience; operating units led by: –Mike Kiepura, President-Consumer Packaging –Jim Porter, President-Corrugated Packaging Proven track record of successfully integrating acquisitions –Opportunities to invest capital in the mill system and optimize the footprint to reduce costs –Complete the box plant consolidation –Apply the RockTenn business model to the box plant system, driving product innovation, improve customer satisfaction and low-cost manufacturing while maximizing sales revenue –Build a single cultural model which inspires a high-performing business Demonstrated ability to reduce debt: –Opening leverage of 2.8x –Targeted leverage position of 2.0x Proven ability to achieve financial objectives Committed to achieving and maintaining investment grade credit profile –BBB-(Stable) rating from S&P Ba1 (Stable) rating from Moody‟s 21
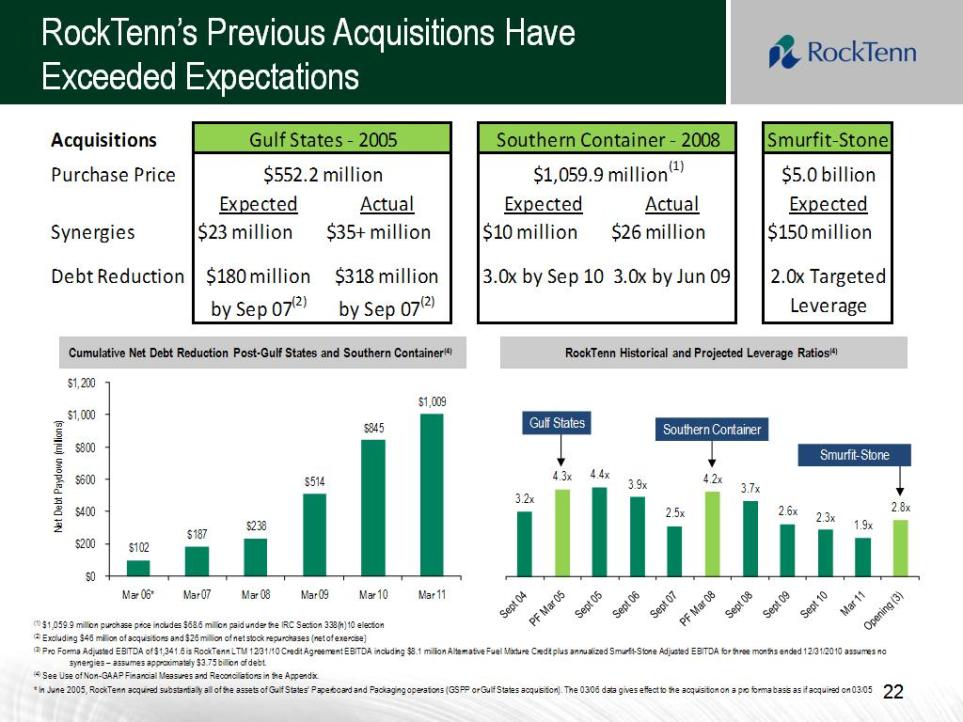
RockTenn Historical and Projected Leverage Ratios(4) 22 22 (1) $1,059.9 million purchase price includes $68.6 million paid under the IRC Section 338(h)10 election(2) Excluding $46 million of acquisitions and $26 million of net stock repurchases (net of exercise)(3) Pro Forma Adjusted EBITDA of $1,341.6 is RockTenn LTM 12/31/10 Credit Agreement EBITDA including $8.1 million Alternative Fuel Mixture Credit plus annualized Smurfit-Stone Adjusted EBITDA for three months ended 12/31/2010 assumes no synergies – assumes approximately $3.75 billion of debt.(4) See Use of Non-GAAP Financial Measures and Reconciliations in the Appendix.* In June 2005, RockTenn acquired substantially all of the assets of Gulf States’ Paperboard and Packaging operations (GSPP or Gulf States acquisition). The 03/06 data gives effect to the acquisition on a pro forma basis as if acquired on 03/05 RockTenn’s Previous Acquisitions Have Exceeded Expectations Cumulative Net Debt Reduction Post-Gulf States and Southern Container(4)
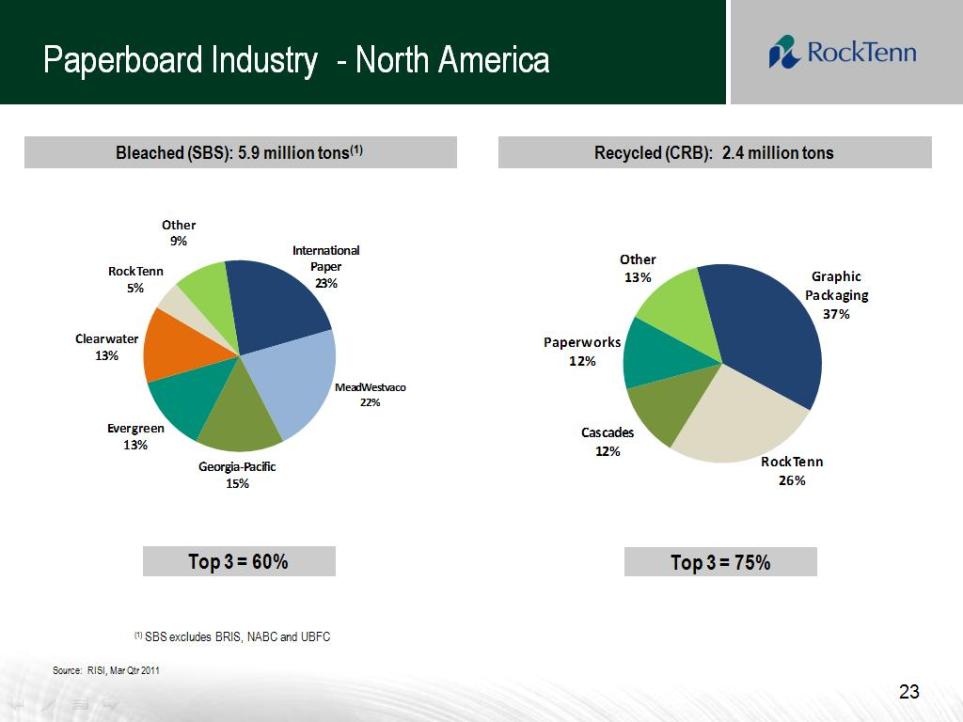
23 Source: RISI, Mar Qtr 2011 (1) SBS excludes BRIS, NABC and UBFC Bleached (SBS): 5.9 million tons(1) Recycled (CRB): 2.4 million tons Paperboard Industry - North America Top 3 = 60% Top 3 = 75%
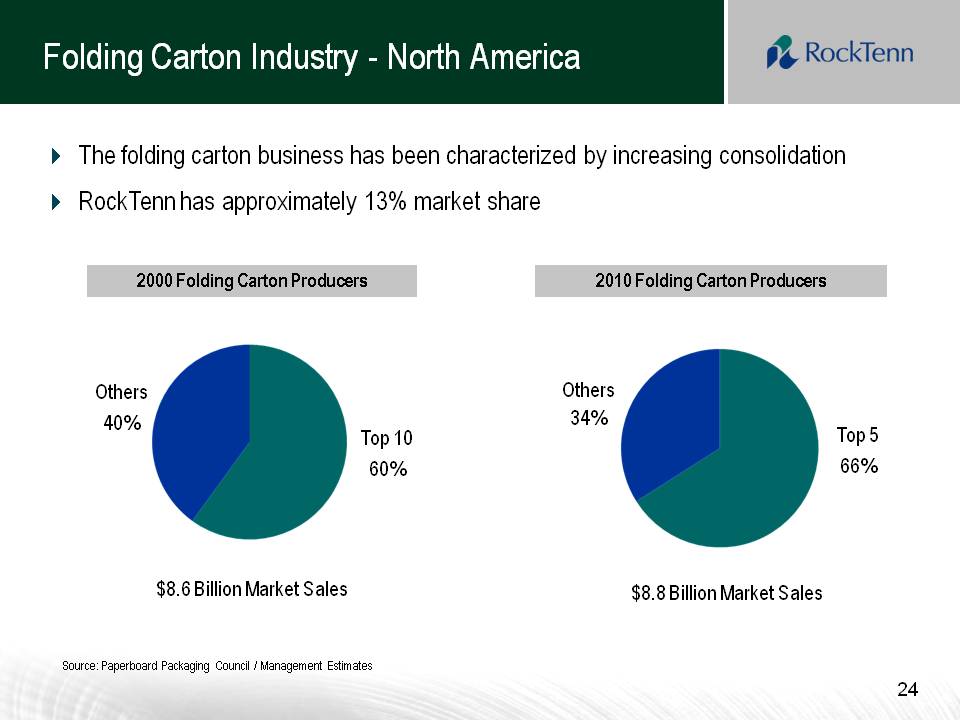
24 Folding Carton Industry - North America 2000 Folding Carton Producers 2010 Folding Carton Producers Source: Paperboard Packaging Council / Management Estimates $8.6 Billion Market Sales The folding carton business has been characterized by increasing consolidation RockTenn has approximately 13% market share $8.8 Billion Market Sales Top 10 60%Others 40% Top 5 66% Others 34%
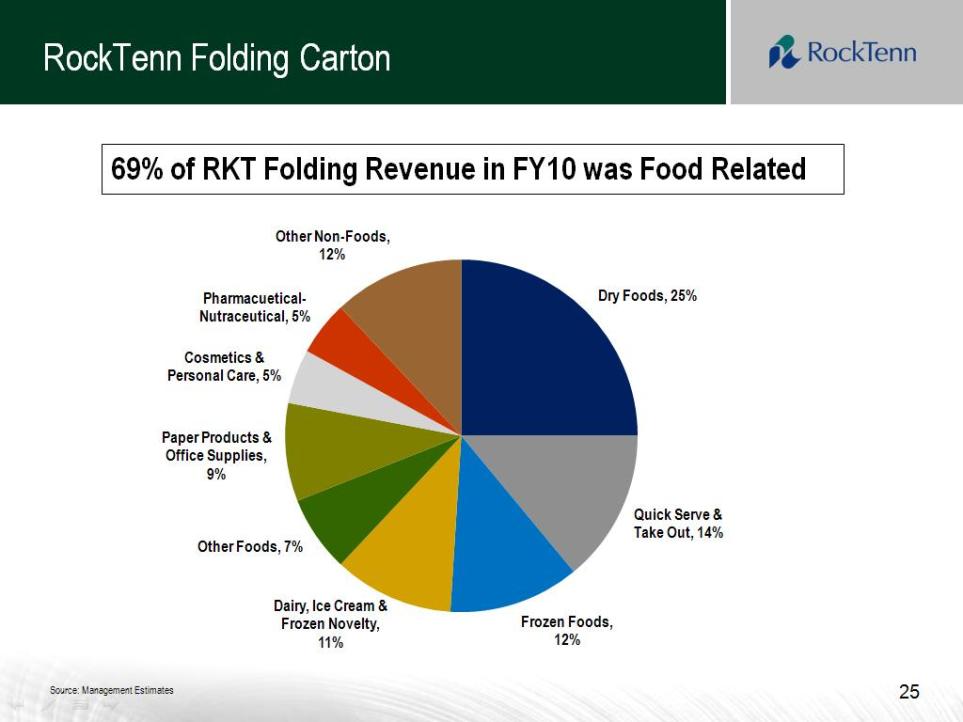
69% of RKT Folding Revenue in FY10 was Food Related Other Non-Foods, 12% Pharmacuetical-Nutraceutical, 5% Dry Foods, 25% Cosmetics & Personal Care, 5% Paper Products & Office Supplies, 9% Other Foods, 7% Quick Serve & Take Out, 14% Frozen Foods, 12% Dairy, Ice Cream & Frozen Novelty, 11% Source: Management Estimates
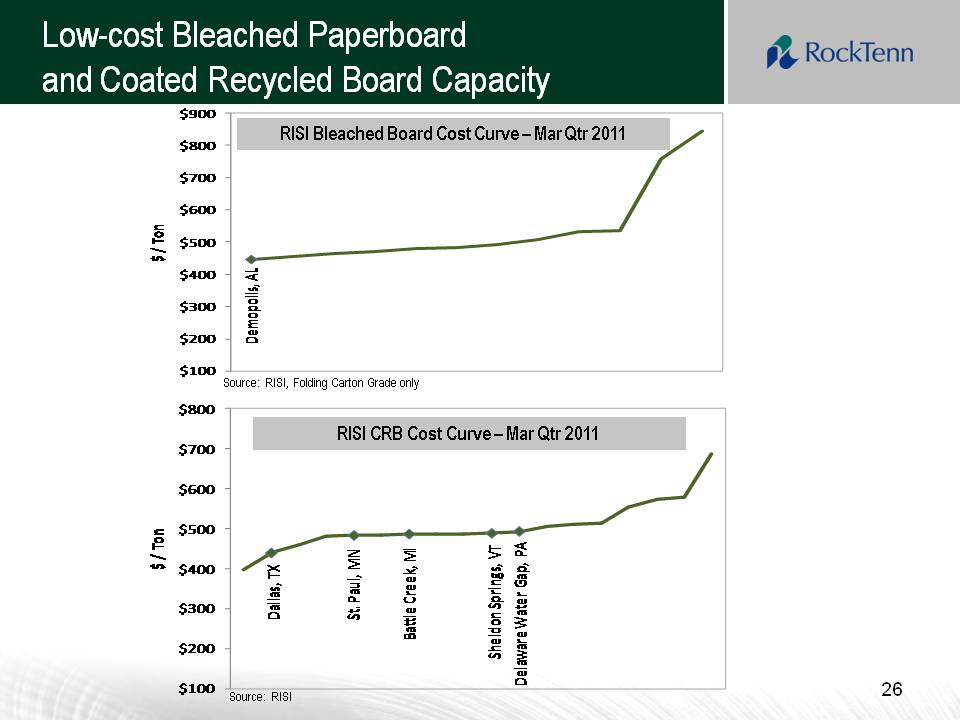
26 onlyRISI Bleached Board Cost Curve –Mar Qtr 2011 RISI CRB Cost Curve –Mar Qtr 2011 800$900$ / TonDemopolis,AL $100 $200 $300 $400 $500 $600 $700 $800$ 100 $200 $300 $400 $500 $0
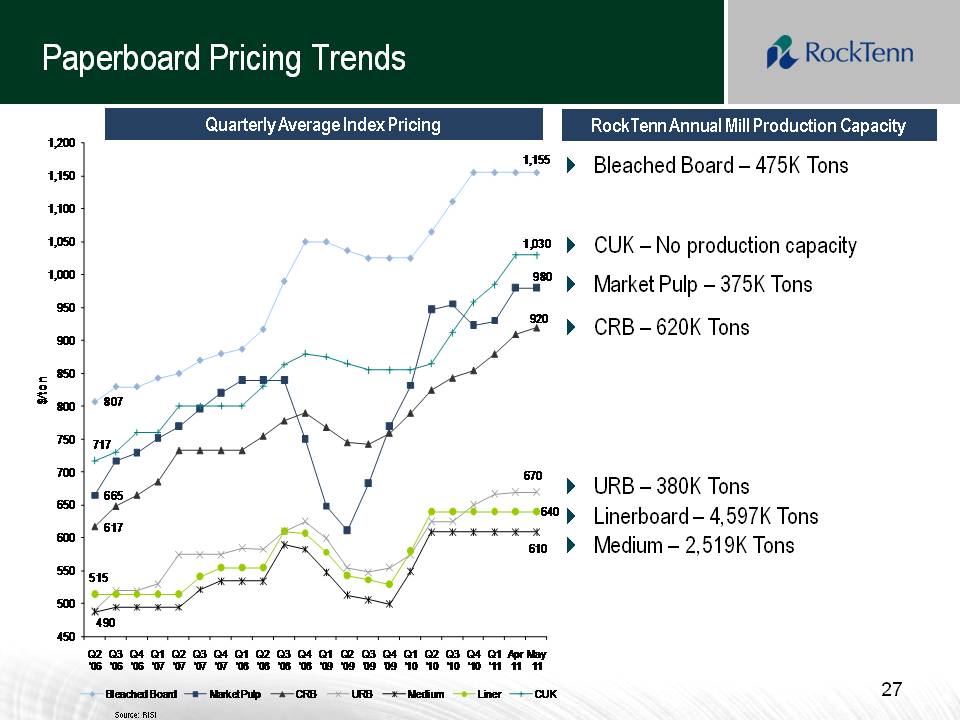
Paperboard Pricing Trends RockTenn Annual Mill Production Capacity Bleached Board –475K Tons CUK –No production capacity Market Pulp –375K Tons CRB –620K Tons URB –380K Tons Linerboard –4,597K Tons Medium –2,519K Tons 8071,1556659806179 20 490 670 610 515 640 7171,030450500550600650 7007 508008 509009501,0001,0501,1001,1501,200 Q2 '06 Q3 '06 Q4 '06 Q1 '07Q2 '07 Q3 '07 Q4 '07 Q1 '08 Q2 '08 Q3 '08 Q4 '08 Q1 '09 Q2 '09 Q3 '09 Q4 '09 Q1 '10 Q2 '10 Q3 '10 Q4 '10 Q1 '11Apr 11May 11$/ton Bleached Board Market Pulp CRBURB MediumLiner CUK
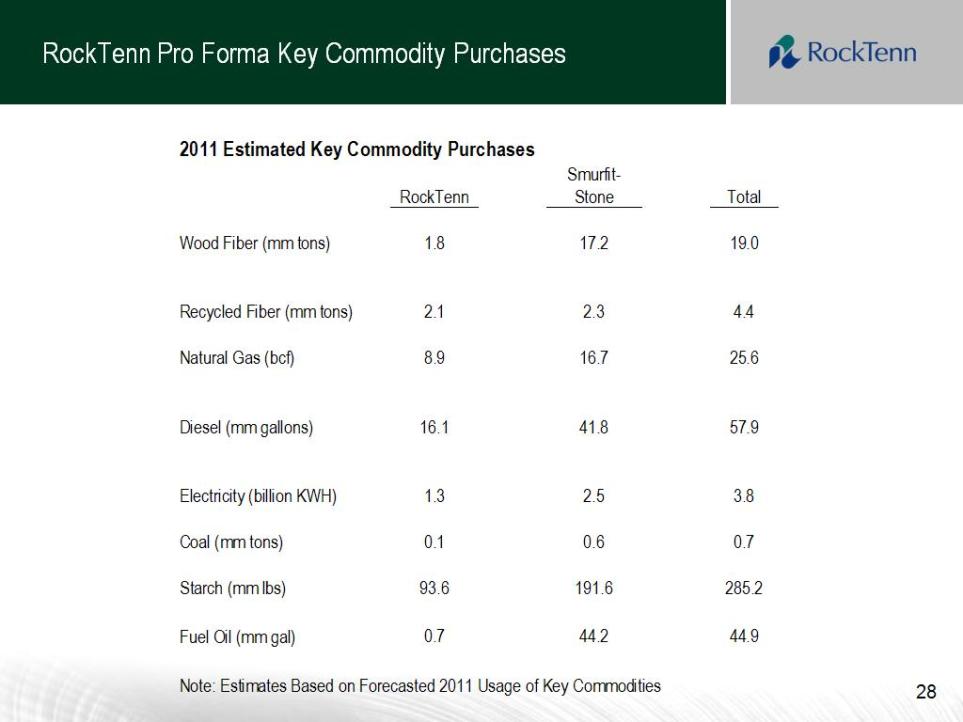
RockTenn Pro Forma Key Commodity Purchases 28 RockTenn Smurfit-Stone Total 1.8 17.2 19.0 2.1 2.3 4.4 8.9 16.7 25.6 16.1 41.8 57.9 1.3 2.5 3.8 0.1 0.6 0.7 93.6 191.6285.20.744.244.9 Coal (mm tons) Starch (mm lbs) Fuel Oil (mm gal)Note: Estimates Based on Forecasted 2011 Usage of Key Commodities Wood Fiber (mm tons) Recycled Fiber (mm tons) Natural Gas (bcf) Diesel (mm gallons)Electricity (billion KWH) 2011 Estimated Key Commodity Purchases
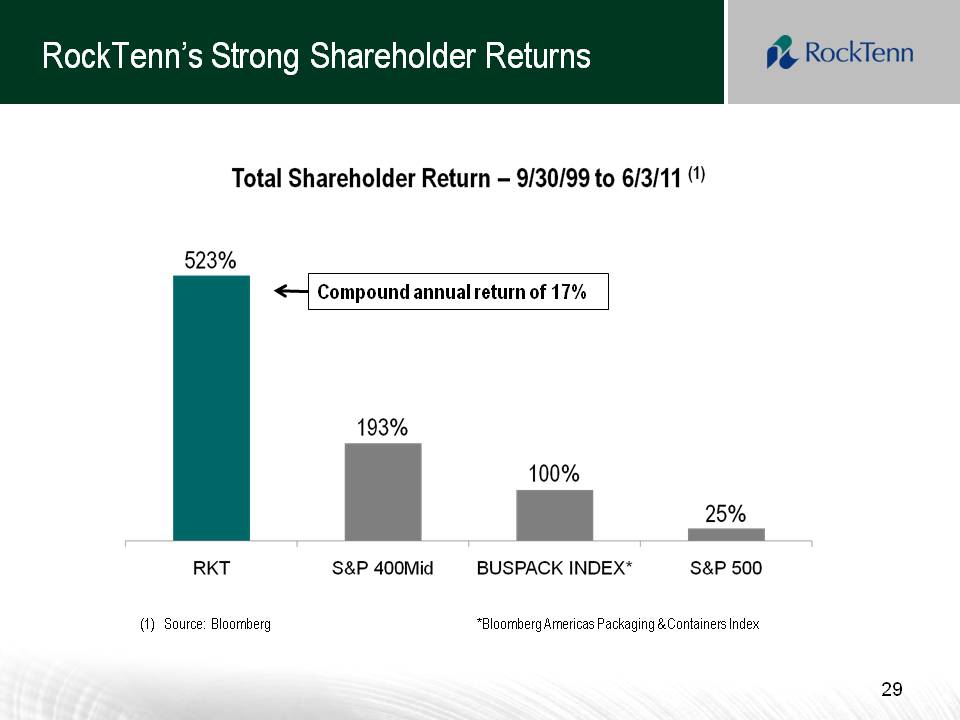
RockTenn’s Strong Shareholder Returns (1)Source: Bloomberg*Bloomberg Americas Packaging & Containers Index Compound annual return of 17% Total Shareholder Return 9/30/99 to 6/3/11 523% RKT 193% 100% 25% Buspack Index S7P 400Mid S$P 500 source: Bloomberg *Bloomberg Americas Packaging & Containers Index
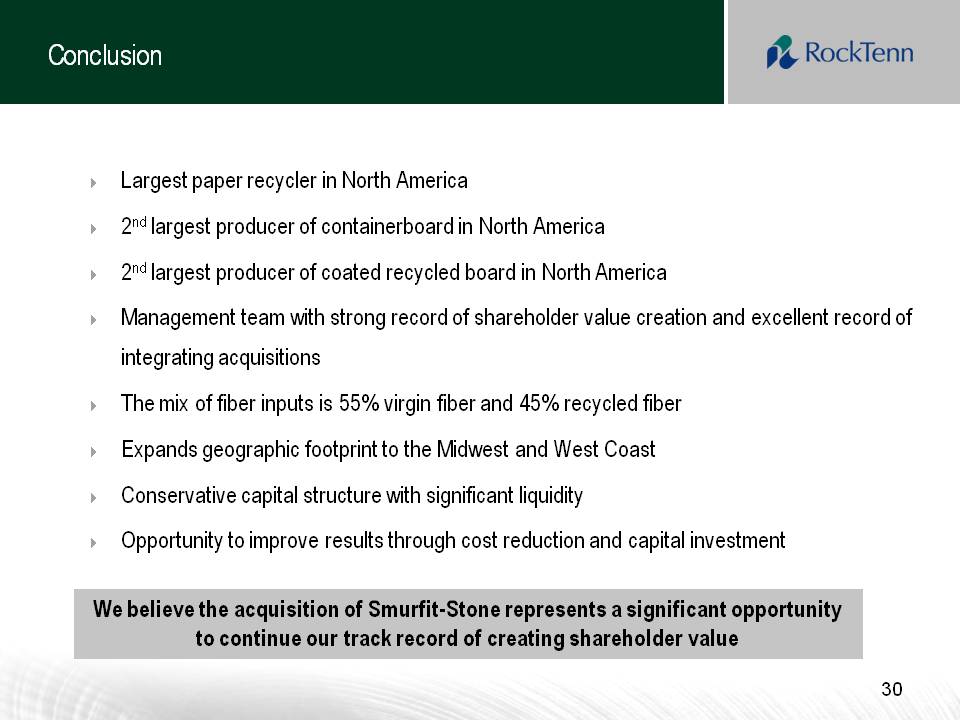
Conclusion Largest paper recycler in North America 2ndlargest producer of containerboard in North America 2ndlargest producer of coated recycled board in North America Management team with strong record of shareholder value creation and excellent record of integrating acquisitions The mix of fiber inputs is 55% virgin fiber and 45% recycled fiber Expands geographic footprint to the Midwest and West Coast Conservative capital structure with significant liquidity Opportunity to improve results through cost reduction and capital investment 30We believe the acquisition of Smurfit-Stone represents a significant opportunity to continue our track record of creating shareholder value

Appendix
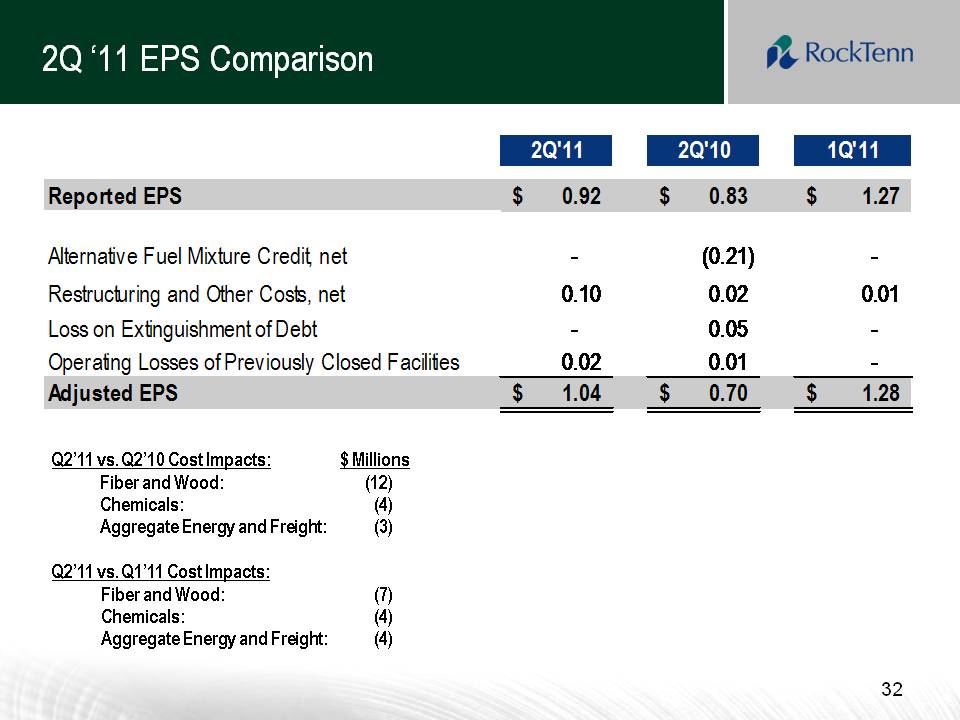
2Q 11 EPS Comparison322Q'112Q'101Q'11Reported EPS 0.92 $ 0.83 $ 1.27 $ Alternative Fuel Mixture Credit, net - (0.21) - Restructuring and Other Costs, net0.10 0.02 0.01 Loss on Extinguishment of Debt- 0.05 - Operating Losses of Previously Closed Facilities0.02 0.01 - Adjusted EPS1.04$ 0.70 $ 1.28$ Q2’11 vs. Q2’10 Cost Impacts: $ Millions Fiber and Wood: (12)Chemicals: (4)Aggregate Energy and Freight: (3) Q2’11 vs. Q1’11 Cost Impacts:Fiber and Wood: (7)Chemicals: (4)Aggregate Energy and Freight:(4)
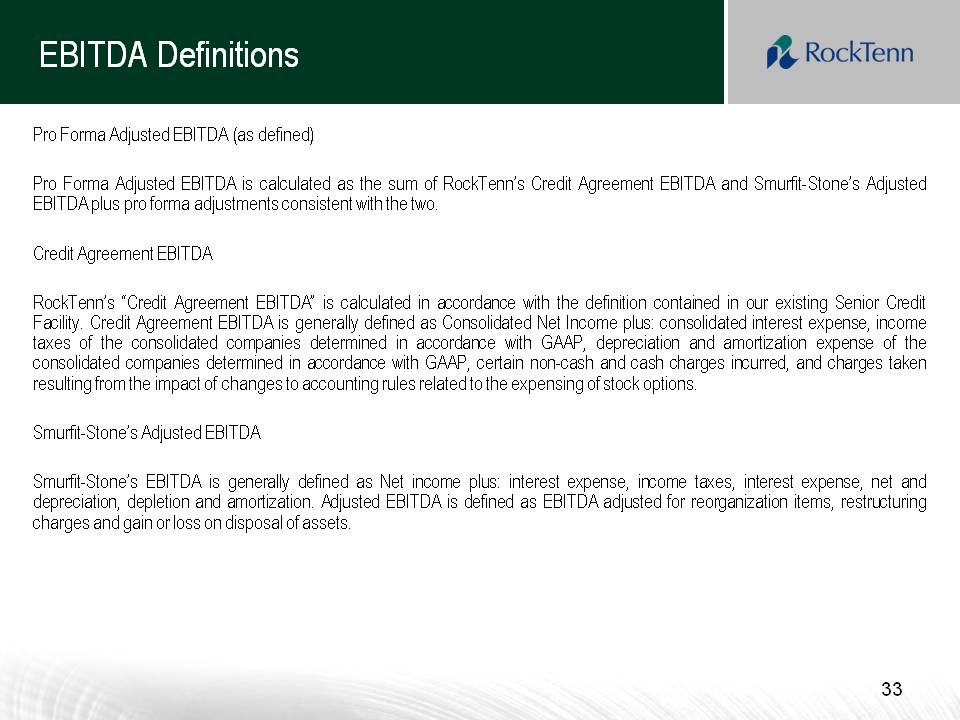
EBITDA Definitions ProForma Adjusted EBITDA(as defined) ProForma Adjusted EBITDA is calculated as the sum of RockTenn’s Credit Agreement EBITDA and Smurfit-Stone’s Adjusted EBITDA plus proforma adjustments consistent with the two. Credit Agreement EBITDA RockTenn‟s“CreditAgreementEBITDA”is calculated in accordance with the definition contained in our existing Senior Credit Facility.Credit Agreement EBITDA is generally defined as Consolidated Net Income plus: consolidated interest expense, income taxes of the consolidated companies determined in accordance with GAAP, depreciation and amortization expense of the consolidated companies determined in accordance with GAAP, certain non-cash and cash charges incurred, and charges taken resulting from the impact of changes to accounting rules related to the expensing g of stock options. Smurfit-Stone‟s Adjusted EBITDA Smurfit Stone‟s EBITDA is generally defined as Net income plus:interest expense,income taxes,interest expense, net and depreciation, depletion and amortization.Adjusted EBITDA is defined as EBITDA adjusted for reorganization items, restructuring charges and gain or loss on disposal of assets.
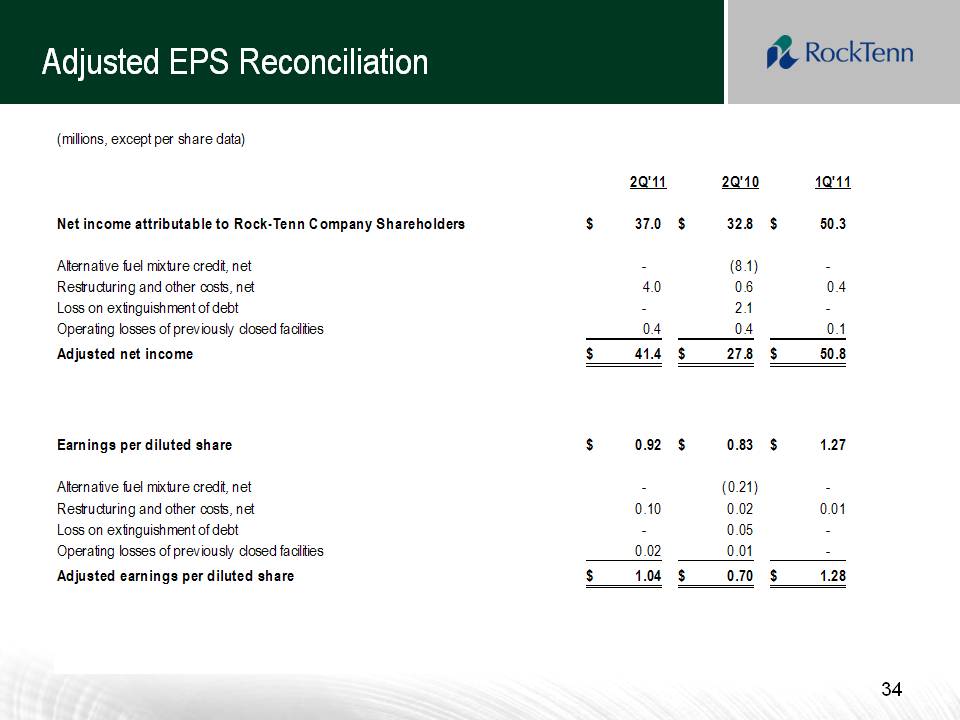
(millions, except per share data)2 Q'112 Q'101 Q'11Net income attributable to Rock-Tenn Company Shareholders37.0 $ 32.8 $ 50.3 $ Alternative fuel mixture credit, net - (8.1) - Restructuring and other costs, net 4.0 0.6 0.4 Loss on extinguishment of debt - 2.1 - Operating losses of previously closed facilities0.4 0.4 0.1 Adjusted net income 41.4$ 27.8 $ 50.8 $ Earnings per diluted share 0.92 $ 0.83 $ 1.27 $ Alternative fuel mixture credit, net- (0.21) - Restructuring and other costs, net0.10 0.02 0.01 Loss on extinguishment of debt- 0.05 - Operating losses of previously closed facilities0.02 0.01 - Adjusted earnings per diluted share 1.04 $ 0.70 $ 1.28 $37.0 $32.8 $50.3 $41.4 $27.8 $50.8 $1.04 $0.70 $1.28 $1.27 $0.83 $0.92
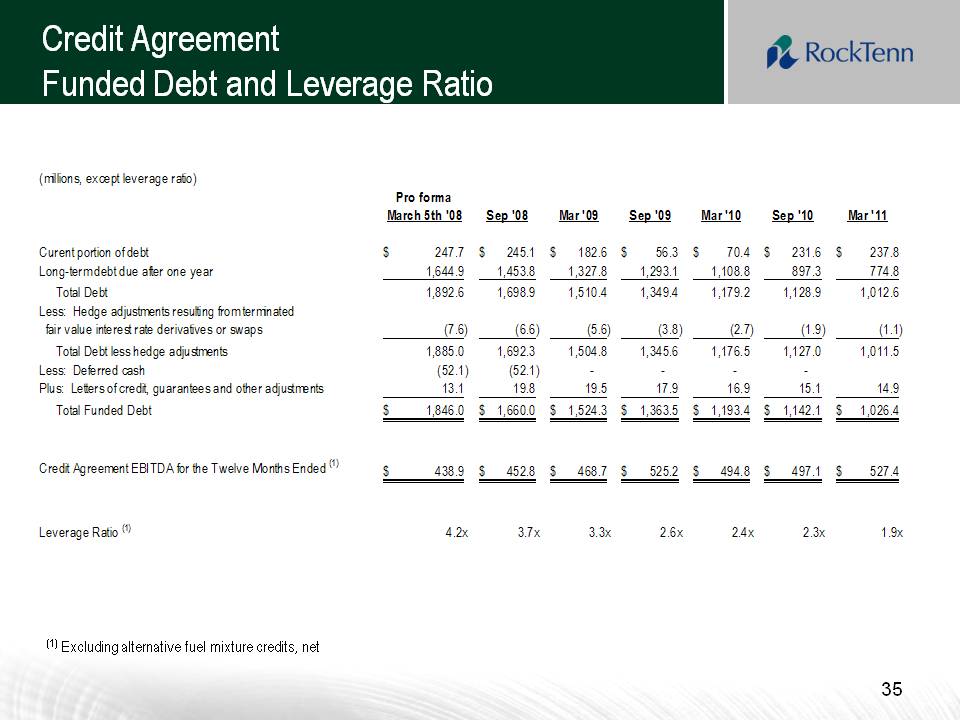
Credit Agreement Funded Debt and Leverage Ratio 35 (millions, except leverage ratio) Pro forma March 5th '08 Sep '08 Mar '09 Sep '09 Mar '10 Sep '10 Mar '11 Curent portion of debt 247.7 $ 245.1 $ 182.6 $ 56.3 $ 70.4 $ 231.6 $ 237.8 $ Long-term debt due after one year 1,644.9 1,453.8 1,327.8 1,293.1 1,108.8 897.3 774.8 Total Debt1,892.6 1,698.9 1,510.4 1,349.4 1,179.2 1,128.9 1,012.6 Less: Hedge adjustments resulting from terminated fair value interest rate derivatives or swaps(7.6) (6.6) (5.6) (3.8) (2.7) (1.9) (1.1) Total Debt less hedge adjustments1,885.0 1,692.3 1,504.8 1,345.6 1,176.5 1,127.0 1,011.5 Less: Deferred cash(52.1) (52.1) - - - - Plus: Letters of credit, guarantees and other adjustments13.1 19.8 19.5 17.9 16.9 15.1 14.9 Total Funded Debt1,846.0$ 1,660.0$ 1,524.3$ 1,363.5$ 1,193.4$ 1,142.1$ 1,026.4$ Credit Agreement EBITDA for the Twelve Months Ended (1)438.9$ 452.8$ 468.7$ 525.2$ 494.8$ 497.1$ 527.4$ Leverage Ratio (1)4.2x 3.7x 3.3x 2.6x 2.4x 2.3x 1.9x (1)Excluding alternative fuel mixture credits, net
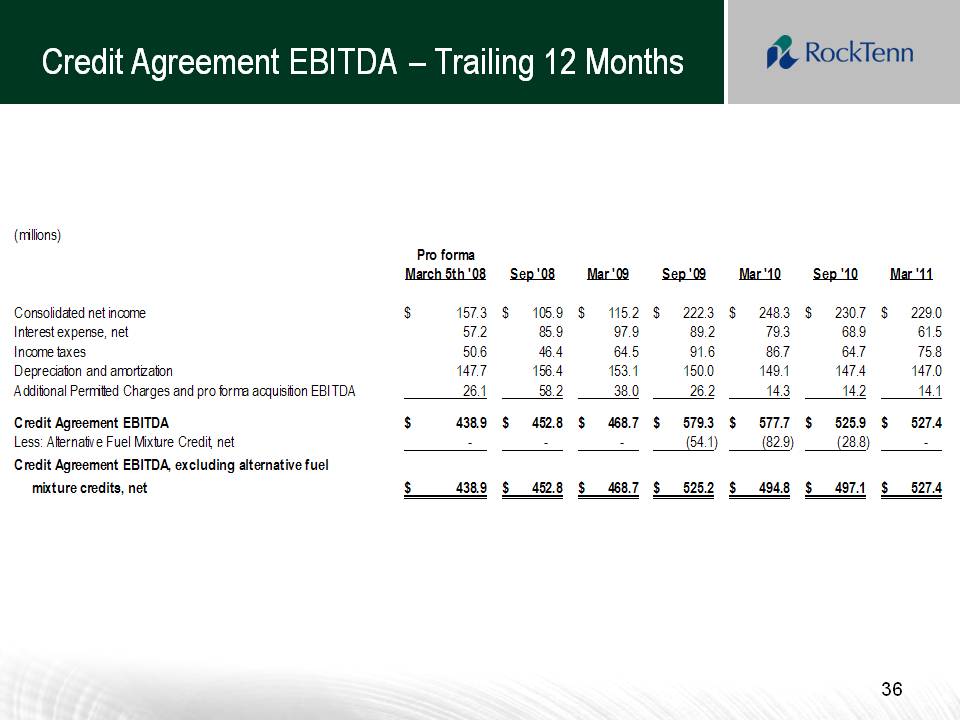
Credit Agreement EBITDA –Trailing 12 Months 36 (millions) Pro forma March 5th '08 Sep '08 Mar '09 Sep '09 Mar '10 Sep '10 Mar '11 Consolidated net income 157.3 $ 105.9 $ 115.2 $ 222.3 $ 248.3 $ 230.7 $ 229.0 $ Interest expense, net 57.2 85.9 97.9 89.2 79.3 68.9 61.5 Income taxes 50.6 46.4 64.5 91.6 86.7 64.7 75.8 Depreciation and amortization 147.7 156.4 153.1 150.0 149.1 147.4 147.0 Additional Permitted Charges and pro forma acquisition EBITDA 26.1 58.2 38.0 26.2 14.3 14.2 14.1 Credit Agreement EBITDA 438.9 $ 452.8 $ 468.7 $ 579.3 $ 577.7 $ 525.9 $ 527.4 $ Less: Alternative Fuel Mixture Credit, net (54.1) (82.9) (28.8) Credit Agreement EBITDA, excluding alternative fuel mixture credits, net 438.9 $ 452.8 $ 468.7 $ 525.2 $ 494.8 $ 497.1 $ 527.4 $
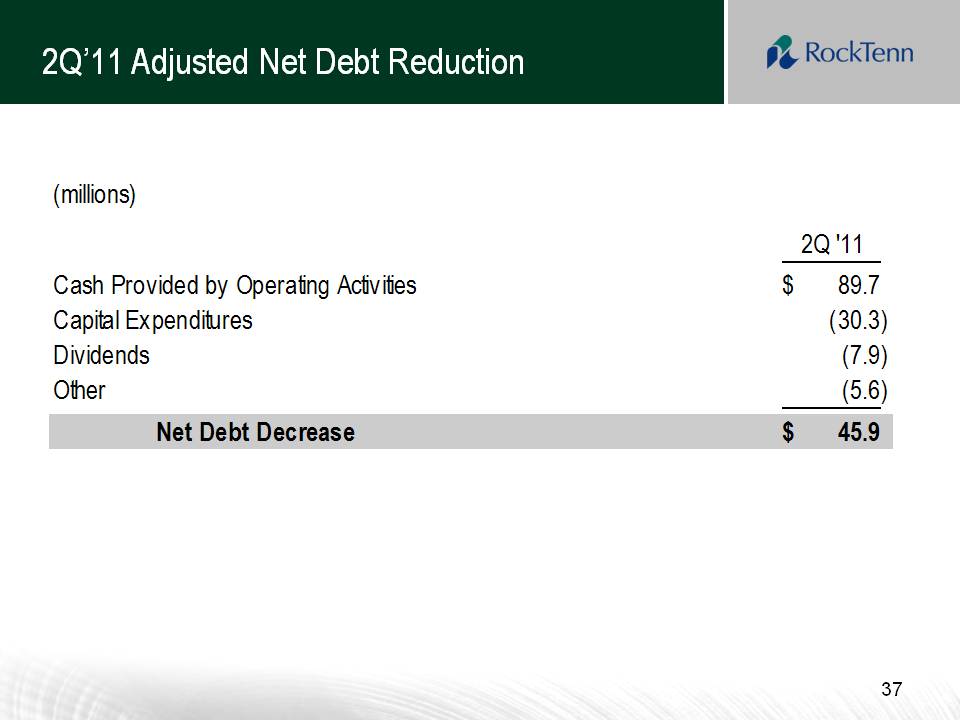
2Q‟11 Adjusted Net Debt Reduction 37 (millions) 2Q '11 Cash Provided by Operating Activities 89.7 $ Capital Expenditures (30.3) Dividends (7.9) Other (5.6) Net Debt Decrease 45.9 $
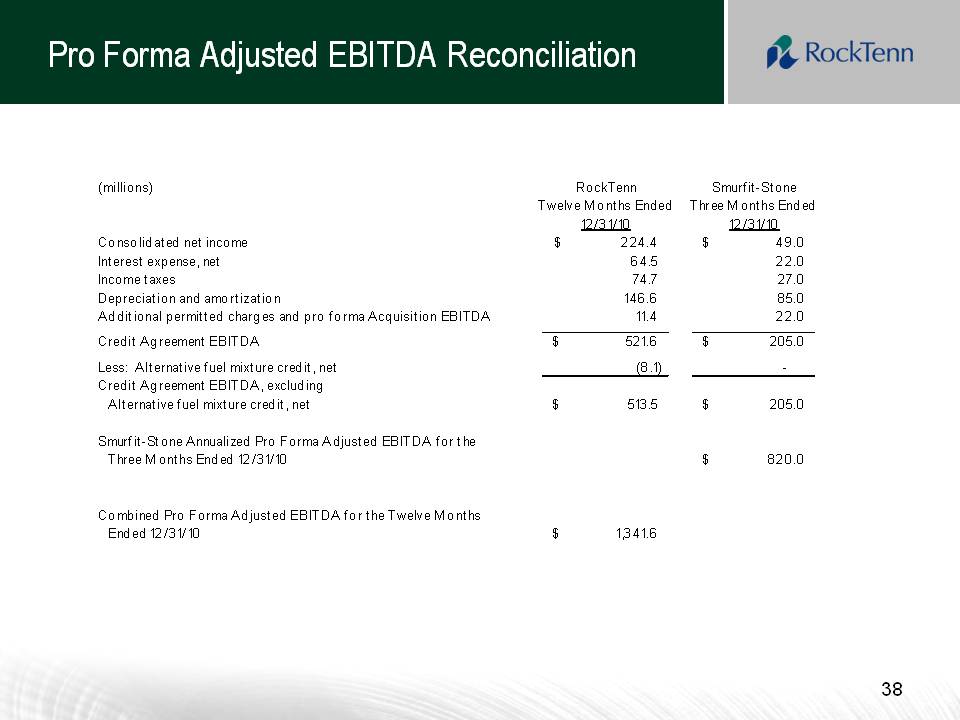
Pro Forma Adjusted EBITDA Reconciliation (millions) RockTenn Smurfit-Stone Twelve Months Ended Three Months Ended 12/31/10 12/31/10 Consolidated net income 224.4 $ 49.0 $ Interest expense, net 64.5 22.0 Income taxes 74.7 27.0 Depreciation and amortization 146.6 85.0 Additional permitted charges and pro forma Acquisition EBITDA 11.4 22.0 Credit Agreement EBITDA 521.6 $ 205.0 $ Less: Alternative fuel mixture credit, net (8.1) Credit Agreement EBITDA, excluding Alternative fuel mixture credit, net 513.5 $ 205.0 $ Smurfit-Stone Annualized Pro Forma Adjusted EBITDA for the Three Months Ended 12/31/10 820.0 $ Combined Pro Forma Adjusted EBITDA for the Twelve Months Ended 12/31/10 1,341.6 $ 39
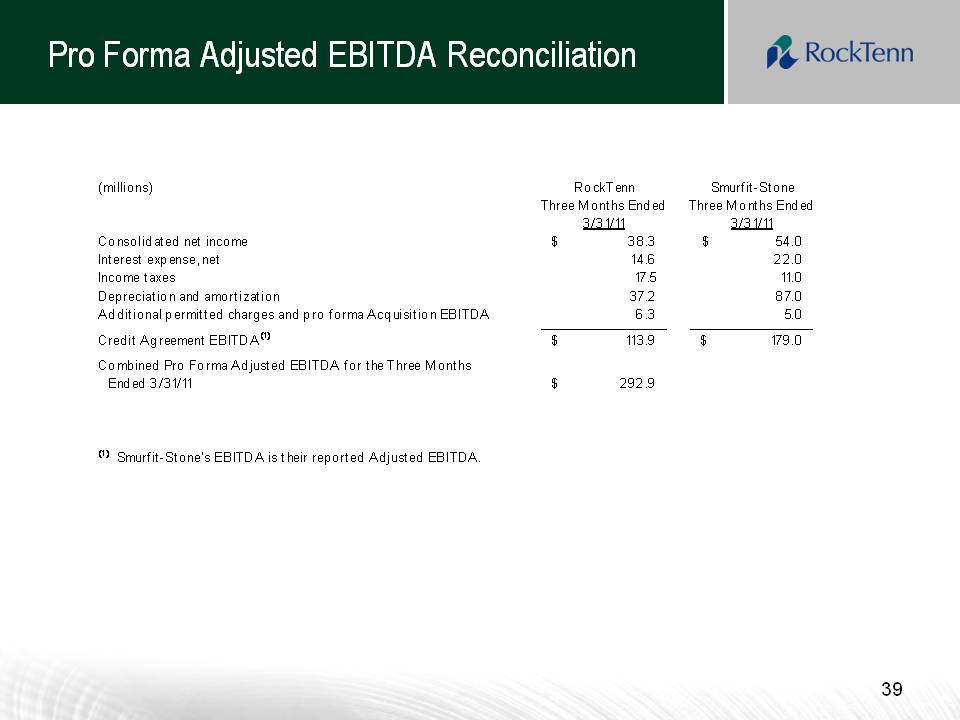
Pro Forma Adjusted EBITDA Reconciliation (millions) RockTenn Smurfit-Stone Three Months Ended Three Months Ended 3/31/11 3/31/11 Consolidated net income 38.3 $ 54.0 $ Interest expense, net 14.6 22.0 Income taxes 17.5 11.0 Depreciation and amortization 37.2 87.0 Additional permitted charges and pro forma Acquisition EBITDA 6.3 5.0 Credit Agreement EBITDA (1) 113.9 $ 179.0 $ Combined Pro Forma Adjusted EBITDA for the Three Months Ended 3/31/11 292.9 $ (1) Smurfit-Stone's EBITDA is their reported Adjusted EBITDA.
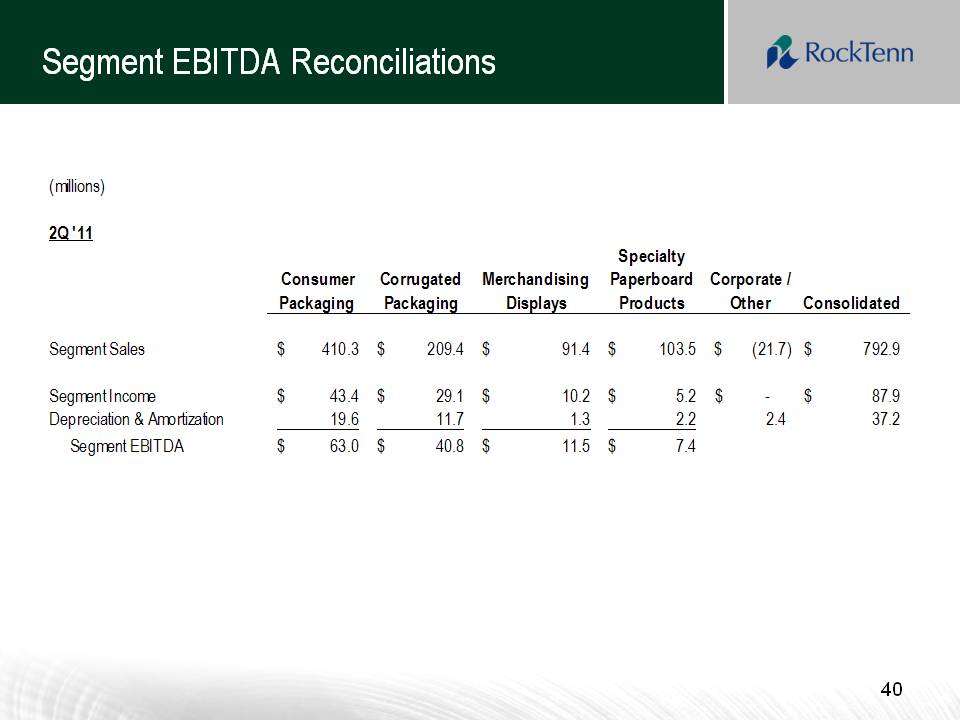
Segment EBITDA Reconciliations 40 (millions) 2Q '11 Consumer Packaging Corrugated Packaging Merchandising Displays Specialty Paperboard Products Corporate / Other Consolidated Segment Sales 410.3 $ 209.4 $ 91.4 $ 103.5 $ (21.7) $ 792.9 $ Segment Income 43.4 $ 29.1 $ 10.2 $ 5.2 $ - $ 87.9 $ Depreciation & Amortization 19.6 11.7 1.3 2.2 2.4 37.2 Segment EBITDA 63.0 $ 40.8 $ 11.5 $ 7.4 $
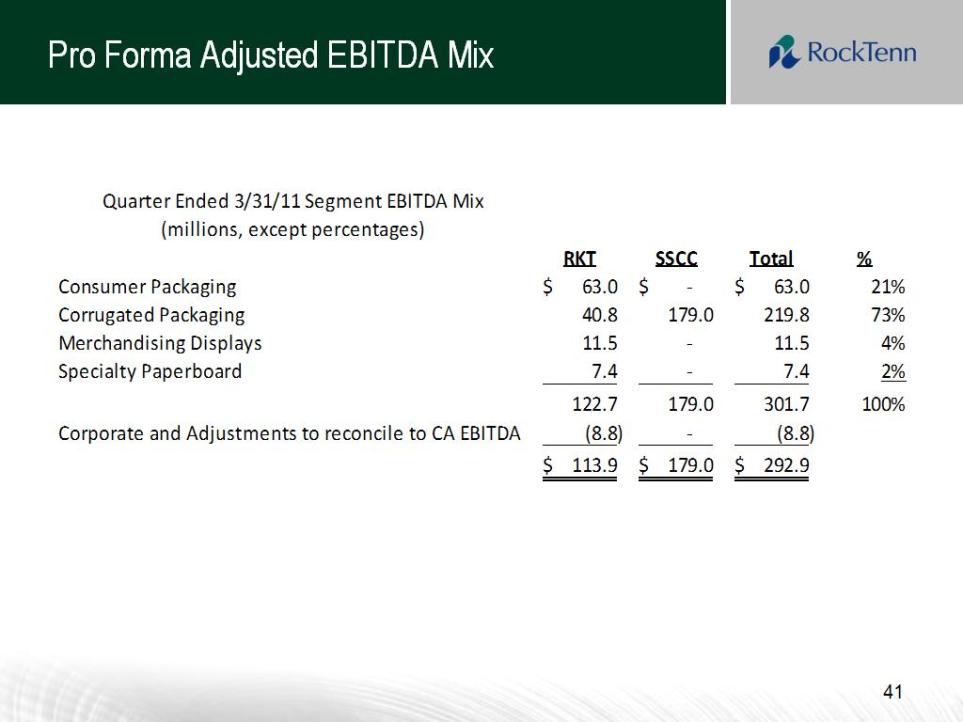
Pro Forma Adjusted EBITDA Mix Quarter Ended 3/31/11 Segment EBITDA Mix (millions, except percentages) RKT SSCC Total % Consumer Packaging 63.0 $ - $ 63.0 $ 21% Corrugated Packaging 40.8 179.0 219.8 73% Merchandising Displays 11.5 - 11.5 4% Specialty Paperboard 7.4 - 7.4 2% 122.7 179.0 301.7 100% Corporate and Adjustments to reconcile to CA EBITDA (8.8) - (8.8) 113.9 $ 179.0 $ 292.9 $
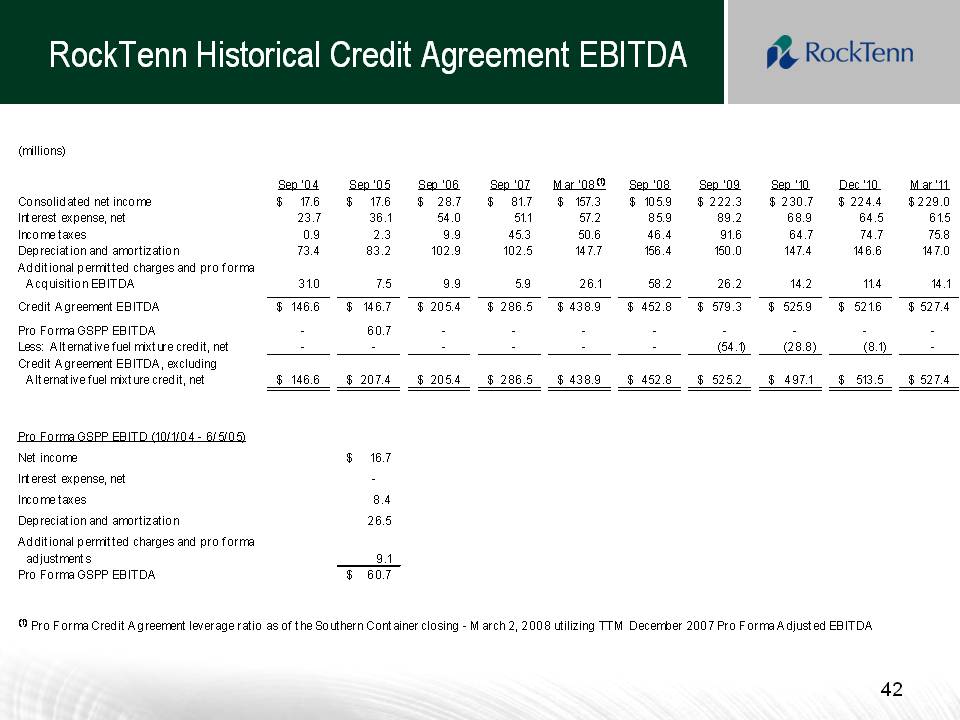
42 RockTenn Historical Credit Agreement EBITDA (millions) Sep '04 Sep '05 Sep '06 Sep '07 Mar '08 (1) Sep '08 Sep '09 Sep '10 Dec '10 Mar '11 Consolidated net income 17.6 $ 17.6 $ 28.7 $ 81.7 $ 157.3 $ 105.9 $ 222.3 $ 230.7 $ 224.4 $ 229.0 $ Interest expense, net 23.7 36.1 54.0 51.1 57.2 85.9 89.2 68.9 64.5 61.5 Income taxes 0.9 2.3 9.9 45.3 50.6 46.4 91.6 64.7 74.7 75.8 Depreciation and amortization 73.4 83.2 102.9 102.5 147.7 156.4 150.0 147.4 146.6 147.0 Additional permitted charges and pro forma Acquisition EBITDA 31.0 7.5 9.9 5.9 26.1 58.2 26.2 14.2 11.4 14.1 Credit Agreement EBITDA 146.6 $ 146.7 $ 205.4 $ 286.5 $ 438.9 $ 452.8 $ 579.3 $ 525.9 $ 521.6 $ 527.4 $ Pro Forma GSPP EBITDA - 60.7 - - - - - - - - Less: Alternative fuel mixture credit, net - - - - - - (54.1) (28.8) (8.1) - Credit Agreement EBITDA, excluding Alternative fuel mixture credit, net 146.6 $ 207.4 $ 205.4 $ 286.5 $ 438.9 $ 452.8 $ 525.2 $ 497.1 $ 513.5 $ 527.4 $ Pro Forma GSPP EBITD (10/1/04 - 6/5/05) Net income 16.7 $ Interest expense, net - Income taxes 8.4 Depreciation and amortization 26.5 Additional permitted charges and pro forma adjustments 9.1 Pro Forma GSPP EBITDA 60.7 $ (1) Pro Forma Credit Agreement leverage ratio as of the Southern Container closing - March 2, 2008 utilizing TTM December 2007 Pro Forma Adjusted EBITDA
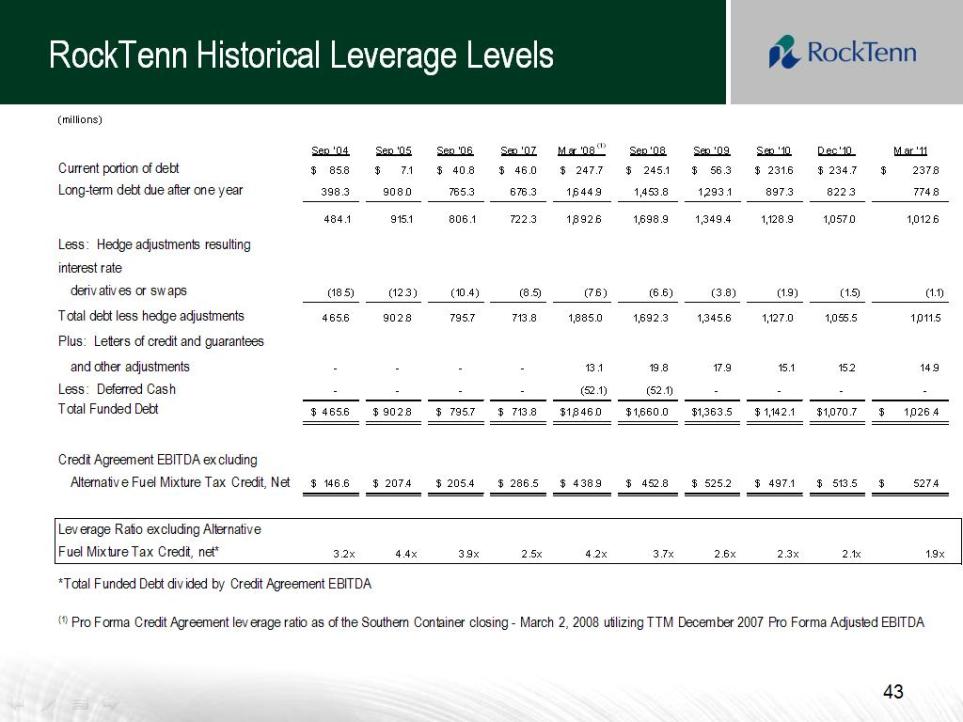
RockTenn Historical Leverage Levels (millions) Sep '04 Sep '05 Sep '06 Sep '07 Mar '08 (1) Sep '08 Sep '09 Sep '10 Dec '10 Mar '11 Current portion of debt 85.8 $ 7.1 $ 40.8 $ 46.0 $ 247.7 $ 245.1 $ 56.3 $ 231.6 $ 234.7 $ 237.8 $ Long-term debt due after one year 398.3 908.0 765.3 676.3 1,644.9 1,453.8 1,293.1 897.3 822.3 774.8 484.1 915.1 806.1 722.3 1,892.6 1,698.9 1,349.4 1,128.9 1,057.0 1,012.6 Less: Hedge adjustments resulting from existing/terminated fair value interest rate derivatives or swaps (18.5) (12.3) (10.4) (8.5) (7.6) (6.6) (3.8) (1.9) (1.5) (1.1) Total debt less hedge adjustments 465.6 902.8 795.7 713.8 1,885.0 1,692.3 1,345.6 1,127.0 1,055.5 1,011.5 Plus: Letters of credit and guarantees and other adjustments - - - - 13.1 19.8 17.9 15.1 15.2 14.9 Less: Deferred Cash - - - - (52.1) (52.1) - - - - Total Funded Debt 465.6 $ 902.8 $ 795.7 $ 713.8 $ 1,846.0 $ 1,660.0 $ 1,363.5 $ 1,142.1 $ 1,070.7 $ 1,026.4 $ Credit Agreement EBITDA excluding Alternative Fuel Mixture Tax Credit, Net 146.6 $ 207.4 $ 205.4 $ 286.5 $ 438.9 $ 452.8 $ 525.2 $ 497.1 $ 513.5 $ 527.4 $ Leverage Ratio excluding Alternative Fuel Mixture Tax Credit, net* 3.2x 4.4x 3.9x 2.5x 4.2x 3.7x 2.6x 2.3x 2.1x 1.9x*Total Funded Debt divided by Credit Agreement EBITDA (1) Pro Forma Credit Agreement leverage ratio as of the Southern Container closing - March 2, 2008 utilizing TTM December 2007 Pro Forma Adjusted EBITDA
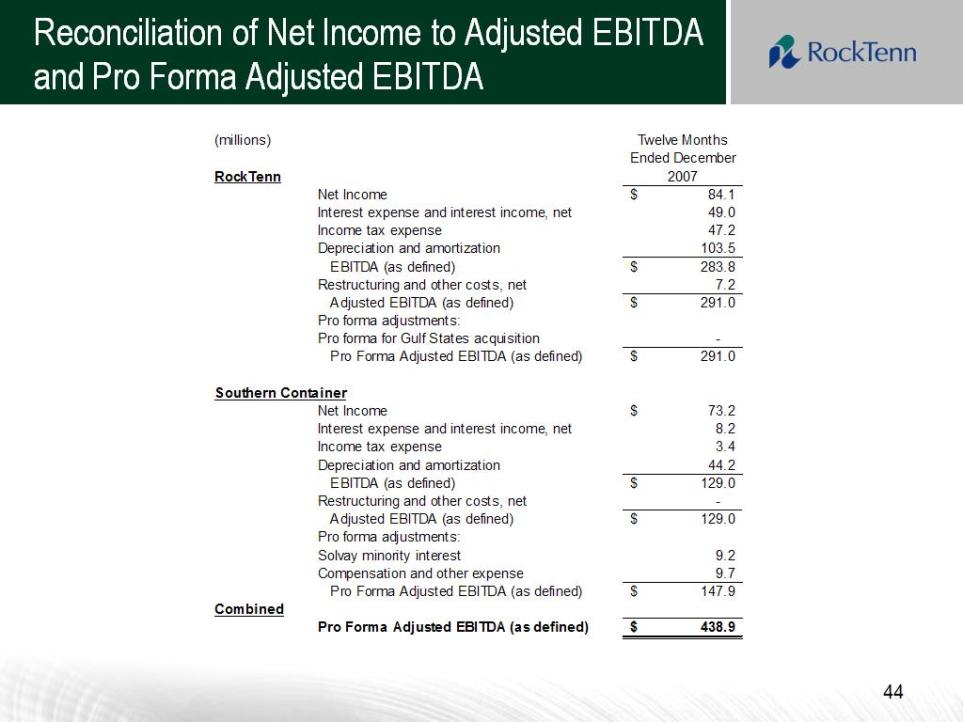
44 (millions) Twelve Months Ended December RockTenn 2007 Net Income 84.1$ Interest expense and interest income, net 49.0 Income tax expense 47.2 Depreciation and amortization 103.5 EBITDA (as defined) 283.8 $ Restructuring and other costs, net 7.2 Adjusted EBITDA (as defined) 291.0 $ Pro forma adjustments: Pro forma for Gulf States acquisition - Pro Forma Adjusted EBITDA (as defined) 291.0 $ Southern Container Net Income 73.2 $ Interest expense and interest income, net 8.2 Income tax expense 3.4 Depreciation and amortization 44.2 EBITDA (as defined) 129.0 $ Restructuring and other costs, net - Adjusted EBITDA (as defined) 129.0 $ Pro forma adjustments: Solvay minority interest 9.2 Compensation and other expense 9.7 Pro Forma Adjusted EBITDA (as defined) 147.9 $ Combined Pro Forma Adjusted EBITDA (as defined) 438.9 $ Reconciliation of Net Income to Adjusted EBITDA and Pro Forma Adjusted EBITDA
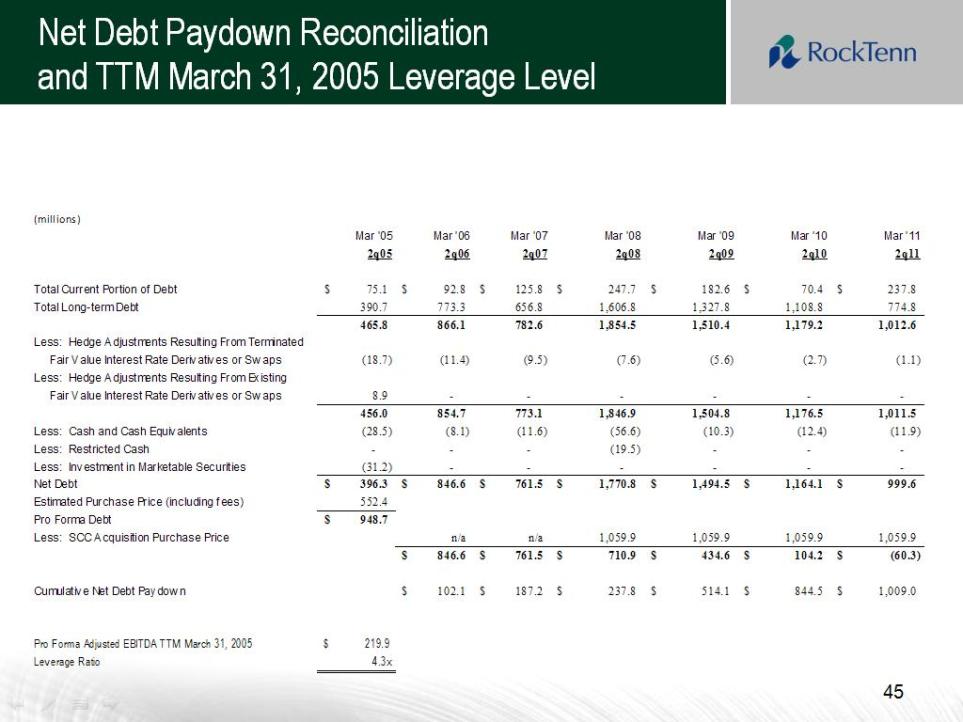
Net Debt Paydown Reconciliation and TTM March 31, 2005 Leverage Level (millions) Mar '05 Mar '06 Mar '07 Mar '08 Mar '09 Mar '10 Mar '11 2q05 2q06 2q07 2q08 2q09 2q10 2q11Total Current Portion of Debt 75.1 $ 92.8 $ 125.8 $ 247.7 $ 182.6 $ 70.4 $ 237.8 $ Total Long-term Debt 390.7 773.3 656.8 1,606.8 1,327.8 1,108.8 774.8 465.8 866.1 782.6 1,854.5 1,510.4 1,179.2 1,012.6 Less: Hedge Adjustments Resulting From Terminated Fair Value Interest Rate Derivatives or Swaps (18.7) (11.4) (9.5) (7.6) (5.6) (2.7) (1.1) Less: Hedge Adjustments Resulting From Existing Fair Value Interest Rate Derivatives or Swaps 8.9 - - - - - - 456.0 854.7 773.1 1,846.9 1,504.8 1,176.5 1,011.5 Less: Cash and Cash Equivalents (28.5) (8.1) (11.6) (56.6) (10.3) (12.4) (11.9) Less: Restricted Cash - - - (19.5) - - - Less: Investment in Marketable Securities (31.2) - - - - - - Net Debt 396.3 $ 846.6 $ 761.5 $ 1,770.8 $ 1,494.5 $ 1,164.1 $ 999.6 $ Estimated Purchase Price (including fees) 552.4 Pro Forma Debt 948.7 $ Less: SCC Acquisition Purchase Price n/a n/a 1,059.9 1,059.9 1,059.9 1,059.9 846.6 $ 761.5 $ 710.9 $ 434.6 $ 104.2 $ (60.3) $ Cumulative Net Debt Paydown 102.1 $ 187.2 $ 237.8 $ 514.1$ 844.5 $ 1,009.0 $ Pro Forma Adjusted EBITDA TTM March 31, 2005 219.9 $ Leverage Ratio 4.3x
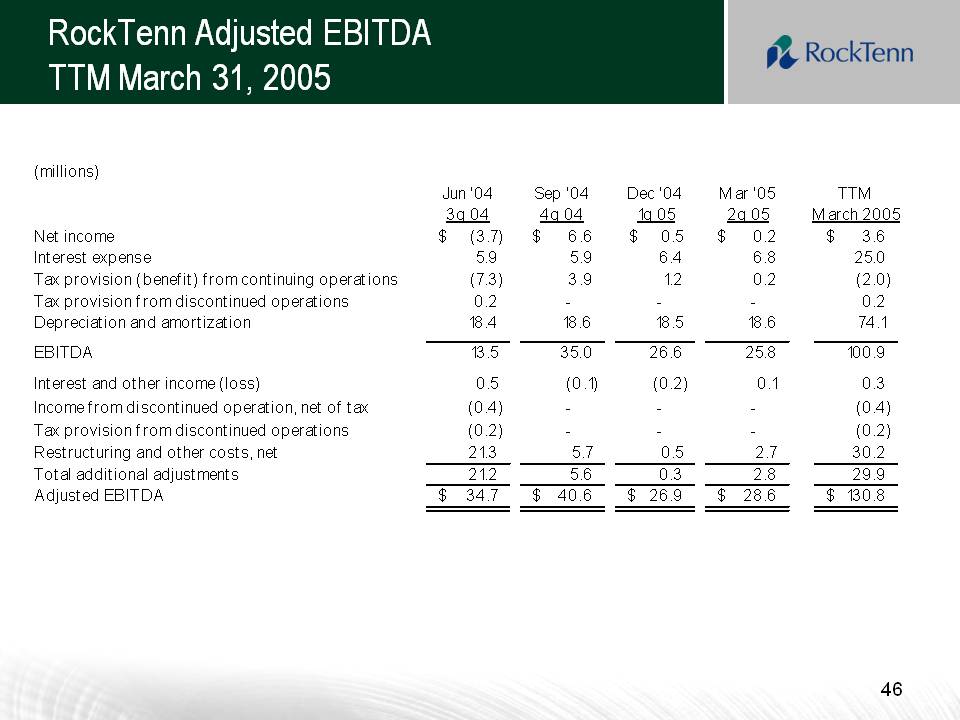
RockTenn Adjusted EBITDA TTM March 31, 2005(millions)Jun '04Sep '04Dec '04Mar '05 TTM3q 044q 041q 052q 05March 2005Net income(3.7) $ 6.6 $ 0.5 $ 0.2 $ 3.6 $ Interest expense 5.9 5.9 6.4 6.8 25.0 Tax provision (benefit) from continuing operations (7.3) 3.9 1.2 0.2 (2.0) Tax provision from discontinued operations0.2 0.2 Depreciation and amortization 18.4 18.6 18.5 18.6 74.1 EBITDA 13.5 35.0 26.6 25.8 100.9 Interest and other income (loss)0.5 (0.1) (0.2) 0.1 0.3 Income from discontinued operation, net of tax(0.4) (0.4) Tax provision from discontinued operations(0.2) (0.2) Restructuring and other costs, net 21.3 5.7 0.5 2.7 30.2 Total additional adjustments 21.2 5.6 0.3 2.8 29.9 Adjusted EBITDA 34.7 $ 40.6 $ 26.9 $ 28.6 $ 130.8 $
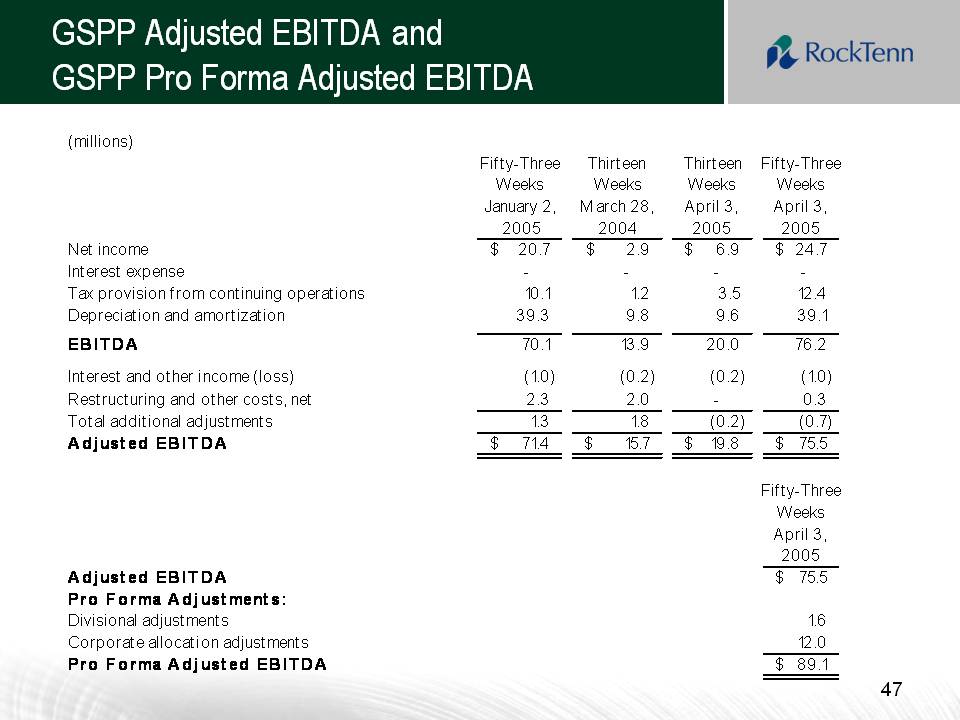
GSPP Adjusted EBITDA and GSPP Pro Forma Adjusted EBITDA (millions) Fifty-Three Thirteen Thirteen Fifty-Three Weeks January 2, 2005 Weeks March 28, 2004 Weeks April 3, 2005Weeks April 3, 2005 Net income 20.7 $ 2.9 $ 6.9 $ 24.7 $ Interest expense Tax provision from continuing operations10.1 1.2 3.5 12.4 Depreciation and amortization39.3 9.8 9.6 39.1 EBITDA70.1 13.9 20.0 76.2 Interest and other income (loss)(1.0) (0.2) (0.2) (1.0) Restructuring and other costs, net2.3 2.0 - 0.3 Total additional adjustments1.3 1.8 (0.2) (0.7) Adjusted EBITDA71.4 $ 15.7 $ 19.8 $ 75.5 $ Fifty-Three Weeks April 3, 2005 Adjusted EBITDA 75.5 $ Pro Forma Adjustments: Divisional adjustments 1.6 Corporate allocation adjustments1 2.0 Pro Forma Adjusted EBITDA 89.1
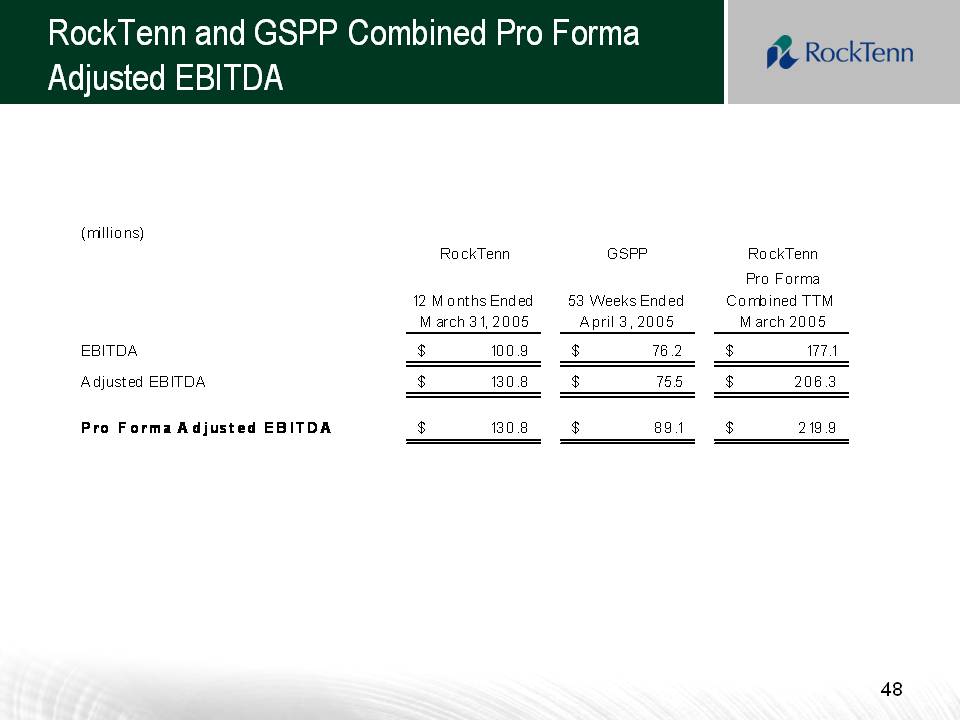
RockTenn and GSPP Combined Pro Forma Adjusted EBITDA (millions) RockTenn GSPP RockTenn 12 Months Ended March 31, 2005 53 Weeks Ended April 3, 2005 Pro Forma Combined TTM March 2005 EBITDA 100.9 $ 76.2 $ 177.1 $ Adjusted EBITDA 130.8 $ 75.5 $ 206.3 $ Pro Forma Adjusted EBITDA130.8 $ 89.1 $ 219.9 $