Exhibit 99.1


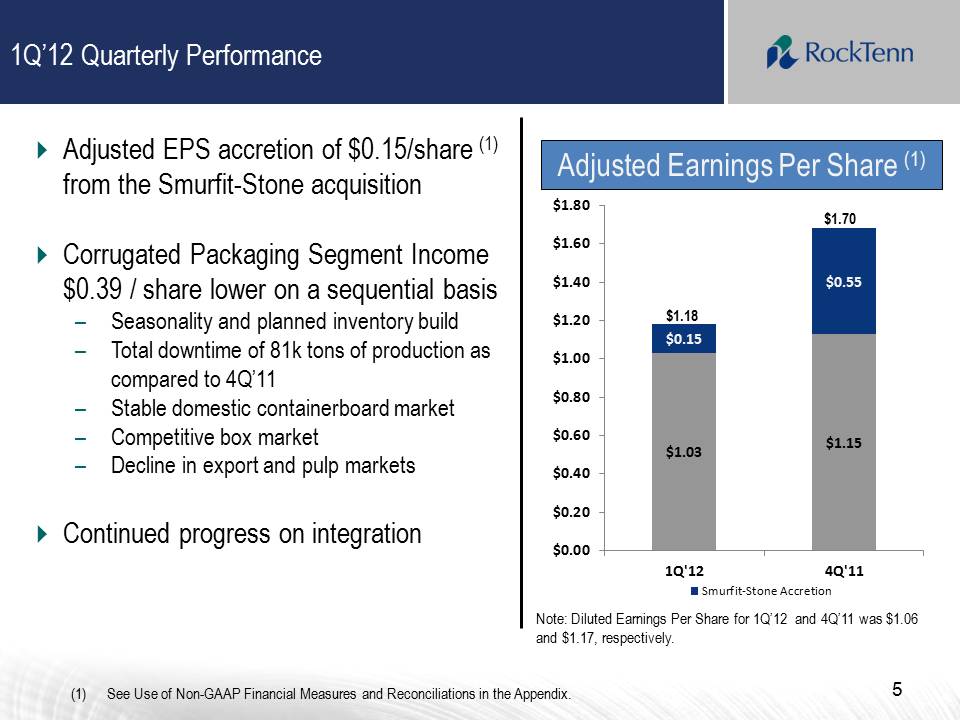
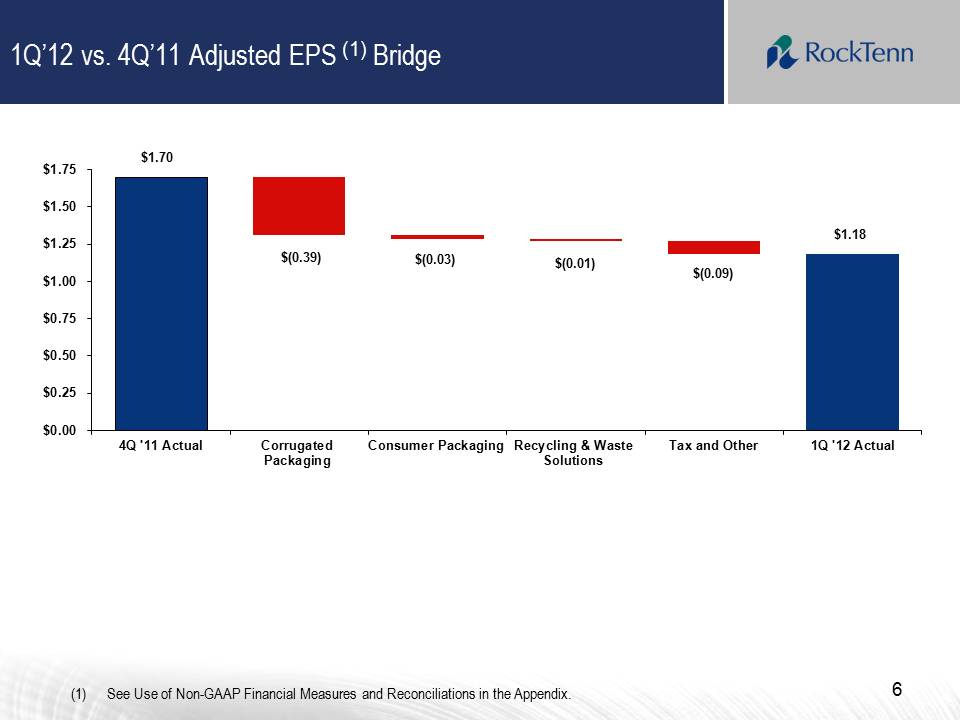


Fiscal 2012 1st Quarter Earnings Conference Call Presentation January 25, 2012 Jim Rubright – Chairman and Chief Executive Officer Steve Voorhees – Chief Financial Officer and Chief Administrative Officer Statements in this presentation that do not relate strictly to historical facts are forward-looking statements within the meaning of the Private Securities Litigation Reform Act of 1995. Forward-looking statements are based on our current expectations, beliefs, plans or forecasts and use words in this presentation such as will, estimate, trending, or refer to future time periods. You should not place undue reliance on any forward-looking statements as such statements involve risks, uncertainties, assumptions and other factors that could cause actual results to differ materially, including the following: our ability to integrate Smurfit-Stone or to achieve benefits from the Smurfit-Stone Acquisition, including, without limitation, synergies and performance improvements; expected levels of depreciation, corporate expenses, interest expense, income tax rates, federal NOL utilization, Black Liquor and AMT tax credit utilization, pension contributions, capital expenditures, commodity costs, maintenance outages, containerboard inventory builds; the level of demand for our products; economic downtime; our ability to successfully identify and make performance improvements; anticipated returns on our capital investments; possible increases in energy, raw materials, shipping and capital equipment costs; any reduction in the supply of raw materials; fluctuations in selling prices and volumes; intense competition; the potential loss of certain customers; adverse changes in general market and industry conditions and other risks, uncertainties and factors discussed in Item 1A "Risk Factors" and under the caption "Business — Forward-Looking Information" in our 2011 Annual Report on Form 10-K and by similar disclosures in any of our subsequent SEC filings. The information contained herein speaks as of the date hereof and we do not have or undertake any obligation to update such information as future events unfold. 2 Cautionary Statement Regarding Forward-Looking Information Use of Non-GAAP Financial Measures and Reconciliations We have included financial measures that are not prepared in accordance with accounting principles generally accepted in the United States ("GAAP"). The non-GAAP financial measures presented are not intended to be a substitute for GAAP financial measures, and any analysis of non-GAAP financial measures should be used only in conjunction with results presented in accordance with GAAP and the reconciliations of non-GAAP financial measures to GAAP financial measures included in the Appendix to this presentation. 3 Disclaimer We may from time to time be in possession of certain information regarding RockTenn that applicable law would not require us to disclose to the public in the ordinary course of business, but would require us to disclose if we were engaged in the purchase or sale of our securities. This presentation shall not be considered to be part of any solicitation of an offer to buy or sell RockTenn securities. This presentation also may not include all of the information regarding RockTenn that you may need to make an investment decision regarding RockTenn securities. Any such investment decision should be made on the basis of the overall mix of information regarding RockTenn that is publicly available as of the date of such decision. 4 $1.03 $1.15 $0.15 $0.55 $0.00 $0.20 $0.40 $0.60 $0.80 $1.00 $1.20 $1.40 $1.60 $1.80 1Q'12 4Q'11 Smurfit-Stone Accretion 1Q’12 Quarterly Performance 5 .Adjusted EPS accretion of $0.15/share (1) from the Smurfit-Stone acquisition .Corrugated Packaging Segment Income $0.39 / share lower on a sequential basis –Seasonality and planned inventory build –Total downtime of 81k tons of production as compared to 4Q’11 –Stable domestic containerboard market –Competitive box market –Decline in export and pulp markets .Continued progress on integration Adjusted Earnings Per Share (1) (1)See Use of Non-GAAP Financial Measures and Reconciliations in the Appendix. $1.18 $1.70 Note: Diluted Earnings Per Share for 1Q’12 and 4Q’11 was $1.06 and $1.17, respectively. 1Q’12 vs. 4Q’11 Adjusted EPS (1) Bridge 6 (1)See Use of Non-GAAP Financial Measures and Reconciliations in the Appendix. $1.70 $1.18 $(0.03) $(0.39) $(0.01) $(0.09) $0.00 $0.25 $0.50 $0.75 $1.00 $1.25 $1.50 $1.75 4Q '11 Actual Corrugated Packaging Consumer Packaging Recycling & Waste Solutions Tax and Other 1Q '12 Actual Financial Summary 7 *Free Cash Flow (a Non-GAAP financial measure) = Operating Cash Flow less Capital Expenditures (1)Reflects Net Income Attributable to Rock-Tenn Company Shareholders (2)See Use of Non-GAAP Financial Measures and Reconciliations in the Appendix. ($ Millions) Net Debt (1) Bridge: Q1’12 * Other includes debt issuance costs, exchange rate effects, etc. 8 (1)See Use of Non-GAAP Financial Measures and Reconciliations in the Appendix. Corrugated Packaging 1Q’12 vs. 4Q’11 Segment Performance 9 .Volume, both domestic and export, reduced segment income by $16 million .Weakened export and pulp markets reduced selling prices by $13 million .Seasonal sales mix reduced selling prices by $14 million .The impact of major commodities was favorable to segment income by $14 million (1)Excludes $0.4 million and $4.0 million of inventory step-up expense respectively 1Q’12 and 4Q’11. (2)See Use of Non-GAAP Financial Measures and Reconciliations in the Appendix. 1Q’12 vs. 4Q’11 Corrugated Packaging EBITDA (1) Bridge 10 $254 ($13) ($14) ($10) ($16) $15 ($1) ($3) ($4) $4 $212 $100 $150 $200 $250 $300 4Q'11 Export / Pulp Price Seasonal Mix Price / Mix Volume Fiber Energy Freight Outage Expense Synergies and Other 1Q'12 ($ Millions) (1)See Use of Non-GAAP Financial Measures and Reconciliations in the Appendix. Consumer Packaging 1Q’12 vs. 4Q’11 Segment Performance 11 .Sequentially, seasonally lower volumes were offset by lower recycled fiber prices and strong sales and performance in the Folding Carton division .Some expected seasonal weakness in CRB and SBS markets during 1Q’12 –13 days of economic downtime taken at one mill in the CRB system in 1Q’12 Note: Converting shipments exclude Display shipments (1)See Use of Non-GAAP Financial Measures and Reconciliations in the Appendix. Recycling and Waste Solutions 1Q’12 vs. 4Q’11 Segment Performance 12 .Increase in recycled fiber sales volume due to segment now managing all RockTenn recycled fiber mill purchases .Reduction in segment margin due to decline in recycled fiber prices (1)See Use of Non-GAAP Financial Measures and Reconciliations in the Appendix. 13 2Q’12 Outlook .Demand flat –Stable container and box demand –SBS and CRB backlogs strengthen .Economic downtime –Containerboard downtime due primarily to export demand and pricing –Continued economic downtime at Stroudsburg specialty CRB Mill to match customer demand .Scheduled major maintenance downtime –2Q’12: 47k tons; 3Q’12: 144k tons; 4Q’12: 0 tons .Continued inventory build in Q2’12: 43k tons followed by drawdown in 3Q’12: 133k tons .Lower containerboard export sales at lower prices .Lower pulp and SBS selling prices .Lower fiber and energy costs –Lower recycled fiber costs trending higher in February and March –Seasonally higher wood costs –Lower energy and other commodity input costs .Benefit of realized synergies and performance improvements –Stevenson natural gas conversion and incremental procurement savings –Expect next significant earnings improvement in 4Q’12 and 1Q’13 with completion of Hodge and Hopewell projects and administrative synergies from SAP to JD Edwards conversion and box plant IT system alignment Synergies and Performance Improvements 14 Synergies and Performance Improvements 15 .The combination of synergy and performance improvement savings expected to be $550 million Key Inputs 16 Note: Excluding Wood Fiber 1Q’12 average prices based off of the following indices: (1)Recycled Fiber: Chicago OCC (2)Natural Gas: NYMEX Henry Hub Futures (3)Fuel Oil: Platts New York #6 2.2% Cargo (4)Diesel: EIA U.S. Diesel Fuel Retail Average Price, Industrial Sector . . . . . Energy Projects .Four major natural gas conversion projects: –Stevenson, AL Completed: January 2012 –West Point, VA Expected Start-up: Fall 2012 –Hopewell, VA Expected Start-up: Fall 2012 –Fernandina Beach, FL Expected Start-up: Fall 2012 .Approximate Cost: $25 million; Estimated Annual Benefit: $45-$50 million .RockTenn has agreed to terminate Solvay Mill’s dependence upon 3rd party coal fired steam supply –Third party will pay RockTenn cash that will fund a new natural gas system –With change to natural gas supply, this agreement should reduce the mill’s cost and eliminate long term environmental risks 17 Key Financial Statistics – FY12 Outlook ($ Millions) 18 .Leverage Ratio of 2.73x(1) .More than $1.3 billion of liquidity available to RockTenn at 12/31/11 including Term Loan A-2 of $227 million –In December 2011 RockTenn amended its Credit Agreement, including a $227 million capital raise of Term Loan A-2 –This new loan can be drawn anytime between now and March 31, 2012. The 2016 notes are callable March 15, 2012 $- $200 $400 $600 $800 $1,000 $1,200 $1,400 $1,600 FY12 FY13 FY14 FY15 FY16 Thereafter Credit Facilities Secured Notes 9.25% Notes A/R Securitization Other 19 RockTenn Capitalization Profile – 12/31/11 Debt Maturity Profile (millions) Above excludes unamortized bond discounts of ($0.8 million) and terminated swaps of $0.3 million (1)See Use of Non-GAAP Financial Measures and Reconciliations in the Appendix. Appendix 21 22 Use of Non-GAAP Financial Measures and Reconciliations Below, we define the non-GAAP financial measures, provide a reconciliation of each non-GAAP financial measure to the most directly comparable financial measure calculated in accordance with GAAP, and discuss the reasons that we believe this information is useful to management and may be useful to investors. These measures may differ from similarly captioned measures of other companies in our industry. Non-GAAP Measures Our definitions of Credit Agreement EBITDA and Segment EBITDA may differ from other similarly titled measures at other companies. Credit Agreement EBITDA (as defined) and Adjusted EBITDA (as defined) are not defined in accordance with GAAP and should not be viewed as alternatives to GAAP measures of operating results or liquidity. RockTenn management believes that net income is the most directly comparable GAAP measure to Credit Agreement EBITDA (as defined) and Segment Income is the most directly comparable GAAP measure to Segment EBITDA. 23 Non-GAAP Measures: Credit Agreement EBITDA and Total Funded Debt (as defined) “Credit Agreement EBITDA” is calculated in accordance with the definition of “EBITDA” contained in the Company’s Credit Agreement. Credit Agreement EBITDA is generally defined as Consolidated Net Income plus: consolidated interest expense; consolidated tax expenses; depreciation and amortization expenses; charges and expenses for financing fees and expenses and write-offs of deferred financing fees and expenses, remaining portions of OID on prepayment of indebtedness, premiums due in respect of prepayment of indebtedness, and commitment fees in respect of financing commitments; various charges and expenses related to, or incurred in connection with, the Smurfit-Stone acquisition; costs and expenses relating to the integration of Smurfit-Stone and the achievement of synergies relating to the Smurfit-Stone acquisition; certain run-rate synergies expected to be achieved due to the Smurfit-Stone acquisition; all non-cash charges; all cash charges and expenses for plant and other facility closures and other cash restructuring charges; labor disruption charges; officer payments associated with any permitted acquisitions; “black liquor” expenses; cash charges and expenses incurred in respect of the Chapter 11 bankruptcy proceeding and plan of reorganization of Smurfit-Stone; and all non-recurring cash expenses taken in respect of any multi-employer and defined benefit pension plan obligations that are related to plant and other facilities closures. For additional information on the calculation see our Credit Agreement, dated as of May 27, 2011, filed as Exhibit 10.1 to our Form 8-K, dated May 27, 2011. “Total Funded Debt” is calculated in accordance with the definition of “Total Funded Debt” contained in the Company’s Credit Agreement. Total Funded Debt is generally defined as aggregate debt obligations reflected in our balance sheet, less the hedge adjustments resulting from terminated and existing fair value interest rate derivatives or swaps, plus additional outstanding letters of credit not already reflected in debt, plus debt guarantees. 24 Non-GAAP Measures: Credit Agreement EBITDA and Total Funded Debt Our management uses Credit Agreement EBITDA and Total Funded Debt to evaluate compliance with RockTenn’s debt covenants and borrowing capacity available under its Credit Agreement. Management also uses Credit Agreement EBITDA as a measure of our Company’s core operating performance. Management believes that investors also use these measures to evaluate the Company’s compliance with its debt covenants and available borrowing capacity. Management also believes that investors use Credit Agreement EBITDA as a measure of our Company’s core operating performance. Borrowing capacity is dependent upon, in addition to other measures, the “Total Funded Debt/EBITDA ratio” or the “Leverage Ratio,” which is defined as Total Funded Debt divided by Credit Agreement EBITDA. 25 Non-GAAP Measures: Net Debt We have defined the non-GAAP measure “Net Debt” to include the aggregate debt obligations reflected in our balance sheet, less the hedge adjustments resulting from terminated and existing fair value interest rate derivatives or swaps, the balance of our cash and cash equivalents, restricted cash (which includes the balance sheet line items restricted cash and restricted cash and marketable debt securities) and certain other investments that we consider to be readily available to satisfy such debt obligations. Our management uses Net Debt, along with other factors, to evaluate our financial condition. We believe that Net Debt is an appropriate supplemental measure of financial condition and may be useful to investors because it provides a more complete understanding of our financial condition before the impact of our decisions regarding the appropriate use of cash and liquid investments. 26 Non-GAAP Measures: Adjusted Net Income and Adjusted Earnings Per Diluted Share We also use the non-GAAP measures “adjusted net income” and “adjusted earnings per diluted share”. Management believes these non-GAAP financial measures provide our board of directors, investors, potential investors, securities analysts and others with useful information to evaluate the performance of the Company because it excludes restructuring and other costs, net, the alternative fuel mixture credit and cellulosic biofuel producer credit and other specific items that management believes are not indicative of the ongoing operating results of the business. The Company and the board of directors use this information to evaluate the Company’s performance relative to other periods. Segment EBITDA Margins 27 (1) Excludes $0.4 million of inventory step-up expense in our Corrugated Packaging segment. 1Q’12 $ Millions Segment EBITDA Margins 28 (1) Excludes inventory step-up expense of $4.0 million for Corrugated Segment. 4Q’11 $ Millions Adjusted EPS Reconciliation 29 (1) Restructuring and other costs and operating losses and transition costs due to plant closures. Net Debt Reconciliation 30 Adjusted EPS – 1Q’12 31 Credit Agreement EBITDA and Leverage Ratio 32 (1) As specified in our Credit Agreement dated May 27, 2011. Credit Agreement EBITDA and Leverage Ratio 33 (1) As specified in our Credit Agreement dated May 27, 2011. Credit Agreement EBITDA Breakout of Additional Permitted Charges 34 (1) As specified in our Credit Agreement dated May 27, 2011. Credit Agreement EBITDA Breakout of Additional Permitted Charges 35 (1) As specified in our Credit Agreement dated May 27, 2011. Credit Agreement EBITDA 36 Adjusted EPS – 4Q’11 37 .RockTenn is committed to having a first quartile mill system through operational excellence and high return investments. .The combined business is clustered in the second quartile of the cost curve –72% of RockTenn’s capacity is lower than the industry cash cost average Well-capitalized, Low-cost Containerboard Mills $331/ton Industry Average Source: September Qtr 2011 RISI and company data. Note: La Tuque bleached liner/SBS mill not shown on cost curve chart Containerboard Cost Curve – September Qtr 2011 RockTenn’s Containerboard Mill System cost per ton = $329 RockTenn Cumulative Capacity 19% 15% 25% 100% 10% 72% 61% 48% 39% 92% 89% 86% 74% 38