
Selective Insurance Group, Inc.
Keefe, Bruyette & Woods
Insurance Conference
September 10, 2009

Financial Strength
Dale Thatcher
Executive Vice President
Chief Financial Officer & Treasurer

Forward Looking Statement
Certain statements in this report, including information incorporated by reference, are “forward-looking statements” as that term is
defined in the Private Securities Litigation Reform Act of 1995 (“PSLRA”). The PSLRA provides a safe harbor under the Securities Act of
1933 and the Securities Exchange Act of 1934 for forward-looking statements. These statements relate to our intentions, beliefs,
projections, estimations or forecasts of future events or our future financial performance and involve known and unknown risks,
uncertainties and other factors that may cause our or our industry's actual results, levels of activity, or performance to be materially
different from those expressed or implied by the forward-looking statements. In some cases, you can identify forward-looking statements
by use of words such as "may," "will," "could," "would," "should," "expect," "plan," "anticipate," "target," "project," "intend," "believe,"
"estimate," "predict," "potential," "pro forma," "seek," "likely" or "continue" or other comparable terminology. These statements are only
predictions, and we can give no assurance that such expectations will prove to be correct. We undertake no obligation, other than as
may be required under the federal securities laws, to publicly update or revise any forward-looking statements, whether as a result of new
information, future events or otherwise.
Factors, that could cause our actual results to differ materially from those projected, forecasted or estimated by us in forward-looking
statements are discussed in further detail in Selective’s public filings with the United States Securities and Exchange Commission. These
risk factors may not be exhaustive. We operate in a continually changing business environment, and new risk factors emerge from time-
to-time. We can neither predict such new risk factors nor can we assess the impact, if any, of such new risk factors on our businesses or
the extent to which any factor or combination of factors may cause actual results to differ materially from those expressed or implied in
any forward-looking statements in this report. In light of these risks, uncertainties and assumptions, the forward-looking events discussed
in this report might not occur.
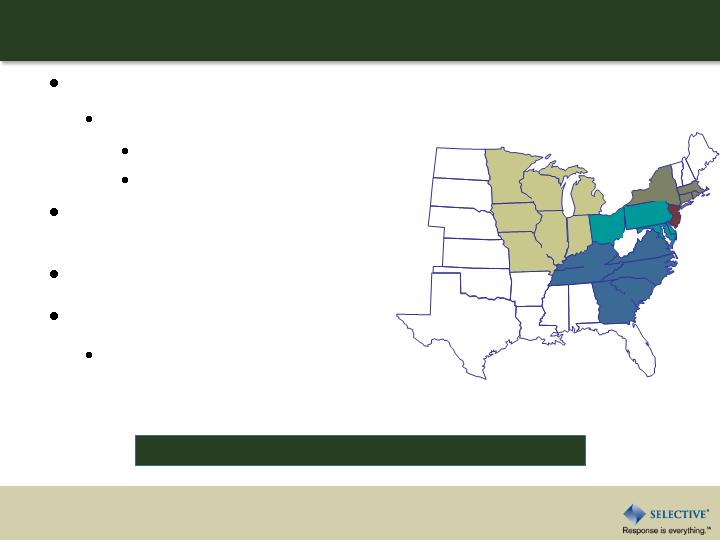
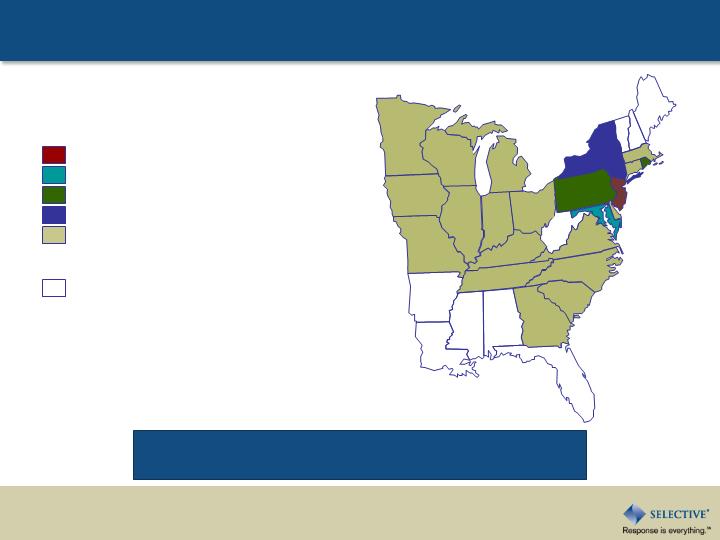
22-state super-regional
$1.5B NPW
86% commercial lines
14% personal lines
Distribution partner with 960
independent agents
Best in class field model
History of financial strength
A.M. Best rated “A” or better for 78
years, and “A+” for past 48 years
Selective Profile
Only 9% of P&C carriers rated A+ or better
CT
MN
IA
MO
WI
I
L
I
N
KY
OH
MI
MI
GA
SC
NC
VA
PA
NY
MD
NJ
RI
DE
CT
MA
TN
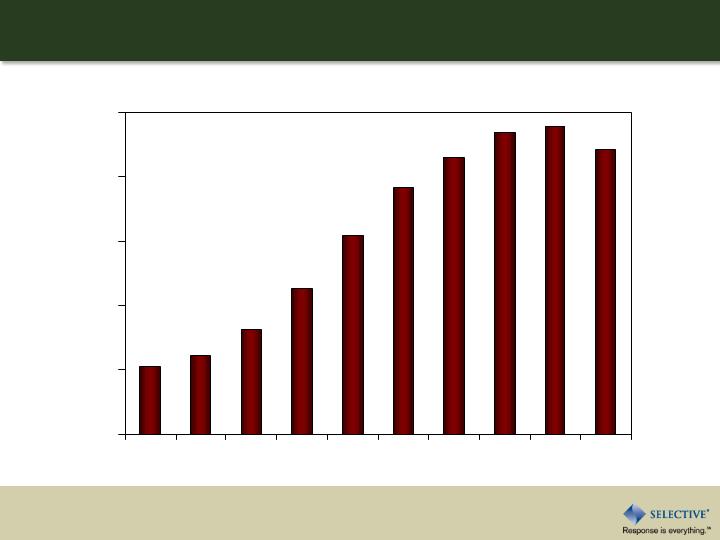
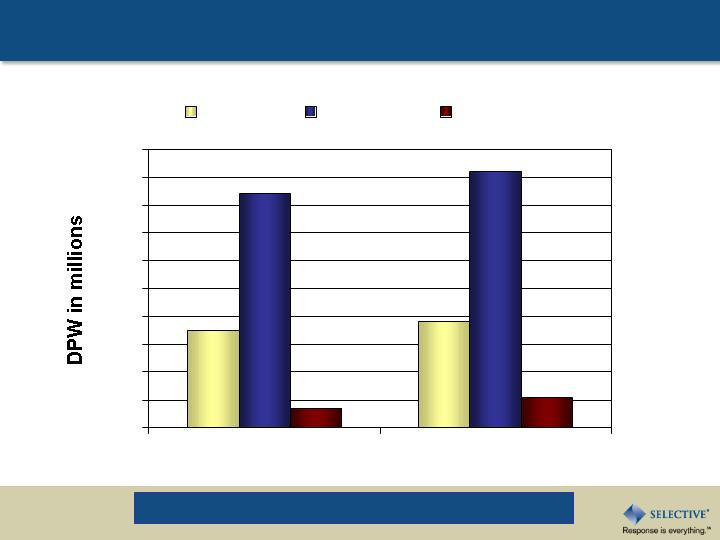
Net Premium Written
$ in millions
600
800
1,000
1,200
1,400
1,600
1999
2000
2001
2002
2003
2004
2005
2006
2007
2008
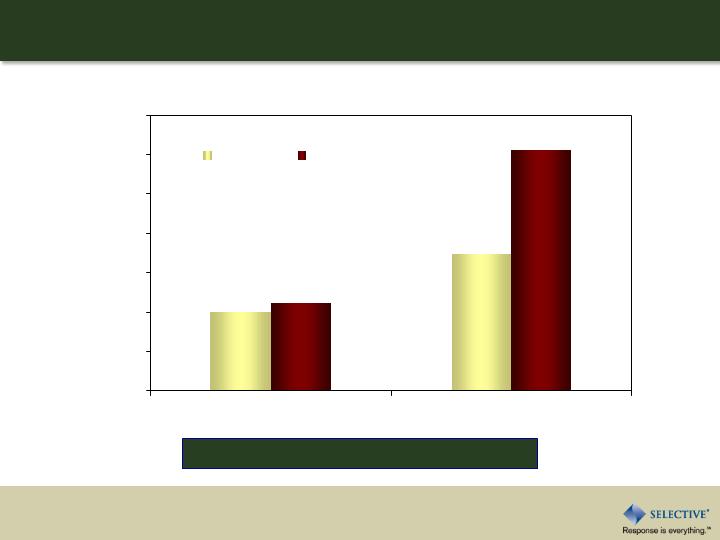
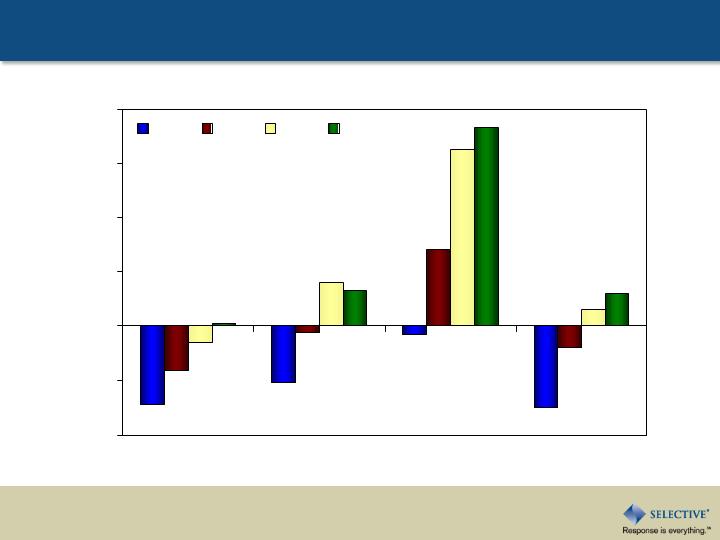
Current Economic Impact on
Premium Growth
2009
2008
-20
-18
-16
-14
-12
-10
-8
-6
-4
-2
0
1Q
2Q
3Q
4Q
1Q
2Q
Audit and Endorsement Returned Premium

A Foundation of Financial Strength
Focused expense management
Conservative investment portfolio
Disciplined reserving practices
Strong reinsurance program
Proactively managed capital

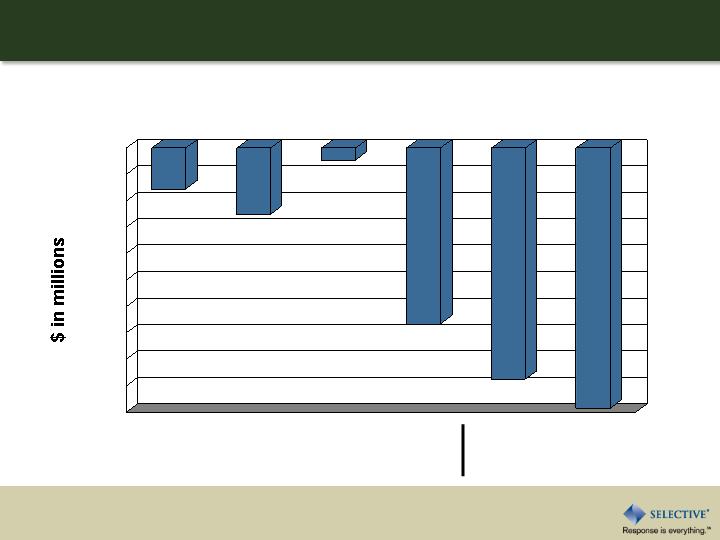
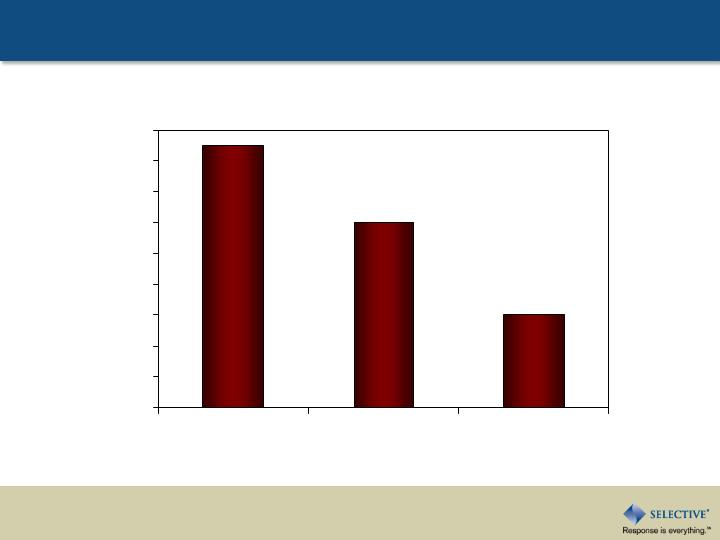
Focused Expense Management
$1 million
Vendor consolidation project
$1 million
Tax credits and incentives
$4 million, one time
Benefits changes
2009
$2 million
Indiana re-domestication
$7 million
Restructuring
$7 million
Targeted commission reductions
2008
Savings
Initiative
Next expense focus area is claims

Average “AA+” bond quality
Approximately 3.5 year average
duration, including short-term &
cash
Equities outperformed S&P 500 for
nine consecutive years
Alternative investments have
outperformed S&P 500 since 1997
Conservative Investment Portfolio
$3.6B Invested Assets
as of June 30, 2009
Equities
2%
Bonds
89%
Short-Term
5%
Alternative
Investments
4%

Alternative Investment Strategies
($ in millions)
Alternative strategies generated $7 million in additional equity over S&P 500 since 1997
Market Values of $143M at June 30, 2009
0
5
10
15
20
25
30
35
Venture Capital
Mezzanine Financing
Real Estate
Private Equity
Secondary Private Equity
Distressed Debt
Energy/Power Generation
Carried
$2,415M
53.9%
57.5%
56.9%
54.8%
52.6%
($10M)
$18M
$16M
$7M
($5M)
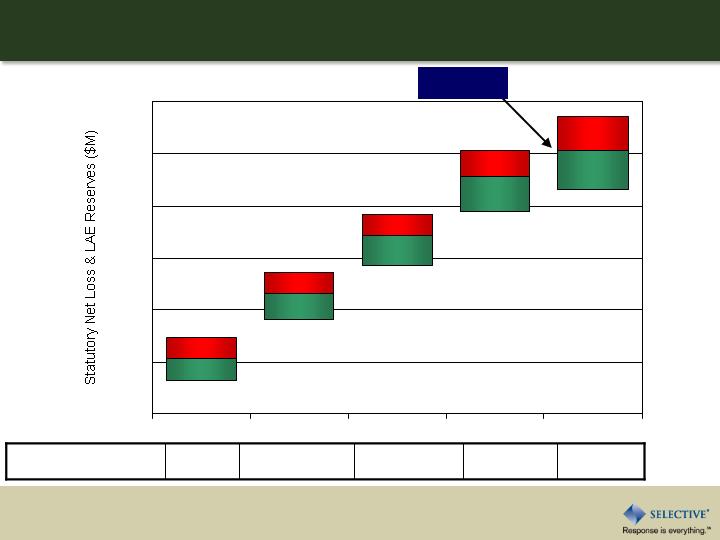
Calendar Year Reserve
Development (p/t)
Disciplined Reserving Practices
Actuarial Reserve Ranges
$102
$112
$135
$150
$84
$85
$99
$128
$87
$79
1,400
1,600
1,800
2,000
2,200
2,400
2,600
2004
2005
2006
2007
2008
Strong Natural Catastrophe Program
RMS Model
CAT cover: $310M in excess of $40M
% of Equity at Risk
Percentages are net of tax, reinsurance and reinstatement premium.
RMS data as of 7/1/07; Equity data as of 6/30/09.
4%
7%
4%
12%
0%
2%
4%
6%
8%
10%
12%
14%
1% Probability
0.4% Probability
8.0 Historic
8.0 Stochastic

Capital Position
Premium to surplus: 1.7x
Debt to total capitalization:
Total: 21.7%
Adjusted: 15.4%
Weighted average life of debt: 35 years
Book value per share $17.85
As of June 30, 2009

Profitability Improvement
Greg Murphy
Chairman, President & CEO

Strategies for Long-Term Profitable Growth
Best in class agency relationships and field model
Commercial lines pricing power
Quality of new business through predictive modeling
Diversification of commercial lines book
Personal lines improvement plan
Best in class claims practices
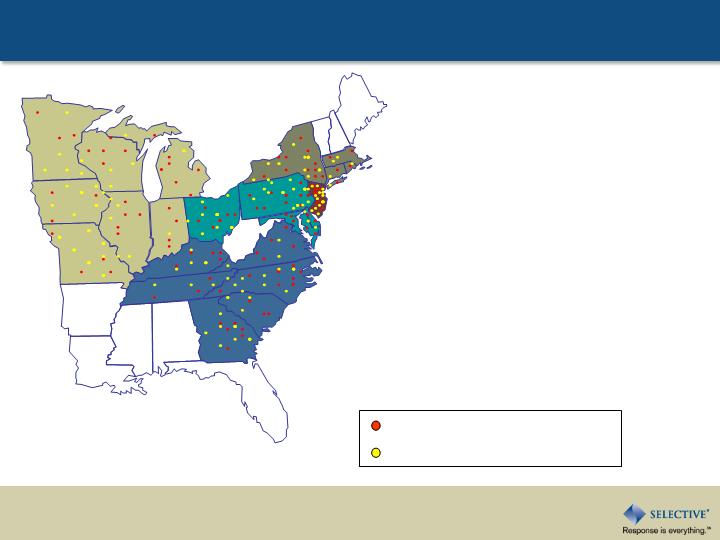
Best in Class Field Model
CT
MN
IA
MO
WI
IL
IN
KY
OH
MI
MI
GA
SC
NC
VA
PA
NY
MD
NJ
RI
DE
CT
MA
TN
100 Agency Management Specialists
140 Claims Management Specialists
…one of the great things with the AMS field model is
the fact that our AMS is out visiting with us every
other week…looking at new opportunities…
Mark Levine of Eastern Insurance
Commercial Lines New Business
Commercial lines new business up 12% YTD
0
10
20
30
40
50
60
70
80
90
100
6 mos 2008
6 mos 2009
One & Done
Middle Market
Large Account

99.1%
Segment 60
94.6%
Segment 41
94.0%
Segment 40
87.2%
Segment 21
87.2%
Segment 20
65.4%
Segment 1
117.7%
Segment 80
99.3%
Segment 61
Profitability Monitoring
Operational Areas
Marketing
Safety
Management
Training
Pricing
Average
Lower
Than
Average
Higher
Than
Average
Growth
Profitability
Improvement
Marketing
Materials
Stewardship
Service
Retention
Sales
Training
Boundary
Control
Corrective
Action
Business Segment
4-Year AY
Combined
Ratio (2008)
Predictive modeling improves performance on an account basis

Percent of Total New Premium Diamond Distribution
WC, BOP, CPP, CA
For lines < $50,000
Commercial Lines Quality Improvement
53%
59%
29%
12%
25%
9%
17%
30%
66%
0%
10%
20%
30%
40%
50%
60%
70%
5 & 4 Diamond
3 Diamond
2 & 1 Diamond
Pre-Modeling
2008
2009 YTD June
Retaining our Best Commercial Business
Retention at point of renewal as of June 30, 2009
5 & 4 Diamond
3 Diamond
2 & 1 Diamond
86%
80%
91%
74%
76%
78%
80%
82%
84%
86%
88%
90%
92%

Commercial Lines Diversification
99.4%
93.2%
91.7%
94.4%
60
100 %
90
80
70
Further diversification results in lower combined ratio
10
15
20
25
30
35
40
45
50
Contractors
Merc/Serv
Manufacturing
Specialty
2008
YTD 2009 June

Selective Total Pricing
Commercial Lines Pricing Power
Jul/Aug:09
2Q:09
1Q:09
4Q08
-3.0%
-0.8%
0.6%
1.2%
-4.0%
-2.0%
0.0%
2.0%
Selective Pricing by Diamond
Commercial Lines Pricing Power
Total
2&1
Diamond
3
Diamond
5&4
Diamond
-4.0%
-2.0%
0.0%
2.0%
4.0%
6.0%
8.0%
4Q:08
1Q:09
2Q:09
Jul/Aug:09

Selective Pricing vs. Industry Indices
Commercial Lines Pricing Power
2Q:09
1Q:09
4Q:08
-3.0%
-0.8%
0.6%
-2.8%
-0.6%
0.5%
-3.1%
-0.5%
-1.1%
-4.0%
-3.0%
-2.0%
-1.0%
0.0%
1.0%
Selective
CLIPS
Advisen ADVx

Personal Lines
$24M in-force price change on $213M book
Underwriting and automation improvements – reduced
operating costs and increased data quality
13-state footprint opportunity – $900 million

Key Claims Strategies
Litigation management
Vendor management
Integrated outcomes
Workers compensation
Other casualty lines
Heightened fraud monitoring
MA
MN
IA
MO
WI
IL
IN
KY
OH
MI
MI
GA
SC
NC
VA
PA
NY
MD
NJ
RI
DE
CT
TN
Commercial Lines
State Market Opportunity
>4% (NJ)
3% to <4% (MD)
2% to <3% (RI & PA)
1% to <2% (NY)
0% to <1% (GA, KY, NC, SC, TN,
VA, IA, IL, IN, MI, MN, MO, WI, OH,
MA, CT, DE)
Not currently in footprint
SIGI’s current average market share = 1.1%.
At 4% market share, premiums would be > $5B
Selective’s Current Market Share

Commercial Lines
Agency Market Opportunity
19,120
10,733
2,060
2,215
283
1,174
2,655
Most Recent
Agency
Commercial
Lines Premium
Volume ($M)
8.3
Total
5.9
8.3
11.4
18.5
10.0
13.6%
Current
Share of
Wallet
NY
All
other
PA
RI
MD
NJ
State
*Includes agents appointed prior to 2006 only
Source: Highline Data
18% Share of
Wallet Results in
$3.4 Billion DPW

Long-Term Shareholder Value Creation
*Fiscal-year dividend
*

Selective Insurance Group, Inc.
Keefe, Bruyette & Woods
Insurance Conference
September 10, 2009