Supplemental Investor Package
Fourth Quarter and
Full Year 2009
Investor Contact:
Jennifer DiBerardino
Vice President, Investor Relations
Tel: 973-948-1364
jennifer.diberardino@selective.com
| SELECTIVE INSURANCE GROUP, INC. |
| FOURTH QUARTER AND FULL YEAR 2009 INVESTOR PACKET |
| TABLE OF CONTENTS |
| | | | | | | | | | |
| | | | | | | | | | |
| Earnings Press Release | 1 |
| Selected Balance Sheet Data | 6 |
| Selected Income Statement Data | 7 |
| Quarterly Investment Income | 8 |
| Investment Yield and Tax Rate Portfolio Breakdown | 9 |
| Statutory Combined Ratio Summary by LOB Quarter | 10 |
| Statutory Combined Ratio Summary by LOB YTD September | 11 |
| Consolidated Balance Sheets | 12 |
| Consolidated Statements of Income - Fourth Quarter | 13a |
| Consolidated Statements of Income - Full Year | 13b |
| Consolidated Statements of Stockholder’s Equity | 14 |
| Consolidated Statements of Cash Flow | 15 |
| Statutory Balance Sheets | 16 |
| Statutory Statements of Income | 17 |
| Investment Portfolio – Appendix | | | | | | |
| | Alternative Investments Exhibit | 18 |
| | Municipal Bond Portfolio Exhibit | 19 |
| | Structured Securities Exhibit | 20 |
| | RMBS & RABS Exhibit | 21 |
| | RMBS & RABS by Vintage Year Exhibit | 22 |
| | RMBS and RABS by Type Exhibit | 23 |
| | Alt-A by Vintage Year Exhibit | 24 |
| | CMBS Exhibit | 25 |
| | CMBS by Vintage Year Exhibit | 26 |
| | CMBS by Type Exhibit | 27 |
| | Credit Quality of AFS Securities Exhibit | 28 |
| | Credit Quality of HTM Securities Exhibit | 29 |
Selective Insurance Group, Inc.
Selected Balance Sheet Data (unaudited)
($ in thousands, except per share amounts)
| | | December 31, | | | December 31, | |
| | | 2009 | | | 2008 | |
| | | | | | | | | Unrealized/ | | | | | | | | | Unrecognized/ | |
| | | Balance | | | Market | | | Unrecognized | | | Balance | | | Market | | | Unrealized | |
| | | Sheet | | | Value | | | Gain/(Loss) | | | Sheet | | | Value | | | Gain/(Loss) | |
| Invested Assets: | | | | | | | | | | | | | | | | | | |
Corporate bonds1,2 | | $ | 1,144,692 | | | | 1,163,973 | | | | (13,031 | ) | | $ | 1,024,179 | | | | 1,024,181 | | | | (124,294 | ) |
Gov't\ Municipal bonds2 | | | 2,201,580 | | | | 2,212,107 | | | | 72,101 | | | | 2,011,262 | | | | 2,011,275 | | | | 35,240 | |
| Total bonds | | | 3,346,272 | | | | 3,376,080 | | | | 59,070 | | | | 3,035,441 | | | | 3,035,456 | | | | (89,054 | ) |
| Equities | | | 80,264 | | | | 80,264 | | | | 15,874 | | | | 132,131 | | | | 132,131 | | | | 6,184 | |
| Short-term investments | | | 213,848 | | | | 213,848 | | | | - | | | | 198,111 | | | | 198,111 | | | | - | |
| Trading securities | | | - | | | | - | | | | - | | | | 2,569 | | | | 2,569 | | | | (1,216 | ) |
| Other investments | | | 140,667 | | | | 140,667 | | | | (25,774 | ) | | | 172,057 | | | | 172,057 | | | | (5,585 | ) |
| Total invested assets | | | 3,781,051 | | | | 3,810,859 | | | | 49,170 | | | | 3,540,309 | | | | 3,540,324 | | | | (89,671 | ) |
| | | | | | | | | | | | | | | | | | | | | | | | | |
| | | | | | | | | | | | | | | | | | | | | | | | | |
| Invested assets per $ of stockholders' equity | | | 3.77 | | | | | | | | | | | | 3.98 | | | | | | | | | |
| | | | | | | | | | | | | | | | | | | | | | | | | |
| Total assets | | | 5,114,827 | | | | | | | | | | | | 4,945,556 | | | | | | | | | |
| | | | | | | | | | | | | | | | | | | | | | | | | |
| Liabilities: | | | | | | | | | | | | | | | | | | | | | | | | |
| Reserve for losses | | | 2,342,919 | | | | | | | | | | | | 2,256,329 | | | | | | | | | |
| Reserve for loss expenses | | | 402,880 | | | | | | | | | | | | 384,644 | | | | | | | | | |
| Unearned premium reserve | | | 844,847 | | | | | | | | | | | | 844,334 | | | | | | | | | |
| | | | | | | | | | | | | | | | | | | | | | | | | |
| Total liabilities | | | 4,112,452 | | | | | | | | | | | | 4,055,063 | | | | | | | | | |
| | | | | | | | | | | | | | | | | | | | | | | | | |
| Stockholders' equity | | | 1,002,375 | | | | | | | | | | | | 890,493 | | | | | | | | | |
| | | | | | | | | | | | | | | | | | | | | | | | | |
| Total debt to capitalization ratio | | | 21.5 | % | | | | | | | | | | | 23.5 | % | | | | | | | | |
Adjusted total debt to capitalization ratio 3 | | | 15.6 | % | | | | | | | | | | | 17.0 | % | | | | | | | | |
| | | | | | | | | | | | | | | | | | | | | | | | | |
| Book value per share | | | 18.83 | | | | | | | | | | | | 16.84 | | | | | | | | | |
| | | | | | | | | | | | | | | | | | | | | | | | | |
| Book value per share excluding unrealized gain or loss on bond portfolio | | | 18.47 | | | | | | | | | | | | 17.94 | | | | | | | | | |
| | | | | | | | | | | | | | | | | | | | | | | | | |
| NPW per insurance segment employee | | | 766 | | | | | | | | | | | | 797 | | | | | | | | | |
| | | | | | | | | | | | | | | | | | | | | | | | | |
| Statutory premiums to surplus ratio | | | 1.5 | x | | | | | | | | | | | 1.7 | x | | | | | | | | |
| | | | | | | | | | | | | | | | | | | | | | | | | |
Statutory surplus4 | | | 981,937 | | | | | | | | | | | | 884,431 | | | | | | | | | |
| 1 | Includes mortgage-backed and asset-backed securities. |
| 2 | Certain prior year amounts were reclassified to conform with current year presentation. |
| 3 | The adjusted debt to capitalization ratio reflects a reduction in debt for amounts held in an irrevocable trust for the benefit of senior note holders as well as the median rating agency equity treatment of 75% applied to our $100 million Junior Subordinated Notes issued September 25, 2006. |
| 4 | December 31, 2008 amount includes a retroactive affiliate transaction involving SICA, SIGI, and Wantage Avenue Holding Company. |
Selective Insurance Group, Inc.
Selected Income Statement Data (unaudited)
December 2009
($ in thousands, except per share amounts)
| | | THREE MONTHS ENDED DECEMBER 31, | | | TWELVE MONTHS ENDED DECEMBER 31, | |
| | | 2009 | | | 2008 | | | 2009 | | | 2008 | |
| | | | | | Per diluted share | | | | | | Per diluted share | | | | | | Per diluted share | | | | | | Per diluted share | |
| Consolidated | | | | | | | | | | | | | | | | | | | | | | | | |
| Revenue | | $ | 389,802 | | | | | | $ | 356,944 | | | | | | | 1,514,018 | | | | | | $ | 1,589,939 | | | | |
| Operating income | | | 25,327 | | | | 0.47 | | | | 7,524 | | | | 0.14 | | | | 74,538 | | | | 1.39 | | | | 76,245 | | | | 1.43 | |
| Net realized losses, after tax | | | (3,683 | ) | | | (0.07 | ) | | | (19,703 | ) | | | (0.38 | ) | | | (29,880 | ) | | | (0.56 | ) | | | (32,144 | ) | | | (0.60 | ) |
| Income (loss) from continuing operations | | | 21,644 | | | | 0.40 | | | | (12,179 | ) | | | (0.24 | ) | | | 44,658 | | | | 0.83 | | | | 44,101 | | | | 0.83 | |
| Loss on discontinued operations, net of tax | | | (1,064 | ) | | | (0.02 | ) | | | (2,209 | ) | | | (0.04 | ) | | | (8,260 | ) | | | (0.15 | ) | | | (343 | ) | | | (0.01 | ) |
| Net income (loss) | | | 20,580 | | | | 0.38 | | | | (14,388 | ) | | | (0.28 | ) | | | 36,398 | | | | 0.68 | | | | 43,758 | | | | 0.82 | |
| Operating return on equity | | | 10.2 | % | | | | | | | 3.2 | % | | | | | | | 7.9 | % | | | | | | | 7.8 | % | | | | |
| | | | | | | | | | | | | | | | | | | | | | | | | | | | | | | | | |
| Insurance Operations | | | | | | | | | | | | | | | | | | | | | | | | | | | | | | | | |
| Gross premiums written | | | 367,296 | | | | | | | | 362,340 | | | | | | | | 1,679,926 | | | | | | | | 1,724,610 | | | | | |
| Net premiums written | | | 304,891 | | | | | | | | 308,651 | | | | | | | | 1,422,655 | | | | | | | | 1,492,738 | | | | | |
| Net premiums earned | | | 352,957 | | | | | | | | 368,838 | | | | | | | | 1,431,047 | | | | | | | | 1,504,187 | | | | | |
| Underwriting (loss) profit | - before tax | | | (542 | ) | | | | | | | (1,407 | ) | | | | | | | 2,385 | | | | | | | | 132 | | | | | |
| | - after tax | | | (353 | ) | | | (0.01 | ) | | | (914 | ) | | | (0.02 | ) | | | 1,550 | | | | 0.03 | | | | 86 | | | | - | |
| GAAP combined ratio | | | 100.2 | % | | | | | | | 100.4 | % | | | | | | | 99.8 | % | | | | | | | 100.0 | % | | | | |
| | | | | | | | | | | | | | | | | | | | | | | | | | | | | | | | | |
| Commercial lines | | | | | | | | | | | | | | | | | | | | | | | | | | | | | | | | |
| Net premiums earned | | | 296,884 | | | | | | | | 315,107 | | | | | | | | 1,214,952 | | | | | | | | 1,294,244 | | | | | |
| GAAP combined ratio | | | 98.6 | % | | | | | | | 99.2 | % | | | | | | | 98.8 | % | | | | | | | 99.2 | % | | | | |
| Personal lines | | | | | | | | | | | | | | | | | | | | | | | | | | | | | | | | |
| Net premiums earned | | | 56,074 | | | | | | | | 53,731 | | | | | | | | 216,095 | | | | | | | | 209,943 | | | | | |
| GAAP combined ratio | | | 108.5 | % | | | | | | | 107.1 | % | | | | | | | 105.6 | % | | | | | | | 105.1 | % | | | | |
| | | | | | | | | | | | | | | | | | | | | | | | | | | | | | | | | |
| Investments | | | | | | | | | | | | | | | | | | | | | | | | | | | | | | | | |
| Net investment income | - before tax | | | 39,801 | | | | | | | | 18,517 | | | | | | | | 118,471 | | | | | | | | 131,032 | | | | | |
| | - after tax | | | 30,333 | | | | 0.57 | | | | 17,043 | | | | 0.33 | | | | 95,725 | | | | 1.79 | | | | 105,039 | | | | 1.97 | |
| Effective tax rate | | | 23.8 | % | | | | | | | 8.0 | % | | | | | | | 19.2 | % | | | | | | | 19.8 | % | | | | |
| Annual after-tax yield on investment portfolio | | | | | | | | | | | | | | | | | | | 2.6 | % | | | | | | | 2.9 | % | | | | |
| Annual after-tax, after-interest expense yield | | | | | | | | | | | | | | | | | | | 2.3 | % | | | | | | | 2.5 | % | | | | |
| Invested assets per $ of stockholders' equity | | | | | | | | | | | | | | | | | | | 3.77 | | | | | | | | 3.98 | | | | | |
| | | | | | | | | | | | | | | | | | | | | | | | | | | | | | | | | |
| Other expenses (net of other income) | | | | | | | | | | | | | | | | | | | | | | | | | | | | | | | | |
| Interest expense | - before tax | | | (4,768 | ) | | | | | | | (5,036 | ) | | | | | | | (19,386 | ) | | | | | | | (20,508 | ) | | | | |
| | - after tax | | | (3,099 | ) | | | (0.06 | ) | | | (3,273 | ) | | | (0.06 | ) | | | (12,601 | ) | | | (0.24 | ) | | | (13,330 | ) | | | (0.25 | ) |
| | | | | | | | | | | | | | | | | | | | | | | | | | | | | | | | | |
| Other - after tax | | $ | (1,554 | ) | | | (0.03 | ) | | $ | (5,332 | ) | | | (0.11 | ) | | | (10,136 | ) | | | (0.19 | ) | | $ | (15,550 | ) | | | (0.29 | ) |
| | | | | | | | | | | | | | | | | | | | | | | | | | | | | | | | | |
| Diluted weighted avg shares outstanding | | | 53,639 | | | | | | | | 51,948 | | | | | | | | 53,397 | | | | | | | | 53,319 | | | | | |
Quarterly
GAAP Investment Income
(unaudited)
($ in thousands)
| | | For the three months ended | | | % | | | Year to Date | | | % | |
| | | December | | | December | | | Increase | | | December | | | December | | | Increase | |
| | | 2009 | | | 2008 | | | (Decrease) | | | 2009 | | | 2008 | | | (Decrease) | |
| Investment Income: | | | | | | | | | | | | | | | | | | |
| Interest: | | | | | | | | | | | | | | | | | | |
| Fixed Maturity Securities | | $ | 34,902 | | | | 36,874 | | | | (5.3 | ) | | $ | 141,882 | | | | 146,555 | | | | (3.2 | ) |
| Short-term | | | 112 | | | | 549 | | | | (79.6 | ) | | | 1,273 | | | | 4,252 | | | | (70.1 | ) |
| Alternative Investments | | | 5,018 | | | | (18,036 | ) | | | 127.8 | | | | (21,726 | ) | | | (12,676 | ) | | | (71.4 | ) |
| Dividends | | | 786 | | | | 1,920 | | | | (59.1 | ) | | | 2,348 | | | | 5,603 | | | | (58.1 | ) |
| Change in Fair Value | | | - | | | | (1,681 | ) | | | 100.0 | | | | 262 | | | | (8,129 | ) | | | 103.2 | |
| Miscellaneous | | | 50 | | | | 105 | | | | (52.4 | ) | | | 343 | | | | 340 | | | | 0.9 | |
| | | | 40,868 | | | | 19,731 | | | | 107.1 | | | | 124,382 | | | | 135,945 | | | | (8.5 | ) |
| | | | | | | | | | | | | | | | | | | | | | | | | |
| Investment Expense | | | 1,067 | | | | 1,214 | | | | (12.1 | ) | | | 5,911 | | | | 4,913 | | | | 20.3 | |
| | | | | | | | | | | | | | | | | | | | | | | | | |
| Net Investment Income Before Tax | | | 39,801 | | | | 18,517 | | | | 114.9 | | | | 118,471 | | | | 131,032 | | | | (9.6 | ) |
| | | | | | | | | | | | | | | | | | | | | | | | | |
| Tax | | | 9,468 | | | | 1,474 | | | | 542.3 | | | | 22,746 | | | | 25,993 | | | | (12.5 | ) |
| | | | | | | | | | | | | | | | | | | | | | | | | |
| Net Investment Income After Tax | | $ | 30,333 | | | | 17,043 | | | | 78.0 | | | $ | 95,725 | | | | 105,039 | | | | (8.9 | ) |
| | | | | | | | | | | | | | | | | | | | | | | | | |
| Net Investment Income per Share | | | 0.57 | | | | 0.33 | | | | 72.7 | | | | 1.79 | | | | 1.97 | | | | (9.1 | ) |
| | | | | | | | | | | | | | | | | | | | | | | | | |
| Effective Tax Rate | | | 23.8 | % | | | 8.0 | % | | | | | | | 19.2 | % | | | 19.8 | % | | | | |
| | | | | | | | | | | | | | | | | | | | | | | | | |
| Average Yields: | | | | | | | | | | | | | | | | | | | | | | | | |
| | | | | | | | | | | | | | | | | | | | | | | | | |
| Fixed Maturity Securities | | | | | | | | | | | | | | | | | | | | | | | | |
| Pre Tax | | | | | | | | | | | | | | | 4.2 | % | | | 4.6 | % | | | | |
| After Tax | | | | | | | | | | | | | | | 3.3 | % | | | 3.6 | % | | | | |
| | | | | | | | | | | | | | | | | | | | | | | | | |
| Portfolio | | | | | | | | | | | | | | | | | | | | | | | | |
| Pre Tax | | | | | | | | | | | | | | | 3.2 | % | | | 3.6 | % | | | | |
| After Tax | | | | | | | | | | | | | | | 2.6 | % | | | 2.9 | % | | | | |
| | | | | | | | | | | | | | | | | | | | | | | | | |
| | | For the three months ended | | | | | | | Year to Date | | | | | |
| | | December | | | December | | | | | | | December | | | December | | | | | |
| | | 2009 | | | 2008 | | | | | | | 2009 | | | 2008 | | | | | |
| Net Realized Gains (Losses) | | | | | | | | | | | | | | | | | | | | | | | | |
| Fixed Maturities | | | (9,085 | ) | | | (13,388 | ) | | | | | | | (47,123 | ) | | | (54,159 | ) | | | | |
| Equity Securities | | | 3,417 | | | | (11,769 | ) | | | | | | | 3,192 | | | | 13,292 | | | | | |
| Other | | | - | | | | (5,156 | ) | | | | | | | (2,039 | ) | | | (8,585 | ) | | | | |
| Total | | | (5,668 | ) | | | (30,313 | ) | | | | | | | (45,970 | ) | | | (49,452 | ) | | | | |
| Net of Tax | | | (3,683 | ) | | | (19,703 | ) | | | | | | | (29,880 | ) | | | (32,144 | ) | | | | |
Selective Insurance Group, Inc. and Consolidated Subsidiaries
Investment Yield and Effective Tax Rate Portfolio Breakdown
December 31, 2009
($ in thousands)
(Unaudited)
| | | | | | Q4 2009 | | | FY 2009 | |
| | | Market Value | | | Yield | | | Effective Tax Rate | | | Yield | | | Effective Tax Rate | |
| | | ($) | | | (%) | | | (%) | | | (%) | | | (%) | |
| | | | | | | | | | | | | | | | | |
| Fixed Maturities Securities: | | | | | | | | | | | | | | | | |
| State & Municipal T/E | | | 1,508,318 | | | | 0.9 | | | | 4.4 | | | | 3.7 | | | | 3.8 | |
| State & Municipal Tax | | | 82,277 | | | | 1.4 | | | | 35.0 | | | | 5.0 | | | | 35.0 | |
| State & Municipal | | | 1,590,595 | | | | 0.9 | | | | 6.5 | | | | 3.7 | | | | 5.7 | |
| U.S. Gov't | | | 621,513 | | | | 1.1 | | | | 35.0 | | | | 3.1 | | | | 35.0 | |
| Corporate | | | 487,161 | | | | 1.4 | | | | 35.0 | | | | 5.3 | | | | 35.0 | |
| ABS's | | | 60,142 | | | | 1.5 | | | | 35.0 | | | | 6.7 | | | | 35.0 | |
| MBS's | | | 616,669 | | | | 1.3 | | | | 35.0 | | | | 5.5 | | | | 35.0 | |
| Total Debt Securities | | | 3,376,080 | | | | 1.1 | | | | 22.3 | | | | 4.2 | | | | 21.5 | |
| Equity Securities | | | 80,264 | | | | 0.7 | | | | 17.6 | | | | 2.1 | | | | 15.5 | |
| Trading Securities | | | - | | | | 0.0 | | | | 0.0 | | | | 19.4 | | | | 35.0 | |
| Short-term Investments | | | 213,848 | | | | 0.1 | | | | 35.0 | | | | 0.6 | | | | 35.0 | |
| Other Investments | | | | | | | | | | | | | | | | | | | | |
| Alternative Investments | | | 137,589 | | | | 3.2 | | | | 35.0 | | | | (13.7 | ) | | | 35.0 | |
| Other | | | 3,078 | | | | 0.0 | | | | 0.0 | | | | 0.0 | | | | 0.0 | |
| | | | 3,810,859 | | | | 1.1 | | | | 23.8 | | | | 3.2 | | | | 19.2 | |
Selective Insurance Group, Inc.
2009 Statutory Results by Line of Business
4th Qtr 2009 (unaudited)
($ in thousands)
| | | Net | | | | | | Net | | | | | | | | | | | | Underwriting | | | Dividends to | | | | | | | | | | |
| | | Premiums | | | Percent | | | Premiums | | | Percent | | | Loss | | | LAE | | | Expense | | | Policyholders | | | Combined Ratio | | | Combined Ratio | | | Underwriting | |
| | | Written | | | Change | | | Earned | | | Change | | | Ratio | | | Ratio | | | Ratio | | | Ratio | | | 2009 | | | 2008 | | | Gain/(Loss) | |
| Personal Lines: | | | | | | | | | | | | | | | | | | | | | | | | | | | | | | | | | |
| | | | | | | | | | | | | | | | | | | | | | | | | | | | | | | | | | |
| Homeowners | | $ | 20,870 | | | | 23.7 | % | | $ | 19,739 | | | | 14.0 | % | | | 52.6 | % | | | 13.6 | % | | | 33.6 | % | | | 0.0 | % | | | 99.8 | % | | | 89.2 | % | | $ | (342 | ) |
| Auto | | | 32,610 | | | | 3.0 | % | | | 34,116 | | | | 0.3 | % | | | 76.9 | % | | | 8.3 | % | | | 32.5 | % | | | 0.0 | % | | | 117.7 | % | | | 118.7 | % | | | (5,537 | ) |
| Other (including flood) | | | 3,114 | | | | 25.2 | % | | | 2,218 | | | | (7.6 | )% | | | 61.2 | % | | | (20.5 | )% | | | (14.4 | )% | | | 0.0 | % | | | 26.3 | % | | | 44.3 | % | | | 1,764 | |
| Total | | $ | 56,594 | | | | 11.0 | % | | $ | 56,073 | | | | 4.4 | % | | | 67.8 | % | | | 9.0 | % | | | 30.3 | % | | | 0.0 | % | | | 107.1 | % | | | 105.6 | % | | $ | (4,115 | ) |
| | | | | | | | | | | | | | | | | | | | | | | | | | | | | | | | | | | | | | | | | | | | | |
| Commercial Lines: | | | | | | | | | | | | | | | | | | | | | | | | | | | | | | | | | | | | | | | | | | | | |
| | | | | | | | | | | | | | | | | | | | | | | | | | | | | | | | | | | | | | | | | | | | | |
| Fire/IM | | $ | 43,734 | | | | 3.7 | % | | $ | 49,931 | | | | 2.0 | % | | | 28.1 | % | | | 5.0 | % | | | 42.9 | % | | | 0.2 | % | | | 76.2 | % | | | 82.5 | % | | $ | 14,544 | |
| Workers compensation | | | 48,148 | | | | (17.1 | )% | | | 61,781 | | | | (16.8 | )% | | | 80.6 | % | | | 14.4 | % | | | 33.7 | % | | | 1.4 | % | | | 130.1 | % | | | 102.1 | % | | | (13,998 | ) |
| General liability | | | 71,217 | | | | (4.7 | )% | | | 88,122 | | | | (7.2 | )% | | | 41.3 | % | | | 20.5 | % | | | 38.1 | % | | | 0.2 | % | | | 100.1 | % | | | 110.3 | % | | | 6,327 | |
| Auto | | | 61,807 | | | | 1.1 | % | | | 73,864 | | | | (1.5 | )% | | | 59.8 | % | | | 7.6 | % | | | 31.9 | % | | | 0.3 | % | | | 99.6 | % | | | 104.8 | % | | | 4,142 | |
| BOP | | | 16,967 | | | | 8.0 | % | | | 16,073 | | | | 7.6 | % | | | 80.1 | % | | | 12.7 | % | | | 33.8 | % | | | 0.0 | % | | | 126.6 | % | | | 116.8 | % | | | (4,583 | ) |
| Bonds | | | 4,215 | | | | 12.3 | % | | | 4,638 | | | | 0.7 | % | | | 26.3 | % | | | 5.0 | % | | | 69.4 | % | | | 0.0 | % | | | 100.7 | % | | | 89.9 | % | | | 259 | |
| Other | | | 2,209 | | | | 7.5 | % | | | 2,475 | | | | 5.0 | % | | | 1.6 | % | | | 0.9 | % | | | 46.9 | % | | | 0.0 | % | | | 49.4 | % | | | 52.5 | % | | | 1,377 | |
| Total | | $ | 248,297 | | | | (3.6 | )% | | $ | 296,883 | | | | (5.8 | )% | | | 53.4 | % | | | 12.6 | % | | | 36.8 | % | | | 0.5 | % | | | 103.3 | % | | | 102.4 | % | | $ | 8,069 | |
| | | | | | | | | | | | | | | | | | | | | | | | | | | | | | | | | | | | | | | | | | | | | |
| Grand Total | | $ | 304,891 | | | | (1.2 | )% | | $ | 352,957 | | | | (4.3 | )% | | | 55.7 | % | | | 12.0 | % | | | 35.6 | % | | | 0.4 | % | | | 103.7 | % | | | 102.7 | % | | $ | 3,953 | |
Note: Some amounts may not foot due to rounding.
| | | 2009 | | | 2008 | |
| Losses Paid | | $ | 185,896 | | | $ | 199,130 | |
| LAE Paid | | | 40,841 | | | | 36,095 | |
| Total Paid | | $ | 226,737 | | | $ | 235,225 | |
Selective Insurance Group, Inc.
2009 Statutory Results by Line of Business
December 2009 YTD (unaudited)
($ in thousands)
| | | Net | | | | | | Net | | | | | | | | | | | | Underwriting | | | Dividends to | | | | | | | | | | |
| | | Premiums | | | Percent | | | Premiums | | | Percent | | | Loss | | | LAE | | | Expense | | | Policyholders | | | Combined Ratio | | | Combined Ratio | | | Underwriting | |
| | | Written | | | Change | | | Earned | | | Change | | | Ratio | | | Ratio | | | Ratio | | | Ratio | | | 2009 | | | 2008 | | | Gain/(Loss) | |
| Personal Lines: | | | | | | | | | | | | | | | | | | | | | | | | | | | | | | | | | |
| | | | | | | | | | | | | | | | | | | | | | | | | | | | | | | | | | |
| Homeowners | | $ | 80,639 | | | | 16.7 | % | | $ | 73,076 | | | | 7.3 | % | | | 61.4 | % | | | 10.4 | % | | | 33.7 | % | | | 0.0 | % | | | 105.5 | % | | | 98.9 | % | | $ | (6,531 | ) |
| Auto | | | 135,861 | | | | 1.0 | % | | | 133,320 | | | | 0.4 | % | | | 67.5 | % | | | 11.9 | % | | | 31.3 | % | | | 0.0 | % | | | 110.7 | % | | | 113.8 | % | | $ | (15,112 | ) |
| Other (including flood) | | | 11,358 | | | | 18.8 | % | | | 9,698 | | | | 7.6 | % | | | 59.3 | % | | | (15.8 | )% | | | (27.4 | )% | | | 0.0 | % | | | 16.1 | % | | | (6.0 | )% | | | 8,596 | |
| Total | | $ | 227,859 | | | | 6.9 | % | | $ | 216,095 | | | | 2.9 | % | | | 65.0 | % | | | 10.2 | % | | | 29.2 | % | | | 0.0 | % | | | 104.4 | % | | | 103.7 | % | | $ | (13,047 | ) |
| | | | | | | | | | | | | | | | | | | | | | | | | | | | | | | | | | | | | | | | | | | | | |
| Commercial Lines: | | | | | | | | | | | | | | | | | | | | | | | | | | | | | | | | | | | | | | | | | | | | |
| | | | | | | | | | | | | | | | | | | | | | | | | | | | | | | | | | | | | | | | | | | | | |
| Fire/IM | | $ | 199,707 | | | | 2.7 | % | | $ | 197,665 | | | | 0.8 | % | | | 41.0 | % | | | 5.0 | % | | | 38.0 | % | | | (0.1 | )% | | | 83.9 | % | | | 92.9 | % | | $ | 30,958 | |
| Workers compensation | | | 251,121 | | | | (17.3 | )% | | | 263,490 | | | | (14.6 | )% | | | 63.2 | % | | | 14.9 | % | | | 28.1 | % | | | 1.4 | % | | | 107.6 | % | | | 96.1 | % | | | (16,664 | ) |
| General liability | | | 352,336 | | | | (10.3 | )% | | | 362,479 | | | | (8.5 | )% | | | 49.6 | % | | | 19.0 | % | | | 34.3 | % | | | 0.0 | % | | | 102.9 | % | | | 102.0 | % | | | (6,905 | ) |
| Auto | | | 298,036 | | | | (0.8 | )% | | | 300,562 | | | | (2.2 | )% | | | 60.4 | % | | | 8.3 | % | | | 29.5 | % | | | 0.0 | % | | | 98.2 | % | | | 99.7 | % | | | 6,204 | |
| BOP | | | 64,958 | | | | 7.5 | % | | | 62,638 | | | | 7.9 | % | | | 69.9 | % | | | 12.4 | % | | | 34.1 | % | | | 0.0 | % | | | 116.4 | % | | | 113.1 | % | | | (11,056 | ) |
| Bonds | | | 18,678 | | | | 2.4 | % | | | 18,455 | | | | (2.0 | )% | | | 26.6 | % | | | 5.1 | % | | | 61.7 | % | | | 0.0 | % | | | 93.4 | % | | | 80.5 | % | | | 1,087 | |
| Other | | | 9,960 | | | | 6.5 | % | | | 9,663 | | | | 4.0 | % | | | 1.0 | % | | | 0.8 | % | | | 44.7 | % | | | 0.0 | % | | | 46.5 | % | | | 47.3 | % | | | 5,033 | |
| Total | | $ | 1,194,797 | | | | (6.6 | )% | | $ | 1,214,953 | | | | (6.1 | )% | | | 54.1 | % | | | 12.5 | % | | | 32.9 | % | | | 0.3 | % | | | 99.8 | % | | | 98.5 | % | | $ | 8,657 | |
| | | | | | | | | | | | | | | | | | | | | | | | | | | | | | | | | | | | | | | | | | | | | |
| Grand Total | | $ | 1,422,655 | | | | (4.7 | )% | | $ | 1,431,047 | | | | (4.9 | )% | | | 55.8 | % | | | 12.1 | % | | | 32.3 | % | | | 0.3 | % | | | 100.5 | % | | | 99.2 | % | | $ | (4,391 | ) |
Note: Some amounts may not foot due to rounding.
| | | 2009 | | | 2008 | |
| Losses Paid | | $ | 757,916 | | | $ | 768,165 | |
| LAE Paid | | | 157,034 | | | | 140,877 | |
| Total Paid | | $ | 914,950 | | | $ | 909,042 | |
| Consolidated Balance Sheets | | | | | | |
| December 31, | | Unaudited | | | | |
| ($ in thousands, except share amounts) | | 2009 | | | 2008 | |
| ASSETS | | | | | | |
| Investments: | | | | | | |
| Fixed maturity securities, held-to-maturity – at carry value | | | | | | |
| (fair value: $1,740,211 – 2009; $1,178 – 2008) | | $ | 1,710,403 | | | | 1,163 | |
| Fixed maturity securities, available-for-sale – at fair value | | | | | | | | |
| (amortized cost: $1,616,456 – 2009; $3,123,346 – 2008) | | | 1,635,869 | | | | 3,034,278 | |
| Equity securities, available-for-sale – at fair value | | | | | | | | |
| (cost of: $64,390 – 2009; $125,947 – 2008) | | | 80,264 | | | | 132,131 | |
| Short-term investments (at cost which approximates fair value) | | | 213,848 | | | | 198,111 | |
| Equity securities, trading – at fair value | | | - | | | | 2,569 | |
| Other investments | | | 140,667 | | | | 172,057 | |
| Total investments | | | 3,781,051 | | | | 3,540,309 | |
| Cash and cash equivalents | | | 811 | | | | 3,606 | |
| Interest and dividends due or accrued | | | 34,651 | | | | 36,538 | |
| Premiums receivable, net of allowance for uncollectible | | | | | | | | |
| accounts of: $5,880 – 2009; $4,237 – 2008 | | | 446,577 | | | | 480,894 | |
| Reinsurance recoverable on paid losses and loss expenses | | | 4,408 | | | | 6,513 | |
| Reinsurance recoverable on unpaid losses and loss expenses | | | 271,610 | | | | 224,192 | |
| Prepaid reinsurance premiums | | | 105,522 | | | | 96,617 | |
| Current federal income tax | | | 17,662 | | | | 26,593 | |
| Deferred federal income tax | | | 111,038 | | | | 150,759 | |
| Property and Equipment – at cost, net of accumulated | | | | | | | | |
| depreciation and amortization of: $141,251 – 2009; $129,333 – 2008 | | | 46,287 | | | | 51,580 | |
| Deferred policy acquisition costs | | | 218,601 | | | | 212,319 | |
| Goodwill | | | 7,849 | | | | 7,849 | |
| Assets of discontinued operations | | | - | | | | 56,468 | |
| Other assets | | | 68,760 | | | | 51,319 | |
| Total assets | | $ | 5,114,827 | | | | 4,945,556 | |
| | | | | | | | | |
| LIABILITIES AND STOCKHOLDERS’ EQUITY | | | | | | | | |
| Liabilities: | | | | | | | | |
| Reserve for losses | | $ | 2,342,919 | | | | 2,256,329 | |
| Reserve for loss expenses | | | 402,880 | | | | 384,644 | |
| Unearned premiums | | | 844,847 | | | | 844,334 | |
| Notes payable | | | 274,606 | | | | 273,878 | |
| Commissions payable | | | 49,237 | | | | 48,560 | |
| Accrued salaries and benefits | | | 103,802 | | | | 118,422 | |
| Liabilities of discontinued operations | | | - | | | | 34,138 | |
| Other liabilities | | | 94,161 | | | | 94,758 | |
| Total liabilities | | $ | 4,112,452 | | | | 4,055,063 | |
| | | | | | | | | |
| Stockholders’ Equity: | | | | | | | | |
| Preferred stock of $0 par value per share: | | | | | | | | |
| Authorized shares 5,000,000; no shares issue or outstanding | | | | | | | | |
| Common stock of $2 par value per share | | | | | | | | |
| Authorized shares: 360,000,000 | | | | | | | | |
| Issued: 95,822,959 – 2009; 95,263,508 – 2008 | | $ | 191,646 | | | | 190,527 | |
| Additional paid-in capital | | | 231,933 | | | | 217,195 | |
| Retained earnings | | | 1,138,978 | | | | 1,128,149 | |
| Accumulated other comprehensive loss | | | (12,460 | ) | | | (100,666 | ) |
| Treasury stock – at cost (shares: 42,578,779 – 2009; 42,386,921 – 2008) | | | (547,722 | ) | | | (544,712 | ) |
| Total stockholders’ equity | | | 1,002,375 | | | | 890,493 | |
| Commitments and contingencies | | | | | | | | |
| Total liabilities and stockholders’ equity | | $ | 5,114,827 | | | | 4,945,556 | |
Consolidated Statements of Income
Fourth Quarter
| | | Unaudited | |
| ($ in thousands, except share amounts) | | 2009 | | | 2008 | |
| Revenues: | | | | | | |
| Net premiums written | | $ | 304,891 | | | | 308,651 | |
| Net increase in unearned premiums and prepaid reinsurance premiums | | | 48,066 | | | | 60,187 | |
| Net premiums earned | | | 352,957 | | | | 368,838 | |
| Net investment income earned | | | 39,801 | | | | 18,517 | |
| Net realized (losses): | | | | | | | | |
| Net realized investment gains (losses) | | | 5,931 | | | | (21,851 | ) |
| Other-than-temporary impairments | | | (18,717 | ) | | | (8,462 | ) |
| Other-than-temporary impairments on fixed maturity securities | | | | | | | | |
| recognized in other comprehensive income | | | 7,118 | | | | - | |
| Total net realized investment (losses) | | | (5,668 | ) | | | (30,313 | ) |
| Other income | | | 2,712 | | | | (98 | ) |
| Total revenues | | | 389,802 | | | | 356,944 | |
| | | | | | | | | |
| Expenses: | | | | | | | | |
| Losses incurred | | | 196,202 | | | | 210,516 | |
| Loss expenses incurred | | | 42,428 | | | | 40,600 | |
| Policy acquisition costs | | | 115,276 | | | | 115,234 | |
| Dividends to policyholders | | | 1,372 | | | | 1,946 | |
| Interest expense | | | 4,768 | | | | 5,036 | |
| Other expenses | | | 3,662 | | | | 6,031 | |
| Total expenses | | | 363,708 | | | | 379,363 | |
| | | | | | | | | |
| Income (loss) from continuing operations, before federal income tax | | | 26,094 | | | | (22,419 | ) |
| | | | | | | | | |
| Federal income tax expense (benefit): | | | | | | | | |
| Current | | | (233 | ) | | | (12,145 | ) |
| Deferred | | | 4,683 | | | | 1,905 | |
| Total federal income tax expense (benefit) | | | 4,450 | | | | (10,240 | ) |
| | | | | | | | | |
| Net income (loss) from continuing operations | | | 21,644 | | | | (12,179 | ) |
| | | | | | | | | |
| Income (loss) from discontinued operations, net of tax: $59-2009; | | | | | | | | |
| $(1,239)-2008 | | | 110 | | | | (2,209 | ) |
| Loss on disposal of discontinued operations, net of tax: $(631)-2009 | | | (1,174 | ) | | | - | |
Total discontinued operations, net of tax | | | (1,064 | ) | | | (2,209 | ) |
| | | | | | | | | |
| Net income (loss) | | | 20,580 | | | | (14,388 | ) |
| | | | | | | | | |
| Earnings per share: | | | | | | | | |
Basic net income (loss) from continuing operations | | | 0.41 | | | | (0.24 | ) |
Basic net loss from discontinued operations | | | (0.02 | ) | | | (0.04 | ) |
| Basic net income (loss) | | $ | 0.39 | | | | (0.28 | ) |
| | | | | | | | | |
Diluted net income (loss) from continuing operations | | $ | 0.40 | | | | (0.24 | ) |
| Diluted net loss from discontinued operations | | | (0.02 | ) | | | (0.04 | ) |
Diluted net income (loss) | | | 0.38 | | | | (0.28 | ) |
| | | | | | | | | |
| Dividends to stockholders | | $ | 0.13 | | | | 0.13 | |
Consolidated Statements of Income
December 31,
| | | Unaudited | |
| ($ in thousands, except share amounts) | | 2009 | | | 2008 | | | 2007 | |
| Revenues: | | | | | | | | | |
| Net premiums written | | $ | 1,422,655 | | | | 1,492,738 | | | | 1,562,450 | |
| Net decrease (increase) in unearned premiums and prepaid reinsurance premiums | | | 8,392 | | | | 11,449 | | | | (37,561 | ) |
| Net premiums earned | | | 1,431,047 | | | | 1,504,187 | | | | 1,524,889 | |
| Net investment income earned | | | 118,471 | | | | 131,032 | | | | 174,144 | |
| Net realized (losses) gains: | | | | | | | | | | | | |
| Net realized investment gains | | | 9,446 | | | | 3,648 | | | | 38,244 | |
| Other-than-temporary impairments | | | (64,184 | ) | | | (53,100 | ) | | | (4,890 | ) |
| Other-than-temporary impairments on fixed maturity securities recognized in | | | | | | | | | | | | |
| other comprehensive income | | | 8,768 | | | | - | | | | - | |
| Total net realized investment (losses) gains | | | (45,970 | ) | | | (49,452 | ) | | | 33,354 | |
| Other income | | | 10,470 | | | | 4,172 | | | | 6,928 | |
| Total revenues | | | 1,514,018 | | | | 1,589,939 | | | | 1,739,315 | |
| | | | | | | | | | | | | |
| Expenses: | | | | | | | | | | | | |
| Losses incurred | | | 798,363 | | | | 845,656 | | | | 829,524 | |
| Loss expenses incurred | | | 173,542 | | | | 165,888 | | | | 168,288 | |
| Policy acquisition costs | | | 457,424 | | | | 485,702 | | | | 491,235 | |
| Dividends to policyholders | | | 3,640 | | | | 5,211 | | | | 7,202 | |
| Interest expense | | | 19,386 | | | | 20,508 | | | | 23,795 | |
| Other expenses | | | 22,477 | | | | 26,807 | | | | 30,507 | |
| Total expenses | | | 1,474,832 | | | | 1,549,772 | | | | 1,550,551 | |
| | | | | | | | | | | | | |
| Income from continuing operations, before federal income tax | | | 39,186 | | | | 40,167 | | | | 188,764 | |
| | | | | | | | | | | | | |
| Federal income tax (benefit) expense: | | | | | | | | | | | | |
| Current | | | 3,585 | | | | 21,995 | | | | 42,557 | |
| Deferred | | | (9,057 | ) | | | (25,929 | ) | | | 2,571 | |
| Total federal income tax (benefit) expense | | | (5,472 | ) | | | (3,934 | ) | | | 45,128 | |
| | | | | | | | | | | | | |
| Net income from continuing operations | | | 44,658 | | | | 44,101 | | | | 143,636 | |
| | | | | | | | | | | | | |
| (Loss) income from discontinued operations, net of tax of $(4,042) – 2009; | | | | | | | | | | | | |
$(438) – 2008; $1,132 – 2007 | | | (7,086 | ) | | | (343 | ) | | | 2,862 | |
| Loss on disposal of discontinued operations, net of tax of $(631) – 2009 | | | (1,174 | ) | | | - | | | | - | |
Total discontinued operations, net of tax | | | (8,260 | ) | | | (343 | ) | | | 2,862 | |
| | | | | | | | | | | | | |
| Net income | | | 36,398 | | | | 43,758 | | | | 146,498 | |
| | | | | | | | | | | | | |
| Earnings per share: | | | | | | | | | | | | |
Basic net income from continuing operations | | | 0.84 | | | | 0.85 | | | | 2.75 | |
Basic net (loss) income from discontinued operations | | | (0.15 | ) | | | (0.01 | ) | | | 0.05 | |
| Basic net income | | $ | 0.69 | | | | 0.84 | | | | 2.80 | |
| | | | | | | | | | | | | |
Diluted net income from continuing operations | | $ | 0.83 | | | | 0.83 | | | | 2.54 | |
| Diluted net (loss) income from discontinued operations | | | (0.15 | ) | | | (0.01 | ) | | | 0.05 | |
Diluted net income | | | 0.68 | | | | 0.82 | | | | 2.59 | |
| | | | | | | | | | | | | |
| Dividends to stockholders | | $ | 0.52 | | | | 0.52 | | | | 0.49 | |
| Consolidated Statements of Stockholders’ Equity | | Unaudited | | | | | | | | | | | | | | | | |
| December 31, | | | | | | | | | | | | | | | | | | |
| ($ in thousands, except share amounts) | | 2009 | | | | | | 2008 | | | | | | 2007 | | | | |
| Common stock: | | | | | | | | | | | | | | | | | | |
| Beginning of year | | $ | 190,527 | | | | | | | 189,306 | | | | | | | 183,124 | | | | |
| Dividend reinvestment plan | | | | | | | | | | | | | | | | | | | | | |
| (shares: 123,880 – 2009; 81,200 – 2008; | | | | | | | | | | | | | | | | | | | | | |
| 78,762 – 2007) | | | 248 | | | | | | | 162 | | | | | | | 158 | | | | |
| Convertible debentures | | | | | | | | | | | | | | | | | | | | | |
| (shares: 45,759 – 2008; 2,074,067 – 2007) | | | - | | | | | | | 92 | | | | | | | 4,148 | | | | |
| Stock purchase and compensation plans | | | | | | | | | | | | | | | | | | | | | |
| (shares: 435,571 – 2009; 483,619 – 2008; | | | | | | | | | | | | | | | | | | | | | |
| 937,835 –2007) | | | 871 | | | | | | | 967 | | | | | | | 1,876 | | | | |
| End of year | | | 191,646 | | | | | | | 190,527 | | | | | | | 189,306 | | | | |
| | | | | | | | | | | | | | | | | | | | | | |
| Additional paid-in capital: | | | | | | | | | | | | | | | | | | | | | |
| Beginning of year | | | 217,195 | | | | | | | 192,627 | | | | | | | 153,246 | | | | |
| Dividend reinvestment plan | | | 1,514 | | | | | | | 1,677 | | | | | | | 1,708 | | | | |
| Convertible debentures | | | - | | | | | | | 645 | | | | | | | 9,806 | | | | |
| Stock purchase and compensation plans | | | 13,224 | | | | | | | 22,246 | | | | | | | 27,867 | | | | |
| End of year | | | 231,933 | | | | | | | 217,195 | | | | | | | 192,627 | | | | |
| | | | | | | | | | | | | | | | | | | | | | |
| Retained earnings: | | | | | | | | | | | | | | | | | | | | | |
| Beginning of year | | | 1,128,149 | | | | | | | 1,105,946 | | | | | | | 986,017 | | | | |
| Cumulative-effect adjustment due to fair value election | | | | | | | | | | | | | | | | | | | | | |
under ASC 825, net of deferred income tax effect of $3,344 | | | - | | | | | | | 6,210 | | | | | | | - | | | | |
| Cumulative-effect adjustment due to adoption of other- | | | | | | | | | | | | | | | | | | | | | |
| than-temporary impairment guidance under ASC 320, | | | | | | | | | | | | | | | | | | | | | |
| net of deferred income tax effect of $1,282 | | | 2,380 | | | | | | | - | | | | | | | - | | | | |
| Net income | | | 36,398 | | | | 36,398 | | | | 43,758 | | | | 43,758 | | | | 146,498 | | | | 146,498 | |
| Cash dividends to stockholders ($0.52 per share – 2009; | | | | | | | | | | | | | | | | | | | | | | | | |
| $0.52 per share – 2008; and $0.49 per share – 2007) | | | (27,949 | ) | | | | | | | (27,765 | ) | | | | | | | (26,569 | ) | | | | |
| End of year | | | 1,138,978 | | | | | | | | 1,128,149 | | | | | | | | 1,105,946 | | | | | |
| | | | | | | | | | | | | | | | | | | | | | | | | |
| Accumulated other comprehensive (loss) income: | | | | | | | | | | | | | | | | | | | | | | | | |
| Beginning of year | | | (100,666 | ) | | | | | | | 86,043 | | | | | | | | 100,601 | | | | | |
| Cumulative-effect adjustment due to fair value election | | | | | | | | | | | | | | | | | | | | | | | | |
| under ASC 825, net of deferred income tax effect of | | | | | | | | | | | | | | | | | | | | | | | | |
| $(3,344) | | | - | | | | | | | | (6,210 | ) | | | | | | | - | | | | | |
| Cumulative-effect adjustment due to adoption of other- | | | | | | | | | | | | | | | | | | | | | | | | |
| than-temporary impairment guidance under ASC 320, | | | | | | | | | | | | | | | | | | | | | | | | |
| net of deferred income tax effect of $(1,282) | | | (2,380 | ) | | | | | | | - | | | | | | | | - | | | | | |
| Other comprehensive income (loss), increase (decrease) in: | | | | | | | | | | | | | | | | | | | | | | | | |
| Unrealized (losses) gains on investment securities: | | | | | | | | | | | | | | | | | | | | | | | | |
| Non-credit portion of other-than-temporary | | | | | | | | | | | | | | | | | | | | | | | | |
| impairment losses recognized in other | | | | | | | | | | | | | | | | | | | | | | | | |
| comprehensive income, net of deferred income tax | | | | | | | | | | | | | | | | | | | | | | | | |
| effect of $(3,030) | | | (5,629 | ) | | | | | | | - | | | | | | | | - | | | | | |
| Other net unrealized gains (losses) on investment | | | | | | | | | | | | | | | | | | | | | | | | |
| securities, net of deferred income tax effect of | | | | | | | | | | | | | | | | | | | | | | | | |
| $49,637 – 2009; $(76,831) – 2008; | | | | | | | | | | | | | | | | | | | | | | | | |
| and $(10,925) – 2007 | | | 92,183 | | | | | | | | (142,685 | ) | | | | | | | (20,289 | ) | | | | |
| Total unrealized gains (losses) on investment | | | | | | | | | | | | | | | | | | | | | | | | |
| securities | | | 86,554 | | | | 86,554 | | | | (142,685 | ) | | | (142,685 | ) | | | (20,289 | ) | | | (20,289 | ) |
| Defined benefit pension plans, net of deferred income | | | | | | | | | | | | | | | | | | | | | | | | |
| tax effect of: $2,171 – 2009; $(20,362) – 2008; | | | | | | | | | | | | | | | | | | | | | | | | |
| $3,086 – 2007 | | | 4,032 | | | | 4,032 | | | | (37,814 | ) | | | (37,814 | ) | | | 5,731 | | | | 5,731 | |
| End of year | | | (12,460 | ) | | | | | | | (100,666 | ) | | | | | | | 86,043 | | | | | |
| Comprehensive income (loss) | | | | | | | 126,984 | | | | | | | | (136,741 | ) | | | | | | | 131,940 | |
| | | | | | | | | | | | | | | | | | | | | | | | | |
| Treasury stock: | | | | | | | | | | | | | | | | | | | | | | | | |
| Beginning of year | | | (544,712 | ) | | | | | | | (497,879 | ) | | | | | | | (345,761 | ) | | | | |
| Acquisition of treasury stock | | | | | | | | | | | | | | | | | | | | | | | | |
| (shares: 191,858 – 2009; 2,039,027 – 2008; | | | | | | | | | | | | | | | | | | | | | | | | |
| 6,057,920 – 2007) | | | (3,010 | ) | | | | | | | (46,833 | ) | | | | | | | (152,118 | ) | | | | |
| End of year | | | (547,722 | ) | | | | | | | (544,712 | ) | | | | | | | (497,879 | ) | | | | |
| Total stockholders’ equity | | $ | 1,002,375 | | | | | | | | 890,493 | | | | | | | | 1,076,043 | | | | | |
| Consolidated Statements of Cash Flows | | | | | | | | | |
| December 31, | | Unaudited | |
| ($ in thousands, except share amounts) | | 2009 | | | 2008 | | | 2007 | |
| Operating Activities | | | | | | | | | |
| Net Income | | $ | 36,398 | | | | 43,758 | | | | 146,498 | |
| | | | | | | | | | | | | |
| Adjustments to reconcile net income to net cash provided by operating activities: | | | | | | | | | | | | |
| Depreciation and amortization | | | 28,593 | | | | 28,552 | | | | 29,139 | |
| Loss on disposal of discontinued operations | | | 1,174 | | | | - | | | | - | |
| Stock-based compensation expense | | | 11,036 | | | | 17,215 | | | | 20,992 | |
| Undistributed losses (income) of equity method investments | | | 21,726 | | | | 13,753 | | | | (4,281 | ) |
| Net realized losses (gains) | | | 45,970 | | | | 49,452 | | | | (33,354 | ) |
| Postretirement life curtailment benefit | | | (4,217 | ) | | | - | | | | - | |
| Deferred tax (benefit) expense | | | (9,057 | ) | | | (26,665 | ) | | | 3,214 | |
| Unrealized (gain) loss on trading securities | | | (262 | ) | | | 8,129 | | | | - | |
| Goodwill impairment on discontinued operations | | | 12,214 | | | | 4,000 | | | | - | |
| | | | | | | | | | | | | |
| Changes in assets and liabilities: | | | | | | | | | | | | |
| Increase in reserves for losses and loss expenses, net of reinsurance recoverable | | | | | | | | | | | | |
| on unpaid losses and loss expenses | | | 58,514 | | | | 102,100 | | | | 227,749 | |
| (Decrease) increase in unearned premiums, net of prepaid reinsurance and advance premiums | | | (8,028 | ) | | | (10,766 | ) | | | 38,346 | |
| Decrease (increase) in net federal income tax recoverable | | | 5,339 | | | | (22,092 | ) | | | (3,767 | ) |
| Decrease (increase) in premiums receivable | | | 34,317 | | | | 15,469 | | | | (37,911 | ) |
| (Increase) decrease in deferred policy acquisition costs | | | (6,282 | ) | | | 14,115 | | | | (8,331 | ) |
| Decrease (increase) in interest and dividends due or accrued | | | 1,918 | | | | (431 | ) | | | (1,331 | ) |
| Decrease (increase) in reinsurance recoverable on paid losses and loss expenses | | | 2,105 | | | | 916 | | | | (2,736 | ) |
| Decrease in accrued salaries and benefits | | | (15,020 | ) | | | (3,100 | ) | | | (3,266 | ) |
| Increase (decrease) in accrued insurance expenses | | | 2,240 | | | | (15,880 | ) | | | 6,370 | |
| Purchase of trading securities | | | - | | | | (6,587 | ) | | | - | |
| Sale of trading securities | | | 2,831 | | | | 21,002 | | | | - | |
| Other-net | | | 6,050 | | | | 8,233 | | | | 8,957 | |
| Net adjustments | | | 191,161 | | | | 197,415 | | | | 239,790 | |
| Net cash provided by operating activities | | | 227,559 | | | | 241,173 | | | | 386,288 | |
| | | | | | | | | | | | | |
| Investing Activities | | | | | | | | | | | | |
| Purchase of fixed maturity securities, held-to-maturity | | | (158,827 | ) | | | - | | | | - | |
| Purchase of fixed maturity securities, available-for-sale | | | (1,041,277 | ) | | | (587,430 | ) | | | (580,864 | ) |
| Purchase of equity securities, available-for-sale | | | (79,455 | ) | | | (70,651 | ) | | | (148,569 | ) |
| Purchase of other investments | | | (16,298 | ) | | | (53,089 | ) | | | (80,147 | ) |
| Purchase of short-term investments | | | (1,956,164 | ) | | | (2,204,107 | ) | | | (2,198,362 | ) |
| Sale of subsidiary | | | (12,538 | ) | | | - | | | | - | |
| Sale of fixed maturity securities, held-to-maturity | | | 5,820 | | | | - | | | | - | |
| Sale of fixed maturity securities, available-for-sale | | | 538,769 | | | | 152,655 | | | | 102,613 | |
| Sale of short-term investments | | | 1,940,427 | | | | 2,196,162 | | | | 2,205,194 | |
| Redemption and maturities of fixed maturity securities, held-to-maturity | | | 282,310 | | | | 4,652 | | | | 4,051 | |
| Redemption and maturities of fixed maturity securities, available-for-sale | | | 122,403 | | | | 294,342 | | | | 319,118 | |
| Sale of equity securities, available-for-sale | | | 137,244 | | | | 102,313 | | | | 187,259 | |
| Proceeds from other investments | | | 25,596 | | | | 26,164 | | | | 40,115 | |
| Purchase of property and equipment | | | (8,207 | ) | | | (8,083 | ) | | | (14,511 | ) |
| Net cash used in investment activities | | | (220,197 | ) | | | (147,072 | ) | | | (164,103 | ) |
| | | | | | | | | | | | | |
| Financing Activities | | | | | | | | | | | | |
| Dividends to stockholders | | | (26,296 | ) | | | (25,804 | ) | | | (24,464 | ) |
| Acquisition of treasury stock | | | (3,010 | ) | | | (46,833 | ) | | | (152,118 | ) |
| Principal payment of notes payable | | | (12,300 | ) | | | (12,300 | ) | | | (18,300 | ) |
| Proceeds from borrowings | | | 13,000 | | | | - | | | | - | |
| Net proceeds from stock purchase and compensation plans | | | 4,612 | | | | 8,222 | | | | 8,609 | |
| Excess tax benefits from share-based payment arrangements | | | (1,200 | ) | | | 1,628 | | | | 3,484 | |
| Borrowings under line of credit agreement | | | - | | | | - | | | | 6,000 | |
| Repayment of borrowings under line of credit agreement | | | - | | | | - | | | | (6,000 | ) |
| Principal payments of convertible bonds | | | - | | | | (8,754 | ) | | | (37,456 | ) |
| Net cash used in financing activities | | | (25,194 | ) | | | (83,841 | ) | | | (220,245 | ) |
| Net (decrease) increase in cash and cash equivalents | | | (17,832 | ) | | | 10,260 | | | | 1,940 | |
| Net (decrease) increase in cash and cash equivalents from discontinued operations | | | (15,037 | ) | | | 8,619 | | | | 921 | |
| Net (decrease) increase in cash from continuing operations | | | (2,795 | ) | | | 1,641 | | | | 1,019 | |
| Cash from continuing operations, beginning of year | | | 3,606 | | | | 1,965 | | | | 946 | |
| Cash from continuing operations, end of year | | $ | 811 | | | | 3,606 | | | | 1,965 | |
Combined Insurance Company Subsidiaries
Unaudited Statutory Balance Sheets
($ in thousands)
| | | Dec-31 | | | * Dec-31 | |
| | | 2009 | | | 2008 | |
| | | | | | | |
| ASSETS | | | | | | |
| Bonds | | $ | 3,289,336 | | | | 3,104,395 | |
| Common stocks | | | 80,264 | | | | 134,700 | |
| Affiliated mortgage loan | | | 39,408 | | | | 40,000 | |
| Other investments | | | 176,983 | | | | 172,346 | |
| Short-term investments | | | 165,957 | | | | 137,878 | |
| Total investments | | | 3,751,948 | | | | 3,589,319 | |
| | | | | | | | | |
| Cash on hand and in banks | | | (29,128 | ) | | | (36,472 | ) |
| Interest and dividends due and accrued | | | 34,808 | | | | 36,523 | |
| Premiums receivable | | | 443,223 | | | | 476,768 | |
| Reinsurance recoverable on paid losses and expenses | | | 4,408 | | | | 6,513 | |
| Federal income tax recoverable | | | 1,608 | | | | 12,069 | |
| Deferred tax recoverable | | | 119,377 | | | | 86,208 | |
| EDP equipment | | | 2,134 | | | | 3,815 | |
| Equities and deposits in pools and associations | | | 4,886 | | | | 8,517 | |
| Receivable for sold securities | | | 19,655 | | | | 13,278 | |
| Other assets | | | 29,748 | | | | 28,719 | |
| Total assets | | $ | 4,382,667 | | | | 4,225,257 | |
| | | | | | | | | |
| LIABILITIES | | | | | | | | |
| Reserve for losses | | $ | 2,072,376 | | | | 2,031,947 | |
| Reinsurance payable on paid loss and loss expense | | | 1,011 | | | | 716 | |
| Reserve for loss expenses | | | 399,457 | | | | 382,796 | |
| Unearned premiums | | | 739,325 | | | | 747,717 | |
| Reserve for commissions payable | | | 49,237 | | | | 48,560 | |
| Ceded balances payable | | | 9,856 | | | | 8,421 | |
| Premium and other taxes payable | | | 22,283 | | | | 20,721 | |
| Borrowed money | | | 13,016 | | | | - | |
| Reserve for dividends to policyholders | | | 3,718 | | | | 5,023 | |
| Reserves for unauthorized reinsurance | | | 1,013 | | | | 1,416 | |
| Funds withheld on account of others | | | 6,261 | | | | 4,977 | |
| Accrued salaries and benefits | | | 66,847 | | | | 74,287 | |
| Other liabilities | | | 16,330 | | | | 14,245 | |
| Total liabilities | | | 3,400,730 | | | | 3,340,826 | |
| | | | | | | | | |
| POLICYHOLDERS' SURPLUS | | | | | | | | |
| Capital | | | 28,325 | | | | 28,325 | |
| Aggregate write-ins for special surplus funds | | | 33,951 | | | | - | |
| Paid in surplus | | | 255,792 | | | | 235,792 | |
| Unassigned surplus | | | 663,869 | | | | 620,314 | |
| Total policyholders' surplus | | | 981,937 | | | | 884,431 | |
| Total liabilities and policyholders' surplus | | $ | 4,382,667 | | | | 4,225,257 | |
*December 31, 2008 results include a retroactive affiliate transaction involving SICA, SIGI, and Wantage Avenue Holding Company.
Selective Insurance Group, Inc.
Combined Insurance Company Subsidiaries
Unaudited Statutory Statements Of Income
($ in thousands)
| | | Three Months Ended | | | | | | Twelve Months Ended | | | | |
| | | December | | | | | | December | | | | |
| | | | | | | | | | | | | | | | | | | | | | | | | |
| | | 2009 | | | | | | 2008 | | | | | | 2009 | | | | | | 2008 | | | | |
| | | | | | | | | | | | | | | | | | | | | | | | | |
UNDERWRITING | | | | | | | | | | | | | | | | | | | | | | | | |
| Net premiums written | | $ | 304,891 | | | | | | | 308,651 | | | | | | | 1,422,655 | | | | | | | 1,492,938 | | | | |
| | | | | | | | | | | | | | | | | | | | | | | | | | | | | |
| Net premiums earned | | | 352,957 | | | | | | | 368,839 | | | | | | | 1,431,047 | | | | | | | 1,504,386 | | | | |
| | | | | | | | | | | | | | | | | | | | | | | | | | | | | |
| Net losses paid | | | 185,896 | | | | | | | 199,130 | | | | | | | 757,916 | | | | | | | 768,165 | | | | |
| Change in reserve for losses | | | 10,559 | | | | | | | 11,670 | | | | | | | 40,428 | | | | | | | 77,988 | | | | |
| Net losses incurred | | | 196,455 | | | | 55.7 | % | | | 210,800 | | | | 57.2 | % | | | 798,344 | | | | 55.8 | % | | | 846,153 | | | | 56.2 | % |
| Net loss expenses paid | | | 40,841 | | | | | | | | 36,095 | | | | | | | | 157,034 | | | | | | | | 140,877 | | | | | |
| Change in reserve for loss expenses | | | 1,595 | | | | | | | | 4,512 | | | | | | | | 16,662 | | | | | | | | 24,670 | | | | | |
| Net loss expenses incurred | | | 42,436 | | | | 12.0 | % | | | 40,607 | | | | 11.0 | % | | | 173,696 | | | | 12.1 | % | | | 165,547 | | | | 11.0 | % |
| Net underwriting expenses incurred | | | 110,432 | | | | 36.2 | % | | | 103,189 | | | | 33.4 | % | | | 465,723 | | | | 32.7 | % | | | 470,362 | | | | 31.6 | % |
| Total deductions | | | 349,323 | | | | | | | | 354,596 | | | | | | | | 1,437,763 | | | | | | | | 1,482,062 | | | | | |
| Statutory underwriting (loss) gain | | | 3,634 | | | | | | | | 14,243 | | | | | | | | (6,716 | ) | | | | | | | 22,324 | | | | | |
| | | | | | | | | | | | | | | | | | | | | | | | | | | | | | | | | |
| Net loss from premium balances charged off | | | (1,044 | ) | | | | | | | (1,440 | ) | | | | | | | (4,490 | ) | | | | | | | (3,876 | ) | | | | |
| Finance charges and other income | | | 2,735 | | | | | | | | (426 | ) | | | | | | | 10,455 | | | | | | | | 2,610 | | | | | |
| Total other income (expense) | | | 1,691 | | | | -0.6 | % | | | (1,866 | ) | | | 0.6 | % | | | 5,965 | | | | -0.4 | % | | | (1,266 | ) | | | 0.1 | % |
| Policyholders' dividends incurred | | | (1,372 | ) | | | 0.4 | % | | | (1,946 | ) | | | 0.5 | % | | | (3,640 | ) | | | 0.3 | % | | | (5,211 | ) | | | 0.3 | % |
| Total underwriting (loss) gain | | | 3,953 | | | | 103.7 | % | | | 10,431 | | | | 102.7 | % | | | (4,391 | ) | | | 100.5 | % | | | 15,847 | | | | 99.2 | % |
| | | | | | | | | | | | | | | | | | | | | | | | | | | | | | | | | |
INVESTMENT | | | | | | | | | | | | | | | | | | | | | | | | | | | | | | | | |
| Net investment income earned | | | 37,329 | | | | | | | | 32,886 | | | | | | | | 133,309 | | | | | | | | 156,336 | | | | | |
| Net realized (loss) gain | | | 2,337 | | | | | | | | (18,979 | ) | | | | | | | (39,055 | ) | | | | | | | (32,939 | ) | | | | |
| Total income before income tax | | | 43,619 | | | | | | | | 24,338 | | | | | | | | 89,863 | | | | | | | | 139,244 | | | | | |
| Federal income tax expense (benefit) | | | 2,653 | | | | | | | | (9,996 | ) | | | | | | | 20,015 | | | | | | | | 34,898 | | | | | |
| | | | | | | | | | | | | | | | | | | | | | | | | | | | | | | | | |
| Net income | | $ | 40,966 | | | | | | | | 34,334 | | | | | | | | 69,848 | | | | | | | | 104,346 | | | | | |
| | | | | | | | | | | | | | | | | | | | | | | | | | | | | | | | | |
| Policyholders' Surplus | | | | | | | | | | | | | | | | | | | | | | | | | | | | | | | | |
| Surplus, beginning of period | | $ | 903,488 | | | | | | | | 932,846 | | | | | | | | 884,431 | | | | | | | | 1,034,294 | | | | | |
| | | | | | | | | | | | | | | | | | | | | | | | | | | | | | | | | |
| Net income | | | 40,966 | | | | | | | | 34,334 | | | | | | | | 69,848 | | | | | | | | 104,346 | | | | | |
| Change in deferred tax | | | (10,666 | ) | | | | | | | (8,410 | ) | | | | | | | 3,972 | | | | | | | | 10,949 | | | | | |
| Change in unrealized gains (losses) | | | 33 | | | | | | | | (35,535 | ) | | | | | | | (11,212 | ) | | | | | | | (97,931 | ) | | | | |
| Dividends to stockholders | | | - | | | | | | | | - | | | | | | | | (24,518 | ) | | | | | | | (77,045 | ) | | | | |
| Paid in surplus | | | - | | | | | | | | - | | | | | | | | 20,000 | | | | | | | | - | | | | | |
| Change in cum. effect of acctg principle | | | - | | | | | | | | - | | | | | | | | 2,540 | | | | | | | | - | | | | | |
| Change in reserve for unauthorized | | | 404 | | | | | | | | (159 | ) | | | | | | | 404 | | | | | | | | (159 | ) | | | | |
| Change in non-admitted assets | | | 11,016 | | | | | | | | (10,447 | ) | | | | | | | (283 | ) | | | | | | | (61,548 | ) | | | | |
| Change in additional admitted deferred tax | | | 33,951 | | | | | | | | - | | | | | | | | 33,951 | | | | | | | | - | | | | | |
| Change in minimum pension liability | | | 3,512 | | | | | | | | (28,748 | ) | | | | | | | 3,512 | | | | | | | | (28,748 | ) | | | | |
| Surplus adjustments | | | (767 | ) | | | | | | | 550 | | | | | | | | (708 | ) | | | | | | | 273 | | | | | |
| | | | | | | | | | | | | | | | | | | | | | | | | | | | | | | | | |
| Net change in surplus for period | | | 78,449 | | | | | | | | (48,415 | ) | | | | | | | 97,506 | | | | | | | | (149,863 | ) | | | | |
| | | | | | | | | | | | | | | | | | | | | | | | | | | | | | | | | |
| Surplus, end of period | | $ | 981,937 | | | | | | | | 884,431 | | | | | | | | 981,937 | | | | | | | | 884,431 | | | | | |
| | | | | | | | | | | | | | | | | | | | | | | | | | | | | | | | | |
| Statutory underwriting (loss) gain: | | $ | 3,953 | | | | | | | | 10,431 | | | | | | | | (4,391 | ) | | | | | | | 15,847 | | | | | |
| | | | | | | | | | | | | | | | | | | | | | | | | | | | | | | | | |
Adjustments under GAAP: | | | | | | | | | | | | | | | | | | | | | | | | | | | | | | | | |
| Deferred policy acquisition costs | | | (5,093 | ) | | | | | | | (11,785 | ) | | | | | | | 6,283 | | | | | | | | (14,116 | ) | | | | |
| Other, net | | | 598 | | | | | | | | (53 | ) | | | | | | | 493 | | | | | | | | (1,599 | ) | | | | |
| GAAP underwriting (loss) gain | | $ | (542 | ) | | | | | | | (1,407 | ) | | | | | | | 2,385 | | | | | | | | 132 | | | | | |
Note: Some amounts or ratios may not foot due to rounding.
Certain amounts have been reclassified to conform to the current year's presentation.
Selective Insurance Group, Inc. and Consolidated Subsidiaries
Alternative Investments
as of December 31, 2009
(unaudited)
| | | Inception | | Current | | | | | | Invest. | | | 4th QTR | | | YTD | | | Remaining | |
Fund | | Year | | Market Value | | | Cost | | | Multiple(1) | | | Income | | | Income | | | Commitment | |
Real Estate | | | | | | | | | | | | | | | | | | | | |
| LEH RE II | | 2005 | | $ | 9,381,351 | | | $ | 12,011,057 | | | | 0.86 | | | $ | (1,340,909 | ) | | $ | (6,071,286 | ) | | $ | 4,020,851 | |
| GS Whitehall 2007 | | 2007 | | $ | 4,150,885 | | | $ | 14,250,000 | | | | 0.29 | | | $ | (135,683 | ) | | $ | (4,396,536 | ) | | $ | 750,000 | |
LEH RE III | | 2008 | | $ | 3,323,525 | | | $ | 6,227,933 | | | | 0.53 | | | $ | (239,446 | ) | | $ | (1,870,237 | ) | | $ | 8,772,067 | |
Total - Real Estate | | | | $ | 16,855,761 | | | $ | 32,488,990 | | | | | | | $ | (1,716,038 | ) | | $ | (12,338,059 | ) | | $ | 13,542,918 | |
Mezzanine Financing | | | | | | | | | | | | | | | | | | | | | | | | | | |
| GS Mezz III | | 2003 | | $ | 3,525,552 | | | $ | 2,403,021 | | | | 1.11 | | | $ | 26,240 | | | $ | (822,879 | ) | | $ | 5,637,326 | |
| LEH Euro Mezz | | 2004 | | $ | 3,310,945 | | | $ | 1,666,328 | | | | 1.13 | | | $ | 223,551 | | | $ | (190,157 | ) | | $ | - | |
| GS Mezz 2006 | | 2006 | | $ | 5,734,349 | | | $ | 9,224,574 | | | | 0.69 | | | $ | 1,570,729 | | | $ | (1,484,828 | ) | | $ | 5,228,783 | |
GS Mezz V | | 2007 | | $ | 7,752,553 | | | $ | 7,094,103 | | | | 1.08 | | | $ | 851,060 | | | $ | 1,022,500 | | | $ | 17,752,669 | |
Total - Mezz. Financing | | | | $ | 20,323,399 | | | $ | 20,388,026 | | | | | | | $ | 2,671,580 | | | $ | (1,475,364 | ) | | $ | 28,618,778 | |
Distressed Debt | | | | | | | | | | | | | | | | | | | | | | | | | | |
| Varde LP | | 1997 | | $ | - | | | $ | - | | | | - | | | $ | (168,089 | ) | | $ | 545,094 | | | $ | - | |
| Varde VIII | | 2006 | | $ | 11,777,125 | | | $ | 10,000,000 | | | | 1.18 | | | $ | 286,343 | | | $ | 1,413,166 | | | $ | - | |
GS Distressed Opp III | | 2007 | | $ | 7,423,866 | | | $ | 10,000,056 | | | | 0.75 | | | $ | 1,146,875 | | | $ | (997,002 | ) | | $ | 4,610,862 | |
Total - Distressed Debt | | | | $ | 19,200,991 | | | $ | 20,000,056 | | | | | | | $ | 1,265,129 | | | $ | 961,258 | | | $ | 4,610,862 | |
Private Equity | | | | | | | | | | | | | | | | | | | | | | | | | | |
| Prospector | | 1997 | | $ | 1,778,445 | | | $ | 1,778,000 | | | | 2.89 | | | $ | 931 | | | $ | 476 | | | $ | - | |
| Trilantic Capital Partners III | | 2004 | | $ | 7,328,103 | | | $ | 3,722,215 | | | | 1.39 | | | $ | 120,731 | | | $ | (98,586 | ) | | $ | 1,073,616 | |
| NB Co-Invest | | 2006 | | $ | 7,522,231 | | | $ | 8,080,716 | | | | 0.95 | | | $ | 531,365 | | | $ | (1,751,256 | ) | | $ | 4,504,351 | |
| GS PEP Asia | | 2007 | | $ | 1,212,898 | | | $ | 1,542,716 | | | | 0.79 | | | $ | 56,843 | | | $ | (141,791 | ) | | $ | 5,454,989 | |
Trilantic Capital Partners IV | | 2007 | | $ | 3,683,090 | | | $ | 4,165,840 | | | | 0.88 | | | $ | 162,148 | | | $ | (79,787 | ) | | $ | 6,932,511 | |
Total - Private Equity | | | | $ | 21,524,768 | | | $ | 19,289,488 | | | | | | | $ | 872,017 | | | $ | (2,070,944 | ) | | $ | 17,965,468 | |
Private Equity, Secondary Market | | | | | | | | | | | | | | | | | | | | | | | | |
| NB SOF | | 2005 | | $ | 7,139,892 | | | $ | 6,382,035 | | | | 1.07 | | | $ | 232,366 | | | $ | (1,284,329 | ) | | $ | 899,494 | |
| GS Vintage IV | | 2007 | | $ | 9,201,938 | | | $ | 11,994,286 | | | | 0.79 | | | $ | 224,544 | | | $ | (3,366,254 | ) | | $ | 6,781,085 | |
| NB SOF II | | 2008 | | $ | 2,561,197 | | | $ | 2,289,234 | | | | 1.11 | | | $ | 67,971 | | | $ | 315,698 | | | $ | 9,623,752 | |
GS Vintage V | | 2008 | | $ | 2,032,875 | | | $ | 2,200,000 | | | | 0.92 | | | $ | 75,714 | | | $ | (176,988 | ) | | $ | 7,800,000 | |
Total - Pvt. Eq. Sec. Mkt. | | | | $ | 20,935,902 | | | $ | 22,865,554 | | | | | | | $ | 600,595 | | | $ | (4,511,873 | ) | | $ | 25,104,331 | |
Energy/Power Generation | | | | | | | | | | | | | | | | | | | | | | | | | | |
| ArcLight I | | 2002 | | $ | 1,441,516 | | | $ | 1,441,516 | | | | 1.74 | | | $ | 501,723 | | | $ | (1,139,962 | ) | | $ | 1,655,505 | |
| ArcLight II | | 2003 | | $ | 7,014,467 | | | $ | 1,639,149 | | | | 1.28 | | | $ | 271,057 | | | $ | (852,108 | ) | | $ | 2,295,492 | |
| ArcLight III | | 2006 | | $ | 12,453,803 | | | $ | 11,816,880 | | | | 1.04 | | | $ | 160,429 | | | $ | 436,623 | | | $ | 1,681,702 | |
| Quintana Energy | | 2006 | | $ | 6,523,861 | | | $ | 7,558,234 | | | | 0.86 | | | $ | 164,989 | | | $ | (359,162 | ) | | $ | 2,441,766 | |
| ArcLight IV | | 2007 | | $ | 5,561,960 | | | $ | 5,712,041 | | | | 0.98 | | | $ | 100,424 | | | $ | 148,674 | | | $ | 2,939,591 | |
Total - Energy/Power Generation | | $ | 32,995,607 | | | $ | 28,167,820 | | | | | | | $ | 1,198,622 | | | $ | (1,765,935 | ) | | $ | 11,014,056 | |
Venture Capital | | | | | | | | | | | | | | | | | | | | | | | | | | |
Venture V | | 2001 | | $ | 5,752,309 | | | $ | 6,273,978 | | | | 0.93 | | | $ | 127,019 | | | $ | (524,587 | ) | | $ | 2,000,000 | |
Total - Venture Capital | | | | $ | 5,752,309 | | | $ | 6,273,978 | | | | | | | $ | 127,019 | | | $ | (524,587 | ) | | $ | 2,000,000 | |
TOTAL - ALTERNATIVE INVESTMENTS | | | | $ | 137,588,736 | | | $ | 149,473,913 | | | | | | | $ | 5,018,925 | | | $ | (21,725,504 | ) | | $ | 102,856,413 | |
(1) Market value + capital returned divided by capital called
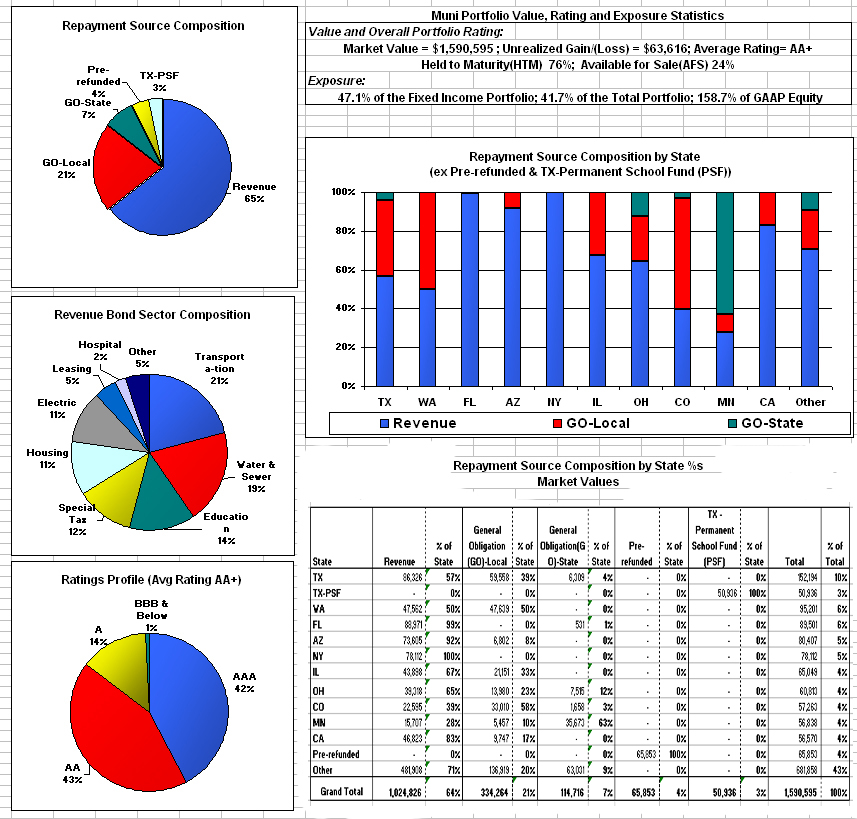
Selective Insurance Group, Inc. and Consolidated Subsidiaries
Municipal Bond Portfolio
State and Repayment Source Composition
December 31, 2009
($s in thousands)
(unaudited)
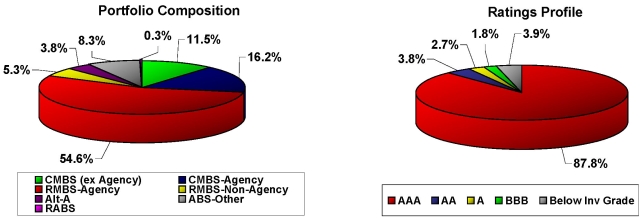
Selective Insurance Group, Inc. and Consolidated Subsidiaries
Structured Securities
December 31, 2009
($ in thousands)
(unaudited)
| | •Market Value = $676,811 ; Unrealized Gain/(Loss) = ($29,838) |
| | •Held to Maturity (HTM) 41%; Available for Sale (AFS) 59% |
| | •Structured Security Portfolio Average Rating = AA+ |
| | •Structured Securities = 17.8% of the Total Portfolio |
Ratings Migration (1)
December 31, 2009
Original Rating | | | Current Rating | | | Downgraded | |
Rating | | Amount | | | AAA | | | AA | | | A | | | BBB | | | Below In v Grade | | | $ | | | | % | |
| AAA | | | 657,384 | | | | 577,504 | | | | 13,460 | | | | 13,670 | | | | 23,751 | | | | 28,999 | | | | 79,880 | | | | 12.2 | % |
| AA | | | 36,238 | | | | 5,000 | | | | 14,845 | | | | | | | | 242 | | | | 16,151 | | | | 16,393 | | | | 45.2 | % |
| A | | | 13,436 | | | | | | | | | | | | 10,000 | | | | | | | | 3,436 | | | | 3,436 | | | | 25.6 | % |
| BBB | | | 25,156 | | | | | | | | | | | | | | | | 7,000 | | | | 18,156 | | | | 18,156 | | | | 72.2 | % |
| Below Inv Grade | | | 5,000 | | | | | | | | | | | | | | | | | | | | 5,000 | | | | - | | | | 0.0 | % |
| Total Par Value | | | 737,214 | | | | 582,504 | | | | 28,305 | | | | 23,670 | | | | 30,993 | | | | 71,742 | | | | 117,865 | | | | 16.0 | % |
Note (1): Migration period is from the purchase date of each security to Decemeber 31, 2009
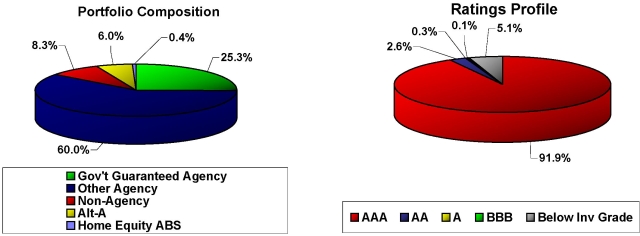
Selective Insurance Group, Inc. and Consolidated Subsidiaries
Residential Mortgage Backed (RMBS) and Residential ABS (RABS) Securities
December 31, 2009
($ in thousands)
(unaudited)
| | •Market Value = $433,191; Unrealized Gain/(Loss) = ($14,436) |
| | •Held to Maturity (HTM) 35%; Available for Sale (AFS) 65% |
| | •RMBS & RABS Portfolio Average Rating = AA+ |
| | •RMBS & RABS Securities = 11.4% of the Total Portfolio |
Ratings Migration (1)
December 31, 2009
Original Rating | | | Current Rating | | | Downgraded | |
Rating | | Amount | | | AAA | | | AA | | | A | | | BBB | | | Below Inv Grade | | | $ | | | % | |
| AAA | | | 442,283 | | | | 391,495 | | | | 13,460 | | | | 1,287 | | | | 988 | | | | 35,053 | | | | 50,788 | | | | 11.5 | % |
| AA | | | 3,889 | | | | | | | | | | | | | | | | 242 | | | | 3,647 | | | | 3,889 | | | | 100.0 | % |
| A | | | 3,436 | | | | | | | | | | | | | | | | | | | | 3,436 | | | | 3,436 | | | | 100.0 | % |
| BBB | | | 1,406 | | | | | | | | | | | | | | | | | | | | 1,406 | | | | 1,406 | | | | 100.0 | % |
| Total Par Value | | | 451,014 | | | | 391,495 | | | | 13,460 | | | | 1,287 | | | | 1,230 | | | | 43,542 | | | | 59,519 | | | | 13.2 | % |
Note (1): Migration period is from the purchase date of each security to December 31, 2009
Residential Mortgage Backed Securities (RMBS) and Residential ABS (RABS) - by Vintage Year
December 31, 2009
($ in thousands)
(unaudited)
Market Value
| Vintage Yr | | AAA | | | AA | | | | A | | | BBB | | | Below Investment Grade | | | Total | | | % of Total RMBS & RABS | | | % of Total Fixed Income Portfolio | | | % of Total GAAP Equity | |
| 1983 | | $ | 8 | | | $ | - | | | $ | - | | | $ | - | | | $ | - | | | $ | 8 | | | | 0 | % | | | 0 | % | | | 0 | % |
| 2002 | | | 44,997 | | | | - | | | | - | | | | 809 | | | | 1,105 | | | | 46,912 | | | | 11 | % | | | 1 | % | | | 5 | % |
| 2003 | | | 40,736 | | | | - | | | | - | | | | - | | | | 763 | | | | 41,499 | | | | 10 | % | | | 1 | % | | | 4 | % |
| 2004 | | | 51,317 | | | | 3,076 | | | | - | | | | - | | | | - | | | | 54,393 | | | | 13 | % | | | 2 | % | | | 5 | % |
| 2005 | | | 32,224 | | | | 8,446 | | | | 655 | | | | - | | | | - | | | | 41,325 | | | | 10 | % | | | 1 | % | | | 4 | % |
| 2006 | | | 32,872 | | | | - | | | | - | | | | - | | | | 18,463 | | | | 51,335 | | | | 12 | % | | | 2 | % | | | 5 | % |
| 2007 | | | 7,733 | | | | - | | | | - | | | | - | | | | 1,727 | | | | 9,460 | | | | 1 | % | | | 0 | % | | | 1 | % |
| 2008 | | | 38,584 | | | | - | | | | - | | | | - | | | | - | | | | 38,584 | | | | 9 | % | | | 1 | % | | | 4 | % |
| 2009 | | | 149,675 | | | | - | | | | - | | | | - | | | | - | | | | 149,675 | | | | 34 | % | | | 5 | % | | | 15 | % |
Total RMBS & RABS-Market Value | | $ | 398,147 | | | $ | 11,522 | | | $ | 655 | | | $ | 809 | | | $ | 22,057 | | | $ | 433,191 | | | | 100 | % | | | 13 | % | | | 43 | % |
| % of Total RMBS & RABS | | | 92 | % | | | 3 | % | | | 0 | % | | | 0 | % | | | 5 | % | | | 100 | % | | | | | | | | | | | | |
| % of Total Fixed Income Portfolio | | | 12 | % | | | 0 | % | | | 0 | % | | | 0 | % | | | 1 | % | | | 13 | % | | | | | | | | | | | | |
| % of Total GAAP Equity | | | 40 | % | | | 1 | % | | | 0 | % | | | 0 | % | | | 2 | % | | | 43 | % | | | | | | | | | | | | |
| Weighted Average Market Price | | | 101.7 | | | | 85.6 | | | | 50.9 | | | | 65.8 | | | | 50.7 | | | | 96.0 | | | | | | | | | | | | | |
Unrealized/Unrecognized Gain/(Loss)
| Vintage Yr | | AAA | | | AA | | | | A | | | BBB | | | Below Investment Grade | | | Total | | |
| 1983 | | $ | - | | | $ | - | | | $ | - | | | $ | - | | | $ | - | | | $ | - | | |
| 2002 | | | 1,418 | | | | - | | | | - | | | | (428 | ) | | | (357 | ) | | | 633 | | |
| 2003 | | | 612 | | | | - | | | | - | | | | - | | | | (1,246 | ) | | | (634 | ) | |
| 2004 | | | (209 | ) | | | (388 | ) | | | - | | | | - | | | | - | | | | (597 | ) | |
| 2005 | | | (3,229 | ) | | | (1,470 | ) | | | (632 | ) | | | - | | | | - | | | | (5,332 | ) | |
| 2006 | | | 661 | | | | - | | | | - | | | | - | | | | (7,695 | ) | | | (7,034 | ) | |
| 2007 | | | 128 | | | | - | | | | - | | | | - | | | | (3,045 | ) | | | (2,916 | ) | |
| 2008 | | | 482 | | | | - | | | | - | | | | - | | | | - | | | | 482 | | |
| 2009 | | | 963 | | | | - | | | | - | | | | - | | | | - | | | | 963 | | |
Total RMBS & RABS -
Unrealized/Unrecognized | | $ | 826 | | | $ | (1,858 | ) | | $ | (632 | ) | | $ | (428 | ) | | $ | (12,343 | ) | | $ | (14,436 | ) | |
Note: Some amounts may not foot due to rounding.
Selective Insurance Group Inc. and Consolidated Subsidiaries
Residential Mortgage Backed Securities (RMBS) and Residential ABS (RABS) - by Type
December 31, 2009
($ in thousands)
(unaudited)
Market Value
| RMBS Type | | AAA | | | AA | | | | A | | | BBB | | | Below Investment Grade | | | Total | | | % of Total RMBS & RABS | | | % of Total Fixed Income Portfolio | | | % of Total GAAP Equity | |
| Gov't Guaranteed Agency | | $ | 109,481 | | | $ | - | | | $ | - | | | $ | - | | | $ | - | | | $ | 109,481 | | | | 25 | % | | | 3 | % | | | 11 | % |
| Other Agency | | | 259,964 | | | | - | | | | - | | | | - | | | | - | | | | 259,964 | | | | 60 | % | | | 8 | % | | | 26 | % |
| Total Agency | | | 369,445 | | | | - | | | | - | | | | - | | | | - | | | | 369,445 | | | | 85 | % | | | 11 | % | | | 37 | % |
| Alt-A | | | 13,388 | | | | 1,317 | | | | - | | | | - | | | | 9,403 | | | | 24,108 | | | | 6 | % | | | 1 | % | | | 2 | % |
| Alt-A CDO | | | - | | | | - | | | | - | | | | - | | | | 1,774 | | | | 1,774 | | | | 0 | % | | | 0 | % | | | 0 | % |
| Home Equity ABS | | | - | | | | - | | | | - | | | | 715 | | | | 1,105 | | | | 1,820 | | | | 0 | % | | | 0 | % | | | 0 | % |
| Non-Agency & Other Prime | | | 15,314 | | | | 10,206 | | | | 655 | | | | 95 | | | | 9,775 | | | | 36,044 | | | | 9 | % | | | 1 | % | | | 4 | % |
Total RMBS & RABS-Market Value | | $ | 398,147 | | | $ | 11,522 | | | $ | 655 | | | $ | 809 | | | $ | 22,057 | | | $ | 433,191 | | | | 100 | % | | | 13 | % | | | 43 | % |
| % of Total RMBS & RABS | | | 92 | % | | | 3 | % | | | 0 | % | | | 0 | % | | | 5 | % | | | 100 | % | | | | | | | | | | | | |
| % of Total Fixed Income Portfolio | | | 12 | % | | | 0 | % | | | 0 | % | | | 0 | % | | | 1 | % | | | 13 | % | | | | | | | | | | | | |
| % of Total GAAP Equity | | | 40 | % | | | 1 | % | | | 0 | % | | | 0 | % | | | 2 | % | | | 43 | % | | | | | | | | | | | | |
| Weighted Average Market Price | | | 101.7 | | | | 85.6 | | | | 50.9 | | | | 65.8 | | | | 50.7 | | | | 96.0 | | | | | | | | | | | | | |
Unrealized/Unrecognized Gain/(Loss)
| RMBS Type | | AAA | | | AA | | | | A | | | BBB | | | Below Investment Grade | | | Total | | |
| Gov't Guaranteed Agency | | $ | 241 | | | $ | - | | | $ | - | | | $ | - | | | $ | - | | | $ | 241 | | |
| Other Agency | | | 6,848 | | | | - | | | | - | | | | - | | | | - | | | | 6,848 | | |
| Total Agency | | | 7,089 | | | | - | | | | - | | | | - | | | | - | | | | 7,089 | | |
| Alt-A | | | (2,240 | ) | | | (230 | ) | | | - | | | | - | | | | (4,942 | ) | | | (7,412 | ) | |
| Alt-A CDO | | | - | | | | - | | | | - | | | | - | | | | 266 | | | | 266 | | |
| Home Equity ABS | | | - | | | | - | | | | - | | | | (281 | ) | | | (357 | ) | | | (637 | ) | |
| Non-Agency & Other Prime | | | (4,023 | ) | | | (1,629 | ) | | | (632 | ) | | | (148 | ) | | | (7,310 | ) | | | (13,742 | ) | |
Total RMBS & RABS -
Unrealized/Unrecognized | | $ | 826 | | | $ | (1,858 | ) | | $ | (632 | ) | | $ | (428 | ) | | $ | (12,343 | ) | | $ | (14,436 | ) | |
Note: Some amounts may not foot due to rounding.
ALT-A by Vintage Year
December 31, 2009
($ in thousands)
(unaudited)
Market Value
| Vintage Yr | | ALT-A Fixed-15 | | | Alt-A Fixed-30 | | | Alt-A Hybrid ARM | | | Alt-A CDO | | | Total | | | % of Total Alt-A | | | % of Total Fixed Income Portfolio | | | % of Total GAAP Equity | |
| 2002 | | $ | 4,335 | | | $ | - | | | $ | - | | | $ | - | | | $ | 4,335 | | | | 17 | % | | | 0 | % | | | 1 | % |
| 2003 | | | - | | | | 1,481 | | | | 412 | | | | - | | | | 1,893 | | | | 7 | % | | | 0 | % | | | 0 | % |
| 2004 | | | - | | | | 1,284 | | | | 1,437 | | | | - | | | | 2,721 | | | | 11 | % | | | 0 | % | | | 0 | % |
| 2005 | | | - | | | | 2,903 | | | | 2,853 | | | | - | | | | 5,756 | | | | 22 | % | | | 0 | % | | | 1 | % |
| 2006 | | | - | | | | 6,969 | | | | 2,433 | | | | 1,774 | | | | 11,177 | | | | 43 | % | | | 1 | % | | | 1 | % |
| Total ALT-A, Market Value | | $ | 4,335 | | | $ | 12,637 | | | $ | 7,135 | | | $ | 1,774 | | | $ | 25,882 | | | | 100 | % | | | 1 | % | | | 3 | % |
| % of Total ALT-A | | | 17 | % | | | 48 | % | | | 28 | % | | | 7 | % | | | 100 | % | | | | | | | | | | | | |
| % of Total Fixed Income Portfolio | | | 0 | % | | | 1 | % | | | 0 | % | | | 0 | % | | | 1 | % | | | | | | | | | | | | |
| % of Total GAAP Equity | | | 1 | % | | | 1 | % | | | 1 | % | | | 0 | % | | | 3 | % | | | | | | | | | | | | |
| Weighted Average Market Price | | | 96.4 | | | | 76.4 | | | | 67.5 | | | | 20.0 | | | | 63.9 | | | | | | | | | | | | | |
Unrealized/Unrecognized Gain/(Loss)
| Vintage Yr | | ALT-A Fixed-15 | | | Alt-A Fixed-30 | | | Alt-A Hybrid ARM | | | Alt-A CDO | | | Total | | |
| 2002 | | $ | (160 | ) | | $ | - | | | $ | - | | | $ | - | | | $ | (160 | ) | |
| 2003 | | | - | | | | (319 | ) | | | (48 | ) | | | - | | | | (367 | ) | |
| 2004 | | | - | | | | (59 | ) | | | (273 | ) | | | - | | | | (332 | ) | |
| 2005 | | | - | | | | (462 | ) | | | (1,150 | ) | | | - | | | | (1,612 | ) | |
| 2006 | | | - | | | | (3,031 | ) | | | (1,911 | ) | | | 266 | | | | (4,676 | ) | |
| Total ALT-A, Unrealized/Unrecognized | | $ | (160 | ) | | $ | (3,870 | ) | | $ | (3,382 | ) | | $ | 266 | | | $ | (7,146 | ) | |
| % of Total ALT-A | | | 2 | % | | | 54 | % | | | 47 | % | | | -3 | % | | | 100 | % | |
Note: Some amounts may not foot due to rounding.
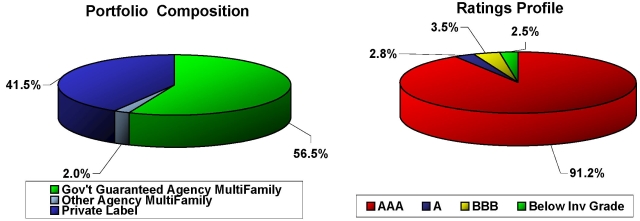
Selective Insurance Group, Inc. and Consolidated Subsidiaries
Commercial Mortgage Backed (CMBS) Securities
December 31, 2009
($ in thousands)
(unaudited)
| | •Market Value = $187,072; Unrealized Gain/(Loss) = ($14,255) |
| | •Held to Maturity (HTM) 49%; Available for Sale (AFS) 51% |
| | •CMBS Portfolio Average Rating = AA+ |
| | •CMBS Securities = 4.9% of the Total Portfolio |
Ratings Migration (1)
December 31, 2009
| Original Rating | | | Current Rating | | | Downgraded | |
| Rating | | Amount | | | AAA | | AA | | | A | | | BBB | | | Below Inv Grade | | | $ | | | % | |
| AAA | | | 190,569 | | | | 161,107 | | | | | 9,424 | | | | 17,223 | | | | 2,815 | | | | 29,462 | | | | 15.5 | % |
| AA | | | 8,635 | | | | 5,000 | | | | | | | | | | | | | 3,635 | | | | 3,635 | | | | 42.1 | % |
| A | | | - | | | | | | | | | | | | | | | | | | | | | - | | | | 0.0 | % |
| BBB | | | 17,000 | | | | | | | | | | | | | 7,000 | | | | 10,000 | | | | 10,000 | | | | 58.8 | % |
| Below Inv Grade | | | 5,000 | | | | | | | | | | | | | | | | | 5,000 | | | | - | | | | 0.0 | % |
| Total Par Value | | | 221,204 | | | | 166,107 | | - | | | 9,424 | | | | 24,223 | | | | 21,450 | | | | 43,097 | | | | 19.5 | % |
Note (1): Migration period is from the purchase date of each security to December 31, 2009
Selective Insurance Group Inc. and Consolidated Subsidiaries
Commercial Mortgage Backed Securities (CMBS) - by Vintage Year
December 31, 2009
($ in thousands)
(unaudited)
Market Value
| Vintage Yr | | AAA | | | | A | | | BBB | | | Below Investment Grade | | | Total | | | % of Total CMBS | | | % of Total Fixed Income Portfolio | | | % of Total GAAP Equity | |
| 1996 | | $ | 1,605 | | | $ | - | | | $ | - | | | $ | - | | | $ | 1,605 | | | | 1 | % | | | 0 | % | | | 0 | % |
| 1999 | | | 3,427 | | | | - | | | | - | | | | - | | | | 3,427 | | | | 2 | % | | | 0 | % | | | 0 | % |
| 2000 | | | 24,930 | | | | - | | | | - | | | | - | | | | 24,930 | | | | 13 | % | | | 1 | % | | | 2 | % |
| 2001 | | | 8,922 | | | | - | | | | - | | | | - | | | | 8,922 | | | | 5 | % | | | 0 | % | | | 1 | % |
| 2002 | | | 9,452 | | | | - | | | | - | | | | - | | | | 9,452 | | | | 5 | % | | | 0 | % | | | 1 | % |
| 2003 | | | 1,952 | | | | - | | | | - | | | | - | | | | 1,952 | | | | 1 | % | | | 0 | % | | | 0 | % |
| 2004 | | | 9,684 | | | | - | | | | - | | | | - | | | | 9,684 | | | | 5 | % | | | 0 | % | | | 1 | % |
| 2005 | | | 13,880 | | | | 2,212 | | | | 1,276 | | | | 253 | | | | 17,622 | | | | 9 | % | | | 1 | % | | | 2 | % |
| 2006 | | | 53,586 | | | | - | | | | 3,755 | | | | - | | | | 57,341 | | | | 31 | % | | | 3 | % | | | 7 | % |
| 2007 | | | 33,117 | | | | 2,967 | | | | 1,642 | | | | 4,379 | | | | 42,105 | | | | 23 | % | | | 1 | % | | | 4 | % |
| 2009 | | | 10,032 | | | | - | | | | - | | | | - | | | | 10,032 | | | | 5 | % | | | 0 | % | | | 1 | % |
| Total CMBS-Market Value | | $ | 170,587 | | | $ | 5,179 | | | $ | 6,674 | | | $ | 4,632 | | | $ | 187,072 | | | | 100 | % | | | 6 | % | | | 19 | % |
| % of Total CMBS | | | 91 | % | | | 3 | % | | | 4 | % | | | 2 | % | | | 100 | % | | | | | | | | | | | | |
| % of Total Fixed Income Portfolio | | | 5 | % | | | 0 | % | | | 1 | % | | | 0 | % | | | 6 | % | | | | | | | | | | | | |
| % of Total GAAP Equity | | | 17 | % | | | 1 | % | | | 1 | % | | | 0 | % | | | 19 | % | | | | | | | | | | | | |
| Weighted Average Market Price | | | 102.7 | | | | 117.1 | | | | 27.6 | | | | 21.6 | | | | 84.6 | | | | | | | | | | | | | |
Unrealized/Unrecognized Gain/(Loss)
| Vintage Yr | | AAA | | | | A | | | BBB | | | Below Investment Grade | | | Total | | |
| 1996 | | $ | (56 | ) | | $ | - | | | $ | - | | | $ | - | | | $ | (56 | ) | |
| 1999 | | | 127 | | | | - | | | | - | | | | - | | | | 127 | | |
| 2000 | | | 595 | | | | - | | | | - | | | | - | | | | 595 | | |
| 2001 | | | 236 | | | | - | | | | - | | | | - | | | | 236 | | |
| 2002 | | | 576 | | | | - | | | | - | | | | - | | | | 576 | | |
| 2003 | | | 36 | | | | - | | | | - | | | | - | | | | 36 | | |
| 2004 | | | 184 | | | | - | | | | - | | | | - | | | | 184 | | |
| 2005 | | | (302 | ) | | | (2,212 | ) | | | (1,791 | ) | | | (2,562 | ) | | | (6,867 | ) | |
| 2006 | | | 16 | | | | - | | | | (4,625 | ) | | | - | | | | (4,609 | ) | |
| 2007 | | | 366 | | | | (2,033 | ) | | | (358 | ) | | | (2,482 | ) | | | (4,507 | ) | |
| 2009 | | | 32 | | | | - | | | | - | | | | - | | | | 32 | | |
| Total CMBS-Unrealized/Unrecognized | | $ | 1,809 | | | $ | (4,245 | ) | | $ | (6,774 | ) | | $ | (5,044 | ) | | $ | (14,255 | ) | |
Note: Some amounts may not foot due to rounding.
Selective Insurance Group Inc. and Consolidated Subsidiaries
Commercial Mortgage Backed Securities (CMBS) - by Type
December 31, 2009
($ in thousands)
(unaudited)
Market Value
CMBS Type | | AAA | | | | A | | | BBB | | | Below Investment Grade | | | Total | | | % of Total CMBS | | | % of Total Fixed Income Portfolio | | | % of Total GAAP Equity | |
| Gov't Guaranteed Agency MultiFamily | | $ | 105,660 | | | $ | - | | | $ | - | | | $ | - | | | $ | 105,660 | | | | 56 | % | | | 3 | % | | | 11 | % |
| Other Agency MultiFamily | | | 3,830 | | | | - | | | | - | | | | - | | | | 3,830 | | | | 2 | % | | | 1 | % | | | 0 | % |
| Total Agency | | | 109,490 | | | | - | | | | - | | | | - | | | | 109,490 | | | | 58 | % | | | 4 | % | | | 11 | % |
| Conduit | | | 11,257 | | | | - | | | | - | | | | - | | | | 11,257 | | | | 6 | % | | | 1 | % | | | 1 | % |
Fusion (1) | | | 41,168 | | | | 2,967 | | | | 1,276 | | | | 439 | | | | 45,851 | | | | 25 | % | | | 1 | % | | | 5 | % |
| Lease-Backed | | | 3,427 | | | | - | | | | - | | | | - | | | | 3,427 | | | | 2 | % | | | 0 | % | | | 0 | % |
| Re-Securitization | | | 52 | | | | 2,212 | | | | 3,755 | | | | 253 | | | | 6,272 | | | | 3 | % | | | 0 | % | | | 1 | % |
| Single Borrower - Multiple Properties | | | 5,193 | | | | - | | | | 1,642 | | | | 3,939 | | | | 10,775 | | | | 6 | % | | | 0 | % | | | 1 | % |
| Total CMBS-Market Value | | $ | 170,587 | | | $ | 5,179 | | | $ | 6,674 | | | $ | 4,632 | | | $ | 187,072 | | | | 100 | % | | | 6 | % | | | 19 | % |
| % of Total CMBS | | | 91 | % | | | 3 | % | | | 4 | % | | | 2 | % | | | 100 | % | | | | | | | | | | | | |
| % of Total Fixed Income Portfolio | | | 5 | % | | | 0 | % | | | 1 | % | | | 0 | % | | | 6 | % | | | | | | | | | | | | |
| % of Total GAAP Equity | | | 17 | % | | | 1 | % | | | 1 | % | | | 0 | % | | | 19 | % | | | | | | | | | | | | |
| Weighted Average Market Price | | | 102.7 | | | | 117.1 | | | | 27.6 | | | | 21.6 | | | | 84.6 | | | | | | | | | | | | | |
Unrealized/Unrecognized Gain/(Loss)
CMBS Type | | AAA | | | | A | | | BBB | | | Below Investment Grade | | | Total | | |
| Gov't Guaranteed Agency MultiFamily | | $ | 1,352 | | | $ | - | | | $ | - | | | $ | - | | | $ | 1,352 | | |
| Other Agency MultiFamily | | | 144 | | | | - | | | | - | | | | - | | | | 144 | | |
| Total Agency | | | 1,495 | | | | - | | | | - | | | | - | | | | 1,495 | | |
| Conduit | | | 284 | | | | - | | | | - | | | | - | | | | 284 | | |
Fusion (1) | | | (274 | ) | | | (2,033 | ) | | | (1,791 | ) | | | (1,422 | ) | | | (5,520 | ) | |
| Lease-Backed | | | 127 | | | | - | | | | - | | | | - | | | | 127 | | |
| Re-Securitization | | | (3 | ) | | | (2,212 | ) | | | (4,625 | ) | | | (2,562 | ) | | | (9,402 | ) | |
| Single Borrower - Multiple Properties | | | 179 | | | | - | | | | (358 | ) | | | (1,061 | ) | | | (1,239 | ) | |
| Total CMBS-Unrealized/Unrecognized | | $ | 1,809 | | | $ | (4,245 | ) | | $ | (6,774 | ) | | $ | (5,044 | ) | | $ | (14,255 | ) | |
(1) Fusion means a CMBS composed of large and small loans.
Note: Some amounts may not foot due to rounding.
Selective Insurance Group, Inc. and Consolidated Subsidiaries
Credit Quality of Available-for-Sale Securities
December 31, 2009
($ in millions)
(unaudited)
| | | December 31, 2009 | | | December 31, 2008 | |
| | | Fair Value | | | Unrealized Gain (Loss) | | | Credit Quality | | | Fair Value | | | Unrealized Gain (Loss) | | | Credit Quality | |
| AFS Portfolio: | | | | | | | | | | | | | | | | | | |
U.S. government obligations1 | | $ | 475.6 | | | | 1.8 | | | AAA | | | | 252.2 | | | | 16.6 | | | AAA | |
| State and municipal obligations | | | 379.8 | | | | 20.3 | | | AA+ | | | | 1,758.0 | | | | 18.6 | | | AA+ | |
| Corporate securities | | | 379.6 | | | | 14.1 | | | A+ | | | | 366.5 | | | | (22.9 | ) | | A | |
| Mortgage-backed securities | | | 373.9 | | | | (17.2 | ) | | AA+ | | | | 596.2 | | | | (86.1 | ) | | AA+ | |
| Asset-backed securities ("ABS") | | | 27.0 | | | | 0.4 | | | AA | | | | 61.4 | | | | (15.3 | ) | | AA | |
| Total AFS portfolio | | $ | 1,635.9 | | | | 19.4 | | | AA+ | | | | 3,034.3 | | | | (89.1 | ) | | AA+ | |
| | | | | | | | | | | | | | | | | | | | | | | | |
| State and Municipal Obligations: | | | | | | | | | | | | | | | | | | | | | | | |
| Government obligations | | $ | 222.6 | | | | 11.0 | | | AA+ | | | | 574.1 | | | | 16.2 | | | AA+ | |
| Special revenue obligations | | | 157.2 | | | | 9.3 | | | AA+ | | | | 1,183.9 | | | | 2.4 | | | AA+ | |
| Total state and municipal obligations | | $ | 379.8 | | | | 20.3 | | | AA+ | | | | 1,758.0 | | | | 18.6 | | | AA+ | |
| | | | | | | | | | | | | | | | | | | | | | | | |
| Corporate Securities: | | | | | | | | | | | | | | | | | | | | | | | |
| Financial | | $ | 67.4 | | | | 3.0 | | | AA- | | | | 101.0 | | | | (13.1 | ) | | A+ | |
| Industrials | | | 46.6 | | | | 2.2 | | | A | | | | 67.7 | | | | (2.1 | ) | | A- | |
| Utilities | | | 18.9 | | | | 0.9 | | | A- | | | | 47.6 | | | | (0.8 | ) | | A | |
| Consumer discretion | | | 26.3 | | | | 1.3 | | | A- | | | | 33.9 | | | | (1.5 | ) | | A- | |
| Consumer staples | | | 51.6 | | | | 1.4 | | | A | | | | 42.0 | | | | 0.5 | | | A | |
| Health care | | | 52.8 | | | | 1.7 | | | AA- | | | | 22.7 | | | | 0.7 | | | A+ | |
| Materials | | | 20.7 | | | | 0.8 | | | A- | | | | 13.2 | | | | (3.7 | ) | | BBB+ | |
| Energy | | | 42.4 | | | | 1.3 | | | AA- | | | | 19.1 | | | | (0.2 | ) | | A- | |
| Information technology | | | 10.8 | | | | 0.1 | | | AA | | | | 10.1 | | | | (1.9 | ) | | BBB | |
| Telecommunications services | | | 14.6 | | | | 0.5 | | | A | | | | 9.2 | | | | (0.8 | ) | | A- | |
| Other | | | 27.5 | | | | 0.9 | | | A | | | | - | | | | - | | | | |
| Total corporate securities | | $ | 379.6 | | | | 14.1 | | | A+ | | | | 366.5 | | | | (22.9 | ) | | A | |
| | | | | | | | | | | | | | | | | | | | | | | | | |
| Mortgage-backed securities: | | | | | | | | | | | | | | | | | | | | | | | | |
| Gov't Guaranteed Agency CMBS | | $ | 94.6 | | | | 1.1 | | | AAA | | | | 56.3 | | | | 2.2 | | | AAA | |
| Other Agency CMBS | | | - | | | | - | | | | - | | | | 16.6 | | | | 0.6 | | | AAA | |
| Non-agency CMBS | | | - | | | | - | | | | - | | | | 154.3 | | | | (34.8 | ) | | AAA | |
| Gov't Guaranteed Agency RMBS | | | 105.2 | | | | 0.1 | | | AAA | | | | 84.6 | | | | 0.7 | | | AAA | |
| Other Agency RMBS | | | 119.8 | | | | 1.9 | | | AAA | | | | 160.9 | | | | 3.5 | | | AAA | |
| Non-agency RMBS | | | 30.2 | | | | (12.8 | ) | | | A- | | | | 74.3 | | | | (28.4 | ) | | AA+ | |
| Alternative-A ("Alt-A") RMBS | | | 24.1 | | | | (7.5 | ) | | | A- | | | | 49.2 | | | | (29.9 | ) | | AA+ | |
Total MBS | | $ | 373.9 | | | | (17.2 | ) | | AA+ | | | | 596.2 | | | | (86.1 | ) | | AA+ | |
| | | | | | | | | | | | | | | | | | | | | | | | | |
| Asset-backed securities: | | | | | | | | | | | | | | | | | | | | | | | | |
| ABS | | $ | 27.0 | | | | 0.4 | | | AA | | | | 59.3 | | | | (15.1 | ) | | AA+ | |
| Alt-A ABS | | | - | | | | - | | | | - | | | | 0.9 | | | | - | | | B | |
Sub-prime ABS2 | | | - | | | | - | | | | - | | | | 1.2 | | | | (0.2 | ) | | A | |
| Total ABS | | $ | 27.0 | | | | 0.4 | | | AA | | | | 61.4 | | | | (15.3 | ) | | AA | |
1 U.S. Governemnt includes coporate securities fully guaranteed by the FDIC.
2 We define sub-prime exposure as exposure to direct and indirect investments in non-agency residential mortgages with average FICO� scores below 650.
Selective Insurance Group, Inc. and Consolidated Subsidiaries
Credit Quality of Held-to-Maturity Securities
December 31, 2009
($ in millions)
(unaudited)
| | | Fair Value | | | Carry Value | | | Unrecognized Holding Gain (Loss)2 | | | Unrealized Gain (Loss) in Other Comprehensive Income3 | | | Total Unrealized / Unrecognized Gain (Loss) | | | Credit Quality | |
HTM Fixed Maturity Portfolio1: | | | | | | | | | | | | | | | | | | | | | | | |
| U.S. government obligations | | $ | 146.0 | | | | 144.8 | | | | 1.2 | | | | 5.6 | | | | 6.8 | | | AAA | |
| State and municipal obligations | | | 1,210.8 | | | | 1,201.4 | | | | 9.4 | | | | 33.9 | | | | 43.3 | | | AA | |
| Corporate securities | | | 107.5 | | | | 98.8 | | | | 8.7 | | | | (6.0 | ) | | | 2.7 | | | A- | |
| Mortgage-backed securities | | | 242.8 | | | | 236.4 | | | | 6.4 | | | | (17.6 | ) | | | (11.2 | ) | | AA+ | |
| Asset-backed securities | | | 33.1 | | | | 29.0 | | | | 4.1 | | | | (6.0 | ) | | | (1.9 | ) | | AA- | |
| Total HTM portfolio | | $ | 1,740.2 | | | | 1,710.4 | | | | 29.8 | | | | 9.9 | | | | 39.7 | | | AA+ | |
| | | | | | | | | | | | | | | | | | | | | | | | | |
| State and Municipal Obligations: | | | | | | | | | | | | | | | | | | | | | | | | |
| Government obligations | | $ | 301.5 | | | | 300.8 | | | | 0.7 | | | | 14.7 | | | | 15.4 | | | AA+ | |
| Special revenue obligations | | | 909.3 | | | | 900.6 | | | | 8.7 | | | | 19.2 | | | | 27.9 | | | AA | |
| Total state and municipal obligations | | $ | 1,210.8 | | | | 1,201.4 | | | | 9.4 | | | | 33.9 | | | | 43.3 | | | AA | |
| | | | | | | | | | | | | | | | | | | | | | | | | |
| Corporate Securities: | | | | | | | | | | | | | | | | | | | | | | | | |
| Financial | | $ | 35.4 | | | | 31.8 | | | | 3.6 | | | | (4.0 | ) | | | (0.4 | ) | | A | |
| Industrials | | | 29.1 | | | | 25.7 | | | | 3.4 | | | | (2.0 | ) | | | 1.4 | | | A- | |
| Utilities | | | 16.5 | | | | 16.3 | | | | 0.2 | | | | (0.1 | ) | | | 0.1 | | | A- | |
| Consumer discretion | | | 6.3 | | | | 6.0 | | | | 0.3 | | | | - | | | | 0.3 | | | BBB+ | |
| Consumer staples | | | 14.6 | | | | 13.9 | | | | 0.7 | | | | 0.5 | | | | 1.2 | | | AA- | |
| Materials | | | 2.1 | | | | 1.9 | | | | 0.2 | | | | (0.1 | ) | | | 0.1 | | | BBB- | |
| Energy | | | 3.5 | | | | 3.2 | | | | 0.3 | | | | (0.3 | ) | | | - | | | BB+ | |
| Total corporate securities | | $ | 107.5 | | | | 98.8 | | | | 8.7 | | | | (6.0 | ) | | | 2.7 | | | A- | |
| | | | | | | | | | | | | | | | | | | | | | | | | |
| Mortgage-backed securities: | | | | | | | | | | | | | | | | | | | | | | | | |
| Gov't Guaranteed Agency CMBS | | $ | 11.1 | | | | 10.8 | | | | 0.3 | | | | - | | | | 0.3 | | | AAA | |
| Other Agency CMBS | | | 3.8 | | | | 3.8 | | | | - | | | | 0.1 | | | | 0.1 | | | AAA | |
| Non-agency CMBS | | | 77.6 | | | | 74.4 | | | | 3.2 | | | | (18.9 | ) | | | (15.7 | ) | | AA+ | |
| Gov't Guaranteed Agency RMBS | | | 4.2 | | | | 3.9 | | | | 0.3 | | | | (0.2 | ) | | | 0.1 | | | AAA | |
| Other Agency RMBS | | | 140.2 | | | | 137.7 | | | | 2.5 | | | | 2.5 | | | | 5.0 | | | AAA | |
| Non-agency RMBS | | | 5.9 | | | | 5.8 | | | | 0.1 | | | | (1.1 | ) | | | (1.0 | ) | | AAA | |
Total mortgage-backed securities | | $ | 242.8 | | | | 236.4 | | | | 6.4 | | | | (17.6 | ) | | | (11.2 | ) | | AA+ | |
| | | | | | | | | | | | | | | | | | | | | | | | | |
| Asset-backed securities: | | | | | | | | | | | | | | | | | | | | | | | | |
| ABS | | $ | 30.2 | | | | 27.0 | | | | 3.2 | | | | (5.1 | ) | | | (1.9 | ) | | AA | |
| Alt-A ABS | | | 1.8 | | | | 1.0 | | | | 0.8 | | | | (0.5 | ) | | | 0.3 | | | CC | |
Sub-prime ABS4 | | | 1.1 | | | | 1.0 | | | | 0.1 | | | | (0.4 | ) | | | (0.3 | ) | | A | |
| Total ABS | | $ | 33.1 | | | | 29.0 | | | | 4.1 | | | | (6.0 | ) | | | (1.9 | ) | | AA- | |
1 2008 HTM securities are not presented as they are not material
2 Unrecognized holding gains (losses) are equal to the fair value less the carry value of the security
3 Unrealized gains (losses) are equal to the fair value less the amortized costs of securities transferred from AFS to HTM at the date of transfer, adjusted for subsequent amortization into income
4 We define sub-prime exposure as exposure to direct and indirect investments in non-agency residential mortgages with average FICO® scores below 650.