EXHIBIT 99.2
| 
Supplemental Investor Package Fourth Quarter and Full Year 2015 Investor Contact: Jennifer DiBerardino Senior Vice President, Investor Relations and Treasurer Tel: 973-948-1364 jennifer.diberardino@selective.com |
Selective Insurance Group, Inc. & Consolidated Subsidiaries
Selected Balance Sheet Data
(unaudited)
| | | December 31, | | December 31, |
| ($ in thousands, except per share data) | | 2015 | | 2014 |
| | | | | | | Unrecognized/ | | | | | | Unrecognized/ |
| | | Balance | | Market | | Unrealized | | Balance | | Market | | Unrealized |
| | | Sheet | | Value | | Gain | | Sheet | | Value | | Gain |
| Invested Assets: | | | | | | | | | | | | | | | | | | | | | | | | |
| Corporate bonds 1 | | $ | 2,955,001 | | | | 2,957,427 | | | | 8,276 | | | $ | 2,693,324 | | | | 2,697,332 | | | | 47,437 | |
| Government and Municipal bonds | | | 1,654,556 | | | | 1,660,320 | | | | 55,901 | | | | 1,690,935 | | | | 1,702,751 | | | | 59,680 | |
| Total fixed income securities | | | 4,609,557 | | | | 4,617,747 | | | | 64,177 | | | | 4,384,259 | | | | 4,400,083 | | | | 107,117 | |
| Equities | | | 207,051 | | | | 207,051 | | | | 13,235 | | | | 191,400 | | | | 191,400 | | | | 32,389 | |
| Short-term investments | | | 194,819 | | | | 194,819 | | | | - | | | | 131,972 | | | | 131,972 | | | | - | |
| Other investments | | | 77,842 | | | | 77,842 | | | | - | | | | 99,203 | | | | 99,203 | | | | - | |
| Total invested assets | | $ | 5,089,269 | | | | 5,097,459 | | | | 77,412 | | | $ | 4,806,834 | | | | 4,822,658 | | | | 139,506 | |
| | | | | | | | | | | | | | | | | | | | | | | | | |
| | | | | | | | | | | | | | | | | | | | | | | | | |
| Invested assets per $ of stockholders' equity | | | 3.64 | | | | | | | | | | | | 3.77 | | | | | | | | | |
| | | | | | | | | | | | | | | | | | | | | | | | | |
| Total assets | | | 6,904,433 | | | | | | | | | | | | 6,574,942 | | | | | | | | | |
| | | | | | | | | | | | | | | | | | | | | | | | | |
| Liabilities: | | | | | | | | | | | | | | | | | | | | | | | | |
| Reserve for loss and loss expenses | | | 3,517,728 | | | | | | | | | | | | 3,477,870 | | | | | | | | | |
| Unearned premium reserve | | | 1,169,710 | | | | | | | | | | | | 1,095,819 | | | | | | | | | |
| | | | | | | | | | | | | | | | | | | | | | | | | |
| Total liabilities | | | 5,506,392 | | | | | | | | | | | | 5,299,356 | | | | | | | | | |
| | | | | | | | | | | | | | | | | | | | | | | | | |
| Stockholders' equity | | | 1,398,041 | | | | | | | | | | | | 1,275,586 | | | | | | | | | |
| | | | | | | | | | | | | | | | | | | | | | | | | |
| Total debt to capitalization ratio | | | 21.7 | % | | | | | | | | | | | 22.6 | % | | | | | | | | |
| | | | | | | | | | | | | | | | | | | | | | | | | |
| Book value per share | | | 24.37 | | | | | | | | | | | | 22.54 | | | | | | | | | |
| | | | | | | | | | | | | | | | | | | | | | | | | |
| Book value per share excluding | | | | | | | | | | | | | | | | | | | | | | | | |
| unrealized gain or loss on fixed income portfolio | | | 23.74 | | | | | | | | | | | | 21.49 | | | | | | | | | |
| | | | | | | | | | | | | | | | | | | | | | | | | |
| NPW per insurance segment employee | | | 979 | | | | | | | | | | | | 908 | | | | | | | | | |
| | | | | | | | | | | | | | | | | | | | | | | | | |
| Statutory premiums to surplus ratio | | | 1.5 | x | | | | | | | | | | | 1.4 | x | | | | | | | | |
| | | | | | | | | | | | | | | | | | | | | | | | | |
| Statutory surplus | | | 1,426,320 | | | | | | | | | | | | 1,307,842 | | | | | | | | | |
1Includes mortgage-backed and asset-backed securities.
Selective Insurance Group, Inc. & Consolidated Subsidiaries
Selected Income Statement Data
(unaudited)
| | | Quarter Ended December 31, | | Year-to-Date December 31, |
($ in thousands, except per share data) | | 2015 | | 2014 | | 2015 | | 2014 |
| | | | | Per diluted share | | | | Per diluted share | | | | Per diluted share | | | | Per diluted share |
| Consolidated | | | | | | | | | | | | | | | | | | | | | | | | | | | | | | | | |
| Revenue | | $ | 545,530 | | | | | | | $ | 503,583 | | | | | | | $ | 2,131,852 | | | | | | | $ | 2,034,861 | | | | | |
| Operating income | | | 47,079 | | | | 0.81 | | | | 41,603 | | | | 0.72 | | | | 157,300 | | | | 2.70 | | | | 124,538 | | | | 2.17 | |
| Net realized (losses) gains, after tax | | | (1,690 | ) | | | (0.03 | ) | | | (253 | ) | | | (0.00 | ) | | | 8,561 | | | | 0.15 | | | | 17,289 | | | | 0.30 | |
| Net income | | | 45,389 | | | | 0.78 | | | | 41,350 | | | | 0.72 | | | | 165,861 | | | | 2.85 | | | | 141,827 | | | | 2.47 | |
| Operating return on equity | | | 13.7 | % | | | | | | | 13.1 | % | | | | | | | 11.8 | % | | | | | | | 10.3 | % | | | | |
| | | | | | | | | | | | | | | | | | | | | | | | | | | | | | | | | |
| Total Insurance Operations | | | | | | | | | | | | | | | | | | | | | | | | | | | | | | | | |
| Gross premiums written | | | 558,607 | | | | | | | | 512,046 | | | | | | | | 2,427,367 | | | | | | | | 2,254,576 | | | | | |
| Net premiums written | | | 474,658 | | | | | | | | 433,586 | | | | | | | | 2,069,904 | | | | | | | | 1,885,280 | | | | | |
| Net premiums earned | | | 516,087 | | | | | | | | 469,850 | | | | | | | | 1,989,909 | | | | | | | | 1,852,609 | | | | | |
| Underwriting gain | - before tax | | | 49,053 | | | | | | | | 38,637 | | | | | | | | 149,029 | | | | | | | | 78,143 | | | | | |
| | - after tax | | | 31,885 | | | | 0.55 | | | | 25,114 | | | | 0.44 | | | | 96,869 | | | | 1.67 | | | | 50,793 | | | | 0.89 | |
| GAAP combined ratio | | | 90.5 | % | | | | | | | 91.8 | % | | | | | | | 92.5 | % | | | | | | | 95.8 | % | | | | |
| | | | | | | | | | | | | | | | | | | | | | | | | | | | | | | | | |
| Standard Commercial Lines | | | | | | | | | | | | | | | | | | | | | | | | | | | | | | | | |
| Net premiums earned | | | 397,162 | | | | | | | | 359,621 | | | | | | | | 1,529,442 | | | | | | | | 1,415,712 | | | | | |
| GAAP combined ratio | | | 86.1 | % | | | | | | | 94.1 | % | | | | | | | 89.2 | % | | | | | | | 95.7 | % | | | | |
| Standard Personal Lines | | | | | | | | | | | | | | | | | | | | | | | | | | | | | | | | |
| Net premiums earned | | | 71,496 | | | | | | | | 73,008 | | | | | | | | 288,134 | | | | | | | | 296,747 | | | | | |
| GAAP combined ratio | | | 92.1 | % | | | | | | | 77.5 | % | | | | | | | 99.5 | % | | | | | | | 94.4 | % | | | | |
| Excess and Surplus Lines | | | | | | | | | | | | | | | | | | | | | | | | | | | | | | | | |
| Net premiums earned | | | 47,429 | | | | | | | | 37,221 | | | | | | | | 172,333 | | | | | | | | 140,150 | | | | | |
| GAAP combined ratio | | | 124.8 | % | | | | | | | 97.8 | % | | | | | | | 109.8 | % | | | | | | | 99.7 | % | | | | |
| | | | | | | | | | | | | | | | | | | | | | | | | | | | | | | | | |
| Investments | | | | | | | | | | | | | | | | | | | | | | | | | | | | | | | | |
| Net investment income | - before tax | | | 30,108 | | | | | | | | 32,108 | | | | | | | | 121,316 | | | | | | | | 138,708 | | | | | |
| | - after tax | | | 23,294 | | | | 0.40 | | | | 24,535 | | | | 0.43 | | | | 93,836 | | | | 1.61 | | | | 104,207 | | | | 1.82 | |
| Effective tax rate | | | 22.6 | % | | | | | | | 23.6 | % | | | | | | | 22.7 | % | | | | | | | 24.9 | % | | | | |
| Annualized after-tax yield on investment portfolio | | | | | | | | | | | | | | | | | | | 1.9 | % | | | | | | | 2.2 | % | | | | |
| Annualized after-tax, after-interest expense yield | | | | | | | | | | | | | | | | | | | 1.6 | % | | | | | | | 1.9 | % | | | | |
| Invested assets per $ of stockholders' equity | | | | | | | | | | | | | | | | | | | 3.64 | | | | | | | | 3.77 | | | | | |
| | | | | | | | | | | | | | | | | | | | | | | | | | | | | | | | | |
| Other expenses (net of other income) | | | | | | | | | | | | | | | | | | | | | | | | | | | | | | | | |
| Interest expense | - before tax | | | (5,603 | ) | | | | | | | (5,668 | ) | | | | | | | (22,428 | ) | | | | | | | (23,063 | ) | | | | |
| | - after tax | | | (3,641 | ) | | | (0.06 | ) | | | (3,684 | ) | | | (0.06 | ) | | | (14,578 | ) | | | (0.25 | ) | | | (14,991 | ) | | | (0.26 | ) |
| | | | | | | | | | | | | | | | | | | | | | | | | | | | | | | | | |
| Other expense - after tax | | $ | (4,459 | ) | | | (0.08 | ) | | $ | (4,362 | ) | | | (0.09 | ) | | $ | (18,827 | ) | | | (0.33 | ) | | $ | (15,471 | ) | | | (0.28 | ) |
| | | | | | | | | | | | | | | | | | | | | | | | | | | | | | | | | |
| Diluted weighted avg shares outstanding | | | 58,387 | | | | | | | | 57,539 | | | | | | | | 58,156 | | | | | | | | 57,351 | | | | | |
Selective Insurance Group, Inc. & Consolidated Subsidiaries
GAAP Insurance Operations Results
(unaudited)
| Fourth Quarter | | | | | | | | | | | | | | | | |
| ($ in thousands) | | Quarter Ended December 31, 2015 | | Quarter Ended December 31, 2014 |
| | | | | | | | | | | | | | | | | |
| | | Standard Commercial Lines | | Standard Personal Lines | | Excess & Surplus Lines | | Grand Total | | Standard Commercial Lines | | Standard Personal Lines | | Excess & Surplus Lines | | Grand Total |
| Net Premiums Written | | | 356,855 | | | | 65,989 | | | | 51,814 | | | | 474,658 | | | 321,399 | | | | 67,494 | | | | 44,693 | | | | 433,586 |
| Net Premiums Earned | | | 397,162 | | | | 71,496 | | | | 47,429 | | | | 516,087 | | | 359,621 | | | | 73,008 | | | | 37,221 | | | | 469,850 |
| Loss and Loss Expense Incurred | | | 199,716 | | | | 43,747 | | | | 43,357 | | | | 286,820 | | | 209,495 | | | | 35,155 | | | | 23,578 | | | | 268,228 |
| Net Underwriting Expenses Incurred | | | 141,325 | | | | 22,118 | | | | 15,842 | | | | 179,285 | | | 126,510 | | | | 21,412 | | | | 12,824 | | | | 160,746 |
| Dividends to Policyholders | | | 929 | | | | - | | | | - | | | | 929 | | | 2,239 | | | | - | | | | - | | | | 2,239 |
| GAAP Underwriting Gain (Loss) | | | 55,192 | | | | 5,631 | | | | (11,770 | ) | | | 49,053 | | | 21,377 | | | | 16,441 | | | | 819 | | | | 38,637 |
| | | | | | | | | | | | | | | | | | | | | | | | | | | | | | | | | |
| GAAP Ratios | | | | | | | | | | | | | | | | | | | | | | | | | | | | | | | | |
| Loss and Loss Expense Ratio | | | 50.3 | % | | | 61.2 | % | | | 91.4 | % | | | 55.6% | | | 58.3 | % | | | 48.2 | % | | | 63.3 | % | | | 57.1% |
| Underwriting Expense Ratio | | | 35.6 | % | | | 30.9 | % | | | 33.4 | % | | | 34.7% | | | 35.2 | % | | | 29.3 | % | | | 34.5 | % | | | 34.2% |
| Dividends to Policyholders Ratio | | | 0.2 | % | | | 0.0 | % | | | 0.0 | % | | | 0.2% | | | 0.6 | % | | | 0.0 | % | | | 0.0 | % | | | 0.5% |
| Combined Ratio | | | 86.1 | % | | | 92.1 | % | | | 124.8 | % | | | 90.5% | | | 94.1 | % | | | 77.5 | % | | | 97.8 | % | | | 91.8% |
| | | | | | | | | | | | | | | | | | | | | | | | | | | | | | | | | |
| | | | | | | | | | | | | | | | | |
| | | | | | | | | | | | | | | | | |
| Year-to-Date | | | | | | | | | | | | | | | | |
| ($ in thousands) | | Year-to-Date December 31, 2015 | | Year-to-Date December 31, 2014 |
| | | | | | | | | | | | | | | | | |
| | | Standard Commercial Lines | | Standard Personal Lines | | Excess & Surplus Lines | | Grand Total | | Standard Commercial Lines | | Standard Personal Lines | | Excess & Surplus Lines | | Grand Total |
| Net Premiums Written | | | 1,596,965 | | | | 283,926 | | | | 189,013 | | | | 2,069,904 | | | 1,441,047 | | | | 292,061 | | | | 152,172 | | | | 1,885,280 |
| Net Premiums Earned | | | 1,529,442 | | | | 288,134 | | | | 172,333 | | | | 1,989,909 | | | 1,415,712 | | | | 296,747 | | | | 140,150 | | | | 1,852,609 |
| Loss and Loss Expense Incurred | | | 819,573 | | | | 200,237 | | | | 128,731 | | | | 1,148,541 | | | 870,018 | | | | 197,182 | | | | 90,301 | | | | 1,157,501 |
| Net Underwriting Expenses Incurred | | | 539,154 | | | | 86,561 | | | | 60,405 | | | | 686,120 | | | 478,291 | | | | 83,029 | | | | 49,463 | | | | 610,783 |
| Dividends to Policyholders | | | 6,219 | | | | - | | | | - | | | | 6,219 | | | 6,182 | | | | - | | | | - | | | | 6,182 |
| GAAP Underwriting Gain (Loss) | | | 164,496 | | | | 1,336 | | | | (16,803 | ) | | | 149,029 | | | 61,221 | | | | 16,536 | | | | 386 | | | | 78,143 |
| | | | | | | | | | | | | | | | | | | | | | | | | | | | | | | | | |
| GAAP Ratios | | | | | | | | | | | | | | | | | | | | | | | | | | | | | | | | |
| Loss and Loss Expense Ratio | | | 53.6 | % | | | 69.5 | % | | | 74.7 | % | | | 57.7% | | | 61.5 | % | | | 66.4 | % | | | 64.4 | % | | | 62.5% |
| Underwriting Expense Ratio | | | 35.2 | % | | | 30.0 | % | | | 35.1 | % | | | 34.5% | | | 33.8 | % | | | 28.0 | % | | | 35.3 | % | | | 33.0% |
| Dividends to Policyholders Ratio | | | 0.4 | % | | | 0.0 | % | | | 0.0 | % | | | 0.3% | | | 0.4 | % | | | 0.0 | % | | | 0.0 | % | | | 0.3% |
| Combined Ratio | | | 89.2 | % | | | 99.5 | % | | | 109.8 | % | | | 92.5% | | | 95.7 | % | | | 94.4 | % | | | 99.7 | % | | | 95.8% |
| | | | | | | | | | | | | | | | | | | | | | | | | | | | | | | | | |
Selective Insurance Group, Inc. and Consolidated Subsidiaries
GAAP Investment Income
December 2015 (unaudited)
| | | Quarter Ended | | % | | Year-to-Date | | % |
| | | December | | December | | Increase | | December | | December | | Increase |
| ($ in thousands, except per share data) | | 2015 | | 2014 | | (Decrease) | | 2015 | | 2014 | | (Decrease) |
| Investment Income: | | | | | | | | | | | | | | | | | | | | | | | | |
| Interest: | | | | | | | | | | | | | | | | | | | | | | | | |
| Fixed Income Securities | | $ | 31,003 | | | | 30,974 | | | | 0 | | | $ | 123,230 | | | | 126,489 | | | | (3 | ) |
| Short-term | | | 40 | | | | 18 | | | | 122 | | | | 112 | | | | 66 | | | | 70 | |
| Other Investments | | | (1,109 | ) | | | 903 | | | | (223 | ) | | | (1,890 | ) | | | 13,580 | | | | (114 | ) |
| Dividends | | | 2,615 | | | | 2,355 | | | | 11 | | | | 9,161 | | | | 7,449 | | | | 23 | |
| | | | 32,549 | | | | 34,250 | | | | (5 | ) | | | 130,613 | | | | 147,584 | | | | (11 | ) |
| | | | | | | | | | | | | | | | | | | | | | | | | |
| Investment Expense | | | 2,441 | | | | 2,142 | | | | 14 | | | | 9,297 | | | | 8,876 | | | | 5 | |
| | | | | | | | | | | | | | | | | | | | | | | | | |
| Net Investment Income Before Tax | | | 30,108 | | | | 32,108 | | | | (6 | ) | | | 121,316 | | | | 138,708 | | | | (13 | ) |
| | | | | | | | | | | | | | | | | | | | | | | | | |
| Tax | | | 6,814 | | | | 7,573 | | | | (10 | ) | | | 27,480 | | | | 34,501 | | | | (20 | ) |
| | | | | | | | | | | | | | | | | | | | | | | | | |
| Net Investment Income After Tax | | $ | 23,294 | | | | 24,535 | | | | (5 | ) | | $ | 93,836 | | | | 104,207 | | | | (10 | ) |
| | | | | | | | | | | | | | | | | | | | | | | | | |
| Net Investment Income per Share | | $ | 0.40 | | | | 0.43 | | | | (7 | ) | | $ | 1.61 | | | | 1.82 | | | | (12 | ) |
| | | | | | | | | | | | | | | | | | | | | | | | | |
| | | | | | | | | | | | | | | | | | | | | | | | | |
| Effective Tax Rate | | | 22.6 | % | | | 23.6 | % | | | | | | | 22.7 | % | | | 24.9 | % | | | | |
| | | | | | | | | | | | | | | | | | | | | | | | | |
| Average Yields : | | | | | | | | | | | | | | | | | | | | | | | | |
| | | | | | | | | | | | | | | | | | | | | | | | | |
| Fixed Income Securities: | | | | | | | | | | | | | | | | | | | | | | | | |
| Pre Tax | | | | | | | | | | | | | | | 2.74 | % | | | 2.98 | % | | | | |
| After Tax | | | | | | | | | | | | | | | 2.07 | % | | | 2.24 | % | | | | |
| | | | | | | | | | | | | | | | | | | | | | | | | |
| Portfolio: | | | | | | | | | | | | | | | | | | | | | | | | |
| Pre Tax | | | | | | | | | | | | | | | 2.45 | % | | | 2.95 | % | | | | |
| After Tax | | | | | | | | | | | | | | | 1.90 | % | | | 2.22 | % | | | | |
| | | | | | | | | | | | | | | | | | | | | | | | | |
| | | | | | | | | | | | | | | | | | | | | | | | | |
| | | Quarter Ended | | Year-to-Date |
| | | December | | December | | December | | December |
| Net Realized Gains (Losses) | | 2015 | | 2014 | | 2015 | | 2014 |
| Fixed Income Securities | | | 1,431 | | | | 82 | | | | 2,018 | | | | 1,528 | |
| Equity Securities | | | (4,193 | ) | | | 109 | | | | 11,645 | | | | 25,650 | |
| Other Investments | | | 162 | | | | (580 | ) | | | (492 | ) | | | (579 | ) |
| | | | | | | | | | | | | | | | | |
| Total | | | (2,600 | ) | | | (389 | ) | | | 13,171 | | | | 26,599 | |
| Net of Tax | | | (1,690 | ) | | | (253 | ) | | | 8,561 | | | | 17,289 | |
As of December 31, 2015 year-to-date new money rates for fixed income securities were 2.4% on a pre-tax basis and 1.7% on an after-tax basis.
Selective Insurance Group, Inc.
Combined Insurance Company Subsidiaries
2015 Statutory Results by Line of Business
Quarter Ended December 2015 (unaudited)
|
| Net
Premiums |
|
Percent |
| Net
Premiums |
|
Percent |
|
Loss |
|
LAE |
| Underwriting
Expense |
| Dividends to
Policyholders |
| Combined Ratio |
| Combined Ratio |
|
Underwriting |
| ($ in thousands) | | Written | | Change | | Earned | | Change | | Ratio | | Ratio | | Ratio | | Ratio | | 2015 | | 2014 | | Gain/(Loss) |
| Standard Personal Lines: | | | | | | | | | | | | | | | | | | | | | | | | | | | | | | | | | | | | | | | | | | | | |
| | | | | | | | | | | | | | | | | | | | | | | | | | | | | | | | | | | | | | | | | | | | | |
| Homeowners | | $ | 30,696 | | | (3.4 | )% | | $ | 33,261 | | | (0.5 | )% | | | 32.2 | % | | | 7.9 | % | | | 38.5 | % | | | 0.0 | % | | | 78.6 | % | | | 55.3 | % | | $ | 8,112 |
| Auto | | | 33,516 | | | (2.0 | )% | | | 36,410 | | | (2.6 | )% | | | 75.0 | % | | | 5.2 | % | | | 35.9 | % | | | 0.0 | % | | | 116.1 | % | | | 104.8 | % | | | (4,817) |
| Other (including flood) | | | 1,777 | | | 17.7 | % | | | 1,826 | | | (16.7 | )% | | | 61.5 | % | | | 4.9 | % | | | (98.2 | )% | | | 0.0 | % | | | (31.8 | )% | | | (65.6 | )% | | | 2,359 |
| Total | | $ | 65,989 | | | (2.2 | )% | | $ | 71,496 | | | (2.1 | )% | | | 54.8 | % | | | 6.4 | % | | | 33.5 | % | | | 0.0 | % | | | 94.7 | % | | | 78.2 | % | | $ | 5,654 |
| | | | | | | | | | | | | | | | | | | | | | | | | | | | | | | | | | | | | | | | | | | | | |
| Standard Commercial Lines: | | | | | | | | | | | | | | | | | | | | | | | | | | | | | | | | | | | | | | | | | | | | |
| | | | | | | | | | | | | | | | | | | | | | | | | | | | | | | | | | | | | | | | | | | | | |
| Commercial property | | $ | 63,423 | | | 14.4 | % | | $ | 69,323 | | | 11.7 | % | | | 23.1 | % | | | 5.5 | % | | | 42.4 | % | | | (0.2 | )% | | | 70.8 | % | | | 78.1 | % | | $ | 22,740 |
| Workers compensation | | | 65,964 | | | 6.0 | % | | | 76,084 | | | 9.6 | % | | | 39.6 | % | | | 17.0 | % | | | 31.8 | % | | | 1.7 | % | | | 90.1 | % | | | 112.1 | % | | | 10,771 |
| General liability | | | 110,051 | | | 12.1 | % | | | 125,861 | | | 10.8 | % | | | 41.9 | % | | | 7.0 | % | | | 40.0 | % | | | (0.1 | )% | | | 88.8 | % | | | 90.7 | % | | | 20,458 |
| Auto | | | 84,517 | | | 13.0 | % | | | 93,138 | | | 10.8 | % | | | 55.9 | % | | | 11.5 | % | | | 36.4 | % | | | (0.1 | )% | | | 103.7 | % | | | 104.4 | % | | | (309) |
| Businessowners' policies | | | 24,480 | | | 5.3 | % | | | 23,825 | | | 8.3 | % | | | 41.9 | % | | | 4.0 | % | | | 40.8 | % | | | 0.0 | % | | | 86.7 | % | | | 98.2 | % | | | 2,899 |
| Bonds | | | 4,788 | | | 9.1 | % | | | 5,213 | | | 4.1 | % | | | 16.3 | % | | | 8.6 | % | | | 72.6 | % | | | 0.0 | % | | | 97.5 | % | | | 92.8 | % | | | 438 |
| Other | | | 3,633 | | | 15.4 | % | | | 3,718 | | | 10.1 | % | | | 1.2 | % | | | 0.2 | % | | | 60.2 | % | | | 0.0 | % | | | 61.6 | % | | | 58.8 | % | | | 1,480 |
| Total | | $ | 356,855 | | | 11.0 | % | | $ | 397,162 | | | 10.4 | % | | | 40.7 | % | | | 9.5 | % | | | 38.8 | % | | | 0.2 | % | | | 89.2 | % | | | 96.0 | % | | $ | 58,477 |
| | | | | | | | | | | | | | | | | | | | | | | | | | | | | | | | | | | | | | | | | | | | | |
| E&S | | $ | 51,814 | | | 15.9 | % | | $ | 47,429 | | | 27.4 | % | | | 70.4 | % | | | 21.2 | % | | | 34.0 | % | | | 0.0 | % | | | 125.6 | % | | | 96.6 | % | | $ | (13,635) |
| | | | | | | | | | | | | | | | | | | | | | | | | | | | | | | | | | | | | | | | | | | | | |
| Total Insurance Operations | | $ | 474,658 | | | 9.5 | % | | $ | 516,087 | | | 9.8 | % | | | 45.4 | % | | | 10.2 | % | | | 37.4 | % | | | 0.2 | % | | | 93.2 | % | | | 93.2 | % | | $ | 50,497 |
| | | | | | | | | | | | | | | | | | | | | | | | | | | | | | | | | | | | | | | | | | | | | |
| Note: Some amounts may not foot due to rounding. | | | | | | | | | | | | | | | | | | | | | | | | | |
| | | | | | | | | | | | | | | | | | | | | | | | | | | | | | | | | | | | | | | | | | | | | |
| | | | | | | | 2015 | | | | 2014 | | | | | | | | | | | | | | | | | | | | | | | | | | | | | | | | | |
| | | | Losses Paid | | | $ | 234,802 | | | $ | 210,724 | | | | | | | | | | | | | | | | | | | | | | | | | | | | | | | | | |
| | | | LAE Paid | | | | 53,288 | | | | 48,313 | | | | | | | | | | | | | | | | | | | | | | | | | | | | | | | | | |
| | | | Total Paid | | | $ | 288,090 | | | $ | 259,037 | | | | | | | | | | | | | | | | | | | | | | | | | | | | | | | | | |
| | | | | | | | | | | | | | | | | | | | | | | | | | | | | | | | | | | | | | | | | | | | | |
Selective Insurance Group, Inc.
Combined Insurance Company Subsidiaries
2015 Statutory Results by Line of Business
Year-to-date December 2015 (unaudited)
| | | Net
Premiums | | Percent | | Net
Premiums | | Percent | | Loss | | LAE | | Underwriting
Expense | | Dividends to
Policyholders | | Combined Ratio | | Combined Ratio | | Underwriting |
| ($ in thousands) | | Written | | Change | | Earned | | Change | | Ratio | | Ratio | | Ratio | | Ratio | | 2015 | | 2014 | | Gain/(Loss) |
| Standard Personal Lines: | | | | | | | | | | | | | | | | | | | | | | | | | | | | | | | | | | | | | | | | | | | | |
| | | | | | | | | | | | | | | | | | | | | | | | | | | | | | | | | | | | | | | | | | | | | |
| Homeowners | | $ | 132,533 | | | (2.4 | )% | | $ | 134,382 | | | 0.1 | % | | | 56.9 | % | | | 8.1 | % | | | 35.6 | % | | | 0.0 | % | | | 100.6 | % | | | 96.9 | % | | $ | (179) |
| Auto | | | 144,641 | | | (3.0 | )% | | | 146,784 | | | (3.0 | )% | | | 64.9 | % | | | 9.2 | % | | | 34.0 | % | | | 0.0 | % | | | 108.1 | % | | | 101.5 | % | | | (11,107) |
| Other (including flood) | | | 6,752 | | | (5.5 | )% | | | 6,968 | | | (37.5 | )% | | | 65.2 | % | | | (0.8 | )% | | | (152.7 | )% | | | 0.0 | % | | | (88.3 | )% | | | (94.6 | )% | | | 12,796 |
| Total | | $ | 283,926 | | | (2.8 | )% | | $ | 288,134 | | | (2.9 | )% | | | 61.2 | % | | | 8.4 | % | | | 30.3 | % | | | 0.0 | % | | | 99.9 | % | | | 94.5 | % | | $ | 1,510 |
| | | | | | | | | | | | | | | | | | | | | | | | | | | | | | | | | | | | | | | | | | | | | |
| Standard Commercial Lines: | | | | | | | | | | | | | | | | | | | | | | | | | | | | | | | | | | | | | | | | | | | | |
| | | | | | | | | | | | | | | | | | | | | | | | | | | | | | | | | | | | | | | | | | | | | |
| Commercial property | | $ | 282,731 | | | 11.5 | % | | $ | 269,022 | | | 9.9 | % | | | 38.7 | % | | | 5.3 | % | | | 38.6 | % | | | 0.0 | % | | | 82.6 | % | | | 97.3 | % | | $ | 41,608 |
| Workers compensation | | | 299,686 | | | 11.4 | % | | | 290,075 | | | 5.6 | % | | | 41.4 | % | | | 15.9 | % | | | 28.8 | % | | | 2.1 | % | | | 88.2 | % | | | 110.1 | % | | | 31,558 |
| General liability | | | 505,891 | | | 11.5 | % | | | 483,291 | | | 8.6 | % | | | 32.8 | % | | | 13.4 | % | | | 35.9 | % | | | 0.0 | % | | | 82.1 | % | | | 83.9 | % | | | 78,536 |
| Auto | | | 376,064 | | | 10.0 | % | | | 358,909 | | | 7.7 | % | | | 58.9 | % | | | 9.8 | % | | | 33.2 | % | | | 0.0 | % | | | 101.9 | % | | | 96.2 | % | | | (12,683) |
| Businessowners' policies | | | 96,257 | | | 7.9 | % | | | 93,428 | | | 8.9 | % | | | 53.8 | % | | | 10.1 | % | | | 39.4 | % | | | 0.0 | % | | | 103.3 | % | | | 108.7 | % | | | (4,172) |
| Bonds | | | 21,192 | | | 6.3 | % | | | 20,350 | | | 5.5 | % | | | 16.4 | % | | | 7.4 | % | | | 66.0 | % | | | 0.0 | % | | | 89.8 | % | | | 84.9 | % | | | 1,513 |
| Other | | | 15,144 | | | 11.4 | % | | | 14,367 | | | 10.4 | % | | | 0.4 | % | | | 0.2 | % | | | 56.8 | % | | | 0.0 | % | | | 57.4 | % | | | 51.9 | % | | | 5,684 |
| Total | | $ | 1,596,965 | | | 10.8 | % | | $ | 1,529,442 | | | 8.0 | % | | | 42.4 | % | | | 11.2 | % | | | 35.2 | % | | | 0.4 | % | | | 89.2 | % | �� | | 95.5 | % | | $ | 142,044 |
| | | | | | | | | | | | | | | | | | | | | | | | | | | | | | | | | | | | | | | | | | | | | |
| E&S | | $ | 189,013 | | | 24.2 | % | | $ | 172,333 | | | 23.0 | % | | | 55.3 | % | | | 19.4 | % | | | 33.7 | % | | | 0.0 | % | | | 108.4 | % | | | 99.2 | % | | $ | (20,066) |
| | | | | | | | | | | | | | | | | | | | | | | | | | | | | | | | | | | | | | | | | | | | | |
| Total Insurance Operations | | $ | 2,069,904 | | | 9.8 | % | | $ | 1,989,909 | | | 7.4 | % | | | 46.2 | % | | | 11.5 | % | | | 34.4 | % | | | 0.3 | % | | | 92.4 | % | | | 95.7 | % | | $ | 123,487 |
| | | | | | | | | | | | | | | | | | | | | | | | | | | | | | | | | | | | | | | | | | | | | |
| Note: Some amounts may not foot due to rounding. | | | | | | | | | | | | | | | | | | | | | |
| | | | | | | | | | | | | | | | | | | | | | | | | | | | | | | | | | | | | | | | | | | | | |
| | | | | | | | 2015 | | | | 2014 | | | | | | | | | | | | | | | | | | | | | | | | | | | | | | | | | |
| | | | Losses Paid | | | $ | 891,485 | | | $ | 873,159 | | | | | | | | | | | | | | | | | | | | | | | | | | | | | | | | | |
| | | | LAE Paid | | | | 197,433 | | | | 187,491 | | | | | | | | | | | | | | | | | | | | | | | | | | | | | | | | | |
| | | | Total Paid | | | $ | 1,088,918 | | | $ | 1,060,650 | | | | | | | | | | | | | | | | | | | | | | | | | | | | | | | | | |
| | | | | | | | | | | | | | | | | | | | | | | | | | | | | | | | | | | | | | | | | | | | | |
Selective Insurance Group, Inc.
Combined Insurance Company Subsidiaries
2015 Net Catastrophe Losses and Prior Year Casualty Reserve Development
Statutory Results by Line of Business
(unaudited)
| | | Quarter Ended | | Year-to-Date |
| Net Catastrophe Losses Incurred | | December 31, 2015 | | December 31, 2014 | | December 31, 2015 | | December 31, 2014 |
| ($ in thousands) | | Loss and Loss Expense Incurred | | Impact on Loss and Loss Expense Ratio | | Loss and Loss Expense Incurred | | Impact on Loss and Loss Expense Ratio | | Loss and Loss Expense Incurred | | Impact on Loss and Loss Expense Ratio | | Loss and Loss Expense Incurred | | Impact on Loss and Loss Expense Ratio |
| | | | | | | | | | | | | | | | | |
| Standard Personal Lines | | $ | 1,354 | | | | 1.9 | % | | $ | (3,334 | ) | | | (4.6 | )% | | $ | 21,735 | | | | 7.5 | % | | $ | 19,284 | | | | 6.5 | % |
| | | | | | | | | | | | | | | | | | | | | �� | | | | | | | | | | | | |
| Standard Commercial Lines | | $ | 1,072 | | | | 0.3 | % | | $ | (4,065 | ) | | | (1.1 | )% | | $ | 34,089 | | | | 2.2 | % | | $ | 37,881 | | | | 2.7 | % |
| | | | | | | | | | | | | | | | | | | | | | | | | | | | | | | | | |
| E&S | | $ | 479 | | | | 1.0 | % | | $ | 420 | | | | 1.1 | % | | $ | 3,231 | | | | 1.9 | % | | $ | 2,805 | | | | 2.0 | % |
| | | | | | | | | | | | | | | | | | | | | | | | | | | | | | | | | |
| Total Insurance Operations | | $ | 2,906 | | | | 0.6 | % | | $ | (6,979 | ) | | | (1.5 | )% | | $ | 59,055 | | | | 3.0 | % | | $ | 59,971 | | | | 3.2 | % |
| | | | | | | | | | | | | | | | | | | | | | | | | | | | | | | | | |
| Prior Year Casualty Reserve Development | | Quarter Ended | | Year-to-Date |
| (Favorable) / Unfavorable | | December 31, 2015 | | December 31, 2014 | | December 31, 2015 | | December 31, 2014 |
| ($ in thousands) | | Loss and Loss Expense Incurred | | Impact on Loss and Loss Expense Ratio | | Loss and Loss Expense Incurred | | Impact on Loss and Loss Expense Ratio | | Loss and Loss Expense Incurred | | Impact on Loss and Loss Expense Ratio | | Loss and Loss Expense Incurred | | Impact on Loss and Loss Expense Ratio |
| | | | | | | | | | | | | | | | | |
| Standard Personal Lines | | $ | (2,000 | ) | | | (2.8 | )% | | $ | (3,000 | ) | | | (4.1 | )% | | $ | (2,000 | ) | | | (0.7 | )% | | $ | (9,000 | ) | | | (3.0 | )% |
| | | | | | | | | | | | | | | | | | | | | | | | | | | | | | | | | |
| Standard Commercial Lines | | $ | (20,000 | ) | | | (5.0 | )% | | $ | (8,000 | ) | | | (2.2 | )% | | $ | (81,000 | ) | | | (5.3 | )% | | $ | (45,500 | ) | | | (3.2 | )% |
| | | | | | | | | | | | | | | | | | | | | | | | | | | | | | | | | |
| E&S | | $ | 10,000 | | | | 21.1 | % | | $ | 2,000 | | | | 5.4 | % | | $ | 16,000 | | | | 9.3 | % | | $ | 6,000 | | | | 4.3 | % |
| | | | | | | | | | | | | | | | | | | | | | | | | | | | | | | | | |
| Total Insurance Operations | | $ | (12,000 | ) | | | (2.3 | )% | | $ | (9,000 | ) | | | (1.9 | )% | | $ | (67,000 | ) | | | (3.4 | )% | | $ | (48,500 | ) | | | (2.6 | )% |
| | | | | | | | | | | | | | | | | | | | | | | | | | | | | | | | | |
Note: Some amounts may not foot due to rounding.
| Selective Insurance Group, Inc. & Consolidated Subsidiaries | | | | |
| Consolidated Balance Sheets | | | | |
| | | | | |
| December 31, | | Unaudited | | |
| ($ in thousands, except share amounts) | | 2015 | | 2014 |
| ASSETS | | | | |
| Investments: | | | | |
| Fixed income securities, held-to-maturity – at carrying value (fair value: $209,544 – 2015; $333,961 – 2014) | | $ | 201,354 | | | 318,137 | |
| Fixed income securities, available-for-sale – at fair value (amortized cost: $4,352,514 – 2015; $3,975,786 – 2014) | | 4,408,203 | | | 4,066,122 | |
| Equity securities, available-for-sale – at fair value (cost: $193,816 – 2015; $159,011 – 2014) | | 207,051 | | | 191,400 | |
| Short-term investments (at cost which approximates fair value) | | 194,819 | | | 131,972 | |
| Other investments | | 77,842 | | | 99,203 | |
| Total investments | | 5,089,269 | | | 4,806,834 | |
| Cash | | 898 | | | 23,959 | |
| Interest and dividends due or accrued | | 38,501 | | | 38,901 | |
| Premiums receivable, net of allowance for uncollectible accounts of: $4,422 – 2015; $4,137 – 2014 | | 615,164 | | | 558,778 | |
| Reinsurance recoverable, net | | 561,968 | | | 581,548 | |
| Prepaid reinsurance premiums | | 140,889 | | | 146,993 | |
| Deferred federal income tax | | 92,696 | | | 98,449 | |
| Property and equipment – at cost, net of accumulated depreciation and amortization of: $188,548 – 2015; $172,183 – 2014 | | 65,701 | | | 59,416 | |
| Deferred policy acquisition costs | | 213,159 | | | 185,608 | |
| Goodwill | | 7,849 | | | 7,849 | |
| Other assets | | 78,339 | | | 66,607 | |
| Total assets | | $ | 6,904,433 | | | 6,574,942 | |
| | | | | |
| LIABILITIES AND STOCKHOLDERS’ EQUITY | | | | |
| Liabilities: | | | | |
| Reserve for losses and loss expenses | | $ | 3,517,728 | | | 3,477,870 | |
| Unearned premiums | | 1,169,710 | | | 1,095,819 | |
| Notes payable | | 388,192 | | | 372,689 | |
| Current federal income tax | | 7,442 | | | 3,921 | |
| Accrued salaries and benefits | | 167,336 | | | 158,382 | |
| Other liabilities | | 255,984 | | | 190,675 | |
| Total liabilities | | $ | 5,506,392 | | | 5,299,356 | |
| | | | | |
| Stockholders’ Equity: | | | | |
| Preferred stock of $0 par value per share: | | | | |
| Authorized shares 5,000,000; no shares issued or outstanding | | $ | — | | | — | |
| Common stock of $2 par value per share: | | | | |
| Authorized shares 360,000,000 | | | | |
| Issued: 100,861,372 – 2015; 99,947,933 – 2014 | | 201,723 | | | 199,896 | |
| Additional paid-in capital | | 326,656 | | | 305,385 | |
| Retained earnings | | 1,446,192 | | | 1,313,440 | |
| Accumulated other comprehensive (loss) income | | (9,425 | ) | | 19,788 | |
| Treasury stock – at cost (shares: 43,500,642 – 2015; 43,353,181 – 2014) | | (567,105 | ) | | (562,923 | ) |
| Total stockholders’ equity | | 1,398,041 | | | 1,275,586 | |
| Commitments and contingencies | | | | |
| Total liabilities and stockholders’ equity | | $ | 6,904,433 | | | 6,574,942 | |
Selective Insurance Group, Inc. & Consolidated Subsidiaries
Consolidated Statements of Income
| | Unaudited Quarter Ended December 31, | | Year Ended December 31,
|
| ($ in thousands, except per share amounts) | | 2015 | | 2014 | | Unaudited 2015 | | 2014 |
| Revenues: | | | | | | | | | | | | | | | | |
| Net premiums earned | | $ | 516,087 | | | | 469,850 | | | | 1,989,909 | | | | 1,852,609 | |
| Net investment income earned | | | 30,108 | | | | 32,108 | | | | 121,316 | | | | 138,708 | |
| Net realized gains: | | | | | | | | | | | | | | | | |
| Net realized investment gains | | | 7,939 | | | | 9,333 | | | | 31,537 | | | | 37,703 | |
| Other-than-temporary impairments | | | (10,539 | ) | | | (9,722 | ) | | | (18,366 | ) | | | (11,104 | ) |
| Total net realized (losses) gains | | | (2,600 | ) | | | (389 | ) | | | 13,171 | | | | 26,599 | |
| Other income | | | 1,935 | | | | 2,014 | | | | 7,456 | | | | 16,945 | |
| Total revenues | | | 545,530 | | | | 503,583 | | | | 2,131,852 | | | | 2,034,861 | |
| | | | | | | | | | | | | | | | | |
| Expenses: | | | | | | | | | | | | | | | | |
| Loss and loss expenses incurred | | | 286,820 | | | | 268,228 | | | | 1,148,541 | | | | 1,157,501 | |
| Policy acquisition costs | | | 180,525 | | | | 161,930 | | | | 689,820 | | | | 624,470 | |
| Interest expense | | | 5,603 | | | | 5,668 | | | | 22,428 | | | | 23,063 | |
| Other expenses | | | 8,784 | | | | 10,557 | | | | 38,371 | | | | 32,696 | |
| Total expenses | | | 481,732 | | | | 446,383 | | | | 1,899,160 | | | | 1,837,730 | |
| | | | | | | | | | | | | | | | | |
| Income from continuing operations, before federal income tax | | | 63,798 | | | | 57,200 | | | | 232,692 | | | | 197,131 | |
| | | | | | | | | | | | | | | | | |
| Federal income tax expense: | | | | | | | | | | | | | | | | |
| Current | | | 16,219 | | | | 5,723 | | | | 45,347 | | | | 28,415 | |
| Deferred | | | 2,190 | | | | 10,127 | | | | 21,484 | | | | 26,889 | |
| | | | | | | | | | | | | | | | | |
| Total federal income tax expense | | | 18,409 | | | | 15,850 | | | | 66,831 | | | | 55,304 | |
| | | | | | | | | | | | | | | | | |
| Net income | | $ | 45,389 | | | | 41,350 | | | | 165,861 | | | | 141,827 | |
| | | | | | | | | | | | | | | | | |
| Earnings per share: | | | | | | | | | | | | | | | | |
| Basic net income | | $ | 0.79 | | | | 0.73 | | | | 2.90 | | | | 2.52 | |
| | | | | | | | | | | | | | | | | |
| Diluted net income | | $ | 0.78 | | | | 0.72 | | | | 2.85 | | | | 2.47 | |
| | | | | | | | | | | | | | | | | |
| Dividends to stockholders | | $ | 0.15 | | | | 0.14 | | | | 0.57 | | | | 0.53 | |
| Selective Insurance Group, Inc. & Consolidated Subsidiaries | | | | | | |
| Consolidated Statements of Comprehensive Income | | | | | | |
| | | | | | | |
| December 31, | | Unaudited | | | | |
| ($ in thousands) | | 2015 | | 2014 | | 2013 |
| Net income | | $ | 165,861 | | | 141,827 | | | 106,418 | |
| | | | | | | |
| Other comprehensive loss, net of tax: | | | | | | |
| Unrealized (losses) gains on investment securities: | | | | | | |
| Unrealized holding (losses) gains arising during year | | (26,143 | ) | | 47,411 | | | (54,557 | ) |
Non-credit portion of other-than-temporary impairments recognized in other comprehensive income | | — | | | — | | | 50 | |
| Amount reclassified into net income: | | | | | | |
| Held-to-maturity securities | | (377 | ) | | (844 | ) | | (1,025 | ) |
| Non-credit other-than-temporary impairment | | 232 | | | 1,085 | | | 9 | |
| Realized gains on available-for-sale securities | | (9,110 | ) | | (18,762 | ) | | (15,301 | ) |
| Total unrealized (losses) gains on investment securities | | (35,398 | ) | | 28,890 | | | (70,824 | ) |
| | | | | | | |
| Defined benefit pension and post-retirement plans: | | | | | | |
| Net actuarial gain (loss) | | 1,585 | | | (35,189 | ) | | 38,775 | |
| Amounts reclassified into net income: | | | | | | |
| Net actuarial loss | | 4,600 | | | 1,236 | | | 2,843 | |
| Prior service cost | | — | | | — | | | 6 | |
| Curtailment expense | | — | | | — | | | 11 | |
| Total defined benefit pension and post-retirement plans | | 6,185 | | | (33,953 | ) | | 41,635 | |
| Other comprehensive loss | | (29,213 | ) | | (5,063 | ) | | (29,189 | ) |
| Comprehensive income | | $ | 136,648 | | | 136,764 | | | 77,229 | |
| Selective Insurance Group, Inc. & Consolidated Subsidiaries | | | | | | |
| Consolidated Statements of Stockholders’ Equity | | | | | | |
| | | | | | | |
| December 31, | | Unaudited | | | | |
| ($ in thousands, except share amounts) | | 2015 | | 2014 | | 2013 |
| Common stock: | | | | | | |
| Beginning of year | | $ | 199,896 | | | 198,240 | | | 196,388 | |
| Dividend reinvestment plan (shares: 50,013 – 2015; 58,309 – 2014; 63,349 – 2013) | | 100 | | | 117 | | | 127 | |
| Stock purchase and compensation plans (shares: 863,426 – 2015; 769,389 – 2014; 862,662 – 2013) | | 1,727 | | | 1,539 | | | 1,725 | |
| End of year | | 201,723 | | | 199,896 | | | 198,240 | |
| | | | | | | |
| Additional paid-in capital: | | | | | | |
| Beginning of year | | 305,385 | | | 288,182 | | | 270,654 | |
| Dividend reinvestment plan | | 1,374 | | | 1,306 | | | 1,396 | |
| Stock purchase and compensation plans | | 19,897 | | | 15,897 | | | 16,132 | |
| End of year | | 326,656 | | | 305,385 | | | 288,182 | |
| | | | | | | |
| Retained earnings: | | | | | | |
| Beginning of year | | 1,313,440 | | | 1,202,015 | | | 1,125,154 | |
| Net income | | 165,861 | | | 141,827 | | | 106,418 | |
Dividends to stockholders ($0.57 per share – 2015; $0.53 per share – 2014; $0.52 per share - 2013) | | (33,109 | ) | | (30,402 | ) | | (29,557 | ) |
| End of year | | 1,446,192 | | | 1,313,440 | | | 1,202,015 | |
| | | | | | | |
| Accumulated other comprehensive (loss) income: | | | | | | |
| Beginning of year | | 19,788 | | | 24,851 | | | 54,040 | |
| Other comprehensive loss | | (29,213 | ) | | (5,063 | ) | | (29,189 | ) |
| End of year | | (9,425 | ) | | 19,788 | | | 24,851 | |
| | | | | | | |
| Treasury stock: | | | | | | |
| Beginning of year | | (562,923 | ) | | (559,360 | ) | | (555,644 | ) |
| Acquisition of treasury stock (shares: 147,461 – 2015; 154,559 – 2014; 167,846 – 2013) | | (4,182 | ) | | (3,563 | ) | | (3,716 | ) |
| End of year | | (567,105 | ) | | (562,923 | ) | | (559,360 | ) |
| Total stockholders’ equity | | $ | 1,398,041 | | | 1,275,586 | | | 1,153,928 | |
| Selective Insurance Group, Inc. & Consolidated Subsidiaries | | | | | | |
| Consolidated Statements of Cash Flow | | | | | | |
| | | | | | | |
| December 31, | | Unaudited | | | | |
| ($ in thousands) | | 2015 | | 2014 | | 2013 |
| Operating Activities | | | | | | |
| Net income | | $ | 165,861 | | | 141,827 | | | 106,418 | |
| | | | | | | |
| Adjustments to reconcile net income to net cash provided by operating activities: | | | | | | |
| Depreciation and amortization | | 59,688 | | | 45,346 | | | 43,461 | |
| Sale of renewal rights | | — | | | (8,000 | ) | | — | |
| Loss on disposal of discontinued operations | | — | | | — | | | 997 | |
| Stock-based compensation expense | | 8,973 | | | 8,702 | | | 8,630 | |
| Undistributed losses (gains) of equity method investments | | 1,889 | | | (153 | ) | | 202 | |
| Net realized gains | | (13,171 | ) | | (26,599 | ) | | (20,732 | ) |
| Net gain on disposal of property and equipment | | — | | | (104 | ) | | — | |
| Retirement income plan curtailment expense | | — | | | — | | | 16 | |
| | | | | | | |
| Changes in assets and liabilities: | | | | | | |
| Increase in reserves for losses and loss expenses, net of reinsurance recoverables | | 59,438 | | | 97,449 | | | 151,037 | |
| Increase in unearned premiums, net of prepaid reinsurance | | 79,995 | | | 32,671 | | | 74,086 | |
| Decrease in net federal income taxes | | 25,004 | | | 31,323 | | | 14,834 | |
| Increase in premiums receivable | | (56,386 | ) | | (33,908 | ) | | (40,482 | ) |
| Increase in deferred policy acquisition costs | | (27,551 | ) | | (12,627 | ) | | (17,458 | ) |
| Decrease (increase) in interest and dividends due or accrued | | 407 | | | (1,536 | ) | | (1,372 | ) |
| Increase (decrease) in accrued salaries and benefits | | 11,392 | | | (7,182 | ) | | 18,685 | |
| Increase (decrease) in accrued insurance expenses | | 23,342 | | | (956 | ) | | 14,444 | |
| Increase (decrease) in other assets and other liabilities | | 42,699 | | | (33,490 | ) | | (16,642 | ) |
| Net adjustments | | 215,719 | | | 90,936 | | | 229,706 | |
| Net cash provided by operating activities | | 381,580 | | | 232,763 | | | 336,124 | |
| | | | | | | |
| Investing Activities | | | | | | |
| Purchase of fixed income securities, held-to-maturity | | (3,316 | ) | | — | | | — | |
| Purchase of fixed income securities, available-for-sale | | (1,041,916 | ) | | (843,616 | ) | | (1,069,387 | ) |
| Purchase of equity securities, available-for-sale | | (195,720 | ) | | (186,019 | ) | | (118,072 | ) |
| Purchase of other investments | | (12,170 | ) | | (10,617 | ) | | (9,332 | ) |
| Purchase of short-term investments | | (1,602,327 | ) | | (1,410,123 | ) | | (2,056,576 | ) |
| Sale of subsidiary | | — | | | — | | | 1,225 | |
| Sale of fixed income securities, available-for-sale | | 61,571 | | | 51,002 | | | 20,126 | |
| Sale of short-term investments | | 1,539,480 | | | 1,452,402 | | | 2,096,805 | |
| Redemption and maturities of fixed income securities, held-to-maturity | | 106,621 | | | 73,415 | | | 116,584 | |
| Redemption and maturities of fixed income securities, available-for-sale | | 567,445 | | | 482,816 | | | 513,804 | |
| Sale of equity securities, available-for-sale | | 172,561 | | | 208,008 | | | 115,782 | |
| Distributions from other investments | | 32,457 | | | 20,774 | | | 12,039 | |
| Purchase of property and equipment | | (16,229 | ) | | (15,510 | ) | | (14,023 | ) |
| Sale of renewal rights | | — | | | 8,000 | | | — | |
| Net cash used in investing activities | | (391,543 | ) | | (169,468 | ) | | (391,025 | ) |
| | | | | | | |
| Financing Activities | | | | | | |
| Dividends to stockholders | | (31,052 | ) | | (28,428 | ) | | (27,416 | ) |
| Acquisition of treasury stock | | (4,182 | ) | | (3,563 | ) | | (3,716 | ) |
| Net proceeds from stock purchase and compensation plans | | 10,089 | | | 7,283 | | | 7,119 | |
| Proceeds from issuance of notes payable, net of debt issuance costs | | — | | | — | | | 178,435 | |
| Proceeds from borrowings | | 15,000 | | | — | | | — | |
| Repayment of borrowings | | — | | | (13,000 | ) | | — | |
| Repayment of notes payable | | — | | | — | | | (100,000 | ) |
| Excess tax benefits from share-based payment arrangements | | 1,736 | | | 1,020 | | | 1,545 | |
| Repayment of capital lease obligations | | (4,689 | ) | | (2,841 | ) | | (1,083 | ) |
| Net (used in) cash provided by financing activities | | (13,098 | ) | | (39,529 | ) | | 54,884 | |
| Net (decrease) increase in cash | | (23,061 | ) | | 23,766 | | | (17 | ) |
| Cash, beginning of year | | 23,959 | | | 193 | | | 210 | |
| Cash, end of year | | $ | 898 | | | 23,959 | | | 193 | |
Selective Insurance Group, Inc.
Combined Insurance Company Subsidiaries
Statutory Balance Sheets
(unaudited)
| | | December 31, | | December 31, |
| ($ in thousands) | | 2015 | | 2014 |
| ASSETS | | | | | | | | |
| Bonds | | $ | 4,491,136 | | | | 4,241,580 | |
| Common stocks | | | 194,789 | | | | 191,400 | |
| Preferred stocks | | | 11,856 | | | | - | |
| Affiliated mortgage loan | | | 35,163 | | | | 35,961 | |
| Other investments | | | 128,788 | | | | 152,154 | |
| Short-term investments | | | 165,678 | | | | 115,342 | |
| Total investments | | | 5,027,410 | | | | 4,736,437 | |
| | | | | | | | | |
| Cash on hand and in banks | | | (34,378 | ) | | | 12,381 | |
| Interest and dividends due and accrued | | | 38,466 | | | | 38,908 | |
| Premiums receivable | | | 609,146 | | | | 556,086 | |
| Reinsurance recoverable on paid losses and expenses | | | 10,949 | | | | 9,570 | |
| Deferred tax recoverable | | | 142,066 | | | | 147,610 | |
| EDP equipment | | | 390 | | | | 518 | |
| Equities and deposits in pools and associations | | | 10,920 | | | | 9,915 | |
| Receivable for sold securities | | | 17 | | | | 34 | |
| Other assets | | | 28,300 | | | | 26,629 | |
| Total assets | | $ | 5,833,286 | | | | 5,538,088 | |
| | | | | | | | | |
| LIABILITIES | | | | | | | | |
| Reserve for losses | | $ | 2,426,583 | | | | 2,398,531 | |
| Reinsurance payable on paid loss and loss expense | | | 2,841 | | | | 2,957 | |
| Reserve for loss expenses | | | 525,322 | | | | 493,510 | |
| Unearned premiums | | | 1,028,820 | | | | 948,826 | |
| Reserve for commissions payable | | | 89,740 | | | | 70,259 | |
| Ceded balances payable | | | 37,222 | | | | 29,624 | |
| Federal income tax payable | | | 25,644 | | | | 20,524 | |
| Premium and other taxes payable | | | 23,998 | | | | 20,137 | |
| Borrowed money | | | 60,031 | | | | 45,027 | |
| Reserve for dividends to policyholders | | | 5,805 | | | | 3,895 | |
| Reserves for unauthorized reinsurance | | | 2,030 | | | | 7,661 | |
| Payable for securities | | | 6,204 | | | | 19,950 | |
| Funds withheld on account of others | | | 6,806 | | | | 7,473 | |
| Accrued salaries and benefits | | | 77,933 | | | | 64,207 | |
| Other liabilities | | | 87,987 | | | | 97,665 | |
| Total liabilities | | | 4,406,966 | | | | 4,230,246 | |
| | | | | | | | | |
| POLICYHOLDERS' SURPLUS | | | | | | | | |
| Capital | | | 42,725 | | | | 42,725 | |
| Paid in surplus | | | 492,869 | | | | 492,869 | |
| Unassigned surplus | | | 890,726 | | | | 772,248 | |
| Total policyholders' surplus | | | 1,426,320 | | | | 1,307,842 | |
| Total liabilities and policyholders' surplus | | $ | 5,833,286 | | | | 5,538,088 | |
Selective Insurance Group, Inc.
Combined Insurance Company Subsidiaries
Statutory Statements Of Income
(unaudited)
| | | Quarter Ended | | | | Year-to-Date | | |
| | | December 31, | | | | December 31, | | |
| ($ in thousands) | | 2015 | | | | 2014 | | | | 2015 | | | | 2014 | | |
| UNDERWRITING | | | | | | | | | | | | | | | | | | | | | | | | | | | | | | | | |
| Net premiums written | | $ | 474,658 | | | | | | | | 433,586 | | | | | | | | 2,069,904 | | | | | | | | 1,885,280 | | | | | |
| | | | | | | | | | | | | | | | | | | | | | | | | | | | | | | | | |
| Net premiums earned | | | 516,087 | | | | | | | | 469,850 | | | | | | | | 1,989,909 | | | | | | | | 1,852,609 | | | | | |
| | | | | | | | | | | | | | | | | | | | | | | | | | | | | | | | | |
| Net losses paid | | | 234,802 | | | | | | | | 210,724 | | | | | | | | 891,485 | | | | | | | | 873,159 | | | | | |
| Change in reserve for losses | | | (441 | ) | | | | | | | (9,756 | ) | | | | | | | 28,052 | | | | | | | | 57,055 | | | | | |
| Net losses incurred | | | 234,361 | | | | 45.4 | % | | | 200,968 | | | | 42.8 | % | | | 919,537 | | | | 46.2 | % | | | 930,214 | | | | 50.2 | % |
| | | | | | | | | | | | | | | | | | | | | | | | | | | | | | | | | |
| Net loss expenses paid | | | 53,288 | | | | | | | | 48,313 | | | | | | | | 197,433 | | | | | | | | 187,491 | | | | | |
| Change in reserve for loss expenses | | | (931 | ) | | | | | | | 17,577 | | | | | | | | 31,813 | | | | | | | | 37,526 | | | | | |
| Net loss expenses incurred | | | 52,357 | | | | 10.2 | % | | | 65,890 | | | | 14.0 | % | | | 229,246 | | | | 11.5 | % | | | 225,017 | | | | 12.2 | % |
| | | | | | | | | | | | | | | | | | | | | | | | | | | | | | | | | |
| Net underwriting expenses incurred | | | 179,153 | | | | 37.6 | % | | | 157,373 | | | | 36.2 | % | | | 716,172 | | | | 34.6 | % | | | 635,760 | | | | 33.7 | % |
| | | | | | | | | | | | | | | | | | | | | | | | | | | | | | | | | |
| Total deductions | | | 465,871 | | | | | | | | 424,231 | | | | | | | | 1,864,955 | | | | | | | | 1,790,991 | | | | | |
| Statutory underwriting gain | | | 50,216 | | | | | | | | 45,619 | | | | | | | | 124,954 | | | | | | | | 61,618 | | | | | |
| | | | | | | | | | | | | | | | | | | | | | | | | | | | | | | | | |
| Net loss from premium balances charged off | | | (773 | ) | | | | | | | (54 | ) | | | | | | | (2,919 | ) | | | | | | | (2,822 | ) | | | | |
| Finance charges and other income | | | 1,983 | | | | | | | | 1,617 | | | | | | | | 7,671 | | | | | | | | 17,204 | | | | | |
| Total other income | | | 1,210 | | | | -0.2 | % | | | 1,563 | | | | -0.3 | % | | | 4,752 | | | | -0.2 | % | | | 14,382 | | | | -0.7 | % |
| Policyholders' dividends incurred | | | (929 | ) | | | 0.2 | % | | | (2,239 | ) | | | 0.5 | % | | | (6,219 | ) | | | 0.3 | % | | | (6,182 | ) | | | 0.3 | % |
| Total underwriting gain | | | 50,497 | | | | 93.2 | % | | | 44,943 | | | | 93.2 | % | | | 123,487 | | | | 92.4 | % | | | 69,818 | | | | 95.7 | % |
| | | | | | | | | | | | | | | | | | | | | | | | | | | | | | | | | |
| INVESTMENT | | | | | | | | | | | | | | | | | | | | | | | | | | | | | | | | |
| Net investment income earned | | | 29,455 | | | | | | | | 31,745 | | | | | | | | 120,558 | | | | | | | | 137,670 | | | | | |
| Net realized (loss) gain | | | (2,600 | ) | | | | | | | (389 | ) | | | | | | | 13,170 | | | | | | | | 26,594 | | | | | |
| Total income before income tax | | | 77,352 | | | | | | | | 76,299 | | | | | | | | 257,215 | | | | | | | | 234,082 | | | | | |
| | | | | | | | | | | | | | | | | | | | | | | | | | | | | | | | | |
| Federal income tax expense | | | 23,648 | | | | | | | | 11,775 | | | | | | | | 61,377 | | | | | | | | 43,827 | | | | | |
| | | | | | | | | | | | | | | | | | | | | | | | | | | | | | | | | |
| Net income | | $ | 53,704 | | | | | | | | 64,524 | | | | | | | | 195,838 | | | | | | | | 190,255 | | | | | |
| | | | | | | | | | | | | | | | | | | | | | | | | | | | | | | | | |
| Policyholders' Surplus | | | | | | | | | | | | | | | | | | | | | | | | | | | | | | | | |
| Surplus, beginning of period | | $ | 1,367,343 | | | | | | | | 1,323,097 | | | | | | | | 1,307,842 | | | | | | | | 1,256,431 | | | | | |
| | | | | | | | | | | | | | | | | | | | | | | | | | | | | | | | | |
| Net income | | | 53,704 | | | | | | | | 64,524 | | | | | | | | 195,838 | | | | | | | | 190,255 | | | | | |
| Change in deferred taxes | | | (2,236 | ) | | | | | | | 8,146 | | | | | | | | (13,637 | ) | | | | | | | (2,016 | ) | | | | |
| Change in net unrealized capital gain / (losses) | | | 7,522 | | | | | | | | 693 | | | | | | | | (12,579 | ) | | | | | | | (3,721 | ) | | | | |
| Dividends to stockholders | | | (14,438 | ) | | | | | | | (14,378 | ) | | | | | | | (57,752 | ) | | | | | | | (57,511 | ) | | | | |
| Change in reserve for unauthorized | | | 5,631 | | | | | | | | (4,927 | ) | | | | | | | 5,631 | | | | | | | | (4,927 | ) | | | | |
| Change in non-admitted assets | | | 4,510 | | | | | | | | (15,801 | ) | | | | | | | (8,151 | ) | | | | | | | (18,004 | ) | | | | |
| Change in Overfunded Contra Asset | | | 562 | | | | | | | | (1,285 | ) | | | | | | | (280 | ) | | | | | | | (5,925 | ) | | | | |
| Qual Pen Trans Liab | | | 2,677 | | | | | | | | (50,660 | ) | | | | | | | 8,211 | | | | | | | | (45,214 | ) | | | | |
| Excess Plan Trans Liab | | | 748 | | | | | | | | (1,400 | ) | | | | | | | 878 | | | | | | | | (1,377 | ) | | | | |
| PRL Plan Trans Liab | | | 297 | | | | | | | | (167 | ) | | | | | | | 319 | | | | | | | | (149 | ) | | | | |
| | | | | | | | | | | | | | | | | | | | | | | | | | | | | | | | | |
| Net change in surplus for period | | | 58,977 | | | | | | | | (15,255 | ) | | | | | | | 118,478 | | | | | | | | 51,411 | | | | | |
| | | | | | | | | | | | | | | | | | | | | | | | | | | | | | | | | |
| Surplus, end of period | | $ | 1,426,320 | | | | | | | | 1,307,842 | | | | | | | | 1,426,320 | | | | | | | | 1,307,842 | | | | | |
| | | | | | | | | | | | | | | | | | | | | | | | | | | | | | | | | |
| Statutory underwriting gain | | $ | 50,497 | | | | | | | | 44,943 | | | | | | | | 123,487 | | | | | | | | 69,818 | | | | | |
| | | | | | | | | | | | | | | | | | | | | | | | | | | | | | | | | |
| Adjustments under GAAP: | | | | | | | | | | | | | | | | | | | | | | | | | | | | | | | | |
| Deferred policy acquisition costs | | | (507 | ) | | | | | | | (4,074 | ) | | | | | | | 27,551 | | | | | | | | 12,626 | | | | | |
| Other, net | | | (937 | ) | | | | | | | (2,232 | ) | | | | | | | (2,009 | ) | | | | | | | (4,301 | ) | | | | |
| GAAP underwriting gain | | $ | 49,053 | | | | | | | | 38,637 | | | | | | | | 149,029 | | | | | | | | 78,143 | | | | | |
| | | | | | | | | | | | | | | | | | | | | | | | | | | | | | | | | |
| | | | | | | | | | | | | | | | | | | | | | | | | | | | | | | | | |
Note: Some amounts or ratios may not foot due to rounding
Selective Insurance Group, Inc. and Consolidated Subsidiaries
Alternative Investments
December 31, 2015
(unaudited)
| | | | | |
| | Number | Original | Remaining | Current |
| Strategy | of Funds | Commitment | Commitment | Market Value |
| Private Equity | 9 | 111,498,351 | 30,204,172 | 35,087,904 |
| Private Credit | 5 | 60,000,000 | 15,129,467 | 13,246,148 |
| Real Assets | 7 | 100,000,000 | 25,819,631 | 19,499,570 |
| TOTAL - ALTERNATIVE INVESTMENTS | 21 | 271,498,351 | 71,153,269 | 67,833,623 |
| | | | | |
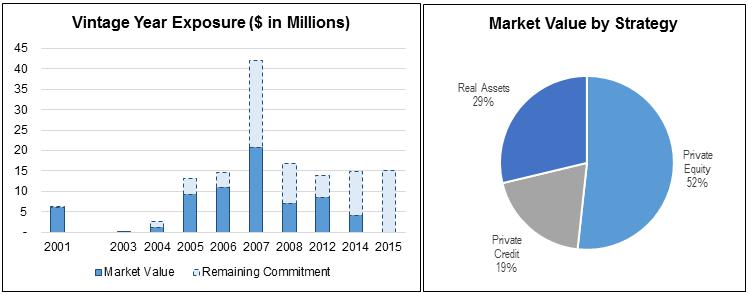
Exhibit may not foot due to rounding