Exhibit 99.2
Supplemental Investor Package
Second Quarter 2016
Investor Contact: Dale A. Thatcher Tel: 973-948-3000 Investor.Relations@Selective.com |
Selective Insurance Group, Inc. & Consolidated Subsidiaries
Selected Balance Sheet Data
(unaudited)
| June 30, | June 30, | December 31, | ||||||||||||||||||||||||||||||||||
| ($ in thousands, except per share data) | 2016 | 2015 | 2015 | |||||||||||||||||||||||||||||||||
| Unrecognized/ | Unrecognized/ | Unrecognized/ | ||||||||||||||||||||||||||||||||||
| Balance | Market | Unrealized | Balance | Market | Unrealized | Balance | Market | Unrealized | ||||||||||||||||||||||||||||
| Sheet | Value | Gain | Sheet | Value | Gain | Sheet | Value | Gain | ||||||||||||||||||||||||||||
| Invested Assets: | ||||||||||||||||||||||||||||||||||||
| Corporate bonds1 | $ | 3,132,689 | 3,135,192 | 80,119 | $ | 2,782,479 | 2,785,884 | 36,643 | $ | 2,955,001 | 2,957,427 | 8,276 | ||||||||||||||||||||||||
| Government and Municipal bonds | 1,699,394 | 1,703,655 | 92,059 | 1,658,198 | 1,666,636 | 35,307 | 1,654,556 | 1,660,320 | 55,901 | |||||||||||||||||||||||||||
| Total fixed income securities | 4,832,083 | 4,838,847 | 172,178 | 4,440,677 | 4,452,520 | 71,950 | 4,609,557 | 4,617,747 | 64,177 | |||||||||||||||||||||||||||
| Equities | 152,938 | 152,938 | 26,057 | 228,883 | 228,883 | 10,745 | 207,051 | 207,051 | 13,235 | |||||||||||||||||||||||||||
| Short-term investments | 205,451 | 205,451 | - | 168,349 | 168,349 | - | 194,819 | 194,819 | - | |||||||||||||||||||||||||||
| Other investments | 76,051 | 76,051 | - | 85,420 | 85,420 | - | 77,842 | 77,842 | - | |||||||||||||||||||||||||||
| Total invested assets | $ | 5,266,523 | 5,273,287 | 198,235 | 4,923,329 | 4,935,172 | 82,695 | 5,089,269 | 5,097,459 | 77,412 | ||||||||||||||||||||||||||
| Invested assets per $ of stockholders' equity | 3.39 | 3.76 | 3.64 | |||||||||||||||||||||||||||||||||
| Total assets | 7,189,641 | 6,777,952 | 6,904,433 | |||||||||||||||||||||||||||||||||
| Liabilities: | ||||||||||||||||||||||||||||||||||||
| Reserve for loss and loss expenses | 3,590,169 | 3,535,433 | 3,517,728 | |||||||||||||||||||||||||||||||||
| Unearned premium reserve | 1,263,450 | 1,177,901 | 1,169,710 | |||||||||||||||||||||||||||||||||
| Total liabilities | 5,636,904 | 5,467,639 | 5,506,392 | |||||||||||||||||||||||||||||||||
| Stockholders' equity | 1,552,737 | 1,310,313 | 1,398,041 | |||||||||||||||||||||||||||||||||
| Total debt to capitalization ratio | 20.0 | % | 22.8 | % | 21.7 | % | ||||||||||||||||||||||||||||||
| Book value per share | 26.86 | 22.95 | 24.37 | |||||||||||||||||||||||||||||||||
| Book value per share excluding | ||||||||||||||||||||||||||||||||||||
| unrealized gain or loss on fixed income portfolio | 25.00 | 22.26 | 23.74 | |||||||||||||||||||||||||||||||||
| NPW per insurance segment employee | 1,011 | 945 | 979 | |||||||||||||||||||||||||||||||||
| Statutory premiums to surplus ratio | 1.4 | x | 1.5 | x | 1.5 | x | ||||||||||||||||||||||||||||||
| Statutory surplus | 1,506,535 | 1,344,630 | 1,426,320 | |||||||||||||||||||||||||||||||||
1Includes mortgage-backed and asset-backed securities.
Selective Insurance Group, Inc. & Consolidated Subsidiaries
Selected Income Statement Data
(unaudited)
| Quarter Ended June 30, | Year-to-Date June 30, | ||||||||||||||||||||||||||||||||
| ($ in thousands, except per share amounts) | 2016 | 2015 | 2016 | 2015 | |||||||||||||||||||||||||||||
| Per diluted share | Per diluted share | Per diluted share | Per diluted share | ||||||||||||||||||||||||||||||
| Consolidated | |||||||||||||||||||||||||||||||||
| Revenue | $ | 568,747 | $ | 521,973 | $ | 1,120,221 | $ | 1,045,865 | |||||||||||||||||||||||||
| Operating income | 42,454 | 0.72 | 35,991 | 0.62 | 81,244 | 1.39 | 63,425 | 1.10 | |||||||||||||||||||||||||
| Net realized gains (losses), after tax | 1,147 | 0.02 | (2,223 | ) | (0.04 | ) | (611 | ) | (0.01 | ) | 10,051 | 0.17 | |||||||||||||||||||||
| Net income | 43,601 | 0.74 | 33,768 | 0.58 | 80,633 | 1.38 | 73,476 | 1.27 | |||||||||||||||||||||||||
| Return on equity | 11.5 | % | 10.3 | % | 10.9 | % | 11.4 | % | |||||||||||||||||||||||||
| Operating return on equity | 11.2 | % | 11.0 | % | 11.0 | % | 9.8 | % | |||||||||||||||||||||||||
| Total Insurance Operations | |||||||||||||||||||||||||||||||||
| Gross premiums written | 673,650 | 626,368 | 1,326,248 | 1,231,232 | |||||||||||||||||||||||||||||
| Net premiums written | 578,140 | 532,133 | 1,143,499 | 1,050,221 | |||||||||||||||||||||||||||||
| Net premiums earned | 531,932 | 490,309 | 1,054,390 | 966,432 | |||||||||||||||||||||||||||||
| Underwriting gain | - before tax | 43,777 | 29,124 | 84,732 | 55,145 | ||||||||||||||||||||||||||||
| - after tax | 28,455 | 0.49 | 18,930 | 0.33 | 55,076 | 0.94 | 35,844 | 0.62 | |||||||||||||||||||||||||
| GAAP combined ratio | 91.8 | % | 94.1 | % | 92.0 | % | 94.3 | % | |||||||||||||||||||||||||
| Standard Commercial Lines | |||||||||||||||||||||||||||||||||
| Net premiums earned | 411,277 | 377,205 | 814,166 | 742,738 | |||||||||||||||||||||||||||||
| GAAP combined ratio | 90.2 | % | 90.7 | % | 91.3 | % | 91.2 | % | |||||||||||||||||||||||||
| Standard Personal Lines | |||||||||||||||||||||||||||||||||
| Net premiums earned | 70,824 | 72,071 | 141,029 | 144,550 | |||||||||||||||||||||||||||||
| GAAP combined ratio | 91.4 | % | 106.5 | % | 89.6 | % | 104.9 | % | |||||||||||||||||||||||||
| Excess and Surplus Lines | |||||||||||||||||||||||||||||||||
| Net premiums earned | 49,831 | 41,033 | 99,195 | 79,144 | |||||||||||||||||||||||||||||
| GAAP combined ratio | 105.1 | % | 103.6 | % | 101.1 | % | 103.8 | % | |||||||||||||||||||||||||
| Investments | |||||||||||||||||||||||||||||||||
| Net investment income | - before tax | 31,182 | 32,230 | 61,951 | 59,147 | ||||||||||||||||||||||||||||
| - after tax | 23,525 | 0.40 | 24,779 | 0.43 | 47,085 | 0.80 | 45,987 | 0.80 | |||||||||||||||||||||||||
| Effective tax rate | 24.6 | % | 23.1 | % | 24.0 | % | 22.2 | % | |||||||||||||||||||||||||
| Annualized after-tax yield on investment portfolio | 1.8 | % | 1.9 | % | |||||||||||||||||||||||||||||
| Annualized after-tax, after-interest expense yield | 1.5 | % | 1.6 | % | |||||||||||||||||||||||||||||
| Invested assets per $ of stockholders' equity | 3.39 | 3.76 | |||||||||||||||||||||||||||||||
| Other expenses (net of other income) | |||||||||||||||||||||||||||||||||
| Interest expense | - before tax | (5,620 | ) | (5,612 | ) | (11,226 | ) | (11,216 | ) | ||||||||||||||||||||||||
| - after tax | (3,653 | ) | (0.06 | ) | (3,649 | ) | (0.06 | ) | (7,297 | ) | (0.12 | ) | (7,291 | ) | (0.13 | ) | |||||||||||||||||
| Other expense - after tax | $ | (5,873 | ) | (0.11 | ) | $ | (4,069 | ) | (0.08 | ) | $ | (13,620 | ) | (0.23 | ) | $ | (11,115 | ) | (0.19 | ) | |||||||||||||
| Diluted weighted avg shares outstanding | 58,598 | 57,805 | 58,552 | 57,761 | |||||||||||||||||||||||||||||
Selective Insurance Group, Inc. & Consolidated Subsidiaries
GAAP Insurance Operations Results
(unaudited)
| Second Quarter | |||||||||
| ($ in thousands) | Quarter Ended June 30, 2016 | Quarter Ended June 30, 2015 | |||||||
| Standard Commercial Lines | Standard Personal Lines | Excess & Surplus Lines | Grand Total | Standard Commercial Lines | Standard Personal Lines | Excess & Surplus Lines | Grand Total | ||
| Net Premiums Written | 449,008 | 75,576 | 53,556 | 578,140 | 410,821 | 75,986 | 45,326 | 532,133 | |
| Net Premiums Earned | 411,277 | 70,824 | 49,831 | 531,932 | 377,205 | 72,071 | 41,033 | 490,309 | |
| Loss and Loss Expense Incurred | 221,618 | 42,212 | 34,649 | 298,479 | 210,088 | 53,933 | 27,540 | 291,561 | |
| Net Underwriting Expenses Incurred | 147,868 | 22,487 | 17,703 | 188,058 | 130,032 | 22,793 | 14,955 | 167,780 | |
| Dividends to Policyholders | 1,618 | - | - | 1,618 | 1,844 | - | - | 1,844 | |
| GAAP Underwriting Gain (Loss) | 40,173 | 6,125 | (2,521) | 43,777 | 35,241 | (4,655) | (1,462) | 29,124 | |
| GAAP Ratios | |||||||||
| Loss and Loss Expense Ratio | 53.9% | 59.6% | 69.5% | 56.1% | 55.7% | 74.8% | 67.1% | 59.5% | |
| Underwriting Expense Ratio | 35.9% | 31.8% | 35.6% | 35.4% | 34.5% | 31.7% | 36.5% | 34.2% | |
| Dividends to Policyholders Ratio | 0.4% | 0.0% | 0.0% | 0.3% | 0.5% | 0.0% | 0.0% | 0.4% | |
| Combined Ratio | 90.2% | 91.4% | 105.1% | 91.8% | 90.7% | 106.5% | 103.6% | 94.1% | |
| Year-to-Date | |||||||||
| ($ in thousands) | Year-to-Date June 30, 2016 | Year-to-Date June 30, 2015 | |||||||
| Standard Commercial Lines | Standard Personal Lines | Excess & Surplus Lines | Grand Total | Standard Commercial Lines | Standard Personal Lines | Excess & Surplus Lines | Grand Total | ||
| Net Premiums Written | 904,071 | 137,545 | 101,883 | 1,143,499 | 826,079 | 141,010 | 83,132 | 1,050,221 | |
| Net Premiums Earned | 814,166 | 141,029 | 99,195 | 1,054,390 | 742,738 | 144,550 | 79,144 | 966,432 | |
| Loss and Loss Expense Incurred | 444,968 | 81,907 | 68,748 | 595,623 | 416,236 | 106,902 | 53,422 | 576,560 | |
| Net Underwriting Expenses Incurred | 294,822 | 44,392 | 31,550 | 370,764 | 257,856 | 44,769 | 28,733 | 331,358 | |
| Dividends to Policyholders | 3,271 | - | - | 3,271 | 3,369 | - | - | 3,369 | |
| GAAP Underwriting Gain (Loss) | 71,105 | 14,730 | (1,103) | 84,732 | 65,277 | (7,121) | (3,011) | 55,145 | |
| GAAP Ratios | |||||||||
| Loss and Loss Expense Ratio | 54.7% | 58.1% | 69.3% | 56.5% | 56.0% | 74.0% | 67.5% | 59.7% | |
| Underwriting Expense Ratio | 36.2% | 31.5% | 31.8% | 35.2% | 34.7% | 30.9% | 36.3% | 34.3% | |
| Dividends to Policyholders Ratio | 0.4% | 0.0% | 0.0% | 0.3% | 0.5% | 0.0% | 0.0% | 0.3% | |
| Combined Ratio | 91.3% | 89.6% | 101.1% | 92.0% | 91.2% | 104.9% | 103.8% | 94.3% | |
Selective Insurance Group, Inc. and Consolidated Subsidiaries
GAAP Investment Income
June 2016 (unaudited)
| Quarter Ended | % | Year-to-Date | % | |||||||||||
| June | June | Increase | June | June | Increase | |||||||||
($ in thousands, except per share data) | 2016 | 2015 | (Decrease) | 2016 | 2015 | (Decrease) | ||||||||
| Investment Income: | ||||||||||||||
| Interest: | ||||||||||||||
| Fixed Income Securities | $31,753 | 30,659 | 4 | $63,397 | 61,626 | 3 | ||||||||
| Short-term | 142 | 23 | 517 | 301 | 48 | 527 | ||||||||
| Other Investments | (611) | 1,422 | (143) | (1,677) | (2,118) | 21 | ||||||||
| Dividends | 2,204 | 2,384 | (8) | 4,434 | 4,176 | 6 | ||||||||
| 33,488 | 34,488 | (3) | 66,455 | 63,732 | 4 | |||||||||
| Investment Expense | 2,306 | 2,258 | 2 | 4,504 | 4,585 | (2) | ||||||||
| Net Investment Income Before Tax | 31,182 | 32,230 | (3) | 61,951 | 59,147 | 5 | ||||||||
| Tax | 7,657 | 7,451 | 3 | 14,866 | 13,160 | 13 | ||||||||
| Net Investment Income After Tax | $23,525 | 24,779 | (5) | $47,085 | 45,987 | 2 | ||||||||
| Net Investment Income per Share | $ 0.40 | 0.43 | (7) | $ 0.80 | 0.80 | 0 | ||||||||
| Effective Tax Rate | 24.6% | 23.1% | 24.0% | 22.2% | ||||||||||
| Average Yields : | ||||||||||||||
| Fixed Income Securities: | ||||||||||||||
| Pre Tax | 2.69% | 2.79% | ||||||||||||
| After Tax | 2.01% | 2.12% | ||||||||||||
| Portfolio: | ||||||||||||||
| Pre Tax | 2.39% | 2.43% | ||||||||||||
| After Tax | 1.82% | 1.89% | ||||||||||||
| Quarter Ended | Year-to-Date | |||||||||||||
| June | June | June | June | |||||||||||
| Net Realized Gains (Losses) | 2016 | 2015 | 2016 | 2015 | ||||||||||
| Fixed Income Securities | 171 | 288 | (219) | 667 | ||||||||||
| Equity Securities | 1,594 | (3,708) | (716) | 15,450 | ||||||||||
| Other Investments | - | - | (4) | (654) | ||||||||||
| Total | 1,765 | (3,420) | (939) | 15,463 | ||||||||||
| Net of Tax | 1,147 | (2,223) | (611) | 10,051 | ||||||||||
As of June 30, 2016 year-to-date new money rates for fixed income securities were 3.0% on a pre-tax basis and 2.1% on an after-tax basis.
Selective Insurance Group, Inc.
Combined Insurance Company Subsidiaries
2016 Statutory Results by Line of Business
Quarter Ended June 2016 (unaudited)
| Net | Net | Underwriting | Dividends to | |||||||||||||||||||||||||||||||||||||||||
| Premiums | Percent | Premiums | Percent | Loss | LAE | Expense | Policyholders | Combined Ratio | Combined Ratio | Underwriting | ||||||||||||||||||||||||||||||||||
| ($ in thousands) | Written | Change | Earned | Change | Ratio | Ratio | Ratio | Ratio | 2016 | 2015 | Gain (Loss) | |||||||||||||||||||||||||||||||||
| Standard Personal Lines: | ||||||||||||||||||||||||||||||||||||||||||||
| Homeowners | $ | 35,993 | (0.8 | )% | $ | 33,411 | (0.9 | )% | 40.2 | % | 8.8 | % | 35.3 | % | 0.0 | % | 84.4 | % | 114.3 | % | $ | 4,308 | ||||||||||||||||||||||
| Auto | 37,956 | 0.1 | % | 35,881 | (2.3 | )% | 58.7 | % | 11.4 | % | 34.2 | % | 0.0 | % | 104.3 | % | 106.4 | % | (2,248 | ) | ||||||||||||||||||||||||
| Other (including flood) | 1,627 | (8.7 | )% | 1,532 | (4.3 | )% | 68.1 | % | (23.9 | )% | (173.5 | )% | 0.0 | % | (129.2 | )% | (93.1 | )% | 2,503 | |||||||||||||||||||||||||
| Total | $ | 75,576 | (0.5 | )% | $ | 70,824 | (1.7 | )% | 50.2 | % | 9.4 | % | 30.3 | % | 0.0 | % | 89.9 | % | 105.4 | % | $ | 5,737 | ||||||||||||||||||||||
| Standard Commercial Lines: | ||||||||||||||||||||||||||||||||||||||||||||
| Commercial property | $ | 79,354 | 12.2 | % | $ | 73,591 | 10.6 | % | 35.4 | % | 5.0 | % | 37.5 | % | 0.3 | % | 78.2 | % | 95.3 | % | $ | 13,883 | ||||||||||||||||||||||
| Workers compensation | 79,074 | 4.8 | % | 75,251 | 6.1 | % | 43.6 | % | 14.1 | % | 28.7 | % | 1.3 | % | 87.7 | % | 89.2 | % | 8,167 | |||||||||||||||||||||||||
| General liability | 145,489 | 8.1 | % | 129,283 | 8.5 | % | 34.4 | % | 13.9 | % | 35.0 | % | 0.2 | % | 83.5 | % | 77.6 | % | 15,696 | |||||||||||||||||||||||||
| Auto | 108,888 | 12.2 | % | 98,896 | 11.5 | % | 64.4 | % | 9.9 | % | 32.5 | % | 0.2 | % | 107.0 | % | 100.6 | % | (10,191 | ) | ||||||||||||||||||||||||
| Businessowners' policies | 25,275 | 7.2 | % | 24,651 | 6.4 | % | 33.3 | % | 11.5 | % | 37.6 | % | 0.0 | % | 82.4 | % | 108.6 | % | 4,114 | |||||||||||||||||||||||||
| Bonds | 6,846 | 17.7 | % | 5,665 | 11.0 | % | 12.8 | % | 7.4 | % | 54.3 | % | 0.0 | % | 74.6 | % | 86.6 | % | 800 | |||||||||||||||||||||||||
| Other | 4,082 | 14.9 | % | 3,940 | 10.9 | % | 0.3 | % | 0.2 | % | 55.9 | % | 0.0 | % | 56.4 | % | 55.8 | % | 1,639 | |||||||||||||||||||||||||
| Total | $ | 449,008 | 9.3 | % | $ | 411,277 | 9.0 | % | 42.8 | % | 11.0 | % | 34.4 | % | 0.4 | % | 88.6 | % | 90.1 | % | $ | 34,107 | ||||||||||||||||||||||
| E&S | $ | 53,556 | 18.2 | % | $ | 49,831 | 21.4 | % | 49.1 | % | 20.5 | % | 33.1 | % | 0.0 | % | 102.7 | % | 102.7 | % | $ | (2,571 | ) | |||||||||||||||||||||
| Total Insurance Operations | $ | 578,140 | 8.6 | % | $ | 531,932 | 8.5 | % | 44.3 | % | 11.7 | % | 33.8 | % | 0.3 | % | 90.1 | % | 93.5 | % | $ | 37,274 | ||||||||||||||||||||||
| Note: Some amounts may not foot due to rounding. | ||||||||||||||||||||||||||||||||||||||||||||
| 2016 | 2015 | |||||||||||||||||||||||||||||||||||||||||||
| Losses Paid | $ | 241,720 | $ | 224,744 | ||||||||||||||||||||||||||||||||||||||||
| LAE Paid | 51,045 | 49,067 | ||||||||||||||||||||||||||||||||||||||||||
| Total Paid | $ | 292,765 | $ | 273,811 | ||||||||||||||||||||||||||||||||||||||||
Selective Insurance Group, Inc.
Combined Insurance Company Subsidiaries
2016 Statutory Results by Line of Business
Year-to-Date June 2016 (unaudited)
| Net | Net | Underwriting | Dividends to | |||||||||||||||||||||||||||||||||||||||||
| Premiums | Percent | Premiums | Percent | Loss | LAE | Expense | Policyholders | Combined Ratio | Combined Ratio | Underwriting | ||||||||||||||||||||||||||||||||||
| ($ in thousands) | Written | Change | Earned | Change | Ratio | Ratio | Ratio | Ratio | 2016 | 2015 | Gain (Loss) | |||||||||||||||||||||||||||||||||
| Standard Personal Lines: | ||||||||||||||||||||||||||||||||||||||||||||
| Homeowners | $ | 62,566 | (2.8 | )% | $ | 66,311 | (1.7 | )% | 38.6 | % | 8.4 | % | 38.0 | % | 0.0 | % | 85.0 | % | 113.8 | % | $ | 11,380 | ||||||||||||||||||||||
| Auto | 71,979 | (2.1 | )% | 71,661 | (2.8 | )% | 58.2 | % | 11.2 | % | 35.1 | % | 0.0 | % | 104.5 | % | 106.5 | % | (3,368 | ) | ||||||||||||||||||||||||
| Other (including flood) | 3,000 | (4.7 | )% | 3,057 | (8.7 | )% | 64.3 | % | (31.8 | )% | (168.6 | )% | 0.0 | % | (136.1 | )% | (103.0 | )% | 7,119 | |||||||||||||||||||||||||
| Total | $ | 137,545 | (2.5 | )% | $ | 141,029 | (2.4 | )% | 49.1 | % | 9.0 | % | 32.0 | % | 0.0 | % | 90.1 | % | 105.2 | % | $ | 15,131 | ||||||||||||||||||||||
| Standard Commercial Lines: | ||||||||||||||||||||||||||||||||||||||||||||
| Commercial property | $ | 154,998 | 9.4 | % | $ | 143,769 | 9.7 | % | 41.4 | % | 4.8 | % | 38.6 | % | 0.4 | % | 84.8 | % | 96.9 | % | $ | 17,483 | ||||||||||||||||||||||
| Workers compensation | 170,386 | 7.0 | % | 151,251 | 8.5 | % | 41.8 | % | 14.0 | % | 27.3 | % | 1.1 | % | 84.3 | % | 89.9 | % | 18,531 | |||||||||||||||||||||||||
| General liability | 290,195 | 9.5 | % | 257,368 | 9.9 | % | 35.5 | % | 12.6 | % | 35.0 | % | 0.2 | % | 83.4 | % | 75.3 | % | 31,106 | |||||||||||||||||||||||||
| Auto | 217,096 | 12.1 | % | 194,315 | 11.0 | % | 63.9 | % | 9.4 | % | 32.4 | % | 0.3 | % | 106.0 | % | 100.0 | % | (19,021 | ) | ||||||||||||||||||||||||
| Businessowners' policies | 50,069 | 4.7 | % | 48,555 | 5.8 | % | 38.2 | % | 11.5 | % | 38.9 | % | 0.0 | % | 88.6 | % | 113.6 | % | 4,961 | |||||||||||||||||||||||||
| Bonds | 12,771 | 15.8 | % | 11,129 | 10.1 | % | 12.8 | % | 7.4 | % | 57.5 | % | 0.0 | % | 77.8 | % | 85.6 | % | 1,526 | |||||||||||||||||||||||||
| Other | 8,556 | 13.0 | % | 7,779 | 10.8 | % | (0.4 | )% | 0.2 | % | 55.3 | % | 0.0 | % | 55.1 | % | 53.9 | % | 3,064 | |||||||||||||||||||||||||
| Total | $ | 904,071 | 9.4 | % | $ | 814,166 | 9.6 | % | 44.0 | % | 10.5 | % | 34.2 | % | 0.4 | % | 89.1 | % | 89.9 | % | $ | 57,650 | ||||||||||||||||||||||
| E&S | $ | 101,883 | 22.6 | % | $ | 99,195 | 25.3 | % | 49.3 | % | 20.0 | % | 31.3 | % | 0.0 | % | 100.6 | % | 102.5 | % | $ | (1,475 | ) | |||||||||||||||||||||
| Total Insurance Operations | $ | 1,143,499 | 8.9 | % | $ | 1,054,390 | 9.1 | % | 45.2 | % | 11.2 | % | 33.7 | % | 0.3 | % | 90.4 | % | 93.2 | % | $ | 71,306 | ||||||||||||||||||||||
| Note: Some amounts may not foot due to rounding. | ||||||||||||||||||||||||||||||||||||||||||||
| 2016 | 2015 | |||||||||||||||||||||||||||||||||||||||||||
| Losses Paid | $ | 452,393 | $ | 419,110 | ||||||||||||||||||||||||||||||||||||||||
| LAE Paid | 97,169 | 94,061 | ||||||||||||||||||||||||||||||||||||||||||
| Total Paid | $ | 549,562 | $ | 513,171 | ||||||||||||||||||||||||||||||||||||||||
Selective Insurance Group, Inc.
Combined Insurance Company Subsidiaries
2016 Net Catastrophe Losses and Prior Year Casualty Reserve Development
Statutory Results by Line of Business
(unaudited)
| Quarter Ended | Year-to-Date | |||||||||||||||||||||||||||||||
| Net Catastrophe Losses Incurred | June 30, 2016 | June 30, 2015 | June 30, 2016 | June 30, 2015 | ||||||||||||||||||||||||||||
| ($ in thousands) | Loss and Loss Expense Incurred | Impact on Loss and Loss Expense Ratio | Loss and Loss Expense Incurred | Impact on Loss and Loss Expense Ratio | Loss and Loss Expense Incurred | Impact on Loss and Loss Expense Ratio | Loss and Loss Expense Incurred | Impact on Loss and Loss Expense Ratio | ||||||||||||||||||||||||
| Standard Personal Lines | $ | 2,104 | 3.0 | % | $ | 8,279 | 11.5 | % | $ | 4,329 | 3.1 | % | $ | 14,597 | 10.1 | % | ||||||||||||||||
| Standard Commercial Lines | $ | 3,623 | 0.9 | % | $ | 13,609 | 3.6 | % | $ | 15,272 | 1.9 | % | $ | 32,258 | 4.3 | % | ||||||||||||||||
| E&S | $ | 2,689 | 5.4 | % | $ | 2,092 | 5.1 | % | $ | 3,184 | 3.2 | % | $ | 2,444 | 3.1 | % | ||||||||||||||||
| Total Insurance Operations | $ | 8,416 | 1.6 | % | $ | 23,980 | 4.9 | % | $ | 22,785 | 2.2 | % | $ | 49,299 | 5.1 | % | ||||||||||||||||
| Prior Year Casualty Reserve Development | Quarter Ended | Year-to-Date | ||||||||||||||||||||||||||||||
| (Favorable) / Unfavorable | June 30, 2016 | June 30, 2015 | June 30, 2016 | June 30, 2015 | ||||||||||||||||||||||||||||
| ($ in thousands) | Loss and Loss Expense Incurred | Impact on Loss and Loss Expense Ratio | Loss and Loss Expense Incurred | Impact on Loss and Loss Expense Ratio | Loss and Loss Expense Incurred | Impact on Loss and Loss Expense Ratio | Loss and Loss Expense Incurred | Impact on Loss and Loss Expense Ratio | ||||||||||||||||||||||||
| Standard Personal Lines | $ | - | 0.0 | % | $ | - | 0.0 | % | $ | - | 0.0 | % | $ | - | 0.0 | % | ||||||||||||||||
| Standard Commercial Lines | $ | (12,000 | ) | (2.9 | )% | $ | (21,000 | ) | (5.6 | )% | $ | (30,000 | ) | (3.7 | )% | $ | (42,000 | ) | (5.7 | )% | ||||||||||||
| E&S | $ | 2,000 | 4.0 | % | $ | 1,000 | 2.4 | % | $ | 3,000 | 3.0 | % | $ | 2,000 | 2.5 | % | ||||||||||||||||
| Total Insurance Operations | $ | (10,000 | ) | (1.9 | )% | $ | (20,000 | ) | (4.1 | )% | $ | (27,000 | ) | (2.6 | )% | $ | (40,000 | ) | (4.1 | )% | ||||||||||||
Note: Some amounts may not foot due to rounding.
Selective Insurance Group, Inc. & Consolidated Subsidiaries
Consolidated Balance Sheets
| Unaudited | ||||||||
| ($ in thousands, except share amounts) | June 30, 2016 | December 31, 2015 | ||||||
| ASSETS | ||||||||
| Investments: | ||||||||
| Fixed income securities, held-to-maturity – at carrying value (fair value: $167,061 – 2016; $209,544 – 2015) | $ | 160,297 | 201,354 | |||||
| Fixed income securities, available-for-sale – at fair value (amortized cost: $4,506,580 – 2016; $4,352,514 – 2015) | 4,671,786 | 4,408,203 | ||||||
| Equity securities, available-for-sale – at fair value (cost: $126,881 – 2016; $193,816 – 2015) | 152,938 | 207,051 | ||||||
| Short-term investments (at cost which approximates fair value) | 205,451 | 194,819 | ||||||
| Other investments | 76,051 | 77,842 | ||||||
| Total investments | 5,266,523 | 5,089,269 | ||||||
| Cash | 1,530 | 898 | ||||||
| Interest and dividends due or accrued | 39,941 | 38,501 | ||||||
| Premiums receivable, net of allowance for uncollectible accounts of: $4,624 – 2016; $4,422 – 2015 | 706,555 | 615,164 | ||||||
| Reinsurance recoverables, net of allowance for uncollectible accounts of: $6,100 – 2016; $5,700 – 2015 | 592,423 | 561,968 | ||||||
| Prepaid reinsurance premiums | 145,520 | 140,889 | ||||||
| Deferred federal income tax | 47,696 | 92,696 | ||||||
| Property and equipment – at cost, net of accumulated depreciation and amortization of: $193,997 – 2016; $188,548 – 2015 | 68,573 | 65,701 | ||||||
| Deferred policy acquisition costs | 228,554 | 213,159 | ||||||
| Goodwill | 7,849 | 7,849 | ||||||
| Other assets | 84,477 | 78,339 | ||||||
| Total assets | $ | 7,189,641 | 6,904,433 | |||||
| LIABILITIES AND STOCKHOLDERS’ EQUITY | ||||||||
| Liabilities: | ||||||||
| Reserve for loss and loss expenses | $ | 3,590,169 | 3,517,728 | |||||
| Unearned premiums | 1,263,450 | 1,169,710 | ||||||
| Short-term debt | 60,000 | 60,000 | ||||||
| Long-term debt | 328,433 | 328,192 | ||||||
| Current federal income tax | 8,670 | 7,442 | ||||||
| Accrued salaries and benefits | 118,733 | 167,336 | ||||||
| Other liabilities | 267,449 | 255,984 | ||||||
| Total liabilities | $ | 5,636,904 | 5,506,392 | |||||
| Stockholders’ Equity: | ||||||||
| Preferred stock of $0 par value per share: | $ | — | — | |||||
| Authorized shares 5,000,000; no shares issued or outstanding | ||||||||
| Common stock of $2 par value per share: | ||||||||
| Authorized shares 360,000,000 | ||||||||
| Issued: 101,451,214 – 2016; 100,861,372 – 2015 | 202,903 | 201,723 | ||||||
| Additional paid-in capital | 340,109 | 326,656 | ||||||
| Retained earnings | 1,509,242 | 1,446,192 | ||||||
| Accumulated other comprehensive income (loss) | 72,007 | (9,425 | ) | |||||
| Treasury stock – at cost (shares: 43,638,649 – 2016; 43,500,642 – 2015) | (571,524 | ) | (567,105 | ) | ||||
| Total stockholders’ equity | $ | 1,552,737 | 1,398,041 | |||||
| Commitments and contingencies | ||||||||
| Total liabilities and stockholders’ equity | $ | 7,189,641 | 6,904,433 | |||||
Selective Insurance Group, Inc. & Consolidated Subsidiaries
Unaudited Consolidated Statements of Income
| Quarter Ended June 30, | Six Months Ended June 30, | |||||||||||||||
| ($ in thousands, except per share amounts) | 2016 | 2015 | 2016 | 2015 | ||||||||||||
| Revenues: | ||||||||||||||||
| Net premiums earned | $ | 531,932 | 490,309 | 1,054,390 | 966,432 | |||||||||||
| Net investment income earned | 31,182 | 32,230 | 61,951 | 59,147 | ||||||||||||
| Net realized gains (losses): | ||||||||||||||||
| Net realized investment gains | 2,314 | 1,031 | 3,203 | 22,008 | ||||||||||||
| Other-than-temporary impairments | (559 | ) | (4,451 | ) | (4,152 | ) | (6,545 | ) | ||||||||
| Other-than-temporary impairments on fixed income securities recognized in other comprehensive income | 10 | — | 10 | — | ||||||||||||
| Total net realized gains (losses) | 1,765 | (3,420 | ) | (939 | ) | 15,463 | ||||||||||
| Other income | 3,868 | 2,854 | 4,819 | 4,823 | ||||||||||||
| Total revenues | 568,747 | 521,973 | 1,120,221 | 1,045,865 | ||||||||||||
| Expenses: | ||||||||||||||||
| Loss and loss expense incurred | 298,479 | 291,561 | 595,623 | 576,560 | ||||||||||||
| Policy acquisition costs | 190,731 | 169,770 | 373,958 | 334,493 | ||||||||||||
| Interest expense | 5,620 | 5,612 | 11,226 | 11,216 | ||||||||||||
| Other expenses | 11,606 | 8,265 | 25,228 | 20,541 | ||||||||||||
| Total expenses | 506,436 | 475,208 | 1,006,035 | 942,810 | ||||||||||||
| Income before federal income tax | 62,311 | 46,765 | 114,186 | 103,055 | ||||||||||||
| Federal income tax expense: | ||||||||||||||||
| Current | 18,318 | 7,733 | 32,402 | 19,987 | ||||||||||||
| Deferred | 392 | 5,264 | 1,151 | 9,592 | ||||||||||||
| Total federal income tax expense | 18,710 | 12,997 | 33,553 | 29,579 | ||||||||||||
| Net income | $ | 43,601 | 33,768 | 80,633 | 73,476 | |||||||||||
| Earnings per share: | ||||||||||||||||
| Basic net income | $ | 0.75 | 0.59 | 1.40 | 1.29 | |||||||||||
| Diluted net income | $ | 0.74 | 0.58 | 1.38 | 1.27 | |||||||||||
| Dividends to stockholders | $ | 0.15 | 0.14 | 0.30 | 0.28 | |||||||||||
Selective Insurance Group, Inc. & Consolidated Subsidiaries
Unaudited Consolidated Statements of Comprehensive Income
| Quarter Ended June 30, | Six Months Ended June 30, | |||||||||||||||
| ($ in thousands) | 2016 | 2015 | 2016 | 2015 | ||||||||||||
| Net income | $ | 43,601 | 33,768 | 80,633 | 73,476 | |||||||||||
| Other comprehensive income (loss), net of tax: | ||||||||||||||||
| Unrealized gains on investment securities: | ||||||||||||||||
| Unrealized holding gains (losses) arising during period | 36,188 | (39,160 | ) | 78,917 | (23,574 | ) | ||||||||||
| Non-credit portion of other-than-temporary impairments recognized in other comprehensive income | (6 | ) | — | (6 | ) | — | ||||||||||
| Amounts reclassified into net income: | ||||||||||||||||
| Held-to-maturity securities | (12 | ) | (120 | ) | (59 | ) | (290 | ) | ||||||||
| Non-credit other-than-temporary impairments | — | — | — | 232 | ||||||||||||
| Realized (gains) losses on available-for-sale securities | (1,145 | ) | 2,225 | 609 | (10,707 | ) | ||||||||||
| Total unrealized gains (losses) on investment securities | 35,025 | (37,055 | ) | 79,461 | (34,339 | ) | ||||||||||
| Defined benefit pension and post-retirement plans: | ||||||||||||||||
| Amounts reclassified into net income: | ||||||||||||||||
| Net actuarial loss | 985 | 1,111 | 1,971 | 2,222 | ||||||||||||
| Total defined benefit pension and post-retirement plans | 985 | 1,111 | 1,971 | 2,222 | ||||||||||||
| Other comprehensive income (loss) | 36,010 | (35,944 | ) | 81,432 | (32,117 | ) | ||||||||||
| Comprehensive income (loss) | $ | 79,611 | (2,176 | ) | 162,065 | 41,359 | ||||||||||
Selective Insurance Group, Inc. & Consolidated Subsidiaries
Unaudited Consolidated Statements of Stockholders’ Equity
| Six Months Ended June 30, | ||||||||
| ($ in thousands) | 2016 | 2015 | ||||||
| Common stock: | ||||||||
| Beginning of year | $ | 201,723 | 199,896 | |||||
| Dividend reinvestment plan (shares: 20,808 – 2016; 26,843 – 2015) | 42 | 54 | ||||||
| Stock purchase and compensation plans (shares: 569,034 – 2016; 611,076 – 2015) | 1,138 | 1,222 | ||||||
| End of period | 202,903 | 201,172 | ||||||
| Additional paid-in capital: | ||||||||
| Beginning of year | 326,656 | 305,385 | ||||||
| Dividend reinvestment plan | 696 | 677 | ||||||
| Stock purchase and compensation plans | 12,757 | 11,233 | ||||||
| End of period | 340,109 | 317,295 | ||||||
| Retained earnings: | ||||||||
| Beginning of year | 1,446,192 | 1,313,440 | ||||||
| Net income | 80,633 | 73,476 | ||||||
| Dividends to stockholders ($0.30 per share – 2016; $0.28 per share – 2015) | (17,583 | ) | (16,235 | ) | ||||
| End of period | 1,509,242 | 1,370,681 | ||||||
| Accumulated other comprehensive income (loss): | ||||||||
| Beginning of year | (9,425 | ) | 19,788 | |||||
| Other comprehensive income (loss) | 81,432 | (32,117 | ) | |||||
| End of period | 72,007 | (12,329 | ) | |||||
| Treasury stock: | ||||||||
| Beginning of year | (567,105 | ) | (562,923 | ) | ||||
| Acquisition of treasury stock (shares: 138,007 – 2016; 129,352 – 2015) | (4,419 | ) | (3,583 | ) | ||||
| End of period | (571,524 | ) | (566,506 | ) | ||||
| Total stockholders’ equity | $ | 1,552,737 | 1,310,313 | |||||
Selective Insurance Group, Inc. & Consolidated Subsidiaries
Unaudited Consolidated Statements of Cash Flow
| Six Months Ended June 30, | ||||||||
| ($ in thousands) | 2016 | 2015 | ||||||
| Operating Activities | ||||||||
| Net income | $ | 80,633 | 73,476 | |||||
| Adjustments to reconcile net income to net cash provided by operating activities: | ||||||||
| Depreciation and amortization | 30,155 | 29,085 | ||||||
| Stock-based compensation expense | 7,203 | 6,049 | ||||||
| Undistributed losses of equity method investments | 1,677 | 2,117 | ||||||
| Net realized losses (gains) | 939 | (15,463 | ) | |||||
| Changes in assets and liabilities: | ||||||||
| Increase in reserve for loss and loss expenses, net of reinsurance recoverables | 41,986 | 66,609 | ||||||
| Increase in unearned premiums, net of prepaid reinsurance | 89,109 | 83,789 | ||||||
| Decrease in net federal income taxes | 2,380 | 19,232 | ||||||
| Increase in premiums receivable | (91,391 | ) | (88,813 | ) | ||||
| Increase in deferred policy acquisition costs | (15,395 | ) | (17,616 | ) | ||||
| (Increase) decrease in interest and dividends due or accrued | (1,030 | ) | 395 | |||||
| Decrease in accrued salaries and benefits | (48,603 | ) | (18,171 | ) | ||||
| Increase in other assets | (3,877 | ) | (743 | ) | ||||
| (Decrease) increase in other liabilities | (34,659 | ) | 25,651 | |||||
| Net adjustments | (21,506 | ) | 92,121 | |||||
| Net cash provided by operating activities | 59,127 | 165,597 | ||||||
| Investing Activities | ||||||||
| Purchase of fixed income securities, available-for-sale | (411,538 | ) | (463,758 | ) | ||||
| Purchase of fixed income securities, held-to-maturity | (4,235 | ) | — | |||||
| Purchase of equity securities, available-for-sale | (16,796 | ) | (177,386 | ) | ||||
| Purchase of other investments | (17,734 | ) | (2,947 | ) | ||||
| Purchase of short-term investments | (691,496 | ) | (732,278 | ) | ||||
| Sale of fixed income securities, available-for-sale | 22,114 | 22,323 | ||||||
| Sale of short-term investments | 680,865 | 695,901 | ||||||
| Redemption and maturities of fixed income securities, held-to-maturity | 44,615 | 68,704 | ||||||
| Redemption and maturities of fixed income securities, available-for-sale | 264,244 | 254,995 | ||||||
| Sale of equity securities, available-for-sale | 83,793 | 135,548 | ||||||
| Distributions from other investments | 13,380 | 17,840 | ||||||
| Purchase of property and equipment | (8,187 | ) | (7,591 | ) | ||||
| Net cash used in investing activities | (40,975 | ) | (188,649 | ) | ||||
| Financing Activities | ||||||||
| Dividends to stockholders | (16,569 | ) | (15,211 | ) | ||||
| Acquisition of treasury stock | (4,419 | ) | (3,583 | ) | ||||
| Net proceeds from stock purchase and compensation plans | 4,368 | 4,037 | ||||||
| Proceeds from borrowings | 55,000 | 15,000 | ||||||
| Repayments of borrowings | (55,000 | ) | — | |||||
| Excess tax benefits from share-based payment arrangements | 1,761 | 1,549 | ||||||
| Repayments of capital lease obligations | (2,661 | ) | (2,331 | ) | ||||
| Net cash used in financing activities | (17,520 | ) | (539 | ) | ||||
| Net increase (decrease) in cash | 632 | (23,591 | ) | |||||
| Cash, beginning of year | 898 | 23,959 | ||||||
| Cash, end of period | $ | 1,530 | 368 | |||||
Selective Insurance Group, Inc.
Combined Insurance Company Subsidiaries
Statutory Balance Sheets
(unaudited)
| June 30, | June 30, | December 31, | ||||||||||
| ($ in thousands) | 2016 | 2015 | 2015 | |||||||||
| ASSETS | ||||||||||||
| Bonds | $ | 4,604,199 | 4,317,425 | 4,491,136 | ||||||||
| Common stocks | 139,419 | 211,119 | 194,789 | |||||||||
| Preferred stocks | 12,950 | 17,742 | 11,856 | |||||||||
| Affiliated mortgage loan | 34,749 | 35,567 | 35,163 | |||||||||
| Other investments | 124,004 | 137,366 | 128,788 | |||||||||
| Short-term investments | 177,354 | 144,696 | 165,678 | |||||||||
| Total investments | 5,092,675 | 4,863,915 | 5,027,410 | |||||||||
| Cash on hand and in banks | (18,294 | ) | (27,701 | ) | (34,378 | ) | ||||||
| Interest and dividends due and accrued | 39,892 | 38,438 | 38,466 | |||||||||
| Premiums receivable | 700,827 | 644,590 | 609,146 | |||||||||
| Reinsurance recoverable on paid losses and expenses | 15,482 | 7,224 | 10,949 | |||||||||
| Deferred tax recoverable | 152,565 | 140,904 | 142,066 | |||||||||
| EDP equipment | 448 | 406 | 390 | |||||||||
| Equities and deposits in pools and associations | 11,827 | 10,930 | 10,920 | |||||||||
| Receivable for sold securities | 2,295 | 3,695 | 17 | |||||||||
| Other assets | 27,075 | 25,226 | 28,300 | |||||||||
| Total assets | $ | 6,024,792 | 5,707,627 | 5,833,286 | ||||||||
| LIABILITIES | ||||||||||||
| Reserve for losses | $ | 2,450,518 | 2,438,075 | 2,426,583 | ||||||||
| Reinsurance payable on paid loss and loss expense | 3,337 | 3,301 | 2,841 | |||||||||
| Reserve for loss expenses | 546,060 | 518,171 | 525,322 | |||||||||
| Unearned premiums | 1,117,930 | 1,032,615 | 1,028,820 | |||||||||
| Reserve for commissions payable | 74,020 | 62,229 | 89,740 | |||||||||
| Ceded balances payable | 35,741 | 28,475 | 37,222 | |||||||||
| Federal income tax payable | 17,505 | 15,291 | 25,644 | |||||||||
| Premium and other taxes payable | 21,474 | 23,076 | 23,998 | |||||||||
| Borrowed money | 60,029 | 60,029 | 60,031 | |||||||||
| Reserve for dividends to policyholders | 7,225 | 5,192 | 5,805 | |||||||||
| Reserves for unauthorized reinsurance | 2,030 | 7,661 | 2,030 | |||||||||
| Payable for securities | 51,981 | 15,929 | 6,204 | |||||||||
| Funds withheld on account of others | 7,490 | 7,503 | 6,806 | |||||||||
| Accrued salaries and benefits | 59,827 | 53,551 | 77,933 | |||||||||
| Other liabilities | 63,090 | 91,899 | 87,987 | |||||||||
| Total liabilities | 4,518,257 | 4,362,997 | 4,406,966 | |||||||||
| POLICYHOLDERS' SURPLUS | ||||||||||||
| Capital | 42,725 | 42,725 | 42,725 | |||||||||
| Paid in surplus | 492,869 | 492,869 | 492,869 | |||||||||
| Unassigned surplus | 970,941 | 809,036 | 890,726 | |||||||||
| Total policyholders' surplus | 1,506,535 | 1,344,630 | 1,426,320 | |||||||||
| Total liabilities and policyholders' surplus | $ | 6,024,792 | 5,707,627 | 5,833,286 | ||||||||
Selective Insurance Group, Inc.
Combined Insurance Company Subsidiaries
Statutory Statements Of Income
(unaudited)
| Quarter Ended | Six Months Ended | |||||||||||||||||||||||||||||||
| June | June | |||||||||||||||||||||||||||||||
| ($ in thousands) | 2016 | 2015 | 2016 | 2015 | ||||||||||||||||||||||||||||
| UNDERWRITING | ||||||||||||||||||||||||||||||||
| Net premiums written | $ | 578,140 | 532,133 | 1,143,499 | 1,050,221 | |||||||||||||||||||||||||||
| Net premiums earned | 531,932 | 490,309 | 1,054,390 | 966,432 | ||||||||||||||||||||||||||||
| Net losses paid | 241,720 | 224,744 | 452,393 | 419,110 | ||||||||||||||||||||||||||||
| Change in reserve for losses | (5,768 | ) | 5,530 | 23,935 | 39,544 | |||||||||||||||||||||||||||
| Net losses incurred | 235,952 | 44.3 | % | 230,274 | 47.0 | % | 476,328 | 45.2 | % | 458,654 | 47.5 | % | ||||||||||||||||||||
| Net loss expenses paid | 51,045 | 49,067 | 97,169 | 94,061 | ||||||||||||||||||||||||||||
| Change in reserve for loss expenses | 11,111 | 12,418 | 20,738 | 24,661 | ||||||||||||||||||||||||||||
| Net loss expenses incurred | 62,156 | 11.7 | % | 61,485 | 12.5 | % | 117,907 | 11.2 | % | 118,722 | 12.2 | % | ||||||||||||||||||||
| Net underwriting expenses incurred | 198,201 | 34.4 | % | 180,898 | 33.9 | % | 389,118 | 34.0 | % | 351,836 | 33.5 | % | ||||||||||||||||||||
| Total deductions | 496,309 | 472,657 | 983,353 | 929,212 | ||||||||||||||||||||||||||||
| Statutory underwriting gain | 35,623 | 17,652 | 71,037 | 37,220 | ||||||||||||||||||||||||||||
| Net loss from premium balances charged off | (633 | ) | (703 | ) | (1,324 | ) | (1,313 | ) | ||||||||||||||||||||||||
| Finance charges and other income | 3,902 | 2,922 | 4,864 | 4,916 | ||||||||||||||||||||||||||||
| Total other income | 3,269 | -0.6 | % | 2,219 | -0.3 | % | 3,540 | -0.3 | % | 3,603 | -0.3 | % | ||||||||||||||||||||
| Policyholders' dividends incurred | (1,618 | ) | 0.3 | % | (1,844 | ) | 0.4 | % | (3,271 | ) | 0.3 | % | (3,369 | ) | 0.3 | % | ||||||||||||||||
| Total underwriting gain | 37,274 | 90.1 | % | 18,027 | 93.5 | % | 71,306 | 90.4 | % | 37,454 | 93.2 | % | ||||||||||||||||||||
| INVESTMENT | ||||||||||||||||||||||||||||||||
| Net investment income earned | 30,899 | 32,155 | 61,522 | 59,282 | ||||||||||||||||||||||||||||
| Net realized gain | 1,762 | (3,422 | ) | (942 | ) | 15,461 | ||||||||||||||||||||||||||
| Total income before income tax | 69,935 | 46,760 | 131,886 | 112,197 | ||||||||||||||||||||||||||||
| Federal income tax expense | 21,902 | 12,530 | 38,505 | 19,791 | ||||||||||||||||||||||||||||
| Net income | $ | 48,033 | 34,230 | 93,381 | 92,406 | |||||||||||||||||||||||||||
| Policyholders' Surplus | ||||||||||||||||||||||||||||||||
| Surplus, beginning of period | $ | 1,461,326 | 1,322,422 | 1,426,320 | 1,307,842 | |||||||||||||||||||||||||||
| Net income | 48,033 | 34,230 | 93,381 | 92,406 | ||||||||||||||||||||||||||||
| Change in deferred taxes | 1,149 | (1,959 | ) | 1,501 | (12,153 | ) | ||||||||||||||||||||||||||
| Change in net unrealized capital gains / (losses) | 2,926 | (637 | ) | 8,237 | (13,547 | ) | ||||||||||||||||||||||||||
| Dividends to stockholders | (15,253 | ) | (14,438 | ) | (30,507 | ) | (28,876 | ) | ||||||||||||||||||||||||
| Change in non-admitted assets | 6,924 | 3,398 | 4,742 | (4,271 | ) | |||||||||||||||||||||||||||
| Change in Overfunded Contra Asset | (22,653 | ) | (280 | ) | (23,700 | ) | (561 | ) | ||||||||||||||||||||||||
| Qual Pen Trans Liab | 24,061 | 1,843 | 26,517 | 3,689 | ||||||||||||||||||||||||||||
| Excess Plan Trans Liab | 19 | 43 | 38 | 86 | ||||||||||||||||||||||||||||
| PRL Plan Trans Liab | 3 | 8 | 6 | 15 | ||||||||||||||||||||||||||||
| Net change in surplus for period | 45,209 | 22,208 | 80,215 | 36,788 | ||||||||||||||||||||||||||||
| Surplus, end of period | $ | 1,506,535 | 1,344,630 | 1,506,535 | 1,344,630 | |||||||||||||||||||||||||||
| Statutory underwriting gain | $ | 37,274 | 18,027 | 71,306 | 37,454 | |||||||||||||||||||||||||||
| Adjustments under GAAP: | ||||||||||||||||||||||||||||||||
| Deferred policy acquisition costs | 7,606 | 11,268 | 15,395 | 17,616 | ||||||||||||||||||||||||||||
| Other, net | (1,103 | ) | (171 | ) | (1,969 | ) | 75 | |||||||||||||||||||||||||
| GAAP underwriting gain | $ | 43,777 | 29,124 | 84,732 | 55,145 | |||||||||||||||||||||||||||
Note: Some amounts or ratios may not foot due to rounding
| Selective Insurance Group, Inc. and Consolidated Subsidiaries | ||||
| Alternative Investments | ||||
| June 30, 2016 | ||||
| (unaudited) | ||||
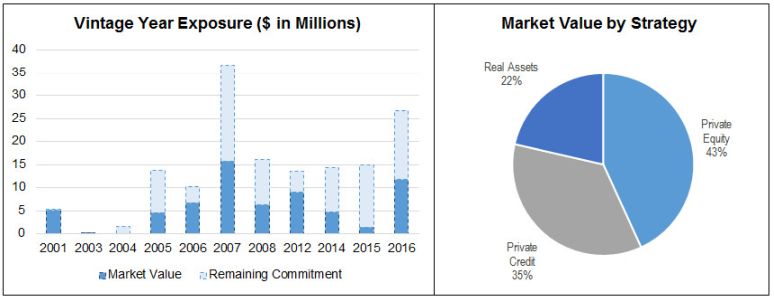
| Number | Original | Remaining | Current | |
| Strategy | of Funds | Commitment | Commitment | Market Value |
| Private Equity | 10 | 118,498,351 | 34,116,513 | 28,438,848 |
| Private Credit | 7 | 80,000,000 | 23,242,735 | 23,336,118 |
| Real Assets | 7 | 100,000,000 | 30,273,409 | 14,132,399 |
| TOTAL - ALTERNATIVE INVESTMENTS | 24 | 298,498,351 | 87,632,657 | 65,907,365 |
 | ||||
| Exhibit may not foot due to rounding | ||||