EXHIBIT 99.2
| 
Supplemental Investor Package ________________________________________________ Third Quarter 2016 Investor Contact: Rohan Pai Tel: 973-948-1364 Rohan.Pai@Selective.com |
Selective Insurance Group, Inc. & Consolidated Subsidiaries
Selected Balance Sheet Data
(unaudited)
| | | September 30, | | September 30, | | December 31, |
| ($ in thousands, except per share data) | | 2016 | | 2015 | | 2015 |
| | | | | | | Unrecognized/ | | | | | | Unrecognized/ | | | | | | Unrecognized/ |
| | | Balance | | Market | | Unrealized | | Balance | | Market | | Unrealized | | Balance | | Market | | Unrealized |
| | | Sheet | | Value | | Gain | | Sheet | | Value | | Gain | | Sheet | | Value | | Gain |
| Invested Assets: | | | | | | | | | | | | | | | | | | | | | | | | | | | | | | | | | | | | |
| Corporate bonds1 | | $ | 3,312,160 | | | | 3,314,526 | | | | 77,917 | | | $ | 2,901,352 | | | | 2,904,449 | | | | 37,945 | | | $ | 2,955,001 | | | | 2,957,427 | | | | 8,276 | |
| Government and Municipal bonds | | | 1,650,844 | | | | 1,654,100 | | | | 78,164 | | | | 1,679,563 | | | | 1,686,985 | | | | 50,263 | | | | 1,654,556 | | | | 1,660,320 | | | | 55,901 | |
| Total fixed income securities | | | 4,963,004 | | | | 4,968,626 | | | | 156,081 | | | | 4,580,915 | | | | 4,591,434 | | | | 88,208 | | | | 4,609,557 | | | | 4,617,747 | | | | 64,177 | |
| Equities | | | 147,304 | | | | 147,304 | | | | 24,323 | | | | 221,951 | | | | 221,951 | | | | 1,131 | | | | 207,051 | | | | 207,051 | | | | 13,235 | |
| Short-term investments | | | 169,604 | | | | 169,604 | | | | - | | | | 125,855 | | | | 125,855 | | | | - | | | | 194,819 | | | | 194,819 | | | | - | |
| Other investments | | | 88,512 | | | | 88,512 | | | | - | | | | 85,146 | | | | 85,146 | | | | - | | | | 77,842 | | | | 77,842 | | | | - | |
| Total invested assets | | $ | 5,368,424 | | | | 5,374,046 | | | | 180,404 | | | $ | 5,013,867 | | | | 5,024,386 | | | | 89,339 | | | $ | 5,089,269 | | | | 5,097,459 | | | | 77,412 | |
| | | | | | | | | | | | | | | | | | | | | | | | | | | | | | | | | | | | | |
| | | | | | | | | | | | | | | | | | | | | | | | | | | | | | | | | | | | | |
| Invested assets per $ of stockholders' equity | | | 3.41 | | | | | | | | | | | | 3.69 | | | | | | | | | | | | 3.64 | | | | | | | | | |
| | | | | | | | | | | | | | | | | | | | | | | | | | | | | | | | | | | | | |
| Total assets | | | 7,363,233 | | | | | | | | | | | | 6,891,877 | | | | | | | | | | | | 6,904,433 | | | | | | | | | |
| | | | | | | | | | | | | | | | | | | | | | | | | | | | | | | | | | | | | |
| Liabilities: | | | | | | | | | | | | | | | | | | | | | | | | | | | | | | | | | | | | |
| Reserve for loss and loss expenses | | | 3,686,586 | | | | | | | | | | | | 3,517,751 | | | | | | | | | | | | 3,517,728 | | | | | | | | | |
| Unearned premium reserve | | | 1,306,255 | | | | | | | | | | | | 1,218,884 | | | | | | | | | | | | 1,169,710 | | | | | | | | | |
| | | | | | | | | | | | | | | | | | | | | | | | | | | | | | | | | | | | | |
| Total liabilities | | | 5,788,329 | | | | | | | | | | | | 5,532,855 | | | | | | | | | | | | 5,506,392 | | | | | | | | | |
| | | | | | | | | | | | | | | | | | | | | | | | | | | | | | | | | | | | | |
| Stockholders' equity | | | 1,574,904 | | | | | | | | | | | | 1,359,022 | | | | | | | | | | | | 1,398,041 | | | | | | | | | |
| | | | | | | | | | | | | | | | | | | | | | | | | | | | | | | | | | | | | |
| Total debt to capitalization ratio | | | 21.2 | % | | | | | | | | | | | 22.2 | % | | | | | | | | | | | 21.7 | % | | | | | | | | |
| | | | | | | | | | | | | | | | | | | | | | | | | | | | | | | | | | | | | |
| Book value per share | | | 27.22 | | | | | | | | | | | | 23.77 | | | | | | | | | | | | 24.37 | | | | | | | | | |
| | | | | | | | | | | | | | | | | | | | | | | | | | | | | | | | | | | | | |
| Book value per share excluding | | | | | | | | | | | | | | | | | | | | | | | | | | | | | | | | | | | | |
| unrealized gain or loss on fixed income portfolio | | | 25.53 | | �� | | | | | | | | | | 22.88 | | | | | | | | | | | | 23.74 | | | | | | | | | |
| | | | | | | | | | | | | | | | | | | | | | | | | | | | | | | | | | | | | |
| NPW per insurance segment employee | | | 1,021 | | | | | | | | | | | | 958 | | | | | | | | | | | | 979 | | | | | | | | | |
| | | | | | | | | | | | | | | | | | | | | | | | | | | | | | | | | | | | | |
| Statutory premiums to surplus ratio | | | 1.4 | x | | | | | | | | | | | 1.5 | x | | | | | | | | | | | 1.5 | x | | | | | | | | |
| | | | | | | | | | | | | | | | | | | | | | | | | | | | | | | | | | | | | |
| Statutory surplus | | | 1,551,227 | | | | | | | | | | | | 1,367,343 | | | | | | | | | | | | 1,426,320 | | | | | | | | | |
1Includes mortgage-backed and asset-backed securities.
Selective Insurance Group, Inc. & Consolidated Subsidiaries
Selected Income Statement Data
(unaudited)
| | | Quarter Ended September 30, | | | Year-to-Date September 30, |
| ($ in thousands, except per share amounts) | | 2016 | | | 2015 | | | 2016 | | | 2015 | |
| | | | | | Per diluted share | | | | | Per diluted share | | | | | Per diluted share | | | | | Per diluted share |
| Consolidated | | | | | | | | | | | | | | | | | | | | | | | | | | | | | | | | |
| Revenue | | $ | 581,691 | | | | | | | $ | 540,457 | | | | | | | $ | 1,701,912 | | | | | | | $ | 1,586,322 | | | | | |
| Operating income | | | 36,104 | | | | 0.62 | | | | 46,796 | | | | 0.81 | | | | 117,348 | | | | 2.00 | | | | 110,221 | | | | 1.90 | |
| Net realized gains, after tax | | | 2,398 | | | | 0.04 | | | | 200 | | | | - | | | | 1,787 | | | | 0.03 | | | | 10,251 | | | | 0.18 | |
| Net income | | | 38,502 | | | | 0.66 | | | | 46,996 | | | | 0.81 | | | | 119,135 | | | | 2.03 | | | | 120,472 | | | | 2.08 | |
| Return on equity | | | 9.8 | % | | | | | | | 14.1 | % | | | | | | | 10.7 | % | | | | | | | 12.2 | % | | | | |
| Operating return on equity | | | 9.2 | % | | | | | | | 14.0 | % | | | | | | | 10.5 | % | | | | | | | 11.2 | % | | | | |
| | | | | | | | | | | | | | | | | | | | | | | | | | | | | | | | | |
| Total Insurance Operations | | | | | | | | | | | | | | | | | | | | | | | | | | | | | | | | |
| Gross premiums written | | | 677,488 | | | | | | | | 637,528 | | | | | | | | 2,003,736 | | | | | | | | 1,868,760 | | | | | |
| Net premiums written | | | 578,773 | | | | | | | | 545,025 | | | | | | | | 1,722,272 | | | | | | | | 1,595,246 | | | | | |
| Net premiums earned | | | 542,429 | | | | | | | | 507,390 | | | | | | | | 1,596,819 | | | | | | | | 1,473,822 | | | | | |
| Underwriting gain | - before tax | | | 32,033 | | | | | | | | 44,831 | | | | | | | | 116,765 | | | | | | | | 99,976 | | | | | |
| | - after tax | | | 20,821 | | | | 0.35 | | | | 29,140 | | | | 0.50 | | | | 75,897 | | | | 1.29 | | | | 64,984 | | | | 1.12 | |
| GAAP combined ratio | | | 94.1 | % | | | | | | | 91.2 | % | | | | | | | 92.7 | % | | | | | | | 93.2 | % | | | | |
| | | | | | | | | | | | | | | | | | | | | | | | | | | | | | | | | |
| Standard Commercial Lines | | | | | | | | | | | | | | | | | | | | | | | | | | | | | | | | |
| Net premiums earned | | | 421,586 | | | | | | | | 389,542 | | | | | | | | 1,235,752 | | | | | | | | 1,132,280 | | | | | |
| GAAP combined ratio | | | 92.9 | % | | | | | | | 88.7 | % | | | | | | | 91.8 | % | | | | | | | 90.3 | % | | | | |
| Standard Personal Lines | | | | | | | | | | | | | | | | | | | | | | | | | | | | | | | | |
| Net premiums earned | | | 68,690 | | | | | | | | 72,088 | | | | | | | | 209,719 | | | | | | | | 216,638 | | | | | |
| GAAP combined ratio | | | 93.8 | % | | | | | | | 96.1 | % | | | | | | | 90.9 | % | | | | | | | 102.0 | % | | | | |
| Excess and Surplus Lines | | | | | | | | | | | | | | | | | | | | | | | | | | | | | | | | |
| Net premiums earned | | | 52,153 | | | | | | | | 45,760 | | | | | | | | 151,348 | | | | | | | | 124,904 | | | | | |
| GAAP combined ratio | | | 104.5 | % | | | | | | | 104.4 | % | | | | | | | 102.3 | % | | | | | | | 104.0 | % | | | | |
| | | | | | | | | | | | | | | | | | | | | | | | | | | | | | | | | |
| Investments | | | | | | | | | | | | | | | | | | | | | | | | | | | | | | | | |
| Net investment income | - before tax | | | 33,375 | | | | | | | | 32,061 | | | | | | | | 95,326 | | | | | | | | 91,208 | | | | | |
| | - after tax | | | 24,913 | | | | 0.42 | | | | 24,555 | | | | 0.42 | | | | 71,998 | | | | 1.23 | | | | 70,542 | | | | 1.22 | |
| Effective tax rate | | | 25.4 | % | | | | | | | 23.4 | % | | | | | | | 24.5 | % | | | | | | | 22.7 | % | | | | |
| Annualized after-tax yield on investment portfolio | | | | | | | | | | | | | | | | | | | 1.8 | % | | | | | | | 1.9 | % | | | | |
| Annualized after-tax, after-interest expense yield | | | | | | | | | | | | | | | | | | | 1.6 | % | | | | | | | 1.6 | % | | | | |
| Invested assets per $ of stockholders' equity | | | | | | | | | | | | | | | | | | | 3.41 | | | | | | | | 3.69 | | | | | |
| | | | | | | | | | | | | | | | | | | | | | | | | | | | | | | | | |
| Other expenses (net of other income) | | | | | | | | | | | | | | | | | | | | | | | | | | | | | | | | |
| Interest expense | - before tax | | | (5,714 | ) | | | | | | | (5,610 | ) | | | | | | | (16,940 | ) | | | | | | | (16,826 | ) | | | | |
| | - after tax | | | (3,714 | ) | | | (0.06 | ) | | | (3,646 | ) | | | (0.06 | ) | | | (11,011 | ) | | | (0.19 | ) | | | (10,937 | ) | | | (0.18 | ) |
| | | | | | | | | | | | | | | | | | | | | | | | | | | | | | | | | |
| Other expense - after tax | | $ | (5,916 | ) | | | (0.09 | ) | | $ | (3,253 | ) | | | (0.05 | ) | | $ | (19,536 | ) | | | (0.33 | ) | | $ | (14,368 | ) | | | (0.26 | ) |
| | | | | | | | | | | | | | | | | | | | | | | | | | | | | | | | | |
| Diluted weighted avg shares outstanding | | | 58,731 | | | | | | | | 57,984 | | | | | | | | 58,612 | | | | | | | | 57,838 | | | | | |
Selective Insurance Group, Inc. & Consolidated Subsidiaries
GAAP Insurance Operations Results
(unaudited)
| Third Quarter | | | | | | | | | | | | | | | | | | | | | | | | |
| ($ in thousands) | | Quarter Ended September 30, 2016 | | | Quarter Ended September 30, 2015 | |
| | | | | | | | | | | | | | | | | | | | | | | | | |
| | | Standard Commercial Lines | | | Standard Personal Lines | | | Excess & Surplus Lines | | | Grand Total | | | Standard Commercial Lines | | | Standard Personal Lines | | | Excess & Surplus Lines | | | Grand Total | |
| Net Premiums Written | | $ | 449,544 | | | | 76,225 | | | | 53,004 | | | | 578,773 | | | $ | 414,031 | | | | 76,927 | | | | 54,067 | | | | 545,025 | |
| Net Premiums Earned | | | 421,586 | | | | 68,690 | | | | 52,153 | | | | 542,429 | | | | 389,542 | | | | 72,088 | | | | 45,760 | | | | 507,390 | |
| Loss and Loss Expense Incurred | | | 238,215 | | | | 41,582 | | | | 36,461 | | | | 316,258 | | | | 203,621 | | | | 49,588 | | | | 31,952 | | | | 285,161 | |
| Net Underwriting Expenses Incurred | | | 152,706 | | | | 22,837 | | | | 18,054 | | | | 193,597 | | | | 139,973 | | | | 19,674 | | | | 15,830 | | | | 175,477 | |
| Dividends to Policyholders | | | 541 | | | | - | | | | - | | | | 541 | | | | 1,921 | | | | - | | | | - | | | | 1,921 | |
| GAAP Underwriting Gain (Loss) | | $ | 30,124 | | | | 4,271 | | | | (2,362 | ) | | | 32,033 | | | $ | 44,027 | | | | 2,826 | | | | (2,022 | ) | | | 44,831 | |
| | | | | | | | | | | | | | | | | | | | | | | | | | | | | | | | | |
| GAAP Ratios | | | | | | | | | | | | | | | | | | | | | | | | | | | | | | | | |
| Loss and Loss Expense Ratio | | | 56.5 | % | | | 60.5 | % | | | 69.9 | % | | | 58.3 | % | | | 52.3 | % | | | 68.8 | % | | | 69.8 | % | | | 56.2 | % |
| Underwriting Expense Ratio | | | 36.3 | % | | | 33.3 | % | | | 34.6 | % | | | 35.7 | % | | | 35.9 | % | | | 27.3 | % | | | 34.6 | % | | | 34.6 | % |
| Dividends to Policyholders Ratio | | | 0.1 | % | | | 0.0 | % | | | 0.0 | % | | | 0.1 | % | | | 0.5 | % | | | 0.0 | % | | | 0.0 | % | | | 0.4 | % |
| Combined Ratio | | | 92.9 | % | | | 93.8 | % | | | 104.5 | % | | | 94.1 | % | | | 88.7 | % | | | 96.1 | % | | | 104.4 | % | | | 91.2 | % |
| | | | | | | | | | | | | | | | | | | | | | | | | | | | | | | | | |
| Year-to-Date | | | | | | | | | | | | | | | | | | | | | | | | |
| ($ in thousands) | | Year-to-Date September 30, 2016 | | | Year-to-Date September 30, 2015 | |
| | | | | | | | | | | | | | | | | | | | | | | | | |
| | | Standard Commercial Lines | | | Standard Personal Lines | | | Excess & Surplus Lines | | | Grand Total | | | Standard Commercial Lines | | | Standard Personal Lines | | | Excess & Surplus Lines | | | Grand Total | |
| Net Premiums Written | | $ | 1,353,615 | | | | 213,770 | | | | 154,887 | | | | 1,722,272 | | | $ | 1,240,110 | | | | 217,937 | | | | 137,199 | | | | 1,595,246 | |
| Net Premiums Earned | | | 1,235,752 | | | | 209,719 | | | | 151,348 | | | | 1,596,819 | | | | 1,132,280 | | | | 216,638 | | | | 124,904 | | | | 1,473,822 | |
| Loss and Loss Expense Incurred | | | 683,183 | | | | 123,489 | | | | 105,209 | | | | 911,881 | | | | 619,857 | | | | 156,490 | | | | 85,374 | | | | 861,721 | |
| Net Underwriting Expenses Incurred | | | 447,528 | | | | 67,229 | | | | 49,604 | | | | 564,361 | | | | 397,829 | | | | 64,443 | | | | 44,563 | | | | 506,835 | |
| Dividends to Policyholders | | | 3,812 | | | | - | | | | - | | | | 3,812 | | | | 5,290 | | | | - | | | | - | | | | 5,290 | |
| GAAP Underwriting Gain (Loss) | | $ | 101,229 | | | | 19,001 | | | | (3,465 | ) | | | 116,765 | | | $ | 109,304 | | | | (4,295 | ) | | | (5,033 | ) | | | 99,976 | |
| | | | | | | | | | | | | | | | | | | | | | | | | | | | | | | | | |
| GAAP Ratios | | | | | | | | | | | | | | | | | | | | | | | | | | | | | | | | |
| Loss and Loss Expense Ratio | | | 55.3 | % | | | 58.9 | % | | | 69.5 | % | | | 57.1 | % | | | 54.7 | % | | | 72.2 | % | | | 68.4 | % | | | 58.5 | % |
| Underwriting Expense Ratio | | | 36.2 | % | | | 32.0 | % | | | 32.8 | % | | | 35.4 | % | | | 35.1 | % | | | 29.8 | % | | | 35.6 | % | | | 34.3 | % |
| Dividends to Policyholders Ratio | | | 0.3 | % | | | 0.0 | % | | | 0.0 | % | | | 0.2 | % | | | 0.5 | % | | | 0.0 | % | | | 0.0 | % | | | 0.4 | % |
| Combined Ratio | | | 91.8 | % | | | 90.9 | % | | | 102.3 | % | | | 92.7 | % | | | 90.3 | % | | | 102.0 | % | | | 104.0 | % | | | 93.2 | % |
| | | | | | | | | | | | | | | | | | | | | | | | | | | | | | | | | |
Selective Insurance Group, Inc. and Consolidated Subsidiaries
GAAP Investment Income
September 2016 (unaudited)
| | | Quarter Ended | | % | | Year-to-Date | | % |
| | | September | | September | | Increase | | September | | September | | Increase |
| ($ in thousands, except per share data) | | 2016 | | 2015 | | (Decrease) | | 2016 | | 2015 | | (Decrease) |
| Investment Income: | | | | | | | | | | | | | | | | | | | | | | | | |
| Interest: | | | | | | | | | | | | | | | | | | | | | | | | |
| Fixed Income Securities | | $ | 32,453 | | | | 30,601 | | | | 6 | | | $ | 95,850 | | | | 92,227 | | | | 4 | |
| Short-term | | | 192 | | | | 24 | | | | 700 | | | | 493 | | | | 72 | | | | 585 | |
| Other Investments | | | 1,628 | | | | 1,337 | | | | 22 | | | | (49 | ) | | | (781 | ) | | | 94 | |
| Dividends | | | 1,506 | | | | 2,370 | | | | (36 | ) | | | 5,940 | | | | 6,546 | | | | (9 | ) |
| | | | 35,779 | | | | 34,332 | | | | 4 | | | | 102,234 | | | | 98,064 | | | | 4 | |
| | | | | | | | | | | | | | | | | | | | | | | | | |
| Investment Expense | | | 2,404 | | | | 2,271 | | | | 6 | | | | 6,908 | | | | 6,856 | | | | 1 | |
| | | | | | | | | | | | | | | | | | | | | | | | | |
| Net Investment Income Before Tax | | | 33,375 | | | | 32,061 | | | | 4 | | | | 95,326 | | | | 91,208 | | | | 5 | |
| | | | | | | | | | | | | | | | | | | | | | | | | |
| Tax | | | 8,462 | | | | 7,506 | | | | 13 | | | | 23,328 | | | | 20,666 | | | | 13 | |
| | | | | | | | | | | | | | | | | | | | | | | | | |
| Net Investment Income After Tax | | $ | 24,913 | | | | 24,555 | | | | 1 | | | $ | 71,998 | | | | 70,542 | | | | 2 | |
| | | | | | | | | | | | | | | | | | | | | | | | | |
| Net Investment Income per Share | | $ | 0.42 | | | | 0.42 | | | | - | | | $ | 1.23 | | | | 1.22 | | | | 1 | |
| | | | | | | | | | | | | | | | | | | | | | | | | |
| Effective Tax Rate | | | 25.4 | % | | | 23.4 | % | | | | | | | 24.5 | % | | | 22.7 | % | | | | |
| | | | | | | | | | | | | | | | | | | | | | | | | |
| Average Yields : | | | | | | | | | | | | | | | | | | | | | | | | |
| | | | | | | | | | | | | | | | | | | | | | | | | |
| Fixed Income Securities: | | | | | | | | | | | | | | | | | | | | | | | | |
| Pre Tax | | | | | | | | | | | | | | | 2.67 | % | | | 2.74 | % | | | | |
| After Tax | | | | | | | | | | | | | | | 2.00 | % | | | 2.08 | % | | | | |
| | | | | | | | | | | | | | | | | | | | | | | | | |
| Portfolio: | | | | | | | | | | | | | | | | | | | | | | | | |
| Pre Tax | | | | | | | | | | | | | | | 2.43 | % | | | 2.48 | % | | | | |
| After Tax | | | | | | | | | | | | | | | 1.84 | % | | | 1.92 | % | | | | |
| | | Quarter Ended | | Year-to-Date |
| | | September | | September | | September | | September |
| Net Realized Gains (Losses) | | 2016 | | 2015 | | 2016 | | 2015 |
| Fixed Income Securities | | $ | 2,163 | | | | (80 | ) | | $ | 1,944 | | | | 587 | |
| Equity Securities | | | 1,522 | | | | 388 | | | | 806 | | | | 15,838 | |
| Other Investments | | | 3 | | | | - | | | | (1 | ) | | | (654 | ) |
| | | | | | | | | | | | | | | | | |
| Total | | | 3,688 | | | | 308 | | | | 2,749 | | | | 15,771 | |
| Net of Tax | | | 2,398 | | | | 200 | | | | 1,787 | | | | 10,251 | |
As of September 30, 2016 year-to-date new money rates for fixed income securities were 2.9% on a pre-tax basis and 2.0% on an after-tax basis.
Selective Insurance Group, Inc.
Combined Insurance Company Subsidiaries
2016 Statutory Results by Line of Business
Quarter Ended September 2016 (unaudited)
| | | Net | | | | Net | | | | | | | | Underwriting | | Dividends to | | | | | | |
| | | Premiums | | Percent | | Premiums | | Percent | | Loss | | LAE | | Expense | | Policyholders | | Combined Ratio | | Combined Ratio | | Underwriting |
| ($ in thousands) | | Written | | Change | | Earned | | Change | | Ratio | | Ratio | | Ratio | | Ratio | | 2016 | | 2015 | | Gain (Loss) |
| Standard Personal Lines: | | | | | | | | | | | | | | | | | | | | | | | | | | | | | | | | | | | | | | | | | | | | |
| | | | | | | | | | | | | | | | | | | | | | | | | | | | | | | | | | | | | | | | | | | | | |
| Homeowners | | $ | 36,131 | | | | (3.6 | )% | | $ | 32,031 | | | | (4.9 | )% | | | 41.9 | % | | | 8.6 | % | | | 35.9 | % | | | 0.0 | % | | | 86.4 | % | | | 96.8 | % | | $ | 2,873 | |
| Auto | | | 38,114 | | | | 1.3 | % | | | 34,865 | | | | (4.8 | )% | | | 63.3 | % | | | 11.0 | % | | | 36.0 | % | | | 0.0 | % | | | 110.3 | % | | | 103.4 | % | | | (4,752 | ) |
| Other (including flood) | | | 1,980 | | | | 8.4 | % | | | 1,794 | | | | (0.0 | )% | | | 62.0 | % | | | (83.5 | )% | | | (143.8 | )% | | | 0.0 | % | | | (165.3 | )% | | | (118.3 | )% | | | 5,028 | |
| Total | | $ | 76,225 | | | | (0.9 | )% | | $ | 68,690 | | | | (4.7 | )% | | | 53.3 | % | | | 7.4 | % | | | 31.3 | % | | | 0.0 | % | | | 92.0 | % | | | 95.0 | % | | $ | 3,149 | |
| | | | | | | | | | | | | | | | | | | | | | | | | | | | | | | | | | | | | | | | | | | | | |
| Standard Commercial Lines: | | | | | | | | | | | | | | | | | | | | | | | | | | | | | | | | | | | | | | | | | | | | |
| | | | | | | | | | | | | | | | | | | | | | | | | | | | | | | | | | | | | | | | | | | | | |
| Commercial property | | $ | 82,695 | | | | 6.5 | % | | $ | 74,052 | | | | 8.0 | % | | | 42.0 | % | | | 5.1 | % | | | 38.0 | % | | | 0.1 | % | | | 85.2 | % | | | 67.8 | % | | $ | 7,703 | |
| Workers compensation | | | 81,646 | | | | 9.7 | % | | | 78,596 | | | | 5.4 | % | | | 37.0 | % | | | 13.4 | % | | | 29.5 | % | | | 0.2 | % | | | 80.2 | % | | | 84.0 | % | | | 14,689 | |
| General liability | | | 141,556 | | | | 8.3 | % | | | 133,981 | | | | 8.7 | % | | | 32.5 | % | | | 15.8 | % | | | 36.3 | % | | | 0.1 | % | | | 84.7 | % | | | 89.1 | % | | | 17,714 | |
| Auto | | | 108,655 | | | | 10.9 | % | | | 100,612 | | | | 10.9 | % | | | 70.3 | % | | | 10.4 | % | | | 33.6 | % | | | 0.1 | % | | | 114.5 | % | | | 104.5 | % | | | (17,257 | ) |
| Businessowners' policies | | | 23,985 | | | | 0.2 | % | | | 24,461 | | | | 3.1 | % | | | 55.3 | % | | | 11.9 | % | | | 39.6 | % | | | 0.0 | % | | | 106.8 | % | | | 100.0 | % | | | (1,482 | ) |
| Bonds | | | 6,723 | | | | 25.1 | % | | | 5,795 | | | | 15.2 | % | | | 12.8 | % | | | 7.2 | % | | | 55.0 | % | | | 0.0 | % | | | 75.0 | % | | | 91.5 | % | | | 937 | |
| Other | | | 4,282 | | | | 8.8 | % | | | 4,089 | | | | 12.7 | % | | | 0.3 | % | | | 0.4 | % | | | 60.0 | % | | | 0.0 | % | | | 60.6 | % | | | 60.0 | % | | | 1,494 | |
| Total | | $ | 449,544 | | | | 8.6 | % | | $ | 421,586 | | | | 8.2 | % | | | 44.8 | % | | | 11.7 | % | | | 35.4 | % | | | 0.1 | % | | | 92.0 | % | | | 88.4 | % | | $ | 23,799 | |
| | | | | | | | | | | | | | | | | | | | | | | | | | | | | | | | | | | | | | | | | | | | | |
| E&S | | $ | 53,004 | | | | (2.0 | )% | | $ | 52,153 | | | | 14.0 | % | | | 52.1 | % | | | 17.9 | % | | | 31.4 | % | | | 0.0 | % | | | 101.4 | % | | | 101.1 | % | | $ | (986 | ) |
| | | | | | | | | | | | | | | | | | | | | | | | | | | | | | | | | | | | | | | | | | | | | |
| Total Insurance Operations | | $ | 578,773 | | | | 6.2 | % | | $ | 542,429 | | | | 6.9 | % | | | 46.5 | % | | | 11.8 | % | | | 34.5 | % | | | 0.1 | % | | | 92.9 | % | | | 90.5 | % | | $ | 25,962 | |
| | | | | | | | | | | | | | | | | | | | | | | | | | | | | | | | | | | | | | | | | | | | | |
| Note: Some amounts may not foot due to rounding. | | | |
| | | | |
| | | | | | | | | | | | | | | | | | | | | | | | | | | | | | | | | | | | | | | | | | | | | |
| | | | | | | | 2016 | | | | 2015 | | | | | | | | | | | | | | | | | | | | | | | | | | | | | | | | | |
| | | | Losses Paid | | | $ | 226,037 | | | $ | 237,573 | | | | | | | | | | | | | | | | | | | | | | | | | | | | | | | | | |
| | | | LAE Paid | | | | 48,335 | | | | 50,084 | | | | | | | | | | | | | | | | | | | | | | | | | | | | | | | | | |
| | | | Total Paid | | | $ | 274,372 | | | $ | 287,657 | | | | | | | | | | | | | | | | | | | | | | | | | | | | | | | | | |
| | | | | | | | | | | | | | | | | | | | | | | | | | | | | | | | | | | | | | | | | | | | | |
Selective Insurance Group, Inc.
Combined Insurance Company Subsidiaries
2016 Statutory Results by Line of Business
Year-to-Date September 2016 (unaudited)
| | | Net | | | | Net | | | | | | | | Underwriting | | Dividends to | | | | | | |
| | | Premiums | | Percent | | Premiums | | Percent | | Loss | | LAE | | Expense | | Policyholders | | Combined Ratio | | Combined Ratio | | Underwriting |
| ($ in thousands) | | Written | | Change | | Earned | | Change | | Ratio | | Ratio | | Ratio | | Ratio | | 2016 | | 2015 | | Gain (Loss) |
| Standard Personal Lines: | | | | | | | | | | | | | | | | | | | | | | | | | | | | | | | | | | | | | | | | | | | | |
| | | | | | | | | | | | | | | | | | | | | | | | | | | | | | | | | | | | | | | | | | | | | |
| Homeowners | | $ | 98,697 | | | | (3.1 | )% | | $ | 98,342 | | | | (2.7 | )% | | | 39.7 | % | | | 8.5 | % | | | 37.2 | % | | | 0.0 | % | | | 85.4 | % | | | 108.0 | % | | $ | 14,253 | |
| Auto | | | 110,093 | | | | (0.9 | )% | | | 106,526 | | | | (3.5 | )% | | | 59.8 | % | | | 11.2 | % | | | 35.4 | % | | | 0.0 | % | | | 106.4 | % | | | 105.5 | % | | | (8,120 | ) |
| Other (including flood) | | | 4,980 | | | | 0.1 | % | | | 4,851 | | | | (5.7 | )% | | | 63.4 | % | | | (50.9 | )% | | | (158.7 | )% | | | 0.0 | % | | | (146.2 | )% | | | (108.5 | )% | | | 12,148 | |
| Total | | $ | 213,770 | | | | (1.9 | )% | | $ | 209,719 | | | | (3.2 | )% | | | 50.4 | % | | | 8.5 | % | | | 31.8 | % | | | 0.0 | % | | | 90.7 | % | | | 101.7 | % | | $ | 18,280 | |
| | | | | | | | | | | | | | | | | | | | | | | | | | | | | | | | | | | | | | | | | | | | | |
| Standard Commercial Lines: | | | | | | | | | | | | | | | | | | | | | | | | | | | | | | | | | | | | | | | | | | | | |
| | | | | | | | | | | | | | | | | | | | | | | | | | | | | | | | | | | | | | | | | | | | | |
| Commercial property | | $ | 237,693 | | | | 8.4 | % | | $ | 217,821 | | | | 9.1 | % | | | 41.6 | % | | | 4.9 | % | | | 38.5 | % | | | 0.3 | % | | | 85.0 | % | | | 86.9 | % | | $ | 25,186 | |
| Workers compensation | | | 252,032 | | | | 7.8 | % | | | 229,847 | | | | 7.4 | % | | | 40.2 | % | | | 13.8 | % | | | 28.0 | % | | | 0.8 | % | | | 82.8 | % | | | 87.7 | % | | | 33,220 | |
| General liability | | | 431,751 | | | | 9.1 | % | | | 391,349 | | | | 9.5 | % | | | 34.5 | % | | | 13.7 | % | | | 35.5 | % | | | 0.2 | % | | | 83.9 | % | | | 80.0 | % | | | 48,820 | |
| Auto | | | 325,751 | | | | 11.7 | % | | | 294,927 | | | | 11.0 | % | | | 66.1 | % | | | 9.7 | % | | | 32.8 | % | | | 0.2 | % | | | 108.9 | % | | | 101.5 | % | | | (36,277 | ) |
| Businessowners' policies | | | 74,055 | | | | 3.2 | % | | | 73,016 | | | | 4.9 | % | | | 43.9 | % | | | 11.6 | % | | | 39.1 | % | | | 0.0 | % | | | 94.7 | % | | | 108.9 | % | | | 3,479 | |
| Bonds | | | 19,494 | | | | 18.8 | % | | | 16,924 | | | | 11.8 | % | | | 12.8 | % | | | 7.4 | % | | | 56.7 | % | | | 0.0 | % | | | 76.8 | % | | | 87.5 | % | | | 2,463 | |
| Other | | | 12,839 | | | | 11.5 | % | | | 11,868 | | | | 11.4 | % | | | (0.2 | )% | | | 0.3 | % | | | 56.9 | % | | | 0.0 | % | | | 56.9 | % | | | 56.0 | % | | | 4,558 | |
| Total | | $ | 1,353,615 | | | | 9.2 | % | | $ | 1,235,752 | | | | 9.1 | % | | | 44.3 | % | | | 10.9 | % | | | 34.6 | % | | | 0.3 | % | | | 90.1 | % | | | 89.4 | % | | $ | 81,449 | |
| | | | | | | | | | | | | | | | | | | | | | | | | | | | | | | | | | | | | | | | | | | | | |
| E&S | | $ | 154,887 | | | | 12.9 | % | | $ | 151,348 | | | | 21.2 | % | | | 50.2 | % | | | 19.3 | % | | | 31.4 | % | | | 0.0 | % | | | 100.9 | % | | | 101.8 | % | | $ | (2,461 | ) |
| | | | | | | | | | | | | | | | | | | | | | | | | | | | | | | | | | | | | | | | | | | | | |
| Total Insurance Operations | | $ | 1,722,272 | | | | 8.0 | % | | $ | 1,596,819 | | | | 8.3 | % | | | 45.6 | % | | | 11.4 | % | | | 34.0 | % | | | 0.2 | % | | | 91.2 | % | | | 92.3 | % | | $ | 97,268 | |
| | | | | | | | | | | | | | | | | | | | | | | | | | | | | | | | | | | | | | | | | | | | | |
| Note: Some amounts may not foot due to rounding. | | | | | | | | | | | | | | | | | | | | | | | | | | | | | | | |
| | | | | | | | | | | | | | | | | | | | | | | | | | | | | | | | |
| | | | | | | | | | | | | | | | | | | | | | | | | | | | | | | | | | | | | | | | | | | | |
| | | | | | | | 2016 | | | | 2015 | | | | | | | | | | | | | | | | | | | | | | | | | | | | | | | | | |
| | | | Losses Paid | | | $ | 678,430 | | | $ | 656,683 | | | | | | | | | | | | | | | | | | | | | | | | | | | | | | | | | |
| | | | LAE Paid | | | | 145,504 | | | | 144,145 | | | | | | | | | | | | | | | | | | | | | | | | | | | | | | | | | |
| | | | Total Paid | | | $ | 823,934 | | | $ | 800,828 | | | | | | | | | | | | | | | | | | | | | | | | | | | | | | | | | |
| | | | | | | | | | | | | | | | | | | | | | | | | | | | | | | | | | | | | | | | | | | | | |
Selective Insurance Group, Inc.
Combined Insurance Company Subsidiaries
2016 Net Catastrophe Losses and Prior Year Casualty Reserve Development
Statutory Results by Line of Business
(unaudited)
| | | Quarter Ended | | Year-to-Date |
| Net Catastrophe Losses Incurred | | September 30, 2016 | | September 30, 2015 | | September 30, 2016 | | September 30, 2015 |
| ($ in thousands) | | Loss and Loss
Expense Incurred | | Impact on Loss and Loss
Expense Ratio | | Loss and Loss
Expense Incurred | | Impact on Loss and Loss
Expense Ratio | | Loss and Loss
Expense Incurred | | Impact on Loss and
Loss Expense Ratio | | Loss and Loss
Expense Incurred | | Impact on Loss and
Loss Expense Ratio |
| | | | | | | | | | | | | | | | | |
| Standard Personal Lines | | $ | 2,480 | | | | 3.6 | % | | $ | 5,784 | | | | 8.0 | % | | $ | 6,809 | | | | 3.2 | % | | $ | 20,381 | | | | 9.4 | % |
| | | | | | | | | | | | | | | | | | | | | | | | | | | | | | | | | |
| Standard Commercial Lines | | | 6,204 | | | | 1.5 | % | | | 757 | | | | 0.2 | % | | | 21,476 | | | | 1.7 | % | | | 33,016 | | | | 2.9 | % |
| | | | | | | | | | | | | | | | | | | | | | | | | | | | | | | | | |
| E&S | | | 1,710 | | | | 3.3 | % | | | 308 | | | | 0.7 | % | | | 4,895 | | | | 3.2 | % | | | 2,752 | | | | 2.2 | % |
| | | | | | | | | | | | | | | | | | | | | | | | | | | | | | | | | |
| Total Insurance Operations | | $ | 10,394 | | | | 1.9 | % | | $ | 6,850 | | | | 1.3 | % | | $ | 33,180 | | | | 2.1 | % | | $ | 56,149 | | | | 3.8 | % |
| | | | | | | | | | | | | | | | | | | | | | | | | | | | | | | | | |
| | | | | | | | | | | | | | | | | | | | | | | | | | | | | | | | | |
| | | | | | | | | | | | | | | | | | | | | | | | | | | | | | | | | |
| | | | | | | | | | | | | | | | | | | | | | | | | | | | | | | | | |
| Prior Year Casualty Reserve Development | | Quarter Ended | | Year-to-Date |
| (Favorable) / Unfavorable | | September 30, 2016 | | September 30, 2015 | | September 30, 2016 | | September 30, 2015 |
| ($ in thousands) | | Loss and Loss
Expense Incurred | | Impact on Loss and Loss
Expense Ratio | | Loss and Loss
Expense Incurred | | Impact on Loss and Loss
Expense Ratio | | Loss and Loss
Expense Incurred | | Impact on Loss and
Loss Expense Ratio | | Loss and Loss
Expense Incurred | | Impact on Loss and
Loss Expense Ratio |
| | | | | | | | | | | | | | | | | | | | | | | | | | | | | | | | | |
| Standard Personal Lines | | $ | - | | | | 0.0 | % | | $ | - | | | | 0.0 | % | | $ | - | | | | 0.0 | % | | $ | - | | | | 0.0 | % |
| | | | | | | | | | | | | | | | | | | | | | | | | | | | | | | | | |
| Standard Commercial Lines | | | (19,000 | ) | | | (4.5 | )% | | | (19,000 | ) | | | (4.9 | )% | | | (49,000 | ) | | | (4.0 | )% | | | (61,000 | ) | | | (5.4 | )% |
| | | | | | | | | | | | | | | | | | | | | | | | | | | | | | | | | |
| E&S | | | - | | | | 0.0 | % | | | 4,000 | | | | 8.7 | % | | | 3,000 | | | | 2.0 | % | | | 6,000 | | | | 4.8 | % |
| | | | | | | | | | | | | | | | | | | | | | | | | | | | | | | | | |
| Total Insurance Operations | | $ | (19,000 | ) | | | (3.5 | )% | | $ | (15,000 | ) | | | (3.0 | )% | | $ | (46,000 | ) | | | (2.9 | )% | | $ | (55,000 | ) | | | (3.7 | )% |
Note: Some amounts may not foot due to rounding.
Selective Insurance Group, Inc. & Consolidated Subsidiaries Consolidated Balance Sheets | | Unaudited | | |
| ($ in thousands, except share amounts) | | September 30,
2016 | | December 31,
2015 |
| ASSETS | | | | | | | | |
| Investments: | | | | | | | | |
| Fixed income securities, held-to-maturity – at carrying value (fair value: $136,094 – 2016; $209,544 – 2015) | | $ | 130,472 | | | | 201,354 | |
| Fixed income securities, available-for-sale – at fair value (amortized cost: $4,682,267 – 2016; $4,352,514 – 2015) | | | 4,832,532 | | | | 4,408,203 | |
| Equity securities, available-for-sale – at fair value (cost: $122,981 – 2016; $193,816 – 2015) | | | 147,304 | | | | 207,051 | |
| Short-term investments (at cost which approximates fair value) | | | 169,604 | | | | 194,819 | |
| Other investments | | | 88,512 | | | | 77,842 | |
| Total investments | | | 5,368,424 | | | | 5,089,269 | |
| Cash | | | 1,493 | | | | 898 | |
| Interest and dividends due or accrued | | | 39,901 | | | | 38,501 | |
| Premiums receivable, net of allowance for uncollectible accounts of: $5,907 – 2016; $4,422 – 2015 | | | 711,589 | | | | 615,164 | |
| Reinsurance recoverables, net of allowance for uncollectible accounts of: $5,500 – 2016; $5,700 – 2015 | | | 640,012 | | | | 561,968 | |
| Prepaid reinsurance premiums | | | 151,981 | | | | 140,889 | |
| Deferred federal income tax | | | 41,656 | | | | 92,696 | |
| Property and equipment – at cost, net of accumulated depreciation and amortization of: $198,171 – 2016; $188,548 – 2015 | | | 69,812 | | | | 65,701 | |
| Deferred policy acquisition costs | | | 235,934 | | | | 213,159 | |
| Goodwill | | | 7,849 | | | | 7,849 | |
| Other assets | | | 94,582 | | | | 78,339 | |
| Total assets | | $ | 7,363,233 | | | | 6,904,433 | |
| | | | | | | | | |
| LIABILITIES AND STOCKHOLDERS’ EQUITY | | | | | | | | |
| Liabilities: | | | | | | | | |
| Reserve for loss and loss expenses | | $ | 3,686,586 | | | | 3,517,728 | |
| Unearned premiums | | | 1,306,255 | | | | 1,169,710 | |
| Short-term debt | | | 45,000 | | | | 60,000 | |
| Long-term debt | | | 378,551 | | | | 328,192 | |
| Current federal income tax | | | 6,509 | | | | 7,442 | |
| Accrued salaries and benefits | | | 103,583 | | | | 167,336 | |
| Other liabilities | | | 261,845 | | | | 255,984 | |
| Total liabilities | | $ | 5,788,329 | | | | 5,506,392 | |
| | | | | | | | | |
| Stockholders’ Equity: | | | | | | | | |
| Preferred stock of $0 par value per share: | | $ | — | | | | — | |
| Authorized shares 5,000,000; no shares issued or outstanding | | | | | | | | |
| Common stock of $2 par value per share: | | | | | | | | |
| Authorized shares 360,000,000 | | | | | | | | |
| Issued: 101,505,201 – 2016; 100,861,372 – 2015 | | | 203,011 | | | | 201,723 | |
| Additional paid-in capital | | | 342,846 | | | | 326,656 | |
| Retained earnings | | | 1,538,928 | | | | 1,446,192 | |
| Accumulated other comprehensive income (loss) | | | 62,209 | | | | (9,425 | ) |
| Treasury stock – at cost (shares: 43,653,034 – 2016; 43,500,642 – 2015) | | | (572,090 | ) | | | (567,105 | ) |
| Total stockholders’ equity | | $ | 1,574,904 | | | | 1,398,041 | |
| Commitments and contingencies | | | | | | | | |
| Total liabilities and stockholders’ equity | | $ | 7,363,233 | | | | 6,904,433 | |
Selective Insurance Group, Inc. & Consolidated Subsidiaries Unaudited Consolidated Statements of Income | | Quarter ended September 30, | | Nine Months ended September 30, |
| ($ in thousands, except per share amounts) | | 2016 | | 2015 | | 2016 | | 2015 |
| Revenues: | | | | | | | | | | | | | | | | |
| Net premiums earned | | $ | 542,429 | | | | 507,390 | | | | 1,596,819 | | | | 1,473,822 | |
| Net investment income earned | | | 33,375 | | | | 32,061 | | | | 95,326 | | | | 91,208 | |
| Net realized gains: | | | | | | | | | | | | | | | | |
| Net realized investment gains | | | 4,030 | | | | 1,590 | | | | 7,233 | | | | 23,598 | |
| Other-than-temporary impairments | | | (342 | ) | | | (1,282 | ) | | | (4,494 | ) | | | (7,827 | ) |
| Other-than-temporary impairments on fixed income securities recognized in other comprehensive income | | | — | | | | — | | | | 10 | | | | — | |
| Total net realized gains | | | 3,688 | | | | 308 | | | | 2,749 | | | | 15,771 | |
| Other income | | | 2,199 | | | | 698 | | | | 7,018 | | | | 5,521 | |
| Total revenues | | | 581,691 | | | | 540,457 | | | | 1,701,912 | | | | 1,586,322 | |
| | | | | | | | | | | | | | | | | |
| Expenses: | | | | | | | | | | | | | | | | |
| Loss and loss expense incurred | | | 316,258 | | | | 285,161 | | | | 911,881 | | | | 861,721 | |
| Policy acquisition costs | | | 193,835 | | | | 174,802 | | | | 567,793 | | | | 509,295 | |
| Interest expense | | | 5,714 | | | | 5,610 | | | | 16,940 | | | | 16,826 | |
| Other expenses | | | 10,441 | | | | 9,045 | | | | 35,669 | | | | 29,586 | |
| Total expenses | | | 526,248 | | | | 474,618 | | | | 1,532,283 | | | | 1,417,428 | |
| | | | | | | | | | | | | | | | | |
| Income before federal income tax | | | 55,443 | | | | 65,839 | | | | 169,629 | | | | 168,894 | |
| | | | | | | | | | | | | | | | | |
| Federal income tax expense: | | | | | | | | | | | | | | | | |
| Current | | | 5,625 | | | | 9,141 | | | | 38,027 | | | | 29,128 | |
| Deferred | | | 11,316 | | | | 9,702 | | | | 12,467 | | | | 19,294 | |
| Total federal income tax expense | | | 16,941 | | | | 18,843 | | | | 50,494 | | | | 48,422 | |
| | | | | | | | | | | | | | | | | |
| Net income | | $ | 38,502 | | | | 46,996 | | | | 119,135 | | | | 120,472 | |
| | | | | | | | | | | | | | | | | |
| Earnings per share: | | | | | | | | | | | | | | | | |
| Basic net income | | $ | 0.66 | | | | 0.82 | | | | 2.06 | | | | 2.11 | |
| | | | | | | | | | | | | | | | | |
| Diluted net income | | $ | 0.66 | | | | 0.81 | | | | 2.03 | | | | 2.08 | |
| | | | | | | | | | | | | | | | | |
| Dividends to stockholders | | $ | 0.15 | | | | 0.14 | | | | 0.45 | | | | 0.42 | |
Selective Insurance Group, Inc. & Consolidated Subsidiaries Unaudited Consolidated Statements of Comprehensive Income | | Quarter ended
September 30, | | Nine Months ended
September 30, |
| ($ in thousands) | | 2016 | | 2015 | | 2016 | | 2015 |
| Net income | | $ | 38,502 | | | | 46,996 | | | | 119,135 | | | | 120,472 | |
| | | | | | | | | | | | | | | | | |
| | | | | | | | | | | | | | | | | |
| Other comprehensive (loss) income, net of tax: | | | | | | | | | | | | | | | | |
| Unrealized (losses) gains on investment securities: | | | | | | | | | | | | | | | | |
| Unrealized holding (losses) gains arising during period | | | (8,444 | ) | | | 5,442 | | | | 70,473 | | | | (18,132 | ) |
| Non-credit portion of other-than-temporary impairments recognized in other comprehensive income | | | — | | | | — | | | | (6 | ) | | | — | |
| Amounts reclassified into net income: | | | | | | | | | | | | | | | | |
| Held-to-maturity securities | | | (9 | ) | | | (63 | ) | | | (68 | ) | | | (353 | ) |
| Non-credit other-than-temporary impairments | | | — | | | | — | | | | — | | | | 232 | |
| Realized gains on available-for-sale securities | | | (2,395 | ) | | | (199 | ) | | | (1,786 | ) | | | (10,906 | ) |
| Total unrealized (losses) gains on investment securities | | | (10,848 | ) | | | 5,180 | | | | 68,613 | | | | (29,159 | ) |
| | | | | | | | | | | | | | | | | |
| Defined benefit pension and post-retirement plans: | | | | | | | | | | | | | | | | |
| Amounts reclassified into net income: | | | | | | | | | | | | | | | | |
| Net actuarial loss | | | 1,050 | | | | 1,110 | | | | 3,021 | | | | 3,332 | |
| Total defined benefit pension and post-retirement plans | | | 1,050 | | | | 1,110 | | | | 3,021 | | | | 3,332 | |
| Other comprehensive (loss) income | | | (9,798 | ) | | | 6,290 | | | | 71,634 | | | | (25,827 | ) |
| Comprehensive income | | $ | 28,704 | | | | 53,286 | | | | 190,769 | | | | 94,645 | |
Selective Insurance Group, Inc. & Consolidated Subsidiaries Unaudited Consolidated Statements of Stockholders’ Equity | | Nine Months ended
September 30, |
| ($ in thousands, except per share amounts) | | 2016 | | 2015 |
| Common stock: | | | | | | | | |
| Beginning of year | | $ | 201,723 | | | | 199,896 | |
| Dividend reinvestment plan (shares: 29,865 – 2016; 38,947 – 2015) | | | 60 | | | | 78 | |
| Stock purchase and compensation plans (shares: 613,964 – 2016; 686,984 – 2015) | | | 1,228 | | | | 1,374 | |
| End of period | | | 203,011 | | | | 201,348 | |
| | | | | | | | | |
| Additional paid-in capital: | | | | | | | | |
| Beginning of year | | | 326,656 | | | | 305,385 | |
| Dividend reinvestment plan | | | 1,035 | | | | 1,014 | |
| Stock purchase and compensation plans | | | 15,155 | | | | 14,588 | |
| End of period | | | 342,846 | | | | 320,987 | |
| | | | | | | | | |
| Retained earnings: | | | | | | | | |
| Beginning of year | | | 1,446,192 | | | | 1,313,440 | |
| Net income | | | 119,135 | | | | 120,472 | |
| Dividends to stockholders ($0.45 per share – 2016; $0.42 per share – 2015) | | | (26,399 | ) | | | (24,376 | ) |
| End of period | | | 1,538,928 | | | | 1,409,536 | |
| | | | | | | | | |
| Accumulated other comprehensive income (loss): | | | | | | | | |
| Beginning of year | | | (9,425 | ) | | | 19,788 | |
| Other comprehensive income (loss) | | | 71,634 | | | | (25,827 | ) |
| End of period | | | 62,209 | | | | (6,039 | ) |
| | | | | | | | | |
| Treasury stock: | | | | | | | | |
| Beginning of year | | | (567,105 | ) | | | (562,923 | ) |
| Acquisition of treasury stock (shares: 152,392 – 2016; 139,031 – 2015) | | | (4,985 | ) | | | (3,887 | ) |
| End of period | | | (572,090 | ) | | | (566,810 | ) |
| Total stockholders’ equity | | $ | 1,574,904 | | | | 1,359,022 | |
Selective Insurance Group, Inc. & Consolidated Subsidiaries Unaudited Consolidated Statements of Cash Flow | | Nine Months ended
September 30, |
| ($ in thousands) | | 2016 | | 2015 |
| Operating Activities | | | | |
| Net income | | $ | 119,135 | | | | 120,472 | |
| | | | | | | | | |
| Adjustments to reconcile net income to net cash provided by operating activities: | | | | | | | | |
| Depreciation and amortization | | | 45,563 | | | | 43,868 | |
| Stock-based compensation expense | | | 8,950 | | | | 7,626 | |
| Undistributed losses of equity method investments | | | 49 | | | | 781 | |
| Net realized gains | | | (2,749 | ) | | | (15,771 | ) |
| | | | | | | | | |
| Changes in assets and liabilities: | | | | | | | | |
| Increase in reserve for loss and loss expenses, net of reinsurance recoverables | | | 90,814 | | | | 60,065 | |
| Increase in unearned premiums, net of prepaid reinsurance | | | 125,453 | | | | 121,424 | |
| Decrease in net federal income taxes | | | 11,534 | | | | 27,980 | |
| Increase in premiums receivable | | | (96,425 | ) | | | (95,188 | ) |
| Increase in deferred policy acquisition costs | | | (22,775 | ) | | | (28,058 | ) |
| (Increase) decrease in interest and dividends due or accrued | | | (1,356 | ) | | | 979 | |
| Decrease in accrued salaries and benefits | | | (63,753 | ) | | | (338 | ) |
| Increase in other assets | | | (16,280 | ) | | | (13,888 | ) |
| (Decrease) increase in other liabilities | | | (20,686 | ) | | | 29,081 | |
| Net adjustments | | | 58,339 | | | | 138,561 | |
| Net cash provided by operating activities | | | 177,474 | | | | 259,033 | |
| | | | | | | | | |
| Investing Activities | | | | | | | | |
| Purchase of fixed income securities, available-for-sale | | | (842,253 | ) | | | (731,154 | ) |
| Purchase of fixed income securities, held-to-maturity | | | (4,235 | ) | | | — | |
| Purchase of equity securities, available-for-sale | | | (24,747 | ) | | | (192,717 | ) |
| Purchase of other investments | | | (34,994 | ) | | | (6,589 | ) |
| Purchase of short-term investments | | | (1,307,024 | ) | | | (1,084,794 | ) |
| Sale of fixed income securities, available-for-sale | | | 33,448 | | | | 22,323 | |
| Sale of short-term investments | | | 1,332,239 | | | | 1,090,911 | |
| Redemption and maturities of fixed income securities, held-to-maturity | | | 74,186 | | | | 79,972 | |
| Redemption and maturities of fixed income securities, available-for-sale | | | 483,877 | | | | 403,510 | |
| Sale of equity securities, available-for-sale | | | 99,420 | | | | 148,228 | |
| Distributions from other investments | | | 18,512 | | | | 22,038 | |
| Purchase of property and equipment | | | (13,421 | ) | | | (11,869 | ) |
| Net cash used in investing activities | | | (184,992 | ) | | | (260,141 | ) |
| | | | | | | | | |
| Financing Activities | | | | | | | | |
| Dividends to stockholders | | | (24,885 | ) | | | (22,848 | ) |
| Acquisition of treasury stock | | | (4,985 | ) | | | (3,887 | ) |
| Net proceeds from stock purchase and compensation plans | | | 4,906 | | | | 6,016 | |
| Proceeds from borrowings | | | 105,000 | | | | 15,000 | |
| Repayments of borrowings | | | (70,000 | ) | | | — | |
| Excess tax benefits from share-based payment arrangements | | | 1,917 | | | | 1,498 | |
| Repayments of capital lease obligations | | | (3,840 | ) | | | (3,517 | ) |
| Net cash provided by (used in) financing activities | | | 8,113 | | | | (7,738 | ) |
| Net increase (decrease) in cash | | | 595 | | | | (8,846 | ) |
| Cash, beginning of year | | | 898 | | | | 23,959 | |
| Cash, end of period | | $ | 1,493 | | | | 15,113 | |
Selective Insurance Group, Inc.
Combined Insurance Company Subsidiaries
Statutory Balance Sheets
(unaudited)
| | | September 30, | | September 30, | | December 31, |
| ($ in thousands) | | 2016 | | 2015 | | 2015 |
| | | | | | | |
| ASSETS | | | | | | | | | | | | |
| Bonds | | $ | 4,737,691 | | | | 4,438,650 | | | | 4,491,136 | |
| Common stocks | | | 135,489 | | | | 210,197 | | | | 194,789 | |
| Preferred stocks | | | 11,310 | | | | 11,708 | | | | 11,856 | |
| Affiliated mortgage loan | | | 34,538 | | | | 35,366 | | | | 35,163 | |
| Other investments | | | 134,972 | | | | 136,591 | | | | 128,788 | |
| Short-term investments | | | 147,891 | | | | 109,393 | | | | 165,678 | |
| Total investments | | | 5,201,891 | | | | 4,941,905 | | | | 5,027,410 | |
| | | | | | | | | | | | | |
| Cash on hand and in banks | | | 5,581 | | | | (6,272 | ) | | | (34,378 | ) |
| Interest and dividends due and accrued | | | 39,843 | | | | 37,944 | | | | 38,466 | |
| Premiums receivable | | | 705,735 | | | | 648,264 | | | | 609,146 | |
| Reinsurance recoverable on paid losses and expenses | | | 9,326 | | | | 11,288 | | | | 10,949 | |
| Deferred tax recoverable | | | 159,475 | | | | 146,936 | | | | 142,066 | |
| EDP equipment | | | 389 | | | | 436 | | | | 390 | |
| Equities and deposits in pools and associations | | | 12,533 | | | | 12,394 | | | | 10,920 | |
| Receivable for sold securities | | | 6 | | | | 64 | | | | 17 | |
| Other assets | | | 30,343 | | | | 26,798 | | | | 28,300 | |
| Total assets | | $ | 6,165,122 | | | | 5,819,757 | | | | 5,833,286 | |
| | | | | | | | | | | | | |
| LIABILITIES | | | | | | | | | | | | |
| Reserve for losses | | $ | 2,477,012 | | | | 2,427,024 | | | | 2,426,583 | |
| Reinsurance payable on paid loss and loss expense | | | 3,472 | | | | 2,677 | | | | 2,841 | |
| Reserve for loss expenses | | | 561,520 | | | | 526,253 | | | | 525,322 | |
| Unearned premiums | | | 1,154,274 | | | | 1,070,250 | | | | 1,028,820 | |
| Reserve for commissions payable | | | 83,202 | | | | 73,293 | | | | 89,740 | |
| Ceded balances payable | | | 46,471 | | | | 32,626 | | | | 37,222 | |
| Federal income tax payable | | | 18,332 | | | | 22,996 | | | | 25,644 | |
| Premium and other taxes payable | | | 21,375 | | | | 24,257 | | | | 23,998 | |
| Borrowed money | | | 95,156 | | | | 60,029 | | | | 60,031 | |
| Reserve for dividends to policyholders | | | 6,587 | | | | 5,989 | | | | 5,805 | |
| Reserves for unauthorized reinsurance | | | 2,030 | | | | 7,661 | | | | 2,030 | |
| Payable for securities | | | 31,326 | | | | 31,974 | | | | 6,204 | |
| Funds withheld on account of others | | | 10,671 | | | | 7,695 | | | | 6,806 | |
| Accrued salaries and benefits | | | 69,337 | | | | 69,837 | | | | 77,933 | |
| Other liabilities | | | 33,130 | | | | 89,853 | | | | 87,987 | |
| Total liabilities | | | 4,613,895 | | | | 4,452,414 | | | | 4,406,966 | |
| | | | | | | | | | | | | |
| | | | | | | | | | | | | |
| POLICYHOLDERS' SURPLUS | | | | | | | | | | | | |
| Capital | | | 42,725 | | | | 42,725 | | | | 42,725 | |
| Paid in surplus | | | 492,869 | | | | 492,869 | | | | 492,869 | |
| Unassigned surplus | | | 1,015,633 | | | | 831,749 | | | | 890,726 | |
| Total policyholders' surplus | | | 1,551,227 | | | | 1,367,343 | | | | 1,426,320 | |
| Total liabilities and policyholders' surplus | | $ | 6,165,122 | | | | 5,819,757 | | | | 5,833,286 | |
Selective Insurance Group, Inc.
Combined Insurance Company Subsidiaries
Statutory Statements Of Income
(unaudited)
| | | Quarter Ended
September | | | | Nine Months Ended
September | | |
| ($ in thousands) | | 2016 | | | | 2015 | | | | 2016 | | | | 2015 | | |
| UNDERWRITING | | | | | | | | | | | | | | | | | | | | | | | | | | | | | | | | |
| Net premiums written | | $ | 578,773 | | | | | | | | 545,025 | | | | | | | | 1,722,272 | | | | | | | | 1,595,246 | | | | | |
| | | | | | | | | | | | | | | | | | | | | | | | | | | | | | | | | |
| Net premiums earned | | | 542,429 | | | | | | | | 507,390 | | | | | | | | 1,596,819 | | | | | | | | 1,473,822 | | | | | |
| | | | | | | | | | | | | | | | | | | | | | | | | | | | | | | | | |
| Net losses paid | | | 226,037 | | | | | | | | 237,573 | | | | | | | | 678,430 | | | | | | | | 656,683 | | | | | |
| Change in reserve for losses | | | 26,528 | | | | | | | | (11,051 | ) | | | | | | | 50,463 | | | | | | | | 28,493 | | | | | |
| Net losses incurred | | | 252,565 | | | | 46.5 | % | | | 226,522 | | | | 44.6 | % | | | 728,893 | | | | 45.6 | % | | | 685,176 | | | | 46.5 | % |
| | | | | | | | | | | | | | | | | | | | | | | | | | | | | | | | | |
| Net loss expenses paid | | | 48,335 | | | | | | | | 50,084 | | | | | | | | 145,504 | | | | | | | | 144,145 | | | | | |
| Change in reserve for loss expenses | | | 15,460 | | | | | | | | 8,083 | | | | | | | | 36,198 | | | | | | | | 32,744 | | | | | |
| Net loss expenses incurred | | | 63,795 | | | | 11.8 | % | | | 58,167 | | | | 11.5 | % | | | 181,702 | | | | 11.4 | % | | | 176,889 | | | | 12.0 | % |
| | | | | | | | | | | | | | | | | | | | | | | | | | | | | | | | | |
| Net underwriting expenses incurred | | | 201,060 | | | | 34.8 | % | | | 185,183 | | | | 33.9 | % | | | 590,178 | | | | 34.3 | % | | | 537,019 | | | | 33.6 | % |
| | | | | | | | | | | | | | | | | | | | | | | | | | | | | | | | | |
| Total deductions | | | 517,420 | | | | | | | | 469,872 | | | | | | | | 1,500,773 | | | | | | | | 1,399,084 | | | | | |
| Statutory underwriting gain | | | 25,009 | | | | | | | | 37,518 | | | | | | | | 96,046 | | | | | | | | 74,738 | | | | | |
| | | | | | | | | | | | | | | | | | | | | | | | | | | | | | | | | |
| Net loss from premium balances charged off | | | (734 | ) | | | | | | | (833 | ) | | | | | | | (2,058 | ) | | | | | | | (2,146 | ) | | | | |
| Finance charges and other income | | | 2,228 | | | | | | | | 772 | | | | | | | | 7,092 | | | | | | | | 5,688 | | | | | |
| Total other income | | | 1,494 | | | | -0.3 | % | | | (61 | ) | | | 0.1 | % | | | 5,034 | | | | -0.3 | % | | | 3,542 | | | | -0.2 | % |
| Policyholders' dividends incurred | | | (541 | ) | | | 0.1 | % | | | (1,921 | ) | | | 0.4 | % | | | (3,812 | ) | | | 0.2 | % | | | (5,290 | ) | | | 0.4 | % |
| Total underwriting gain | | | 25,962 | | | | 92.9 | % | | | 35,536 | | | | 90.5 | % | | | 97,268 | | | | 91.2 | % | | | 72,990 | | | | 92.3 | % |
| | | | | | | | | | | | | | | | | | | | | | | | | | | | | | | | | |
| INVESTMENT | | | | | | | | | | | | | | | | | | | | | | | | | | | | | | | | |
| Net investment income earned | | | 32,398 | | | | | | | | 31,821 | | | | | | | | 93,920 | | | | | | | | 91,103 | | | | | |
| Net realized gain | | | 3,689 | | | | | | | | 309 | | | | | | | | 2,747 | | | | | | | | 15,770 | | | | | |
| Total income before income tax | | | 62,049 | | | | | | | | 67,666 | | | | | | | | 193,935 | | | | | | | | 179,863 | | | | | |
| | | | | | | | | | | | | | | | | | | | | | | | | | | | | | | | | |
| Federal income tax expense | | | 8,778 | | | | | | | | 17,938 | | | | | | | | 47,283 | | | | | | | | 37,729 | | | | | |
| | | | | | | | | | | | | | | | | | | | | | | | | | | | | | | | | |
| Net income | | $ | 53,271 | | | | | | | | 49,728 | | | | | | | | 146,652 | | | | | | | | 142,134 | | | | | |
| | | | | | | | | | | | | | | | | | | | | | | | | | | | | | | | | |
| Policyholders' Surplus | | | | | | | | | | | | | | | | | | | | | | | | | | | | | | | | |
| Surplus, beginning of period | | $ | 1,506,535 | | | | | | | | 1,344,630 | | | | | | | | 1,426,320 | | | | | | | | 1,307,842 | | | | | |
| | | | | | | | | | | | | | | | | | | | | | | | | | | | | | | | | |
| Net income | | | 53,271 | | | | | | | | 49,728 | | | | | | | | 146,652 | | | | | | | | 142,134 | | | | | |
| Change in deferred taxes | | | (10,503 | ) | | | | | | | 752 | | | | | | | | (9,002 | ) | | | | | | | (11,401 | ) | | | | |
| Change in net unrealized capital (losses) / gains | | | (1,078 | ) | | | | | | | (6,554 | ) | | | | | | | 7,159 | | | | | | | | (20,101 | ) | | | | |
| Dividends to stockholders | | | (15,254 | ) | | | | | | | (14,438 | ) | | | | | | | (45,761 | ) | | | | | | | (43,314 | ) | | | | |
| Change in non-admitted assets | | | 16,729 | | | | | | | | (8,390 | ) | | | | | | | 21,471 | | | | | | | | (12,661 | ) | | | | |
| Change in Overfunded Contra Asset | | | (28,408 | ) | | | | | | | (281 | ) | | | | | | | (52,108 | ) | | | | | | | (842 | ) | | | | |
| Qual Pen Trans Liab | | | 29,908 | | | | | | | | 1,845 | | | | | | | | 56,425 | | | | | | | | 5,534 | | | | | |
| Excess Plan Trans Liab | | | 22 | | | | | | | | 44 | | | | | | | | 60 | | | | | | | | 130 | | | | | |
| PRL Plan Trans Liab | | | 5 | | | | | | | | 7 | | | | | | | | 11 | | | | | | | | 22 | | | | | |
| | | | | | | | | | | | | | | | | | | | | | | | | | | | | | | | | |
| Net change in surplus for period | | | 44,692 | | | | | | | | 22,713 | | | | | | | | 124,907 | | | | | | | | 59,501 | | | | | |
| | | | | | | | | | | | | | | | | | | | | | | | | | | | | | | | | |
| Surplus, end of period | | $ | 1,551,227 | | | | | | | | 1,367,343 | | | | | | | | 1,551,227 | | | | | | | | 1,367,343 | | | | | |
| | | | | | | | | | | | | | | | | | | | | | | | | | | | | | | | | |
| Statutory underwriting gain | | $ | 25,962 | | | | | | | | 35,536 | | | | | | | | 97,268 | | | | | | | | 72,990 | | | | | |
| | | | | | | | | | | | | | | | | | | | | | | | | | | | | | | | | |
| Adjustments under GAAP: | | | | | | | | | | | | | | | | | | | | | | | | | | | | | | | | |
| Deferred policy acquisition costs | | | 7,380 | | | | | | | | 10,442 | | | | | | | | 22,775 | | | | | | | | 28,058 | | | | | |
| Other, net | | | (1,309 | ) | | | | | | | (1,147 | ) | | | | | | | (3,278 | ) | | | | | | | (1,072 | ) | | | | |
| GAAP underwriting gain | | $ | 32,033 | | | | | | | | 44,831 | | | | | | | | 116,765 | | | | | | | | 99,976 | | | | | |
| | | | | | | | | | | | | | | | | | | | | | | | | | | | | | | | | |
| | | | | | | | | | | | | | | | | | | | | | | | | | | | | | | | | |
Note: Some amounts or ratios may not foot due to rounding
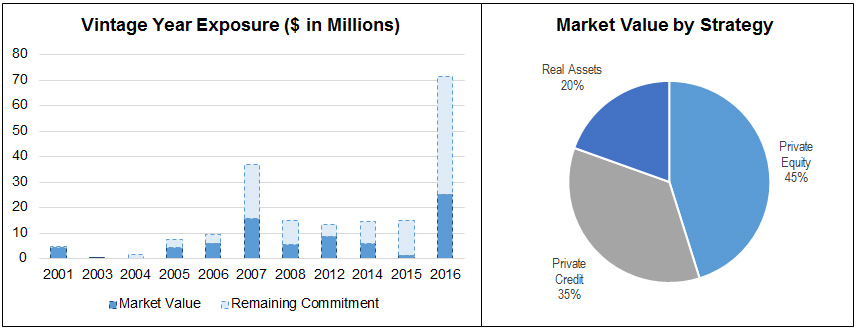
| Selective Insurance Group, Inc. and Consolidated Subsidiaries |
| Alternative Investments |
| September 30, 2016 |
| (unaudited) |
| | | | | |
| | Number | Original | Remaining | Current |
| Strategy | of Funds | Commitment | Commitment | Market Value |
| Private Equity | 15 | 150,456,790 | 57,793,283 | 35,443,848 |
| Private Credit | 8 | 92,000,000 | 30,762,618 | 27,708,889 |
| Real Assets | 7 | 100,000,000 | 22,922,421 | 15,329,396 |
| TOTAL - ALTERNATIVE INVESTMENTS | 30 | 342,456,790 | 111,478,322 | 78,482,133 |
 |
| | | | | |
| Exhibit may not foot due to rounding | | | | |