Exhibit 99.2
| 
Supplemental Investor Package ________________________________________________ First Quarter 2017 Investor Contact: Rohan Pai Senior Vice President, Investor Relations and Treasurer Tel: 973-948-1364 Rohan.Pai @selective.com |
Selective Insurance Group, Inc. & Consolidated Subsidiaries
Selected Balance Sheet Data
(unaudited)
| | | March 31, | | March 31, | | December 31, |
| ($ in thousands, except per share amounts) | | 2017 | | 2016 | | 2016 |
| | | | | | | Unrecognized/ | | | | | | Unrecognized/ | | | | | | Unrecognized/ |
| | | Balance | | Market | | Unrealized | | Balance | | Market | | Unrealized | | Balance | | Market | | Unrealized |
| | | Sheet | | Value | | Gain | | Sheet | | Value | | Gain | | Sheet | | Value | | Gain |
| Invested Assets: | | | | | | | | | | | | | | | | | | | | | | | | | | | | | | | | | | | | |
| Corporate bonds1 | | $ | 3,480,965 | | | | 3,482,488 | | | | 34,897 | | | | 3,073,489 | | | | 3,076,144 | | | | 53,348 | | | $ | 3,332,522 | | | | 3,334,044 | | | | 24,339 | |
| Government and Municipal bonds | | | 1,470,876 | | | | 1,472,856 | | | | 30,350 | | | | 1,690,552 | | | | 1,695,583 | | | | 70,315 | | | | 1,561,574 | | | | 1,563,707 | | | | 18,255 | |
| Total fixed income securities | | | 4,951,841 | | | | 4,955,344 | | | | 65,247 | | | | 4,764,041 | | | | 4,771,727 | | | | 123,663 | | | | 4,894,096 | | | | 4,897,751 | | | | 42,594 | |
| Equities | | | 154,918 | | | | 154,918 | | | | 30,304 | | | | 215,789 | | | | 215,789 | | | | 21,611 | | | | 146,753 | | | | 146,753 | | | | 25,864 | |
| Short-term investments | | | 247,207 | | | | 247,207 | | | | - | | | | 103,132 | | | | 103,132 | | | | - | | | | 221,701 | | | | 221,701 | | | | - | |
| Other investments | | | 106,796 | | | | 106,796 | | | | - | | | | 80,916 | | | | 80,916 | | | | - | | | | 102,397 | | | | 102,397 | | | | - | |
| Total invested assets | | $ | 5,460,762 | | | | 5,464,265 | | | | 95,551 | | | | 5,163,878 | | | | 5,171,564 | | | | 145,274 | | | $ | 5,364,947 | | | | 5,368,602 | | | | 68,458 | |
| | | | | | | | | | | | | | | | | | | | | | | | | | | | | | | | | | | | | |
| | | | | | | | | | | | | | | | | | | | | | | | | | | | | | | | | | | | | |
| Invested assets per $ of stockholders' equity | | | 3.43 | | | | | | | | | | | | 3.50 | | | | | | | | | | | | 3.50 | | | | | | | | | |
| | | | | | | | | | | | | | | | | | | | | | | | | | | | | | | | | | | | | |
| Total assets | | | 7,404,096 | | | | | | | | | | | | 7,022,492 | | | | | | | | | | | | 7,355,848 | | | | | | | | | |
| | | | | | | | | | | | | | | | | | | | | | | | | | | | | | | | | | | | | |
| Liabilities: | | | | | | | | | | | | | | | | | | | | | | | | | | | | | | | | | | | | |
| Reserve for losses and loss expenses | | | 3,679,471 | | | | | | | | | | | | 3,575,496 | | | | | | | | | | | | 3,691,719 | | | | | | | | | |
| Unearned premium reserve | | | 1,299,823 | | | | | | | | | | | | 1,209,377 | | | | | | | | | | | | 1,262,819 | | | | | | | | | |
| | | | | | | | | | | | | | | | | | | | | | | | | | | | | | | | | | | | | |
| Total liabilities | | | 5,811,517 | | | | | | | | | | | | 5,546,527 | | | | | | | | | | | | 5,824,478 | | | | | | | | | |
| | | | | | | | | | | | | | | | | | | | | | | | | | | | | | | | | | | | | |
| Stockholders' equity | | | 1,592,579 | | | | | | | | | | | | 1,475,965 | | | | | | | | | | | | 1,531,370 | | | | | | | | | |
| | | | | | | | | | | | | | | | | | | | | | | | | | | | | | | | | | | | | |
| Total debt-to-capitalization ratio | | | 21.6 | % | | | | | | | | | | | 20.8 | % | | | | | | | | | | | 22.3 | % | | | | | | | | |
| | | | | | | | | | | | | | | | | | | | | | | | | | | | | | | | | | | | | |
| Book value per share | | | 27.34 | | | | | | | | | | | | 25.61 | | | | | | | | | | | | 26.42 | | | | | | | | | |
| | | | | | | | | | | | | | | | | | | | | | | | | | | | | | | | | | | | | |
| Book value per share excluding | | | | | | | | | | | | | | | | | | | | | | | | | | | | | | | | | | | | |
| unrealized gain or loss on bond portfolio | | | 26.65 | | | | | | | | | | | | 24.30 | | | | | | | | | | | | 25.98 | | | | | | | | | |
| | | | | | | | | | | | | | | | | | | | | | | | | | | | | | | | | | | | | |
| NPW per insurance segment employee | | | 1,043 | | | | | | | | | | | | 999 | | | | | | | | | | | | 1,028 | | | | | | | | | |
| | | | | | | | | | | | | | | | | | | | | | | | | | | | | | | | | | | | | |
| Statutory premiums to surplus ratio | | | 1.4 | x | | | | | | | | | | | 1.4 | x | | | | | | | | | | | 1.4 | x | | | | | | | | |
| | | | | | | | | | | | | | | | | | | | | | | | | | | | | | | | | | | | | |
| Statutory surplus | | | 1,622,268 | | | | | | | | | | | | 1,461,326 | | | | | | | | | | | | 1,583,781 | | | | | | | | | |
1Includes mortgage-backed and asset-backed securities.
Selective Insurance Group, Inc. & Consolidated Subsidiaries
Selected Income Statement Data
(unaudited)
| | | | Quarter Ended March 31, |
| ($ in thousands, except per share amounts) | | 2017 | | 2016 |
| | | | | | Per diluted share | | | | Per diluted share |
| Consolidated | | | | | | | | |
| Revenue | | $ | 600,469 | | | | | | | $ | 551,474 | | | | | |
| Net income | | | 50,440 | | | | 0.85 | | | | 37,032 | | | | 0.63 | |
| Exclude: Net realized losses | | | 1,045 | | | | 0.02 | | | | 2,704 | | | | 0.05 | |
| Exclude: Tax on net realized losses | | | (366 | ) | | | (0.01 | ) | | | (946 | ) | | | (0.02 | ) |
| Operating income | | | 51,119 | | | | 0.86 | | | | 38,790 | | | | 0.66 | |
| | | | | | | | | | | | | | | | | | |
| Total Insurance Operations | | | | | | | | | | | | | | | | |
| Gross premiums written | | $ | 689,511 | | | | | | | | 652,598 | | | | | |
| Net premiums written | | | 598,704 | | | | | | | | 565,359 | | | | | |
| Net premiums earned | | | 560,854 | | | | | | | | 522,458 | | | | | |
| Underwriting gain | - before tax | | | 49,222 | | | | | | | | 40,955 | | | | | |
| | - after tax | | | 31,994 | | | | 0.54 | | | | 26,621 | | | | 0.46 | |
| GAAP combined ratio | | | 91.2 | % | | | | | | | 92.2 | % | | | | |
| | | | | | | | | | | | | | | | | | |
| Standard Commercial Lines | | | | | | | | | | | | | | | | |
| Net premiums earned | | $ | 438,414 | | | | | | | | 402,889 | | | | | |
| GAAP combined ratio | | | 90.3 | % | | | | | | | 92.3 | % | | | | |
| | | | | | | | | | | | | | | | | | |
| Standard Personal Lines | | | | | | | | | | | | | | | | |
| Net premiums earned | | $ | 71,201 | | | | | | | | 70,205 | | | | | |
| GAAP combined ratio | | | 92.8 | % | | | | | | | 87.7 | % | | | | |
| | | | | | | | | | | | | | | | | | |
| Excess and Surplus Lines | | | | | | | | | | | | | | | | |
| Net premiums earned | | $ | 51,239 | | | | | | | | 49,364 | | | | | |
| GAAP combined ratio | | | 96.9 | % | | | | | | | 97.1 | % | | | | |
| | | | | | | | | | | | | | | | | | |
| Investments | | | | | | | | | | | | | | | | |
| Net investment income | - before tax | | $ | 37,419 | | | | | | | | 30,769 | | | | | |
| | - after tax | | | 27,451 | | | | 0.46 | | | | 23,560 | | | | 0.40 | |
| Effective tax rate | | | 26.6 | % | | | | | | | 23.4 | % | | | | |
| Annual after-tax yield on investment portfolio | | | 2.0 | % | | | | | | | 1.8 | % | | | | |
| Annual after-tax, after-interest expense yield | | | 1.7 | % | | | | | | | 1.6 | % | | | | |
| Invested assets per $ of stockholders' equity | | | 3.43 | | | | | | | | 3.50 | | | | | |
| | | | | | | | | | | | | | | | | | |
| Other expenses (net of other income) | | | | | | | | | | | | | | | | |
| Interest expense | - before tax | | $ | (6,106 | ) | | | | | | | (5,606 | ) | | | | |
| | - after tax | | | (3,969 | ) | | | (0.07 | ) | | | (3,644 | ) | | | (0.06 | ) |
| | | | | | | | | | | | | | | | | | |
| Other expense - after tax | | | | (4,357 | ) | | | (0.07 | ) | | $ | (7,747 | ) | | | (0.14 | ) |
| | | | | | | | | | | | | | | | | | |
| Diluted weighted avg shares outstanding | | | 59,148 | | | | | | | | 58,507 | | | | | |
Selective Insurance Group, Inc. & Consolidated Subsidiaries
GAAP Insurance Operations Results
(unaudited)
| ($ in thousands) | | Quarter Ended March 31, 2017 | | Quarter Ended March 31, 2016 |
| | | | | | | | | | | | | | | | | |
| | | Standard
Commercial
Lines | | Standard
Personal
Lines | | Excess &
Surplus
Lines | | Grand Total | | Standard
Commercial
Lines | | Standard
Personal
Lines | | Excess &
Surplus
Lines | | Grand Total |
| Net Premiums Written | | $ | 483,548 | | | | 64,696 | | | | 50,460 | | | | 598,704 | | | $ | 455,063 | | | | 61,969 | | | | 48,327 | | | | 565,359 | |
| Net Premiums Earned | | | 438,414 | | | | 71,201 | | | | 51,239 | | | | 560,854 | | | | 402,889 | | | | 70,205 | | | | 49,364 | | | | 522,458 | |
| Losses and Loss Expenses Incurred | | | 241,564 | | | | 44,290 | | | | 31,618 | | | | 317,472 | | | | 223,350 | | | | 39,695 | | | | 34,099 | | | | 297,144 | |
| Net Underwriting Expenses Incurred | | | 154,401 | | | | 21,805 | | | | 18,051 | | | | 194,257 | | | | 146,954 | | | | 21,905 | | | | 13,847 | | | | 182,706 | |
| Dividends to Policyholders | | | (97 | ) | | | - | | | | - | | | | (97 | ) | | | 1,653 | | | | - | | | | - | | | | 1,653 | |
| GAAP Underwriting Gain | | $ | 42,546 | | | | 5,106 | | | | 1,570 | | | | 49,222 | | | $ | 30,932 | | | | 8,605 | | | | 1,418 | | | | 40,955 | |
| | | | | | | | | | | | | | | | | | | | | | | | | | | | | | | | | |
| GAAP Ratios | | | | | | | | | | | | | | | | | | | | | | | | | | | | | | | | |
| Loss and Loss Expense Ratio | | | 55.1 | % | | | 62.2 | % | | | 61.7 | % | | | 56.6 | % | | | 55.4 | % | | | 56.5 | % | | | 69.1 | % | | | 56.9 | % |
| Underwriting Expense Ratio | | | 35.2 | % | | | 30.6 | % | | | 35.2 | % | | | 34.6 | % | | | 36.5 | % | | | 31.2 | % | | | 28.0 | % | | | 35.0 | % |
| Dividends to Policyholders Ratio | | | 0.0 | % | | | 0.0 | % | | | 0.0 | % | | | 0.0 | % | | | 0.4 | % | | | 0.0 | % | | | 0.0 | % | | | 0.3 | % |
| Combined Ratio | | | 90.3 | % | | | 92.8 | % | | | 96.9 | % | | | 91.2 | % | | | 92.3 | % | | | 87.7 | % | | | 97.1 | % | | | 92.2 | % |
| | | | | | | | | | | | | | | | | | | | | | | | | | | | | | | | | |
Selective Insurance Group, Inc. and Consolidated Subsidiaries
GAAP Investment Income
March 2017 (unaudited)
| | | Quarter Ended | | % |
| | | March | | March | | Increase |
| ($ in thousands, except per share data) | | 2017 | | 2016 | | (Decrease) |
| Investment Income: | | | | | | |
| Interest: | | | | | | |
| Fixed Income Securities | | $ | 36,891 | | | | 31,644 | | | | 17 | |
| Short-term | | | 250 | | | | 159 | | | | 57 | |
| Other Investments | | | 1,603 | | | | (1,066 | ) | | | 250 | |
| Dividends | | | 1,468 | | | | 2,230 | | | | (34 | ) |
| | | | 40,212 | | | | 32,967 | | | | 22 | |
| | | | | | | | | | | | | |
| Investment Expense | | | 2,793 | | | | 2,198 | | | | 27 | |
| | | | | | | | | | | | | |
| Net Investment Income Before Tax | | | 37,419 | | | | 30,769 | | | | 22 | |
| | | | | | | | | | | | | |
| Tax | | | 9,968 | | | | 7,209 | | | | 38 | |
| | | | | | | | | | | | | |
| Net Investment Income After Tax | | $ | 27,451 | | | | 23,560 | | | | 17 | |
| | | | | | | | | | | | | |
| Net Investment Income per Share | | $ | 0.46 | | | | 0.40 | | | | 15 | |
| | | | | | | | | | | | | |
| | | | | | | | | | | | | |
| Effective Tax Rate | | | 26.6 | % | | | 23.4 | % | | | | |
| | | | | | | | | | | | | |
| Average Yields: | | | | | | | | | | | | |
| | | | | | | | | | | | | |
| Fixed Income Securities: | | | | | | | | | | | | |
| Pre Tax | | | 3.00 | % | | | 2.70 | % | | | | |
| After Tax | | | 2.18 | % | | | 2.02 | % | | | | |
| | | | | | | | | | | | | |
| Portfolio: | | | | | | | | | | | | |
| Pre Tax | | | 2.77 | % | | | 2.40 | % | | | | |
| After Tax | | | 2.03 | % | | | 1.84 | % | | | | |
| | | | | | | | | | | | | |
| | | | | | | | | | | | | |
| | | | Quarter Ended | | | | | |
| | | | March | | | | March | | | | | |
| Net Realized Losses | | | 2017 | | | | 2016 | | | | | |
| Fixed Income Securities | | | (196 | ) | | | (390 | ) | | | | |
| Equity Securities | | | (1,314 | ) | | | (2,310 | ) | | | | |
| Other Investments | | | 465 | | | | (4 | ) | | | | |
| | | | | | | | | | | | | |
| Total | | | (1,045 | ) | | | (2,704 | ) | | | | |
| Net of Tax | | | (679 | ) | | | (1,758 | ) | | | | |
Year-to-date as of March 31, 2017, new money rates for fixed income securities were 3.1% on a pre-tax basis and 2.1% on an after-tax basis.
Selective Insurance Group, Inc.
Combined Insurance Company Subsidiaries
2017 Statutory Results by Line of Business
Quarter Ended March 2017 (unaudited)
| | | Net | | | | Net | | | | | | | | Underwriting | | Dividends to | | Combined | | Combined | | |
| | | Premiums | | Percent | | Premiums | | Percent | | Loss | | LAE | | Expense | | Policyholders | | Ratio | | Ratio | | Underwriting |
| ($ in thousands) | | Written | | Change | | Earned | | Change | | Ratio | | Ratio | | Ratio | | Ratio | | 2017 | | 2016 | | Gain/(Loss) |
| Standard Personal Lines: | | | | | | | | | | | | | | | | | | | | | | | | | | | | | | | | | | | | | | | | | | | | |
| | | | | | | | | | | | | | | | | | | | | | | | | | | | | | | | | | | | | | | | | | | | | |
| Homeowners | | $ | 26,535 | | | | (0.1 | )% | | $ | 32,700 | | | | (0.6 | )% | | | 38.8 | % | | | 8.5 | % | | | 39.2 | % | | | 0.0 | % | | | 86.5 | % | | | 86.5 | % | | $ | 6,830 | |
| Auto | | | 36,719 | | | | 7.9 | % | | | 36,950 | | | | 3.3 | % | | | 65.9 | % | | | 10.9 | % | | | 33.4 | % | | | 0.0 | % | | | 110.1 | % | | | 104.9 | % | | | (3,673 | ) |
| Other (including flood) | | | 1,441 | | | | 5.1 | % | | | 1,551 | | | | 1.7 | % | | | 54.9 | % | | | (24.6 | )% | | | (151.2 | )% | | | 0.0 | % | | | (120.9 | )% | | | (142.0 | )% | | | 3,260 | |
| Total | | $ | 64,696 | | | | 4.4 | % | | $ | 71,201 | | | | 1.4 | % | | | 53.2 | % | | | 9.0 | % | | | 31.7 | % | | | 0.0 | % | | | 93.9 | % | | | 90.6 | % | | $ | 6,418 | |
| | | | | | | | | | | | | | | | | | | | | | | | | | | | | | | | | | | | | | | | | | | | | |
| Standard Commercial Lines: | | | | | | | | | | | | | | | | | | | | | | | | | | | | | | | | | | | | | | | | | | | | |
| | | | | | | | | | | | | | | | | | | | | | | | | | | | | | | | | | | | | | | | | | | | | |
| Commercial property | | $ | 80,503 | | | | 6.4 | % | | $ | 76,391 | | | | 8.9 | % | | | 43.3 | % | | | 5.2 | % | | | 37.6 | % | | | (0.4 | )% | | | 85.8 | % | | | 91.8 | % | | $ | 9,319 | |
| Workers compensation | | | 91,840 | | | | 0.6 | % | | | 79,326 | | | | 4.4 | % | | | 54.9 | % | | | 13.6 | % | | | 26.0 | % | | | 1.1 | % | | | 95.6 | % | | | 81.1 | % | | | 245 | |
| General liability | | | 155,137 | | | | 7.2 | % | | | 139,984 | | | | 9.3 | % | | | 31.9 | % | | | 7.5 | % | | | 34.1 | % | | | (0.2 | )% | | | 73.2 | % | | | 83.4 | % | | | 32,295 | |
| Auto | | | 117,387 | | | | 8.5 | % | | | 107,129 | | | | 12.3 | % | | | 63.7 | % | | | 10.4 | % | | | 32.0 | % | | | (0.3 | )% | | | 105.7 | % | | | 104.9 | % | | | (9,384 | ) |
| Businessowners' policies | | | 26,201 | | | | 5.7 | % | | | 24,845 | | | | 3.9 | % | | | 46.3 | % | | | 11.3 | % | | | 37.2 | % | | | 0.0 | % | | | 94.8 | % | | | 95.0 | % | | | 793 | |
| Bonds | | | 7,792 | | | | 31.5 | % | | | 6,498 | | | | 18.9 | % | | | 11.1 | % | | | 6.5 | % | | | 51.9 | % | | | 0.0 | % | | | 69.4 | % | | | 81.6 | % | | | 1,315 | |
| Other | | | 4,690 | | | | 4.8 | % | | | 4,241 | | | | 10.5 | % | | | (0.2 | )% | | | 0.3 | % | | | 54.8 | % | | | 0.0 | % | | | 55.1 | % | | | 53.8 | % | | | 1,660 | |
| Total | | $ | 483,548 | | | | 6.3 | % | | $ | 438,414 | | | | 8.8 | % | | | 46.0 | % | | | 9.1 | % | | | 33.2 | % | | | (0.0 | )% | | | 88.3 | % | | | 89.7 | % | | $ | 36,244 | |
| | | | | | | | | | | | | | | | | | | | | | | | | | | | | | | | | | | | | | | | | | | | | |
| E&S | | | 50,460 | | | | 4.4 | % | | | 51,239 | | | | 3.8 | % | | | 45.5 | % | | | 16.3 | % | | | 34.1 | % | | | 0.0 | % | | | 95.9 | % | | | 98.4 | % | | | 2,347 | |
| | | | | | | | | | | | | | | | | | | | | | | | | | | | | | | | | | | | | | | | | | | | | |
| Total Insurance Operations | | $ | 598,704 | | | | 5.9 | % | | $ | 560,854 | | | | 7.3 | % | | | 46.9 | % | | | 9.7 | % | | | 33.1 | % | | | (0.0 | )% | | | 89.7 | % | | | 90.7 | % | | $ | 45,009 | |
| | | | | | | | | | | | | | | | | | | | | | | | | | | | | | | | | | | | | | | | | | | | | |
| Note: Some amounts may not foot due to rounding. |
| | | | | | | | | | | | | | | | | | | | | | | | | | | | | | | | | | | | | | | | | | | | | |
| | | | | | | | 2017 | | | | 2016 | | | | | | | | | | | | | | | | | | | | | | | | | | | | | | | | | |
| | | | Losses Paid | | | | 241,979 | | | | 210,673 | | | | | | | | | | | | | | | | | | | | | | | | | | | | | | | | | |
| | | | LAE Paid | | | | 48,513 | | | | 46,124 | | | | | | | | | | | | | | | | | | | | | | | | | | | | | | | | | |
| | | | Total Paid | | | $ | 290,492 | | | $ | 256,797 | | | | | | | | | | | | | | | | | | | | | | | | | | | | | | | | | |
| | | | | | | | | | | | | | | | | | | | | | | | | | | | | | | | | | | | | | | | | | | | | |
Selective Insurance Group, Inc.
Combined Insurance Company Subsidiaries
2017 Net Catastrophe Losses and Prior Year Casualty Reserve Development
Statutory Results by Line of Business
(unaudited)
| | | Quarter Ended |
| Net Catastrophe Losses Incurred | | March 31, 2017 | | March 31, 2016 |
| ($ in thousands) | | Losses and Loss
Expenses Incurred | | Impact on Losses and
Loss Expense Ratio | | Losses and Loss
Expenses Incurred | | Impact on Losses and
Loss Expense Ratio |
| | | | | | | | | |
| Standard Personal Lines | | $ | 3,909 | | | | 5.5 | % | | $ | 2,225 | | | | 3.2 | % |
| | | | | | | | | | | | | | | | | |
| Standard Commercial Lines | | | 6,899 | | | | 1.6 | % | | | 11,649 | | | | 2.9 | % |
| | | | | | | | | | | | | | | | | |
| E&S | | | 1,403 | | | | 2.7 | % | | | 495 | | | | 1.0 | % |
| | | | | | | | | | | | | | | | | |
| Total Insurance Operations | | $ | 12,212 | | | | 2.2 | % | | $ | 14,369 | | | | 2.8 | % |
| | | | | | | | | | | | | | | | | |
| | | | | | | | | | | | | | | | | |
| | | | | | | | | | | | | | | | | |
| | | | | | | | | | | | | | | | | |
| | | | | | | | | | | | | | | | | |
| | | | | | | | | | | | | | | | | |
| Prior Year Casualty Reserve Development | | Quarter Ended |
| (Favorable) / Unfavorable | | March 31, 2017 | | March 31, 2016 |
| ($ in thousands) | | Losses and Loss
Expenses Incurred | | Impact on Losses and
Loss Expense Ratio | | Losses and Loss
Expenses Incurred | | Impact on Losses and
Loss Expense Ratio |
| | | | | | | | | |
| Standard Personal Lines | | $ | 2,000 | | | | 2.8 | % | | $ | - | | | | 0.0 | % |
| | | | | | | | | | | | | | | | | |
| Standard Commercial Lines | | | (16,400 | ) | | | (3.7 | )% | | | (18,000 | ) | | | (4.5 | )% |
| | | | | | | | | | | | | | | | | |
| E&S | | | - | | | | 0.0 | % | | | 1,000 | | | | 2.0 | % |
| | | | | | | | | | | | | | | | | |
| Total Insurance Operations | | $ | (14,400 | ) | | | (2.6 | )% | | $ | (17,000 | ) | | | (3.3 | )% |
Note: Some amounts may not foot due to rounding.
Selective Insurance Group, Inc. & Consolidated Subsidiaries | | | | |
| Consolidated Balance Sheets | | Unaudited | | |
| | | | | |
| | | March 31, | | December 31, |
| ($ in thousands, except share amounts) | | 2017 | | 2016 |
| ASSETS | | | | | | | | |
| Investments: | | | | | | | | |
Fixed income securities, held-to-maturity – at carrying value
(fair value: $88,339 – 2017; $105,211 – 2016) | | $ | 84,836 | | | | 101,556 | |
Fixed income securities, available-for-sale – at fair value
(amortized cost: $4,805,368 – 2017; $4,753,759 – 2016) | | | 4,867,005 | | | | 4,792,540 | |
Equity securities, available-for-sale – at fair value
(cost: $124,614 – 2017; $120,889 – 2016) | | | 154,918 | | | | 146,753 | |
| Short-term investments (at cost which approximates fair value) | | | 247,207 | | | | 221,701 | |
| Other investments | | | 106,796 | | | | 102,397 | |
| Total investments | | | 5,460,762 | | | | 5,364,947 | |
| Cash | | | 483 | | | | 458 | |
| Interest and dividends due or accrued | | | 40,239 | | | | 40,164 | |
Premiums receivable, net of allowance for uncollectible
accounts of: $6,613 – 2017; $5,980 – 2016 | | | 707,677 | | | | 681,611 | |
Reinsurance recoverable, net of allowance for uncollectible
accounts of: $5,000 – 2017; $5,500 – 2016 | | | 580,386 | | | | 621,537 | |
| Prepaid reinsurance premiums | | | 145,436 | | | | 146,282 | |
| Current federal income tax | | | — | | | | 2,486 | |
| Deferred federal income tax | | | 72,218 | | | | 84,840 | |
Property and equipment – at cost, net of accumulated
depreciation and amortization of: $202,917 – 2017; $198,729 – 2016 | | | 68,503 | | | | 69,576 | |
| Deferred policy acquisition costs | | | 227,622 | | | | 222,564 | |
| Goodwill | | | 7,849 | | | | 7,849 | |
| Other assets | | | 92,921 | | | | 113,534 | |
| Total assets | | $ | 7,404,096 | | | | 7,355,848 | |
| | | | | | | | | |
| LIABILITIES AND STOCKHOLDERS’ EQUITY | | | | | | | | |
| Liabilities: | | | | | | | | |
| Reserve for losses and loss expenses | | $ | 3,679,471 | | | | 3,691,719 | |
| Unearned premiums | | | 1,299,823 | | | | 1,262,819 | |
| Long-term debt | | | 438,782 | | | | 438,667 | |
| Current federal income tax | | | 11,552 | | | | — | |
| Accrued salaries and benefits | | | 96,322 | | | | 132,880 | |
| Other liabilities | | | 285,567 | | | | 298,393 | |
| Total liabilities | | $ | 5,811,517 | | | | 5,824,478 | |
| | | | | | | | | |
| Stockholders’ Equity: | | | | | | | | |
| Preferred stock of $0 par value per share: | | $ | — | | | | — | |
| Authorized shares 5,000,000; no shares issued or outstanding | | | | | | | | |
| Common stock of $2 par value per share: | | | | | | | | |
| Authorized shares 360,000,000 | | | | | | | | |
| Issued: 102,028,447 – 2017; 101,620,436 – 2016 | | | 204,057 | | | | 203,241 | |
| Additional paid-in capital | | | 354,239 | | | | 347,295 | |
| Retained earnings | | | 1,609,862 | | | | 1,568,881 | |
| Accumulated other comprehensive income (loss) | | | 2,090 | | | | (15,950 | ) |
Treasury stock – at cost
(shares: 43,780,884 – 2017; 43,653,237 – 2016) | | | (577,669 | ) | | | (572,097 | ) |
| Total stockholders’ equity | | $ | 1,592,579 | | | | 1,531,370 | |
| Commitments and contingencies | | | | | | | | |
| Total liabilities and stockholders’ equity | | $ | 7,404,096 | | | | 7,355,848 | |
| Selective Insurance Group, Inc. & Consolidated Subsidiaries | | |
| Unaudited Consolidated Statements of Income | | |
| | | Quarter Ended March 31, |
| ($ in thousands, except per share amounts) | | 2017 | | 2016 |
| Revenues: | | | | |
| Net premiums earned | | $ | 560,854 | | | | 522,458 | |
| Net investment income earned | | | 37,419 | | | | 30,769 | |
| Net realized losses: | | | | | | | | |
| Net realized investment gains | | | 2,430 | | | | 889 | |
| Other-than-temporary impairments | | | (3,475 | ) | | | (3,593 | ) |
| Total net realized losses | | | (1,045 | ) | | | (2,704 | ) |
| Other income | | | 3,241 | | | | 951 | |
| Total revenues | | | 600,469 | | | | 551,474 | |
| | | | | | | | | |
| Expenses: | | | | | | | | |
| Losses and loss expenses incurred | | | 317,472 | | | | 297,144 | |
| Policy acquisition costs | | | 196,228 | | | | 183,227 | |
| Interest expense | | | 6,106 | | | | 5,606 | |
| Other expenses | | | 13,089 | | | | 13,622 | |
| Total expenses | | | 532,895 | | | | 499,599 | |
| | | | | | | | | |
| Income before federal income tax | | | 67,574 | | | | 51,875 | |
| | | | | | | | | |
| Federal income tax expense: | | | | | | | | |
| Current | | | 14,273 | | | | 14,084 | |
| Deferred | | | 2,861 | | | | 759 | |
| Total federal income tax expense | | | 17,134 | | | | 14,843 | |
| | | | | | | | | |
| Net income | | $ | 50,440 | | | | 37,032 | |
| | | | | | | | | |
| Earnings per share: | | | | | | | | |
| Basic net income | | $ | 0.87 | | | | 0.64 | |
| | | | | | | | | |
| Diluted net income | | $ | 0.85 | | | | 0.63 | |
| | | | | | | | | |
| Dividends to stockholders | | $ | 0.16 | | | | 0.15 | |
| Selective Insurance Group, Inc. & Consolidated Subsidiaries | | |
| Unaudited Consolidated Statements of Comprehensive Income | | |
| | | Quarter Ended March 31, |
| ($ in thousands) | | 2017 | | 2016 |
| Net income | | $ | 50,440 | | | | 37,032 | |
| | | | | | | | | |
| Other comprehensive income, net of tax: | | | | | | | | |
| Unrealized gains on investment securities: | | | | | | | | |
| Unrealized holding gains arising during period | | | 16,761 | | | | 42,729 | |
| Amounts reclassified into net income: | | | | | | | | |
| Held-to-maturity securities | | | (32 | ) | | | (47 | ) |
| Realized losses on available-for-sale securities | | | 981 | | | | 1,754 | |
| Total unrealized gains on investment securities | | | 17,710 | | | | 44,436 | |
| | | | | | | | | |
| Defined benefit pension and post-retirement plans: | | | | | | | | |
| Amounts reclassified into net income: | | | | | | | | |
| Net actuarial loss | | | 330 | | | | 986 | |
| Total defined benefit pension and post-retirement plans | | | 330 | | | | 986 | |
| Other comprehensive income | | | 18,040 | | | | 45,422 | |
| Comprehensive income | | $ | 68,480 | | | | 82,454 | |
| Selective Insurance Group, Inc. & Consolidated Subsidiaries | | |
| Unaudited Consolidated Statements of Stockholders’ Equity | | |
| | | Quarter Ended March 31, |
| ($ in thousands) | | 2017 | | 2016 |
| Common stock: | | | | | | | | |
| Beginning of year | | $ | 203,241 | | | | 201,723 | |
Dividend reinvestment plan
(shares: 8,249 – 2017; 10,931 – 2016) | | | 16 | | | | 22 | |
Stock purchase and compensation plans
(shares: 399,762 – 2017; 386,567 – 2016) | | | 800 | | | | 773 | |
| End of period | | | 204,057 | | | | 202,518 | |
| | | | | | | | | |
| Additional paid-in capital: | | | | | | | | |
| Beginning of year | | | 347,295 | | | | 326,656 | |
| Dividend reinvestment plan | | | 348 | | | | 351 | |
| Stock purchase and compensation plans | | | 6,596 | | | | 6,958 | |
| End of period | | | 354,239 | | | | 333,965 | |
| | | | | | | | | |
| Retained earnings: | | | | | | | | |
| Beginning of year | | | 1,568,881 | | | | 1,446,192 | |
| Net income | | | 50,440 | | | | 37,032 | |
Dividends to stockholders
($0.16 per share – 2017; $0.15 per share – 2016) | | | (9,459 | ) | | | (8,789 | ) |
| End of period | | | 1,609,862 | | | | 1,474,435 | |
| | | | | | | | | |
| Accumulated other comprehensive income: | | | | | | | | |
| Beginning of year | | | (15,950 | ) | | | (9,425 | ) |
| Other comprehensive income | | | 18,040 | | | | 45,422 | |
| End of period | | | 2,090 | | | | 35,997 | |
| | | | | | | | | |
| Treasury stock: | | | | | | | | |
| Beginning of year | | | (572,097 | ) | | | (567,105 | ) |
Acquisition of treasury stock
(shares: 127,647 – 2017; 122,250 – 2016) | | | (5,572 | ) | | | (3,845 | ) |
| End of period | | | (577,669 | ) | | | (570,950 | ) |
| Total stockholders’ equity | | $ | 1,592,579 | | | | 1,475,965 | |
| Selective Insurance Group, Inc. & Consolidated Subsidiaries | | | | |
| Unaudited Consolidated Statements of Cash Flows | | | | |
| | | Quarter Ended March 31, |
| ($ in thousands) | | 2017 | | 2016 |
| Operating Activities | | | | | | | | |
| | | | | | | | | |
| Net income | | $ | 50,440 | | | | 37,032 | |
| | | | | | | | | |
| Adjustments to reconcile net income to net cash provided by operating activities: | | | | | | | | |
| Depreciation and amortization | | | 12,882 | | | | 14,627 | |
| Stock-based compensation expense | | | 5,273 | | | | 4,377 | |
| Undistributed (gains) losses of equity method investments | | | (665 | ) | | | 1,066 | |
| Loss on disposal of fixed assets | | | 998 | | | | — | |
| Net realized losses | | | 1,045 | | | | 2,704 | |
| | | | | | | | | |
| Changes in assets and liabilities: | | | | | | | | |
| Increase in reserve for losses and loss expenses, net of reinsurance recoverable | | | 28,903 | | | | 42,390 | |
| Increase in unearned premiums, net of prepaid reinsurance | | | 37,850 | | | | 42,901 | |
| Decrease in net federal income taxes | | | 16,946 | | | | 5,296 | |
| Increase in premiums receivable | | | (26,066 | ) | | | (39,180 | ) |
| Increase in deferred policy acquisition costs | | | (5,058 | ) | | | (7,789 | ) |
| (Increase) decrease in interest and dividends due or accrued | | | (218 | ) | | | 528 | |
| Decrease in accrued salaries and benefits | | | (36,558 | ) | | | (27,115 | ) |
| Decrease (increase) in other assets | | | 15,998 | | | | (10,128 | ) |
| Decrease in other liabilities | | | (55,175 | ) | | | (52,902 | ) |
| Net cash provided by operating activities | | | 46,595 | | | | 13,807 | |
| | | | | | | | | |
| Investing Activities | | | | | | | | |
| Purchase of fixed income securities, available-for-sale | | | (724,880 | ) | | | (264,828 | ) |
| Purchase of equity securities, available-for-sale | | | (14,083 | ) | | | (7,574 | ) |
| Purchase of other investments | | | (11,211 | ) | | | (12,723 | ) |
| Purchase of short-term investments | | | (1,027,885 | ) | | | (303,228 | ) |
| Sale of fixed income securities, available-for-sale | | | 594,805 | | | | 12,905 | |
| Sale of short-term investments | | | 1,010,917 | | | | 394,915 | |
| Redemption and maturities of fixed income securities, held-to-maturity | | | 16,527 | | | | 37,400 | |
| Redemption and maturities of fixed income securities, available-for-sale | | | 116,357 | | | | 130,641 | |
| Sale of equity securities, available-for-sale | | | 5,503 | | | | 4,285 | |
| Distributions from other investments | | | 6,428 | | | | 7,994 | |
| Purchase of property and equipment | | | (4,937 | ) | | | (3,439 | ) |
| Net cash used in investing activities | | | (32,459 | ) | | | (3,652 | ) |
| | | | | | | | | |
| Financing Activities | | | | | | | | |
| Dividends to stockholders | | | (8,955 | ) | | | (8,270 | ) |
| Acquisition of treasury stock | | | (5,572 | ) | | | (3,845 | ) |
| Net proceeds from stock purchase and compensation plans | | | 1,563 | | | | 1,478 | |
| Proceeds from borrowings | | | 64,000 | | | | 25,000 | |
| Repayments of borrowings | | | (64,000 | ) | | | (25,000 | ) |
| Excess tax benefits from share-based payment arrangements | | | — | | | | 1,361 | |
| Repayments of capital lease obligations | | | (1,147 | ) | | | (1,094 | ) |
| Net cash used in financing activities | | | (14,111 | ) | | | (10,370 | ) |
| Net increase (decrease) in cash | | | 25 | | | | (215 | ) |
| Cash, beginning of year | | | 458 | | | | 898 | |
| Cash, end of period | | $ | 483 | | | | 683 | |
Selective Insurance Group, Inc.
Combined Insurance Company Subsidiaries
Statutory Balance Sheets
(unaudited)
| | | March 31, | | March 31, | | December 31, |
| ($ in thousands) | | 2017 | | 2016 | | 2016 |
| | | | | | | |
| ASSETS | | | | | | | | | | | | |
| Bonds | | $ | 4,824,921 | | | | 4,583,540 | | | | 4,780,269 | |
| Common stocks | | | 138,331 | | | | 202,619 | | | | 130,608 | |
| Preferred stocks | | | 16,107 | | | | 12,807 | | | | 15,871 | |
| Affiliated mortgage loan | | | 34,108 | | | | 34,957 | | | | 34,324 | |
| Other investments | | | 151,770 | | | | 130,365 | | | | 147,364 | |
| Short-term investments | | | 221,505 | | | | 81,011 | | | | 203,924 | |
| Total investments | | | 5,386,742 | | | | 5,045,299 | | | | 5,312,360 | |
| | | | | | | | | | | | | |
| Cash on hand and in banks | | | (4,415 | ) | | | (12,429 | ) | | | 13,911 | |
| Interest and dividends due and accrued | | | 40,102 | | | | 37,891 | | | | 40,038 | |
| Premiums receivable | | | 699,630 | | | | 649,660 | | | | 673,649 | |
| Reinsurance recoverable on paid losses and expenses | | | 8,455 | | | | 9,025 | | | | 10,337 | |
| Deferred tax recoverable | | | 159,702 | | | | 144,761 | | | | 161,165 | |
| EDP equipment | | | 1,732 | | | | 397 | | | | 549 | |
| Equities and deposits in pools and associations | | | 12,050 | | | | 10,864 | | | | 12,683 | |
| Receivable for sold securities | | | 373 | | | | 647 | | | | 5,176 | |
| Other assets | | | 30,153 | | | | 28,245 | | | | 29,040 | |
| Total assets | | $ | 6,334,524 | | | | 5,914,360 | | | | 6,258,908 | |
| | | | | | | | | | | | | |
| LIABILITIES | | | | | | | | | | | | |
| Reserve for losses | | $ | 2,518,967 | | | | 2,456,286 | | | | 2,497,916 | |
| Reinsurance payable on paid loss and loss expense | | | 3,400 | | | | 3,057 | | | | 3,163 | |
| Reserve for loss expenses | | | 570,944 | | | | 534,949 | | | | 564,976 | |
| Unearned premiums | | | 1,154,386 | | | | 1,071,722 | | | | 1,116,536 | |
| Reserve for commissions payable | | | 53,402 | | | | 50,382 | | | | 92,763 | |
| Ceded balances payable | | | 40,690 | | | | 41,112 | | | | 62,939 | |
| Federal income tax payable | | | 38,411 | | | | 34,247 | | | | 17,394 | |
| Premium and other taxes payable | | | 21,741 | | | | 19,411 | | | | 24,149 | |
| Borrowed money | | | 110,214 | | | | 60,031 | | | | 110,212 | |
| Reserve for dividends to policyholders | | | 4,111 | | | | 6,439 | | | | 5,706 | |
| Reserves for unauthorized reinsurance | | | 1,755 | | | | 2,030 | | | | 1,755 | |
| Payable for securities | | | 86,288 | | | | 25,563 | | | | 41,603 | |
| Funds withheld on account of others | | | 10,776 | | | | 7,928 | | | | 7,501 | |
| Accrued salaries and benefits | | | 48,280 | | | | 52,230 | | | | 83,718 | |
| Other liabilities | | | 48,891 | | | | 87,647 | | | | 44,796 | |
| Total liabilities | | | 4,712,256 | | | | 4,453,034 | | | | 4,675,127 | |
| | | | | | | | | | | | | |
| | | | | | | | | | | | | |
| POLICYHOLDERS' SURPLUS | | | | | | | | | | | | |
| Capital | | | 42,725 | | | | 42,725 | | | | 42,725 | |
| Paid in surplus | | | 492,869 | | | | 492,869 | | | | 492,869 | |
| Unassigned surplus | | | 1,086,674 | | | | 925,732 | | | | 1,048,187 | |
| Total policyholders' surplus | | | 1,622,268 | | | | 1,461,326 | | | | 1,583,781 | |
| Total liabilities and policyholders' surplus | | $ | 6,334,524 | | | | 5,914,360 | | | | 6,258,908 | |
Selective Insurance Group, Inc.
Combined Insurance Company Subsidiaries
Statutory Statements of Income
(unaudited)
| | | Quarter Ended |
| | | March |
| ($ in thousands) | | 2017 | | | | 2016 | | |
| UNDERWRITING | | | | | | | | |
| Net premiums written | | $ | 598,704 | | | | | | | | 565,359 | | | | | |
| | | | | | | | | | | | | | | | | |
| Net premiums earned | | | 560,854 | | | | | | | | 522,458 | | | | | |
| | | | | | | | | | | | | | | | | |
| Net losses paid | | | 241,979 | | | | | | | | 210,673 | | | | | |
| Change in reserve for losses | | | 21,051 | | | | | | | | 29,703 | | | | | |
| Net losses incurred | | | 263,030 | | | | 46.9 | % | | | 240,376 | | | | 46.0 | % |
| | | | | | | | | | | | | | | | | |
| Net loss expenses paid | | | 48,513 | | | | | | | | 46,124 | | | | | |
| Change in reserve for loss expenses | | | 5,969 | | | | | | | | 9,627 | | | | | |
| Net loss expenses incurred | | | 54,482 | | | | 9.7 | % | | | 55,751 | | | | 10.7 | % |
| | | | | | | | | | | | | | | | | |
| Net underwriting expenses incurred | | | 201,060 | | | | 33.5 | % | | | 190,917 | | | | 33.7 | % |
| | | | | | | | | | | | | | | | | |
| Total deductions | | | 518,572 | | | | | | | | 487,044 | | | | | |
| Statutory underwriting gain | | | 42,282 | | | | | | | | 35,414 | | | | | |
| | | | | | | | | | | | | | | | | |
| Net loss from premium balances charged off | | | (645 | ) | | | | | | | (691 | ) | | | | |
| Finance charges and other income | | | 3,275 | | | | | | | | 962 | | | | | |
| Total other income | | | 2,630 | | | | -0.4 | % | | | 271 | | | | 0.0 | % |
| Policyholders' dividends incurred | | | 97 | | | | 0.0 | % | | | (1,653 | ) | | | 0.3 | % |
| Total underwriting gain | | | 45,009 | | | | 89.7 | % | | | 34,032 | | | | 90.7 | % |
| | | | | | | | | | | | | | | | | |
| INVESTMENT | | | | | | | | | | | | | | | | |
| Net investment income earned | | | 35,757 | | | | | | | | 30,623 | | | | | |
| Net realized losses | | | (1,082 | ) | | | | | | | (2,704 | ) | | | | |
| Total income before income tax | | | 79,684 | | | | | | | | 61,951 | | | | | |
| | | | | | | | | | | | | | | | | |
| Federal income tax expense | | | 21,016 | | | | | | | | 16,603 | | | | | |
| | | | | | | | | | | | | | | | | |
| Net income | | $ | 58,668 | | | | | | | | 45,348 | | | | | |
| | | | | | | | | | | | | | | | | |
| Policyholders' surplus | | | | | | | | | | | | | | | | |
| Surplus, beginning of period | | $ | 1,583,781 | | | | | | | | 1,426,320 | | | | | |
| | | | | | | | | | | | | | | | | |
| Net income | | | 58,668 | | | | | | | | 45,348 | | | | | |
| Change in deferred taxes | | | (1,752 | ) | | | | | | | 352 | | | | | |
| Change in net unrealized capital losses | | | 3,771 | | | | | | | | 5,311 | | | | | |
| Dividends to stockholders | | | (20,024 | ) | | | | | | | (15,254 | ) | | | | |
| Change in non-admitted assets | | | (2,656 | ) | | | | | | | (2,182 | ) | | | | |
| Change in Overfunded Contra Asset | | | (1,282 | ) | | | | | | | (1,047 | ) | | | | |
| Qual Pen Trans Liab | | | 1,744 | | | | | | | | 2,456 | | | | | |
| Excess Plan Trans Liab | | | 8 | | | | | | | | 19 | | | | | |
| PRL Plan Trans Liab | | | 10 | | | | | | | | 3 | | | | | |
| | | | | | | | | | | | | | | | | |
| Net change in surplus for period | | | 38,487 | | | | | | | | 35,006 | | | | | |
| | | | | | | | | | | | | | | | | |
| Surplus, end of period | | $ | 1,622,268 | | | | | | | | 1,461,326 | | | | | |
| | | | | | | | | | | | | | | | | |
| Statutory underwriting gain | | $ | 45,009 | | | | | | | | 34,032 | | | | | |
| | | | | | | | | | | | | | | | | |
| Adjustments under GAAP: | | | | | | | | | | | | | | | | |
| Deferred policy acquisition costs | | | 5,058 | | | | | | | | 7,789 | | | | | |
| Other, net | | | (845 | ) | | | | | | | (866 | ) | | | | |
| GAAP underwriting gain | | $ | 49,222 | | | | | | | | 40,955 | | | | | |
| | | | | | | | | | | | | | | | | |
Note: Some amounts or ratios may not foot due to rounding.
| Selective Insurance Group, Inc. and Consolidated Subsidiaries |
| Alternative Investments |
| March 31, 2017 |
| (unaudited) |
| | | | | | | | | |
| | | Number | | Original | | Remaining | | Current |
| Strategy | | of Funds | | Commitment | | Commitment | | Market Value |
| Private Equity | | | 20 | | | | 176,515,538 | | | | 74,669,031 | | | | 41,354,303 | |
| Private Credit | | | 10 | | | | 109,000,000 | | | | 40,745,221 | | | | 31,026,212 | |
| Real Assets | | | 7 | | | | 92,000,000 | | | | 27,763,706 | | | | 16,264,503 | |
| TOTAL - ALTERNATIVE INVESTMENTS | | | 37 | | | | 377,515,538 | | | | 143,177,958 | | | | 88,645,018 | |
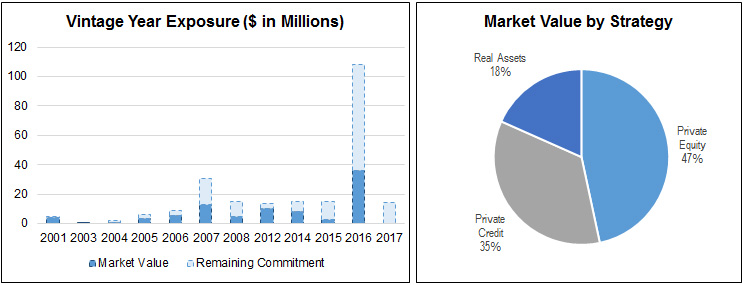
Exhibit may not foot due to rounding