Exhibit 99.1
Welcome
Jennifer DiBerardino
Vice President, Investor Relations
Certain statements in this report, including information incorporated by reference, are “forward-
looking statements” as that term is defined in the Private Securities Litigation Reform Act of 1995
(“PSLRA”). The PSLRA provides a safe harbor under the Securities Act of 1933 and the Securities
Exchange Act of 1934 for forward-looking statements. These statements relate to our intentions,
beliefs, projections, estimations or forecasts of future events or our future financial performance
and involve known and unknown risks, uncertainties and other factors that may cause our or our
industry's actual results, levels of activity, or performance to be materially different from those
expressed or implied by the forward-looking statements. In some cases, you can identify forward-
looking statements by use of words such as "may," "will," "could," "would," "should," "expect,"
"plan," "anticipate," "target," "project," "intend," "believe," "estimate," "predict," "potential," "pro
forma," "seek," "likely" or "continue" or other comparable terminology. These statements are only
predictions, and we can give no assurance that such expectations will prove to be correct. We
undertake no obligation, other than as may be required under the federal securities laws, to
publicly update or revise any forward-looking statements, whether as a result of new information,
future events or otherwise.
Factors, that could cause our actual results to differ materially from those projected, forecasted or
estimated by us in forward-looking statements are discussed in further detail in Selective’s public
filings with the United States Securities and Exchange Commission. These risk factors may not be
exhaustive. We operate in a continually changing business environment, and new risk factors
emerge from time-to-time. We can neither predict such new risk factors nor can we assess the
impact, if any, of such new risk factors on our businesses or the extent to which any factor or
combination of factors may cause actual results to differ materially from those expressed or
implied in any forward-looking statements in this report. In light of these risks, uncertainties and
assumptions, the forward-looking events discussed in this report might not occur.
Forward Looking Statement
12:30-1:00 p.m. | Registration | |
1:00 p.m. | Welcome | Jennifer DiBerardino, VP Investor Relations |
1:10 p.m. | Strategic Overview | Greg Murphy, Chairman, President and Chief Executive Officer |
1:35 p.m. | Insurance Operations | John Marchioni, Chief U/W & Field Officer |
Business Intelligence | Brenda Hall, SVP Field U/W & Information Strategy | |
Personal Lines | Allen Anderson, SVP Personal Lines | |
2:35 p.m. | Break | |
2:45 p.m. | Agency Panel •HMS Insurance Associates •Eastern Insurance •Berends Hendricks Stuit •BB&T | John Marchioni, moderator Gary Berger Mark Levine Jerry Niewiek David Pruett |
3:45 p.m. | Claims Operations | Mary Porter, Chief Claims Officer |
4:00 p.m. | Enterprise Risk Management and Financial Highlights Investments | Dale Thatcher, Chief Financial Officer Kerry Guthrie, Chief Investment Officer |
4:30 p.m. | Closing and Q&A | Greg Murphy & Management Team |
5:00 p.m. | Reception |
Investor Day Agenda - March 24, 2009
The Journey Continues
with Sound Strategy
Greg Murphy
Chairman, President & CEO
Source: A.M. Best
Commercial Lines P&C Statutory Combined Ratio
%
Commercial Lines P&C Statutory NPW Growth
Source: A.M. Best
Strong Cycle Management
that Balances
Growth and Profitability
Who We Are
Selective is a High-Tech, High-Touch company writing
commercial and personal lines business in 22 states
through 940 relationship focused independent agents.
commercial and personal lines business in 22 states
through 940 relationship focused independent agents.
We deploy leading edge technology to provide an ease
of doing business, supplementing our excellent
agency relationships.
Our Strategy is About…
…creating and capturing value
…managing information to make better decisions
creating long term profitable growth
…competitive positioning and sustainability
Nationals
Estimated Years
of
Advantage
Regionals
Ahead
Behind
On Par
3
Small business straight through
processing
processing
P/L predictive modeling
1-2
C/L predictive modeling
2-3
3-5
Relationships
Field model
3-5
2
Ability to execute
2
Safety management
Competitive Advantages
Nationals
Estimated Years
of
Advantage
Regionals
Ahead
Behind
On Par
1-3
1-3
Information Management
Cycle Mgmt Tools: DSM
2
0
Technology: agency integration
Technology: CL customer self service
Competitive Advantages
* Source: IIABA 2007P-C Insurance Market report (2-09)
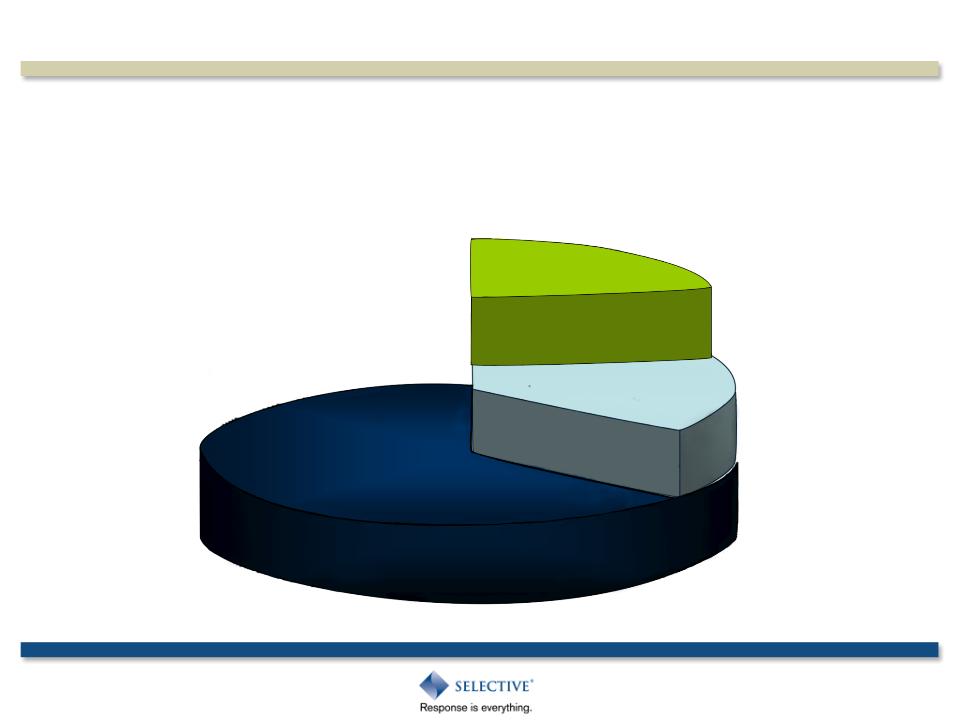
Regional Carriers Wrote 23%
of 2007 PL Premiums or $52B
Strategy is About Increasing Market Share
Personal Lines - $115 Billion Opportunity
How Written:
• CSRs place business based on price and ease of doing business
Keys to Success:
• Relationships are critical to being in the game
• Operational and technological efficiency
• Automated underwriting
• Pricing precision
Source: IIABA 2007 P-C Insurance Market report (2-09)
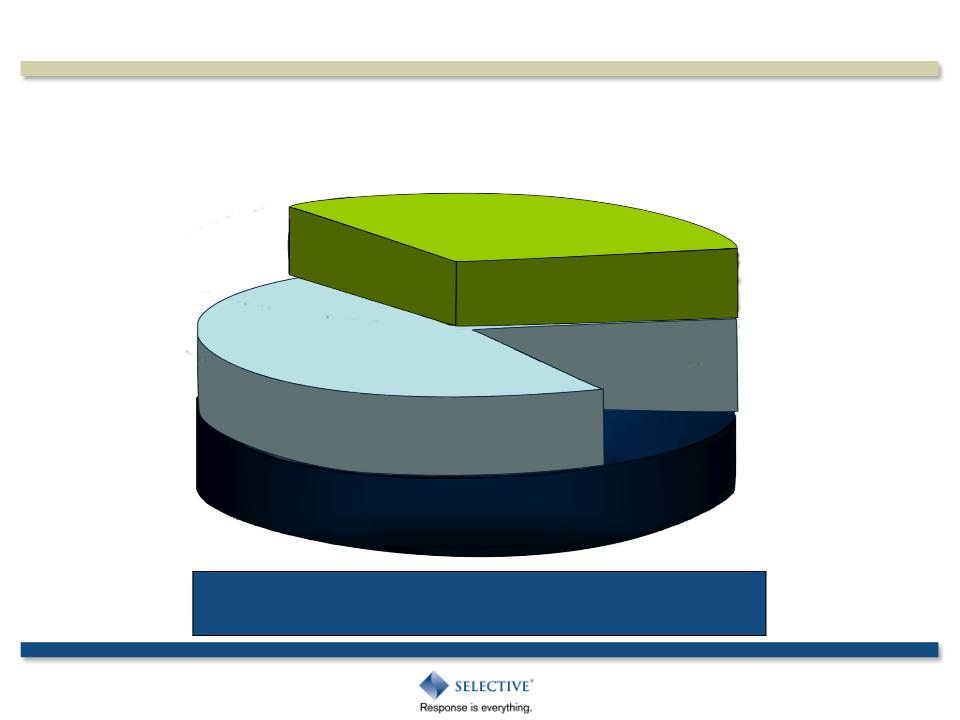
Regional Agency Carriers Wrote 32%
of 2007 CL or $83B
In 10 years regional companies increased
C/L market share 20%
Strategy is About Increasing Market Share
6,122
4,026
939
486
44
186
441
Premium at
5% Market
Share
5% Market
Share
1.1
122,437
Total
80,512
18,771
9,725
881
3,729
8,819
Total
Statewide
DPW ($M)
Statewide
DPW ($M)
1.0
NY
0.7
All other
2.1
PA
2.6
RI
3.0
MD
4.4%
NJ
Current
Market
Share
Market
Share
State
Greenfield Growth Opportunities
State | Current Share of Wallet | Most Recent Agency Commercial Lines Premium Volume ($M) |
NJ | 13.6% | 2,655 |
MD | 10.0 | 1,174 |
RI | 18.5 | 283 |
PA | 11.4 | 2,215 |
NY | 8.3 | 2,060 |
All other | 5.9 | 10,733 |
Total | 8.3 | 19,120 |
*Includes agents appointed prior to 2006 only
Source: Highline Data
18% Share of
Wallet Results in
Wallet Results in
$3.4 Billion DPW
Greenfield Growth Opportunities
$54 billion
Middle Market ($25K to $250K)
Small Business (up to $25K)
$23 billion
Large Accounts ($250K to $1M)
$21 billion
We Look at the Market in Three Distinct Components
How Written:
• The decision makers are the Agency CSR or the Producer
• Flows through path of least resistance
Keys to our Success:
• Must have relationship to get in the game
• Systems integrate directly with agents
• Underwriting templates with predictive modeling increase throughput
• Insured self-service
• Broad underwriting appetite
About 30% of our book is small business
Small Business - $23 Billion Opportunity
Automated One & Done® New Business
Small Business Profitability
Retention
• 1.5 points better than policies over $25,000
Profitability
• A 3-year loss ratio of 2.2 points better than policies over $25,000
Price Sensitivity
• Small business policies have significantly less rate modification than
policies > $25,000
policies > $25,000
●
Middle Market Business - $54 Billion Opportunity
AMS compensation guidelines
• Measures growth and profitability
• No pure growth objectives
Strategic Business Units
• Product portfolio by market
segment
segment
• Specialty
• Mercantile and Service
• Manufacturing
• Contractors
• Underwriting authority guidelines
• Not a market
• Not an appetite
Middle Market Profitability
How Written:
• Agent-controlled accounts or new prospects that want customized solutions
Keys to Success:
• Custom safety management solutions
• CMS provides service and customer knowledge
• Actuarial unit for target pricing
• Sophisticated underwriting
Large Account Business - $21 Billion Opportunity
In 2008…
• Submissions continue to be strong
• Hit ratio down 50%
• New business down 40% to $20M
• Pure price down only 4%
• Retention remained strong at 81%
��� Combined ratio - 101.7%
Solid Cycle Management Critical to Profitability
Sources: Advisen and Tillinghast CLIPs
Selective gave up less
price than competitors in
2008: (3.1)% versus
(5.8)%
price than competitors in
2008: (3.1)% versus
(5.8)%
Commercial Lines Pricing
Key to Underwriting Improvements
• Enterprise risk management
• Conservative investment strategy
• Strong reinsurance program
• Disciplined reserving practices
Financial Strength to Support Profitable Growth
Long-Term Shareholder Value Creation
Building on a Strong Foundation
John Marchioni
Executive Vice President
Chief Underwriting & Field Operations Officer
• Empowered field model
• Best-in-class agency relationships
• Industry-leading automation
• Broad underwriting appetite
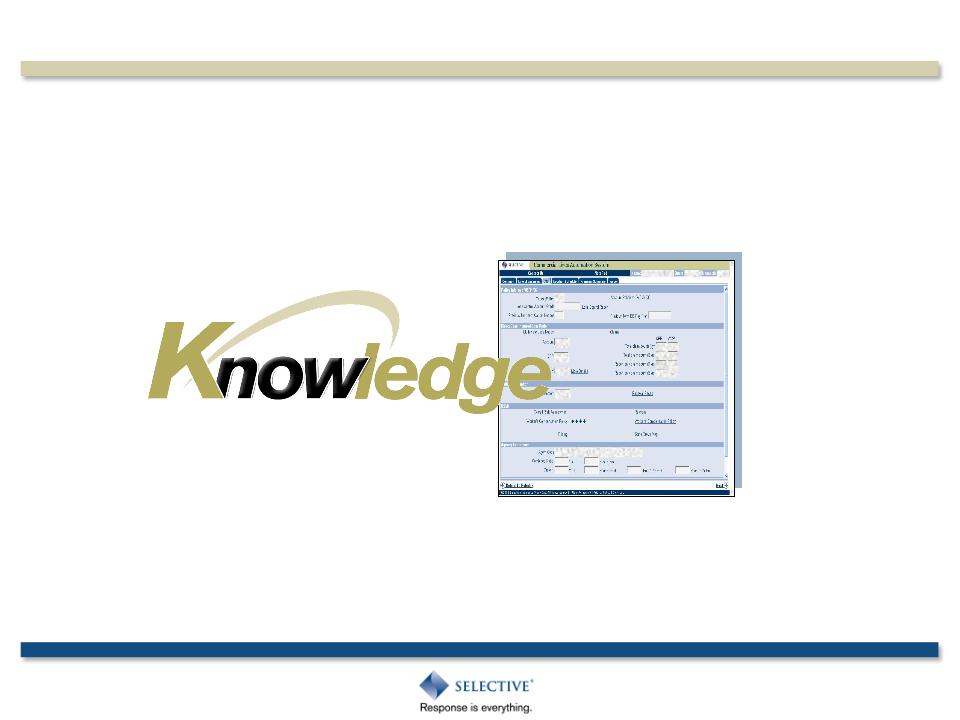
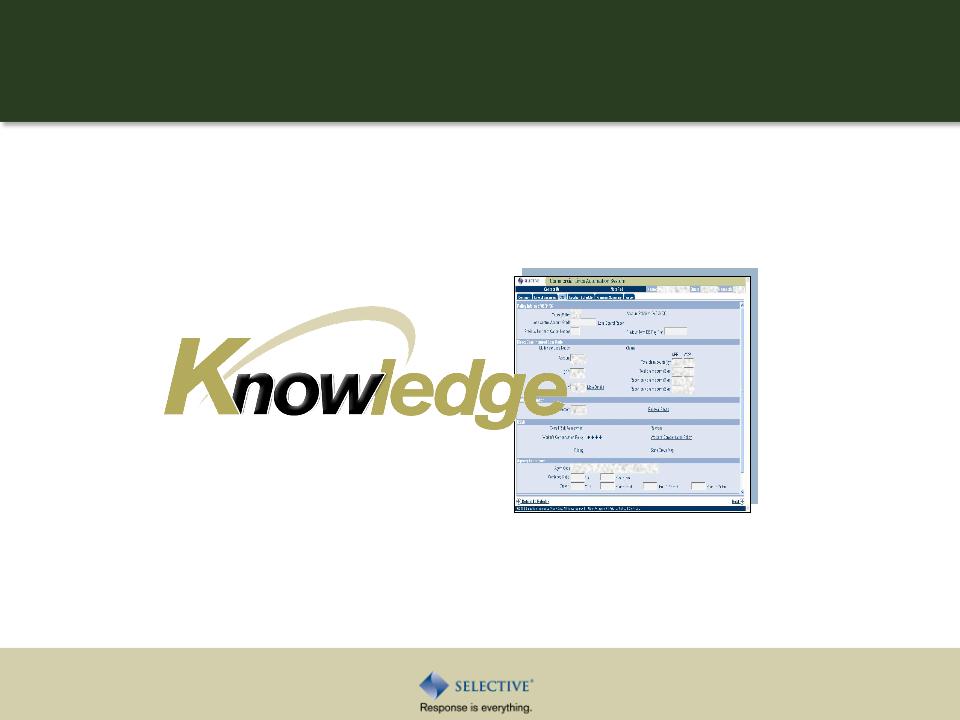
Enhanced through Knowledge Management
High-Tech, High-Touch® Model
Better access to better information to make better decisions
The integration of KM and our strong business model
will drive growth and profitability
Knowledge Management
Models are weighted using 2008 premium, new and renewal.
Policy size <$50,000 DPW
CL Predictive Models - All Lines
Historical % of Premium | 20% | 30% | 30% | 15% | 5% |
Worst 5% of the book reduces ROE by 200 bps
Diamond Score
The Power of Modeling
For new prospects AMS provided with:
• Diamond score
• Pricing guidance by line of business
Enhanced through Knowledge Management
Empowered Field Model
Agency Management Specialist (AMS)
• Own their geographic territory
• Measured on growth and profitability
• Authority to write middle market new business
Percent of Total Premium Diamond Distribution
WC, BOP, CPP, CA
For lines < $50,000
Improved New Business Decision-Making
For renewal accounts underwriter provided with:
• Diamond score
• Pricing guidance by line of business
• All necessary information to make renewal
underwriting and pricing decision
Enhanced through Knowledge Management
Empowered Field Model
Regional underwriting teams
• Manage renewal book by agency
• Authority to make individual account decisions
• Measured on price and retention
Decision Support Information
All lines, point of renewal retention.
2008: All lines combined (WC, BOP, CPP, Comm Auto) <$50K DPW
Average retention of 87%
Diamond Score
Improving Renewal Mix
Advanced segmentation drives reallocation of
resources to troubled segments
Enhanced through Knowledge Management
Empowered Field Model
Safety Management Specialists (SMS)
• Consultative approach with customers
• Pre-quote inspections lead to higher hit ratio
• Accounts on service plan retain at higher levels
In the current market, what do agents rank as “most important”
when deciding where to place their best business?
While each of these factors is important,
relationships drive the business
Strong Agency Relationships
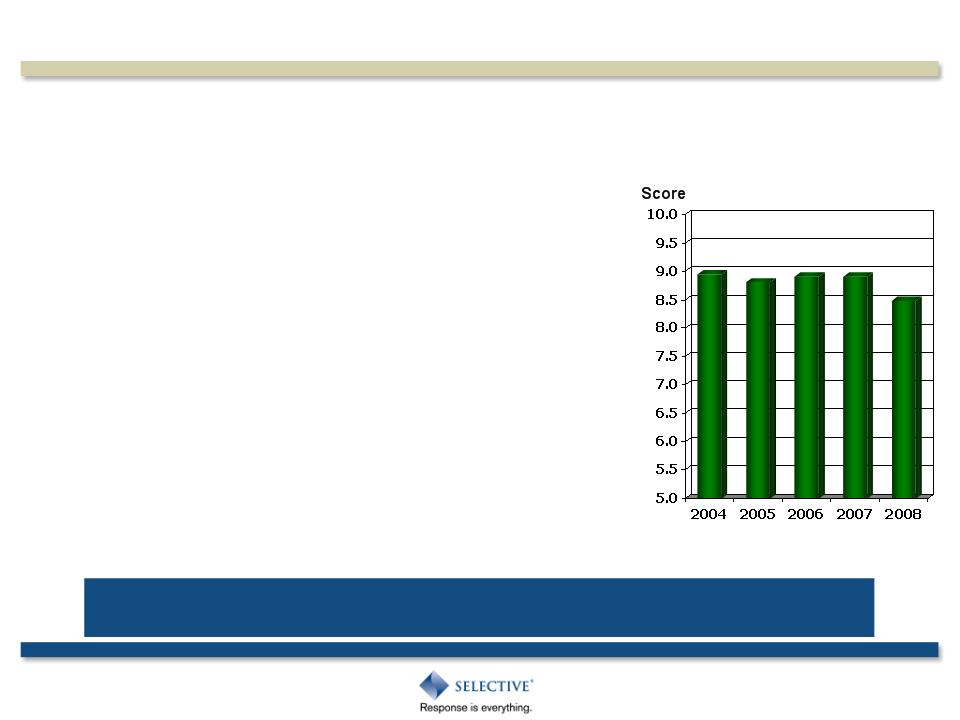
• 2008 Agency satisfaction survey
• Survey highlights:
• Quality of AMSs’ underwriting decisions
- 87% favorable
- 87% favorable
• Quality of CMSs’ claims decisions
- - 84% favorable
• Quality of Commercial Lines products
- - 93% favorable
• Overall ease of doing business
- 83% favorable
- 83% favorable
91% rated us “excellent” or “very good” for overall satisfaction
Strong Agency Relationships
Source: SNL Financial and Company Reports
Peer Average
($ Millions)
$1.8M
Top 3 position in 65% of our agents
Agency Penetration
Note: for illustrative purposes only
Agency Management & Planning
Enhanced Through Market Knowledge
• Advanced agency segmentation
• Improved market planning
Robert Rusboldt
President and CEO
Independent Insurance Agents
and Brokers of America
“…super-regionals like Selective are
attracting the top independent agents in the
country, there’s going to be a flight to good
companies like Selective [who have] taken
on the role that nationals used to play as far
as loyalty and quality of service and
excellence”
attracting the top independent agents in the
country, there’s going to be a flight to good
companies like Selective [who have] taken
on the role that nationals used to play as far
as loyalty and quality of service and
excellence”
“There Will Be A Flight To Quality”
Predictive Models drive more accurate pricing
and risk selection without manual intervention
Advanced segmentation drives expanded
underwriting templates
Enhanced through Knowledge Management
Industry Leading Automation
Underwriting systems designed in collaboration with agents
• CLAS®, SelectPLUS®
• xSELerate®
• One & Done® Small Business platform
Focused on segment diversification
Specialty
Mercantile &
Service
Manufacturers
& Wholesalers
Contractors
Broad Underwriting Appetite
Segment 41 | 95.6% | ||
Segment 60 | 101.0% |
Segment 21 | 86.3% | ||
Segment 40 | 95.3% |
Segment 1 | 68.7% | ||
Segment 20 | 85.8% |
Segment 61 | 101.2% | ||
Segment 80 | 120.2% |
Operational Areas
Marketing
Safety
Management
Management
Training
Pricing
Average
Lower
Than
Than
Average
Higher
Than
Average
Than
Average
Growth
Marketing
Materials
Materials
Stewardship
Service
Retention
Sales
Training
Training
Boundary
Control
Corrective
Action
Action
*Direct accident year combined ratio
Business Segment
3-Year
Combined
Ratio
Combined
Ratio
Broad Underwriting Appetite
Enhanced through Knowledge Management
Qualified Leads Program
• Prescreened, high-quality new business prospects
• Leverages power of predictive models
• AMS’s more proactive in new business development
Targeted state expansion
• Massachusetts 2007 (CL only)
• Tennessee 2008 (all lines)
• $8.5B CL premium potential combined
Using Information to Drive Growth
= Profitable Growth
Empowered field model
Best-in-class agency relationships
Industry-leading automation
Broad underwriting appetite
The Winning Equation
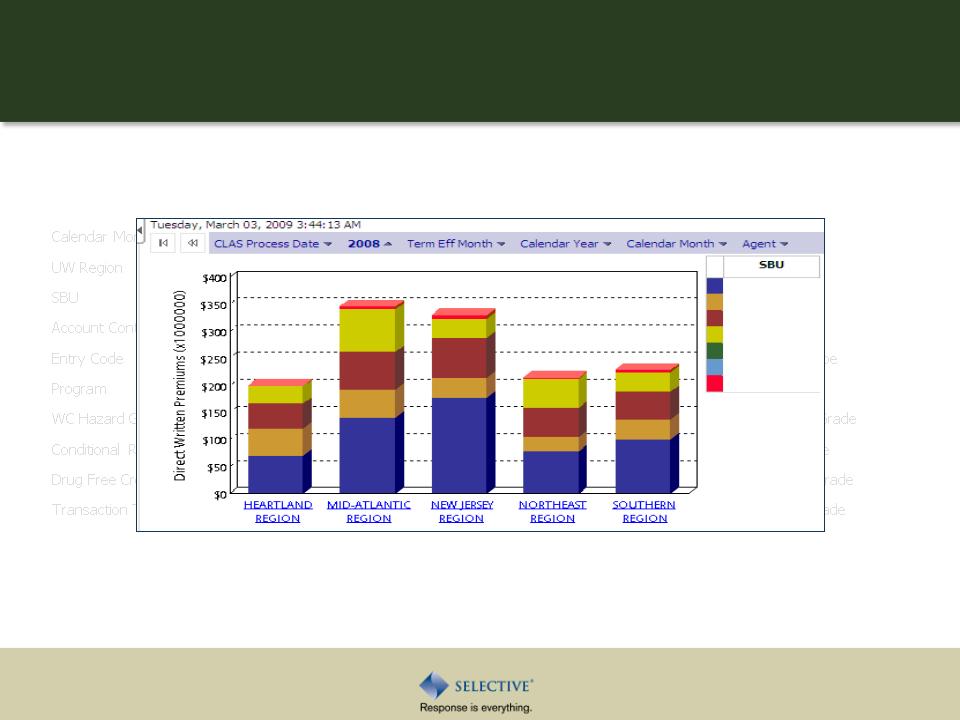
Business Intelligence
Drives Profitability
Brenda Hall
Senior Vice President
Director of Field Underwriting &
Information Strategy
Business Engine
Underwriting - Claims
Billing - Safety Management
Information
Augmentation
External Data
Business Intelligence Platform
Analytics - - Predictive Modeling
Fuels Business Intelligence
Data
Selective’s Information Engine
Traditional analytics:
• State
• Line of Business
• Agency
Portfolio Management
Dividend Plan
FTE Count
Voluntary / Involuntary
Policy New or Renewal
Policy Size
Policy Info Integration
RMF Stratified
Policy LOB Trans Type
Declination Reason
Account Level Referral
President Club Agent
BOP Hazard Grade
Calendar Year
Term Effective Month
Term Effective Year
CLAS Process Date
Managing Our Portfolio Through Analytics
Segment 41 | 95.6% | ||
Segment 60 | 101.0% |
Segment 21 | 86.3% | ||
Segment 40 | 95.3% |
Segment 1 | 68.7% | ||
Segment 20 | 85.8% |
Segment 61 | 101.2% | ||
Segment 80 | 120.2% |
Operational Areas
Marketing
Safety
Management
Management
Training
Pricing
Average
Lower
Than
Than
Average
Higher
Than
Average
Than
Average
Growth
Marketing
Materials
Materials
Stewardship
Service
Retention
Sales
Training
Training
Boundary
Control
Corrective
Action
Action
*Direct accident year combined ratio
Business Segment
3-Year
Combined
Ratio
Combined
Ratio
Portfolio Management - Segmentation
• Targeted Specialty Segment
• 3 year combined ratio of 92%
• YTD February new business growth +40%
• 15 sales meetings in 9 states
• Enhanced specialty program coverage
Targeted Business Segmentation Growth
• Detailed loss analysis conducted
• Newer business traveler hotel sub-
segment driving losses:
• Relaxed building codes
• Workers Compensation strains
• Ineffective management
• Market pressure pushed pricing down
New underwriting guidelines now in use
Segmentation Analysis - Hotels
New Guidelines:
• No new ventures or management with
< 5 years experience
• Larger, resort-style hotels
• AAA or equivalent ‘star’ rating
• Formal risk management plan
Implementation - - Hotels
Tactical book of business review
•
•
• Focus on multi-year performance
• Identify agencies not meeting expectations
• Perform tactical book of business review
• Create agency profitability improvement plan
Portfolio Management - Agency Segmentation
The Agent
High-caliber agency
Not profitable with Selective
Not growing as we wanted
Strong relationship with
AMS and underwriter -
commitment to Selective
AMS and underwriter -
commitment to Selective
Agency Profitability Improvement Plan
Success Story
Success Story
The Analysis
High concentration of
heavier vehicles -
deductibles low
heavier vehicles -
deductibles low
Poorly performing non-
contracting risks
contracting risks
Concentration of larger
accounts
accounts
Agency Profitability Improvement Plan
Success Story
Success Story
The Plan
Re-underwrite, price to
exposure, engage Safety
Management
exposure, engage Safety
Management
Non-renew where necessary
Aggressive, targeted growth
Buy-in from the agency
Agency Profitability Improvement Plan
Success Story
Success Story
DPW - Total | DPW - NEW | Combined Ratio (%) | |
2002 | $3,985 | $443 | 115.1 |
2003 | $4,561 | $1,701 | 108.1 |
2004 | $6,149 | $1,617 | 79.6 |
2005 | $6,427 | $1,335 | 69.4 |
2006 | $8,610 | $2,825 | 81.2 |
2007 | $10,338 | $3,641 | 93.6 |
2008 | $11,401 | $2,675 | 73.7 |
Keys to Success
• Relationship with agency
• Ability to understand what drove results
• Commitment to grow profitably with agency
The Results Speak For Themselves
Decision Support Information
Business Intelligence Drives Profitability
Personal Lines
Allen Anderson
Senior Vice President
Personal Lines
The Road to
Profitability
Profitability
Personal Lines
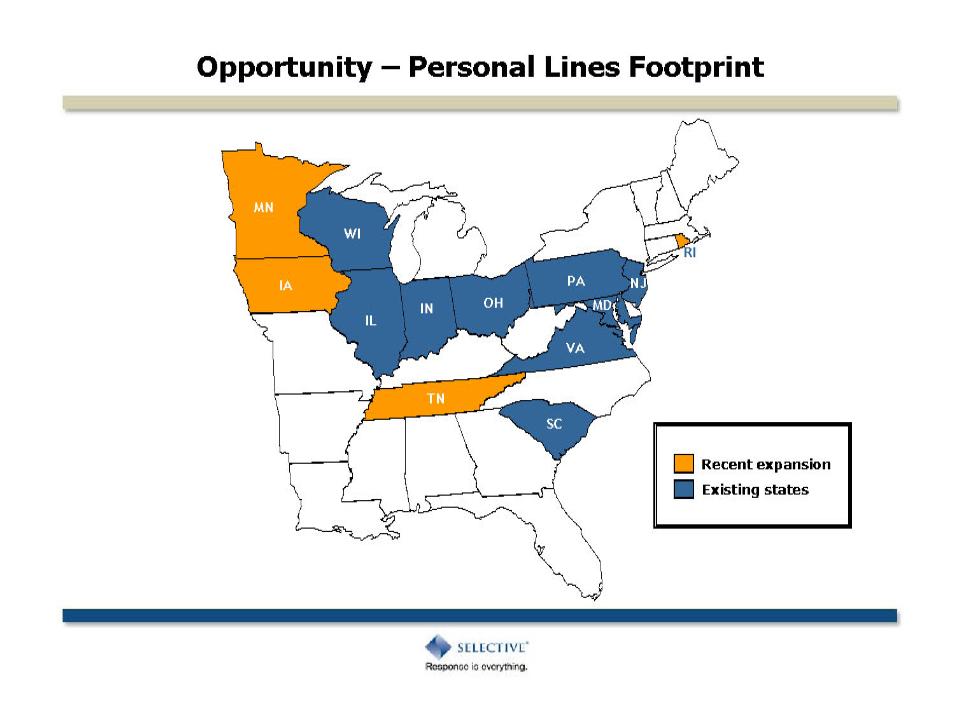
• Our opportunity
• Underwriting and automation
improvements
improvements
• Profitable by 2010
Region | Targeted Market Share ($M) |
Heartland (IL, IN, MN, WI, IA) | 302 |
Mid-Atlantic (PA, MD, OH) | 267 |
New Jersey | 143 |
Northeast (RI) | 13 |
Southern (VA, TN, SC) | 175 |
Total premium at 1.5% market share | $900 |
Significant growth potential in our 13-state footprint
Key Growth Opportunities
Underwriting and Automation Improvement
• Automated underwriting rules at
point of sale
point of sale
• Knowledge Management launched
• Access to current information
• Production
• In-force
• Renewal
• Accident year loss
• Granular, real-time information to
make decisions
make decisions
Note: Year-end run rates
New Business Processed through One & Done®
2006
2007
2008
Quote Volume
Underwriting and Automation Improvement
($ in millions) | Weighted Average Price Change | In-Force Premium Impact |
2008 | 7.4% | $14.9 |
2009 | 4.3% | $ 9.1 |
2008 NPW of $213M, up 4% versus 2007
Personal Lines Rate Activity
x
The Road to Profitability - Quality of Book
The Road to Profitability - New Business
x
Rate Group
• Opportunity - A targeted 1.5% market share
equals $900 million
equals $900 million
• Underwriting and automation improvements
- reduced operating costs and increased data
quality
- reduced operating costs and increased data
quality
• Profitable by 2010 through additional rate
and improved business mix
The Road to
Profitability
Profitability
Personal Lines
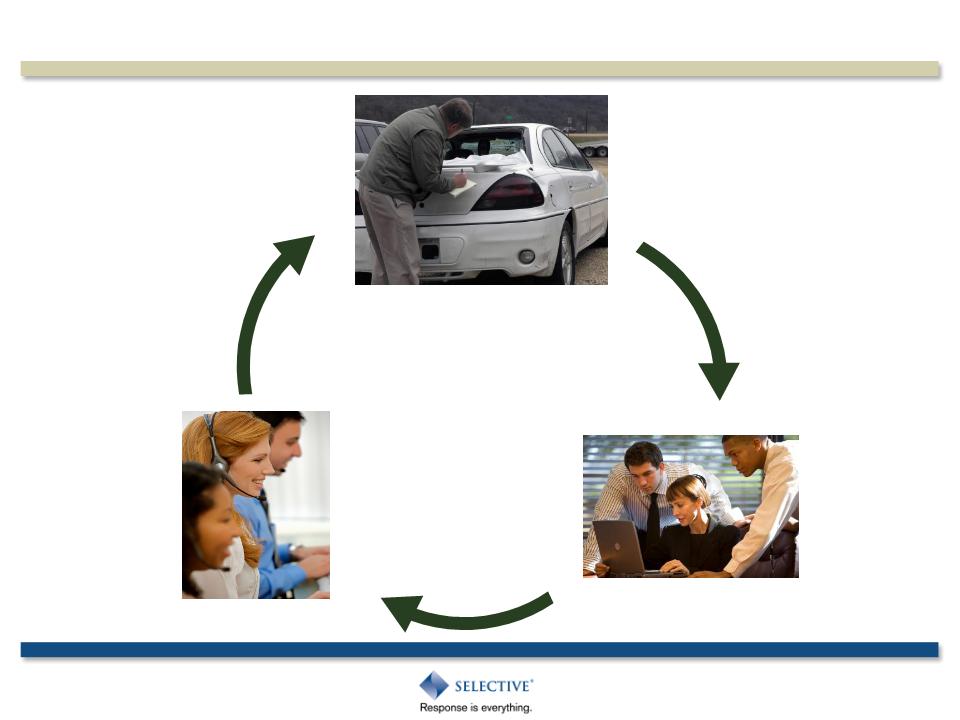
Claims Strategy
Mary Porter
Executive Vice President
Chief Claims Officer
• Year-end 2008
• $2.3 billion total loss reserves
• $385 million total LAE reserves
• 38,000 open claims
• Best integrated outcome
• Cycle time management
• Cost effective assignment
• Expense management
Claims Opportunity
Corporate
Claims
Claims
Field-based
CMS
CMS
Claims
Service
Center
Service
Center
Overview of Claims Organization
Shorter cycle-time, lower expense
Claims Service Center
• First notice of loss - 24 x 7
• Immediate file set-up and
assignment
assignment
• Total loss / glass / auto
• Small dollar claims
Field based litigation and workers compensation adjusters
Field-Based Claims
• 140 CMSs in 22 states
• Ability to service multi-lines
• Speed in response and resolution
• Immediate investigation better results
Corporate Claims
• Line of business expertise
• High-exposure files and litigation
• Specialty claims - Environmental,
EPLI, Municipalities
• Claims legal - expertise and expense
management
management
• Quality assurance, training, compliance
Continual Review and Benchmarking
• Operational reviews
• Internal and external reviews
• Workers compensation strategy
• Overall claims strategy
• Ward Group®
• We participated in 2006 and 2007 Benchmarking Program
Goal: Approximately $6 million savings in 2009
Key Initiatives Completed
• Workers compensation strategy
• Case management improvements
• Right sized staffing and workloads
• Streamlined procedures/report handling
• Bill review, PPO penetration and
additional expense management
Moving Us in the
Right Direction
Key Initiatives for 2009
• Litigation management
• Continue 2008 improvement:
$2.5 million legal expense reduction
• Proactive suit management
• Early recognition
• Expense management
Key Initiatives for 2009
• Vendor panel
• Quality
• Expense management
• Cycle time and best possible
integrated outcome
integrated outcome
The Journey Ahead - Claims Strategy Initiative
Enterprise Risk Management
Dale Thatcher
Executive Vice President
Chief Financial Officer & Treasurer
• Super-regional P&C company
• 22-state commercial lines footprint (86% NPW)
• 13-state personal lines footprint (14% NPW)
• Commercial lines consists of low hazard, suburban and rural risks
• Small to mid-sized commercial lines with $11,000 avg. account size
• High franchise value: $1.6M in NPW per agency (distributing
through 940 independent agents)
Selective’s Risk Profile - Underwriting
• Short liability duration of 3.7 years
• Carried reserves at 54th percentile of actuarial range
• Detailed actuarial reviews each quarter
• Smaller risks are more homogeneous and less complex
which yields more stable results
• Experienced actuarial staff: 10 Fellows, 5 Associates,
12 students, 1 statistician
Selective’s Risk Profile - Reserves
• Buy reinsurance to 0.6% probability event (stochastic basis),
0.4% probability event (historic basis)
• “A” average credit quality of catastrophe reinsurers
• Ceded premium, excluding Flood, 4% of gross premium
• Unsecured net reinsurance recoverables 10% of surplus at
12/31/08
12/31/08
• 1% probability event = 4.7% net after-tax impact on surplus
Selective’s Risk Profile - Reinsurance
• Premium to surplus: 1.7x
• Debt-to-capital ratio of 23.5%, 17% adjusted
• Attractive debt repayment schedule
• $250M long-term, average life of 39 years
• Near-term expiring debt of $12M in 2009 & 2010
• Interest coverage ratio of 4.6x operating income at YE 2008
• Access to $50M line of credit, expiring in 2011
• Sustainable growth rate of 5%
• No derivatives, off-balance sheet or unusual transactions
Selective Risk Profile - Capital & Liquidity
$3.6B Invested Assets
as of February 28, 2009
Selective Risk Profile - Investments
Investments
Kerry Guthrie
Executive Vice President
Chief Investment Officer
“AA+” average portfolio rating
AA+
AAA
AAA
AA
A
AA+
$3.1 billion market value, 84% of overall portfolio
High Credit Quality Bond Investment Portfolio
As of February 28, 2009
• $1.8 billion market value, 49% of overall portfolio
• “AA+” rated (“AA” without insurance enhancement)
Challenges
• Significant revenue shortfalls
• State & local budget pressures
• Weakening credit profiles
• Ratings turbulence
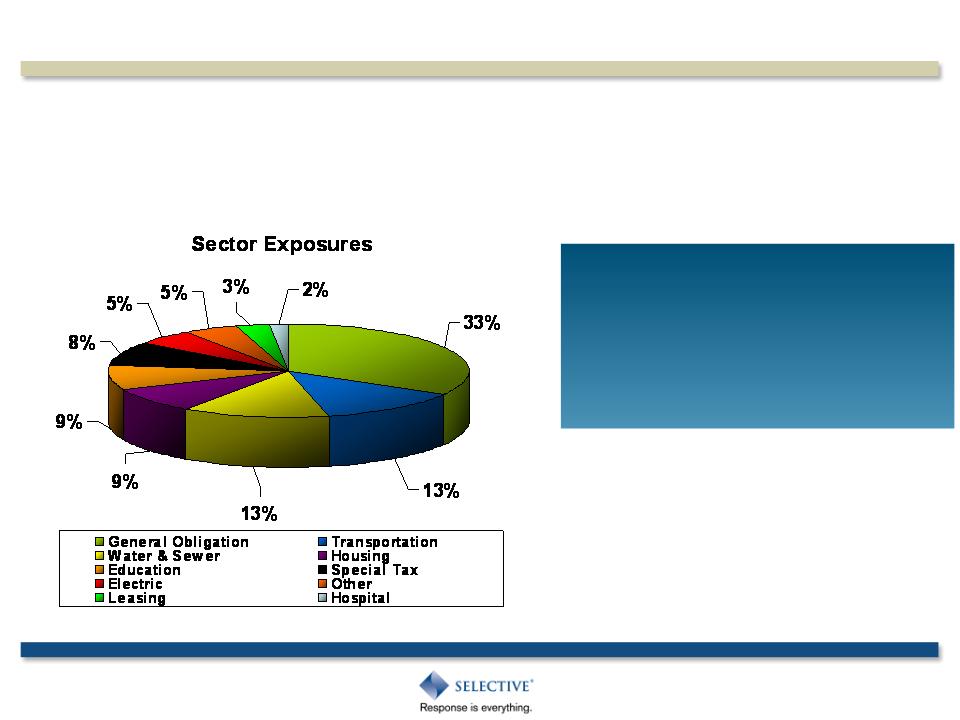
Municipal Securities - February 28, 2009
• Comfortable with underlying credit quality, which
remains very high
remains very high
• First quarter actions:
• $1.3 billion reclassified to held to maturity (HTM)
• $500 million AFS highest quality bonds, most liquid names
• Sold $39 million of state general obligation bonds
• Underweight potential troubled spots (CA, MI, OH)
• Significant portfolio diversification by geography/sectors
Municipal Observations
Challenges
• Capital market access
• Declining corporate earnings
• Ratings turbulence
• $407 million market value, 11% of overall portfolio
• Average rating “A”
Corporate Bonds - February 28, 2009
• New purchases
• Limited financing needs
• Recession resistant companies
• Strong balance sheets
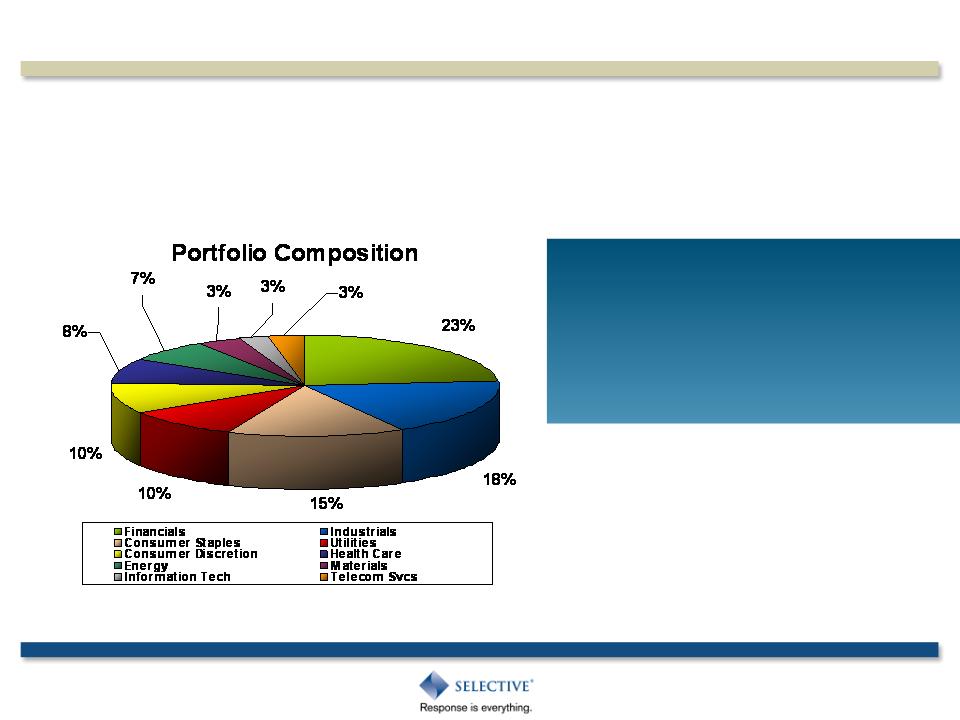
• Avoiding troubled sectors
• Focused on short duration paper
• No “Big 3” auto exposure
• Underweight financials and cyclicals
• Portfolio is high quality and has performed well
Corporate Bonds Observations
• $352 million market value, 10% of overall portfolio
• High quality ratings profile, “AA+” average rating
Challenges
• Unemployment continues to rise
• Home values continue to fall
• Illiquid non-agency RMBS market
• Ratings turbulence
• Regulatory/Political risk
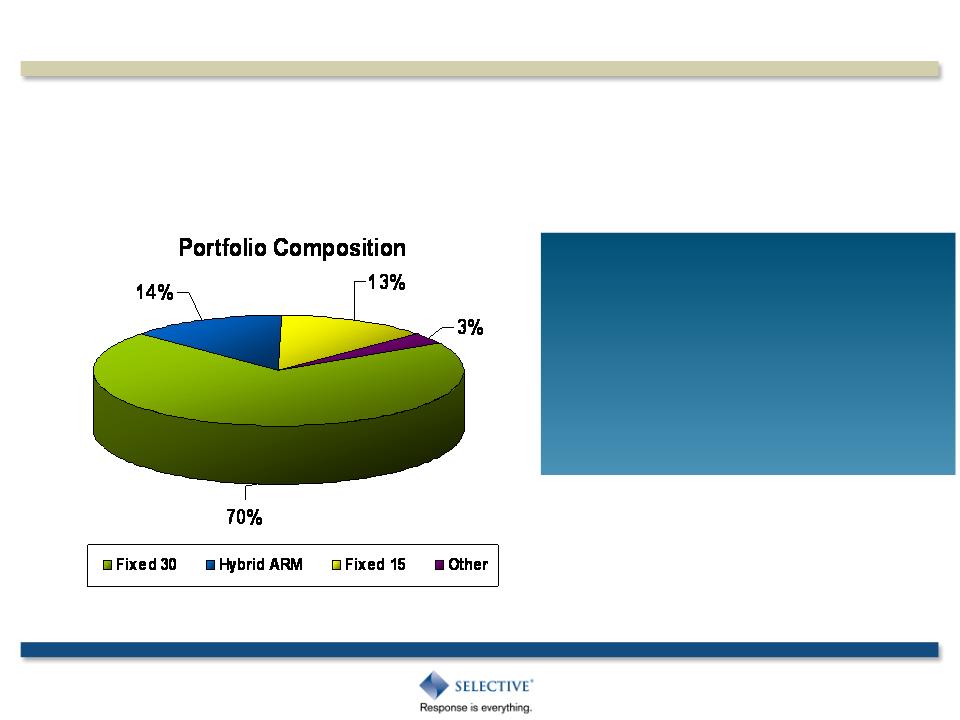
RMBS and RABS Securities - February 28, 2009
• Total Prime RMBS portfolio - “amortizing effect”
• Received $56 million in principal paydowns in 2008 - 15%
of portfolio
of portfolio
• Averaging $14 million in principal paydowns per quarter
• Prime Non-agency RMBS under pressure
• Received $23 million in principal paydowns in 2008 - 17%
of portfolio
of portfolio
• $113 million, 13% of stockholders equity
• Average FICO score 726
• Average loan-to-value (LTV) ratio 67%
• Average market evaluation $62
RMBS and RABS Observations
Challenges
• Refinancing risk
• All Alt-A’s viewed negatively
• Illiquid market
• 2006 vintage issues
• Rating downgrades
• $41 million market value, 1% of total portfolio
• “AA” average rating
• Predominantly fixed-rate loans
Alt-A RMBS Securities - February 28, 2009
• Total Prime Alt-A portfolio
• No Alt-A purchases after 3rd quarter 2006
• Unrealized loss $38 million
• Alt-A 2006 vintage:
• $25 million, 60% of total Alt-A, 3% of stockholders equity
• Average FICO score 710
• Average loan-to-value (LTV) ratio 73%
• Average market evaluation $42
• Unrealized loss $34 million
Alt-A Observations
Challenges
• Corporate bankruptcies rising
• Weak operating conditions
• Declining property values
• Refinancing risk
• Subordinated classes
• $209 million market value, 6% of overall portfolio
• High quality ratings profile, Average rating “AAA”
• Diversified portfolio
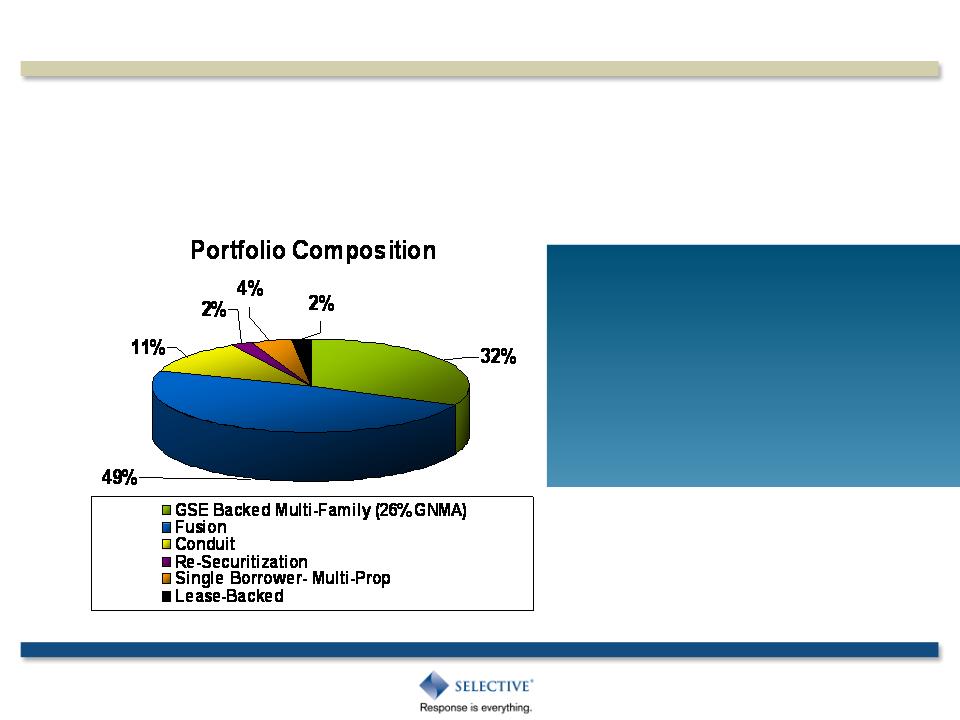
CMBS Securities - February 28, 2009
• Actions taken in first quarter:
• Sold $65 million
• Purchased $23 million GNMA-backed project loans
• Reduced exposure by 20%
• $100 million reclassified to HTM
• $11 million principal paydowns received in Q1 2009
• Received $18 million in principal paydowns in 2008
• $12 million in unrealized losses
CMBS Observations
• $165 million market value, less than 5% of portfolio
• Alternative investments outperformed S&P 500 by:
• 2,700 bps in 2008
• 1,000 bps since 1997 on an annualized basis
Challenges
• Global financial asset decline
• Accounting = Earnings volatility
• FAS 157 adding more volatility
• Credit crisis = low M&A
• Quarter lag in reporting NAVs
• Illiquidity
Alternative Investments - December 31, 2008
• No new commitments planned
• Private equity structure, no hedge fund exposure
• $119 million unfunded commitment at 12/31/08
• Expect some reduction in unfunded commitment from a few
general partners
general partners
• Distribution and contributions have slowed significantly
• Awaiting 12/31/08 net asset values
Alternative Investment Observations
• $114 million market value, 3% of total portfolio
• Equities outperformed S&P 500 for last nine years
Challenges
• Current bear market
• Extreme volatility
• Decline corporate profits
• Limited earnings visibility
• Regulatory/political risk
Equity Securities - February 28, 2009
• Actions taken in the first quarter:
• Further sales reduced gross equity exposure to approximately
$90 million
$90 million
• Including the hedge, net equity exposure of approximately
$50 million or only 1.4% of invested assets, 6% of
stockholders equity
$50 million or only 1.4% of invested assets, 6% of
stockholders equity
Equity Observations
Investment Strategy for the Current Environment
Selective’s Investment Philosophy
• Conservative buy & hold strategy
• Fundamental analysis driven decision-making
• Value-oriented investment style
• Investing for the long-term
• Confidence in the strength of our investment portfolio
Financial Highlights
Dale Thatcher
Executive Vice President
Chief Financial Officer & Treasurer
Long-Term Shareholder Value Creation
Non-cash reductions in Book Value per share | |
OTTI | $(0.65) |
Fixed Income | $(1.39) |
Equity | $(1.21) |
Pension charge | $(0.72) |
Total | $(3.97) |
2008 Market Valuation Impact on Book Value
• Moved $1.9B of fixed income securities into HTM to lock-in gains
and protect GAAP equity
• Equity exposure reduced to $90M gross, $50M net at 2/28/2009
• If the entire Alternative Investment portfolio was written-down to zero
book value per share would decrease by just $2
First Quarter Update
• Severe weather losses throughout our footprint generated
property losses of approximately $17 million in excess of
expected
property losses of approximately $17 million in excess of
expected
• Alternative investments have not yet reported 4th quarter
results
results
• Commercial lines pure price down only 1.3% through
February
February
The Journey Continues
with Sound Strategy
Greg Murphy
Chairman, President & CEO
Long Term Focus
• Foundation of financial strength
• Superior field model
• Best in class agency relationships
• Information rich to make better decisions