Exhibit 99.2

Supplemental Investor Package
First Quarter 2009
Investor Contact:
Jennifer DiBerardino
Vice President, Investor Relations
Tel: 973-948-1364
jennifer.diberardino@selective.com
SELECTIVE INSURANCE GROUP, INC. | ||
| FIRST QUARTER 2009 INVESTOR PACKET | ||
| TABLE OF CONTENTS | ||
| Earnings Press Release | 2 | |
| Selected Balance Sheet Data | 7 | |
| Selected Income Statement Data | 8 | |
| Quarterly Investment Income | 9 | |
| Statutory Combined Ratio Summary by LOB Quarter | 10 | |
| Consolidated Balance Sheets | 11 | |
| Consolidated Statements of Income | 12 | |
| Consolidated Statements of Stockholder’s Equity | 13 | |
| Consolidated Statements of Cash Flow | 14 | |
| Statutory Balance Sheets | 15 | |
| Statutory Statements of Income | 16 | |
| Investment Portfolio – Appendix | ||
| Municipal Fixed Income Portfolio Exhibit | 17 | |
| Ratings on Municipal Fixed Income Portfolio Exhibit | 18 | |
| Structured Securities Chart | 19 | |
| Structured Securities Ratings Migration | 20 | |
| RMBS & RABS Chart | 21 | |
| RMBS & RABS by Vintage Year Exhibit | 22 | |
| RMBS and RABS by Type Exhibit | 23 | |
| RMBS & RABS Ratings Migrations | 24 | |
| CMBS Chart | 25 | |
| CMBS by Vintage Year Exhibit | 26 | |
| CMBS by Type Exhibit | 27 | |
| CMBS Ratings Migration | 28 | |
| 2007 Vintage CMBS Chart | 29 | |
| 2007 Vintage CMBS Exhibit | 30 | |
| 2005 & 2006 Vintage CMBS Exhibit | 31 | |
| 2005 & 2006 Vintage CMBS Exhibit | 32 | |
| Alt-A RMBS Chart | 33 | |
| Alt-A by Vintage Year Exhibit | 34 | |
| Fixed Income Government & Agency Exposure Exhibit | 35 | |
| Fixed Maturities Severity & Duration of Unrealized/Unrecognized Losses Exhibit | 36 | |
| Credit Quality of AFS Securities Exhibit | 37 | |
| Credit Quality of HTM Securities Exhibit | 38 | |
| Selective Insurance Group, Inc. | ||||||||||||||
| Selected Balance Sheet Data (unaudited) | ||||||||||||||
($ in thousands, except per share amounts) | ||||||||||||||
| March 31, | March 31, | December 31, | ||||||||||||
| 2009 | 2008 | 2008 | ||||||||||||
| Unrecognized/ | Unrecognized/ | Unrecognized/ | ||||||||||||
| Balance | Market | Unrealized | Balance | Market | Unrealized | Balance | Market | Unrealized | ||||||
| Sheet | Value | Gain/(Loss) | Sheet | Value | Gain/(Loss) | Sheet | Value | Gain/(Loss) | ||||||
Invested Assets: | ||||||||||||||
Corporate bonds1,2 | $ | 1,053,477 | 1,047,586 | (97,934) | $ | 1,251,910 | 1,251,913 | (26,416) | $ | 1,024,179 | 1,024,181 | (124,294) | ||
Gov't\ Municipal bonds2 | 2,072,518 | 2,059,462 | 59,158 | 1,774,064 | 1,774,186 | 31,862 | 2,011,262 | 2,011,275 | 35,240 | |||||
| Total bonds | 3,125,995 | 3,107,048 | (38,776) | 3,025,974 | 3,026,099 | 5,446 | 3,035,441 | 3,035,456 | (89,054) | |||||
| Equities | 94,472 | 94,472 | (5,226) | 232,787 | 232,787 | 85,613 | 132,131 | 132,131 | 6,184 | |||||
| Short-term investments | 271,277 | 271,277 | - | 212,616 | 212,616 | - | 198,111 | 198,111 | - | |||||
| Trading securities | - | - | - | 23,148 | 23,148 | 5,861 | 2,569 | 2,569 | (1,216) | |||||
| Other investments | 153,337 | 153,337 | (16,192) | 197,097 | 197,097 | 26,109 | 172,057 | 172,057 | (5,585) | |||||
| Total invested assets | 3,645,081 | 3,626,134 | (60,194) | 3,691,622 | 3,691,747 | 123,029 | 3,540,309 | 3,540,324 | (89,671) | |||||
| Invested assets per $ of stockholders' equity | 4.00 | 3.53 | 3.98 | |||||||||||
| Total assets | 5,001,933 | 4,970,486 | 4,941,332 | |||||||||||
| Liabilities: | ||||||||||||||
| Reserve for losses | 2,273,947 | 2,199,024 | 2,256,329 | |||||||||||
| Reserve for loss expenses | 390,890 | 368,274 | 384,644 | |||||||||||
| Unearned premium reserve | 856,823 | 850,494 | 844,334 | |||||||||||
| Total liabilities | 4,091,798 | 3,924,794 | 4,050,839 | |||||||||||
| Stockholders' equity | 910,135 | 1,045,692 | 890,493 | |||||||||||
| Total debt to capitalization ratio | 23.1% | 21.5% | 23.5% | |||||||||||
Adjusted total debt to capitalization ratio 3 | 16.7% | 15.0% | 17.0% | |||||||||||
| Book value per share | 17.23 | 19.62 | 16.84 | |||||||||||
| Book value per share excluding | ||||||||||||||
| FAS 115 unrealized gain or loss on bond portfolio | 17.47 | 19.55 | 17.94 | |||||||||||
| NPW per insurance segment employee | 783 | 823 | 797 | |||||||||||
| Statutory premiums to surplus ratio | 1.8x | 1.5x | 1.7x | |||||||||||
| Statutory surplus | 849,985 | 1,016,282 | 884,431 | |||||||||||
1 Includes mortgage-backed and asset backed securities. | ||||||||||||||
2 Certain prior year amounts were reclassified to conform with currrent year presentation. | ||||||||||||||
3 The adjusted debt to capitalization ratio reflects a reduction in debt for amounts held in an irrevocable trust for the benefit of senior note holders as well as the median rating agency equity treatment of 75% applied to our $100 million Junior Subordinated Notes issued September 25, 2006. | ||||||||||||||
| Selective Insurance Group, Inc. | ||||||||||
| Selected Income Statement Data (unaudited) | ||||||||||
| March 2009 | THREE MONTHS ENDED MARCH 31, | |||||||||
| ($ in thousands, except per share amounts) | 2009 | 2008 | ||||||||
| Per diluted share | Per diluted share | |||||||||
| Consolidated | ||||||||||
| Revenue | $ | 369,565 | $ | 439,047 | ||||||
| Operating income | 2,739 | 0.05 | 19,518 | 0.36 | ||||||
| Net realized (losses) gains, after tax | (15,616 | ) | (0.30 | ) | 985 | 0.02 | ||||
| Net (loss) income | (12,877 | ) | (0.25 | ) | 20,503 | 0.38 | ||||
| Operating return on equity | 1.2% | 7.4% | ||||||||
| Insurance Operations | ||||||||||
| Gross premiums written | 436,441 | 443,979 | ||||||||
| Net premiums written | 375,783 | 391,954 | ||||||||
| Net premiums earned | 363,873 | 383,387 | ||||||||
| Underwriting (loss) profit - before tax | (2,963 | ) | 1,799 | |||||||
| - after tax | (1,926 | ) | (0.04 | ) | 1,169 | 0.02 | ||||
| GAAP combined ratio | 100.8% | 99.5% | ||||||||
| Commercial lines | ||||||||||
| Net premiums earned | 311,545 | 332,091 | ||||||||
| GAAP combined ratio | 100.1% | 98.3% | ||||||||
| Personal lines | ||||||||||
| Net premiums earned | 52,328 | 51,296 | ||||||||
| GAAP combined ratio | 105.3% | 107.3% | ||||||||
| Investments | ||||||||||
| Net investment income - before tax | 15,717 | 37,866 | ||||||||
| - after tax | 15,141 | 0.29 | 29,371 | 0.55 | ||||||
| Effective tax rate | 3.7% | 22.4% | ||||||||
| Annual after-tax yield on investment portfolio | 1.7% | 3.2% | ||||||||
| Annual after-tax, after-interest expense yield | 1.3% | 2.8% | ||||||||
| Invested assets per $ of stockholders' equity | 4.00 | 3.53 | ||||||||
| Human Resource Administration Outsourcing | ||||||||||
| Annual gross billings | 917,256 | 988,002 | ||||||||
| Revenue | 12,719 | 15,118 | ||||||||
| Income - after tax | 73 | 0.00 | 507 | 0.01 | ||||||
| Return on revenue | 0.6% | 3.4% | ||||||||
| Worksite lives | 20,381 | 24,017 | ||||||||
| Other expenses (net of other income) | ||||||||||
| Interest expense - before tax | (5,024 | ) | (5,309 | ) | ||||||
| - after tax | (3,266 | ) | (0.06 | ) | (3,451 | ) | (0.06) | |||
| Other - after tax | $ | (7,283 | ) | (0.14 | ) | $ | (8,078 | ) | (0.16) | |
| Diluted weighted avg shares outstanding | 52,352 | 53,882 | ||||||||
| Selective Insurance Group, Inc. and Consolidated Subsidiaries | |||||||||||||||
| Quarterly | |||||||||||||||
GAAP Investment Income (unaudited) | |||||||||||||||
| ($ in thousands) | |||||||||||||||
| For the three months ended | % | ||||||||||||||
| March | March | Increase | |||||||||||||
| 2009 | 2008 | (Decrease) | |||||||||||||
| Investment Income: | |||||||||||||||
| Interest: | |||||||||||||||
Fixed Maturity Securities | 36,261 | 36,406 | (0.4 | ) | |||||||||||
Short-term | 612 | 1,437 | (57.4 | ) | |||||||||||
| Alternative Investments | (20,549 | ) | 1,833 | N/M | |||||||||||
| Dividends | 515 | 1,159 | (55.6 | ) | |||||||||||
| Change in Fair Value | 262 | (1,888 | ) | 113.9 | |||||||||||
| Miscellaneous | 172 | 74 | 132.4 | ||||||||||||
| 17,273 | 39,021 | (55.7 | ) | ||||||||||||
| Investment Expense | 1,556 | 1,155 | 34.7 | ||||||||||||
| Net Investment Income Before Tax | 15,717 | 37,866 | (58.5 | ) | |||||||||||
| Tax | 576 | 8,495 | (93.2 | ) | |||||||||||
| Net Investment Income After Tax | $ | 15,141 | 29,371 | (48.4 | ) | ||||||||||
| Net Investment Income per Share | 0.29 | 0.55 | (47.3 | ) | |||||||||||
| Effective Tax Rate | 3.7 | % | 22.4 | % | |||||||||||
| Average Yields: | |||||||||||||||
| Fixed Maturity Securities | |||||||||||||||
| Pre Tax | 4.3 | % | 4.6 | % | |||||||||||
| After Tax | 3.4 | % | 3.6 | % | |||||||||||
| Portfolio | |||||||||||||||
| Pre Tax | 1.7 | % | 4.1 | % | |||||||||||
| After Tax | 1.7 | % | 3.2 | % | |||||||||||
| Year to Date | |||||||
| March | March | ||||||
| Net Realized Gains (Losses) | 2009 | 2008 | |||||
| Fixed Maturities Gains | $4,533 | $543 | |||||
| Fixed Maturities Losses | (28,368 | ) | (1,154 | ) | |||
| Total Fixed Maturities | (23,835 | ) | (611 | ) | |||
| Equity Securities Gains | 19,663 | 2,597 | |||||
| Equity Securities Losses | (19,853 | ) | (471 | ) | |||
| Total Equity Securities | (190 | ) | 2,126 | ||||
| Total | (24,025 | ) | 1,515 | ||||
| Net of Tax | (15,616 | ) | 985 | ||||
| (1) | Certain prior year amounts were reclassified to conform with current year presentation. | ||||||
| Selective Insurance Group, Inc. | ||||||||||||||||||||||||||||||||||||||||||||
| 2009 Statutory Results by Line of Business | ||||||||||||||||||||||||||||||||||||||||||||
| March 2009 YTD (unaudited) | ||||||||||||||||||||||||||||||||||||||||||||
| ($ in thousands) | ||||||||||||||||||||||||||||||||||||||||||||
Net Premiums Written | Percent Change | Net Premiums Earned | Percent Change | Loss Ratio | LAE Ratio | Underwriting Expense Ratio | Dividends to Policyholders Ratio | Combined Ratio 2009 | Combined Ratio 2008 | Underwriting Gain/(Loss) | ||||||||||||||||||||||||||||||||||
| Personal Lines: | ||||||||||||||||||||||||||||||||||||||||||||
| Homeowners | $ | 15,351 | 8.8 | % | $ | 17,106 | 3.2 | % | 84.1 | % | 8.7 | % | 37.4 | % | 0.0 | % | 130.2 | % | 111.8 | % | $ | (4,508 | ) | |||||||||||||||||||||
| Auto | 32,639 | (2.8 | )% | 32,852 | 0.8 | % | 56.3 | % | 13.8 | % | 30.5 | % | 0.0 | % | 100.6 | % | 113.4 | % | $ | (134 | ) | |||||||||||||||||||||||
| Other (including flood) | 2,352 | 13.6 | % | 2,371 | 11.9 | % | 75.7 | % | (10.9 | )% | (31.4 | )% | 0.0 | % | 33.4 | % | 1.1 | % | 1,573 | |||||||||||||||||||||||||
| Total | $ | 50,342 | 1.2 | % | $ | 52,328 | 2.0 | % | 66.3 | % | 11.0 | % | 29.7 | % | 0.0 | % | 107.0 | % | 107.8 | % | $ | (3,069 | ) | |||||||||||||||||||||
| Commercial Lines: | ||||||||||||||||||||||||||||||||||||||||||||
| Fire/IM | $ | 50,234 | 4.1 | % | $ | 48,885 | (2.1 | )% | 59.5 | % | 4.8 | % | 37.3 | % | (0.6 | )% | 101.0 | % | 96.6 | % | $ | (995 | ) | |||||||||||||||||||||
| Workers compensation | 72,176 | (10.1 | )% | 70,377 | (10.3 | )% | 51.5 | % | 14.6 | % | 24.6 | % | 1.8 | % | 92.5 | % | 94.5 | % | 4,836 | |||||||||||||||||||||||||
| General liability | 99,804 | (10.3 | )% | 94,224 | (8.8 | )% | 54.0 | % | 18.2 | % | 32.5 | % | (0.3 | )% | 104.4 | % | 97.1 | % | (5,927 | ) | ||||||||||||||||||||||||
| Auto | 79,859 | (0.4 | )% | 75,846 | (4.3 | )% | 60.6 | % | 7.2 | % | 28.6 | % | (0.3 | )% | 96.1 | % | 100.1 | % | 1,772 | |||||||||||||||||||||||||
| BOP | 16,377 | 7.8 | % | 15,210 | 7.6 | % | 71.8 | % | 12.2 | % | 33.8 | % | 0.0 | % | 117.8 | % | 105.1 | % | (3,099 | ) | ||||||||||||||||||||||||
| Bonds | 4,339 | (4.3 | )% | 4,623 | (3.2 | )% | 23.1 | % | 4.9 | % | 59.4 | % | 0.0 | % | 87.4 | % | 81.1 | % | 750 | |||||||||||||||||||||||||
| Other | 2,652 | 7.9 | % | 2,380 | 4.4 | % | (2.1 | )% | 0.8 | % | 43.1 | % | 0.0 | % | 41.8 | % | 47.9 | % | 1,268 | |||||||||||||||||||||||||
| Total | $ | 325,441 | (4.9 | )% | $ | 311,545 | (6.2 | )% | 55.9 | % | 12.0 | % | 31.1 | % | 0.1 | % | 99.1 | % | 96.9 | % | $ | (1,394 | ) | |||||||||||||||||||||
| Grand Total | $ | 375,783 | (4.1 | )% | $ | 363,873 | (5.1 | )% | 57.4 | % | 11.9 | % | 30.8 | % | 0.1 | % | 100.2 | % | 98.3 | % | $ | (4,463 | ) | |||||||||||||||||||||
| Note: Some amounts may not foot due to rounding. | ||||||||||||||||||||||||||||||||||||||||||||
| 2009 | 2008 | |||||||||||||||||||||||||||||||||||||||||||
| Losses Paid | $ | 195,792 | $ | 188,840 | ||||||||||||||||||||||||||||||||||||||||
| LAE Paid | 36,685 | 34,461 | ||||||||||||||||||||||||||||||||||||||||||
| Total Paid | $ | 232,477 | $ | 223,301 | ||||||||||||||||||||||||||||||||||||||||
| SELECTIVE INSURANCE GROUP, INC. | Unaudited | |||||||
| CONSOLIDATED BALANCE SHEETS | March 31, | December 31, | ||||||
| ($ in thousands, except share amounts) | 2009 | 2008 | ||||||
| ASSETS | ||||||||
| Investments: | ||||||||
| Fixed maturity securities, held-to-maturity – at amortized cost | ||||||||
(fair value of: $1,867,519 – 2009; $1,178 – 2008) | $ | 1,886,466 | 1,163 | |||||
| Fixed maturity securities, available-for-sale – at fair value | ||||||||
(amortized cost of: $1,265,228 – 2009; $3,123,346 – 2008) | 1,239,529 | 3,034,278 | ||||||
| Equity securities, available-for-sale – at fair value | ||||||||
(cost of: $99,698 – 2009; $125,947 – 2008) | 94,472 | 132,131 | ||||||
| Short-term investments – at cost which approximates fair value | 271,277 | 198,111 | ||||||
| Equity securities, trading – at fair value | - | 2,569 | ||||||
| Other investments | 153,337 | 172,057 | ||||||
| Total investments | 3,645,081 | 3,540,309 | ||||||
| Cash and cash equivalents | 12,631 | 18,643 | ||||||
| Interest and dividends due or accrued | 35,555 | 36,538 | ||||||
| Premiums receivable, net of allowance for uncollectible | ||||||||
accounts of: $5,251 – 2009; $4,237 – 2008 | 483,237 | 480,894 | ||||||
| Other trade receivables, net of allowance for uncollectible | ||||||||
accounts of: $306 – 2009; $299 – 2008 | 21,799 | 19,461 | ||||||
| Reinsurance recoverable on paid losses and loss expenses | 5,262 | 6,513 | ||||||
| Reinsurance recoverable on unpaid losses and loss expenses | 228,303 | 224,192 | ||||||
| Prepaid reinsurance premiums | 97,196 | 96,617 | ||||||
| Current federal income tax | 2,483 | 26,327 | ||||||
| Deferred federal income tax | 140,484 | 146,801 | ||||||
| Property and equipment – at cost, net of accumulated | ||||||||
depreciation and amortization of: $135,712 – 2009; $132,609 – 2008 | 49,706 | 51,697 | ||||||
| Deferred policy acquisition costs | 213,669 | 212,319 | ||||||
| Goodwill | 29,637 | 29,637 | ||||||
| Other assets | 36,890 | 51,384 | ||||||
Total assets | $ | 5,001,933 | 4,941,332 | |||||
| LIABILITIES AND STOCKHOLDERS’ EQUITY | ||||||||
| Liabilities: | ||||||||
| Reserve for losses | $ | 2,273,947 | 2,256,329 | |||||
| Reserve for loss expenses | 390,890 | 384,644 | ||||||
| Unearned premiums | 856,823 | 844,334 | ||||||
| Notes payable | 273,885 | 273,878 | ||||||
| Commissions payable | 31,653 | 48,560 | ||||||
| Accrued salaries and benefits | 125,139 | 147,050 | ||||||
| Other liabilities | 139,461 | 96,044 | ||||||
Total liabilities | 4,091,798 | 4,050,839 | ||||||
| Stockholders' Equity: | ||||||||
Preferred stock of $0 par value per share: Authorized shares: 5,000,000; no shares issued or outstanding | ||||||||
| Common stock of $2 par value per share: | ||||||||
| Authorized shares: 360,000,000 | ||||||||
Issued: 95,376,045 – 2009; 95,263,508 – 2008 | 190,752 | 190,527 | ||||||
| Additional paid-in capital | 221,835 | 217,195 | ||||||
| Retained earnings | 1,108,335 | 1,128,149 | ||||||
| Accumulated other comprehensive income | (63,420 | ) | (100,666 | ) | ||||
| Treasury stock – at cost (shares: 42,556,303 – 2009; 42,386,921 – 2008) | (547,367 | ) | (544,712 | ) | ||||
Total stockholders' equity | 910,135 | 890,493 | ||||||
Commitments and contingencies | ||||||||
Total liabilities and stockholders' equity | $ | 5,001,933 | 4,941,332 | |||||
| SELECTIVE INSURANCE GROUP, INC. | ||||||||
| UNAUDITED CONSOLIDATED STATEMENTS OF INCOME | Quarters ended | |||||||
| March 31, | ||||||||
| ($ in thousands, except per share amounts) | 2009 | 2008 | ||||||
| Revenues: | ||||||||
| Net premiums written | $ | 375,783 | 391,954 | |||||
Net increase in unearned premiums and prepaid reinsurance premiums | �� | (11,910 | ) | (8,567 | ) | |||
| Net premiums earned | 363,873 | 383,387 | ||||||
| Net investment income earned | 15,717 | 37,866 | ||||||
| Net realized (losses) gains | (24,025 | ) | 1,515 | |||||
| Other income | 14,000 | 16,279 | ||||||
Total revenues | 369,565 | 439,047 | ||||||
| Expenses: | ||||||||
| Losses incurred | 209,089 | 210,130 | ||||||
| Loss expenses incurred | 43,105 | 42,946 | ||||||
| Policy acquisition costs | 113,106 | 127,677 | ||||||
| Dividends to policyholders | 465 | 535 | ||||||
| Interest expense | 5,024 | 5,309 | ||||||
| Other expenses | 19,698 | 25,848 | ||||||
Total expenses | 390,487 | 412,445 | ||||||
| (Loss) income before federal income tax | (20,922 | ) | 26,602 | |||||
| Federal income tax (benefit) expense: | ||||||||
| Current | 5,694 | 11,135 | ||||||
| Deferred | (13,739 | ) | (5,036 | ) | ||||
Total federal income tax (benefit) expense | (8,045 | ) | 6,099 | |||||
| Net (loss) income | $ | (12,877 | ) | 20,503 | ||||
| Earnings per share: | ||||||||
Basic net (loss) income | $ | (0.25 | ) | 0.39 | ||||
Diluted net (loss) income | $ | (0.25 | ) | 0.38 | ||||
| Dividends to stockholders | $ | 0.13 | 0.13 | |||||
| SELECTIVE INSURANCE GROUP, INC. | ||||||||||||||||||
| UNAUDITED CONSOLIDATED STATEMENTS OF | ||||||||||||||||||
| STOCKHOLDERS’ EQUITY | ||||||||||||||||||
| Quarters ended March 31, | ||||||||||||||||||
| ($ in thousands, except per share amounts) | 2009 | 2008 | ||||||||||||||||
| Common stock: | ||||||||||||||||||
| Beginning of year | $ | 190,527 | 189,306 | |||||||||||||||
| Dividend reinvestment plan | ||||||||||||||||||
(shares: 36,670 – 2009; 19,298 – 2008) | 73 | 38 | ||||||||||||||||
| Convertible debentures | ||||||||||||||||||
(shares: 45,759 – 2008) | - | 92 | ||||||||||||||||
| Stock purchase and compensation plans | ||||||||||||||||||
(shares: 75,867 – 2009; 133,339 – 2008) | 152 | 267 | ||||||||||||||||
| End of period | 190,752 | 189,703 | ||||||||||||||||
| Additional paid-in capital: | ||||||||||||||||||
| Beginning of year | 217,195 | 192,627 | ||||||||||||||||
| Dividend reinvestment plan | 373 | 429 | ||||||||||||||||
| Convertible debentures | - | 645 | ||||||||||||||||
| Stock purchase and compensation plans | 4,267 | 10,088 | ||||||||||||||||
| End of period | 221,835 | 203,789 | ||||||||||||||||
| Retained earnings: | ||||||||||||||||||
| Beginning of year | 1,128,149 | 1,105,946 | ||||||||||||||||
| Cumulative-effect adjustment due to adoption of FAS 159, | ||||||||||||||||||
| net of deferred income tax effect of $3,344 | - | 6,210 | ||||||||||||||||
| Net (loss) income | (12,877 | ) | (12,877 | ) | 20,503 | 20,503 | ||||||||||||
| Cash dividends to stockholders ($0.13 per share – 2009; | ||||||||||||||||||
$0.13 per share – 2008) | (6,937 | ) | (7,062 | ) | ||||||||||||||
| End of period | 1,108,335 | 1,125,597 | ||||||||||||||||
| Accumulated other comprehensive (loss) income: | ||||||||||||||||||
| Beginning of year | (100,666 | ) | 86,043 | |||||||||||||||
| Cumulative-effect adjustment due to adoption of FAS 159, | ||||||||||||||||||
| net of deferred income tax effect of $(3,344) | - | (6,210 | ) | |||||||||||||||
| Other comprehensive income (loss) increase (decrease) in: | ||||||||||||||||||
| Net unrealized gains (losses) on investment securities, | ||||||||||||||||||
| net of deferred income tax effect of | ||||||||||||||||||
| $20,152 – 2009, $(14,357) – 2008 | 37,425 | 37,425 | (26,663 | ) | (26,663 | ) | ||||||||||||
| Defined benefit pension plans, net of deferred income tax effect of | ||||||||||||||||||
| $(97) – 2009; $19 – 2008 | (179 | ) | (179 | ) | 35 | 35 | ||||||||||||
| End of period | (63,420 | ) | 53,205 | |||||||||||||||
| Comprehensive income (loss) | 24,369 | (6,125 | ) | |||||||||||||||
| Treasury stock: | ||||||||||||||||||
| Beginning of year | (544,712 | ) | (497,879 | ) | ||||||||||||||
| Acquisition of treasury stock | ||||||||||||||||||
(shares: 169,382 – 2009; 1,196,663 – 2008) | (2,655 | ) | (28,723 | ) | ||||||||||||||
| End of period | (547,367 | ) | (526,602 | ) | ||||||||||||||
| Total stockholders’ equity | $ | 910,135 | 1,045,692 | |||||||||||||||
| SELECTIVE INSURANCE GROUP, INC. | |||
| UNAUDITED CONSOLIDATED STATEMENTS OF CASH FLOW | Quarters ended March 31, | ||
| ($ in thousands) | 2009 | 2008 | |
| Operating Activities | ||||||||
| Net (loss) income | $ | (12,877 | ) | 20,503 | ||||
| Adjustments to reconcile net (loss) income to net cash provided by operating activities: | ||||||||
| Depreciation and amortization | 6,788 | 7,129 | ||||||
| Stock-based compensation expense | 3,238 | 8,896 | ||||||
| Undistributed losses of equity method investments | 20,549 | 980 | ||||||
| Net realized losses (gains) | 24,025 | (1,515 | ) | |||||
| Postretirement life curtailment benefit | (4,217 | ) | - | |||||
| Deferred tax benefit | (13,739 | ) | (5,036 | ) | ||||
| Unrealized (gain) loss on trading securities | (262 | ) | 1,888 | |||||
| Changes in assets and liabilities: | ||||||||
| Increase in reserves for losses and loss expenses, net of reinsurance recoverable | ||||||||
on unpaid losses and loss expenses | 20,019 | 29,598 | ||||||
| Increase in unearned premiums, net of prepaid reinsurance and advance premiums | 11,497 | 8,295 | ||||||
| Decrease/increase in net federal income tax recoverable/payable | 23,844 | 9,854 | ||||||
| Increase in premiums receivable | (2,343 | ) | (185 | ) | ||||
| Increase in other trade receivables | (2,338 | ) | (618 | ) | ||||
| (Increase) Decrease in deferred policy acquisition costs | (1,350 | ) | 876 | |||||
| Decrease in interest and dividends due or accrued | 1,012 | 1,033 | ||||||
| Decrease in reinsurance recoverable on paid losses and loss expenses | 1,251 | 122 | ||||||
| Decrease in accrued salaries and benefits | (16,211 | ) | (11,724 | ) | ||||
| Decrease in accrued insurance expenses | (14,221 | ) | (24,950 | ) | ||||
| Purchase of trading securities | - | (4,530 | ) | |||||
| Sale of trading securities | 2,831 | 4,696 | ||||||
| Other-net | 7,424 | 641 | ||||||
| Net adjustments | 67,797 | 25,450 | ||||||
| Net cash provided by operating activities | 54,920 | 45,953 | ||||||
| Investing Activities | ||||||||
| Purchase of fixed maturity securities, held-to-maturity | (50,408 | ) | - | |||||
| Purchase of fixed maturity securities, available-for-sale | (216,000 | ) | (77,944 | ) | ||||
| Purchase of equity securities, available-for-sale | (60,100 | ) | (7,212 | ) | ||||
| Purchase of other investments | (4,620 | ) | (15,506 | ) | ||||
| Purchase of short-term investments | (601,637 | ) | (341,234 | ) | ||||
| Sale of fixed maturity securities, available-for-sale | 168,019 | 30,452 | ||||||
| Sale of short-term investments | 528,471 | 318,696 | ||||||
| Redemption and maturities of fixed maturity securities, held-to-maturity | 34,097 | 1,492 | ||||||
| Redemption and maturities of fixed maturity securities, available-for-sale | 51,666 | �� | 79,566 | |||||
| Sale of equity securities, available-for-sale | 86,318 | 6,995 | ||||||
| Proceeds from other investments | 14,499 | 2,609 | ||||||
| Purchase of property and equipment | (1,360 | ) | (1,825 | ) | ||||
| Net cash used in investing activities | (51,055 | ) | (3,911 | ) | ||||
| Financing Activities | ||||||||
| Dividends to stockholders | (6,955 | ) | (6,572 | ) | ||||
| Acquisition of treasury stock | (2,655 | ) | (28,723 | ) | ||||
| Net proceeds from stock purchase and compensation plans | 885 | 2,196 | ||||||
| Excess tax benefits from share-based payment arrangements | (1,152 | ) | 1,265 | |||||
| Principal payments of convertible debt | - | (8,754 | ) | |||||
| Net cash used in financing activities | (9,877 | ) | (40,588 | ) | ||||
| Net (decrease) increase in cash and cash equivalents | (6,012 | ) | 1,454 | |||||
| Cash and cash equivalents, beginning of year | 18,643 | 8,383 | ||||||
| Cash and cash equivalents, end of period | $ | 12,631 | 9,837 | |||||
Supplemental Disclosures of Cash Flow Information
| Cash paid (received) during the year for: | ||||||||
| Interest | $ | $1,875 | 1,968 | |||||
| Federal income tax | (17,000 | ) | - | |||||
| Supplemental schedule of non-cash financing activity: | ||||||||
| Conversion of convertible debentures | - | 169 | ||||||
| Selective Insurance Group, Inc. | |||||||||
Combined Insurance Company Subsidiaries | |||||||||
| Unaudited Statutory Balance Sheets | |||||||||
| ($ in thousands) | |||||||||
| March 31 | December 31 | ||||||||
| 2009 | 2008* | ||||||||
| ASSETS | |||||||||
| Bonds | $ | 3,112,564 | 3,104,395 | ||||||
Common stocks | 94,472 | 134,700 | |||||||
| Affiliated mortgage loan | 39,855 | 40,000 | |||||||
| Other investments | 153,634 | 172,346 | |||||||
| Short-term investments | 209,957 | 137,878 | |||||||
| Total investments | 3,610,482 | 3,589,319 | |||||||
| Cash on hand and in banks | (32,603 | ) | (36,472 | ) | |||||
| Interest and dividends due and accrued | 35,716 | 36,523 | |||||||
| Premiums receivable | 480,317 | 476,768 | |||||||
| Reinsurance recoverable on paid losses and expenses | 5,262 | 6,513 | |||||||
| Federal income tax recoverable | - | 12,069 | |||||||
| Deferred tax recoverable | 88,964 | 86,208 | |||||||
| EDP equipment | 3,246 | 3,815 | |||||||
| Equities and deposits in pools and associations | 8,220 | 8,517 | |||||||
| Receivable for sold securities | 1,355 | 13,278 | |||||||
| Capital contribution receivable | 20,000 | - | |||||||
| Other assets | 26,317 | 28,719 | |||||||
| Total assets | $ | 4,247,276 | 4,225,257 | ||||||
| LIABILITIES | |||||||||
| Reserve for losses | $ | 2,045,009 | 2,031,947 | ||||||
| Reinsurance payable on paid loss and loss expense | 912 | 716 | |||||||
| Reserve for loss expenses | 389,245 | 382,796 | |||||||
| Unearned premiums | 759,627 | 747,717 | |||||||
| Reserve for commissions payable | 31,653 | 48,560 | |||||||
| Ceded balances payable | 10,840 | 8,421 | |||||||
| Federal income tax payable | 14,515 | - | |||||||
| Premium and other taxes payable | 23,407 | 20,721 | |||||||
| Reserve for dividends to policyholders | 4,134 | 5,023 | |||||||
| Reserves for unauthorized/overdue reinsurance | 1,416 | 1,416 | |||||||
| Payable for securities | 36,149 | - | |||||||
| Funds withheld on account of others | 6,210 | 4,977 | |||||||
| Accrued salaries and benefits | 57,511 | 74,287 | |||||||
| Other liabilities | 16,663 | 14,245 | |||||||
| Total liabilities | 3,397,291 | 3,340,826 | |||||||
| POLICYHOLDERS' SURPLUS | |||||||||
| Capital | 28,325 | 28,325 | |||||||
| Paid in surplus | 235,792 | 235,792 | |||||||
| Unassigned surplus | 585,868 | 620,314 | |||||||
| Total policyholders' surplus | 849,985 | 884,431 | |||||||
| Total liabilities and policyholders' surplus | $ | 4,247,276 | 4,225,257 | ||||||
| *December 31, 2008 results include a retroactive affiliate transaction involving Selective Insurance Company of America, Selective Insurance Group, Inc., and Wantage Avenue Holding Company, Inc. | |||||||||
| Selective Insurance Group, Inc. | |||||||||||||||||||
Combined Insurance Company Subsidiaries | |||||||||||||||||||
| Unaudited Statutory Statements Of Income | |||||||||||||||||||
| ($ in thousands) | |||||||||||||||||||
Three Months Ended | |||||||||||||||||||
| March | |||||||||||||||||||
UNDERWRITING | 2009 | 2008 | |||||||||||||||||
| Net premiums written | $ | 375,783 | 391,953 | ||||||||||||||||
| Net premiums earned | 363,873 | 383,387 | |||||||||||||||||
| Net losses paid | 195,792 | 188,840 | |||||||||||||||||
| Change in reserve for losses | 13,062 | 21,284 | |||||||||||||||||
| Net losses incurred | 208,854 | 57.4 | % | 210,124 | 54.8 | % | |||||||||||||
| Net loss expenses paid | 36,685 | 34,461 | |||||||||||||||||
| Change in reserve for loss expenses | 6,451 | 8,279 | |||||||||||||||||
| Net loss expenses incurred | 43,136 | 11.9 | % | 42,740 | 11.1 | % | |||||||||||||
| Net underwriting expenses incurred | 115,813 | 30.8 | % | 126,486 | 32.3 | % | |||||||||||||
| Total deductions | 367,803 | 379,350 | |||||||||||||||||
| Statutory (loss) gain | (3,930 | ) | 4,037 | ||||||||||||||||
| Net loss from premium balances charged off | (1,334 | ) | (653 | ) | |||||||||||||||
| Finance charges and other income | 1,266 | 691 | |||||||||||||||||
| Total other (expense) income | (68 | ) | 0.0 | % | 38 | 0.0 | % | ||||||||||||
| Policyholders' dividends incurred | (465 | ) | 0.1 | % | (535 | ) | 0.1 | % | |||||||||||
| Total underwriting (loss) gain | (4,463 | ) | 100.2 | % | 3,540 | 98.3 | % | ||||||||||||
INVESTMENT | |||||||||||||||||||
| Net investment income earned | 26,054 | 40,248 | |||||||||||||||||
| Net realized (loss) gain | (24,978 | ) | 3,320 | ||||||||||||||||
| Total (loss) income before income tax | (3,387 | ) | 47,108 | ||||||||||||||||
| Federal income tax expense | 9,584 | 14,694 | |||||||||||||||||
| Net (loss) income | $ | (12,971 | ) | 32,414 | |||||||||||||||
| Policyholders' Surplus | |||||||||||||||||||
| Surplus, beginning of period | $ | 884,431 | 1,034,294 | ||||||||||||||||
| Net (loss) income | (12,971 | ) | 32,414 | ||||||||||||||||
| Change in deferred tax | 15,052 | 1,411 | |||||||||||||||||
| Change in unrealized (losses) | (22,061 | ) | (18,115 | ) | |||||||||||||||
Dividends to stockholders | (12,003 | ) | (24,540 | ) | |||||||||||||||
| Paid in surplus | 20,000 | - | |||||||||||||||||
| Change in non-admitted assets | (22,463 | ) | (9,087 | ) | |||||||||||||||
| Surplus adjustments | - | (95 | ) | ||||||||||||||||
| Net change in surplus for period | (34,446 | ) | (18,012 | ) | |||||||||||||||
| Surplus, end of period | $ | 849,985 | 1,016,282 | ||||||||||||||||
| Statutory underwriting (loss) gain: | $ | (4,463 | ) | 3,540 | |||||||||||||||
Adjustments under GAAP: | |||||||||||||||||||
| Deferred policy acquisition costs | 1,351 | (876 | ) | ||||||||||||||||
| Other, net | 149 | (865 | ) | ||||||||||||||||
| GAAP underwriting (loss) gain | $ | (2,963 | ) | 1,799 | |||||||||||||||
| Note: Some amounts or ratios may not foot due to rounding. | |||||||||||||||||||
| Certain amounts have been reclassified to conform to the current year's presentation. | |||||||||||||||||||
| Selective Insurance Group, Inc. and Consolidated Subsidiaries | |||||||||||||
| Municipal Fixed Income Portfolio as of March 31, 2009 | |||||||||||||
| ($ in millions) | |||||||||||||
| (unaudited) | |||||||||||||
| Average | Market | % of Total | Unrealized/ Unrecognized | ||||||||||
| Credit Rating | Value | Muni Portfolio | Gain/(Loss) | ||||||||||
| Uninsured Securities | AA+ | 908 | 53 | % | $26 | ||||||||
Securities with Insurance Enhanced1 | AA+ | 807 | 47 | % | 22 | ||||||||
| Without Insurance Enhancement | AA- | ||||||||||||
| Total | $ | 1,715 | 100 | % | $48 | ||||||||
1 Includes $25.7 million of unrated municipal fixed income securities which are considered to be investment grade. | |||||
| A "BBB-" rating has been applied to these municipal fixed income securities in the interest of conservatism. | |||||
| Note: Some amounts may not foot due to rounding. | |||||
| Selective Insurance Group, Inc. and Consolidated Subsidiaries | ||||||||||
| Ratings on Municipal Fixed Income Portfolio | ||||||||||
| March 31, 2009 | ||||||||||
| ($ in millions) | ||||||||||
| (unaudited) | ||||||||||
Uninsured Securities (1) | Insurance Enhanced Securities1 (2) | Underlying Rating of Insurance Enhanced Securities1 (3) | Total Municipal Fixed Income Portfolio (with Insurance Enhancement) (1) + (2) | Total Municipal Fixed Income Portfolio (without Insurance Enhancement) (1) + (3) | ||||||
| Ratings | Market Value | % of Total | Market Value | % of Total | Market Value | % of Total | Market Value | % of Total | Market Value | % of Total |
| AAA | $ 481 | 53% | $ 221 | 27% | $ 63 | 8% | $ 702 | 41% | $ 545 | 32% |
| AA+ | 150 | 16% | 85 | 11% | 102 | 13% | 235 | 14% | 252 | 15% |
| AA | 151 | 17% | 111 | 14% | 142 | 17% | 261 | 16% | 292 | 17% |
| AA- | 70 | 8% | 327 | 41% | 242 | 30% | 398 | 23% | 313 | 18% |
| A+ | 28 | 3% | 10 | 1% | 87 | 11% | 39 | 2% | 115 | 7% |
| A | - | 0% | 40 | 5% | 75 | 9% | 40 | 2% | 75 | 4% |
| A- | 18 | 2% | 10 | 1% | 57 | 7% | 28 | 2% | 75 | 4% |
| BBB+ | 1 | 0% | 3 | 0% | 9 | 1% | 4 | 0% | 9 | 1% |
| BBB | 7 | 1% | - | 0% | - | 0% | 7 | 0% | 7 | 0% |
| BBB- | - | 0% | - | 0% | 30 | 4% | - | 0% | 30 | 2% |
| BB+ | 2 | 0% | - | 0% | - | 0% | 2 | 0% | 2 | 0% |
| Total | $ 908 | 100% | $ 807 | 100% | $ 807 | 100% | $ 1,715 | 100% | $ 1,715 | 100% |
| Average Rating: | AA+ | AA+ | AA- | AA+ | AA | |||||
| Unrealized/Unrecognized Gain/(Loss): | 26 | 22 | 48 | |||||||
1 Includes $25.7 million of unrated municipal fixed income securities which are considered to be investment grade. | |||||||
| A "BBB-" rating has been applied to these municipal fixed income securities in the interest of conservatism. | |||||||
| Note: Some amounts may not foot due to rounding. | |||||||
Selective Insurance Group, Inc. and Consolidated Subsidiaries
Structured Securities
March 31, 2009
($ in thousands)
(unaudited)
 | 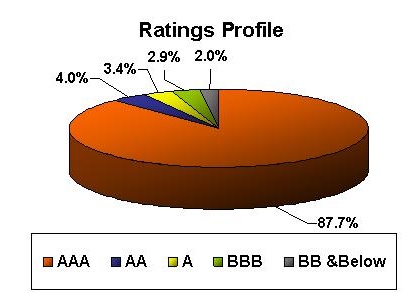 |
| •Market Value = $608,564 ; Unrealized Gain/(Loss) = ($81,370) | |
| •Held to Maturity (HTM) 50%; Available for Sale (AFS) 50% | |
| •Structured Security Portfolio Average Rating = AA+ | |
| •Structured Securities = 16.8% of the Total Portfolio |
Selective Insurance Group Inc. and Consolidated Subsidiaries | ||||||||
Structured Securities | ||||||||
Ratings Migration (1) | ||||||||
March 31, 2009 | ||||||||
($ in thousands) | ||||||||
(unaudited) | ||||||||
Original Rating | Current Rating | |||||||
Rating | Amount | AAA | AA | A | BBB | BB | B | CC |
AAA | $ 567,592 | 529,172 | 6,954 | 8,549 | 14,811 | 6,722 | 1,384 | - |
AA | 25,452 | 4,796 | 17,432 | 2,028 | - | 291 | - | 905 |
A | 9,881 | - | - | 9,881 | - | - | - | - |
BBB | 2,889 | - | - | - | 2,580 | 309 | - | - |
BB | 2,750 | - | - | - | - | 2,750 | - | - |
Total Market Value | $ 608,564 | 533,968 | 24,386 | 20,458 | 17,391 | 10,072 | 1,384 | 905 |
Note (1): Migration period is from the purchase date of each security to March 31, 2009 | ||||||||
Selective Insurance Group, Inc. and Consolidated Subsidiaries
Residential Mortgage Backed (RMBS) and Residential ABS (RABS) Securities
March 31, 2009
($ in thousands)
(unaudited)
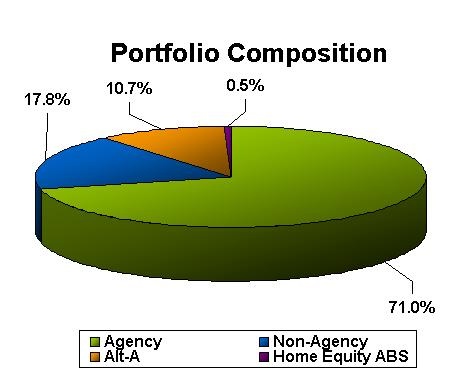 | 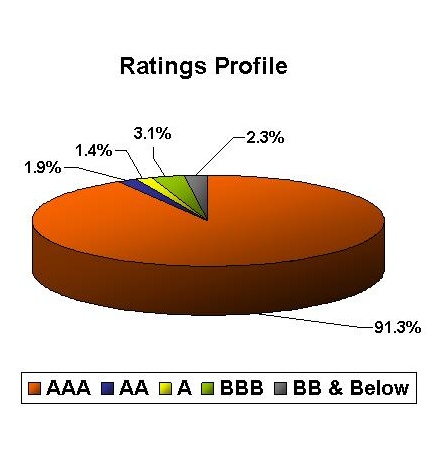 |
| •Market Value = $380,840; Unrealized Gain/(Loss) = ($38,135) | |
| •Held to Maturity (HTM) 45%; Available for Sale (AFS) 55% | |
| •RMBS & RABS Portfolio Average Rating = AA+ | |
| •RMBS & RABS Securities = 10.5% of the Total Portfolio |
| Selective Insurance Group Inc. and Consolidated Subsidiaries | |||||||||||
| Residential Mortgage Backed Securities (RMBS) and Residential ABS (RABS)- by Vintage Year | |||||||||||
| March 31, 2009 | |||||||||||
($ in thousands) | |||||||||||
(unaudited) | |||||||||||
| Market Value | |||||||||||
Vintage Yr | AAA | AA | A | BBB | BB | B | CC | Total | % of Total RMBS & RABS | % of Total Fixed Income Portfolio | % of Total GAAP Equity | |||||||||||||||||||||||||||||||||
1983 | $ | 16 | $ | - | $ | - | $ | - | $ | - | $ | - | $ | - | $ | 16 | 0 | % | 0 | % | 0 | % | ||||||||||||||||||||||
2002 | 60,840 | - | 1,927 | - | - | - | - | 62,767 | 16 | % | 2 | % | 7 | % | ||||||||||||||||||||||||||||||
2003 | 60,357 | - | 904 | - | - | - | - | 61,262 | 16 | % | 2 | % | 7 | % | ||||||||||||||||||||||||||||||
2004 | 42,712 | 1,426 | - | - | - | - | - | 44,138 | 12 | % | 1 | % | 5 | % | ||||||||||||||||||||||||||||||
2005 | 50,689 | - | - | - | - | - | - | 50,689 | 13 | % | 2 | % | 6 | % | ||||||||||||||||||||||||||||||
2006 | 69,051 | 4,193 | - | 11,427 | 6,468 | 1,384 | 905 | 93,428 | 25 | % | 3 | % | 10 | % | ||||||||||||||||||||||||||||||
2007 | 9,427 | 1,620 | 2,483 | 411 | - | - | - | 13,942 | 4 | % | 0 | % | 1 | % | ||||||||||||||||||||||||||||||
2008 | 28,537 | - | - | - | - | - | - | 28,537 | 7 | % | 1 | % | 3 | % | ||||||||||||||||||||||||||||||
2009 | 26,060 | - | - | - | - | - | - | 26,060 | 7 | % | 1 | % | 3 | % | ||||||||||||||||||||||||||||||
Total RMBS & RABS-Market Value | $ | 347,691 | $ | 7,239 | $ | 5,314 | $ | 11,838 | $ | 6,468 | $ | 1,384 | $ | 905 | $ | 380,840 | 100 | % | 12 | % | 42 | % | ||||||||||||||||||||||
% of Total RMBS & RABS | 91 | % | 2 | % | 2 | % | 3 | % | 2 | % | 0 | % | 0 | % | 100 | % | ||||||||||||||||||||||||||||
% of Total Fixed Income Portfolio | 11 | % | 0 | % | 0 | % | 1 | % | 0 | % | 0 | % | 0 | % | 12 | % | ||||||||||||||||||||||||||||
% of Total GAAP Equity | 38 | % | 1 | % | 1 | % | 1 | % | 1 | % | 0 | % | 0 | % | 42 | % | ||||||||||||||||||||||||||||
Weighted Average Market Price | 90.9 | 61.5 | 30.6 | 60.7 | 43.1 | 46.1 | 10.0 | 83.1 | ||||||||||||||||||||||||||||||||||||
Unrealized/Unrecognized Gain/(Loss) | ||||||||||||||||||||||||||||||||||||||||||||
Vintage Yr | AAA | AA | A | BBB | BB | B | CC | Total | ||||||||||||||||||||||||||||||||||||
1983 | $ | 1 | $ | - | $ | - | $ | - | $ | - | $ | - | $ | - | $ | 1 | ||||||||||||||||||||||||||||
2002 | 1,237 | - | (457 | ) | - | - | - | - | 781 | |||||||||||||||||||||||||||||||||||
2003 | 160 | - | (1,431 | ) | - | - | - | - | (1,271 | ) | ||||||||||||||||||||||||||||||||||
2004 | (1,822 | ) | (384 | ) | - | - | - | - | - | (2,206 | ) | |||||||||||||||||||||||||||||||||
2005 | (12,761 | ) | - | - | - | - | - | - | (12,761 | ) | ||||||||||||||||||||||||||||||||||
2006 | (8,781 | ) | (1,982 | ) | - | (87 | ) | (2,101 | ) | (754 | ) | - | (13,705 | ) | ||||||||||||||||||||||||||||||
2007 | 102 | (1,075 | ) | (8,439 | ) | (308 | ) | - | - | - | (9,721 | ) | ||||||||||||||||||||||||||||||||
2008 | 638 | - | - | - | - | - | - | 638 | ||||||||||||||||||||||||||||||||||||
2009 | 109 | - | - | - | - | - | - | 109 | ||||||||||||||||||||||||||||||||||||
Total RMBS & RABS - Unrealized/Unrecognized | $ | (21,117 | ) | $ | (3,441 | ) | $ | (10,327 | ) | $ | (395 | ) | $ | (2,101 | ) | $ | (754 | ) | $ | - | $ | (38,135 | ) | |||||||||||||||||||||
% of Total RMBS & RABS | 55 | % | 9 | % | 27 | % | 1 | % | 6 | % | 2 | % | 0 | % | 100 | % | ||||||||||||||||||||||||||||
Note: Some amounts may not foot due to rounding. | ||||||||||||||||||||||||||||||||||||||||||||
| Selective Insurance Group Inc. and Consolidated Subsidiaries | |||||||||||
| Residential Mortgage Backed Securities (RMBS) and Residential ABS (RABS)- by Type | |||||||||||
| March 31, 2009 | |||||||||||
| ($ in thousands) | |||||||||||
| (unaudited) | |||||||||||
| Market Value | |||||||||||
RMBS Type | AAA | AA | A | BBB | BB | B | CC | Total | % of Total RMBS & RABS | % of Total Fixed Income Portfolio | % of Total GAAP Equity | |||||||||||||||||||||||||||||||||
Agency | $ | 260,221 | $ | - | $ | - | $ | - | $ | - | $ | - | $ | - | $ | 260,221 | 68 | % | 9 | % | 29 | % | ||||||||||||||||||||||
FHA/VA | 10,252 | - | - | - | - | - | - | 10,252 | 3 | % | 0 | % | 1 | % | ||||||||||||||||||||||||||||||
Total Agency | 270,473 | - | - | - | - | - | - | 270,473 | 71 | % | 9 | % | 30 | % | ||||||||||||||||||||||||||||||
Alt-A | 30,289 | 1,426 | - | 3,210 | 3,571 | 1,384 | - | 39,880 | 10 | % | 1 | % | 4 | % | ||||||||||||||||||||||||||||||
Alt-A CDO | - | - | - | - | - | - | 905 | 905 | 0 | % | 0 | % | 0 | % | ||||||||||||||||||||||||||||||
Home Equity ABS | - | - | 1,927 | - | - | - | - | 1,927 | 1 | % | 0 | % | 0 | % | ||||||||||||||||||||||||||||||
Non-Agency & Other Prime | 46,929 | 5,814 | 3,387 | 8,628 | 2,897 | - | - | 67,656 | 18 | % | 2 | % | 8 | % | ||||||||||||||||||||||||||||||
Total RMBS & RABS-Market Value | $ | 347,691 | $ | 7,239 | $ | 5,314 | $ | 11,838 | $ | 6,468 | $ | 1,384 | $ | 905 | $ | 380,840 | 100 | % | 12 | % | 42 | % | ||||||||||||||||||||||
% of Total RMBS & RABS | 91 | % | 2 | % | 2 | % | 3 | % | 2 | % | 0 | % | 0 | % | 100 | % | ||||||||||||||||||||||||||||
% of Total Fixed Income Portfolio | 11 | % | 0 | % | 0 | % | 1 | % | 0 | % | 0 | % | 0 | % | 12 | % | ||||||||||||||||||||||||||||
% of Total GAAP Equity | 38 | % | 1 | % | 1 | % | 1 | % | 1 | % | 0 | % | 0 | % | 42 | % | ||||||||||||||||||||||||||||
Weighted Average Market Price | 90.9 | 61.5 | 30.6 | 60.7 | 43.1 | 46.1 | 10.0 | 83.1 | ||||||||||||||||||||||||||||||||||||
Unrealized/Unrecognized Gain/(Loss) | ||||||||||||||||||||||||||||||||||||||||||||
RMBS Type | AAA | AA | A | BBB | BB | B | CC | Total | ||||||||||||||||||||||||||||||||||||
Agency | $ | 7,684 | $ | - | $ | - | $ | - | $ | - | $ | - | $ | - | $ | 7,684 | ||||||||||||||||||||||||||||
FHA/VA | (1,888 | ) | - | - | - | - | - | - | (1,888 | ) | ||||||||||||||||||||||||||||||||||
Total Agency | 5,796 | - | - | - | - | - | - | 5,796 | ||||||||||||||||||||||||||||||||||||
Alt-A | (11,907 | ) | (384 | ) | - | - | - | (754 | ) | - | (13,046 | ) | ||||||||||||||||||||||||||||||||
Alt-A CDO | - | - | - | - | - | - | - | - | ||||||||||||||||||||||||||||||||||||
Home Equity ABS | - | - | (457 | ) | - | - | - | - | (457 | ) | ||||||||||||||||||||||||||||||||||
Non-Agency & Other Prime | (15,006 | ) | (3,057 | ) | (9,871 | ) | (395 | ) | (2,101 | ) | - | - | (30,428 | ) | ||||||||||||||||||||||||||||||
Total RMBS & RABS - Unrealized/Unrecognized | $ | (21,117 | ) | $ | (3,441 | ) | $ | (10,327 | ) | $ | (395 | ) | $ | (2,101 | ) | $ | (754 | ) | $ | - | $ | (38,135 | ) | |||||||||||||||||||||
% of Total RMBS & RABS | 55 | % | 9 | % | 27 | % | 1 | % | 6 | % | 2 | % | 0 | % | 100 | % | ||||||||||||||||||||||||||||
Selective Insurance Group Inc. and Consolidated Subsidiaries | ||||||||
Residential Mortgage Backed (RMBS) and Asset Backed (RABS) Securities | ||||||||
Ratings Migration (1) | ||||||||
March 31, 2009 | ||||||||
($ in thousands) | ||||||||
(unaudited) | ||||||||
Original Rating | Current Rating | |||||||
Rating | Amount | AAA | AA | A | BBB | BB | B | CC |
AAA | $ 374,385 | 347,560 | 5,619 | 1,927 | 11,427 | 6,468 | 1,384 | |
AA | 4,685 | 132 | 1,620 | 2,028 | - | - | - | 905 |
A | 1,359 | - | - | 1,359 | - | - | - | - |
BBB | $ 411 | - | - | - | 411 | - | - | - |
BB | - | - | - | - | - | - | - | - |
Total Market Value | 380,840 | 347,692 | 7,239 | 5,314 | 11,838 | 6,468 | 1,384 | 905 |
Note (1): Migration period is from the purchase date of each security to March 31, 2009 | ||||||||
Selective Insurance Group, Inc. and Consolidated Subsidiaries
Commercial Mortgage Backed (CMBS) Securities
March 31, 2009
($ in thousands)
(unaudited)
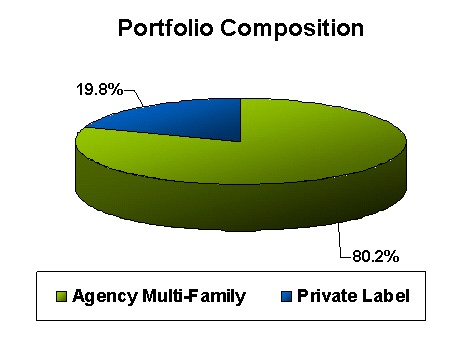
 |  |
| • Market Value = $171,204; Unrealized Gain/(Loss) = ($33,438) | ||||
| • Held to Maturity (HTM) 60%; Available for Sale (AFS) 40% | ||||
| • CMBS Portfolio Average Rating = AAA | ||||
| • CMBS Securities = 4.7% of the Total Portfolio | ||||
| Selective Insurance Group Inc. and Consolidated Subsidiaries | |||||||||
| Commercial Mortgage Backed Securities (CMBS) - by Vintage Year | |||||||||
| March 31, 2009 | |||||||||
| ($ in thousands) | |||||||||
| (unaudited) | |||||||||
| Market Value | |||||||||
Vintage Yr | AAA | AA | A | BBB | BB | Total | % of Total CMBS | % of Total Fixed Income Portfolio | % of Total GAAP Equity | |||||||||||||||||||||||||||
1996 | $ | 5,022 | $ | - | $ | - | $ | - | $ | - | $ | 5,022 | 3 | % | 0 | % | 0 | % | ||||||||||||||||||
1999 | 6,940 | - | - | - | - | 6,940 | 4 | % | 0 | % | 1 | % | ||||||||||||||||||||||||
2000 | 28,317 | - | - | - | - | 28,317 | 17 | % | 1 | % | 3 | % | ||||||||||||||||||||||||
2001 | 26,704 | - | - | - | - | 26,704 | 16 | % | 1 | % | 3 | % | ||||||||||||||||||||||||
2002 | 15,902 | - | - | - | - | 15,902 | 9 | % | 1 | % | 2 | % | ||||||||||||||||||||||||
2003 | 1,830 | - | - | - | - | 1,830 | 1 | % | 0 | % | 0 | % | ||||||||||||||||||||||||
2004 | 8,499 | - | - | - | - | 8,499 | 5 | % | 0 | % | 1 | % | ||||||||||||||||||||||||
2005 | 951 | - | 1,029 | 718 | 254 | 2,952 | 2 | % | 0 | % | 0 | % | ||||||||||||||||||||||||
2006 | 21,208 | 1,335 | - | 1,945 | - | 24,488 | 14 | % | 1 | % | 3 | % | ||||||||||||||||||||||||
2007 | 45,817 | - | - | 1,383 | 3,350 | 50,550 | 30 | % | 2 | % | 6 | % | ||||||||||||||||||||||||
Total CMBS-Market Value | $ | 161,190 | $ | 1,335 | $ | 1,029 | $ | 4,046 | $ | 3,604 | $ | 171,204 | 100 | % | 6 | % | 19 | % | ||||||||||||||||||
% of Total CMBS | 94 | % | 1 | % | 1 | % | 2 | % | 2 | % | 100 | % | ||||||||||||||||||||||||
% of Total Fixed Income Portfolio | 5 | % | 0 | % | 0 | % | 1 | % | 0 | % | 6 | % | ||||||||||||||||||||||||
% of Total GAAP Equity | 18 | % | 0 | % | 0 | % | 0 | % | 1 | % | 19 | % | ||||||||||||||||||||||||
Weighted Average Market Price | 95.3 | 38.1 | 23.0 | 20.5 | 19.5 | 79.5 | ||||||||||||||||||||||||||||||
Unrealized/Unrecognized Gain/(Loss) | ||||||||||||||||||||||||||||||||||||
Vintage Yr | AAA | AA | A | BBB | BB | Total | ||||||||||||||||||||||||||||||
1996 | $ | (234 | ) | $ | - | $ | - | $ | - | $ | - | $ | (234 | ) | ||||||||||||||||||||||
1999 | 38 | - | - | - | - | 38 | ||||||||||||||||||||||||||||||
2000 | 137 | - | - | - | - | 137 | ||||||||||||||||||||||||||||||
2001 | 815 | - | - | - | - | 815 | ||||||||||||||||||||||||||||||
2002 | 782 | - | - | - | - | 782 | ||||||||||||||||||||||||||||||
2003 | (174 | ) | - | - | - | - | (174 | ) | ||||||||||||||||||||||||||||
2004 | (1,000 | ) | - | - | - | - | (1,000 | ) | ||||||||||||||||||||||||||||
2005 | (634 | ) | - | (3,443 | ) | (4,081 | ) | (2,568 | ) | (10,728 | ) | |||||||||||||||||||||||||
2006 | (5,216 | ) | 751 | - | (7,673 | ) | - | (12,138 | ) | |||||||||||||||||||||||||||
2007 | (3,247 | ) | - | - | (1,970 | ) | (5,720 | ) | (10,937 | ) | ||||||||||||||||||||||||||
Total CMBS-Unrealized/Unrecognized | $ | (8,733 | ) | $ | 751 | $ | (3,443 | ) | $ | (13,724 | ) | $ | (8,289 | ) | $ | (33,438 | ) | |||||||||||||||||||
% of Total CMBS | 26 | % | -2 | % | 10 | % | 41 | % | 25 | % | 100 | % | ||||||||||||||||||||||||
Note: Some amounts may not foot due to rounding. | ||||||||||||||||||||||||||||||||||||
| Selective Insurance Group Inc. and Consolidated Subsidiaries | |||||||||
| Commercial Mortgage Backed Securities (CMBS) - by Type | |||||||||
| March 31, 2009 | |||||||||
| ($ thousands) | |||||||||
| (unaudited) | |||||||||
| Market Value | ||||||||||||||||||||||||||||||||||||
CMBS Type | AAA | AA | A | BBB | BB | Total | % of Total CMBS | % of Total Fixed Income Portfolio | % of Total GAAP Equity | |||||||||||||||||||||||||||
Agency MultiFamily | $ | 90,968 | $ | - | $ | - | $ | - | $ | - | $ | 90,968 | 53 | % | 3 | % | 10 | % | ||||||||||||||||||
Conduit | 11,252 | - | - | - | - | 11,252 | 7 | % | 1 | % | 1 | % | ||||||||||||||||||||||||
Fusion (1) | 48,565 | - | - | 851 | 600 | 50,016 | 29 | % | 2 | % | 6 | % | ||||||||||||||||||||||||
Lease-Backed | 4,148 | - | - | - | - | 4,148 | 2 | % | 0 | % | 0 | % | ||||||||||||||||||||||||
Re-Securitization | 1,231 | 1,335 | 1,029 | 1,945 | 254 | 5,794 | 3 | % | 0 | % | 1 | % | ||||||||||||||||||||||||
Single Borrower - Multiple Properties | 5,026 | - | - | 1,250 | 2,750 | 9,026 | 5 | % | 0 | % | 1 | % | ||||||||||||||||||||||||
Total CMBS-Market Value | $ | 161,190 | $ | 1,335 | $ | 1,029 | $ | 4,046 | $ | 3,604 | $ | 171,204 | 100 | % | 6 | % | 19 | % | ||||||||||||||||||
% of Total CMBS | 94 | % | 1 | % | 1 | % | 2 | % | 2 | % | 100 | % | ||||||||||||||||||||||||
% of Total Fixed Income Portfolio | 5 | % | 0 | % | 0 | % | 1 | % | 0 | % | 6 | % | ||||||||||||||||||||||||
% of Total GAAP Equity | 18 | % | 0 | % | 0 | % | 0 | % | 1 | % | 19 | % | ||||||||||||||||||||||||
Weighted Average Market Price | 95.3 | 38.1 | 23.0 | 20.5 | 19.5 | 79.5 | ||||||||||||||||||||||||||||||
Unrealized/Unrecognized Gain/(Loss) | ||||||||||||||||||||||||||||||||||||
CMBS Type | AAA | AA | A | BBB | BB | Total | ||||||||||||||||||||||||||||||
Agency MultiFamily | $ | 3,383 | $ | - | $ | - | $ | - | $ | - | $ | 3,383 | ||||||||||||||||||||||||
Conduit | (89 | ) | - | - | - | - | (89 | ) | ||||||||||||||||||||||||||||
Fusion (1) | (7,815 | ) | - | - | (5,301 | ) | (3,470 | ) | (16,586 | ) | ||||||||||||||||||||||||||
Lease-Backed | 40 | - | - | - | - | 40 | ||||||||||||||||||||||||||||||
Re-Securitization | (4,240 | ) | 751 | (3,443 | ) | (7,673 | ) | (2,569 | ) | (17,174 | ) | |||||||||||||||||||||||||
Single Borrower - Multiple Properties | (12 | ) | - | - | (750 | ) | (2,250 | ) | (3,012 | ) | ||||||||||||||||||||||||||
Total CMBS-Unrealized/Unrecognized | $ | (8,733 | ) | $ | 751 | $ | (3,443 | ) | $ | (13,724 | ) | $ | (8,289 | ) | $ | (33,438 | ) | |||||||||||||||||||
% of Total CMBS | 26 | % | -2 | % | 10 | % | 41 | % | 25 | % | 100 | % | ||||||||||||||||||||||||
(1) Fusion means a CMBS composed of large and small loans.
Note: Some amounts may not foot due to rounding.
Selective Insurance Group Inc. and Consolidated Subsidiaries | ||||||
Commercial Mortgage Backed Securities (CMBS) | ||||||
Ratings Migration (1) | ||||||
March 31, 2009 | ||||||
($ in thousands) | ||||||
(unaudited) | ||||||
Original Rating | Current Rating | |||||
Rating | Amount | AAA | AA | A | BBB | BB |
AAA | $ 161,088 | 156,525 | 1,335 | 1,029 | 1,945 | 254 |
AA | 4,956 | 4,665 | - | - | - | 291 |
A | - | - | - | - | - | - |
BBB | 2,410 | - | - | - | 2,101 | 309 |
BB | 2,750 | - | - | - | - | 2,750 |
Total Market Value | $ 171,204 | 161,190 | 1,335 | 1,029 | 4,046 | 3,604 |
Note (1): Migration period is from the purchase date of each security to March 31, 2009 | ||||||
Selective Insurance Group, Inc. and Consolidated Subsidiaries
2007 Vintage Commercial Mortgage Backed (CMBS) Securities
March 31, 2009
($ in thousands)
(unaudited)
 | 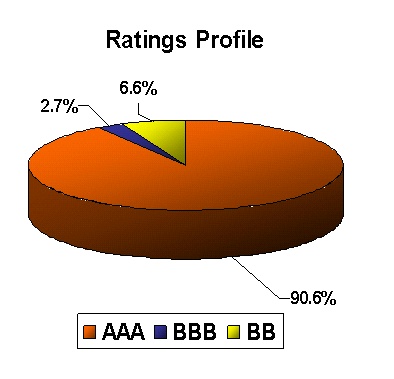 |
| •Market Value = $50,550; Unrealized Gain/(Loss) = ($10,937) | |
| •Held to Maturity (HTM) 41%; Available for Sale (AFS) 59% | |
| •2007 Vintage CMBS Portfolio Average Rating = AA+ | |
| •2007 Vintage CMBS Securities = 1.6% of the Fixed Income Portfolio | |
| •2007 Vintage CMBS Securities = 1.4% of the Total Portfolio | |
| •2007 Vintage CMBS Securities = 5.5% of GAAP Equity |
| Selective Insurance Group Inc. and Consolidated Subsidiaries | |||||||
| 2007 Vintage Commercial Mortgage Backed Securities (CMBS) | |||||||
| March 31, 2009 | |||||||
| ($ in thousands) | |||||||
| (unaudited) | |||||||
| Market Value | ||||||||||||||||||||||||||||
CMBS Type | AAA | BBB | BB | Total | % of 2007 Vintage CMBS | % of Total Fixed Income Portfolio | % of Total GAAP Equity | |||||||||||||||||||||
Agency MultiFamily | $ | 40,531 | $ | - | $ | - | $ | 40,531 | 80 | % | 1 | % | 4 | % | ||||||||||||||
Fusion (1) | 5,286 | 133 | 600 | 6,020 | 12 | % | 0 | % | 1 | % | ||||||||||||||||||
Single Borrower - Multiple Properties | - | 1,250 | 2,750 | 4,000 | 8 | % | 1 | % | 1 | % | ||||||||||||||||||
2007 Vintage CMBS-Market Value | $ | 45,817 | $ | 1,383 | $ | 3,350 | $ | 50,550 | 100 | % | 2 | % | 6 | % | ||||||||||||||
% of 2007 Vintage CMBS | 91 | % | 2 | % | 7 | % | 100 | % | ||||||||||||||||||||
% of Total Fixed Income Portfolio | 1 | % | 0 | % | 1 | % | 2 | % | ||||||||||||||||||||
% of Total GAAP Equity | 5 | % | 0 | % | 1 | % | 6 | % | ||||||||||||||||||||
Weighted Average Market Price | 93.3 | 27.7 | 21.4 | 72.5 | ||||||||||||||||||||||||
Unrealized/Unrecognized Gain/(Loss) | ||||||||||||||||||||||||||||
CMBS Type | AAA | BBB | BB | Total | ||||||||||||||||||||||||
Agency MultiFamily | $ | 1,491 | $ | - | $ | - | $ | 1,491 | ||||||||||||||||||||
Fusion (1) | (4,737 | ) | (1,220 | ) | (3,470 | ) | (9,427 | ) | ||||||||||||||||||||
Single Borrower - Multiple Properties | - | (750 | ) | (2,250 | ) | (3,000 | ) | |||||||||||||||||||||
2007 Vintage CMBS-Unrealized/Unrecognized | $ | (3,247 | ) | $ | (1,970 | ) | $ | (5,720 | ) | $ | (10,937 | ) | ||||||||||||||||
% of 2007 Vintage CMBS | 30 | % | 18 | % | 52 | % | 100 | % | ||||||||||||||||||||
(1) Fusion means a CMBS composed of large and small loans
Note: Some amounts may not foot due to rounding.
Selective Insurance Group, Inc. and Consolidated Subsidiaries
2005 & 2006 Vintage Commercial Mortgage Backed (CMBS) Securities
March 31, 2009
($ in thousands)
(unaudited)
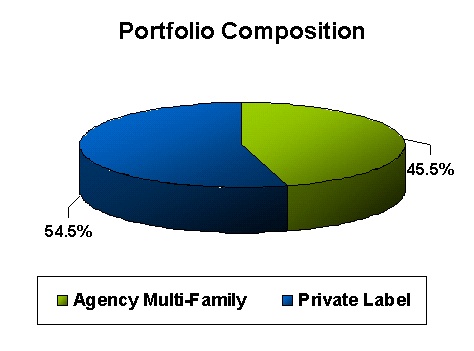 | 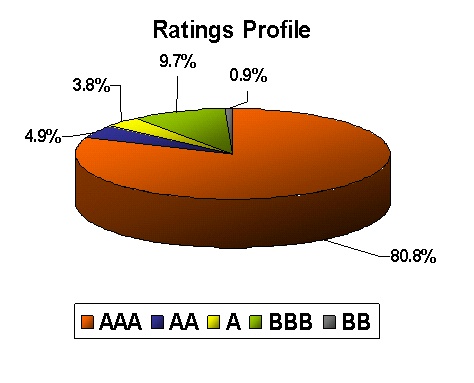 |
| •Market Value = $27,440; Unrealized Gain/(Loss) = ($22,866) | |
| •Held to Maturity (HTM) 54%; Available for Sale (AFS) 46% | |
| •2005 & 2006 Vintage CMBS Portfolio Average Rating = AA+ | |
| •2005 & 2006 Vintage CMBS Securities = 0.9% of the Fixed Income Portfolio | |
| •2005 & 2006 Vintage CMBS Securities = 0.8% of the Total Portfolio | |
| •2005 & 2006 Vintage CMBS Securities = 3.0% of GAAP Equity |
| Selective Insurance Group Inc. and Consolidated Subsidiaries | |||||||||
| 2005 & 2006 Vintage Commercial Mortgage Backed Securities (CMBS) | |||||||||
| March 31, 2009 | |||||||||
| ($ in thousands) | |||||||||
| (unaudited) | |||||||||
| Market Value | |||||||||
CMBS Type | AAA | AA | A | BBB | BB | Total | % of 2005 & 2006 Vintage CMBS | % of Total Fixed Income Portfolio | % of Total GAAP Equity |
Agency MultiFamily | $ 12,497 | $ - | $ - | $ - | $ - | $ 12,497 | 46% | 1% | 1% |
Fusion (1) | 8,431 | - | - | 718 | - | 9,149 | 33% | 0% | 1% |
Single Borrower - Multiple Properties | 1,231 | 1,335 | 1,029 | 1,945 | 254 | 5,794 | 21% | 0% | 1% |
2005 & 2006 Vintage CMBS-Market Value | $ 22,159 | $ 1,335 | $ 1,029 | $ 2,663 | $ 254 | $ 27,440 | 100% | 1% | 3% |
% of 2007 Vintage CMBS | 81% | 5% | 3% | 10% | 1% | 100% | |||
% of Total Fixed Income Portfolio | 1% | 0% | 0% | 0% | 0% | 1% | |||
% of Total GAAP Equity | 2% | 0% | 0% | 0% | 1% | 3% | |||
Weighted Average Market Price | 80.3 | 38.1 | 23.0 | 18.1 | 9.0 | 51.7 | |||
Unrealized/Unrecognized Gain/(Loss) | |||||||||
CMBS Type | AAA | AA | A | BBB | BB | Total | |||
Agency MultiFamily | $ (41) | $ - | $ - | $ - | $ - | $ (41) | |||
Fusion (1) | (1,569) | - | - | (4,081) | - | (5,650) | |||
Single Borrower - Multiple Properties | (4,240) | 751 | (3,443) | (7,673) | (2,568) | (17,174) | |||
2005 & 2006 Vintage CMBS-Unrealized/Unrecognized | $ (5,850) | $ 751 | $ (3,443) | $ (11,754) | $ (2,568) | $ (22,866) | |||
% of 2005 & 2006 Vintage CMBS | 26% | -3% | 15% | 51% | 11% | 100% | |||
(1) Fusion means a CMBS composed of large and small loans | |||||||||
| Note: Some amounts may not foot due to rounding. | |||||||||
Selective Insurance Group, Inc. and Consolidated Subsidiaries
Alt-A RMBS Securities
March 31, 2009
($ in thousands)
(unaudited)
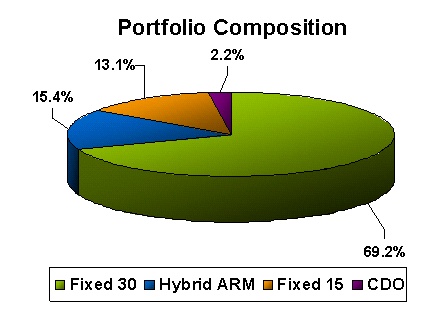 |  |
| •Market Value = $40,785; Unrealized Gain/(Loss) = ($13,046) | ||
| •Held to Maturity (HTM) 2%; Available for Sale (AFS) 98% | ||
| •Alt-A RMBS Portfolio Average Rating = AA | ||
| •Alt-A RMBS Securities = 1.1% of the Total Portfolio | ||
| -Fixed-30 Loan-to-Value Ratio = 72.6% | ||
| -Hybrid ARM Loan-to-Value Ratio = 71.9% | ||
| -Fixed-15 Loan-to-Value Ratio = 42.2% | ||
| Selective Insurance Group, Inc. and Consolidated Subsidiaries |
| ALT-A by Vintage Year |
| March 31, 2009 |
| ($ in thousands) |
| (unaudited) |
| Market Value |
| Vintage Yr | ALT-A Fixed-15 | Alt-A Fixed-30 | Alt-A Hybrid ARM | Alt-A CDO | Total | % of Total Alt-A | % of Total Fixed Income Portfolio | % of Total GAAP Equity |
| 2002 | $ 5,340 | $ - | $ - | $ - | $ 5,340 | 13% | 0% | 0% |
| 2003 | - | 1,698 | 430 | - | 2,128 | 5% | 0% | 0% |
| 2004 | - | 2,043 | 1,535 | - | 3,578 | 9% | 0% | 0% |
| 2005 | - | 2,993 | 2,396 | - | 5,389 | 13% | 0% | 1% |
| 2006 | - | 21,509 | 1,936 | 905 | 24,350 | 60% | 1% | 3% |
| Total ALT-A, Market Value | $ 5,340 | $ 28,243 | $ 6,297 | $ 905 | $ 40,785 | 100% | 1% | 4% |
| % of Total ALT-A | 13% | 69% | 16% | 2% | 100% | |||
| % of Total Fixed Income Portfolio | 0% | 1% | 0% | 0% | 1% | |||
| % of Total GAAP Equity | 0% | 3% | 1% | 0% | 4% | |||
| Weighted Average Market Price | 99.8 | 45.3 | 54.5 | 10.0 | 46.2 | |||
| Unrealized/Unrecognized Gain/(Loss) | ||||||||
| Vintage Yr | ALT-A Fixed-15 | Alt-A Fixed-30 | Alt-A Hybrid ARM | Alt-A CDO | Total | |||
| 2002 | $ (9) | $ - | $ - | $ - | $ (9) | |||
| 2003 | - | (338) | (69) | - | (407) | |||
| 2004 | - | (260) | (443) | - | (703) | |||
| 2005 | - | (681) | (2,225) | - | (2,906) | |||
| *2006 | - | (6,573) | (2,448) | - | (9,021) | |||
| Total ALT-A, Unrealized/Unrecognized | $ (9) | $ (7,852) | $ (5,185) | $ - | $ (13,046) | |||
| % of Total ALT-A | 0% | 60% | 40% | 0% | 100% | |||
*Alt-A purchases in 3Q06 were halted—no 2007 or later vintage in portfolio.
Note: Some amounts may not foot due to rounding.
Selective Insurance Group, Inc. and Consolidated Subsidiaries
Fixed Income Government & Agency Exposure
March 31, 2009
($ in thousands)
(unaudited)
Unrecognized/ Unrealized | |||||||||
| Market Value | Gains | ||||||||
| US Government | |||||||||
| Small Business Adm | $ | 36,143 | $ | 1,079 | |||||
US Treasury (1) | 39,686 | 5,479 | |||||||
Other US Govt Guaranteed (2) | 96,156 | 1,640 | |||||||
| Total US Government | 171,985 | 8,198 | |||||||
| Government Agency Debt | |||||||||
| Fannie Mae | 40,316 | 351 | |||||||
| Freddie Mac | 40,301 | 301 | |||||||
| 80,617 | 652 | ||||||||
| Federal Farm Credit Bank | 47,523 | 293 | |||||||
| Federal Home Loan Bank | 31,122 | 943 | |||||||
| Tenn Valley Authority | 13,526 | 1,177 | |||||||
| 92,171 | 2,413 | ||||||||
| Total Govt Agency Debt | 172,788 | 3,065 | |||||||
| Total US Government Obligations | 344,773 | 11,263 | |||||||
| Agency MBS | |||||||||
| Fannie Mae | 78,201 | 2,381 | |||||||
| Freddie Mac | 107,728 | 2,408 | |||||||
Total Agency MBS(3) | 185,929 | 4,789 | |||||||
| Total Government & Agency Exposure | $ | 530,702 | $ | 16,052 | |||||
(1) $24.0 Million market value on deposit. |
(2) U.S. Government includes corporate securities fully guaranteed by the Federal Deposit Insurance Corporation (FDIC). |
(3) Included in the portfolios are $177.7 million market value of Ginnie Mae MBS which benefit from a direct government guarantee. |
| Note: Some amounts may not foot due to rounding. |
| Selective Insurance Group, Inc. and Consolidated Subsidiaries | ||||||||
| Fixed Maturity Securities | ||||||||
| Severity and Duration of Unrealized/Unrecognized Losses | ||||||||
| March 31, 2009 | ||||||||
| ($ in millions) | ||||||||
| (unaudited) | ||||||||
Unrealized/ Unrecognized | Fair | |||||||
| Fair Value as a Percentage of Amortized Cost | (Loss) Gain | Value | ||||||
| 85% but less than 100% of amortized cost | $ | (21.3 | ) | 573.4 | ||||
| 75% or more but less than 85% of amortized cost | (16.7 | ) | 72.3 | |||||
| Less than 75% of amortized cost | (93.3 | ) | 90.5 | |||||
| Gross unrealized/unrecognized losses on fixed maturity securities | (131.3 | ) | 736.2 | |||||
| Gross unrealized/unrecognized gains on fixed maturity securities | 92.5 | 2,370.8 | ||||||
| Net unrealized/unrecognized losses on fixed maturity securities | $ | (38.8 | ) | 3,107.0 | ||||
| 75% or more but less than 85% of Amortized Cost/ | Less than 75% of Amortized Cost/ | |||||||
| Duration of Unrealized/Unrecognized Loss Position | Carry Value | Carry Value | ||||||
| 0 – 3 months | $ | (5.0 | ) | (7.9 | ) | |||
| 4 – 6 months | (10.2 | ) | (24.6 | ) | ||||
| 7 – 9 months | (1.5 | ) | (15.5 | ) | ||||
| 10 – 12 months | - | (7.6 | ) | |||||
| Greater than 12 months | - | (37.7 | ) | |||||
| Gross unrealized/unrecognized losses | $ | (16.7 | ) | (93.3 | ) | |||
| Selective Insurance Group, Inc. and Consolidated Subsidiaries | ||||||||||||||||||||||||
| Credit Quality of Available for Sale Securities | ||||||||||||||||||||||||
| March 31, 2009 | ||||||||||||||||||||||||
| ($ in millions) | ||||||||||||||||||||||||
| (unaudited) | ||||||||||||||||||||||||
| March 31, 2009 | December 31, 2008 | |||||||||||||||||||||||
| Fair Value | Unrealized Gain (Loss) | Credit Quality | Fair Value | Unrealized Gain (Loss) | Credit Quality | |||||||||||||||||||
| AFS Portfolio: | ||||||||||||||||||||||||
U.S. government obligations1 | $ | 177.7 | 2.6 | AAA | 252.2 | 16.6 | AAA | |||||||||||||||||
| State and municipal obligations | 451.0 | 21.8 | AA+ | 1,758.0 | 18.6 | AA+ | ||||||||||||||||||
| Corporate securities | 305.5 | (9.7 | ) | A | 366.5 | (22.9 | ) | A | ||||||||||||||||
| Mortgage-backed securities | 278.6 | (37.6 | ) | AA+ | 596.2 | (86.1 | ) | AA+ | ||||||||||||||||
| Asset-backed securities ("ABS") | 26.7 | (2.8 | ) | AA | 61.4 | (15.3 | ) | AA | ||||||||||||||||
| Total AFS portfolio | $ | 1,239.5 | (25.7 | ) | AA+ | 3,034.3 | (89.1 | ) | AA+ | |||||||||||||||
| State and Municipal Obligations: | ||||||||||||||||||||||||
| Government obligations | $ | 251.2 | 12.0 | AA+ | 574.1 | 16.2 | AA+ | |||||||||||||||||
| Special revenue obligations | 199.8 | 9.8 | AA+ | 1,183.9 | 2.4 | AA+ | ||||||||||||||||||
| Total state and municipal obligations | $ | 451.0 | 21.8 | AA+ | 1,758.0 | 18.6 | AA+ | |||||||||||||||||
| Corporate Securities: | ||||||||||||||||||||||||
| Financial | $ | 63.2 | (8.2 | ) | AA- | 101.0 | (13.1 | ) | A+ | |||||||||||||||
| Industrials | 41.4 | 1.0 | A | 67.7 | (2.1 | ) | A- | |||||||||||||||||
| Utilities | 27.5 | (0.3 | ) | A- | 47.6 | (0.8 | ) | A | ||||||||||||||||
| Consumer discretion | 29.8 | (1.0 | ) | A | 33.9 | (1.5 | ) | A- | ||||||||||||||||
| Consumer staples | 43.2 | 1.3 | A | 42.0 | 0.5 | A | ||||||||||||||||||
| Health care | 35.5 | 1.6 | AA | 22.7 | 0.7 | A+ | ||||||||||||||||||
| Materials | 12.3 | (2.7 | ) | A- | 13.2 | (3.7 | ) | BBB+ | ||||||||||||||||
| Energy | 30.0 | 1.0 | A+ | 19.1 | (0.2 | ) | A- | |||||||||||||||||
| Information technology | 10.2 | (1.8 | ) | BBB- | 10.1 | (1.9 | ) | BBB | ||||||||||||||||
| Telecommunications services | 12.4 | (0.6 | ) | A- | 9.2 | (0.8 | ) | A- | ||||||||||||||||
| Total corporate securities | $ | 305.5 | (9.7 | ) | A | 366.5 | (22.9 | ) | A | |||||||||||||||
| Mortgage-backed securities: | ||||||||||||||||||||||||
| Agency CMBS | $ | 68.5 | 2.8 | AAA | 72.9 | 2.8 | AAA | |||||||||||||||||
| Non-agency CMBS | - | - | - | 154.3 | (34.8 | ) | AAA | |||||||||||||||||
| Agency RMBS | 103.3 | 3.0 | AAA | 245.5 | 4.2 | AAA | ||||||||||||||||||
| Non-agency RMBS | 66.9 | (30.3 | ) | AA+ | 74.3 | (28.4 | ) | AA+ | ||||||||||||||||
Alternative-A ("Alt-A") RMBS | 39.9 | (13.1 | ) | AA+ | 49.2 | (29.9 | ) | AA+ | ||||||||||||||||
Total MBS | $ | 278.6 | (37.6 | ) | AA+ | 596.2 | (86.1 | ) | AA+ | |||||||||||||||
| Asset-backed securities: | ||||||||||||||||||||||||
| ABS | $ | 26.7 | (2.8 | ) | AA | 59.3 | (15.1 | ) | AA+ | |||||||||||||||
| Alt-A ABS | - | - | - | 0.9 | - | B | ||||||||||||||||||
Sub-prime ABS2 | - | - | - | 1.2 | (0.2 | ) | A | |||||||||||||||||
Total ABS | $ | 26.7 | (2.8 | ) | AA | 61.4 | (15.3 | ) | AA | |||||||||||||||
1 U.S. Governemnt includes coporate securities fully guaranteed by the FDIC. | ||||||||||||||||||||||||
2 Sub-prime exposure is defined as exposure to direct and indirect investments in non-agency residential mortgages with average FICO® scores below 650. | ||||||||||||||||||||||||
Unrealized gains (losses) represent market value fluctuations from the later of: (i) the date a security is designated as available for sale; or (ii) the date that an other-than-temporary impairment charge is recognized, through the end of the reporting period.
| Selective Insurance Group, Inc. and Consolidated Subsidiaries | ||||||||||||||||||||||||
Credit Quality of Held to Maturity Securities | ||||||||||||||||||||||||
| March 31, 2009 | ||||||||||||||||||||||||
| ($ in millions) | ||||||||||||||||||||||||
| (unaudited) | ||||||||||||||||||||||||
| Fair Value | Carry Value | Unrecognized Holding Gain (Loss) | Unrealized Gain (Loss) in Other Comprehensive Income | Total Unrealized / Unrecognized Gain (Loss) | Credit Quality | |||||||||||||||||||
HTM Fixed Maturity Portfolio1: | ||||||||||||||||||||||||
| U.S. government obligations | $ | 167.1 | 165.6 | 1.5 | 7.2 | 8.7 | AAA | |||||||||||||||||
| State and municipal obligations | 1,263.7 | 1,278.2 | (14.5 | ) | 40.6 | 26.1 | AA+ | |||||||||||||||||
| Corporate securities | 133.5 | 133.1 | 0.4 | (7.3 | ) | (6.9 | ) | A | ||||||||||||||||
| Mortgage-backed securities | 270.6 | 276.2 | (5.6 | ) | (28.0 | ) | (33.6 | ) | AAA | |||||||||||||||
| Asset-backed securities | 32.6 | 33.4 | (0.8 | ) | (6.6 | ) | (7.4 | ) | AA | |||||||||||||||
| Total HTM portfolio | $ | 1,867.5 | 1,886.5 | (19.0 | ) | 5.9 | (13.1 | ) | AA+ | |||||||||||||||
| State and Municipal Obligations: | ||||||||||||||||||||||||
| Government obligations | $ | 310.6 | 315.1 | (4.5 | ) | 17.0 | 12.5 | AA+ | ||||||||||||||||
| Special revenue obligations | 953.1 | 963.1 | (10.0 | ) | 23.6 | 13.6 | AA+ | |||||||||||||||||
| Total state and municipal obligations | $ | 1,263.7 | 1,278.2 | (14.5 | ) | 40.6 | 26.1 | AA+ | ||||||||||||||||
| Corporate Securities: | ||||||||||||||||||||||||
| Financial | $ | 41.1 | 41.8 | (0.7 | ) | (5.0 | ) | (5.7 | ) | A | ||||||||||||||
| Industrials | 32.0 | 31.7 | 0.3 | (2.5 | ) | (2.2 | ) | A- | ||||||||||||||||
| Utilities | 16.9 | 16.5 | 0.4 | (0.1 | ) | 0.3 | A+ | |||||||||||||||||
| Consumer discretion | 10.6 | 10.6 | - | 0.2 | 0.2 | A | ||||||||||||||||||
| Consumer staples | 18.9 | 18.7 | 0.2 | 0.6 | 0.8 | AA- | ||||||||||||||||||
| Health care | 3.0 | 3.0 | - | - | - | BBB | ||||||||||||||||||
| Materials | 1.9 | 1.9 | - | (0.1 | ) | (0.1 | ) | BBB | ||||||||||||||||
| Energy | 9.1 | 8.9 | 0.2 | (0.4 | ) | (0.2 | ) | A | ||||||||||||||||
| Total corporate securities | $ | 133.5 | 133.1 | 0.4 | (7.3 | ) | (6.9 | ) | A | |||||||||||||||
| Mortgage-backed securities: | ||||||||||||||||||||||||
| Agency CMBS | $ | 22.5 | 22.4 | 0.1 | 0.5 | 0.6 | AAA | |||||||||||||||||
| Non-agency CMBS | 80.2 | 85.8 | (5.6 | ) | (31.2 | ) | (36.8 | ) | AA+ | |||||||||||||||
| Agency RMBS | 156.7 | 157.0 | (0.3 | ) | 3.1 | 2.8 | AAA | |||||||||||||||||
| Non-agency RMBS | 11.2 | 11.0 | 0.2 | (0.4 | ) | (0.2 | ) | AAA | ||||||||||||||||
Total mortgage-backed securities | $ | 270.6 | 276.2 | (5.6 | ) | (28.0 | ) | (33.6 | ) | AAA | ||||||||||||||
| Asset-backed securities: | ||||||||||||||||||||||||
| ABS | $ | 30.6 | 30.9 | (0.3 | ) | (6.8 | ) | (7.1 | ) | AA+ | ||||||||||||||
Alt-A ABS | 0.9 | 1.3 | (0.4 | ) | 0.4 | - | CC | |||||||||||||||||
Sub-prime ABS2 | 1.1 | 1.2 | (0.1 | ) | (0.2 | ) | (0.3 | ) | A | |||||||||||||||
| Total ABS | $ | 32.6 | 33.4 | (0.8 | ) | (6.6 | ) | (7.4 | ) | AA | ||||||||||||||
1 2008 HTM securities are not presented as they are not material | ||||||||||||||||||||||||
2 Sub-prime exposure is defined as exposure to direct and indirect investments in non-agency residential mortgages with average FICO® scores below 650. | ||||||||||||||||||||||||
Unrecognized holding gains (losses) represent market value fluctuations from the later of: (i) the date a security is designated as held to maturity; or (ii) the date that an other-than-temporary impairment charge is recognized, through the end of the reporting period. In addition, for securities transferred from an available-for-sale designation, unrealized gain/loss amounts represent market value fluctuations from the later of: (i) the date a security was originally designated as available for sale; or (ii) the date that an other-than-temporary impairment charge was recognized, through the date of transfer, net of amortization subsequent to the date of transfer.