UNITED STATES
SECURITIES AND EXCHANGE COMMISSION
WASHINGTON, D.C. 20549
FORM 10-K
(Mark One)
| x | ANNUAL REPORT PURSUANT TO SECTION 13 OR 15(d) OF THE SECURITIES |
| | EXCHANGE ACT OF 1934 |
| | For the fiscal year ended March 30, 2007 |
OR |
| r | TRANSITION REPORT PURSUANT TO SECTION 13 OR 15(d) OF THE SECURITIES |
| | EXCHANGE ACT OF 1934 |
| | For the transition period from | to |
Commission File No.: 1-4850 |
 COMPUTER SCIENCES CORPORATION
(Exact name of Registrant as specified in its charter)
Nevada | 95-2043126 |
(State of incorporation or organization) | (I.R.S. Employer Identification No.) |
| | |
2100 East Grand Avenue | |
El Segundo, California | 90245 |
(Address of principal executive offices) | (zip code) |
| | |
Registrant's telephone number, including area code: (310) 615-0311 |
| | |
Securities registered pursuant to Section 12(b) of the Act: |
| | |
Title of each class: | Name of each exchange on which registered |
Common Stock, $1.00 par value per share | New York Stock Exchange |
Preferred Stock Purchase Rights | |
| | |
Securities registered pursuant to Section 12(g) of the Act: None |
Indicate by check mark if the registrant is a well-known seasoned issuer, as defined in Rule 405 of the Securities Act. Yes x No r
Indicate by check mark if the registrant is not required to file reports pursuant to Section 13 or Section 15(d) of the Act. Yes r No x
Indicate by check mark whether the Registrant (1) has filed all reports required to be filed by Section 13 or 15(d) of the Securities Exchange Act of 1934 during the preceding 12 months, and (2) has been subject to such filing requirements for the past 90 days. Yes x No r
Indicate by check mark if disclosure of delinquent filers pursuant to Item 405 of Regulation S-K is not contained herein, and will not be contained, to the best of Registrant’s knowledge, in definitive proxy or information statements incorporated by reference in Part III of this Form 10-K or any amendment to this Form 10-K. x
Indicate by check mark whether the registrant is a large accelerated filer, an accelerated filer, or a non-accelerated filer. See definition of “accelerated filer and large accelerated filer” in Rule 12b-2 of the Exchange Act. (Check one):
Large accelerated filer x Accelerated r Non-accelerated filer r
Indicate by check mark whether the registrant is a shell company (as defined in Rule 12b-2 of the Exchange Act). Yes r No x
As of September 29, 2006 the aggregate market value of stock held by non-affiliates of the Registrant was approximately $8,422,000,000.
There were 173,993,039 shares of the Registrant’s common stock outstanding as of May 25, 2007.
DOCUMENTS INCORPORATED BY REFERENCE
Portions of the Registrant’s definitive Proxy Statement for its 2007 Annual Meeting of Stockholders, which will be filed with the Securities and Exchange Commission within 120 days after March 30, 2007, are incorporated by reference into Part III hereof.
Explanatory Note
As previously announced and disclosed in a Current Report on Form 8-K dated May 30, 2007, Computer Sciences Corporation (CSC or the Company) has restated its consolidated balance sheet as of March 31, 2006, and the related consolidated statements of income, stockholders’ equity and cash flows for fiscal years ended March 31, 2006 and April 1, 2005 in this Form 10-K as discussed in Note 2, “Restatement of Consolidated Financial Statements” in the Notes to Consolidated Financial Statements. These restatements relate to the 1) completion of the Company’s investigation of its stock option granting practices, 2) the correction of errors relating to the accounting for income taxes, and 3) recognition of revenue for the sale of licenses for a software product. This Form 10-K also reflects the restatement of “Selected Consolidated Financial Data” in Item 6 for the fiscal years ended March 31, 2006, April 1, 2005, April 2, 2004 and March 28, 2003. In addition, the quarterly financial data in Item 8 has been restated.
The Company has not amended and does not plan to amend previously filed Annual Reports on Form 10-K or Quarterly Reports on Form 10-Q for any period affected by this restatement.
Revenue Recognition
The Company determined that it did not correctly apply the provisions of Statement of Position 97-2, “Software Revenue Recognition” with respect to the sale of licenses for a software product. As a result, the Company overstated revenue and unbilled receivables and understated deferred revenue related to this product in fiscal years prior to 2005. In fiscal years 2006 and 2005 this error resulted in an understatement of revenue. The Company has restated revenue for fiscal 2006 and 2005 and as a result revenue increased $23.4 and $21.4 for these years, respectively. The cumulative effect of this error on earnings retained for use in business was a decrease of $51.1 at April 3, 2004.
Income Taxes
The Company identified errors related to income taxes in prior periods. The most significant of these errors related to income tax accounting for amortization of tax bases of assets contributed to a consolidated affiliate. The impact of the correction of this error was an increase in income tax expense of $53.7 and $11.8 for fiscal 2006 and 2005. The cumulative effect of the correction of this error on earnings retained for use in business was a decrease of $91.4 at April 3, 2004.
In addition, the Company identified errors in the accounting for U.S. income tax liabilities related to foreign operations. The impact of the correction of this error was an increase in income tax expense of $6.6 and $5.4 for fiscal 2006 and 2005. The cumulative effect of this error on earnings retained for use in business was a decrease $15.2 at April 3, 2004.
The Company also identified individually immaterial income tax accounting errors that have been corrected. These errors related principally to state income taxes, provision for a gain, the valuation of state net operating losses and deferred tax liabilities related to state taxes. The combined impact of these errors on income tax expense was an increase of $28.4 and $1.4 for fiscal 2006 and 2005 respectively. The cumulative effect of the correction of these errors on earnings retained for use in business was a decrease of $3.6 at April 3, 2004.
Additionally, the Company identified certain errors in the preparation of U.S. federal tax returns. These included an error which understated the deduction of certain general and administrative costs in its U.S. federal income tax returns for fiscal 2002 through fiscal 2005 and resulted in the overstatement of income tax expense by $7.4 for fiscal 2005 and an understatement of income tax expense by $2.1 for fiscal 2006. The cumulative effect of the correction of these errors on earnings retained for use in business was an increase of $17.3 at April 3, 2004.
As a result of the errors noted above the Company incurred interest and penalties. For fiscal 2006 and 2005 the Company has recorded adjustments related to additional interest expense of $16.7 and $2.6, respectively, for the income tax errors. The cumulative effect on earnings retained for use in business was a decrease of $4.8 at April 3, 2004. The Company also recorded penalties related to the income tax errors of $4.0 and $44.3 for fiscal 2006 and 2005, respectively. The cumulative effect of the penalties for periods prior to fiscal 2005 on earnings retained for use in business was a decrease of $7.4 at April 3, 2004.
The total effect of all the income tax adjustments noted above was to increase income tax expense $90.8 ($84.2 net of impact of interest expense) and $11.2 ($10.2 net of the impact of interest expense) for fiscal 2006 and fiscal 2005. The cumulative effect of these errors on earnings retained for use in business was a decrease of $ 105.1 at April 3, 2004.
Stock Options
As announced in a Current Report on Form 8-K filed on February 28, 2007, the Company has completed its internal investigation of its stock option grant practices. As previously announced, in response to investigations of CSC's option grant practices by the Securities and Exchange Commission and the United States Attorney's Office for the Eastern District of New York, the Company's Board of Directors on July 29, 2006, established a special committee, comprised of the two most recently elected independent directors (the Special Committee), to manage and supervise the internal investigation, and to report the results of its investigation to the independent members of the Board of Directors. Upon receipt of the results of the investigation, the independent directors made conclusions required to address the issues raised by the investigation.
Together with its independent counsel and forensic accountants, the Special Committee conducted an extensive review of stock option grants made by the Company between March 1, 1996, and July 31, 2006 (the Relevant Period), which covered 13,564 grants made on 520 dates. The Special Committee cooperated with the SEC and the U.S. Attorney throughout this process.
The Company's independent directors concluded that the evidence obtained by the Special Committee's investigation, as well as by their own interviews of certain current and former employees, did not establish any intentional wrongdoing by current or former employees or directors, and the independent directors continue to have confidence in the integrity of management.
Based on the report of the Special Committee, the independent directors determined that 9,234 stock option grants should be modified, principally due to delays in authorization and approval and the absence of definitive documentation, including:
· | 540 stock option grants made on five dates between May 9, 1996, and June 13, 2002, which should have been accounted for as repricings of prior stock option grants, 527 of which require variable accounting until April 1, 2006, when the Company adopted Statement of Financial Accounting Standards (SFAS) No. 123R, “Share-Based Payment”; |
· | 3,906 other stock option grants made on 108 dates between April 9, 1996, and April 3, 2006, for which the measurement date should be changed to a later date on which the closing stock price was higher, requiring additional compensation expense; and |
· | 4,788 other stock option grants made on 71 dates between April 1, 1996, and July 10, 2006, for which the measurement date should be changed to a later date on which the closing stock price was lower, requiring no additional compensation expense. |
The incremental cumulative non-cash compensation expense, before taxes, from March 1, 1996, through June 30, 2006, related to stock options was approximately $70 million, including approximately $30 million attributable to the repricings requiring variable accounting. This $70 million (approximately $60 million after taxes) has been allocated among the last 11 fiscal years and first three quarters of fiscal 2007 as follows:
| | | Pre-Tax Expense | |
Fiscal Year Ended | | (in millions) | |
| | | | |
| March 29, 1996 | | $ | 0.0 | |
| March 28, 1997 | | $ | 0.4 | |
| April 3, 1998 | | $ | 1.8 | |
| April 2, 1999 | | $ | 3.2 | |
| March 31, 2000 | | $ | 8.7 | |
| March 30, 2001 | | $ | 2.8 | |
| March 29, 2002 | | $ | 16.8 | |
| March 28, 2003 | | $ | (6.5 | ) |
| April 2, 2004 | | $ | 14.1 | |
| April 1, 2005 | | $ | 8.5 | |
| March 31, 2006 | | $ | 20.6 | |
Fiscal Quarter Ended | | | |
| | | | |
| June 30, 2006 | | $ | (0.2 | ) |
The Company also determined that the tax benefits associated with the exercise of certain stock options in foreign jurisdictions had been incorrectly credited against the foreign tax provision, rather than additional paid-in capital. The Company further determined that it had applied the effective rate, rather than the U.S. statutory rate, in recognizing the tax benefits associated with the exercise of stock options in the U.S. Correction of these two tax errors resulted in an incremental cumulative tax provision of approximately $14 million, which is included in the previously stated $60 million incremental cumulative after-tax compensation expense through June 30, 2006.
Unless otherwise indicated, all references hereafter in this explanatory note to years are to calendar years.
Background
During the Relevant Period, CSC granted stock options to two categories of employees:
| · | the Chief Executive Officer, Chief Operating Officer, each of their respective direct reports and each other employee who is an "officer" for purposes of the Securities Exchange Act of 1934 (collectively, Senior Executives); and |
| · | all other employees (collectively, Other Employees). |
Option grants to Senior Executives were approved by the Compensation Committee or the Board of Directors. Approvals for option grants to Other Employees were delegated to the Chief Executive Officer or, after July 1999, in the case of option grants of 5,000 shares or less, to the Corporate Vice President, Human Resources. The Company did not grant stock options to its independent directors.
Option grants during the Relevant Period can be grouped into three general categories:
| · | "Annual Cycle Options," which were granted as part of the annual compensation review process each year; |
| · | "Discounted Options," which, on and prior to May 12, 2004, were granted on the Annual Cycle Option grant date in lieu of a cash bonus, and which typically had an exercise price per share equal to 25% of the closing market price of the Company's common stock on the grant date; and |
| · | "Other Options," which primarily include options granted to new hires (including to employees acquired through acquisitions and outsourcings) and for promotions and special recognition. |
Of the 13,564 option grants made by the Company during the Relevant Period, (i) 9,134 were for Annual Cycle Options, (ii) 262 were for Discounted Options and (iii) 4,168 were for Other Options. The option grants in each category were reviewed to determine the first date upon which the identity of the optionee, the number of shares subject to the option grant and the option exercise price were determined with finality (the measurement date). The following describes the option grants for which the independent directors determined that the measurement date should be a date other than the grant date.
Annual Cycle Options
Annual Cycle Options Granted to Senior Executives.
The independent directors concluded that there was evidence that the Annual Cycle Options granted to Senior Executives in 1996, 1999 and 2002 may each have had two measurement dates: (i) the first occurring on the date of an initial action to select the optionees, the number of option shares and the grant date closing stock price to be used for the exercise price, and (ii) the second occurring on the date of a subsequent action, within 10 days, to select a later grant date closing stock price to be used for the exercise price. Therefore, the Company determined that the aggregate 54 Annual Cycle Option grants to Senior Executives on May 9, 1996, May 10, 1999 and June 13, 2002, should be accounted for as a repricing of options for which a measurement date had previously been established on May 6, 1996, May 3, 1999, and June 3, 2002, respectively. Generally accepted accounting principles in effect at the time require a change from fixed to variable accounting for the 1999 and 2002 repricings, but not for the 1996 repricing. The incremental cumulative non-cash compensation expense before taxes from March 1, 1996, through June 30, 2006, related to accounting for these Annual Cycle Option grants to Senior Executives as repricings was approximately $10 million.
Annual Cycle Options Granted to Other Employees.
In each of the years from 1996 through 2005, there were changes, after the grant date, in the list of Annual Cycle Options to be granted to Other Employees. Therefore, the measurement date for all of the 7,562 Annual Cycle Options (excluding the 260 French grants discussed below) granted to Other Employees in those years was changed to be the first date upon which the list was determined with finality. Of these grants, 3,891 had a lower closing stock price on the new measurement dates than on the related grant dates, which did not result in any additional compensation expense. The remaining 3,671 grants did, however, except as set forth below, result in additional compensation expense amortized over the vesting period.
The new measurement date for the 2001 Annual Cycle Options granted to Other Employees resulted in a repricing requiring variable accounting. On October 29, 2001, the Company commenced an exchange offer (the 2001 Exchange Offer) pursuant to which employees could elect to cancel unexercised options with an exercise price per share of $70 or more in exchange for new options. The 2001 Exchange Offer was specifically designed so that no employee eligible to participate was granted any options during the period beginning six months before the commencement of the 2001 Exchange Offer and ending six months after the option cancellation date. Although the grant date of the Annual Cycle Options granted to Other Employees in 2001 precedes the 2001 Exchange Offer commencement date by more than six months, the new measurement date of these Annual Cycle Options does not. Consequently, certain of these options were treated as a repricing of options held by the same optionee which were cancelled in the 2001 Exchange Offer. The remaining 2001 Annual Cycle Options which were not treated as a repricing also resulted in additional compensation expense, since the new measurement date had a higher closing stock price than the grant date. The incremental cumulative non-cash compensation expense before taxes through June 30, 2006, related to changing the measurement date of the 2001 Annual Cycle Options granted to Other Employees, and accounting for such options as a repricing was approximately $21 million, including approximately $19 million attributable to variable accounting.
By 2006, the Company had revised the annual grant process, and the measurement date of the Annual Cycle Options granted to Other Employees on May 22, 2006, is the same as the grant date.
The foregoing description excludes all Annual Cycle Options granted to Other Employees subject to French taxes (French Options). The Company has a French sub-plan pursuant to which it grants French Options addressing French tax consequences. One of the requirements for these options is that they not be granted during a "closed period," as defined under French tax law. Until recently, the Company understood that the closed period included, among other periods, the 10-trading day period before and after the Company made a material announcement. Since the Company did not determine the grant date of French Options until it had confirmed that no material announcement was made during the following 10 trading days, the measurement date for all of the 260 French Option grants made during the Relevant Period has been changed. The Company currently believes that the closed period does not include the 10-day period after a material announcement (other than an earnings release or the filing of a Form 10-K or Form 10-Q).
The incremental cumulative non-cash compensation expense before taxes from March 1, 1996, through June 30, 2006, related to Annual Cycle Option grants to Other Employees, including the $21 million relating to the 2001 Annual Cycle Options discussed above, constitutes approximately $47 million of the total $70 million incremental cumulative non-cash compensation expense before taxes.
Discounted Options and Restricted Stock
The Company has identified 105 Discounted Options granted on four dates between May 3, 2000, and May 12, 2004, in which the identity of the optionee or the number of shares underlying the option was not determined with finality until after the grant date. The incremental cumulative non-cash compensation expense before taxes from May 3, 2000, through December 29, 2006, related to changing the measurement dates for these Discounted Options grants was approximately $1 million.
In 2005 and 2006, the Company granted restricted stock and restricted stock units, respectively, in lieu of a cash bonus. Sixteen of the restricted stock awards in 2005 were not determined with finality until after the grant date, and the Company recorded an incremental cumulative non-cash compensation expense before taxes from March 1, 1996, through December 29, 2006, related to accounting for the change in the measurement dates for these restricted stock awards of less than $50,000. This amount has been included in the aggregate incremental compensation expense amounts related to stock options.
The Company has also determined it had incorrectly reversed accruals for certain management bonuses which had been exchanged for discounted options and awards. The previously stated allocation of the $68 million incremental cumulative non-cash compensation expense before taxes from March 1, 1996, through December 29, 2006, related to stock options includes the resulting increase or decrease in compensation expense for each period affected. The cumulative impact of the bonus accrual adjustments through June 30, 2006, was approximately $4 million.
By 2006, the Company had revised the process for granting and accounting for equity in lieu of a cash bonus, and the measurement date of the restricted stock units awarded on May 22, 2006, in lieu of a cash bonus is the same as the grant date.
Other Options
During the Relevant Period, the Company issued 4,168 Other Option grants to new hires and for promotions, special recognition and other reasons. Of these, the Company identified 931 which were granted to new hires who joined the Company through an acquisition, or through an outsourcing by their former employer, in which the measurement date should be a date other than the grant date. Although the acquisition or outsourcing agreement generally set forth the aggregate number of option shares to be granted to the new employees, the specific allocation among employees was often not finalized until after the grant date.
The Company has also identified 320 additional Other Option grants in which the measurement date should be a date other than the grant date, and two Other Option grants which should have been accounted for as repricings requiring variable accounting. These Other Option grants were primarily made to new hires or for promotions or special recognition.
By 2006, the Company had revised the processes for granting Other Options, and the measurement date of all Other Options granted after April 3, 2006, other than those granted to French employees, is the same as the grant date. The incremental cumulative non-cash compensation expense before taxes from March 1, 1996, through June 30, 2006, related to Other Option grants was approximately $8 million.
Changes in Option Grant Procedure
Other than options granted to French employees, the Company has not identified any stock option grants made after April 3, 2006, that were accounted for incorrectly. In order to provide greater predictability and transparency in the Company's equity granting process, however, the Board of Directors adopted an Equity Grant Policy on February 23, 2007. The Policy Statement provides that:
· | all terms of each equity grant must be approved on or prior to the grant date; |
· | all stock options must have an exercise price equal to or greater than the closing market price on the grant date; |
· | there will be a fixed, monthly grant date for all equity grants other than those issued to new hires who become CSC employees through a merger, acquisition or outsourcing; |
· | all recipients of equity grants must be notified of such grants as soon as possible after approval, and the Company must use reasonable efforts to notify such recipients on or prior to the grant date; |
· | there is an approval matrix for all equity grants; |
· | the Compensation Committee must approve an annual equity grant budget that cannot be exceeded without its prior approval; and |
· | the Company's management must make a report to the Compensation Committee, within two weeks after the end of each quarter, of all equity grants issued during the quarter. |
The Company has restated previously filed financial statements in this Form 10-K. Adjustments to net income amounted to $15.2 million and $7.3 million, respectively, for the fiscal years ended March 31, 2006 and April 1, 2005.
The incremental impact from recognizing stock-based compensation expense resulting from the investigation of past stock option grants is as follows (dollars in millions):
Fiscal Year | | Pre-Tax Expense | | | After Tax Expense | |
| 1997 | | $ | .4 | | | $ | .3 | |
| 1998 | | | 1.8 | | | | 1.4 | |
| 1999 | | | 3.2 | | | | 1.6 | |
| 2000 | | | 8.7 | | | | 11.6 | |
| 2001 | | | 2.8 | | | | 6.0 | |
| 2002 | | | 16.8 | | | | 11.8 | |
| 2003 | | | (6.5 | ) | | | (4.0 | ) |
| 2004 | | | 14.1 | | | | 8.9 | |
| Total 1997 – 2004 impact | | | 41.3 | | | | 37.6 | |
| 2005 | | | 8.5 | | | | 7.3 | |
| 2006 | | | 20.6 | | | | 15.2 | |
| Total | | $ | 70.4 | | | $ | 60.1 | |
Additionally, the Company has restated the pro forma expense under Statement of Financial Accounting Standards (“SFAS”) No. 123 in Note 1 of the Notes to Consolidated Financial Statements of this Form 10-K to reflect the impact of these adjustments for the years ended March 31, 2006 and April 1, 2005.
TABLE OF CONTENTS
Item | | Page |
| | | |
| | Part I | |
| | | |
| 1. | Business | 1 |
| 1A. | Risk Factors | 5 |
| 1B. | Unresolved Staff Comments | 10 |
| 2. | Properties | 10 |
| 3. | Legal Proceedings | 11 |
| 4. | Submission of Matters to a Vote of Security Holders | 13 |
| | | |
| | Part II | |
| | | |
| 5. | Market for the Registrant’s Common Equity, Related Stockholder Matters and Issuer Purchases of Equity Securities | 14 |
| 6. | Selected Financial Data | 16 |
| 7. | Management’s Discussion and Analysis of Financial Condition and Results of Operations | 22 |
| 7A. | Quantitative and Qualitative Disclosures About Market Risk | 47 |
| 8. | Consolidated Financial Statements and Supplementary Data | 48 |
| 9. | Changes in and Disagreements with Accountants on Accounting and Financial Disclosure | 125 |
| 9A. | Controls and Procedures | 125 |
| 9B. | Other Information | 125 |
| | | |
| | Part III | |
| | | |
| 10. | Directors and Executive Officers of the Registrant | 126 |
| 11. | Executive Compensation | 126 |
| 12. | Security Ownership of Certain Beneficial Owners and Management and Related Stockholder Matters | 126 |
| 13. | Certain Relationships and Related Transactions | 126 |
| 14. | Principal Accountant Fees and Services | 126 |
| | | |
| | Part IV | |
| | | |
| 15. | Exhibits | 127 |
i
PART I
Item 1. Business
INTRODUCTION AND HISTORY
General
Computer Sciences Corporation (CSC or the Company) is one of the world leaders in the information technology (I/T) and professional services industry. Since it was founded in 1959, the Company has helped clients use I/T more efficiently in order to improve their operations and profitability, achieve business results and focus on core competencies.
CSC offers a broad array of services to clients in the Global Commercial and government markets and specializes in the application of complex I/T to achieve its customers’ strategic objectives. Its service offerings include information technology and business process outsourcing, and I/T and professional services.
Outsourcing involves operating all or a portion of a customer’s technology infrastructure, including systems analysis, applications development, network operations, desktop computing and data center management. CSC also provides business process outsourcing, managing key functions for clients, such as procurement and supply chain, call centers and customer relationship management, credit services, claims processing and logistics.
I/T and professional services include systems integration, consulting and other professional services. Systems integration encompasses designing, developing, implementing and integrating complete information systems. Consulting and professional services includes advising clients on the strategic acquisition and utilization of I/T and on business strategy, security, modeling, simulation, engineering, operations, change management and business process reengineering.
The Company also licenses sophisticated software systems for the financial services markets and provides a broad array of end-to-end e-business solutions that meet the needs of large commercial and government clients. The Company focuses on delivering results by combining business innovation skills with seasoned delivery expertise to provide flexible and scalable solutions. To do so, CSC draws on its vast experience in designing, building and maintaining large, complex, mission-critical systems and applies this knowledge to today’s business challenges.
CSC does not have exclusive agreements with hardware or software providers and believes this vendor neutrality enables it to better identify and manage solutions specifically tailored to each client’s needs.
Major Markets
CSC provides its services to clients in Global Commercial industries and to the U.S. federal and foreign government. Segment and geographic information is included in Note 16 to the notes to consolidated financial statements for the year ended March 30, 2007.
In the Global Commercial market sector, CSC’s service offerings are delivered to clients in a wide array of industries including aerospace/defense, automotive, chemical and resources, consumer goods, financial services, healthcare, manufacturing, retail/distribution, telecommunications, and technology. The Company’s Global Commercial market sector also includes U.S. local and foreign government clients.
The Company has provided I/T services to the U.S. federal government since 1961, is a leading federal contractor and is one of its top I/T service providers. CSC serves a broad federal customer base, including most civil departments and branches of the military, as well as the Department of Homeland Security. The Company provides a broad spectrum of services to the U.S. federal government, ranging from traditional systems integration and outsourcing to complex project management and technical services. Key offerings include enterprise modernization, telecommunications and networking, managed services, base and range operations, and training and simulation.
Geographically, CSC has major operations throughout North America, Europe and the Asia-Pacific region, including India.
During the last three fiscal years, the Company’s revenue mix by major markets was as follows:
| | | 2007 | | | 2006 | | | 2005 | |
| U.S. Commercial | | | 26 | % | | | 28 | % | | | 27 | % |
| Europe | | | 28 | | | | 28 | | | | 31 | |
| Other International | | | 10 | | | | 9 | | | | 9 | |
| Global Commercial | | | 64 | | | | 65 | | | | 67 | |
| U.S. Federal Government | | | 36 | | | | 35 | | | | 33 | |
| Total Revenues | | | 100 | % | | | 100 | % | | | 100 | % |
Fiscal 2007 Overview
During fiscal 2007, CSC announced awards valued at approximately $16.9 billion, including $9.2 billion of Global Commercial awards and $7.7 billion with the U.S. federal government. These multi-year awards represent the estimated value of the Company’s portion at contract signing. They cannot be considered firm orders, however, due to their variable attributes, including demand-driven usage, modifications in scope of work due to changing customer requirements, the annual funding constraints and indefinite delivery/indefinite quantity characteristics of major portions of the Company’s U.S. federal activities.
During April 2006, the Company implemented a restructuring program which is expected to positively impact future cash flow and earnings, enhancing shareholder value. The program is designed to streamline CSC’s global operations and increase the use of lower cost resources, and involves workforce reductions during fiscal 2007 and 2008 to address excess capacity in certain geographies. Restructuring charges consist predominantly of severance and related employee payments resulting from termination. As a result, during fiscal 2007, the company incurred pre-tax restructuring charges of $333.4 million.
During fiscal 2007, the Company completed the acquisition of Datatrac Information Services, Inc., a privately held U.S government services and solutions provider headquartered in Richardson, Texas for an initial purchase price of $123.8 million. The acquisition expands the Company’s I/T Solutions services within the North American Public Sector, and strengthens CSC’s ability to compete for work within the U.S. Department of Homeland Security and other government agencies. For further discussion, please see Note 4 to the notes to consolidated financial statements.
Global Commercial Market Highlights
Within the Global Commercial market, there were several significant awards to CSC during fiscal 2007. Many of the Company’s awards were extensions and/or expansions of existing relationships, a clear indication of customer satisfaction.
CSC’s largest commercial award during fiscal 2007 was the 9 year, $3.7 billion contract with the United Kingdom’s National Health Service. Under this agreement CSC assumes the role of primary contractor from Accenture Ltd. for two additional regions for the implementation of a record keeping system for the National Health Service.
CSC signed a $330 million, 7 year agreement with TDC, the largest telecommunications company in Denmark. Under the seven year contract, CSC will provide the full scope of I/T infrastructure services including desktop, helpdesk, data center and local area networking services.
CSC entered into a $378 million, 8 year agreement with Blue Scope Steel, Ltd, a leading international flat steel solutions company. CSC will be responsible for managing and delivering a diverse set of I/T services ranging from consulting, applications development and support, disaster recovery, systems integration and end-user services on a variety of technology platforms.
CSC signed a $275 million, 7 year contract with UK visas, a joint UK Home Office and Foreign and Commonwealth Office directorate which operates as the overseas arm of the United Kingdom’s integrated border management. CSC will establish Visa Application Centers in three regions covering 15 countries in the Europe, Americas and North African regions.
CSC entered into a $180 million, 7 year I/T services agreement with Newmont Mining Corporation, one of the world’s largest gold mining companies. Under the agreement, CSC will manage operations for all of Newmont’s global shared services operations and regional gold mining facilities, including locations in Denver, Nevada, Ghana, Peru and Australia. CSC will also be responsible for Newmont’s enterprise-wide infrastructure, which includes help desk, desktop, network, and telecommunications, and security services, as well as server support and applications maintenance.
North American Public Sector Highlights
The North American Public Sector (formerly the U.S. Federal Sector) had several significant awards during fiscal 2007 from the U.S. federal government.
The Company’s largest U.S. federal government award during the fiscal year was the $2.0 billion, 3 to 6 year contract with the U.S. Army. The company is one of 11 firms that have been awarded an Information Technology Enterprise Solutions-2 Services contract by the U.S. Army Contracting Agency on behalf of the Army’s Program Executive Office for Enterprise Information Systems. Under the agreement, CSC will provide a comprehensive range of I/T services to support the Army’s enterprise infrastructure worldwide.
CSC signed an $800 million, 4 year contract with the U.S Agency for International Development. CSC is one of 5 firms that have been awarded a Principal Resource for Information Management Enterprise-wide blanket purchase agreement by U.S. Agency for International Development. CSC will provide a comprehensive range of I/T support services in support of USAID’s mission to provide economic development and humanitarian assistance around the world.
CSC entered into a $378 million, 6.5 year agreement with the U.S. Air Force. Under the agreement CSC will provide technical and business transformation services for the U.S. Air Force Expeditionary Combat Support System. The Company will also be the prime systems integrator and provide logistics business process redesign and commercial off-the-shelf enterprise resource planning services.
CSC also signed a $151 million, 5 year contract with the Department of Defense’s Missile Defense Agency. The Company will provide scientific, engineering and technical assistance for the U.S. Ballistic Missile Defense System.
COMPETITION
The I/T and professional services markets in which CSC competes are not dominated by a single company or a small number of companies. A substantial number of companies offer services that overlap and are competitive with those offered by the Company. Some of these are large industrial firms, including computer manufacturers and major aerospace firms that may have greater financial resources than CSC and, in some cases, may have greater capacity to perform services similar to those provided by the Company. The increased importance of offshore labor centers has brought a number of foreign-based firms into competition with CSC.
CSC’s ability to obtain business is dependent upon its ability to offer better strategic concepts and technical solutions, better value, a quicker response, more flexibility or a combination of these factors. In the opinion of the Company’s management, CSC is positioned to compete effectively in the Global Commercial and U.S. federal government markets based on its technology and systems expertise and large project management skills. It is also management’s opinion that CSC’s competitive position is enhanced by the full spectrum of I/T and professional services it provides, from consulting to software and systems design, implementation and integration, to information technology and business process outsourcing to technical services, delivered to a broad commercial and government customer base.
EMPLOYEES
The Company has offices worldwide, and as of March 30, 2007 employed approximately 79,000 persons. The services provided by CSC require proficiency in many fields, such as computer sciences, programming, mathematics, physics, engineering, astronomy, geology, operations, research, economics, statistics and business administration.
U.S. SECURITIES AND EXCHANGE COMMISSION REPORTS
All of the Company’s Annual Reports on Form 10-K, Quarterly Reports on Form 10-Q and Current Reports on Form 8-K, and all amendments to those reports, filed with or furnished to the U.S. Securities and Exchange Commission (SEC) on or after January 19, 1995 are available free of charge through the Company’s Internet website, www.csc.com, as soon as reasonably practical after the Company has electronically filed such material with, or furnished it to, the SEC.
FORWARD-LOOKING AND CAUTIONARY STATEMENTS
All statements and assumptions contained in this Annual Report and in the documents attached or incorporated by reference that do not directly and exclusively relate to historical facts constitute “forward-looking statements” within the meaning of the Safe Harbor provisions of the Private Securities Litigation Reform Act of 1995. These statements represent current expectations and beliefs of CSC, and no assurance can be given that the results described in such statements will be achieved.
Forward-looking information contained in these statements include, among other things, statements with respect to CSC’s financial condition, results of operations, cash flows, business strategies, operating efficiencies or synergies, competitive positions, growth opportunities, plans and objectives of management, and other matters. Such statements are subject to numerous assumptions, risks, uncertainties and other factors, many of which are outside of CSC’s control, which could cause actual results to differ materially from the results described in such statements. These factors include without limitation those listed below under Item 1A. Risk Factors.
Forward-looking statements in this Annual Report speak only as of the date of this Annual Report, and forward-looking statements in documents attached or incorporated by reference speak only as to the date of those documents. CSC does not undertake any obligation to update or release any revisions to any forward-looking statement or to report any events or circumstances after the date of this Annual Report or to reflect the occurrence of unanticipated events, except as required by law.
Item 1A. Risk Factors
Past performance may not be a reliable indicator of future financial performance. Future performance and historical trends may be adversely affected by the following factors, as well as other variables, and should not be relied upon to project future period results.
| 1. | Our business may be adversely impacted as a result of changes in demand, both globally and in individual market segments, for information technology outsourcing, business process outsourcing and consulting and systems integration services. |
Economic and political uncertainty adversely impact our customers’ demand for our services. A general economic downturn may adversely impact our customers’ demand for consulting and systems integration services. Our federal government segment generated approximately 36.1% of our revenue for fiscal 2007. While the pipeline for government projects continues to be robust, the budget deficit, the cost of rebuilding infrastructure as a result of natural disasters and the cost of reconstruction in Iraq may reduce the federal government’s demand for information technology projects, adversely impacting our federal government segment and our business.
| 2. | Our ability to continue to develop and expand our service offerings to address emerging business demands and technological trends will impact our future growth. If we are not successful in meeting these business challenges our results of operations and cash flows will be materially and adversely affected. |
Our ability to implement solutions for our customers incorporating new developments and improvements in technology which translate into productivity improvements for our customers and to develop service offerings that meet the current and prospective customers’ needs are critical to our success. The markets we serve are highly competitive. Our competitors may develop solutions or services which make our offerings obsolete. Our ability to develop and implement up to date solutions utilizing new technologies which meet evolving customer needs in consulting and systems integration and technology outsourcing markets will impact our future revenue growth and earnings.
| 3. | Our primary markets, technology outsourcing and consulting and systems integration, are highly competitive markets. If we are unable to compete in these highly competitive markets our results of operations will be materially and adversely affected. |
Our competitors include large, technically competent and well capitalized companies. As a result, the markets which we serve are highly competitive. This competition may place downward pressure on operating margins in our industry, particularly for technology outsourcing contract extensions or renewals. As a result we may not be able to maintain our current operating margins for technology outsourcing contracts, extended or renewed in the future.
Any reductions in margins will require that we effectively manage our cost structure. If we fail to effectively manage our cost structure during periods with declining margins our results of operations will be adversely affected.
| 4. | Our ability to consummate and integrate acquisitions may materially and adversely affect our profitability if we fail to achieve anticipated revenue improvements and cost reductions. |
Our ability to successfully integrate the operations we acquire and leverage these operations to generate revenue and earnings growth will significantly impact future revenue and earnings. Integrating acquired operations is a significant challenge and there is no assurance that the company will be able to manage the integrations successfully. Failure to successfully integrate acquired operations may adversely affect our cost structure thereby reducing our margins and return on investment.
| 5. | Our customers may experience financial difficulties and we may not be able to collect our receivables, materially and adversely affecting our profitability. |
Over the course of a long-term contract our customers’ financial fortunes may change affecting their ability to pay their obligations and our ability to collect our fees for services rendered. Additionally, we may perform work for the federal government, for which we must file requests for equitable adjustment or claims with the proper agency to seek recovery in whole or in part for out-of-scope work directed or caused by the customers in support of their critical missions. While we may resort to other methods to pursue our claims or collect our receivables these methods are expensive and time consuming and success is not guaranteed. Failure to collect our receivables or prevail on our claims would have an adverse affect on our profitability.
| 6. | If we are unable to accurately estimate the cost of services and the timeline for completion of contracts the profitability of our contracts may be materially and adversely affected. |
Our commercial and federal government contracts are typically awarded on a competitive basis. Our bids are based upon, among other items, the cost to provide the services. To generate an acceptable return on our investment in these contracts we must be able to accurately estimate our costs to provide the services required by the contract and to be able to complete the contracts in a timely manner. If we fail to accurately estimate our costs or the time required to complete a contract the profitability of our contracts may be materially and adversely affected.
| 7. | We are defendants in pending litigation which may have a material and adverse impact on our profitability. |
As noted in Item 3, Legal Proceedings, of this Form 10-K we are currently party to a number of disputes which involve or may involve litigation. We are not able to predict the ultimate outcome of these disputes or the actual impact of these matters on our profitability. If we agree to settle these matters or judgments secured against us we will incur charges which may have a material and adverse impact on our liquidity and earnings.
We are engaged in providing services under contracts with the U.S. Government. These contracts are subject to extensive legal and regulatory requirements and, from time to time, agencies of the U.S. Government investigate whether our operations are being conducted in accordance with these requirements. U.S. Government investigations of us, whether related to the Company’s federal government contracts or conducted for other reasons, could result in administrative, civil or criminal liabilities, including repayments, fines or penalties being imposed upon us, or could lead to suspension or debarment from future U.S. Government contracting.
| 8. | Our ability to provide our customers with competitive services is dependent on our ability to attract and retain qualified personnel. |
Our ability to grow and provide our customers with competitive services is partially dependent on our ability to attract and retain highly motivated people with the skills to serve our customers. As we noted above, the markets we serve are highly competitive and competition for skilled employees in the technology outsourcing and consulting and systems integration markets is intense for both on-shore and off-shore locales.
| 9. | Our international operations are exposed to risks, including fluctuations in exchange rates, which may be beyond our control. |
For fiscal 2007 we earned approximately 38% of revenues in currencies other than the U.S. dollar. As a result we are exposed to various risks associated with operating in multiple countries including exposure to fluctuations in currency exchange rates. While this risk is partially mitigated by largely matching costs with revenues in a given currency, our exposure to fluctuations in other currencies against the U.S. dollar increases as revenue in currencies other than the U.S. dollar increase and as more of the services we provide shifted to lower cost regions of the world. We project that the percentage of our revenue denominated in currencies other than the U.S. dollar will continue to represent a significant portion of our revenue. Also, we project that some of our ability to match revenue and expenses in a given currency will decrease as more work is performed at offshore locations.
We operate in 55 countries and our operations in these countries are subject to the local legal and political environments. Our operations are subject to among other things, employment, taxation, statutory reporting, trade restrictions and other regulations. In spite of our best efforts we may not be in compliance with all regulations around the world and may be subject to penalties and or fines as a result. These penalties or fines may materially and adversely impact our profitability.
10. | Our ability to compete in certain markets we serve is dependent on our ability to continue to expand our capacity in certain offshore locations. However, as our presence in these locations increases we are exposed to risks inherent to these locations which may adversely impact our revenue and profitability. |
A significant portion of our application outsourcing and software development activities have been shifted to India and we plan to continue to expand our presence there. As such, we are exposed to the risks inherent to operating in India including 1) a highly competitive labor market for skilled workers which may result in significant increases in labor costs as well as shortages of qualified workers in the future, 2) the tax holiday granted by certain tax jurisdictions in India to the Company, which currently extend through 2010, may not be extended or may be revoked resulting in an increase in income tax expense, 3) the possibility that the U.S. federal government or the European Union may enact legislation which may provide significant disincentives to customers to offshore certain of their operations which would reduce the demand for the services we provide in India and may adversely impact our cost structure and profitability.
11. | In the course of providing services to customers we may inadvertently infringe on the intellectual property rights of others and be exposed to claims for damages. |
The solutions we provide to our customers may inadvertently infringe on the intellectual property rights of third parties resulting in claims for damages against us or our customers. Our contracts generally indemnify our clients from claims for intellectual property infringement for the services and equipment we provide under our contracts. The expense and time of defending against these claims may have a material and adverse impact on our profitability. Additionally, the publicity we may receive as a result of infringing intellectual property rights may damage our reputation and adversely impact our ability to develop new business.
12. | Generally our contracts contain provisions under which a customer may terminate the contract prior to completion. Early contract terminations may materially and adversely affect our revenues and profitability. |
Our contracts contain provisions by which customers may terminate the contract prior to completion of the term of the contract. These contracts generally allow the customer to terminate the contract for convenience upon providing written notice. In these cases we seek, either by defined contract schedules or through negotiations, recovery of our investments in the contracts. There is no assurance we will be able to fully recover our investments.
We may not be able to replace the revenue and earnings from these contracts in the short-term. In the long-term our reputation may be harmed by the publicity generated from contract terminations.
13. | We may be exposed to negative publicity and other potential risks if we are unable to maintain effective internal controls. |
We are required under the Sarbanes-Oxley Act of 2002 to provide a report from management to our shareholders on our internal controls over financial reporting including an assessment of the effectiveness of these controls to provide reasonable assurance a material misstatement did not occur in our financial statements. The failure of our controls to provide reasonable assurance that a material misstatement does not exist or to detect a material misstatement may cause us to be unable to meet our filing requirements and the resulting negative publicity may adversely affect our business, and our stock price may be materially and adversely affected.
14. | We have identified a material weakness related to accounting for income taxes and concluded that our internal control over financial reporting was not effective as of March 30, 2007. Inability to maintain effective internal control over financial reporting could adversely affect our financial results, the market price of our common stock or our operations. |
The Company has identified a material weakness related to accounting for income taxes and, as a result, has concluded that our internal control over financial reporting as of March 30, 2007 was not effective. Remediation of this material weakness may be costly and time consuming. Inability to maintain effective internal control over financial reporting could adversely affect our financial results, the market price of our common stock or our operations.
15. | Our largest customer, the U.S. federal government, accounts for a significant portion of our revenue and earnings. Inherent in the government contracting process are various risks which may materially and adversely affect our business and profitability. |
A significant portion of our revenue, approximately 36.1%, is derived from contracts with the U.S. federal government. As a result our exposure to the risks inherent in the government contracting process is material. These risks include government audits of billable contract costs and reimbursable expenses, project funding and requests for equitable adjustment, compliance with government reporting requirements as well as the consequences if improper or illegal activities are discovered.
If any of these should occur our reputation may be adversely impacted and our relationship with the government agencies we work with damaged resulting in a material and adverse affect on our profitability.
16. | Our ability to raise additional capital for future needs will impact our ability to compete in the markets we serve. |
We may require additional capital to purchase assets, complete strategic acquisitions, repurchase shares on the open market or for general liquidity needs. Declines in our credit rating or limits on our ability to sell additional shares may adversely affect our ability to raise additional capital or materially increase our cost of capital. Our inability to raise additional capital at a reasonable cost may adversely impact our revenue growth and the price of our stock.
17. | As a result of the delayed filing of our Form 10-Q for the quarter ending December 29, 2006, we are currently ineligible to use Form S-3 to register securities with the SEC in capital-raising transactions, which may adversely affect our cost of future capital. |
As a result of the delayed filing of our Form 10-Q for the quarter ended December 29, 2006, we are ineligible to use Form S-3 to register securities for sale by us or for resale by other security holders, in capital raising transactions, until we have timely filed all periodic reports under the Securities Exchange Act of 1934 for at least 12 calendar months following March 5, 2007, the date our Form 10-Q for the quarter ended December 29, 2006 was filed. In the meantime, for capital raising transactions we would need to use Form S-1 to register securities with the SEC, or issue such securities in a private placement, which could increase the costs of raising capital during this period.
18. | Our future profitability may be materially and adversely affected if we fail to execute according to plan the restructuring announced by the Company on April 4, 2006. |
The Company announced a restructuring plan in April 2006, to be carried out during fiscal 2007 and 2008. The restructuring will result in an estimated pre-tax charge of $440 million and have resulted in cost savings of $180 million and an estimated $340 million during fiscal 2007 and 2008, respectively. The majority of the restructuring activities involve employees in central and southern Europe with certain aspects of the restructuring subject to negotiation with employee works councils. Additionally, certain restructured activities will be centralized or transitioned to other locales requiring the transfer of knowledge. If we fail to execute our restructuring plan and achieve the cost savings we have estimated our margins and profitability will be materially and adversely affected.
19. | Our performance on contracts on which we have partnered with third parties may be adversely affected if the third parties fail to deliver on their commitments. |
Our contracts are increasingly complex and require that we partner with parties including software and hardware vendors to provide the complex solutions required by our customers. Our ability to deliver the solution and provide the services required by our customers is dependent on the ability of our partners to meet their delivery schedules. If our partners fail to deliver their services or products on time our ability to complete the contract may be adversely affected which may have a material and adverse impact on our revenue and profitability.
If we are the primary contractor and our partners fail to perform as agreed we may be liable to our customers for penalties or lost profits. These penalties or payments for lost profits may have a material and adverse affect on our profitability.
Item 1B. Unresolved Staff Comments |
| None |
| |
Item 2. Properties
Owned properties as of March 30, 2007 | | Approximate Square Footage | | General Usage |
| Blythewood, South Carolina | | 456,000 | | Computer and General Office |
| Falls Church, Virginia | | 401,000 | | General Office |
| Copenhagen, Denmark | | 368,000 | | Computer and General Office |
| Aldershot, United Kingdom | | 268,000 | | General Office |
| El Segundo, California | | 206,000 | | General Office |
| Austin, Texas | | 203,000 | | General Office |
| Newark, Delaware | | 176,000 | | Computer and General Office |
| Taastrup, Denmark | | 147,000 | | Computer and General Office |
| Norwich, Connecticut | | 144,000 | | Computer and General Office |
| Daleville, Alabama | | 137,000 | | General Office |
| Petaling Jaya, Malaysia | | 136,000 | | Computer and General Office |
| Berkeley Heights, New Jersey | | 119,000 | | Computer and General Office |
| Meriden, Connecticut | | 118,000 | | Computer and General Office |
| Aaurus, Denmark | | 101,000 | | General Office |
| Moorestown, New Jersey | | 99,000 | | General Office |
| Chesterfield, United Kingdom | | 80,000 | | Computer and General Office |
| Maidstone, United Kingdom | | 79,000 | | Computer and General Office |
| Hong Kong, China | | 74,000 | | General Office |
| Jacksonville, Illinois | | 60,000 | | General Office |
| Singapore | | 46,000 | | General Office |
| Turnbridge, United Kingdom | | 43,000 | | General Office |
| Sterling, Virginia | | 41,000 | | General Office |
| Various other U.S. and foreign locations | | 83,000 | | General Office |
| | | | | |
Leased properties as of March 30, 2007 | | | | |
| Washington, D.C. area | | 2,679,000 | | Computer and General Office |
| Texas | | 819,000 | | Computer and General Office |
| India | | 726,000 | | Computer and General Office |
| Australia & other Pacific Rim locations | | 672,000 | | General Office |
| Germany | | 632,000 | | General Office |
| England | | 588,000 | | Computer and General Office |
| Ohio | | 584,000 | | General Office |
| New Jersey | | 401,000 | | General Office |
| Tennessee | | 381,000 | | General Office |
| Denmark | | 374,000 | | General Office |
| California | | 350,000 | | General Office |
| Florida | | 311,000 | | General Office |
| New York | | 295,000 | | General Office |
| Connecticut | | 287,000 | | General Office |
| Georgia | | 285,000 | | General Office |
| Delaware | | 262,000 | | General Office |
| France | | 232,000 | | General Office |
| Illinois | | 226,000 | | General Office |
| Sweden | | 214,000 | | General Office |
| Alabama | | 211,000 | | General Office |
| Massachusetts | | 203,000 | | General Office |
| Various other U.S. and foreign locations | | 2,528,000 | | Computer and General Office |
| | | | | |
Upon expiration of its leases, the Company does not anticipate any difficulty in obtaining renewals or alternative space. Lease expiration dates range from fiscal 2008 through 2018.
Item 3. Legal Proceedings
CSC is engaged in providing services under contracts with the U.S. Government. The contracts are subject to extensive legal and regulatory requirements and, from time to time, agencies of the U.S. Government investigate whether the Company’s operations are being conducted in accordance with these requirements. U.S. Government investigations of the Company, whether related to the Company’s federal government contracts or conducted for other reasons, could result in administrative, civil or criminal liabilities, including repayments, fines or penalties being imposed upon the Company, or could lead to suspension or debarment from future U.S. Government contracting. The Company believes it has adequately reserved for any losses which may be experienced from these investigations.
In the course of business, discrepancies or claims may arise as to the use or reliability of various software products provided by the Company for its customers. During 2005, the Company was named, along with other vendors to the insurance industry and dozens of insurance companies in Hensley, et al. vs. Computer Sciences Corporation, et al., filed as a putative nationwide class action in state court in Miller County, Arkansas shortly before President Bush signed the Class Action Fairness Act into law. The plaintiffs allege the defendants conspired to wrongfully use software products licensed by the Company and the other software vendors to reduce the amount paid to the licensees’ insureds for bodily injury claims. Plaintiffs also allege wrongful concealment of the manner in which these software programs evaluate claims and wrongful concealment of information about alleged inherent errors and flaws in the software. Plaintiffs seek injunctive and monetary relief of less than $75,000 for each class member, as well as attorney’s fees and costs. The Company is vigorously defending itself against the allegations.
Litigation is inherently uncertain and it is not possible to predict the ultimate outcome of the matters discussed above. Considering the early stage of the Hensley case, the complicated issues presented by that matter, and the fact that no class has been certified, it is not possible at this time to make meaningful estimates of the amount or range of loss that could result from this matter. It is possible that the Company’s business, financial condition, results of operations, or cash flows could be affected by the resolution of this matter. Whether any losses, damages or remedies ultimately resulting from this proceeding could reasonably have a material effect on the Company’s business, financial condition, results of operations, or cash flows will depend on a number of variables, including, for example, the timing and amount of such losses or damages, if any, and the structure and type of any such remedies. Depending on the ultimate resolution of these matters, some may be material to the Company's operating results for a particular period if an unfavorable outcome results, although such a material unfavorable result is not presently expected, and all other litigation, in the aggregate, is not expected to result in a material adverse impact to the consolidated financial statements.
As reflected by Form 8-K filings made by Sears Holdings Corporation (SHC) on May 13, 2005 (following merger with K-Mart Holding Corporation), and by the Company on May 16, 2005, SHC's subsidiary, Sears, Roebuck and Co. (Sears), and the Company are in dispute over amounts due and owing and applicable termination fees following Sears' termination of its Master Services Agreement (Agreement) with the Company on May 11, 2005. The dispute which also involves billings for continued services and counterclaim allegations by Sears of contract breaches is expected to be resolved pursuant to negotiations or legal and arbitration proceedings. As of March 30, 2007, the Company’s investment in net assets associated with the Agreement was approximately $80 million. These net assets include accounts receivable, prepaid expenses, outsourcing contract costs, software, and property, plant and equipment. The Company will vigorously pursue recovery for its associated assets and commitments. While the Company expects full recovery of its investments associated with this Agreement, if unsuccessful, the Company may experience a charge, which could be material, associated with the impairment of these assets.
The Company has converted 16 submitted Requests for Equitable Adjustment (REAs) to interest bearing claims under the Contract Disputes Act (CDA) totaling in excess of $1 billion on two U.S. Federal contracts. Included in current assets on the Company’s balance sheet is approximately $820 million of unbilled accounts receivable and deferred costs related to the contracts. CSC has requested payment for certain related out-of-scope work directed or caused by the customers in support of their critical missions. The contractual modification process for scope changes has lagged behind the need for CSC to provide critical on-going operational support. The Company does not record any profit element when it defers costs associated with such REAs/claims. The Company believes it has a legal basis for pursuing recovery of these REAs/claims and that collection is probable with interest on the claims accruing but not being recognized. Settlement of the amounts depends on individual circumstances, negotiations with the parties and prosecution of the claims; we are unable to predict the timing of resolution of these claims.
Several shareholders of the Company have filed purported derivative actions against both the Company, as nominal defendant, as well as certain of CSC's executive officers and directors. These actions generally allege that certain of the individual defendants breached their fiduciary duty to the Company by purportedly “backdating” stock options granted to CSC executives, improperly recording and accounting for allegedly backdated stock options, producing and disseminating disclosures that improperly recorded and accounted for the allegedly backdated options, engaging in acts of corporate waste, and committing violations of insider trading laws. They allege that certain of the defendants were unjustly enriched and seek to require them to disgorge their profits. The Company and certain directors and other individuals have also been sued in a class action proceeding alleging violations of the ERISA statute related to claims of alleged backdating of stock options.
In addition to the matters noted above, the Company is currently party to a number of disputes which involve or may involve litigation. The Company consults with legal counsel on those issues related to litigation and seeks input from other experts and advisors with respect to other matters in the ordinary course of business. Whether any losses, damages or remedies ultimately resulting from such other matters could reasonably have a material effect on the Company's business, financial condition, results of operation, or cash flows will depend on a number of variables, including, for example, the timing and amount of such losses or damages (if any) and the structure and type of any such remedies. For these reasons, it is not possible to make reliable estimates of the amount or range of loss that could result from these other matters at this time. Company management does not, however, presently expect any of such other matters to have a material impact on the consolidated financial statements of the Company.
Item 4. Submission of Matters to a Vote of Security Holders
None.
Executive Officers of the Registrant
Name | Age | | Year First Elected as An Officer | | Term as an Officer | | Position Held With the Registrant | | Family Relationship |
| Michael W. Laphen* | 56 | | 2001 | | Indefinite | | President and Chief Executive Officer | | None |
| Michael E. Keane | 51 | | 2006 | | Indefinite | | Vice President and Chief Financial Officer | | None |
| Hayward D. Fisk | 64 | | 1989 | | Indefinite | | Vice President, General Counsel and Secretary | | None |
| Harvey N. Bernstein | 60 | | 1988 | | Indefinite | | Vice President, Global Legal Compliance & Assistant Secretary | | None |
| Donald G. DeBuck | 49 | | 2001 | | Indefinite | | Vice President and Controller | | None |
| Thomas R. Irvin | 58 | | 2004 | | Indefinite | | Vice President and Treasurer | | None |
| Paul T. Tucker | 59 | | 1997 | | Indefinite | | Vice President, Corporate Development | | None |
* Director of the Company
Business Experience of Officers
Michael W. Laphen joined the Company in 1977 and was elected President and Chief Executive Officer effective May 22, 2007. He was named a director of the Company in February 2007. He previously served as President and Chief Operating Officer. He was Vice President from August 2001 to April 2003. He was President of the European Group from August 2000 to March 2003. Previous positions within the Company include President of the Federal Sector—Civil Group (1998-2000), and President of Systems Group—Integrated Systems Division (1992-1998).
Michael E. Keane joined the Company in 2005 as Vice President—Finance and was elected Vice President and Chief Financial Officer in 2006. Former positions include Senior Vice President and Chief Financial Officer of UNOVA, Inc. (1997-2005), and Senior Vice President and Chief Financial Officer of Western Atlas Inc (1996-1997).
Hayward D. Fisk joined the Company in 1989 as Vice President, General Counsel and Secretary. Prior to joining the Company, he was associated for 21 years with Sprint Corporation (formerly United Telecommunications, Inc.), in various legal and executive officer positions, most recently as Vice President and Associate General Counsel.
Harvey N. Bernstein joined the Company as Assistant General Counsel in 1983. He became Vice President, Global Legal Compliance and Assistant Secretary in 2003 after being elected a Vice President in 1988 and thereafter serving as Deputy General Counsel and Assistant Secretary. Prior to joining the Company, he specialized in government procurement law at the firm of Fried, Frank, Harris, Shriver & Jacobson in Washington, D.C.
Donald G. DeBuck joined the Company in 1979 and was elected Vice President and Controller in August 2001. Previous positions within the Company include Assistant Controller (1998-2001) and Vice President of Finance and Administration, Communications Industry Services (1996-1998).
Thomas R. Irvin joined the Company as Assistant Treasurer in 1987 and was elected Vice President and Treasurer in November 2004. Prior to joining the Company, he held various financial and engineering positions with Ni-Cal Development Corporation, Raytheon and Dravo Corporation.
Paul T. Tucker joined the Company in 1996 as a Corporate Development executive, and in August 1997 was elected Vice President of Corporate Development. From 1990 to 1995 he was President and Chief Executive Officer of Knight-Ridder Financial, an electronic real-time financial market information company. Previously, he founded and served as President and Chief Technologist of HAL Communications Corp., a communications hardware and software company and was an Associate Professor and Senior Research Engineer at the University of Illinois.
PART II
Item 5. Market for the Registrant’s Common Equity, Related Stockholder Matters and Issuer Purchases of Equity Securities
(a) Holders
Common stock of Computer Sciences Corporation is listed and traded on the New York Stock Exchange under the ticker symbol “CSC.”
As of May 25, 2007 the number of registered shareholders of Computer Sciences Corporation’s common stock was 8,441. The table shows the high and low intra-day prices of the Company’s common stock as reported on the composite tape of the New York Stock Exchange for each quarter during the last two calendar years and through May 25, 2007.
| | | 2007 | | | 2006 | | | 2005 | |
Calendar Quarter | | High | | | Low | | | High | | | Low | | | High | | | Low | |
1st | | | 56.25 | | | | 50.38 | | | | 59.09 | | | | 48.01 | | | | 56.51 | | | | 44.03 | |
2nd | | | 59.13 | * | | | 51.55 | * | | | 60.39 | | | | 48.26 | | | | 48.87 | | | | 42.31 | |
3rd | | | | | | | | | | | 53.80 | | | | 46.23 | | | | 47.60 | | | | 43.49 | |
4th | | | | | | | | | | | 54.13 | | | | 47.48 | | | | 59.90 | | | | 44.25 | |
* Through May 25, 2007
It has been the Company’s policy to invest earnings in the growth of the Company rather than distribute earnings as dividends. This policy, under which dividends have not been paid since fiscal 1969, is expected to continue, but is subject to review by the Board of Directors. Under the Company’s most restrictive covenant requirement, $4,250.6 million of retained earnings was available for cash dividends at March 30, 2007.
(b) Purchases of Equity Securities
The following table provides information on a monthly basis for the fourth quarter ended March 30, 2007 with respect to the Company’s purchases of equity securities.
Period | | Total Number of Shares Purchased (1) | | | Average Price Paid Per Share | | Total Number Of Shares Purchased as Part of Publicly Announced Plans or Programs | | Maximum Number of Shares that May Yet Be Purchased Under the Plans or Program | |
| December 29, 2006 to January 26, 2007 | | | | | | | | | | 2,991,766 | |
| January 27, 2007 to February 23, 2007 | | | 170 | | | | 54.69 | | | | | 2,991,766 | |
| February 24, 2007 to March 30, 2007 | | | | | | | | | | | | 2,991,766 | |
| (1) | The Company accepted 170 shares of its common stock in the fourth quarter ended March 30, 2007 from employees in lieu of cash due to the Company in connection with the exercise of stock options. Such shares of common stock are stated at cost and held as treasury shares to be used for general corporate purposes. |
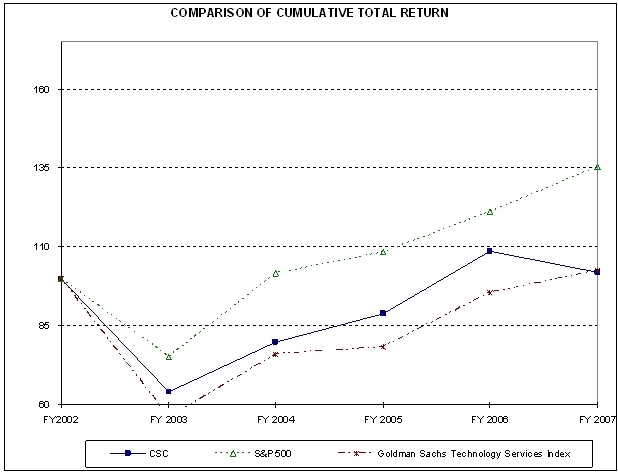
Performance Graph
The following graph compares the cumulative total return on CSC stock during the last five fiscal years with the cumulative total return on the Standard & Poor’s 500 Stock Index and the Goldman Sachs Technology Services Index.
CSC Total Shareholder Return
(Period Ended March 30, 2007)
Indexed Return (2002 = 100) | |
| | | | | | | | | | | | | | | | | | | |
| | | Return 2003 | | | Return 2004 | | | Return 2005 | | | Return 2006 | | | Return 2007 | | | CAGR | |
| CSC Common Stock | | | -35.86 | % | | | 24.44 | % | | | 11.42 | % | | | 22.30 | % | | | -6.16 | % | | | 0.41 | % |
| S&P 500 Index | | | -24.76 | % | | | 35.12 | % | | | 6.69 | % | | | 11.73 | % | | | 11.83 | % | | | 6.27 | % |
| Goldman Sachs Technology Services Index | | | -44.16 | % | | | 36.27 | % | | | 3.06 | % | | | 21.75 | % | | | 7.42 | % | | | 0.51 | % |
| | | | | | | | | | | | | | | | | | | | | | | | | |
Assumes $100 invested on April 1, 2002 in Computer Sciences Corporation Common Stock, the S&P 500 Index, and the Goldman Sachs Technology Services Index. Indexed amounts and return percentages assume a March 31 fiscal year end.
Item 6. Selected Financial Data
COMPUTER SCIENCES CORPORATION
| | | Five Year Review | |
In millions except per-share amounts | | March 30, 2007 | | | March 31, 2006 | | | April 1, 2005 | | | April 2, 2004 | | | March 28, 2003 | |
| | | | | | As Restated (1)(2) | | | As Restated (2) | | | As Restated (2) | | | As Restated (2) | |
| | | | | | | | | | | | | | | | |
| Total Assets | | $ | 13,730.5 | | | $ | 13,021.7 | | | $ | 12,603.2 | | | $ | 11,752.8 | | | $ | 10,356.7 | |
| Debt: | | | | | | | | | | | | | | | | | | | | |
Long-term | | | 1,412.2 | | | | 1,376.8 | | | | 1,303.0 | | | | 2,306.4 | | | | 2,204.7 | |
Short-term | | | 51.9 | | | | 56.6 | | | | 78.4 | | | | 52.9 | | | | 249.9 | |
Current maturities | | | 41.8 | | | | 28.7 | | | | 7.3 | | | | 7.2 | | | | 24.7 | |
Total | | | 1,505.9 | | | | 1,462.1 | | | | 1,388.7 | | | | 2,366.5 | | | | 2,479.3 | |
| Stockholders' equity | | | 5,885.5 | | | | 6,505.4 | | | | 6,314.2 | | | | 5,367.6 | | | | 4,469.7 | |
| Working capital | | | 1,446.8 | | | | 1,923.6 | | | | 1,670.6 | | | | 1,894.7 | | | | 1,406.2 | |
| Property and equipment: | | | | | | | | | | | | | | | | | | | | |
At cost | | | 5,612.9 | | | | 5,367.9 | | | | 5,520.3 | | | | 4,988.9 | | | | 4,131.2 | |
Accumulated depreciation and | | | | | | | | | | | | | | | | | | | | |
amortization | | | 3,073.8 | | | | 3,047.8 | | | | 3,154.9 | | | | 2,818.9 | | | | 2,152.6 | |
Property and equipment, net | | | 2,539.1 | | | | 2,320.1 | | | | 2,365.4 | | | | 2,170.0 | | | | 1,978.6 | |
| Current assets to current liabilities | | 1.3:1 | | | 1.4:1 | | | 1.4:1 | | | 1.6:1 | | | 1.5:1 | |
| Debt to total capitalization | | | 20.4 | % | | | 18.4 | % | | | 18.0 | % | | | 30.6 | % | | | 35.7 | % |
| Book value per share | | $ | 33.96 | | | $ | 34.74 | | | $ | 33.02 | | | $ | 28.57 | | | $ | 23.93 | |
| Stock price range (high) | | | 60.39 | | | | 59.90 | | | | 58.00 | | | | 47.00 | | | | 50.10 | |
(low) | | | 46.23 | | | | 42.31 | | | | 38.07 | | | | 26.52 | | | | 24.30 | |
| (1) | See the "Explanatory Note" immediately preceding Part I, Item 1 and Note 2, "Restatement of Consolidated Financial Statements," in Notes to Consolidated Financial Statements of this Form 10-K. |
| (2) | The Selected Financial Data for March 31, 2006, April 1, 2005, April 2, 2004 and March 28, 2003 have been restated to reflect adjustments related to stock-based compensation expense and the associated tax impact, the correction of errors relating to the accounting for income taxes and the recognition of revenue for the sale of licenses for a software product, as further described in the “Explanatory Note” immediately preceding Part I, Item 1 of this Form 10-K. |
Five-Year Review (Continued)
| | | March 31, 2006 | |
| | | | | | Adjustments | | | | |
| | | As Reported | | | Revenue Recognition | | | Stock Options | | | Income Taxes | | | Other | | | As Restated | |
| | | | | | | | | | | | | | | | | | | |
| Total Assets | | $ | 13,029.6 | | | $ | (34.4 | ) | | $ | 25.3 | | | $ | 1.2 | | | | | | $ | 13,021.7 | |
| Debt: | | | | | | | | | | | | | | | | | | | | | | | |
Long-term | | | 1,376.8 | | | | | | | | | | | | | | | | | | | 1,376.8 | |
Short-term | | | 56.6 | | | | | | | | | | | | | | | | | | | 56.6 | |
Current maturities | | | 28.7 | | | | | | | | | | | | | | | | | | | 28.7 | |
Total | | | 1,462.1 | | | | | | | | | | | | | | | | | | | 1,462.1 | |
| Stockholders' equity | | | 6,771.9 | | | | (24.0 | ) | | | 25.3 | | | | (267.2 | ) | | $ | (0.6 | ) | | | 6,505.4 | |
| Working capital | | | 2,164.8 | | | | (3.3 | ) | | | | | | | (237.3 | ) | | | (0.6 | ) | | | 1,923.6 | |
| Property and equipment: | | | | | | | | | | | | | | | | | | | | | | | | |
At cost | | | 5,367.9 | | | | | | | | | | | | | | | | | | | | 5,367.9 | |
Accumulated depreciation and | | | | | | | | | | | | | | | | | | | | | | | | |
amortization | | | 3,047.8 | | | | | | | | | | | | | | | | | | | | 3,047.8 | |
Property and equipment, net | | | 2,320.1 | | | | | | | | | | | | | | | | | | | | 2,320.1 | |
| Current assets to current liabilities | | 1.5:1 | | | | | | | | | | | (0.1):1 | | | | | | | 1.4:1 | |
| Debt to total capitalization | | | 17.8 | % | | | 0.1 | | | | (0.1 | ) | | | 0.6 | | | | | | | | 18.4 | % |
| Book value per share | | | 36.16 | | | | (0.13 | ) | | | 0.14 | | | | (1.43 | ) | | | | | | | 34.74 | |
| Stock (high) | | | 59.90 | | | | | | | | | | | | | | | | | | | | 59.90 | |
| Stock (low) | | | 42.31 | | | | | | | | | | | | | | | | | | | | 42.31 | |
| | | April 1, 2005 | |
| | | | | | Adjustments | | | | |
| | | As Reported | | | Revenue Recognition | | | Stock Options | | | Income Taxes | | | Other | | | As Restated | |
| | | | | | | | | | | | | | | | | | | |
| Total Assets | | $ | 12,633.9 | | | $ | (55.4 | ) | | $ | 20.6 | | | $ | 4.1 | | | | | | $ | 12,603.2 | |
| Debt: | | | | | | | | | | | | | | | | | | | | | | | |
Long-term | | | 1,303.0 | | | | | | | | | | | | | | | | | | | 1,303.0 | |
Short-term | | | 78.4 | | | | | | | | | | | | | | | | | | | 78.4 | |
Current maturities | | | 7.3 | | | | | | | | | | | | | | | | | | | 7.3 | |
Total | | | 1,388.7 | | | | | | | | | | | | | | | | | | | 1,388.7 | |
| Stockholders' equity | | | 6,494.7 | | | | (38.2 | ) | | | 20.6 | | | | (162.3 | ) | | $ | (0.6 | ) | | | 6,314.2 | |
| Working capital | | | 1,811.9 | | | | (2.0 | ) | | | | | | | (138.7 | ) | | | (0.6 | ) | | | 1,670.6 | |
| Property and equipment: | | | | | | | | | | | | | | | | | | | | | | | | |
At cost | | | 5,520.3 | | | | | | | | | | | | | | | | | | | | 5,520.3 | |
Accumulated depreciation and | | | | | | | | | | | | | | | | | | | | | | | | |
amortization | | | 3,154.9 | | | | | | | | | | | | | | | | | | | | 3,154.9 | |
Property and equipment, net | | | 2,365.4 | | | | | | | | | | | | | | | | | | | | 2,365.4 | |
| Current assets to current liabilities | | 1.5:1 | | | | | | | | | | | (0.1):1 | | | | | | | 1.4:1 | |
| Debt to total capitalization | | | 17.6 | % | | | 0.1 | | | | (0.1 | ) | | | 0.4 | | | | | | | | 18.0 | % |
| Book value per share | | | 33.97 | | | | (0.20 | ) | | | 0.11 | | | | (0.86 | ) | | | | | | | 33.02 | |
| Stock (high) | | | 58.00 | | | | | | | | | | | | | | | | | | | | 58.00 | |
| Stock (low) | | | 38.07 | | | | | | | | | | | | | | | | | | | | 38.07 | |
| Five-Year Review (Continued) |
| | | April 2, 2004 | |
| | | | | | Adjustments | | | |
| | | As Reported | | | Revenue Recognition | | | Stock Options | | | Income Taxes | | Other | | As Restated | |
| | | | | | | | | | | | | | | | | |
| Total Assets | | $ | 11,804.0 | | | $ | (74.3 | ) | | $ | 20.0 | | | $ | 3.1 | | | | $ | 11,752.8 | |
| Debt: | | | | | | | | | | | | | | | | | | | | | |
Long-term | | | 2,306.4 | | | | | | | | | | | | | | | | | 2,306.4 | |
Short-term | | | 52.9 | | | | | | | | | | | | | | | | | 52.9 | |
Current maturities | | | 7.2 | | | | | | | | | | | | | | | | | 7.2 | |
Total | | | 2,366.5 | | | | | | | | | | | | | | | | | 2,366.5 | |
| Stockholders' equity | | | 5,503.7 | | | | (51.1 | ) | | | 20.0 | | | | (105.0 | ) | | | | 5,367.6 | |
| Working capital | | | 1,974.1 | | | | 3.4 | | | | | | | | (82.8 | ) | | | | 1,894.7 | |
| Property and equipment: | | | | | | | | | | | | | | | | | | | | | |
At cost | | | 4,988.9 | | | | | | | | | | | | | | | | | 4,988.9 | |
Accumulated depreciation and | | | | | | | | | | | | | | | | | | | | | |
amortization | | | 2,818.9 | | | | | | | | | | | | | | | | | 2,818.9 | |
Property and equipment, net | | | 2,170.0 | | | | | | | | | | | | | | | | | 2,170.0 | |
| Current assets to current liabilities | | 1.6:1 | | | | | | | | | | | | | | | | 1.6:1 | |
| Debt to total capitalization | | | 30.1 | % | | | 0.2 | | | | (0.1 | ) | | | 0.4 | | | | | 30.6 | % |
| Book value per share | | | 29.30 | | | | (0.27 | ) | | | 0.11 | | | | (0.57 | ) | | | | 28.57 | |
| Stock (high) | | | 47.00 | | | | | | | | | | | | | | | | | 47.00 | |
| Stock (low) | | | 26.52 | | | | | | | | | | | | | | | | | 26.52 | |
| | | March 28, 2003 | |
| | | | | | Adjustments | | | |
| | | As Reported | | | Revenue Recognition | | | Stock Options | | | Income Taxes | | Other | | As Restated | |
| | | | | | | | | | | | | | | | | |
| Total Assets | | $ | 10,433.2 | | | $ | (92.4 | ) | | $ | 13.5 | | | $ | 2.4 | | | | $ | 10,356.7 | |
| Debt: | | | | | | | | | | | | | | | | | | | | | |
Long-term | | | 2,204.7 | | | | | | | | | | | | | | | | | 2,204.7 | |
Short-term | | | 249.9 | | | | | | | | | | | | | | | | | 249.9 | |
Current maturities | | | 24.7 | | | | | | | | | | | | | | | | | 24.7 | |
Total | | | 2,479.3 | | | | | | | | | | | | | | | | | 2,479.3 | |
| Stockholders' equity | | | 4,606.4 | | | | (63.5 | ) | | | 13.5 | | | | (86.7 | ) | | | | 4,469.7 | |
| Working capital | | | 1,475.3 | | | | 1.9 | | | | | | | | (71.0 | ) | | | | 1,406.2 | |
| Property and equipment: | | | | | | | | | | | | | | | | | | | | | |
At cost | | | 4,131.2 | | | | | | | | | | | | | | | | | 4,131.2 | |
Accumulated depreciation and | | | | | | | | | | | | | | | | | | | | | |
amortization | | | 2,152.6 | | | | | | | | | | | | | | | | | 2,152.6 | |
Property and equipment, net | | | 1,978.6 | | | | | | | | | | | | | | | | | 1,978.6 | |
| Current assets to current liabilities | | 1.5:1 | | | | | | | | | | | | | | | | 1.5:1 | |
| Debt to total capitalization | | | 35.0 | % | | | 0.3 | | | | (0.1 | ) | | | 0.5 | | | | | 35.7 | % |
| Book value per share | | | 24.66 | | | | (0.34 | ) | | | 0.07 | | | | (0.46 | ) | | | | 23.93 | |
| Stock (high) | | | 50.10 | | | | | | | | | | | | | | | | | 50.10 | |
| Stock (low) | | | 24.30 | | | | | | | | | | | | | | | | | 24.30 | |
Five-Year Review (Continued)
| | | Fiscal Year | |
In millions except per-share amounts | | 2007 | | | 2006 | | | 2005 | | | 2004 | | | 2003 | |
| | | | | | As Restated (1)(2) | | | As Restated (1)(2) | | | As Restated (2) | | | As Restated (2) | |
| Revenues | | $ | 14,856.6 | | | $ | 14,639.0 | | | $ | 14,080.0 | | | $ | 13,468.5 | | | $ | 11,167.6 | |
| Costs of services (excludes depreciation and amortization) | | | 11,817.8 | | | | 11,724.0 | | | | 11,320.1 | | | | 10,834.2 | | | | 8,931.7 | |
| Selling, general and administrative | | | 916.4 | | | | 862.5 | | | | 856.7 | | | | 804.6 | | | | 696.2 | |
| Depreciation and amortization | | | 1,073.6 | | | | 1,091.8 | | | | 1,051.0 | | | | 966.0 | | | | 799.7 | |
| Interest, net | | | 125.7 | | | | 80.1 | | | | 143.3 | | | | 162.3 | | | | 136.1 | |
| Special items | | | 316.1 | | | | 77.3 | | | | 28.6 | | | | 22.7 | | | | 1.3 | |
| Total costs and expenses | | | 14,249.6 | | | | 13,835.7 | | | | 13,399.7 | | | | 12,789.8 | | | | 10,565.0 | |
| Income before taxes | | | 607.0 | | | | 803.3 | | | | 680.3 | | | | 678.7 | | | | 602.6 | |
| Taxes on income | | | 218.2 | | | | 332.2 | | | | 236.0 | | | | 218.4 | | | | 185.9 | |
| Income from continuing operations | | $ | 388.8 | | | $ | 471.1 | | | $ | 444.3 | | | $ | 460.3 | | | $ | 416.7 | |
| Basic earnings per common share, continuing operations | | $ | 2.21 | | | $ | 2.54 | | | $ | 2.34 | | | $ | 2.46 | | | $ | 2.42 | |
| Diluted earnings per common share, continuing operations | | $ | 2.16 | | | $ | 2.51 | | | $ | 2.31 | | | $ | 2.44 | | | $ | 2.41 | |
| Average common shares outstanding | | | 176.263 | | | | 185.693 | | | | 189.575 | | | | 187.273 | | | | 172.317 | |
| Average common shares outstanding assuming dilution | | | 179.733 | | | | 187.984 | | | | 191.936 | | | | 188.648 | | | | 173.147 | |
Notes:
Fiscal 2007 special items represent charges related to the restructuring and a true-up of an impairment charge related to the termination of the Nortel Networks contract offset by a gain from the redemption of Dyncorp International preferred stock.
Fiscal 2006 special items represent charges related to the termination, per an agreement made with Nortel Networks, of the Company’s services for certain information technology outsourcing activities, see Note 7 to the consolidated financial statements. Fiscal 2005 special items represent charges related to the early retirement of debt. Fiscal 2004 and 2003 special items relate to exit and disposal activities.
No dividends were paid by CSC during the five years presented.
The consolidated financial statements included in Item 8 of this Annual Report present income from discontinued operations, the gain on sale of discontinued operations, and the cumulative effect of a change in accounting principle.
| (1) | See the "Explanatory Note" immediately preceding Part I, Item 1 and Note 2, "Restatement of Consolidated Financial Statements," in Notes to Consolidated Financial Statements of this Form 10-K. |
| (2) | The Selected Financial Data for fiscal years 2006, 2005, 2004 and 2003 have been restated to reflect adjustments related to stock-based compensation expense and the associated tax impact, the correction of errors relating to the accounting for income taxes and the recognition of revenue for the sale of licenses for a software product, as further described in the “Explanatory Note” immediately preceding Part I, Item 1 of the Form 10-K. The following table presents the effects of these adjustments made to the Company’s previously reported Selected Financial Data for these periods: |
Five-Year Review (Continued)
| | | Fiscal Year 2006 | |
| | | | | | Adjustments | | | | |
In millions except per-share amounts | | As Reported | | | Revenue Recognition | | | Stock Options | | | Income Taxes | | | Other | | | As Restated | |
| Revenues | | $ | 14,615.6 | | | $ | 23.4 | | | | | | | | | | | | $ | 14,639.0 | |
Costs of services (excludes depreciation and amortization) | | | 11,719.8 | | | | | | | $ | 4.3 | | | | | | $ | (0.1 | ) | | | 11,724.0 | |
| Selling, general and administrative | | | 842.2 | | | | | | | | 16.3 | | | $ | 4.0 | | | | | | | | 862.5 | |
| Depreciation and amortization | | | 1,091.8 | | | | | | | | | | | | | | | | | | | | 1,091.8 | |
| Interest, net | | | 63.4 | | | | | | | | | | | | 16.7 | | | | | | | | 80.1 | |
| Special items | | | 77.3 | | | | | | | | | | | | | | | | | | | | 77.3 | |
| Total costs and expenses | | | 13,794.5 | | | | | | | | 20.6 | | | | 20.7 | | | | (0.1 | ) | | | 13,835.7 | |
| Income from continuing operations before taxes | | | 821.1 | | | | 23.4 | | | | (20.6 | ) | | | (20.7 | ) | | | 0.1 | | | | 803.3 | |
| Taxes on income | | | 244.1 | | | | 9.3 | | | | (5.4 | ) | | | 84.2 | | | | | | | | 332.2 | |
| Income from continuing operations | | | 577.0 | | | | 14.1 | | | | (15.2 | ) | | | (104.9 | ) | | | 0.1 | | | | 471.1 | |
| Basic | | $ | 3.11 | | | $ | 0.08 | | | $ | (0.08 | ) | | $ | (0.57 | ) | | | | | | $ | 2.54 | |
| Diluted | | $ | 3.07 | | | $ | 0.08 | | | $ | (0.08 | ) | | $ | (0.56 | ) | | | | | | $ | 2.51 | |
| Average common shares outstanding | | | 185.693 | | | | | | | | | | | | | | | | | | | | 185.693 | |
Average common shares outstanding assuming dilution | | | 187.695 | | | | | | | | 0.289 | | | | | | | | | | | | 187.984 | |
| | | Fiscal Year 2005 | |
| | | | | | Adjustments | | | | |
In millions except per-share amounts | | As Reported | | | Revenue Recognition | | | Stock Options | | | Income Taxes | | | Other | | | As Restated | |
| Revenues | | $ | 14,058.6 | | | $ | 21.4 | | | | | | | | | | | | $ | 14,080.0 | |
Costs of services (excludes depreciation and amortization) | | | 11,315.1 | | | | | | | $ | 3.9 | | | | | | $ | 1.1 | | | | 11,320.1 | |
| Selling, general and administrative | | | 807.8 | | | | | | | | 4.5 | | | $ | 44.4 | | | | | | | | 856.7 | |
| Depreciation and amortization | | | 1,051.0 | | | | | | | | | | | | | | | | | | | | 1,051.0 | |
| Interest, net | | | 140.7 | | | | | | | | | | | | 2.6 | | | | | | | | 143.3 | |
| Special items | | | 28.6 | | | | | | | | | | | | | | | | | | | | 28.6 | |
| Total costs and expenses | | | 13,343.2 | | | | | | | | 8.4 | | | | 47.0 | | | | 1.1 | | | | 13,399.7 | |
| Income from continuing operations before taxes | | | 715.4 | | | | 21.4 | | | | (8.4 | ) | | | (47.0 | ) | | | (1.1 | ) | | | 680.3 | |
| Taxes on income | | | 219.0 | | | | 8.5 | | | | (1.1 | ) | | | 10.1 | | | | (.5 | ) | | | 236.0 | |
| Income from continuing operations | | | 496.4 | | | | 12.9 | | | | (7.3 | ) | | | (57.1 | ) | | | (.6 | ) | | | 444.3 | |
| Basic | | $ | 2.62 | | | $ | 0.07 | | | $ | (0.04 | ) | | $ | (0.31 | ) | | | | | | $ | 2.34 | |
| Diluted | | $ | 2.59 | | | $ | 0.07 | | | $ | (0.04 | ) | | $ | (0.31 | ) | | | | | | $ | 2.31 | |
| Average common shares outstanding | | | 189.575 | | | | | | | | | | | | | | | | | | | | 189.575 | |
Average common shares outstanding assuming dilution | | | 191.799 | | | | | | | | 0.137 | | | | | | | | | | | | 191.936 | |
Five-Year Review (Continued)
| | | Fiscal Year 2004 | |
| | | | | | Adjustments | | | | |
In millions except per-share amounts | | As Reported | | | Revenue Recognition | | | Stock Options | | | Income Taxes | | | Other | | | As Restated | |
| Revenues | | $ | 13,447.9 | | | $ | 20.6 | | | | | | | | | | | | $ | 13,468.5 | |
Costs of services (excludes depreciation and amortization) | | | 10,828.2 | | | | | | | $ | 6.0 | | | | | | | | | | 10,834.2 | |
| Selling, general and administrative | | | 793.7 | | | | | | | | 8.1 | | | $ | 2.8 | | | | | | | 804.6 | |
| Depreciation and amortization | | | 966.0 | | | | | | | | | | | | | | | | | | | 966.0 | |
| Interest, net | | | 160.6 | | | | | | | | | | | | 1.7 | | | | | | | 162.3 | |
| Special items | | | 22.7 | | | | | | | | | | | | | | | | | | | 22.7 | |
| Total costs and expenses | | | 12,771.2 | | | | | | | | 14.1 | | | | 4.5 | | | | | | | 12,789.8 | |
| Income from continuing operations before taxes | | | 676.7 | | | | 20.6 | | | | (14.1 | ) | | | (4.5 | ) | | | | | | 678.7 | |
| Taxes on income | | | 200.5 | | | | 8.1 | | | | (5.2 | ) | | | 14.0 | | | | 1.0 | | | | 218.4 | |
| Income from continuing operations | | | 476.2 | | | | 12.5 | | | | (8.9 | ) | | | (18.5 | ) | | | (1.0 | ) | | | 460.3 | |
| Basic | | $ | 2.54 | | | $ | 0.07 | | | $ | (0.05 | ) | | $ | (0.10 | ) | | | | | | $ | 2.46 | |
| Diluted | | $ | 2.52 | | | $ | 0.07 | | | $ | (0.05 | ) | | $ | (0.10 | ) | | | | | | $ | 2.44 | |
| Average common shares outstanding | | | 187.273 | | | | | | | | | | | | | | | | | | | | 187.273 | |
Average common shares outstanding assuming dilution | | | 188.704 | | | | | | | | (0.056 | ) | | | | | | | | | | | 188.648 | |
| | | Fiscal Year 2003 | |
| | | | | | Adjustments | | | |
In millions except per-share amounts | | As Reported | | | Revenue Recognition | | | Stock Options | | | Income Taxes | | Other | | As Restated | |
| Revenues | | $ | 11,162.3 | | | $ | 5.3 | | | | | | | | | | $ | 11,167.6 | |
Costs of services (excludes depreciation and amortization) | | | 8,934.9 | | | | | | | $ | (3.2 | ) | | | | | | | 8,931.7 | |
| Selling, general and administrative | | | 699.5 | | | | | | | | (3.3 | ) | | | | | | | 696.2 | |
| Depreciation and amortization | | | 799.7 | | | | | | | | | | | | | | | | 799.7 | |
| Interest, net | | | 134.3 | | | | | | | | | | | | 1.8 | | | | | 136.1 | |
| Special items | | | 1.3 | | | | | | | | | | | | | | | | | 1.3 | |
| Total costs and expenses | | | 10,569.7 | | | | | | | | (6.5 | ) | | | 1.8 | | | | | 10,565.0 | |
| Income from continuing operations before taxes | | | 592.6 | | | | 5.3 | | | | 6.5 | | | | (1.8 | ) | | | | 602.6 | |
| Taxes on income | | | 164.1 | | | | 2.1 | | | | 2.5 | | | | 17.2 | | | | | 185.9 | |
| Income from continuing operations | | | 428.5 | | | | 3.2 | | | | 4.0 | | | | (19.0 | ) | | | | 416.7 | |
| Basic | | $ | 2.49 | | | $ | 0.02 | | | $ | (0.02 | ) | | $ | (0.07 | ) | | | $ | 2.42 | |
| Diluted | | $ | 2.48 | | | $ | 0.02 | | | $ | (0.02 | ) | | $ | (0.07 | ) | | | $ | 2.41 | |
| Average common shares outstanding | | | 172.317 | | | | | | | | | | | | | | | | | 172.317 | |
Average common shares outstanding assuming dilution | | | 173.119 | | | | | | | | 0.028 | | | | | | | | | 173.147 | |
Item 7. Management’s Discussion and Analysis of Financial Condition and Results of Operations
Note: The following Management’s Discussion and Analysis of Financial Condition and Results of Operations has been revised for the effects of the restatement discussed in Note 2 in the Notes to Consolidated Financial Statements.
GENERAL
The following discussion and analysis provides information management believes is relevant to an assessment and understanding of the consolidated results of operations and financial condition of Computer Sciences Corporation (CSC or the Company). The discussion should be read in conjunction with the Company’s consolidated financial statements and notes thereto for the year ended March 30, 2007. There are three primary objectives of this discussion:
| 1) | to provide a narrative explanation of the consolidated financial statements, as presented through the eyes of management; |
| 2) | to enhance the disclosures in the consolidated financial statements and footnotes, providing context within which the consolidated financial statements should be analyzed; and |
| 3) | to provide information to assist the reader in ascertaining the predictive value of the reported financial results. |
To achieve these objectives, the discussion is presented in the following sections:
Overview—includes a brief description of the business and how it earns revenue and generates cash, as well as a discussion of the key business drivers, economic and industry factors, fiscal 2007 highlights and fiscal 2008 commentary.
Results of Operations—discusses year-over-year changes to operating results for fiscal 2005 to 2007, describing the factors affecting revenue on a consolidated and reporting segment basis, including new contracts, acquisitions and currency impacts, and also by describing the factors affecting changes in the major cost and expense categories.
Financial Condition—discusses causes of changes in cash flows and describes the Company’s liquidity position and available capital resources.
Critical Accounting Estimates—discusses accounting policies that require critical judgments and estimates.
OVERVIEW
The Company’s primary service offerings are outsourcing and I/T and professional services. Outsourcing activities include operating all or a portion of a customer’s technology infrastructure and applications, and business process outsourcing. I/T and professional services include systems integration, consulting and other professional services and software systems sales and related services. CSC provides these services to customers in the Global Commercial and North American Public Sector markets. On a geographic basis, CSC provides services to Global Commercial customers in the United States, Europe and other international locations. Operations in Australia, Asia and Canada generate substantially all revenue within Other International.
Economic and Industry Factors
Global Commercial markets are affected by various economic and industry factors. The economic environment in the regions CSC serves will impact customers’ decisions for discretionary spending on I/T projects. CSC is in a highly competitive industry which exerts downward pressure on pricing and requires companies to continually seek ways to differentiate themselves through several factors, including service offerings and flexibility. Management monitors industry factors including relative market shares, growth rates, billing rates, staff utilization rates and margins as well as macroeconomic indicators such as interest rates, inflation rates and foreign currency rates.
The North American Public Sector market is also highly competitive and has unique characteristics. All U.S. government contracts and subcontracts may be modified, curtailed or terminated at the convenience of the government if program requirements or budgetary constraints change. In the event that a contract is terminated for convenience, the Company generally is reimbursed for its allowable costs through the date of termination and is paid a proportionate amount of the stipulated profit or fee attributable to the work performed. Shifting priorities of the U.S. government can also impact the future of projects. The Company recognized the U.S. government’s increased priorities on defense and homeland security programs and has focused business development efforts in these areas. Management monitors government priorities and industry factors through numerous industry and government publications and forecasts, legislative activity, budgeting and appropriation processes and by participating in industry professional associations.
Business Drivers
Revenue is generated by providing services on a variety of contract vehicles lasting from less than six months to 10 years or more. Factors affecting revenue include:
| · | the Company’s ability to successfully bid on and win new contract awards, |
| · | the ability to satisfy existing customers and obtain add-on business and win contract re-competes, |
| · | the ability to compete on price, services offered, technical ability, experience and flexibility, |
| · | the ability to successfully identify and integrate acquisitions and leverage them to generate new revenues, |
| · | the ability to successfully identify and divest non-core operations which may impact revenue in the short-term but provide resources to pursue longer-term growth and value creation opportunities, and |
| · | currency fluctuations related to international operations. |
Earnings are driven by the above revenue factors, in addition to the following:
| · | the ability to control costs, particularly labor costs, subcontractor expenses and overhead costs including healthcare, pension and general and administrative costs, |
| · | the ability to anticipate headcount needs to avoid staff shortages or excesses, |
| · | the ability to accurately estimate various factors incorporated in contract bids and proposals, and |
| · | the ability to develop offshore capabilities and migrate compatible service offerings offshore. |
Cash flows are impacted by the above earnings factors, in addition to other factors including the following:
| · | timely management of receivables and payables, |
| · | investment opportunities available, particularly related to business acquisitions and dispositions and large outsourcing contracts, and |
| · | the ability to efficiently manage capital including debt and equity instruments. |
Key Performance Indicators
The Company manages and assesses the performance of its business through various means, with the primary financial measures including new contract wins, revenue growth, margins, cash flow and return on investment.
New contract wins—In addition to being a primary driver of future revenue, focusing on new contract wins also provides management an assessment of the Company’s ability to compete. The total level of wins tends to fluctuate from year to year depending on the timing of new and recompeted contracts as well as numerous external factors. CSC employs stringent financial and operational reviews and discipline in the new contract process to evaluate risks and generate appropriate margins and returns from new contracts.
Revenue growth—Year-over-year revenues tend to vary less than new contract wins, and reflect performance on both new and existing contracts. With a wide array of services offered, the Company is able to pursue additional work from existing customers. In addition, incremental increases in revenue will not necessarily result in linear increases in costs, particularly overhead and other indirect costs, thus potentially improving profit margins. Foreign currency fluctuations also impact revenue growth.
Margins—Margins reflect the Company’s performance on contracts and ability to control costs. While the ratios of various cost elements as a percentage of revenue can shift as a result of acquisitions or dispositions of business with different cost profiles, a focus on maintaining and improving overall margins leads to improved efficiencies and profitability. Although the majority of the Company’s costs are denominated in the same currency as revenues, increased use of offshore support also exposes CSC to additional margin fluctuations.
Cash flow—Over time the primary drivers of the Company’s cash flow are earnings provided by the Company’s operations and the use of capital to generate those earnings. Also contributing to short term cash flow results are movements in current asset and liability balances. The Company also regularly reviews the U.S. Generally Accepted Accounting Principles (GAAP) cash flow measurements of operating, investing and financing cash flows, as well as non-GAAP free cash flow.
Return on investment (ROI)—ROI is an effective indicator combining a focus on margins with efficient and productive net asset utilization. A combination of strong margins (measuring how efficiently profit is generated from revenue) and investment base turnover (measuring how effectively revenue is generated from investors’ capital) is required to generate sufficient returns on capital. Strong working capital management also serves to minimize investment capital and increase returns.
Readers should be cautioned that Days Sales Outstanding (DSO), free cash flow and ROI are not GAAP measures, and the Company’s definition of such measures may differ from other companies. Therefore, such measures may not be comparable to those of other companies. CSC thinks these non-GAAP financial measures provide useful information to investors regarding the Company’s financial condition and results of operations as they provide another measure of the Company’s performance and ability to service its debt. CSC calculates DSO as follows: Total receivables at quarter-end divided by revenue-per-day. Revenue-per-day equals total revenues for the quarter divided by the number of days in the fiscal quarter. Free cash flow is equal to the sum of 1) operating cash flows, 2) investing cash flows, excluding business acquisitions and dispositions, purchase or sale of available for sale securities and 3) capital lease payments. ROI is calculated by multiplying profit margin times investment base turnover. The profit margin used is profit before interest and special items and after tax divided by revenues. Investment base turnover equals revenues divided by average debt and equity.
Fiscal 2007 Highlights
Significant events during fiscal 2007 include:
| · | Revenues rose 1.5%, though declined 0.3% on a constant currency basis. |
| · | The Company recorded a special pretax restructuring charge of $333.4 million ($272.4 after tax or $1.52 per share) and a special pretax gain of $18.3 million ($11.2 million after tax or 6 cents per share). |
| · | Legal and other costs associated with the stock option investigation, including costs incurred to obtain debt covenant waivers and employee income taxes related to the stock option investigation were $22.3 million ($15.7 million after tax or 9 cents per share). |
| · | Income from continuing operations, including the restructuring charge, was $388.8 million compared to $471.1 million for the prior year a decline of 17.5%. |
| · | Continuing earnings per share, after special charges, were down 14%. The fiscal 2007 special charge of $1.46 per share, as compared to the prior year special charge of 26 cents per share, adversely impacted earnings per share from continuing operations compared to prior year by 40.3%. |
| · | Announced contract awards of $16.9 billion with new North American Public Sector awards of $7.7 billion, and new Global Commercial awards totaling $9.2 billion, an increase of 40% in announced awards from the prior year. |
| · | The Company entered into two accelerated share repurchase transactions during the year. In the first quarter of fiscal 2007 the Company acquired and retired 9.3 million shares of outstanding common shares for $500 million and during the second quarter the Company acquired and retired an additional 7.1 million shares for $500 million. |
| · | Free cash flow of $671.5 million increased $208.6 million from $462.9 million in fiscal 2006, including $207.2 million disbursed for restructuring activities, as well as approximately $190 million deferred income recognition and delayed payments on capital expenditures the magnitude of which are not representative of the Company’s ongoing cash flow trends. (1) |
| (1) | The following is a reconciliation of free cash flow to the most directly comparable Generally Accepted Accounting Principles (GAAP) financial measure: |
| | | Fiscal Year Ended | |
(in millions) | | March 30, 2007 | | | March 31, 2006 | | | April 1, 2005 | |
| Free cash flow | | $ | 671.5 | | | $ | 462.9 | | | $ | 493.9 | |
| Net cash used in investing activities | | | 872.7 | | | | 1,124.0 | | | | 595.4 | |
| Proceeds from redemption of preferred stock | | | 126.5 | | | | | | | | | |
| Acquisition, net of cash acquired | | | (134.3 | ) | | | (44.1 | ) | | | (20.5 | ) |
| Business dispositions | | | 2.8 | | | | .5 | | | | 819.1 | |
| Capital lease payments | | | 39.4 | | | | 8.0 | | | | 6.7 | |
| Sale of available-for-sale securities | | | | | | | | | | | 46.9 | |
| Net cash provided by operating activities | | $ | 1,578.6 | | | $ | 1,551.3 | | | $ | 1,941.5 | |
Capital lease payments and proceeds from the sale of property and equipment (included in investing activities) are included in the calculation of free cash flow. Prior periods have been adjusted to conform with this presentation.
| · | DSO was 94 days at year-end versus 87 days at the end of the prior year. |
| · | Debt-to-total capitalization ratio was 20.4% at year-end, an increase of 2.0% points from the prior year ratio. |
| · | ROI from continuing operations was 9.6% for the year a 2.1% point improvement from prior year. |
| The Company’s significant wins during fiscal 2007 included the following: |
| · | United Kingdom National Health Service ($3.7 billion), |
| · | Blue Scope Steel ($378 million), |
North American Public Sector:
| · | U.S. Army Program Executive Office for Enterprise Information Systems ($2.0 billion), |
| · | U.S. Agency for International Development ($800 million), |
| · | U.S Air Force Expeditionary Combat Support System ($378 million), |
| · | New York Department of Health ($276 million), and |
| · | U.S. Department of Health and Human Services ($243 million). |
These multi-year awards represent the estimated value of the Company’s portion at contract signing. They cannot be considered firm orders, however, due to their variable attributes, including demand-driven usage, modifications in scope of work due to changing customer requirements, annual funding constraints and indefinite delivery/indefinite quantity characteristics of major portions of the Company’s North American Public Sector activities.
The limited revenue growth, a decline on a constant currency basis, in the Global Commercial sector and the decrease in awards during the first half of fiscal 2007 reflect, in part, the impact on the Company’s ability to secure new awards as a result of the Company’s evaluation of strategic initiatives during the first part of the fiscal 2007 as well as the general trend in the industry towards smaller scope and/or shorter term outsourcing contracts. The majority of new awards for the Global Commercial sector, with the exception of the National Heath Service award, were awarded during the last half of the fiscal year. The North American Public Sector continued to win a share of U.S. federal government contracts as its total contract awards for fiscal 2007 increased by 30% from the previous fiscal year with contract awards from the Department of Defense continuing to lead the way. Currency shifts during fiscal 2007 favorably impacted revenue and largely offset declines in constant currency revenue in Europe.
The Company’s growth in prior years has created a broad, long-term global revenue base across numerous customers, industries, geographic regions and service offerings with approximately 79% of CSC’s revenues derived from long-term contracts including Global Commercial outsourcing and U.S. federal government engagements. This revenue base provides the Company with a relatively stable base of revenue during periods when contract awards may slow or the market for certain services softens.
A reduction in working capital was the result of an increase in payables and deferred income which was partially offset by increases in receivables and prepaid expenses as well as an increase in cash paid for taxes and cash paid for restructuring activities. The net effect was a modest increase in cash flow from operations for fiscal 2007. The increase in deferred income, approximately $340 million, is not expected to recur at a similar amount during fiscal 2008. Cash out-flow for investing activities declined from prior year as a result of lower levels of investment in outsourcing contracts and equipment. Contributing to the decline, the Company exited fiscal 2007 with capital expenditures unpaid and reflected in accounts payable of approximately $110 million in excess of usual levels of such activity. These purchases will be reported as fiscal 2008 outflows. Outflows for financing activities reflect the Company’s acquisition and retirement of 16.4 million shares of outstanding common stock during fiscal 2007.
Fiscal 2008 Commentary
As a leading federal contractor and one of the top I/T service providers to the U.S. federal government, CSC’s North American Public Sector is well-positioned to benefit from continued demand for I/T services in this market. The U.S. federal government is one of the world’s largest I/T services consumers, and its spending is expected to continue to increase during the upcoming year in order to improve technologies in the areas of defense, homeland security and civil agency modernization. While the ultimate distribution of U.S. federal funds and project assignments can vary, the Company expects its broad I/T and outsourcing capabilities to be viewed favorably by the U.S. federal government.
Global Commercial market awards during the fourth quarter of fiscal 2007 were the highest quarterly total during the past two fiscal years. This reversed the trend of the four quarters preceding the fourth quarter of fiscal 2007 which were adversely impacted by the market’s response to the Company’s consideration of strategic alternatives. A key success for the Company was the award of two additional regions for the implementation of a record keeping system for the United Kingdom’s National Health Service. The awards for commercial engagements during the fourth quarter of fiscal 2007 rebounded, and the pipeline of future prospects is showing some growth. The Company has been and will continue to be selective in new business pursuit opportunities given the focus on margin expansion and increasing return on investment. With respect to discretionary spending and project work, Central and Southern Europe continue to show areas of soft demand, and demand in North America for consulting and systems integration did not show significant improvement, while price pressures continue. While the future demand for outsourcing services is not known with certainty, the long-term nature of major outsourcing engagements allows CSC to benefit from a certain level of continuity. Growth during fiscal 2008 in Global Commercial revenue from new business awarded during fiscal 2007 is expected to be tempered by the continued demand for offshore services and the resulting pressure on prices. During fiscal 2007, the Company’s Global Commercial segment’s revenue was favorably impacted by currency fluctuations in Europe and Other International regions. The Company cannot forecast with certainty future movement in currency exchange rates or its impact on operating results.
Other trends the Company expects for fiscal 2008 are as follows:
| · | Revenue for the North American Public Sector for fiscal 2008 will benefit from its $9.2 billion of announced awards. This represents a $2.2 billion increase in awards during fiscal 2007. The North American Public Sector is expected to continue to grow at or above the revenue growth rate for fiscal 2007. The Company expects Global Commercial revenue growth to be tempered by the previous softness in new contract awards during the later part of fiscal 2006 and first half of fiscal 2007. In addition, adjustments of billing rates to industry benchmarks for certain significant outsourcing contracts awarded during fiscal 2005 and 2006, as these contracts mature, may also temper revenue growth for the Global Commercial segment. The demand for offshore services is expected to continue to increase as customers seek to lower costs and will present opportunity as well as temper revenue growth in Europe as well as the U.S. Commercial market. |
| · | The Company has identified and expects to pursue $29.4 billion of federal opportunities that will be awarded in fiscal 2008, plus an additional $17.3 billion during fiscal 2009. The Company expects to win a share of these awards. |
| · | Cash flow from operations for fiscal 2008 is expected to decrease slightly from the $1,578.6 million for fiscal 2007. Fiscal 2008 operating cash flow is expected to be adversely impacted by a decline in deferred income. |
| · | Cash outflow from investing activities is expected to increase from fiscal 2007 levels primarily as a result of investment in computers and related equipment in the U.S. Commercial and North American Public Sector and for capital assets acquired in fiscal 2007 but paid for during fiscal 2008. |
The Company’s overall short-term financial objectives include:
| 1. | Successfully launch the new contracts won during fiscal 2007. |
| 2. | Manage ongoing engagements to maximize revenue and margins. |
| 3. | Successfully close and integrate the acquisition of Covansys Corporation. |
| 4. | Effectively manage working capital and capital investment. |
| 5. | Maintain appropriate investment base turnover rates and operating margins, with particular emphasis on the new business, in order to improve return on investment. |
| 6. | Pursue the current pipeline of commercial and North American Public Sector opportunities and win a proportionate share. |
| 7. | Continue execution of the restructuring plan begun in fiscal 2007. |
The Company has recently defined and begun implementing a comprehensive growth strategy. This strategy is based upon a detailed assessment of the market place as well as input from current and potential customers. To implement the strategy, the Company launched Project Accelerate, which is comprised of five (5) key growth initiatives.
The five growth initiatives and the benefits the Company believes Project Accelerate offers to its key stakeholders are:
| · | Focus on enhancing industry-specific offerings and value proposition to clients. The Company is investing significantly to offer differentiated business solutions that combine technology, intellectual property, and industry expertise to improve its clients’ business results. The Company is focused on developing high value, technology-enabled business solutions, consulting services, and business process outsourcing offerings for the following key verticals: Financial Services; Healthcare; Manufacturing, including Aerospace & Defense; Public Sector; Chemical, Energy & National Resources; and Technology/Consumer. |
| · | Focus on aggressively growing and leveraging its India capabilities. The Company has launched an India Direct Sales channel to address customers’ needs for pure offshore services and to compete directly against low cost, offshore IT providers. The Company has been making and will continue to make investments to build out its India delivery capabilities for remote infrastructure management, application services, and business process offerings. Its pursuit and pending acquisition of Covansys Corporation signifies the Company’s commitment to expanding offshore selling and delivery capabilities in India. When this acquisition closes, the Company will have more than 14,000 employees in India, and India will be its second largest country of employment. |
| · | Focus on further expanding its global footprint. The Company currently operates in more than 55 countries and serves some of the world’s largest global companies. It delivers to the world from around the world. Consequently, the Company is continuing its commitment to world sourcing as an important value component of its global delivery model. It will continue to offer clients the mix of on-shore, near-shore and offshore services most appropriate to their needs. The Company is particularly focused on expanding capabilities in Asia, Latin America, and Eastern Europe, in addition to India. |
| · | Focus on commercial outsourcing and further strengthen the Company’s ability to deliver the services its clients require consistently and seamlessly across their global enterprise. Also, the Company is investing to win a higher share of mid-size deals – those having total contract values between $50 and $350 million by launching a dedicated sales team and enhancing delivery capabilities to address this large and growing market segment. |
| · | Focus on the North American Public Sector market. The Company will build on an established market position by enhancing its offerings to core markets and investing in selected higher growth sub-segments such as identity management and credentialing, health services, and logistics and transportation. Additionally, the Company will look to expand the work it does for the public sector in Canada and to build upon its success with the U.S. federal government in the pursuit of selected state and local growth opportunities. |
These five initiatives will be supported by a disciplined acquisition strategy. This acquisition approach is focused on vertical markets and core delivery capabilities, directed towards higher growth and margin businesses and strictly aligned with the priorities of Project Accelerate.
This strategy is global in scope and focused on proactively addressing the needs of the Company’s markets and clients. The Company believes Project Accelerate has attractive benefits for all its key stakeholders.
| - | For clients, the strategy will help us continue to evolve to meet their needs and drive improved business value to them. |
| - | For employees, the strategy is designed to provide exciting professional growth opportunities globally. |
| - | For shareholders, the strategy will help us provide a more clear vision and roadmap going forward, which will target revenue growth and the cash flows and ROI required to enhance overall shareholder returns. This strategy is designed to balance our portfolio across public sector, business solutions, and outsourcing services offerings over time. |
RESULTS OF OPERATIONS
Revenues
Revenues for the Global Commercial and North American Public Sector segments (see Note 16 to the consolidated financial statements) for fiscal 2007, fiscal 2006 and fiscal 2005 are as follows:
| | | Fiscal 2007 | | | Fiscal 2006 | | | Fiscal 2005 | |
| | | Amount | | | Percent Change | | | Amount | | | Percent Change | | | Amount | |
| | | | | | | | | As Restated | | | | | | As Restated | |
U.S. Commercial | | $ | 3,872.9 | | | | (4.3 | )% | | $ | 4,047.7 | | | | 5.1 | % | | $ | 3,851.1 | |
Europe | | | 4,146.3 | | | | (.7 | ) | | | 4,176.8 | | | | (3.4 | ) | | | 4,325.7 | |
Other International | | | 1,487.1 | | | | 9.3 | | | | 1,360.5 | | | | 10.9 | | | | 1,227.3 | |
| Global Commercial sector | | | 9,506.3 | | | | (.8 | ) | | | 9,585.0 | | | | 1.9 | | | | 9,404.1 | |
| North American Public sector | | | 5,350.3 | | | | 5.9 | | | | 5,054.0 | | | | 8.1 | | | | 4,675.9 | |
| Corporate | | | | | | | | | | | | | | | | | | | | |
| Total | | $ | 14,856.6 | | | | 1.5 | | | $ | 14,639.0 | | | | 4.0 | | | $ | 14,080.0 | |
The major factors affecting the percent change in revenues are presented as follows:
Fiscal 2007 vs. Fiscal 2006 | | Approximate Impact of Currency Fluctuations | | | Net Internal Growth | | | Total | |
U.S. Commercial | | | | | | (4.3 | )% | | | (4.3 | )% |
Europe | | | 5.2 | % | | | (5.9 | ) | | | (.7 | ) |
Other International | | | 3.3 | | | | 6.0 | | | | 9.3 | |
| Global Commercial sector | | | 2.7 | | | | (3.5 | ) | | | (.8 | ) |
| North American Public sector | | | | | | | 5.9 | | | | 5.9 | |
| Corporate | | | | | | | | | | | | |
| Total | | | 1.8 | | | | (.3 | ) | | | 1.5 | |
Fiscal 2006 vs. Fiscal 2005 | | Approximate Impact of Currency Fluctuations | | | Net Internal Growth | | | Total | |
U.S. Commercial | | | | | | 5.1 | % | | | 5.1 | % |
Europe | | | (3.5 | )% | | | .1 | | | | (3.4 | ) |
Other International | | | 2.5 | | | | 8.4 | | | | 10.9 | |
| Global Commercial sector | | | (1.3 | ) | | | 3.2 | | | | 1.9 | |
| North American Public sector | | | | | | | 8.1 | | | | 8.1 | |
| Corporate | | | | | | | | | | | | |
| Total | | | (.8 | ) | | | 4.8 | | | | 4.0 | |
Fiscal 2007 revenue growth from Department of Defense contracts in the North American Public Sector and growth in Other International operations helped offset the impact of 1) terminated commercial contracts with Nortel Networks and Sears, 2) the impact of a decline in commercial awards during fiscal 2006 and early 2007 in U.S. Commercial and Europe operations and 3) reduced scope on an intelligence agency program. The decline in Global Commercial revenue for fiscal 2007 of 0.8% (a decline of 3.5% in constant currency) was the result of terminated engagements in U.S. Commercial operations and reductions in scope on a number of contracts in Europe offset by growth in our Australian and Asia operations. Other International operations benefited from growth on existing business as a result of successful recompete efforts on contracts in Australia and additional project work on contracts in Asia. The North American Public Sector revenue growth benefited from growth on existing programs, contracts awarded during fiscal 2007 and from the acquisition, in the third quarter, of an identity management and credentialing business. These positive factors offset the effects of programs with reduced scopes as noted above.
Fiscal 2006 revenue growth from significant new commercial engagements and Federal programs offset the impact of 1) terminated commercial contracts with Nortel Networks and JPMorgan Chase, 2) revised billing rates for extended contracts, 3) reduced scope on certain Federal programs and 4) wind down of the development phase on a significant government project. Global Commercial growth for fiscal 2006 of 1.9% (3.2% in constant currency) was led by U.S. Commercial operations where new outsourcing engagements, growth on existing outsourcing engagements and growth in the U.S. consulting and systems integration business offset terminated engagements and lower billing rates on extended engagements. Other International operations benefited from growth on existing business. Europe operations, in constant currency, were unchanged from the prior year. The U.S. Federal sector revenue growth benefited from contracts awarded during fiscal 2006 and 2005 and from growth on existing programs offsetting the effects of programs with reduced scopes as noted above.
Global Commercial
Revenue from Global Commercial declined in fiscal 2007 compared to the prior year with revenue 0.8% below prior year and on a constant currency basis 3.5% below prior year. Declines in new contract awards during fiscal 2006 and the early 2007, the termination of certain U.S. Commercial contracts, declines in revenue from mature contracts in Europe and continued soft demand for consulting and systems integration offerings were partially offset by growth in Australia and Asia.
U.S. Commercial revenues decreased $175 million for fiscal 2007, or 4.3%. The decline was primarily the result of the termination of the Sears, Roebuck & Co and Nortel Networks contracts, which combined contributed an additional $205 million of revenue in the prior year. These declines were partially offset by revenue growth on existing outsourcing contracts. Revenue in the consulting and systems integration business was unchanged from the prior year as the increase in demand for these services in the prior year did not carry forward into fiscal 2007. No significant new contracts contributed to growth in U.S. Commercial business for fiscal 2007.
During fiscal 2007 Europe revenues decreased $31 million or 0.7% and on a constant currency basis decreased $246 million or 5.9% from the prior year. Growth from outsourcing and I/T and professional services engagements with U.K. National Health Service and Public Sector Scandinavia combined for $58 million in revenue growth and favorable currency effects, which contributed $214 million, were offset by revenue declines as a result of reductions in the scope of work for certain outsourcing engagements of $155 million in Northern Europe, the termination of the Nortel Networks contract, a decline in software license sales and continued softness in demand for the Company’s consulting and systems integration services in Germany and Italy.
Other International revenues increased $127 million or 9.3%, 6.0% in constant currency, during fiscal 2007. Australian operations contributed $84 million of revenue growth attributable to a professional staffing business, a major outsourcing contract and success in winning a number of recompete contracts during fiscal 2007. This growth was offset somewhat by the expiration of a government contract. Asia contributed $59 million in revenue growth attributable to additional work on various outsourcing engagements. This growth was offset somewhat by a decline in revenue from Canada operations, primarily as a result of the termination of the Nortel Networks contract.
During fiscal 2006 revenue from Global Commercial grew 1.9% or 3.2% in constant currency. New major engagements contributed approximately $483 million to Global Commercial’s revenue growth for fiscal 2006. These engagements, although primarily for outsourcing services, include other I/T and professional services as well. Revenue from existing engagements declined for fiscal 2006 as growth in U.S. consulting and systems integration services and in Other International was offset by lower billing rates on a contract extension, reduced volume on certain contracts, the termination and wind-down of certain contracts such as Nortel Networks, Sears, and JPMorgan Chase and a decline in software license sales.
U.S. Commercial revenues increased $197 million for fiscal 2006, or 5.1%. The growth was primarily from outsourcing contracts awarded during fiscal 2005 and growth in the consulting and systems integration business. New contracts contributing to the growth were Sun, Ascension Health, Textron and Aon which when combined, contributed $279 million to revenue growth for fiscal 2006. This revenue growth and the contribution from U.S. consulting and systems integration were partially offset by reduced volumes and billing rates on certain significant outsourcing contracts and the termination of significant outsourcing contracts with Nortel Networks and JPMorgan Chase. The Company’s contract with Sears, Roebuck & Co. for outsourcing services, which was terminated during fiscal 2006, provided $131 million of revenue during fiscal 2006.
Other International revenues increased $133 million or 10.9%, 8.4% in constant currency, during fiscal 2006. Australian operations contributed $62 million of revenue growth attributable to a professional staffing business and a major outsourcing contract, offset somewhat by the termination of an outsourcing contract. Asia contributed $50 million in revenue growth attributable to various outsourcing engagements.
During fiscal 2006 Europe revenues decreased $149 million or 3.4% though were essentially unchanged on a constant currency basis. Growth from new outsourcing and I/T and professional services engagements with U.K. National Health Service, Zurich Financial Services and Renault of $184 million was offset by unfavorable currency movements of approximately $152 million, reduced scope of work on certain outsourcing engagements, reduced billing rates on a contract extension, a decline in software license sales and continued softness in demand for the Company’s consulting and systems integration services in Germany and Italy.
North American Public Sector
The Company’s North American Public sector revenues were derived from the following sources:
| | | Fiscal 2007 | | | Fiscal 2006 | | | Fiscal 2005 | |
Dollars in millions | | Amount | | | Percent Change | | | Amount | | | Percent Change | | | Amount | |
| Department of Defense | | $ | 3,593.8 | | | | 6.7 | % | | $ | 3,368.9 | | | | 15.8 | % | | $ | 2,909.8 | |
| Civil agencies | | | 1,600.1 | | | | 3.6 | | | | 1,544.3 | | | | (4.3 | ) | | | 1,612.9 | |
Other (1) | | | 156.4 | | | | 11.1 | | | | 140.8 | | | | (8.1 | ) | | | 153.2 | |
| Total North American Public Sector | | $ | 5,350.3 | | | | 5.9 | | | $ | 5,054.0 | | | | 8.1 | | | $ | 4,675.9 | |
| (1) | Other revenues consist of foreign, state and local government work as well as commercial contracts performed by the North American Public sector segment. |
North American Public Sector revenue growth for fiscal 2007 was 5.9% with revenue up $296 million to $5,350.3 million. The revenue growth was the result of new business awarded during fiscal 2007 and 2006, increases on existing Department of Defense contracts and the acquisition in the third quarter of an identity management and credentialing business. This growth was partially offset by reductions in funding for one other significant program as funds were redirected to other Department of Defense programs. The North American Public Sector continued to win significant new business during fiscal 2007 with announced new U.S. federal contract awards of $9.2 billion versus $7.1 billion for fiscal 2006 and $7.0 billion for fiscal 2005.
Department of Defense revenue increased $225 million or 6.7% to $3,593.8 million for fiscal 2007. Growth was the result of increased demand for equipment procurement and installation services for the U.S. Army, a program to provide engineering support services to the U.S. Army’s Aviation and Missile Command, an increase in scope for a program to provide mission support services, a new program to provide engineering logistics and business operations services to the U.S. Army, management services for certain intelligence services, a program to provide flight simulation services to the U.S. Army and the acquisition of an identity management and credentialing business in the third quarter. These new programs, tasking and acquisition provided approximately $292 million in revenue growth for fiscal 2007. This growth was partially offset by funding shortfalls on an intelligence services program as funds were redirected to other programs and revenue declined $70 million on this program.
Civil agencies revenue increased $56 million or 3.6% versus fiscal 2006, as a result of increased activity on a contract with the Federal Aviation Administration, and I/T engineering and management services contract with the EPA as well as growth in consulting services provided to various agencies.
Work performed by the North American Public Sector for state and local governments as well as commercial clients was $156 million for fiscal 2007, an increase of $16 million from the prior year. This increase was the result of achievement of milestones on a project with a foreign government to provide information technology services. This increase was partially offset by a reduction in revenue on a contract with the New York Department of Health where the contract evolved from system development to run and maintain and system enhancement work.
For fiscal 2006 North American Public Sector revenue growth was 8.1% with revenue up $378 million to $5,054 million. The revenue growth was driven by new business awarded during fiscal 2006 and 2005 and increases on existing Department of Defense contracts. This growth was partially offset by the completion of the development phase on a state contract and reduced scope on a small number of significant programs. The North American Public Sector continued to win significant new business during fiscal 2006 with announced new U.S. federal contract awards of $7.1 billion versus $7.0 billion for fiscal 2005 and $5.0 billion for fiscal 2004.
Department of Defense revenue increased $459 million or 15.8% to $3,369 million for fiscal 2006. Growth was the result of increased demand for equipment procurement and installation services for the U.S. Army, a new program to provide aviation support services, new tasking on programs to provide logistical support to the U.S. Army, new tasking to provide technical support for the Navy’s undersea test facilities, a multiple award contract to provide professional services to Naval Sea Systems Command, a new program to provide support services for the U.S. Strategic Command and I/T engineering and management services for certain intelligence services. These new programs and tasking provided approximately $297 million in revenue growth for fiscal 2006. The remainder of the revenue increase during fiscal 2006 was the result of normal contract activities including new tasking on various projects and various new programs.
For fiscal 2006 Civil agencies revenue was down $69 million or 4.3% versus fiscal 2005, driven by the reduction in scope for a significant project with the Internal Revenue Service. The impact of the scope reduction on this project was approximately $72 million. New tasking on projects for the National Aeronautics and Space Administration (NASA) offset scope reductions and the completion of other programs.
Work performed by the North American Public Sector for state and local governments as well as commercial clients was $141 million for fiscal 2006, down $12 million. The decrease was the result, primarily, of a reduction of effort on a contract with the New York Department of Health. This was offset somewhat by a project with a foreign government to provide information technology services.
Costs and Expenses
The Company’s costs and expenses were as follows:
| | | Dollar Amount | | | Percentage of Revenue | |
| | | 2007 | | | 2006 | | | 2005 | | | 2007 | | | 2006 | | | 2005 | |
| | | | | | As Restated | | | As Restated | | | | | | | | | | |
Costs of services (excludes depreciation and amortization) | | $ | 11,817.8 | | | $ | 11,724.0 | | | $ | 11,320.1 | | | | 79.5 | % | | | 80.1 | % | | | 80.4 | % |
| Selling, general and administrative | | | 916.4 | | | | 862.5 | | | | 856.7 | | | | 6.2 | | | | 5.9 | | | | 6.1 | |
| Depreciation and amortization | | | 1,073.6 | | | | 1,091.8 | | | | 1,051.0 | | | | 7.2 | | | | 7.5 | | | | 7.5 | |
| Interest expense, net | | | 125.7 | | | | 80.1 | | | | 143.3 | | | | .8 | | | | .5 | | | | 1.0 | |
| Special items | | | 316.1 | | | | 77.3 | | | | 28.6 | | | | 2.1 | | | | .5 | | | | .2 | |
Total | | $ | 14,249.6 | | | $ | 13,835.7 | | | $ | 13,399.7 | | | | 95.9 | % | | | 94.5 | % | | | 95.2 | % |
The Company substantially matches revenues and costs in the same currency. Therefore, foreign currency did not have a material impact on costs and expenses as a percentage of revenue. However, the Company is increasing its use of offshore support and therefore may be exposed to additional margin fluctuations.
Costs and expenses as a percentage of revenue for fiscal 2007 increased 1.4% points to 95.9% from 94.5% for fiscal 2006 primarily as a result of costs incurred from restructuring activities which contributed 2.4% to the total cost ratio. The cost of services ratio decreased as a result of restructuring activities during fiscal 2007 and cost management while the depreciation and amortization ratio decreased as a result of the termination of the Nortel Networks and Sears contracts both of which were capital intensive contracts. The selling, general and administrative (SG&A) expense ratio increased as a result of 1) professional fees and employee taxes to be paid by the Company as a result of the stock option investigation, and 2) the SG&A portion of additional compensation expense incurred as a result of the adoption of SFAS No. 123R during fiscal 2007. The interest expense ratio increased as a result of financing a repurchase of shares with commercial paper, an increase in interest expense related to income taxes and an increase in assets under capital leases.
Costs and expenses as a percentage of revenue for fiscal 2006 improved .7% points to 94.5% from 95.2% for fiscal 2005 with most ratios improved or unchanged from the prior year. The cost of services ratio decreased as a result of cost management and certain revenue settlements for which the associated costs were recorded in a prior period. The interest expense ratio decreased primarily as the result of the retirement of $1 billion of term debt during March 2005. These decreases were offset by the impairment charge and loss on sale of equipment due to the termination of portions of the Nortel Networks contract recorded as a special item in fiscal 2006.
Costs of Services
Costs of services as a percentage of revenue decreased .6% points to 79.5% for fiscal 2007 as a result of a decrease in the Global Commercial ratio of 1.2% points to 75.7% and a .1% point decrease in the North American Public Sector ratio to 86.2%. Improvements in the cost of services ratio for the Global Commercial segment were primarily in the outsourcing business in the United States and Asia, as a result of cost savings initiatives, restructuring activities and the termination of low margin contracts.
The Global Commercial cost of services ratio for fiscal 2007 benefited from reductions in the ratio in U.S. Commercial operations, where the ratio improved 2.1% points as a result of cost savings initiatives during the past year, the transfer of certain tasks to lower cost regions for certain contracts, and the termination of low margin contracts. The ratio for Other International operations improved 1.6% points as Asia benefited from restructuring activities. These improvements in the cost of services ratio for Other International were partially offset by significant revenue growth from a low margin professional staffing business in Australia. Europe, where the ratio decreased .7% points, benefited from reductions in the cost of services ratio as a result of the transfer of certain tasks to lower cost regions, the impact of restructuring activities on the ratio in the consulting and systems integration activities and a reduction in management bonuses. These reductions in expense were somewhat offset by higher costs on certain outsourcing engagements.
The North American Public Sector ratio for fiscal 2007 benefited from the impact of an adverse estimate to complete incurred on a state project in the prior year and a revenue increase on this contract during the current year as a result of the client extending the contract. These changes combined for .4% points favorable impact to the ratio for fiscal 2007. This favorable impact was partially offset by an adverse cost incurred for contracts with the IRS of .2% points during fiscal 2007. These changes, combined, had a .1% point favorable impact on the overall cost of services ratio.
Costs of services as a percentage of revenue decreased .3% points to 80.1% for fiscal 2006 as a result of a decrease in the Global Commercial ratio of .2% points to 76.9% and a .4% points decrease in the North American Public Sector ratio to 86.3%. The ratio for fiscal 2006 benefited, as noted below, from cost of services amounts carried at the Corporate level for fiscal 2005 which included $24 million of accrued cost related to the settlement of an overtime pay class action lawsuit.
The Global Commercial cost of services ratio for fiscal 2006 benefited from reductions in the ratio in Europe as a result of outsourcing improvements in the United Kingdom offset somewhat by higher ratios for other European consulting and systems integration business. These improvements in Europe were offset by a higher ratio for U.S. outsourcing as a result of start up and termination activities and an unfavorable mix impact as revenue from higher margin software license sales was lower for the year. The costs of services ratio benefited from certain revenue items such as revenue settlements with clients for which the related costs were recognized in a prior period, a pre-tax $8 million gain from the sale of a building and the novation of certain contracts. These items favorably benefited the ratio approximately .2% points.
The North American Public Sector ratio for fiscal 2006 benefited from increased margins for certain time and materials contracts on subcontractor work and materials and cost containment on a fixed unit price contract. The year over year comparison also benefited .2% points from unfavorable adjustments during fiscal 2005 on certain programs for which recovery of costs was not probable. These factors were somewhat offset by an adverse estimate to complete incurred on a state project impacting the ratio by approximately (.1%) point.
Selling, General and Administrative
Selling, general and administrative (SG&A) expenses as a percentage of revenue increased .3% points to 6.2% for fiscal 2007 primarily as a result of additional compensation expense due to the incremental impact of the adoption of SFAS No. 123(R) and the legal expenses related to the investigation by the Securities and Exchange Commission and the Department of Justice into the Company’s stock option granting practices. These items had a .3% point net unfavorable impact on the expense ratio for fiscal 2007. The pretax incremental stock option expense recorded in SG&A as a result of the adoption of SFAS No. 123(R) was approximately $14.2 million ($10.0 million net of taxes) and the pre-tax legal and related expenses related to the stock option investigation, including employee taxes to be paid by the company, were approximately $22.3 million ($15.7 million net of tax). The comparison of the fiscal 2007 ratio to the prior year ratio benefited from a one-time adverse impact to the prior year ratio for a provision for doubtful accounts, as noted below, which had a .1% point impact on the expense ratio for fiscal 2006. The allocation of the SFAS No. 123(R) and legal expenses, noted above, for fiscal 2007 resulted in an increase in the North American Public Sector expense ratio of .5% points and an increase in the Global Commercial ratio of .2% points.
Selling, general and administrative (SG&A) expenses of 5.9% as a percentage of revenue for fiscal 2006 decreased .2% points from the prior year primarily as a result of a decrease in income tax penalties as compared to prior year of approximately $40 million partially offset by additional compensation expense of $16.4 million (approximately $12.1 million net of taxes). The decrease in the ratio was the result of a decrease in the ratio for the corporate segment as a result of the decrease in tax penalties partially offset by an increase in the ratio for the North American Public Sector of .5% points. The North American Public Sector ratio increase was attributable to increased expenses in the new business development area and increased management and bid and proposal costs. The Global commercial ratio was essentially flat to the prior year as improvements in the ratio from savings in new business selling costs due to fewer significant new business opportunities and a reduction in general and administrative costs was offset by the increase in compensation costs as a result of the restatement noted above and the adverse impact of a pre-tax $18 million provision for doubtful accounts related to negotiations with an outsourcing customer regarding certain contract provisions.
Depreciation and Amortization
Depreciation and amortization expense as a percentage of revenue decreased .3% points to 7.2% during fiscal 2007. The expense ratio improved in both the North American Public Sector and in Global Commercial. The decrease in the expense ratio was the result of revenue growth and a decline in depreciation and amortization expense to $1,073.6 million for fiscal 2007. This decline was the result of an approximately $20 million decrease in depreciation expense for fiscal 2007 due primarily to the termination and disposal of the related assets for the Sears contract and a shift in the mix of the assets in Australia toward longer lived assets. The North American Public Sector ratio decreased by .2% points as depreciation and amortization expense was held flat and revenue increased by 5.9%. The Global Commercial ratio decreased .2% point due to the reduction in expense noted above while revenues were essentially flat to the prior year.
Depreciation and amortization expense of $1,091.8 million for fiscal 2006 represents 7.5% of revenue and was unchanged from the ratio of 7.5% for fiscal 2005. Improvement in the North American Public Sector ratio was offset by an increase in the Global Commercial ratio. The North American Public Sector ratio decreased by .1% point predominantly due to decreases in amortization of certain intangibles acquired in the Dyncorp acquisition. The Global Commercial ratio increased as a result of significant upfront capital investment for outsourcing contracts awarded during fiscal 2005 and 2004 in Europe and Asia and capital refreshes necessary on some existing contracts, offset by lower levels of capital investment for U.S. commercial operations due to the termination of the Nortel and Sears contracts and a favorable mix variance from Australian operations due to revenue growth in non-capital intensive business lines.
Interest Expense and Interest Income
The increase in interest expense for fiscal 2007 of $54.3 was the result, primarily, of three factors: 1) the use of commercial paper to finance the accelerated share repurchase transactions (see Note 11 in the Notes to Consolidated Financial Statements) which increased interest from commercial paper by $19.7 million for fiscal 2007, 2) an increase in equipment under capital leases, particularly in the North American Public Sector, resulted in an increase in interest expense of $13.0 million, and 3) interest accrued related to income taxes and income tax contingency items of $18.7 million (see Note 2 in the Notes to Consolidated Financial Statements). Interest income increased approximately $8.7 million for fiscal 2007 as a result of an increase in interest income from tax refund items, interest income from a partnership and interest on cash balances in Asia and Canada. These increases offset the loss of dividend income from the DynCorp International 13% preferred stock which was redeemed during the first quarter of fiscal 2007. The result of the increase in interest expense and interest income was an increase in net interest expense of $34 million and an increase in the interest expense ratio of .2% points.
The decrease in interest expense for fiscal 2006 compared to fiscal 2005 was due to lower average debt levels during fiscal 2006 as the result of the retirement of $1 billion of term debt during March 2005. The interest savings from the retirement of the term debt was somewhat offset by an increase in interest expense for income taxes, capitalized leases and short-term borrowings for working capital needs in Europe. The combination of these factors resulted in a reduction in interest expense of $38.5 million. In addition, interest income, including dividend income from the DynCorp International 13% preferred stock, increased approximately $24.7 million for fiscal 2006 resulting in a .6% improvement in the net interest expense ratio. During May 2006, the Company received approximately $169 million from DynCorp International for the redemption of the preferred stock and payment of cumulative dividends of approximately $22.5 million.
Special Items
Special items totaling $316.1 million were recorded during the year ended March 30, 2007, and consisted of: (1) a $333.4 million restructuring charge (see discussion below), (2) a $1.0 million true-up of an estimate related to the fiscal 2006 Nortel impairment charge and (3) an $18.3 million gain from the redemption of DynCorp International preferred stock.
Restructuring
In April 2006, the Company announced a restructuring plan to be carried out during fiscal 2007 and 2008. The objectives of the plan are to 1) streamline CSC’s worldwide operations and 2) leverage the increased use of lower cost global resources. Restructuring charges consist predominantly of severance and related employee payments resulting from terminations. During the third quarter of fiscal 2007 the Company evaluated facility consolidation opportunities and other areas where operations can be streamlined and costs reduced consistent with the plan objectives, resulting in additional lease termination, asset impairment and other charges.
Workforce reductions of approximately 4,400 employees occurred in fiscal 2007, and an additional 1,100 reductions are planned for fiscal 2008. Termination-related charges of $294.3 million were recorded in fiscal 2007. Other, primarily vacant space-related costs, of $39.1 million were also recorded during the year, net of an $11.6 million gain on the sale of a data center facility. All but approximately $.1 million of the restructuring charge was incurred in the Global Commercial reporting segment. Additional restructuring charges of not more than $110 million are expected to be incurred in fiscal 2008.
The restructuring plan generated savings of approximately $180 million in fiscal 2007 and is expected to result in savings of $340 million in fiscal 2008. Approximately 97% of the savings comes from reduced cost of services, while the remainder will be predominantly from lower selling, general and administrative costs. Savings are net of new or increased recurring costs, primarily the costs anticipated for an increasing offshore workforce. Savings will also be impacted by certain transitional costs as new offshore staff are trained while outgoing staff are still on the payrolls. Such transitional costs were under $10 million in fiscal 2007 and expected to be under $2 million in fiscal 2008.
A majority of the planned headcount reductions (3,000 in fiscal 2007 and 500 in 2008) were scheduled to take place in Europe. Approximately 1,100 and 500 positions were to be reduced in North America in fiscal 2007 and 2008, respectively, with the balance in Australia and Asia. Partially offsetting the reductions were planned headcount increases in certain lower cost regions of approximately 1,400 and 700 employees in fiscal 2007 and 2008, respectively. As of March 30, 2007, approximately 4,400 separations have been completed (approximately one-sixth due to attrition), with 3,000 in Europe, 1,100 in North America and the remainder in Australia and Asia. Approximately 2,100 new hires occurred in lower cost regions during the full year ended March 30, 2007, including replacements of some of the 4,400 reductions as well as for previously-planned and on-going business activities.
The Company’s strategy in Europe has been to obtain negotiated, voluntary terminations to the extent possible, but involuntary terminations were also necessary in certain countries to attain targeted reductions. Outside of Europe, terminations have been predominantly involuntary. Involuntary termination benefits are determined in accordance with existing company policies and local legal requirements. In some countries, local regulations require the Company to consult with employee representatives such as works councils or unions in the determination of job categories and number of employees to be terminated, as well as the resulting termination benefit amounts.
The amounts of termination benefits are typically attributable to employees’ services already rendered and increase as length of service increases. The Company records charges for negotiated, voluntary terminations at the time an employee accepts the Company’s offer. Involuntary termination benefits are accrued at the time such obligations are considered probable and reasonably estimable. Such a calculation is based on estimates of benefit payouts as well as number and type of staff to be terminated. In cases where a plan calls for first attempting to garner voluntary terminations and then moves to involuntary terminations if targeted reductions are not achieved, a charge is accrued based on estimated involuntary benefits for all remaining reductions.
Accruals for future termination benefits are based on a number of assumptions and estimates. Such accruals may differ from actual results for a variety of reasons, including: different benefit amounts or mix of employees as a result of completed employee representative consultations; additional voluntary terminations in lieu of accrued involuntary terminations; changes in mix of actual terminated employees by age, years of service, or job class.
Restructuring-related pre-tax cash payments of approximately $207.2 million were made in fiscal 2007 (excluding $25.8 million cash proceeds received from sale of a data center) and are estimated to be approximately $195 million for fiscal 2008. Included in the restructuring charge are pension benefit augmentations that are due to certain employees in accordance with legal or contractual obligations, which will be paid out over several years as part of normal pension distributions. Such liabilities are included in the consolidated pension liability account.
See the following table for a summary of fiscal 2007 activity (in millions):
| | | Total pre-tax charges recorded year-to-date fiscal 2007 | | | Less charges not affecting restructuring liability (1) | | | Less Payments (2) | | | Other (3) | | | Restructuring liability as of March 30, 2007 | |
| Workforce reductions | | $ | 294.3 | | | $ | (6.8 | ) | | $ | (201.7 | ) | | $ | 7.7 | | | $ | 93.5 | |
| Other | | | 39.1 | | | | 6.3 | | | | (5.5 | ) | | | 1.0 | | | | 40.9 | |
| Total | | $ | 333.4 | | | $ | (0.5 | ) | | $ | (207.2 | ) | | $ | 8.7 | | | $ | 134.4 | |
(1) | Charges primarily consist of pension benefit augmentations offset by gains on sale of a data center facility. |
(2) | Excludes $25.8 million cash proceeds received from sale of a data center facility. |
(3) | Foreign currency translation adjustments. |
During fiscal 2006 Nortel Networks (Nortel) terminated the Company’s services for certain information technology outsourcing activities under the outsourcing agreement between Nortel and the Company. As a result of the termination of these services the Company recorded a non-cash special charge of $52.0 million in the second quarter of fiscal 2006 to write down outsourcing contract costs and certain equipment associated with the contract to their estimated fair value. The Company recorded an additional charge in the fourth quarter of fiscal 2006 of $25.3 million to write down the remaining assets to fair value, recognize a loss on the assets sold to Nortel under the terms of the termination settlement, record severance costs for those employees who were not hired by Nortel or redeployed within the Company and record costs associated with terminating the contract for a total charge of $77.3 million ($48.3 million after tax) or 26 cents per share.
During the fourth quarter of fiscal 2005 the Company recorded a charge of $29.5 million for premium payments and the write down of deferred financing costs and interest discount related to the early redemption of $1 billion of term debt. The Company elected to make this early redemption and incur the charges as it had available cash and these debt issues carried interest rates above current prevailing rates. See Note 10 to the consolidated financial statements for further description. The debt redemption charge was partially offset by the reversal in the fourth quarter of previously recorded facility restructuring accruals of $.9 million. The combined special items had a $0.10 per share impact on earnings per share and a .2% net impact on the Company’s profit margin in fiscal 2005.
Taxes
The provision for taxes on continuing operations as a percentage of pre-tax earnings was 35.9%, 41.4% and 34.7% for fiscal 2007, fiscal 2006 and fiscal 2005, respectively. The decrease in the effective tax rate during fiscal 2007 as compared to fiscal 2006 was the result of lower state tax and additional credits in fiscal 2007, partially offset by higher foreign effective tax rates. The Company’s income tax expense for fiscal 2007 includes a reduction for a change in estimate in the amount of approximately $24 million of research and development credits available to be claimed by the Company for years prior to fiscal 2007. As a result of these factors, the effective tax rate for fiscal 2007 declined 5.5% percentage points from fiscal 2006. The increase in fiscal 2006 income tax expense compared to fiscal 2005 was primarily the result a reduction in tax contingency recorded in fiscal 2005 which did not recur in fiscal 2006. See Note 8 to the consolidated financial statements for further discussion of income taxes.
Discontinued Operations
Income from discontinued operations net of taxes was $61.3 million and $313.8 million, respectively, for fiscal years 2006 and 2005. Income from discontinued operations during fiscal 2006 included the gain on sale of Health Plan Solutions of $22.9 million and the gain from the working capital adjustment for the sale of DynCorp International of $38.4 million. The Company received $65.5 million par value preferred stock for the working capital adjustment and recorded taxes of $20.7 million and a valuation allowance of approximately $6.5 million against the preferred stock. Income from discontinued operations during fiscal 2005 includes the net after tax gain on the sale of DynCorp International of $228.8 million or approximately $1.19 per share. In fiscal 2005, proceeds from the sale included $775 million of cash and $75 million of par value preferred stock. Discontinued operations for fiscal 2005 included the operations of DynCorp International, sold during the fourth quarter of fiscal 2005, and the operations of Health Plan Solutions which was classified as held for sale as of April 1, 2005 and sold during the first quarter of fiscal 2006.
Cumulative Effect of Change in Accounting Principle
In March 2005, the Financial Accounting Standards Board (FASB) issued FASB Interpretation No. 47, “Accounting for Conditional Asset Retirement Obligations—an interpretation of FASB Statement No. 143.” During fiscal 2006, the Company recorded a Cumulative Effect of a Change in Accounting Principle of $5.6 million ($4.3 million after tax) or $0.02 per share as a result of implementing the Interpretation to account for the Company’s unrecorded legal obligations to restore some of its leased facilities to their original condition upon lease expiration.
Earnings Per Share and Share Base
Earnings per share from continuing operations for fiscal 2007 as compared to fiscal 2006 decreased $0.35 to $2.16. Earnings per share from continuing operations for fiscal 2007 were adversely impacted by special charges of $1.46 per share and favorably impacted by a decrease in the average share base of 8.3 million shares from fiscal 2006. This decline in the share base was the result of the Company’s acquisition and retirement of 16.4 million shares through two accelerated share repurchase transactions with 9.3 million shares acquired during the first quarter and 7.1 million shares acquired during the second quarter of fiscal 2007. See Note 11 to the consolidated financial statements for further discussion of these transactions. This reduction to the share base was partially offset by option exercises during the past twelve months and an increase in common stock equivalents of 1.2 million for fiscal 2007.
Earnings per share from continuing operations increased $0.20 to $2.51 for fiscal 2006. Earnings per share from continuing operations for fiscal 2006 were adversely impacted by special charges of $0.26 per share and a decrease in income from continuing operations and favorably impacted by a decline in the average share base of 4.1 million shares for fiscal 2006. This decline in the share base was driven primarily by the Company’s acquisition of 7.13 million treasury shares in the HPS exchange which reduced weighted average shares outstanding by 6.6 million shares for fiscal 2006. This reduction was partially offset by employee stock option exercises during fiscal 2006. Common stock equivalents declined slightly on a year over year basis.
FINANCIAL CONDITION
Cash Flows
Dollars in millions | | Fiscal 2007 | | | Fiscal 2006 | | | Fiscal 2005 | |
| Net cash from operations | | $ | 1,578.6 | | | $ | 1,551.3 | | | $ | 1,941.5 | |
| Net cash used in investing | | | (872.7 | ) | | | (1,124.0 | ) | | | (595.4 | ) |
| Net cash used in financing | | | (955.5 | ) | | | (150.7 | ) | | | (900.6 | ) |
| Effect of exchange rate changes on cash and cash equivalents | | | 9.0 | | | | 3.8 | | | | 2.0 | |
| Net increase (decrease) in cash and cash equivalents | | | (240.6 | ) | | | 280.4 | | | | 447.5 | |
| Cash and cash equivalents at beginning of year | | | 1,290.7 | | | | 1,010.3 | | | | 562.8 | |
Cash and cash equivalents at end of year | | $ | 1,050.1 | | | $ | 1,290.7 | | | $ | 1,010.3 | |
Historically, the majority of the Company’s cash and cash equivalents have been provided from operating activities and this trend continued during fiscal 2007 as operating activities generated an additional $27 million in cash compared to the prior year or $1.6 billion in net cash during fiscal 2007. Cash generated from operations during fiscal 2007 was the result of factors with significant, but opposing, impacts on cash flow, including cash outflows to fund the restructuring plan and cash inflows from advanced customer payments. Factors impacting working capital during the year include:
| · | During fiscal 2007 cash payments for restructuring activities were $181 million; net of $26 million from the sale of assets related to the restructuring, during fiscal 2007 |
| · | During fiscal 2007 the Company’s billed trade accounts receivables and unbilled receivables increased approximately $223 million and $229 million, respectively. The increase in trade receivables was across both the North American Public Sector and the Global Commercial segments. The increase in unbilled receivables related primarily to contracts in Europe and U.S. federal contracts. This compares to an increase in unbilled receivables of approximately $184 million and a minimal increase in trade accounts receivable during fiscal 2006. The fiscal 2007 increase in trade accounts receivable and unbilled receivables contributed to an increase in DSO to 94 days at the end of fiscal 2007 from 87 days at the end of last year. |
| · | The Company’s investment in deferred costs and work in progress related to certain contracts increased approximately $231 million during fiscal 2007 compared to an increase of $262 million in the prior year. The majority of the increase relates to the UK National Health Service contract. |
| · | Accounts payable and accrued expenses combined increased $532 million for fiscal 2007 compared to a decrease of $50 million for fiscal 2006. The increase in the balance for fiscal 2007 was the result of the timing of payments for accounts payable, which included an increase of approximately $110 million of capital expenditure payables, an increase in accrued expenses for restructuring activities and activity on contracts. |
| · | The Company made payments for taxes of $304.8 million and $147.9 million for fiscal 2007 and 2006, respectively. The Company projects cash payments for taxes to remain at fiscal 2007 levels for 2008; however, resolution of tax contingencies could have a significant impact on cash tax payments. |
| · | Advanced payments received from customers increased approximately $270 million during fiscal 2007, primarily as a result of the achievement of billing milestones on a significant development effort for a foreign government client. Such balances partially offset the Company’s significant investment in this project. This compares to a decrease in advanced payments from customers for fiscal 2006 as a result of the winding down of a contract and lower advanced payments on another contract as it transitioned out of the start-up phase. |
The Company has submitted 16 Requests for Equitable Adjustment (REAs) totaling in excess of $1 billion on two U.S. Federal contracts. Included in current assets on the Company’s balance sheet is approximately $820 million of unbilled accounts receivable and deferred costs related to the contracts. CSC has requested payment for certain related out-of-scope work directed or caused by the customers in support of their critical missions. The contractual modification process for scope changes has lagged behind the need for CSC to provide critical on-going operational support. The Company does not record any profit element when it defers costs associated with such REAs. The Company believes it has a legal basis for pursuing recovery of these REAs and that collection is probable. Settlement of the amounts depends on individual circumstances and negotiations with the parties and we are unable to predict the timing of resolution of the REAs.
The Company’s capital investments principally relate to purchases of computer equipment and purchases and development of software, and deferred outsourcing contract costs that have supported the Company’s expanding Global Commercial operations in prior years. Investments include computer equipment purchased at the inception of outsourcing contracts as well as for subsequent upgrades, expansion or replacement of these client-supporting assets. For cash flow presentation purposes, the Outsourcing Contracts line includes amounts paid to clients for assets purchased from the clients that are categorized as property and equipment on the balance sheet. Outsourcing contract costs are also comprised of incremental external costs as well as certain internal costs that directly relate to a contract’s acquisition or start-up, including payments to clients for amounts in excess of the fair market value of acquired assets (premium). The absence of significant new outsourcing contract awards during the latter part of fiscal 2006 and fiscal 2007 resulted in a reduction in investing cash outflows for computer equipment and related facilities costs and for outsourcing contract costs. These reductions in cash outflows were partially offset by cash outflows for the acquisition of an identity management and credentialing business (see Note 4 in Notes to Consolidated Financial Statements) and an increase in cash outflows for purchase and development of software as a result of software purchases in Europe, primarily for the National Health Service contract.
While increasing new business will typically require higher overall capital investments, the mix of the new business will also impact the level of capital. The growth in U.S. federal awards during fiscal 2006 limited the growth in overall capital investment in fiscal 2007 as U.S. federal contracts typically require lower levels of initial investment when compared with similar commercial outsourcing contracts. This is expected to continue during fiscal 2008 but is expected to be tempered somewhat by revenue resulting from an increase in commercial contract awards during the fourth quarter of fiscal 2007, as well as the payment for capital expenditures incurred during fiscal 2007 of approximately $110 million.
Dispositions of investments in businesses have from time to time generated investing cash flows for the Company. During the fourth quarter of fiscal 2005 the disposition of DynCorp International generated $775 million in cash proceeds. As discussed below the Company used these proceeds to reduce debt levels during that quarter.
As described above, historically a majority of the Company’s capital investments have been funded by cash from operations. Fiscal 2007 continued to reflect this trend; however, the Company has increased its use of capital leases to finance certain equipment purchases related to long term contracts with total capital lease obligations of $152 million as of March 30, 2007. The Company funded the acquisition and retirement of outstanding shares from two accelerated share repurchase transactions during fiscal 2007 with approximately $600 million of commercial paper and cash on hand. The commercial paper was redeemed during fiscal 2007 using cash generated from operating activities. During fiscal 2006 the Company financed its capital investments primarily with cash generated from operations. Financing cash flows for fiscal 2005 reflected the Company’s use of the proceeds from the sale of DynCorp International to redeem $1.0 billion of term debt during the fourth quarter of fiscal 2005. Cash outflows to redeem the term debt included $27.8 million of early redemption premiums. At year-end fiscal 2007 and 2006, there was no outstanding commercial paper, a result of cash generated from operations.
Partially offsetting the financing cash out flows were cash proceeds from the exercise of employee stock options during fiscal 2007 and 2006 of $94.8 million and $101.1 million, respectively.
Liquidity and Capital Resources
The balance of cash and cash equivalents was $1,050.1 million at March 30, 2007, $1,290.7 million at March 31, 2006, and $1,010.3 million at April 1, 2005. During fiscal 2007, equity decreased $619.9 million primarily as a result of the Company’s repurchase of outstanding shares through two accelerated share repurchase transactions and the adoption SFAS No. 158, “Employers’ Accounting for Defined Benefit Pension and Other Postretirement Plans” (SFAS No. 158), which required the recognition of an additional unfunded pension obligation of $705.1 million ($476.5 million net of taxes) on the balance sheet. The Company’s total unfunded pension obligation was $801.7 million at March 30, 2007. In prior years, the unfunded pension obligation would have been disclosed in the notes to the financial statements. Current year earnings of $388.8 million, the exercise of employee stock options for $94.8 million and an increase in the foreign currency translation adjustment of $248.3 million partially offset these reductions.
At the end of fiscal 2007, CSC’s ratio of debt to total capitalization was 20.4%, up from the ratio at the end of fiscal 2006 of 18.4%, and from 18.0% at the end of fiscal 2005. The increase in the debt ratio was primarily the result of the decrease in equity due to the share repurchases and the impact of the adoption of SFAS No. 158 as discussed above. The Company’s debt to total capitalization ratio of 20.4% is expected to rise in fiscal 2008 as a result of financing the announced acquisition of Covansys Corporation as well as financing the repurchase of up to $1 billion of outstanding common stock under a Rule 10b5-1 purchase plan. The capitalization ratio may also be impacted during fiscal 2008 by the need to finance other suitable investments the Company may identify or other significant capital requirements that may arise.
Dollars in millions | | 2007 | | | 2006 | | | 2005 | |
| | | | | | As Restated | | | As Restated | |
| Debt | | $ | 1,505.9 | | | $ | 1,462.1 | | | $ | 1,388.7 | |
| Equity | | | 5,885.5 | | | | 6,505.4 | | | | 6,314.2 | |
| Total capitalization | | $ | 7,391.4 | | | $ | 7,967.5 | | | $ | 7,702.9 | |
| Debt to total capitalization | | | 20.4 | % | | | 18.4 | % | | | 18.0 | % |
The Company purchased and retired approximately 16.4 million outstanding common shares through two accelerated share repurchase transactions for $1 billion during fiscal 2007. The first transaction was an accelerated share repurchase agreement for 9.3 million shares for an initial purchase price of $500 million, or $54 per share, subject to adjustment. The second transaction was a collared share repurchase agreement under which the Company acquired 7.1 million shares for $500 million. The number of shares is subject to adjustment upon final determination of the price per share subject to the terms of the collar. For the collared share repurchase agreement the Company has no further obligation and may receive additional shares depending on the final price per share. These transactions were financed through available cash on hand and the issuance of approximately $600 million of commercial paper which has subsequently been redeemed.
The Company’s sources of liquidity include cash, commercial paper and committed and uncommitted lines of credit. Short-term borrowings are principally used to supplement operating cash flow in funding working capital requirements.
At March 30, 2007, the Company had a committed line of credit providing $1 billion of long-term commercial paper backup which expires on August 23, 2011. If the Company were unable to sell its commercial paper, borrow under its uncommitted lines of credit, or determines it is too costly to do either of the aforementioned, the Company has the ability to borrow under this committed line of credit. This line of credit has the option of being drawn at a Base Rate, a Eurodollar Rate or a bid option rate. The line requires the Company to 1) limit liens placed on our assets to $100 million and to liens incurred in the ordinary course of business; 2) maintain a minimum interest coverage ratio of consolidated Earnings Before Interest, Taxes, Depreciation and Amortization (EBITDA) to consolidated interest expense for the period of four consecutive fiscal quarters ending on or immediately prior to such period not to exceed 3.00 to 1.00; and 3) not permit at the end of any quarterly financial reporting period the ratio of consolidated total debt to consolidated EBITDA for the period of four consecutive fiscal quarters ending on or immediately prior to such date, to exceed 3.00 to 1.00. For further details on this agreement please see Exhibit 10.23, which is incorporated by reference to this Annual Report. As of March 30, 2007 the Company’s total liquidity was approximately $2,050 million which included cash and cash equivalents and marketable securities of $1,050.1 million and availability under the syndicated backstop credit facility of $1 billion. As of March 30, 2007, the Company had no borrowings under this credit facility and was in compliance with all terms of the agreement.
At March 30, 2007, the Company had $51.9 million of short-term borrowings and $1.45 billion of long-term debt. As further described in Note 10 to the consolidated financial statements, commercial paper is classified as short-term borrowings. The Company had no outstanding commercial paper as of March 30, 2007.
In March 2005, the Company used the proceeds from the sale of DynCorp International and cash on hand to redeem the 7.5% term notes due August 2005, and the 6.75% term notes due June 2006 for $998.9 million, and an early redemption premium of $27.8 million.
On March 21, 2005, the Company instituted a voluntary share repurchase program for shareholders owning less than 100 shares. Under this program which has now expired, the Company repurchased 48,443 shares for $2.2 million on April 25, 2005 and 11,000 shares for $.5 million on May 31, 2005.
In the opinion of management, CSC will be able to meet its liquidity and cash needs for the foreseeable future through the combination of cash flows from operating activities, cash balances, and unused short-term borrowing capacity. If these resources need to be augmented, major additional cash requirements would likely be financed by the issuance of debt and/or equity securities and/or the exercise of the put option as described in Note 15 to the consolidated financial statements. During fiscal 2002, the Company filed a shelf registration statement for up to $1.5 billion of debt and/or equity securities. The Company has previously issued $600 million worth of term debt from the shelf registration, leaving $900 million of shelf available for additional securities. As a result of the delay in filing its second and third quarter Form 10-Q’s during fiscal 2007 the Company will not be able to utilize the available shelf registration to issue additional securities until April of 2008. There can be no assurances the Company will be able to issue debt with acceptable terms.
Off Balance Sheet Arrangements and Contractual Obligations
The following table summarizes the expiration of the Company’s financial guarantees outstanding as of March 30, 2007:
Dollars in millions | | Fiscal 2008 | | | Fiscal 2009 | | | Fiscal 2010 & thereafter | | | Total | |
| Performance guarantees: | | | | | | | | | | | | |
| Surety bonds | | $ | 22.4 | | | $ | 2.4 | | | | | | $ | 24.8 | |
| Letters of credit | | | 366.1 | | | | 186.2 | | | $ | 10.1 | | | | 562.4 | |
| Standby letters of credit | | | 72.0 | | | | 1.0 | | | | | | | | 73.0 | |
| Foreign subsidiary debt guarantees | | | 543.9 | | | | | | | | 23.2 | | | | 567.1 | |
Total | | $ | 1,004.4 | | | $ | 189.6 | | | $ | 33.3 | | | $ | 1,227.3 | |
See Note 10 to the notes to consolidated financial statements for further discussion.
The following table summarizes the Company’s payments on contractual obligations by period as of March 30, 2007:
Dollars in millions | | Less than 1 year | | | 1-3 years | | | 3-5 years | | | More than 5 years | | | Total | |
| Long-term debt | | | | | $ | 499.4 | | | $ | 498.5 | | | $ | 297.8 | | | $ | 1,295.7 | |
| Interest on fixed rate debt | | $ | 74.9 | | | | 117.1 | | | | 76.1 | | | | 13.7 | | | | 281.8 | |
| Capital lease obligations | | | 41.5 | | | | 36.5 | | | | 16.7 | | | | 57.1 | | | | 151.8 | |
| Bank debt | | | 51.9 | | | | | | | | | | | | | | | | 51.9 | |
| Operating leases | | | 302.1 | | | | 397.8 | | | | 199.9 | | | | 125.6 | | | | 1,025.4 | |
| Minimum purchase obligations | | | 435.3 | | | | 313.4 | | | | 53.8 | | | | | | | | 802.5 | |
| Other long-term liabilities | | | .3 | | | | 3.4 | | | | 2.7 | | | | .1 | | | | 6.5 | |
Total | | $ | 906.0 | | | $ | 1,367.6 | | | $ | 847.7 | | | $ | 494.3 | | | $ | 3,615.6 | �� |
Regarding minimum purchase obligations included above, the Company has signed long-term purchase agreements with certain software, hardware, telecommunication and other service providers to obtain favorable pricing, committed service levels and terms for services necessary for the operation of business activities. The Company is contractually committed to purchase specified service minimums over remaining periods ranging generally from one to five years. If the Company does not meet the specified service minimums, the Company may have an obligation to pay the service provider a portion or all of the shortfall.
The above excludes estimated minimum funding requirements for retiree benefit plans as set forth by the Employee Retirement Income Security Act (ERISA). The Company has numerous plans, both inside and outside of the U.S., and determines expected funding requirements on a per-plan basis. The minimum funding requirement can vary significantly from year to year based on a variety of factors, and can be zero in some years. Funding is determined based on a review of benefit obligations and plan assets as well as various regulatory requirements including ERISA and Cost Accounting Standards (CAS) applied to U.S. government contracts. While there are certain minimum contribution requirements, CSC may elect to increase the level of funding of contributions based on a number of factors including performance of pension investments, changes in workforce composition and the ability to recover costs on cost reimbursable contracts. During fiscal 2008, the Company expects to make contributions of approximately $240 million to pension and postretirement benefit plans. The Company has not quantified expected contributions beyond fiscal 2008 because it is not possible to predict future timing or direction of the capital markets, which can have a significant impact on future minimum funding obligations. Refer to the Critical Accounting Estimates section later in this MD&A and to Note 12 to the notes to consolidated financial statements for further discussion.
Fiscal 2007 Company contributions amounted to $248.8 million. These fiscal year contribution figures may differ from those in Note 12 to the notes to consolidated financial statements due to the use of a December 31st measurement date in that note.
Dividends and Redemption
It has been the Company’s policy to invest earnings in the growth of the Company rather than distribute earnings as dividends. This policy, under which dividends have not been paid since fiscal 1969, is expected to continue, but is subject to review by the Board of Directors.
CRITICAL ACCOUNTING ESTIMATES
Our consolidated financial statements have been prepared in accordance with accounting principles generally accepted in the United States (U.S. GAAP). Our significant accounting policies are described in Note 1 to the consolidated financial statements under “Summary of Significant Accounting Policies.” The preparation of consolidated financial statements in accordance with U.S. GAAP requires us to make estimates and judgments that affect the reported amounts of assets, liabilities, revenue and expenses, as well as the disclosure of contingent assets and liabilities. We base our estimates and judgments on historical experience and other factors believed to be reasonable under the circumstances. Many of the types of estimates made are for contract-specific issues. Changes to estimates or assumptions on a specific contract could result in a material adjustment to the consolidated financial statements.
We have identified several critical accounting estimates. An accounting estimate is considered critical if both: (a) the nature of the estimates or assumptions is material due to the levels of subjectivity and judgment involved, and (b) the impact of changes in the estimates and assumptions would have a material effect on the consolidated financial statements. Our critical accounting estimates relate to: revenue recognition and cost estimation and recoverability on long-term, fixed-price contracts; revenue recognition on software license sales that require significant customization; capitalization of outsourcing contract costs and software development costs; estimates used to determine deferred income taxes; assumptions related to purchase accounting and goodwill; assumptions to determine retirement benefits costs and liabilities; and assumptions and estimates used to analyze contingencies and litigation. For all of these estimates, we caution that future events rarely develop exactly as forecast, and the best estimates routinely require adjustment.
Revenue recognition
The majority of our revenue is recognized based on objective criteria and does not require significant estimates. Revenue from our fixed unit price contracts, time and materials contracts and cost plus contracts is recognized based on objective criteria and is not subject to estimates that may change over time. However, for our fixed-price contracts that use percentage-of-completion accounting, which is less than seven percent of the Company’s revenues, the determination of revenues and costs requires significant judgment and estimation. Under this method we recognize revenue on a constant margin as contract milestones or other output based measures are achieved. Costs are deferred until contractual milestones or other output based or cost based measures are achieved. The method requires estimates of costs and profits over the entire term of the contract, including estimates of resources and costs necessary to complete performance. Such estimates are particularly difficult on activities involving state-of-the-art technologies such as system development projects. The cost estimation process is based upon the professional knowledge and experience of our software and systems engineers, program managers and financial professionals. Key factors that are considered in estimating the work to be completed and ultimate contract profitability include the availability and productivity of labor and the nature and complexity of the work to be performed. A significant change in an estimate on one or more contracts could have a material effect on our results of operations. Our management regularly reviews project profitability and the underlying estimates.
Modifications to contract scope, schedule, and price may be required on development contracts accounted for on a percentage-of-completion basis. Accounting for such changes prior to formal contract modification requires evaluation of the characteristics and circumstances of the effort completed and assessment of probability of recovery. If recovery is deemed probable, we may, as appropriate, either defer the costs until the parties have agreed on the contract change or recognize the costs and related revenue as current period contract performance. We routinely negotiate such contract modifications in both the U.S. Federal and Global Commercial segments.
Many of our contracts call for us to provide a range of services or elements to our customers. The total estimated revenue for these contracts is allocated to the various services or elements based on relative fair value. These relative fair values are determined based on objective evidence of fair value. Once the total estimated revenue has been allocated to the various contract elements, revenue for each element is recognized based on the relevant revenue recognition method for the services performed or elements delivered.
Estimates of total revenue at contract inception often differ materially from actual revenue due to volume difference, changes in technology or other factors which may not be foreseen at inception.
Revenue recognition on software license sales that require significant customization
If significant customization is required in the delivery of a proprietary software product, revenue is recognized as the software customization services are performed in accordance with the percentage-of-completion method described above. Thus, cost and profit estimates are required over the life of the project, and changes in such estimates can have a material effect on results.
Capitalization of outsourcing contract costs
Certain costs incurred upon initiation of an outsourcing contract are deferred and amortized over the contract life. These costs consist of contract acquisition and transition/set-up costs, and include the cost of due diligence activities after competitive selection, costs associated with installation of systems and processes, and amounts paid to clients in excess of the fair market value of acquired assets (premiums). Finance staff, working with program management, review costs to determine appropriateness for deferral in accordance with relevant accounting guidance.
Key estimates and assumptions that we must make include assessing the fair value of acquired assets in order to calculate the premium and projecting future cash flows in order to assess the recoverability of deferred costs. We utilize the experience and knowledge of our professional staff in program management, operations, procurement and finance areas, as well as third parties on occasion, to determine fair values of assets acquired. To assess recoverability, undiscounted estimated cash flows of the contract are projected over its remaining life and compared to the unamortized deferred cost balance. Such estimates require judgment and assumptions, which are based upon the professional knowledge and experience of our personnel. Key factors that are considered in estimating the undiscounted cash flows include projected labor costs and productivity efficiencies. A significant change in an estimate or assumption on one or more contracts could have a material effect on our results of operations. Amortization of such premiums is recorded as a reduction to revenues.
Capitalization of software development costs
We capitalize certain costs incurred to develop commercial software products and to develop or purchase internal-use software. Significant estimates and assumptions include: determining the appropriate period over which to amortize the capitalized costs based on the estimated useful lives, estimating the marketability of the commercial software products and related future revenues, and assessing the unamortized cost balances for impairment. For commercial software products, determining the appropriate amortization period is based on estimates of future revenues from sales of the products. We consider various factors to project marketability and future revenues, including an assessment of alternative solutions or products, current and historical demand for the product, and anticipated changes in technology that may make the product obsolete. For internal-use software, the appropriate amortization period is based on estimates of our ability to utilize the software on an ongoing basis. To assess the realizability or recoverability of capitalized software costs, we must estimate future revenue, costs and cash flows. Such estimates require assumptions about future cash inflows and outflows, and are based on the experience and knowledge of professional staff. A significant change in an estimate related to one or more software products could result in a material change to our results of operations.
Estimates used to determine income tax expense
We make certain estimates and judgments in determining income tax expense for financial statement purposes. These estimates and judgments occur in the calculation of certain tax assets and liabilities, which principally arise from differences in the timing of recognition of revenue and expense for tax and financial statement purposes. We also must analyze income tax reserves, as well as determine the likelihood of recoverability of deferred tax assets, and adjust any valuation allowances accordingly. Considerations with respect to the recoverability of deferred tax assets include the period of expiration of the tax asset, planned use of the tax asset, and historical and projected taxable income as well as tax liabilities for the tax jurisdiction to which the tax asset relates. Valuation allowances are evaluated periodically and will be subject to change in each future reporting period as a result of changes in one or more of these factors.
Assumptions related to purchase accounting and goodwill
We account for our acquisitions using the purchase method of accounting. This method requires estimates to determine the fair values of assets and liabilities acquired, including judgments to determine any acquired intangible assets such as customer-related intangibles, as well as assessments of the fair value of existing assets such as property and equipment. Liabilities acquired can include balances for litigation and other contingency reserves established prior to or at the time of acquisition, and require judgment in ascertaining a reasonable value. Third party valuation firms may be used to assist in the appraisal of certain assets and liabilities, but even those determinations would be based on significant estimates provided by us, such as forecasted revenues or profits on contract-related intangibles. Numerous factors are typically considered in the purchase accounting assessments, which are conducted by Company professionals from legal, finance, human resources, information systems, program management and other disciplines. Changes in assumptions and estimates of the acquired assets and liabilities would result in changes to the fair values, resulting in an offsetting change to the goodwill balance associated with the business acquired.
As goodwill is not amortized, goodwill balances are regularly assessed for potential impairment. Such assessments require an analysis of future cash flow projections as well as a determination of an appropriate discount rate to calculate present values. Cash flow projections are based on management-approved estimates, which involve the input of numerous Company professionals from finance, operations and program management. Key factors used in estimating future cash flows include assessments of labor and other direct costs on existing contracts, estimates of overhead costs and other indirect costs, and assessments of new business prospects and projected win rates. Significant changes in the estimates and assumptions used in purchase accounting and goodwill impairment testing can have a material effect on the consolidated financial statements.
Assumptions to determine retirement benefits costs and liabilities
We offer a number of pension and postretirement benefit and life insurance benefit plans. CSC utilizes actuarial methods required by Statement of Financial Accounting Standards (SFAS) No. 87, as amended by SFAS No. 158 for fiscal 2007, “Employers’ Accounting for Pensions,” and SFAS No. 106, “Employers’ Accounting for Postretirement Benefits Other Than Pensions,” to account for pension and postretirement benefit plans, respectively. The actuarial methods require numerous assumptions to calculate the net periodic pension benefit expense and the related pension benefit obligation for our defined benefit pension plans. Two of the most significant assumptions are the expected long-term rate of return on plan assets and discount rates. In making these assumptions, we are required to consider current market conditions, including changes in interest rates. Changes in the related net periodic pension costs may occur in the future due to changes in these and other assumptions.
The expected long-term rate of return on plan assets should, over time, approximate the actual long-term returns on pension plan assets. The assumption for the expected long-term rate of return on plan assets is selected by taking into account the expected duration of the projected benefit obligation for each plan, the asset mix of the plan, historic plan asset returns as well as current market conditions and other factors. The weighted-average of the expected long-term rates of return, for all plans, on plan assets utilized for the fiscal 2007 pension plan valuations was 7.7% compared to 7.8% used in fiscal 2006. Holding all other assumptions constant, a one-half percent increase or decrease in each of the assumed rates of return on plan assets would have decreased or increased, respectively, the net periodic pension cost by approximately $16 million.
An assumed discount rate is required to be used in each pension plan actuarial valuation. The discount rate assumption reflects the market rate for high-quality, fixed income debt instruments based on the expected duration of the benefit payments for each of our pension plans as of the annual measurement date and is subject to change each year. The weighted-average of the discount rates utilized for the fiscal 2007 pension plan valuations was 5.3% compared to 5.6% used for fiscal 2006. Holding all other assumptions constant, a one-half percent increase or decrease in each of the assumed discount rates would have decreased the net periodic pension cost by approximately $40 million, or increased it by approximately $52 million, respectively. Some portion of the increase or decrease would be moderated by cost reimbursable contracts.
The accounting guidance includes mechanisms that serve to limit the volatility in earnings which would otherwise result from recording changes in the value of plan assets and benefit obligations in the consolidated financial statements in the periods in which such changes occur. For example, while the expected long-term rate of return on plan assets should, over time, approximate the actual long-term returns, differences between the expected and actual returns may occur in any given year. Such differences contribute to the deferred actuarial gains or losses which are then amortized over time. For CSC, positive market returns for fiscal 2006 and fiscal 2007 caused actual pension plan asset returns to exceed those expected. Declining discount rates over the past several years, which resulted in higher calculated benefit obligations, served to partially offset or more than offset the positive impact of the asset returns for fiscal 2005 and fiscal 2006, respectively.
For fiscal 2007, SFAS No. 158 requires recognition of a pension obligation if the fair value of plan assets is less than the projected benefit obligation (PBO) at the end of the year. For fiscal 2006, SFAS No. 87 requires recognition of a minimum pension obligation if the fair value of plan assets is less than the accumulated benefit obligation (ABO) at the end of the year. At the end of fiscal 2007, a number of our pension plans had PBOs in excess of the fair value of their respective plan assets, thus requiring the recognition of additional pension obligations. The effect of this adjustment and the annual measurement was to increase pension liability by $403.5 million, decrease intangible assets by $16 million, decrease non-current asset by $87.4 million, and increase accumulated comprehensive loss by $539.7 million ($376.0 million net of taxes). Based on future plan asset performance and interest rates, additional charges to equity might be required.
Assumptions and estimates used to analyze contingencies and litigation
We are subject to various claims and contingencies associated with lawsuits, insurance, tax and other issues arising out of the normal course of business. The consolidated financial statements reflect the treatment of claims and contingencies based on management’s view of the expected outcome. CSC consults with legal counsel on issues related to litigation and seeks input from other experts and advisors with respect to matters in the ordinary course of business. If the likelihood of an adverse outcome is probable and the amount is estimable, we accrue a liability in accordance with SFAS No. 5, “Accounting for Contingencies.” Significant changes in the estimates or assumptions used in assessing the likelihood of an adverse outcome could have a material effect on the consolidated financial results.
Item 7A. Quantitative and Qualitative Disclosures about Market Risk Interest Rates
The Company utilizes fixed-rate long-term debt obligations, short-term commercial paper and other borrowings subject to market risk from changes in interest rates. Sensitivity analysis is one technique used to measure the impact of changes in interest rates on the value of market-risk sensitive financial instruments. A hypothetical 10% movement in interest rates would not have a material impact on the Company’s future earnings or cash flows and fair value of fixed rate debt.
Foreign Currency
During the ordinary course of business, the Company enters into certain contracts denominated in foreign currency. Potential foreign currency exposures arising from these contracts are analyzed during the contract bidding process. The Company generally manages these transactions by incurring costs to service contracts in the same currency in which revenue is received. Short-term contract financing requirements are met by borrowing in the same currency. By generally matching revenues, costs and borrowings to the same currency, the Company has been able to substantially mitigate foreign currency risk to earnings. However, the Company is increasing its use of offshore support and is therefore becoming more exposed to currency fluctuations. The Company may use foreign currency forward contracts or options to hedge exposures arising from these transactions.
During fiscal 2007, 38.2% of the Company’s revenue was generated outside of the United States. Using sensitivity analysis, a hypothetical 10% increase in the value of the U.S. dollar against all currencies would decrease revenue by 3.82% or $567.9 million, while a hypothetical 10% decrease in the value of the U.S. dollar against all currencies would increase revenue by 3.82% or $567.9 million. In the opinion of management, a substantial portion of this fluctuation would be offset by expenses incurred in local currency. As a result, a hypothetical 10% movement of the value of the U.S. dollar against all currencies in either direction would impact the Company’s earnings before interest and taxes by $8.3 million. This amount would be offset, in part, from the impacts of local income taxes and local currency interest expense.
At March 30, 2007, the Company had approximately $914.1 million of non-U.S. dollar denominated cash and cash equivalents, and approximately $51.9 million of non-U.S. dollar borrowings.
Item 8. Consolidated Financial Statements and Supplementary Data
Index to Consolidated Financial Statements and Financial Statement Schedule
| | Page |
Consolidated Financial Statements |
| Management’s Report on Internal Control | 49 |
| Reports of Independent Registered Public Accounting Firm | 50 |
| Consolidated Balance Sheets as of March 30, 2007 and March 31, 2006 (As Restated) | 53 |
| Consolidated Statements of Income for the years ended March 30, 2007, March 31, 2006 (As Restated) and April 1, 2005 (As Restated) | 55 |
| Consolidated Statements of Cash Flows for the years ended March 30, 2007, March 31, 2006 (As Restated) and April 1, 2005 (As Restated) | 56 |
| Consolidated Statements of Stockholders’ Equity for the years ended March 30, 2007, March 31, 2006 (As Restated) and April 1, 2005 (As Restated) | 57 |
| Notes to Consolidated Financial Statements | 58 |
| Quarterly Financial Information (Unaudited) | 110 |
Schedule |
| Schedule II—Valuation and Qualifying Accounts for the years ended March 30, 2007, March 31, 2006 and April 1, 2005 | 124 |
Schedules other than that listed above have been omitted since they are either not required, are not applicable, or the required information is shown in the consolidated financial statements or related notes.
MANAGEMENT REPORT
Management Report on Internal Control Over Financial Reporting
The management of Computer Sciences Corporation (the Company) is responsible for establishing and maintaining adequate internal control over financial reporting. The Company’s internal control over financial reporting is a process designed to provide reasonable assurance regarding the reliability of financial reporting and the preparation of the Company’s consolidated financial statements for external reporting purposes in accordance with accounting principles generally accepted in the United States of America.
The Company’s internal control over financial reporting includes policies and procedures pertaining to the maintenance of records that, in reasonable detail, accurately and fairly reflect transactions and dispositions of assets; provide reasonable assurance transactions are recorded as necessary to permit preparation of consolidated financial statements in accordance with accounting principles generally accepted in the United States of America, and receipts and expenditures are being made only in accordance with authorizations of management and the directors of the Company; and provide reasonable assurance regarding prevention or timely detection of unauthorized acquisition, use or disposition of the Company’s assets that could have a material effect on the Company’s consolidated financial statements. All internal controls, no matter how well designed, have inherent limitations. Therefore, even where internal control over financial reporting is determined to be effective, it can provide only reasonable assurance. Projections of any evaluation of effectiveness to future periods are subject to the risk controls may become inadequate because of changes in conditions, or the degree of compliance with the policies or procedures may deteriorate.
As of the end of the Company’s 2007 fiscal year, management conducted an assessment of the effectiveness of the Company’s internal control over financial reporting based on the framework established in Internal Control—Integrated Framework issued by the Committee of Sponsoring Organizations of the Treadway Commission (COSO). A material weakness is a significant deficiency, or a combination of significant deficiencies, that results in more than a remote likelihood that a material misstatement to the Company’s annual or interim financial statements will not be prevented or detected. In the course of the Company’s assessment, it has identified the following material weakness in internal control over financial reporting: there are insufficient knowledgeable and competent personnel in certain key positions within the tax function and processes and procedures over accounting for income taxes are not adequate for the Company’s size and complexity. As a result of this material weakness in internal control over the accounting for income taxes, material errors in income tax expense and related liabilities and deferred tax assets occurred in fiscal 2007 and prior years which resulted in restatements, as described in Note 2 to the consolidated financial statements. Accordingly, management has determined the Company’s internal control over financial reporting as of March 30, 2007 was not effective.
Management’s assessment of the effectiveness of the Company’s internal control over financial reporting as of March 30, 2007 has been audited by the Company’s independent registered public accounting firm, as stated in their report appearing on page 50.
Date: June 13, 2007
REPORT OF INDEPENDENT REGISTERED PUBLIC ACCOUNTING FIRM
To the Board of Directors and Stockholders
Computer Sciences Corporation
El Segundo, California
We have audited management’s assessment, included in the accompanying Management Report on Internal Control over Financial Reporting, that Computer Sciences Corporation (the Company) did not maintain effective internal control over financial reporting as of March 30, 2007, because of the effect of the material weakness identified in management’s assessment based on the criteria established in Internal Control – Integrated Framework issued by the Committee of Sponsoring Organizations of the Treadway Commission. The Company’s management is responsible for maintaining effective internal control over financial reporting and for its assessment of the effectiveness of internal control over financial reporting. Our responsibility is to express an opinion on management’s assessment and an opinion on the effectiveness of the Company’s internal control over financial reporting based on our audit.
We conducted our audit in accordance with the standards of the Public Company Accounting Oversight Board (United States). Those standards require that we plan and perform the audit to obtain reasonable assurance about whether effective internal control over financial reporting was maintained in all material respects. Our audit included obtaining an understanding of internal control over financial reporting, evaluating management’s assessment, testing and evaluating the design and operating effectiveness of internal control, and performing such other procedures as we considered necessary in the circumstances. We believe that our audit provides a reasonable basis for our opinions.
A company’s internal control over financial reporting is a process designed by, or under the supervision of, the company’s principal executive and principal financial officers, or persons performing similar functions, and effected by the company’s board of directors, management, and other personnel to provide reasonable assurance regarding the reliability of financial reporting and the preparation of financial statements for external purposes in accordance with generally accepted accounting principles. A company’s internal control over financial reporting includes those policies and procedures that (1) pertain to the maintenance of records that, in reasonable detail, accurately and fairly reflect the transactions and dispositions of the assets of the company; (2) provide reasonable assurance that transactions are recorded as necessary to permit preparation of financial statements in accordance with generally accepted accounting principles, and that receipts and expenditures of the company are being made only in accordance with authorizations of management and directors of the company; and (3) provide reasonable assurance regarding prevention or timely detection of unauthorized acquisition, use, or disposition of the company’s assets that could have a material effect on the financial statements.
Because of the inherent limitations of internal control over financial reporting, including the possibility of collusion or improper management override of controls, material misstatements due to error or fraud may not be prevented or detected on a timely basis. Also, projections of any evaluation of the effectiveness of the internal control over financial reporting to future periods are subject to the risk that the controls may become inadequate because of changes in conditions, or that the degree of compliance with the policies or procedures may deteriorate.
A material weakness is a significant deficiency, or combination of significant deficiencies, that results in more than a remote likelihood that a material misstatement of the annual or interim financial statements will not be prevented or detected. The following material weakness has been identified and included in management's assessment: there are insufficient knowledgeable and competent tax personnel and the Company’s processes and procedures for accounting for income taxes are inadequate for the Company’s size and complexity. As a result of this material weakness in the design of internal control over accounting for income taxes, material errors in income tax expense and related liabilities and deferred tax assets occurred in fiscal 2007 and prior years. This deficiency results in a more than remote likelihood that a material misstatement to the Company’s income tax expense and related liabilities and deferred tax asset accounts in the annual or interim financial statements will not be prevented or detected. This material weakness was considered in determining the nature, timing, and extent of audit tests applied in our audit of the consolidated financial statements and financial statement schedule as of and for the year ended March 30, 2007 of the Company and this report does not affect our report on such financial statements and financial statement schedule.
In our opinion, management’s assessment that the Company did not maintain effective internal control over financial reporting as of March 30, 2007, is fairly stated, in all material respects, based on the criteria established in Internal Control – Integrated Framework issued by the Committee of Sponsoring Organizations of the Treadway Commission. Also in our opinion, because of the effect of the material weakness described above on the objectives of the control criteria, the Company has not maintained effective internal control over financial reporting as of March 30, 2007, based on the criteria established in Internal Control – Integrated Framework issued by the Committee of Sponsoring Organizations of the Treadway Commission.
We have also audited, in accordance with the standards of the Public Company Accounting Oversight Board (United States), the consolidated financial statements and financial statement schedule as of and for the year ended March 30, 2007 of the Company and our report dated June 13, 2007 expressed an unqualified opinion on those financial statements and financial statement schedule, and includes an explanatory paragraph relating to the Company’s adoption of Statement of Financial Accounting Standards (SFAS) No. 123(R), Share-Based Payment on April 1, 2006 and SFAS No. 158, Employer’s Accounting for Defined Benefit Pension and Other Postretirement Plans – An Amendment of FASB Statement No. 87, 88, 106 and 132R on March 30, 2007.
DELOITTE & TOUCHE LLP
Los Angeles, California
June 13, 2007
REPORT OF INDEPENDENT REGISTERED PUBLIC ACCOUNTING FIRM
To the Board of Directors and Stockholders
Computer Sciences Corporation
El Segundo, California
We have audited the accompanying consolidated balance sheets of Computer Sciences Corporation (the Company) as of March 30, 2007 and March 31, 2006, and the related consolidated statements of income, stockholders’ equity, and cash flows for each of the three years in the period ended March 30, 2007. Our audits also included the financial statement schedule listed in the Index at Item 8. These financial statements and the financial statement schedule are the responsibility of the Company’s management. Our responsibility is to express an opinion on the financial statements and the financial statement schedule based on our audits.
We conducted our audits in accordance with the standards of the Public Company Accounting Oversight Board (United States). Those standards require that we plan and perform the audit to obtain reasonable assurance about whether the financial statements are free of material misstatement. An audit includes examining, on a test basis, evidence supporting the amounts and disclosures in the financial statements. An audit also includes assessing the accounting principles used and significant estimates made by management, as well as evaluating the overall financial statement presentation. We believe that our audits provide a reasonable basis for our opinion.
In our opinion, such consolidated financial statements present fairly, in all material respects, the financial position of Computer Sciences Corporation as of March 30, 2007 and March 31, 2006, and the results of its operations and its cash flows for each of the three years in the period ended March 30, 2007, in conformity with accounting principles generally accepted in the United States of America. Also, in our opinion, such financial statement schedule, when considered in relation to the basic consolidated financial statements taken as a whole, presents fairly, in all material respects, the information set forth therein.
As discussed in Note 1, Note 12 and Note 14 to the consolidated financial statements, the Company adopted Statement of Financial Accounting Standards (SFAS) No. 123(R), Share-Based Payment on April 1, 2006 and SFAS No. 158, Employer’s Accounting for Defined Benefit Pension and Other Postretirement Plans – An Amendment of FASB Statement No. 87, 88, 106 and 132R on March 30, 2007.
As discussed in Note 2 to the consolidated financial statements, the Company has restated the accompanying consolidated balance sheet as of March 31, 2006, and the related consolidated statements of income, stockholders’ equity, and cash flows for each of the two years in the period ended March 31, 2006.
We have also audited, in accordance with the standards of the Public Company Accounting Oversight Board (United States), the effectiveness of the Company’s internal control over financial reporting as of March 30, 2007, based on the criteria established in Internal Control – Integrated Framework issued by the Committee of Sponsoring Organizations of the Treadway Commission and our report dated June 13, 2007 expressed an unqualified opinion on management’s assessment of the effectiveness of the Company’s internal control over financial reporting and an adverse opinion on the effectiveness of the Company’s internal control over financial reporting.
DELOITTE & TOUCHE LLP
Los Angeles, California
June 13, 2007
COMPUTER SCIENCES CORPORATION
CONSOLIDATED BALANCE SHEETS
ASSETS
In millions | | March 30, 2007 | | | March 31, 2006 | |
| | | | | | As Restated (1) | |
| Current assets: | | | | | | |
Cash and cash equivalents | | $ | 1,050.1 | | | $ | 1,290.7 | |
Receivables, net of allowance for doubtful accounts of $58.0 (2007) and $68.4 (2006) | | | 4,184.3 | | | | 3,732.6 | |
Prepaid expenses and other current assets | | | 1,472.0 | | | | 1,268.9 | |
Total current assets | | | 6,706.4 | | | | 6,292.2 | |
| Investments and other assets: | | | | | | | | |
Software, net of accumulated amortization of $830.3 (2007) and $732.4 (2006) | | | 513.3 | | | | 453.3 | |
Outsourcing contract costs, net of accumulated amortization of $1,167.9 (2007) and $1,112.8 (2006) | | | 1,029.5 | | | | 1,175.3 | |
Goodwill, net of accumulated amortization of $340.1 (2007) and $323.0 (2006) | | | 2,505.2 | | | | 2,306.3 | |
Other assets | | | 437.0 | | | | 474.5 | |
Total investments and other assets | | | 4,485.0 | | | | 4,409.4 | |
| Property and equipment—at cost: | | | | | | | | |
Land, buildings and lease hold improvements | | | 1,001.0 | | | | 913.4 | |
Computers and related equipment | | | 4,189.7 | | | | 4,039.9 | |
Furniture and other equipment | | | 422.2 | | | | 414.6 | |
| | | | 5,612.9 | | | | 5,367.9 | |
Less accumulated depreciation and amortization | | | 3,073.8 | | | | 3,047.8 | |
Property and equipment, net | | | 2,539.1 | | | | 2,320.1 | |
| | | $ | 13,730.5 | | | $ | 13,021.7 | |
| (1) | See Note 2, "Restatement of Consolidated Financial Statements," in Notes to Consolidated Financial Statements. |
(See notes to consolidated financial statements)
COMPUTER SCIENCES CORPORATION
CONSOLIDATED BALANCE SHEETS (CONTINUED)
LIABILITIES AND STOCKHOLDERS’ EQUITY
In millions | | March 30, 2007 | | | March 31, 2006 | |
| | | | | | As Restated (1) | |
| Current liabilities: | | | | | | |
Short-term debt and current maturities of long-term debt | | $ | 93.7 | | | $ | 85.3 | |
Accounts payable | | | 855.7 | | | | 705.1 | |
Accrued payroll and related costs | | | 732.5 | | | | 707.5 | |
Other accrued expenses | | | 1,799.3 | | | | 1,442.7 | |
Deferred revenue | | | 1,025.5 | | | | 634.3 | |
Federal, state and foreign income taxes | | | 752.9 | | | | 793.7 | |
Total current liabilities | | | 5,259.6 | | | | 4,368.6 | |
| Long-term debt, net of current maturities | | | 1,412.2 | | | | 1,376.8 | |
| Other long-term liabilities | | | 1,173.2 | | | | 770.9 | |
| Commitments and contingencies | | | | | | | | |
| Stockholders’ equity : | | | | | | | | |
Preferred stock par value $1 per share; authorized 1,000,000 shares; none issued | | | | | | | | |
Common stock, par value $1 per share; authorized 750,000,000 shares; issued 181,105,129 (2007) and 194,904,250 (2006) | | | 181.1 | | | | 194.9 | |
Additional paid-in capital | | | 1,876.3 | | | | 1,882.0 | |
Earnings retained for use in business | | | 4,250.6 | | | | 4,692.8 | |
Accumulated other comprehensive income (loss) | | | (68.5 | ) | | | 106.8 | |
| | | | 6,239.5 | | | | 6,876.5 | |
Less common stock in treasury, at cost, 7,787,140 (2007) and 7,653,655 shares (2006) | | | (354.0 | ) | | | (347.1 | ) |
Unearned restricted stock | | | | | | | (24.0 | ) |
Stockholders’ equity, net | | | 5,885.5 | | | | 6,505.4 | |
| | | $ | 13,730.5 | | | $ | 13,021.7 | |
| (1) | See Note 2, "Restatement of Consolidated Financial Statements," in Notes to Consolidated Financial Statements. |
(See notes to consolidated financial statements)
COMPUTER SCIENCES CORPORATION
CONSOLIDATED STATEMENTS OF INCOME
| | | Fiscal Year Ended | |
In millions (except per-share amounts) | | March 30, 2007 | | | March 31, 2006 | | | April 1, 2005 | |
| | | | | | As Restated (1) | | | As Restated (1) | |
| Revenues | | $ | 14,856.6 | | | $ | 14,639.0 | | | $ | 14,080.0 | |
| Costs of services (excludes depreciation and amortization) | | | 11,817.8 | | | | 11,724.0 | | | | 11,320.1 | |
| Selling, general and administrative | | | 916.4 | | | | 862.5 | | | | 856.7 | |
| Depreciation and amortization | | | 1,073.6 | | | | 1,091.8 | | | | 1,051.0 | |
| Interest expense | | | 175.2 | | | | 120.9 | | | | 159.4 | |
| Interest income | | | (49.5 | ) | | | (40.8 | ) | | | (16.1 | ) |
| Special items | | | 316.1 | | | | 77.3 | | | | 28.6 | |
| Total costs and expenses | | | 14,249.6 | | | | 13,835.7 | | | | 13,399.7 | |
| Income from continuing operations before taxes | | | 607.0 | | | | 803.3 | | | | 680.3 | |
| Taxes on income | | | 218.2 | | | | 332.2 | | | | 236.0 | |
| Income from continuing operations | | | 388.8 | | | | 471.1 | | | | 444.3 | |
| Income from discontinued operations, net of taxes | | | | | | | | | | | 85.0 | |
| Gain on sale of discontinued operations, net of taxes | | | | | | | 61.3 | | | | 228.8 | |
| Discontinued operations, net of taxes | | | | | | | 61.3 | | | | 313.8 | |
| Cumulative effect of change in accounting principle, net of taxes | | | | | | | (4.3 | ) | | | | |
| Net income | | $ | 388.8 | | | $ | 528.1 | | | $ | 758.1 | |
| Earnings per common share: | | | | | | | | | | | | |
| Continuing operations | | $ | 2.21 | | | $ | 2.54 | | | $ | 2.34 | |
| Discontinued operations | | | | | | | 0.33 | | | | 1.66 | |
| Cumulative effect of change in accounting principle | | | | | | | (0.02 | ) | | | | |
| Basic* | | $ | 2.21 | | | $ | 2.84 | | | $ | 4.00 | |
| Continuing operations | | $ | 2.16 | | | $ | 2.51 | | | $ | 2.31 | |
| Discontinued operations | | | | | | | 0.33 | | | | 1.64 | |
| Cumulative effect of change in accounting principle | | | | | | | (0.02 | ) | | | | |
| Diluted* | | $ | 2.16 | | | $ | 2.81 | | | $ | 3.95 | |
| ______________ | | | | | | | | | | | | |
| * Amounts may not add as a result of rounding. | | | | | | | | | | | | |
| (1) | See Note 2, "Restatement of Consolidated Financial Statements," in Notes to Consolidated Financial Statements. |
(See notes to consolidated financial statements)
COMPUTER SCIENCES CORPORATION
CONSOLIDATED STATEMENTS OF CASH FLOWS
| | | Fiscal Year Ended | |
In millions (except per-share amounts) | | March 30, 2007 | | | March 31, 2006 | | | April 1, 2005 | |
| | | | | | As Restated (1) | | | As Restated (1) | |
| Cash flows from operating activities: | | | | | | | | | |
Net income | | $ | 388.8 | | | $ | 528.1 | | | $ | 758.1 | |
Adjustments to reconcile net income to net cash provided byoperating activities: | | | | | | | | | | | | |
Depreciation and amortization | | | 1,162.0 | | | | 1,187.5 | | | | 1,145.5 | |
Stock based compensation | | | 58.7 | | | | 32.9 | | | | 18.4 | |
Cumulative effect of change in accounting principle | | | | | | | 4.3 | | | | | |
Deferred taxes | | | (51.9 | ) | | | 129.4 | | | | 142.9 | |
Special items | | | 2.3 | | | | 77.3 | | | | 28.6 | |
Gain on dispositions, net of tax | | | (23.2 | ) | | | (60.9 | ) | | | (229.7 | ) |
Provision for losses on accounts receivable | | | 5.5 | | | | 28.7 | | | | 10.7 | |
Excess tax benefit from stock based compensation | | | (12.1 | ) | | | | | | | | |
Changes in assets and liabilities, net of effects of acquisitions and dispositions: | | | | | | | | | | | | |
Increase in receivables | | | (238.0 | ) | | | (261.5 | ) | | | (314.7 | ) |
Increase in prepaid expenses and other current assets | | | (324.8 | ) | | | (193.4 | ) | | | (400.2 | ) |
Increase (decrease) in accounts payable and accruals | | | 348.2 | | | | (49.9 | ) | | | 493.5 | |
Increase (decrease) in income taxes payable | | | (75.3 | ) | | | 72.6 | | | | 98.9 | |
Increase in deferred revenue | | | 340.1 | | | | 73.5 | | | | 222.8 | |
Other operating activities, net | | | (1.7 | ) | | | (17.3 | ) | | | (33.3 | ) |
Net cash provided by operating activities | | | 1,578.6 | | | | 1,551.3 | | | | 1,941.5 | |
| Cash flows from investing activities: | | | | | | | | | | | | |
Purchases of property and equipment | | | (685.9 | ) | | | (826.9 | ) | | | (855.2 | ) |
Outsourcing contracts | | | (112.7 | ) | | | (242.5 | ) | | | (416.5 | ) |
Acquisitions, net of cash acquired | | | (134.3 | ) | | | (44.1 | ) | | | (20.5 | ) |
Business dispositions | | | 2.8 | | | | .5 | | | | 819.1 | |
Software | | | (154.2 | ) | | | (151.1 | ) | | | (205.1 | ) |
Other investing activities, net | | | 211.6 | | | | 140.1 | | | | 82.8 | |
Net cash used in investing activities | | | (872.7 | ) | | | (1,124.0 | ) | | | (595.4 | ) |
| Cash flows from financing activities: | | | | | | | | | | | | |
Borrowings under lines of credit | | | 542.9 | | | | 454.9 | | | | 47.9 | |
Repayment of borrowings under lines of credit | | | (564.4 | ) | | | (477.3 | ) | | | (25.8 | ) |
Principal payments on long-term debt | | | (40.8 | ) | | | (8.5 | ) | | | (7.4 | ) |
Redemption of debt | | | | | | | | | | | (1,025.2 | ) |
Proceeds from stock options, net of tax and other common stock transactions | | | 94.8 | | | | 101.1 | | | | 107.8 | |
Excess tax benefit from stock-based compensation | | | 12.1 | | | | | | | | | |
Repurchase of common stock | | | (1,000.0 | ) | | | | | | | | |
Acquisition of treasury stock | | | | | | | (227.7 | ) | | | | |
Other financing activities, net | | | (.1 | ) | | | 6.8 | | | | 2.1 | |
Net cash used in financing activities | | | (955.5 | ) | | | (150.7 | ) | | | (900.6 | ) |
| Effect of exchange rate changes on cash and cash equivalents | | | 9.0 | | | | 3.8 | | | | 2.0 | |
| Net increase (decrease) in cash and cash equivalents | | | (240.6 | ) | | | 280.4 | | | | 447.5 | |
| Cash and cash equivalents at beginning of year | | | 1,290.7 | | | | 1,010.3 | | | | 562.8 | |
| Cash and cash equivalents at end of year | | $ | 1,050.1 | | | $ | 1,290.7 | | | $ | 1,010.3 | |
| (1) | See Note 2, "Restatement of Consolidated Financial Statements," in Notes to Consolidated Financial Statements. |
(See notes to consolidated financial statements)
COMPUTER SCIENCES CORPORATION
CONSOLIDATED STATEMENTS OF STOCKHOLDERS’ EQUITY
| | | | | | | | | | | | Earnings | | | | | | | | | | | | | |
| | | | | | | | | | | | Retained | | | Accumulated | | | | | | | | | | |
| | | | | | | | | Additional | | | For Use | | | Other | | | Common | | | Unearned | | | | |
In millions except shares in | | Common Stock | | | Paid-In | | | in | | | Comprehensive | | | Stock in | | | Restricted | | | | |
thousands | | Shares | | | Amount | | | Capital | | | Business | | | Income (Loss) | | | Treasury | | | Stock | | | Total | |
| | | | | | As Restated (1) | | | As Restated (1) | | | As Restated (1) | | | | | | | | | As Restated (1) | | | As Restated (1) | |
Balance as of April 2, 2004 as previously reported | | | 188,294.0 | | | $ | 188.3 | | | $ | 1,539.2 | | | $ | 3,597.9 | | | $ | 198.4 | | | $ | (19.2 | ) | | $ | (.9 | ) | | $ | 5,503.7 | |
Adjustments to opening shareholder's equity (1) | | | | | | | | | | | 55.1 | | | | (191.3 | ) | | | | | | | | | | | | | | | (136.2 | ) |
Balance at April 2, 2004 as restated (1) | | | 188,294.0 | | | | 188.3 | | | | 1,594.3 | | | | 3,406.6 | | | | 198.4 | | | | (19.2 | ) | | | (.9 | ) | | | 5,367.5 | |
| Comprehensive income: | | | | | | | | | | | | | | | | | | | | | | | | | | | | | | | | |
| Net income | | | | | | | | | | | | | | | 758.1 | | | | | | | | | | | | | | | | 758.1 | |
| Currency translation adjustment | | | | | | | | | | | | | | | | | | | 94.3 | | | | | | | | | | | | 94.3 | |
| Unfunded pension obligation | | | | | | | | | | | | | | | | | | | (37.7 | ) | | | | | | | | | | | (37.7 | ) |
Unrealized loss on available for sale securities | | | | | | | | | | | | | | | | | | | (.1 | ) | | | | | | | | | | | (.1 | ) |
| Comprehensive income | | | | | | | | | | | | | | | | | | | | | | | | | | | | | | | 814.6 | |
Stock based compensation expense and option exercises | | | 3,368.2 | | | | 3.4 | | | | 138.6 | | | | | | | | | | | | (.1 | ) | | | (9.8 | ) | | | 132.1 | |
| Balance at April 1, 2005 | | | 191,662.2 | | | | 191.7 | | | | 1,732.9 | | | | 4,164.7 | | | | 254.9 | | | | (19.3 | ) | | | (10.7 | ) | | | 6,314.2 | |
| | | | | | | | | | | | | | | | | | | | | | | | | | | | | | | | | |
| Comprehensive income: | | | | | | | | | | | | | | | | | | | | | | | | | | | | | | | | |
| Net income | | | | | | | | | | | | | | | 528.1 | | | | | | | | | | | | | | | | 528.1 | |
| Currency translation adjustment | | | | | | | | | | | | | | | | | | | (169.6 | ) | | | | | | | | | | | (169.6 | ) |
| Unfunded pension obligation | | | | | | | | | | | | | | | | | | | 14.2 | | | | | | | | | | | | 14.2 | |
Unrealized loss on available for sale securities | | | | | | | | | | | | | | | | | | | 7.3 | | | | | | | | | | | | 7.3 | |
| Comprehensive income | | | | | | | | | | | | | | | | | | | | | | | | | | | | | | | 380.0 | |
| Acquisition of treasury stock | | | | | | | | | | | | | | | | | | | | | | | (327.8 | ) | | | | | | | (327.8 | ) |
Stock based compensation expense and option exercises | | | 3,242.1 | | | | 3.2 | | | | 149.1 | | | | | | | | | | | | | | | | (13.3 | ) | | | 139.0 | |
| Balance at March 31, 2006 | | | 194,904.3 | | | | 194.9 | | | | 1,882.0 | | | | 4,692.8 | | | | 106.8 | | | | (347.1 | ) | | | (24.0 | ) | | | 6,505.4 | |
| | | | | | | | | | | | | | | | | | | | | | | | | | | | | | | | | |
| Comprehensive income: | | | | | | | | | | | | | | | | | | | | | | | | | | | | | | | | |
| Net income | | | | | | | | | | | | | | | 388.8 | | | | | | | | | | | | | | | | 388.8 | |
| Currency translation adjustment | | | | | | | | | | | | | | | | | | | 248.3 | | | | | | | | | | | | 248.3 | |
| Unfunded pension obligation | | | | | | | | | | | | | | | | | | | 58.8 | | | | | | | | | | | | 58.8 | |
Unrealized loss on available for sale securities | | | | | | | | | | | | | | | | | | | 1.0 | | | | | | | | | | | | 1.0 | |
Reclassification adjustment for gains realized in net income | | | | | | | | | | | | | | | | | | | (6.9 | ) | | | | | | | | | | | (6.9 | ) |
| Comprehensive income | | | | | | | | | | | | | | | | | | | | | | | | | | | | | | | 690.0 | |
| Acquisition of treasury stock | | | | | | | | | | | | | | | | | | | | | | | (6.9 | ) | | | | | | | (6.9 | ) |
Stock based compensation expense and option exercises | | | 2,603.0 | | | | 2.6 | | | | 146.9 | | | | | | | | | | | | | | | | | | | | 149.5 | |
Amortization and forfeitures of restricted stock | | | | | | | | | | | | | | | | | | | | | | | | | | | 24.0 | | | | 24.0 | |
| Repurchase common stock | | | (16,402.1 | ) | | | (16.4 | ) | | | (152.6 | ) | | | (831.0 | ) | | | | | | | | | | | | | | | (1,000.0 | ) |
Adjustment to initially apply FASB Statement No. 158, net of taxes | | | | | | | | | | | | | | | | | | | (476.5 | ) | | | | | | | | | | | (476.5 | ) |
| Balance at March 30, 2007 | | | 181,105.2 | | | $ | 181.1 | | | $ | 1,876.3 | | | $ | 4,250.6 | | | $ | (68.5 | ) | | $ | (354.0 | ) | | | | | | $ | 5,885.5 | |
| (1) | See Note 2, "Restatement of Consolidated Financial Statements," in Notes to Consolidated Financial Statements. |
(See notes to consolidated financial statements)
COMPUTER SCIENCES CORPORATION
NOTES TO CONSOLIDATED FINANCIAL STATEMENTS
(Dollars in millions except per-share amounts)
Note 1—Summary of Significant Accounting Policies
Principles of Consolidation
The accompanying consolidated financial statements include those of Computer Sciences Corporation, its subsidiaries and those joint ventures and partnerships over which it exercises control, hereafter collectively referred to as “CSC” or “the Company.” Investments in business entities in which the Company does not have control, but has the ability to exercise significant influence over operating and financial policies, generally 20 – 50 percent ownership, are accounted for by the equity method. Other investments are accounted for by the cost method. All intercompany transactions and balances have been eliminated.
Reclassification
Prior period amounts have been adjusted to conform to current year presentation.
The Company has reclassified pension plans which have asset balances from other long-term liabilities to other assets. The reclassifications have been made to prior the period consolidated balance sheet to conform to the current year presentation. As a result the Company’s March 31, 2006 balance sheet herein reflects an $86.3 reclassification of other long-term liabilities to other assets. The balance sheet was the only financial statement impacted by this reclassification.
Prior year pension disclosure amounts have been restated to exclude a government plan which the Company has determined does not fall under SFAS No. 132(R) (as modified by SFAS No. 158), as the Company is not the plan sponsor.
Accounting Change
The Company adopted FASB Statement of Financial Accounting Standards (SFAS) No. 158, “Employer’s Accounting for Defined Benefit Pension and Other Postretirement Plans – An Amendment of FASB Statement No. 87, 88, 106 and 132R,” effective March 30, 2007. This Statement requires recognition of the overfunded or underfunded status of single-employer defined benefit postretirement plans as assets or liabilities, respectively, on the balance sheet. Changes to the funded status of the defined benefit plans are recognized in comprehensive income in the year in which the change occurs. Changes in the funded status are measured based on the projected benefit obligation for pension plans and the accumulated benefit obligation for other postretirement plans.
SFAS No. 158 further requires that the funded status of a defined benefit plan be measured as of the Company’s fiscal year end balance sheet date. This provision is effective for fiscal years ending after December 15, 2008. The Company has not yet determined the impact of this change to its financial statements.
The provisions of SFAS No. 158 were applied prospectively as of March 30, 2007 with the exception of the measurement date provision which will be applied in fiscal 2009.
COMPUTER SCIENCES CORPORATION
NOTES TO CONSOLIDATED FINANCIAL STATEMENTS (Continued)
(Dollars in millions except per-share amounts)
Note 1—Summary of Significant Accounting Policies (Continued)
The impact of the adoption of SFAS No. 158 on the Company’s consolidated balance sheet as of March 30, 2007 was as follows:
| | | Before Adoption of SFAS No. 158 | | | Adjustments | | | After Adoption of SFAS No. 158 | |
| Other assets | | $ | 583.5 | | | $ | (146.5 | ) | | $ | 437.0 | |
| Total assets | | | 13,877.0 | | | | (146.5 | ) | | | 13,730.5 | |
| Other accrued expense | | | 1,783.3 | | | | 16.0 | | | | 1,799.3 | |
| Income taxes payable | | | 981.5 | | | | (228.6 | ) | | | 752.9 | |
| Total current liabilities | | | 5,472.2 | | | | (212.6 | ) | | | 5,259.6 | |
| Other long-term liabilities | | | 630.6 | | | | 542.6 | | | | 1,173.2 | |
| Accumulated other comprehensive income | | | 408.0 | | | | (476.5 | ) | | | (68.5 | ) |
| Total stockholders’ equity | | | 6,362.0 | | | | (476.5 | ) | | | 5,885.5 | |
| Total liabilities and stockholders’ equity | | | 13,877.0 | | | | (146.5 | ) | | | 13,730.5 | |
On April 1, 2006 the Company adopted SFAS No. 123(R), “Share-Based Payment.” The Company has adopted the modified prospective transition method and therefore has not restated the results of prior periods. Under this method, the Company is required to recognize compensation expense equal to the fair value of partially vested share-based awards at April 1, 2006 over the remaining period of service, as well as the compensation expense for those share-based awards granted or modified on or after April 1, 2006. The total stock-based compensation expense for awards issued on or after April 1, 2006 is recorded on a straight-line basis over the vesting period based on the grant-date fair values. For those awards granted prior to the date of adoption, compensation expense is recognized on an accelerated basis based on the grant-date fair value amount as calculated for pro forma purposes under SFAS No. 123. The fair values are estimated using the Black-Scholes-Merton option pricing model as discussed further below. With respect to the income tax benefits associated with exercises of share-based payments, the Company has elected to adopt the alternative transition method as permitted by Financial Accounting Standards Board Staff Position (FSP) No. FAS 123(R)-3: Transition Election Related to Accounting for the Tax Effects of Share-Based Payment Awards.
Prior to the adoption of SFAS No. 123(R), the Company accounted for its stock-based compensation expense under Accounting Principles Board Opinion (APB) No. 25 “Accounting for Stock Issued to Employees” and related interpretations. The Company disclosed in its prior financial statements certain pro forma net income and earnings per share information under SFAS No. 123 “Accounting for Stock-Based Compensation,” as amended by SFAS No. 148 “Accounting for Stock-Based Compensation – Transition and Disclosure.”
In accordance with SFAS No. 123(R), the Company recognized $58.4 of stock-based compensation expense ($41.2 net of tax) for fiscal 2007. Of this amount, $13.8 was charged to costs of services and $44.6 was charged to selling, general and administrative expense, respectively. As a result of adopting SFAS No. 123(R), income from continuing operations before taxes for fiscal 2007 was $48.4 ($34.2 net of tax) lower than had the Company continued to account for share-based compensation under APB 25. The impact on both basic and diluted earnings per share for the same period was $.19 per share.
COMPUTER SCIENCES CORPORATION
NOTES TO CONSOLIDATED FINANCIAL STATEMENTS (Continued)
(Dollars in millions except per-share amounts)
Note 1—Summary of Significant Accounting Policies (Continued)
The following pro forma table illustrates the impact on net income and earnings per share had the Company applied the fair value expense recognition provisions of SFAS No. 123 for the years ended March 31, 2006 and April 1, 2005:
| | | Fiscal Year Ended March 31, 2006 | | | Fiscal Year Ended April 1, 2005 | |
| | | As Restated (1) | | | As Restated (1) | |
| Net income, | | $ | 528.1 | | | $ | 758.1 | |
| Add: Stock-based employee compensation expense included in reported net income, net of related tax effects | | | 23.8 | | | | 13.3 | |
Deduct: Total stock-based employee compensation expense determined under fair value based method for all awards, net of related tax effects | | | (34.3 | ) | | | (38.7 | ) |
| Pro forma net income | | $ | 517.6 | | | $ | 732.7 | |
| Earnings per share: | | | | | | | | |
| Basic – as reported | | | 2.84 | | | | 4.00 | |
| Basic – pro forma | | | 2.79 | | | | 3.86 | |
| Diluted – as reported | | | 2.81 | | | | 3.95 | |
| Diluted – pro forma | | | 2.75 | | | | 3.82 | |
| (1) | See Note 2, "Restatement of Consolidated Financial Statements |
As indicated, the Company uses the Black-Scholes-Merton model in determining the fair value of options granted. In applying this model, the expected term was calculated based on the Company’s historical experience with respect to its stock plan activity and is representative of the period of time that the stock-based awards are expected to be outstanding. Beginning April 1, 2006, the Company determined separate assumptions for the expected term of options granted based on three separate job tier classifications which had distinct historical exercise behavior. This resulted in separate fair value calculations by job tier. The risk-free interest rate was based on the zero coupon interest rate of U.S. Government issued Treasury strips with a period commensurate with the expected term of the options. In determining the overall risk-free interest rate, a range of interest rates from 4.11% to 4.96% was applied depending on the expected life of the grant. Expected volatility was based on a blended approach using an equal weighting of implied volatility and historical volatility. Historical volatility was based on the Company’s 10-year historical daily closing price. Implied volatility was based on option trading behavior for those options traded on certain exchange markets that have maturities of nine months and longer. The range of volatility used for fiscal 2007 was 28% to 33%. Forfeitures were estimated based on historical experience.
The weighted average fair values of stock options granted during fiscal 2007, fiscal 2006 and fiscal 2005 were $16.67, $15.59 and $16.95 per share, respectively. In calculating the actual and pro forma compensation expense for its stock incentive plans, the Company used the following weighted average assumptions:
| | | Fiscal Year | |
| | | 2007 | | | 2006 | | | 2005 | |
| Risk-free interest rate | | | 4.84 | % | | | 3.73 | % | | | 3.47 | % |
| Expected volatility | | | 28 | % | | | 41 | % | | | 47 | % |
| Expected lives | | 4.09 years | | | 3.87 years | | | 3.67 years | |
COMPUTER SCIENCES CORPORATION
NOTES TO CONSOLIDATED FINANCIAL STATEMENTS (Continued)
(Dollars in millions except per-share amounts)
Note 1—Summary of Significant Accounting Policies (Continued)
The Company implemented Financial Accounting Standards Board Interpretation No. (FIN) 47, “Accounting for Conditional Asset Retirement Obligations-an interpretation of FASB Statement No. 143” at December 31, 2005. The Company’s asset retirement obligation relates to leases which require the leased facilities be restored to their original condition upon expiration of the lease. As a result of adopting FIN 47, the Company recorded a liability for the asset retirement obligation of approximately $8.5 and recorded a charge to a cumulative effect of change in accounting principle for $5.6 ($4.3 after tax). Pro forma effects of implementing FIN 47 were not disclosed as they were not material.
Use of Estimates
The preparation of consolidated financial statements in conformity with accounting principles generally accepted in the United States of America requires management to make estimates and assumptions that affect the amounts reported in the consolidated financial statements and accompanying notes. Actual results could differ from those estimates.
Revenue Recognition
The Company’s primary service offerings are information technology (I/T) outsourcing and I/T and other professional services. The Company provides these services under time and materials, cost-reimbursable, unit-price and fixed price contracts. The form of contract, rather than the type of service offering, is the primary determinant of revenue recognition. Except as described below for certain fixed price contracts, revenues are recognized when persuasive evidence of an arrangement exists, services or products have been provided to the client, the sales price is fixed or determinable, and collectibility is reasonably assured.
For time and materials contracts, revenue is recorded at agreed-upon billing rates at the time services are provided.
For cost-reimbursable contracts, revenue is recorded at the time costs are incurred and associated fees are recognized when probable and estimable by applying an estimated factor to costs as incurred, such factor being determined by the contract provisions and prior experience.
Revenue is recognized on unit-price contracts based on unit metrics times the agreed upon contract unit price.
Revenue on eligible fixed price contracts is recognized on the basis of the estimated percentage-of-completion. Eligible contracts include certain software development projects and fixed price arrangements with the U.S. Federal government. Currently, less than seven percent of the Company’s revenues are recognized under this method. Progress towards completion is typically measured based on achievement of specified contract milestones, or other measure of progress when available, or based on costs incurred as a proportion of estimated total costs. Profit in a given period is reported at the expected profit margin to be achieved on the overall contract. This method can result in the recognition of unbilled receivables or the deferral of costs or profit on these contracts. Deferred costs may include costs related to customer change orders subject to negotiation with the customer. These deferred costs are recorded as prepaid expenses on the Company’s balance sheet. Management regularly reviews project profitability and underlying estimates. Revisions to the estimates at completion are reflected in results of operations as a change in accounting estimate in the period in which the facts that give rise to the revision become known by management. Provisions for estimated losses, if any, are recognized in the period in which the loss becomes probable and estimable. The provision includes estimated costs in excess of estimated revenue and any profit margin previously recognized.
COMPUTER SCIENCES CORPORATION
NOTES TO CONSOLIDATED FINANCIAL STATEMENTS (Continued)
(Dollars in millions except per-share amounts)
Note 1—Summary of Significant Accounting Policies (Continued)
The sale of proprietary software licenses typically includes multiple deliverables such as a license to use the software, post contract customer support, and services. Revenue is allocated to the undelivered elements equal to their fair value with the remainder allocated to the delivered software license element. Fair value is determined based on the price charged where each deliverable is sold separately. Revenue allocated to each element is recognized when 1) a written contract is executed, 2) the element has been delivered, 3) the fee is fixed and determinable, and 4) collectibility is reasonably assured. If significant customization is required, software licensing revenue is recognized as the related software customization services are performed in accordance with the percentage-of-completion method, utilizing the output method to measure progress to completion. Costs incurred in connection with sales of proprietary software are expensed as incurred.
Client contracts may include the provision of more than one of CSC’s services. CSC adopted Emerging Issues Task Force (EITF) Issue 00-21, “Revenue Arrangements with Multiple Deliverables,” for all arrangements entered into or modified after July 4, 2003. Accordingly, for applicable arrangements, revenue recognition includes the proper identification of separate units of accounting and the allocation of revenue across all elements based on relative fair values, with proper consideration given to the guidance provided by other authoritative literature.
Depreciation and Amortization
The Company’s depreciation and amortization policies are as follows:
| Property and Equipment: | |
Buildings | 10 to 40 years |
Computers and related equipment | 3 to 5 years |
Furniture and other equipment | 2 to 10 years |
Leasehold improvements | Shorter of lease term or useful life |
| Software | 2 to 10 years |
| Credit information files | 10 to 20 years |
| Acquired contract related intangibles | Contract life and first contract renewal |
| Outsourcing contract costs | Contract life, excluding option years |
For financial reporting purposes, the cost of property and equipment, less applicable residual values, is depreciated using predominately the straight-line method. Depreciation commences when the specific asset is complete, installed and ready for normal use. Outsourcing contract costs and credit information files are amortized on a straight-line basis. Acquired intangible assets are amortized based on estimated undiscounted cash flow over the estimated life of the asset or on a straight line basis if cash flow cannot be reliably estimated.
Software Development Costs
The Company capitalizes costs incurred to develop commercial software products after technological feasibility has been established. Costs incurred to establish technological feasibility are charged to expense as incurred. Enhancements to software products are capitalized where such enhancements extend the life or significantly expand the marketability of the products. Amortization of capitalized software development costs is determined separately for each software product. Annual amortization expense is calculated based on the greater of (a) the ratio of current gross revenues for each product to the total of current anticipated future gross revenues for the product or (b) the straight-line method over the estimated economic life of the product.
Unamortized capitalized software costs associated with commercial software products are regularly evaluated for impairment on a product-by-product basis by a comparison of the unamortized balance to the product’s net realizable value. The net realizable value is the estimated future gross revenues from that product reduced by the related estimated future costs. When indications exist of a possible impairment in software, the Company assesses recoverability by reviewing undiscounted estimated cash flows associated with the software product or its related asset group and compares the total to the unamortized balance.
COMPUTER SCIENCES CORPORATION
NOTES TO CONSOLIDATED FINANCIAL STATEMENTS (Continued)
(Dollars in millions except per-share amounts)
Note 1—Summary of Significant Accounting Policies (Continued)
The Company capitalizes costs incurred to develop internal-use computer software. Internal and external costs incurred in connection with development of upgrades or enhancements that result in additional functionality are also capitalized. These capitalized costs are amortized on a straight-line basis over the estimated useful life of the software. Purchased software is capitalized and amortized over the estimated useful life of the software.
Outsourcing Contract Costs
Costs on outsourcing contracts, including costs incurred for bid and proposal activities, are generally expensed as incurred. However, certain costs incurred upon initiation of an outsourcing contract are deferred and expensed over the contract life. These costs represent incremental external costs or certain specific internal costs that are directly related to the contract acquisition or transition activities. Such capitalized costs can be separated into two principal categories: contract acquisition costs and transition/set-up costs. The primary types of costs that may be capitalized include labor and related fringe benefits, subcontractor costs, travel costs, and asset premiums.
The first principal category, contract acquisition costs, consists mainly of due diligence activities after competitive selection as well as premiums paid. Premiums are amounts paid to clients in excess of the fair market value of acquired assets. Fixed assets acquired in connection with outsourcing transactions are capitalized at fair value and depreciated consistent with fixed asset policies described above. Premiums are capitalized as outsourcing contract costs and amortized over the contract life. The amortization of outsourcing contract cost premiums is accounted for as a reduction in revenue. The second principal category of capitalized outsourcing costs is transition/set-up costs. Such costs are primarily associated with installation of systems and processes.
In the event indications exist that an outsourcing contract cost balance related to a particular contract may be impaired, undiscounted estimated cash flows of the contract are projected over its remaining term, and compared to the unamortized outsourcing contract cost balance. If the projected cash flows are not adequate to recover the unamortized cost balance, the balance would be adjusted to equal the contract’s fair value in the period such a determination is made. The primary indicator used to determine when impairment testing should be performed is when a contract is materially underperforming, or is expected to materially underperform in the future, as compared to the original bid model or subsequent annual budgets.
Terminations of outsourcing contracts, including transfers either back to the client or to another I/T provider, prior to the end of their committed contract terms are infrequent due to the complex transition of personnel, assets, methodologies, and processes involved with outsourcing transactions. In the event of an early termination, the Company and the client, pursuant to certain contractual provisions, engage in discussions to determine the recovery of unamortized contract costs, lost profits, transfer of personnel, rights to implemented systems and processes, as well as other matters.
Acquisition Accounting and Goodwill
Under acquisition accounting, the purchase price is allocated to the underlying tangible and intangible assets acquired and liabilities assumed based upon their respective fair market values, with the excess recorded as goodwill. Goodwill is assessed for impairment at least annually for each reporting unit. See Notes 4 and 5 for further discussion.
COMPUTER SCIENCES CORPORATION
NOTES TO CONSOLIDATED FINANCIAL STATEMENTS (Continued)
(Dollars in millions except per-share amounts)
Note 1—Summary of Significant Accounting Policies (Continued)
Marketable Securities
The Company classifies its investments in marketable securities in accordance with SFAS No. 115, “Accounting for Certain Investments in Debt and Equity Securities.” Based on criteria set forth in SFAS No. 115 the Company has determined all of its investment securities are to be classified as available-for-sale. Available-for-sale securities are carried at fair value, with unrealized gains and losses reported as a separate component of shareholders’ equity. During fiscal 2007 the Company recorded $2.3 ($1.7 after taxes) of unrealized gains related to available-for-sale securities as of March 30, 2007. Available-for-sale securities are included in Prepaid expenses and other current assets in the accompanying balance sheets. Realized gains and losses and declines in value judged to be other-than-temporary on available-for-sale securities are included in selling, general and administrative expenses.
During the first quarter of fiscal 2007 the Company redeemed the preferred stock received from the sale of DynCorp International for $168.6, $23.8 representing dividends receivable, resulting in a gain of $11.2 net of taxes of $7.1.
Income Taxes
Accounting for income taxes requires the recognition of deferred tax liabilities and assets for the expected future tax consequences of temporary differences between the financial statement carrying amounts and the tax bases of assets and liabilities. The Company maintains valuation allowances where, based on the weight of available evidence, it is more likely than not all or a portion of a deferred tax asset will not be realized. Changes in valuation allowances from period to period are included in our tax provision in the period of change. In determining whether a valuation allowance is warranted, the Company takes into account such factors as prior earnings history, expected future earnings, carryback and carryforward periods, and tax strategies that could potentially enhance the likelihood of realization of a deferred tax asset. The Company is also subject to examination of its income tax returns by the Internal Revenue Service and other tax authorities. The Company periodically assesses the likelihood of adverse outcomes resulting from these examinations to determine the impact on deferred taxes and income tax liabilities and the adequacy of the provision for income taxes.
Cash Flows
For purposes of reporting cash and cash equivalents, the Company considers all investments in cash equivalents purchased with an original maturity of three months or less to be cash equivalents. The Company’s investments consist of high quality securities issued by a number of institutions having high credit ratings, thereby limiting the Company’s exposure to concentrations of credit risk. With respect to financial instruments, the Company’s carrying amounts of its other current assets and liabilities were deemed to approximate their market values due to their short maturity. At March 30, 2007 and March 31, 2006, the Company had no outstanding material hedge contracts with respect to its foreign exchange or interest rate positions.
Capital expenditures acquired through capital lease obligations were $77.2 for the year ended March 30, 2007 and capital expenditures in accounts payable were $123.3 for the year ended March 30, 2007. Previous year amounts were not material.
Depreciation and amortization reported in the consolidated statements of cash flows includes amortization of outsourcing contract premiums of $88.3, $95.7 and $85.5 for fiscal years 2007, 2006 and 2005, respectively, which is reported as a reduction of revenue in the Consolidated Statements of Income.
Cash payments for interest on indebtedness and cash payments for taxes on income are as follows:
| | | Fiscal Year | |
| | | 2007 | | | 2006 | | | 2005 | |
| Interest | | $ | 144.4 | | | $ | 95.1 | | | $ | 173.7 | |
| Taxes on income, net of refunds | | | 304.8 | | | | 147.9 | | | | 49.3 | |
COMPUTER SCIENCES CORPORATION
NOTES TO CONSOLIDATED FINANCIAL STATEMENTS (Continued)
(Dollars in millions except per-share amounts)
Note 1—Summary of Significant Accounting Policies (Continued)
Valuation of Long-Lived Assets
The Company evaluates the carrying value of long-lived assets to be held and used, other than goodwill and intangible assets with indefinite lives, when events and circumstances indicate a potential impairment. The carrying value of a long-lived asset is considered impaired when the anticipated undiscounted cash flow from such asset is separately identifiable and is less than its carrying value. In that case, a loss is recognized based on the amount by which the carrying value exceeds the fair value of the long-lived asset. Fair value is determined primarily using the expected present value, in which multiple cash flow scenarios that reflect the range of possible outcomes and a risk free rate are used to estimate fair value. Losses on long-lived assets to be disposed of are determined in a similar manner, except that fair values are reduced for the cost of disposal. Changes in estimates of future cash flows could result in a write-down of the asset in a future period.
Foreign Currency
The Company has determined local currencies are the functional currencies of the foreign operations. Accordingly, these foreign entities translate assets and liabilities from their local currencies to U.S. dollars using year-end exchange rates while income and expense accounts are translated at the average rates in effect during the year. The resulting translation adjustment is recorded as part of accumulated other comprehensive income (AOCI). As of March 30, 2007 and March 31, 2006 the balance of currency translation adjustment included in AOCI was a deferred gain of $431.0 and $182.7, respectively.
COMPUTER SCIENCES CORPORATION
NOTES TO CONSOLIDATED FINANCIAL STATEMENTS (Continued)
(Dollars in millions except per-share amounts)
Note 1—Summary of Significant Accounting Policies (Continued)
Earnings per Share
Basic earnings per common share are computed using the weighted average number of common shares outstanding during the period. Diluted earnings per share reflect the incremental shares issuable upon the assumed exercise of stock options.
| | | Fiscal Year | |
| | | 2007 | | | 2006 | | | 2005 | |
| | | | | | As Restated (1) | | | As Restated (1) | |
| Income from continuing operations | | $ | 388.8 | | | $ | 471.1 | | | $ | 444.3 | |
| Income from discontinued operations, net of taxes | | | | | | | | | | | 85.0 | |
| Gain on sale of discontinued operations, net of taxes | | | | | | | 61.3 | | | | 228.8 | |
| Discontinued operations, net of taxes | | | | | | | 61.3 | | | | 313.8 | |
| Cumulative effect of change in accounting principle, net of taxes | | | | | | | (4.3 | ) | | | | |
Net income | | $ | 388.8 | | | $ | 528.1 | | | $ | 758.1 | |
| | | | | | | | | | | | | |
| Common share information (in millions): | | | | | | | | | | | | |
Average common shares outstanding for basic EPS | | | 176.263 | | | | 185.693 | | | | 189.575 | |
Dilutive effect of stock options | | | 3.470 | | | | 2.291 | | | | 2.361 | |
| Shares for diluted EPS | | | 179.733 | | | | 187.984 | | | | 191.936 | |
| | | | | | | | | | | | | |
| Income from continuing operations | | $ | 2.21 | | | $ | 2.54 | | | $ | 2.34 | |
| Income from discontinued operations, net of taxes | | | | | | | | | | | 0.45 | |
| Gain on sale of discontinued operations, net of taxes | | | | | | | 0.33 | | | | 1.21 | |
| Discontinued operations, net of taxes | | | | | | | 0.33 | | | | 1.66 | |
| Cumulative effect of change in accounting principle, net of taxes | | | | | | | (0.02 | ) | | | | |
Basic EPS* | | $ | 2.21 | | | $ | 2.84 | | | $ | 4.00 | |
| | | | | | | | | | | | | |
| Income from continuing operations | | $ | 2.16 | | | $ | 2.51 | | | $ | 2.31 | |
| Income from discontinued operations, net of taxes | | | | | | | | | | | 0.44 | |
| Gain on sale of discontinued operations, net of taxes | | | | | | | 0.33 | | | | 1.19 | |
| Discontinued operations, net of taxes* | | | | | | | 0.33 | | | | 1.64 | |
| Cumulative effect of change in accounting principle, net of taxes | | | | | | | (0.02 | ) | | | | |
Diluted EPS* | | $ | 2.16 | | | $ | 2.81 | | | $ | 3.95 | |
| | | | | | | | | | | | | |
| * Amounts may not add as a result of rounding. | | | | | | | | | | | | |
| (1) | See Note 2, "Restatement of Consolidated Financial Statements |
(See notes to consolidated financial statements)
COMPUTER SCIENCES CORPORATION
NOTES TO CONSOLIDATED FINANCIAL STATEMENTS (Continued)
(Dollars in millions except per-share amounts)
Note 1—Summary of Significant Accounting Policies (Continued)
The computation of diluted EPS did not include stock options which were antidilutive, as their exercise price was greater than the average market price of the Company’s common stock during the year. The number of such options was 5,214,576, 2,865,076 and 3,057,225 for the years ended March 30, 2007, March 31, 2006 and April 1, 2005, respectively.
Recent Accounting Pronouncements
In June 2006, the FASB issued FASB Interpretation No. 48, “Accounting for Uncertainty in Income Taxes – an interpretation of FASB Statement No. 109” (FIN 48). The interpretation clarifies the accounting for uncertainty in income taxes recognized in a company's financial statements in accordance with SFAS No. 109, "Accounting for Income Taxes." Specifically, the pronouncement prescribes a recognition threshold and a measurement attribute for the financial statement recognition and measurement of a tax position taken or expected to be taken in a tax return. The interpretation also provides guidance on the related derecognition, classification, interest and penalties, accounting for interim periods, disclosure and transition of uncertain tax positions. The interpretation is effective for CSC’s fiscal 2008. The Company is assessing FIN 48 and has not determined the impact that the adoption of FIN 48 will have on its consolidated financial statements. The Company does, however, expect to record a cumulative effect adjustment to its fiscal 2008 balance of beginning earnings retained for use in business, and that adjustment may be material.
During September, 2006 the Securities and Exchange Commission released Staff Accounting Bulletin (SAB) No. 108, “Considering the Effects of Prior Year Misstatements when Quantifying Misstatements in Current Year Financial Statements.” SAB No. 108 requires a registrant to quantify all misstatements that could be material to financial statement users under both the “rollover” and “iron curtain” approaches. If either approach results in quantifying a misstatement that is material the registrant must adjust its financial statements. SAB No. 108 is applicable for CSC’s fiscal 2007. The adoption of SAB No. 108 did not have a material impact on the Company’s consolidated financial statements.
In September 2006 the FASB issued SFAS No. 157, “Fair Value Measurements.” The Statement defines fair value, establishes a framework for measuring fair value in accordance with generally accepted accounting principles and expands disclosures about fair value measurements. This Statement applies under other accounting pronouncements that require or permit fair value measurements. The Statement does not require any new fair value measurements. The Statement is effective for CSC’s fiscal 2009. At this time the Company does not believe the adoption of SFAS No. 157 will have a material impact on the Company’s results of operations or financial position.
In February 2007, the FASB issued SFAS No. 159, “The Fair Value Option for Financial Assets and Financial Liabilities – Including an amendment of FASB Statement No. 115.” This Statement permits entities to choose to measure many financial instruments and certain other items at fair value at specified election dates. If the fair value option is elected, a business entity shall report unrealized gains and losses on elected items in earnings at each subsequent reporting date. Upon initial adoption of this Statement an entity is permitted to elect the fair value option for available-for-sale and held-to-maturity securities previously accounted for under Statement 115. The effect of reclassifying those securities into the trading category should be included in a cumulative-effect adjustment of retained earnings and not in current-period earnings and should be separately disclosed. This Statement is effective for CSC’s fiscal 2009. The Company does not believe the adoption of SFAS No. 159 will have a material impact on the Company’s results of operations or financial position.
COMPUTER SCIENCES CORPORATION
NOTES TO CONSOLIDATED FINANCIAL STATEMENTS (Continued)
(Dollars in millions except per-share amounts)
Note 2—Restatement of Consolidated Financial Statements
The Company has restated the accompanying consolidated balance sheet as of March 31, 2006, and the related consolidated statements of income, stockholders’ equity and cash flows for fiscal years ended March 31, 2006 and April 1, 2005. These restatements relate to 1) the completion of the Company’s investigation of its stock option granting practices, 2) the correction of errors relating to the accounting for income taxes, and 3) the recognition of revenue for the sale of licenses for a software product. The effects of the restatement adjustments on the Company’s originally reported results of operations for the years ended March 31, 2006 and April 1, 2005 and on its originally reported earnings retained for use in business at April 2, 2004 are summarized below:
| | | Net Income for the Year Ended March 31, 2006 | | | Net Income for the Year Ended April 1, 2005 | | | Earnings Retained For Use In Business As Of April 3, 2004 | |
| As previously reported | | $ | 634.0 | | | $ | 810.2 | | | $ | 3,597.9 | |
| Adjustments: | | | | | | | | | | | | |
| Revenue from software licensing arrangements, net of related income tax effect | | | 14.1 | | | | 12.9 | | | | (51.1 | ) |
| Stock-based compensation, net of related income tax effect | | | (12.2 | ) | | | (6.2 | ) | | | (24.8 | ) |
| Stock based compensation in lieu of cash bonus, net of related income tax effect | | | (1.0 | ) | | | .5 | | | | (2.6 | ) |
| Reversal of tax benefit associated with exercise of stock options | | | (2.0 | ) | | | (1.6 | ) | | | (10.2 | ) |
| Penalties for income tax errors | | | (4.0 | ) | | | (44.3 | ) | | | (7.4 | ) |
| Interest on income tax items, net of related tax effects | | | (10.1 | ) | | | (1.6 | ) | | | (4.8 | ) |
| Income taxes | | | (90.8 | ) | | | (11.2 | ) | | | (92.9 | ) |
| Other | | | .1 | | | | (.6 | ) | | | 2.5 | |
| Net decrease | | | (105.9 | ) | | | (52.1 | ) | | | (191.3 | ) |
| As restated | | $ | 528.1 | | | $ | 758.1 | | | $ | 3,406.6 | |
COMPUTER SCIENCES CORPORATION
NOTES TO CONSOLIDATED FINANCIAL STATEMENTS (Continued)
(Dollars in millions except per-share amounts)
Note 2—Restatement of Consolidated Financial Statements (Continued)
Revenue Recognition
The Company determined that it did not correctly apply the provisions of Statement of Position 97-2, “Software Revenue Recognition” with respect to the sale of licenses for a software product. As a result, the Company overstated revenue and unbilled receivables and understated deferred revenue related to this product in fiscal years prior to 2005. In fiscal years 2006 and 2005 this error resulted in an understatement of revenue. The Company has restated revenue for fiscal 2006 and 2005 and as a result revenue increased $23.4 and $21.4 for these years, respectively. The Company has also restated receivables, other assets, and deferred revenue at March 31, 2006 resulting in increases (decreases) of $(13.7), $(20.7), and $5.2, respectively. The cumulative effect of this error on earnings retained for use in business was a decrease of $51.1 at April 3, 2004.
Income Taxes
The Company identified errors related to income taxes in prior periods. The most significant of these errors related to income tax accounting for amortization of tax bases of assets contributed to a consolidated affiliate. The impact of the correction of this error was an increase in income tax expense of $53.7 and $11.8 for fiscal 2006 and 2005. The cumulative effect of the correction of this error on earnings retained for use in business was a decrease of $91.4 at April 3, 2004.
In addition, the Company identified errors in the accounting for U.S. income tax liabilities related to foreign operations. The impact of the correction of this error was an increase in income tax expense of $6.6 and $5.4 for fiscal 2006 and 2005. The cumulative effect of this error on earnings retained for use in business was a decrease $15.2 at April 3, 2004.
The Company also identified individually immaterial income tax accounting errors that have been corrected. These errors related principally to state income taxes, provision for a gain, the valuation of state net operating losses and deferred tax liabilities related to state taxes. The combined impact of these errors on income tax expense was an increase of $28.4 and $1.4 for fiscal 2006 and 2005 respectively. The cumulative effect of the correction of these errors on earnings retained for use in business was a decrease of $3.6 at April 3, 2004.
Additionally, the Company identified certain errors in the preparation of U.S. federal tax returns. These included an error which understated the deduction of certain general and administrative costs in its U.S. federal income tax returns for fiscal 2002 through fiscal 2005 and resulted in the overstatement of income tax expense by $7.4 for fiscal 2005 and an understatement of income tax expense by $2.1 for fiscal 2006. The cumulative effect of the correction of these errors on earnings retained for use in business was an increase of $17.3 at April 3, 2004.
As a result of the errors noted above the Company incurred interest and penalties. For fiscal 2006 and 2005 the Company has recorded adjustments related to additional interest expense of $16.7 and $2.6, respectively, for the income tax errors. The cumulative effect on earnings retained for use in business was a decrease of $4.8 at April 3, 2004. The Company also recorded penalties related to the income tax errors of $4.0 and $44.3 for fiscal 2006 and 2005, respectively. The cumulative effect of the penalties for periods prior to fiscal 2005 on earnings retained for use in business was a decrease of $7.4 at April 3, 2004.
COMPUTER SCIENCES CORPORATION
NOTES TO CONSOLIDATED FINANCIAL STATEMENTS (Continued)
(Dollars in millions except per-share amounts)
Note 2—Restatement of Consolidated Financial Statements (Continued)
The total effect of all the income tax adjustments noted above was to increase income tax expense $90.8 ($84.2 net of impact of interest expense) and $11.2 ($10.2 net of the impact of interest expense) for fiscal 2006 and fiscal 2005. As a result of the correction of these errors, other assets, other accrued expenses, and Federal, State and foreign income taxes payable increased by $1.2, $83.0, $154.3, respectively at March 31, 2006. The cumulative effect of these errors on earnings retained for use in business was a decrease of $105.1 at April 3, 2004.
Other
The Company also identified errors in an accrual for payroll taxes and in recording the tax benefit related to the exercise of employee stock options. The correction of these errors increased (decreased) cost of sales by $(0.1) and $1.1 during fiscal 2006 and 2005, respectively, and resulted in a $2.5 cumulative increase to earnings retained for use in business at April 3, 2004.
The Company has reclassified operating cash flow related to deferred taxes from income taxes payable to deferred taxes on the cash flow statement as of March 31, 2006 to conform with current and prior period presentations. As a result the Company’s March 31, 2006 cash flow statement herein includes a $67.4 reclassification of income taxes payable to deferred taxes in addition to the adjustments related to changes in deferred taxes as a result of the restatement for tax accounting errors in the operating section of the Statement of Cash Flows. The Statement of Cash Flows was the only financial statement impacted by this reclassification.
Stock Options
In July 2006 the Company established a special committee, comprised of the two most recently elected independent directors (the Special Committee), to manage and supervise an investigation into the Company’s stock option grant practices between March 1, 1996 and July 31, 2006 (the Relevant Period). Together with its independent counsel and forensic accountants, the Special Committee conducted an extensive review of stock option grants made by the Company during the Relevant Period, which covered 13,564 grants.
Based on the results of the Special Committee’s investigation, the independent directors determined that 9,234 stock option grants should be modified, principally due to delays in authorization and approval and the absence of definitive documentation, including:
· | 540 stock option grants made between May 9, 1996, and June 13, 2002, which should have been accounted for as repricings of prior stock option grants, 527 of which require variable accounting until April 1, 2006, when the Company adopted Statement of Financial Accounting Standards (SFAS) No. 123R, “Share-Based Payment”; |
· | 3,906 other stock option grants made between April 9, 1996, and April 3, 2006, for which the measurement date should be changed to a later date on which the closing stock price was higher, requiring additional compensation expense; and |
· | 4,788 other stock option grants made between April 1, 1996, and July 10, 2006, for which the measurement date should be changed to a later date on which the closing stock price was lower, requiring no additional compensation expense. |
COMPUTER SCIENCES CORPORATION
NOTES TO CONSOLIDATED FINANCIAL STATEMENTS (Continued)
(Dollars in millions except per-share amounts)
Note 2—Restatement of Consolidated Financial Statements (Continued)
The incremental cumulative non-cash compensation expense, before taxes, from March 1, 1996, through March 31, 2006, related to stock options was as follows:
Fiscal Year Ended | | Pre-Tax Expense | |
| | | | |
| March 29, 1996 | | $ | 0.0 | |
| March 28, 1997 | | $ | 0.4 | |
| April 3, 1998 | | $ | 1.8 | |
| April 2, 1999 | | $ | 3.2 | |
| March 31, 2000 | | $ | 8.7 | |
| March 30, 2001 | | $ | 2.8 | |
| March 29, 2002 | | $ | 16.8 | |
| March 28, 2003 | | $ | (6.5 | ) |
| April 2, 2004 | | $ | 14.1 | |
| April 1, 2005 | | $ | 8.5 | |
| March 31, 2006 | | $ | 20.6 | |
The Company also determined that the tax benefits associated with the exercise of certain stock options in foreign jurisdictions had been incorrectly credited against the foreign tax provision, rather than additional paid-in capital. The Company further determined that it had inappropriately applied the effective rate, rather than the U.S. statutory rate, in recognizing the tax benefits associated with the exercise of stock options in the U.S. Correction of these two tax errors resulted in an incremental cumulative tax provision of approximately $14.
Unless otherwise indicated, all references in this Note 2 hereafter to years are to calendar years.
Background
During the Relevant Period, CSC granted stock options to two categories of employees:
| · | the Chief Executive Officer, Chief Operating Officer, each of their respective direct reports and each other employee who is an “officer” for purposes of the Securities Exchange Act of 1934 (collectively, Senior Executives); and |
| · | all other employees (collectively, Other Employees). |
Option grants to Senior Executives were approved by the Compensation Committee or the Board of Directors. Approvals for option grants to Other Employees were delegated to the Chief Executive Officer or, after July 1999, in the case of option grants of 5,000 shares or less, to the Corporate Vice President, Human Resources. The Company did not grant stock options to its independent directors.
Option grants during the Relevant Period can be grouped into three general categories:
| · | “Annual Cycle Options,” which were granted as part of the annual compensation review process each year; |
| · | “Discounted Options,” which, on and prior to May 12, 2004, were granted on the Annual Cycle Option grant date in lieu of a cash bonus, and which typically had an exercise price per share equal to 25% of the closing market price of the Company’s common stock on the grant date; and |
| · | “Other Options,” which primarily include options granted to new hires (including to employees acquired through acquisitions and outsourcings) and for promotions and special recognition. |
COMPUTER SCIENCES CORPORATION
NOTES TO CONSOLIDATED FINANCIAL STATEMENTS (Continued)
(Dollars in millions except per-share amounts)
Note 2—Restatement of Consolidated Financial Statements (Continued)
Of the 13,564 option grants made by the Company during the Relevant Period, (i) 9,134 were for Annual Cycle Options, (ii) 262 were for Discounted Options and (iii) 4,168 were for Other Options. The option grants in each category were reviewed to determine the first date upon which the identity of the optionee, the number of shares subject to the option grant and the option exercise price were determined with finality (the measurement date). The following describes the option grants for which the independent directors determined that the measurement date should be a date other than the grant date.
Annual Cycle Options
Annual Cycle Options Granted to Senior Executives.
The independent directors concluded that there was evidence that the Annual Cycle Options granted to Senior Executives in 1996, 1999 and 2002 may each have had two measurement dates: (i) the first occurring on the date of an initial action to select the optionees, the number of option shares and the grant date closing stock price to be used for the exercise price, and (ii) the second occurring on the date of a subsequent action, within 10 days, to select a later grant date closing stock price to be used for the exercise price. Therefore, the Company determined that the aggregate 54 Annual Cycle Option grants to Senior Executives on May 9, 1996, May 10, 1999 and June 13, 2002, should be accounted for as a repricing of options for which a measurement date had previously been established on May 6, 1996, May 3, 1999, and June 3, 2002, respectively. Generally accepted accounting principles in effect at the time require a change from fixed to variable accounting for the 1999 and 2002 repricings, but not for the 1996 repricing. The incremental cumulative non-cash compensation expense before taxes from March 1, 1996, through March 31, 2006, related to accounting for these Annual Cycle Option grants to Senior Executives as repricings was approximately $10.
Annual Cycle Options Granted to Other Employees.
In each of the years from 1996 through 2005, there were changes, after the grant date, in the list of Annual Cycle Options to be granted to Other Employees. Therefore, the measurement date for all of the 7,562 Annual Cycle Options (excluding the 260 French grants discussed below) granted to Other Employees in those years has been changed to be the first date upon which the list was determined with finality. Of these grants, 3,891 had a lower closing stock price on the new measurement dates than on the related grant dates, which did not result in any additional compensation expense. The remaining 3,671 grants did, however, except as set forth below, result in additional compensation expense amortized over the vesting period.
The new measurement date for the 2001 Annual Cycle Options granted to Other Employees resulted in a repricing requiring variable accounting. On October 29, 2001, the Company commenced an exchange offer (the 2001 Exchange Offer) pursuant to which employees could elect to cancel unexercised options with an exercise price per share of $70 or more in exchange for new options. The 2001 Exchange Offer was specifically designed so that no employee eligible to participate was granted any options during the period beginning six months before the commencement of the 2001 Exchange Offer and ending six months after the option cancellation date. Although the grant date of the Annual Cycle Options granted to Other Employees in 2001 precedes the 2001 Exchange Offer commencement date by more than six months, the new measurement date of these Annual Cycle Options does not. Consequently, certain of these options were treated as a repricing of options held by the same optionee which were cancelled in the 2001 Exchange Offer. The remaining 2001 Annual Cycle Options which were not treated as a repricing also resulted in additional compensation expense, since the new measurement date had a higher closing stock price than the grant date. The restatement adjustment related to the incremental cumulative non-cash compensation expense before taxes through March 31, 2006, related to changing the measurement date of the 2001 Annual Cycle Options granted to Other Employees, and accounting for such options as a repricing was approximately $21, including approximately $19 attributable to variable accounting.
COMPUTER SCIENCES CORPORATION
NOTES TO CONSOLIDATED FINANCIAL STATEMENTS (Continued)
(Dollars in millions except per-share amounts)
Note 2 – Restatement of Consolidated Financial Statements (continued)
The foregoing description excludes all Annual Cycle Options granted to Other Employees subject to French taxes (French Options). The Company has a French sub-plan pursuant to which it grants French Options addressing French tax consequences. One of the requirements for these options is that they not be granted during a “closed period,” as defined under French tax law. Until recently, the Company understood that the closed period included, among other periods, the 10-trading day period before and after the Company made a material announcement. Since the Company did not determine the grant date of French Options until it had confirmed that no material announcement was made during the following 10 trading days, the measurement date for all of the 260 French Option grants made during the Relevant Period has been changed. The Company currently believes that the closed period does not include the 10-day period after a material announcement (other than an earnings release or the filing of a Form 10-K or Form 10-Q).
The restatement adjustment related to the incremental cumulative non-cash compensation expense before taxes from March 1, 1996, through March 31, 2006, related to Annual Cycle Option grants to Other Employees, including the $21 relating to the 2001 Annual Cycle Options discussed above, constitutes approximately $47 of the total $70 incremental cumulative non-cash compensation expense before taxes.
Discounted Options and Restricted Stock
The Company has identified 105 Discounted Options granted between May 3, 2000, and May 12, 2004, in which the identity of the optionee or the number of shares underlying the option was not determined with finality until after the grant date. The restatement adjustment related to the incremental cumulative non-cash compensation expense before taxes from May 3, 2000, through March 31, 2006, related to accounting for the change in measurement dates for these Discounted Options grants was approximately $1.
In 2005 and 2006, the Company granted restricted stock and restricted stock units, respectively, in lieu of a cash bonus. Sixteen of the restricted stock awards in 2005 were not determined with finality until after the grant date, and the Company recorded an incremental cumulative non-cash compensation expense before taxes from March 1, 1996, through June 30, 2006, related to accounting for the change in measurement dates for these restricted stock awards of less than $0.05. This amount has been included in the aggregate incremental compensation expense amounts related to stock options.
The Company has also determined it had incorrectly reversed accruals for certain management bonuses which had been exchanged for discounted options and awards. The aggregate incremental cumulative non-cash compensation expense before taxes from March 1, 1996, through June 30, 2006, related to stock options includes the resulting increase or decrease in compensation expense for each period affected. The cumulative impact of the bonus accrual adjustments through March 31, 2006, was approximately $5.
Other Options
During the Relevant Period, the Company issued 4,168 Other Option grants to new hires and for promotions, special recognition and other reasons. Of these, the Company identified 931 which were granted to new hires who joined the Company through an acquisition or through an outsourcing by their former employer, in which the measurement date should have been a date other than the grant date. Although the acquisition or outsourcing agreement generally set forth the aggregate number of option shares to be granted to the new employees, the specific allocation among employees was often not finalized until after the grant date.
The Company has also identified 320 additional Other Option grants in which the measurement date should have been a date other than the grant date, and two Other Option grants which should have been accounted for as repricings requiring variable accounting. These Other Option grants were primarily made to new hires or for promotions or special recognition.
COMPUTER SCIENCES CORPORATION
NOTES TO CONSOLIDATED FINANCIAL STATEMENTS (Continued)
(Dollars in millions except per-share amounts)
Note 2 – Restatement of Consolidated Financial Statements (continued)
The restatement adjustment related to the incremental cumulative non-cash compensation expense before taxes from March 1, 1996, through March 31, 2006, related to Other Option grants was approximately $8.
Historical stock-based compensation expense and the incremental impact from recognizing stock-based compensation expense resulting from the investigation of past stock option grants is as follows:
| | | | | | Adjustments | | | | |
Fiscal Year | | As Previously Reported, net of taxes (1) | | | Pre-Tax Expense | | | After Tax Expense | | | As Restated, net of taxes | |
| 1997 | | $ | .7 | | | $ | .4 | | | $ | .3 | | | $ | 1.0 | |
| 1998 | | | .8 | | | | 1.8 | | | | 1.4 | | | | 2.2 | |
| 1999 | | | .5 | | | | 3.2 | | | | 1.6 | | | | 2.1 | |
| 2000 | | | .5 | | | | 8.7 | | | | 11.6 | | | | 12.1 | |
| 2001 | | | 1.8 | | | | 2.8 | | | | 6.0 | | | | 7.8 | |
| 2002 | | | 3.8 | | | | 16.8 | | | | 11.8 | | | | 15.6 | |
| 2003 | | | 5.1 | | | | (6.5 | ) | | | (4.0 | ) | | | 1.1 | |
| 2004 | | | 4.9 | | | | 14.1 | | | | 8.9 | | | | 13.8 | |
| Total 1997 – 2004 impact | | $ | 18.1 | | | $ | 41.3 | | | $ | 37.6 | | | $ | 55.7 | |
| 2005 | | | 6.0 | | | | 8.5 | | | | 7.3 | | | | 13.3 | |
| 2006 | | | 8.6 | | | | 20.6 | | | | 15.2 | | | | 23.8 | |
| Total | | $ | 32.7 | | | $ | 70.4 | | | $ | 60.1 | | | $ | 92.8 | |
| (1) | Represents stock-based compensation expense as determined under APB No. 25 and used in disclosures pursuant to SFAS No. 123. |
Additionally, the Company has restated the pro forma expense under SFAS No. 123 in Note 1 of the Notes to Consolidated Financial Statements to reflect the impact of these adjustments.
COMPUTER SCIENCES CORPORATION
NOTES TO CONSOLIDATED FINANCIAL STATEMENTS (Continued)
(Dollars in millions except per-share amounts)
Note 2—Restatement of Consolidated Financial Statements (Continued)
The following table presents the effects of the restatement adjustments on the Company’s previously reported consolidated balance sheet as of March 31, 2006:
ASSETS
| | | March 31, 2006 | |
| | | | | | Adjustment | | | |
| | | As Reported | | | Revenue Recognition | | | Stock Options | | | Income Taxes | | Other | | As Restated | |
| Current assets: | | | | | | | | | | | | | | | | |
| Cash and cash equivalents | | $ | 1,290.7 | | | | | | | | | | | | | $ | 1,290.7 | |
Receivables, net of allowance for doubtful accounts of $68.4 | | | 3,746.3 | | | $ | (13.7 | ) | | | | | | | | | | 3,732.6 | |
| Prepaid expenses and other current assets | | | 1,268.9 | | | | | | | | | | | | | | | 1,268.9 | |
| Total current assets | | | 6,305.9 | | | | (13.7 | ) | | | | | | | | | | 6,292.2 | |
| Investments and other assets: | | | | | | | | | | | | | | | | | | | |
Software, net of accumulated amortization of $732.4 | | | 453.3 | | | | | | | | | | | | | | | 453.3 | |
Outsourcing contract costs, net of accumulated amortization of $1,112.8 | | | 1,175.3 | | | | | | | | | | | | | | | 1,175.3 | |
Goodwill, net of accumulated amortization of $323.0 | | | 2,306.3 | | | | | | | | | | | | | | | 2,306.3 | |
| Other assets | | | 468.7 | | | | (20.7 | ) | | $ | 25.3 | | | $ | 1.2 | | | | | 474.5 | |
| Total investments and other assets | | | 4,403.6 | | | | (20.7 | ) | | | 25.3 | | | | 1.2 | | | | | 4,409.4 | |
| Property and equipment—at cost : | | | | | | | | | | | | | | | | | | | | | |
| Land, buildings and lease hold improvements | | | 913.4 | | | | | | | | | | | | | | | | | 913.4 | |
| Computers and related equipment | | | 4,039.9 | | | | | | | | | | | | | | | | | 4,039.9 | |
| Furniture and other equipment | | | 414.6 | | | | | | | | | | | | | | | | | 414.6 | |
| | | | 5,367.9 | | | | | | | | | | | | | | | | | 5,367.9 | |
| Less accumulated depreciation and amortization | | | 3,047.8 | | | | | | | | | | | | | | | | | 3,047.8 | |
| Property and equipment, net | | | 2,320.1 | | | | | | | | | | | | | | | | | 2,320.1 | |
| | | $ | 13,029.6 | | | $ | (34.4 | ) | | $ | 25.3 | | | $ | 1.2 | | | | $ | 13,021.7 | |
COMPUTER SCIENCES CORPORATION
NOTES TO CONSOLIDATED FINANCIAL STATEMENTS (Continued)
(Dollars in millions except per-share amounts)
Note 2—Restatement of Consolidated Financial Statements (Continued)
LIABILITIES AND STOCKHOLDERS’ EQUITY
| | | March 31, 2006 | |
| | | | | | Adjustments | | | | |
| | | As Reported | | | Revenue Recognition | | | Stock Options | | | Income Taxes | | | Other | | | As Restated | |
| Current liabilities: | | | | | | | | | | | | | | | | | | |
Short-term debt and current maturities of long-term debt | | $ | 85.3 | | | | | | | | | | | | | | | $ | 85.3 | |
| Accounts payable | | | 705.1 | | | | | | | | | | | | | | | | 705.1 | |
| Accrued payroll and related costs | | | 706.5 | | | | | | | | | | | | $ | 1.0 | | | | 707.5 | |
| Other accrued expenses | | | 1,359.7 | | | | | | | | | $ | 83.0 | | | | | | | | 1,442.7 | |
| Deferred revenue | | | 629.1 | | | $ | 5.2 | | | | | | | | | | | | | | | 634.3 | |
| Federal, state and foreign income taxes | | | 655.4 | | | | (15.6 | ) | | | | | | 154.3 | | | | (.4 | ) | | | 793.7 | |
| Total current liabilities | | | 4,141.1 | | | | (10.4 | ) | | | | | | 237.3 | | | | 0.6 | | | | 4,368.6 | |
| Long-term debt, net of current maturities | | | 1,376.8 | | | | | | | | | | | | | | | | | | | 1,376.8 | |
| Other long-term liabilities | | | 739.8 | | | | | | | | | | | 31.1 | | | | | | | | 770.9 | |
| Commitments and contingencies | | | | | | | | | | | | | | | | | | | | | | | |
| Stockholders’ equity: | | | | | | | | | | | | | | | | | | | | | | | |
Preferred stock par value $1 per share; authorized 1,000,000 shares; none issued | | | | | | | | | | | | | | | | | | | | | | | |
Common stock, par value $1 per share; authorized 750,000,000 shares; issued and 194,904,250 | | | 194.9 | | | | | | | | | | | | | | | | | | | 194.9 | |
| Additional paid-in capital | | | 1,799.2 | | | | | | | $ | 85.4 | | | | | | | | (2.6 | ) | | | 1,882.0 | |
| Earnings retained for use in business | | | 5,042.1 | | | | (24.0 | ) | | | (60.1 | ) | | | (267.2 | ) | | | 2.0 | | | | 4,692.8 | |
| Accumulated other comprehensive income | | | 106.8 | | | | | | | | | | | | | | | | | | | | 106.8 | |
| | | | 7,143.0 | | | | (24.0 | ) | | | 25.3 | | | | (267.2 | ) | | | (.6 | ) | | | 6,876.5 | |
Less common stock in treasury, at cost, 7,653,655 shares | | | (347.1 | ) | | | | | | | | | | | | | | | | | | | (347.1 | ) |
| Unearned restricted stock | | | (24.0 | ) | | | | | | | | | | | | | | | | | | | (24.0 | ) |
| Stockholders’ equity, net | | | 6,771.9 | | | | (24.0 | ) | | | 25.3 | | | | (267.2 | ) | | | (.6 | ) | | | 6,505.4 | |
| | | $ | 13,029.6 | | | $ | (34.4 | ) | | $ | 25.3 | | | $ | 1.2 | | | | | | | $ | 13,021.7 | |
COMPUTER SCIENCES CORPORATION
NOTES TO CONSOLIDATED FINANCIAL STATEMENTS (Continued)
(Dollars in millions except per-share amounts)
Note 2—Restatement of Consolidated Financial Statements (Continued)
The following table presents the effects of the restatement adjustments in the Company’s previously reported consolidated statements of income:
| | | Fiscal Year Ended March 31, 2006 | |
| | | | | | Adjustments | | | | |
| | | As Reported | | | Revenue Recognition | | | Stock Options | | | Income Taxes | | | Other | | | As Restated | |
| Revenues | | $ | 14,615.6 | | | $ | 23.4 | | | | | | | | | | | | $ | 14,639.0 | |
Costs of services (excludes depreciation and amortization) | | | 11,719.8 | | | | | | | $ | 4.3 | | | | | | $ | (.1 | ) | | | 11,724.0 | |
| Selling, general and administrative | | | 842.2 | | | | | | | | 16.3 | | | $ | 4.0 | | | | | | | | 862.5 | |
| Depreciation and amortization | | | 1,091.8 | | | | | | | | | | | | | | | | | | | | 1,091.8 | |
| Interest expense | | | 104.2 | | | | | | | | | | | | 16.7 | | | | | | | | 120.9 | |
| Interest income | | | (40.8 | ) | | | | | | | | | | | | | | | | | | | (40.8 | ) |
| Special items | | | 77.3 | | | | | | | | | | | | | | | | | | | | 77.3 | |
| Total costs and expenses | | | 13,794.5 | | | | | | | | 20.6 | | | | 20.7 | | | | (.1 | ) | | | 13,835.7 | |
Income from continuing operations before taxes | | | 821.1 | | | | 23.4 | | | | (20.6 | ) | | | (20.7 | ) | | | .1 | | | | 803.3 | |
| Taxes on income | | | 244.1 | | | | 9.3 | | | | (5.4 | ) | | | 84.2 | | | | | | | | 332.2 | |
| Income from continuing operations | | | 577.0 | | | | 14.1 | | | | (15.2 | ) | | | (104.9 | ) | | | .1 | | | | 471.1 | |
Income from discontinued operations, net of Taxes | | | | | | | | | | | | | | | | | | | | | | | | |
Gain on sale of discontinued operations, net of taxes | | | 61.3 | | | | | | | | | | | | | | | | | | | | 61.3 | |
| Discontinued operations, net of taxes | | | 61.3 | | | | | | | | | | | | | | | | | | | | 61.3 | |
| Cumulative effect of change in accounting principle, net of taxes | | | (4.3 | ) | | | | | | | | | | | | | | | | | | | (4.3 | ) |
| Net income | | $ | 634.0 | | | $ | 14.1 | | | $ | (15.2 | ) | | $ | (104.9 | ) | | $ | .1 | | | $ | 528.1 | |
| Earnings per common share: | | | | | | | | | | | | | | | | | | | | | | | | |
| Continuing operations | | $ | 3.11 | | | $ | 0.08 | | | $ | (0.08 | ) | | $ | (0.56 | ) | | | | | | $ | 2.54 | |
| Discontinued operations | | | 0.33 | | | | | | | | | | | | | | | | | | | | 0.33 | |
Cumulative effect of change in accounting principle | | | (0.02 | ) | | | | | | | | | | | | | | | | | | | (0.02 | ) |
| Basic* | | $ | 3.41 | | | $ | 0.08 | | | $ | (0.08 | ) | | $ | (0.56 | ) | | | | | | $ | 2.84 | |
| Continuing operations | | $ | 3.07 | | | $ | 0.08 | | | $ | (0.08 | ) | | $ | (0.56 | ) | | | | | | $ | 2.51 | |
| Discontinued operations | | | 0.33 | | | | | | | | | | | | | | | | | | | | 0.33 | |
| Cumulative effect of change in accounting principle | | | (0.02 | ) | | | | | | | | | | | | | | | | | | | (0.02 | ) |
| Diluted* | | $ | 3.38 | | | $ | 0.08 | | | $ | (0.09 | ) | | $ | (0.56 | ) | | | | | | $ | 2.81 | |
| | | | | | | | | | | | | | | | | | | | | | | | | |
Amounts may not add as a result of rounding | | | | | | | | | | | | | | | | | | | | | | | | |
COMPUTER SCIENCES CORPORATION
NOTES TO CONSOLIDATED FINANCIAL STATEMENTS (Continued)
(Dollars in millions except per-share amounts)
Note 2—Restatement of Consolidated Financial Statements (Continued)
The following table presents the effects of the restatement adjustments in the Company’s previously reported consolidated statements of income:
| | | Fiscal Year Ended April 1, 2005 | |
| | | | | | Adjustments | | | | |
| | | As Reported | | | Revenue Recognition | | | Stock Options | | | Income Taxes | | | Other | | | As Restated | |
| Revenues | | $ | 14,058.6 | | | $ | 21.4 | | | | | | | | | | | | $ | 14,080.0 | |
Costs of services (excludes depreciation and amortization) | | | 11,315.1 | | | | | | | $ | 3.9 | | | | | | $ | 1.1 | | | | 11,320.1 | |
| Selling, general and administrative | | | 807.8 | | | | | | | | 4.6 | | | $ | 44.3 | | | | | | | | 856.7 | |
| Depreciation and amortization | | | 1,051.0 | | | | | | | | | | | | | | | | | | | | 1,051.0 | |
| Interest expense | | | 156.8 | | | | | | | | | | | | 2.6 | | | | | | | | 159.4 | |
| Interest income | | | (16.1 | ) | | | | | | | | | | | | | | | | | | | (16.1 | ) |
| Special items | | | 28.6 | | | | | | | | | | | | | | | | | | | | 28.6 | |
| Total costs and expenses | | | 13,343.2 | | | | | | | | 8.5 | | | | 46.9 | | | | 1.1 | | | | 13,399.7 | |
Income from continuing operations before taxes | | | 715.4 | | | | 21.4 | | | | (8.5 | ) | | | (46.9 | ) | | | (1.1 | ) | | | 680.3 | |
| Taxes on income | | | 219.0 | | | | 8.5 | | | | (1.2 | ) | | | 10.2 | | | | (.5 | ) | | | 236.0 | |
| Income from continuing operations | | | 496.4 | | | | 12.9 | | | | (7.3 | ) | | | (57.1 | ) | | | (.6 | ) | | | 444.3 | |
Income from discontinued operations, net of Taxes | | | 85.0 | | | | | | | | | | | | | | | | | | | | 85.0 | |
Gain on sale of discontinued operations, net of taxes | | | 228.8 | | | | | | | | | | | | | | | | | | | | 228.8 | |
| Discontinued operations, net of taxes | | | 313.8 | | | | | | | | | | | | | | | | | | | | 313.8 | |
| Cumulative effect of change in accounting principle, net of taxes | | | | | | | | | | | | | | | | | | | | | | | | |
| Net income | | $ | 810.2 | | | $ | 12.9 | | | $ | (7.3 | ) | | $ | (57.1 | ) | | $ | (.6 | ) | | $ | 758.1 | |
| Earnings per common share: | | | | | | | | | | | | | | | | | | | | | | | | |
| Continuing operations | | $ | 2.62 | | | $ | 0.07 | | | $ | (0.04 | ) | | $ | (0.30 | ) | | | | | | $ | 2.34 | |
| Discontinued operations | | | 1.66 | | | | | | | | | | | | | | | | | | | | 1.66 | |
Cumulative effect of change in accounting principle | | | | | | | | | | | | | | | | | | | | | | | | |
| Basic* | | $ | 4.27 | | | $ | 0.07 | | | $ | (0.03 | ) | | $ | (0.30 | ) | | | | | | $ | 4.00 | |
| Continuing operations | | $ | 2.59 | | | $ | 0.07 | | | $ | (0.04 | ) | | $ | (0.30 | ) | | | | | | $ | 2.31 | |
| Discontinued operations | | | 1.64 | | | | | | | | | | | | | | | | | | | | 1.64 | |
| Cumulative effect of change in accounting principle | | | | | | | | | | | | | | | | | | | | | | | | |
| Diluted* | | $ | 4.22 | | | $ | 0.07 | | | $ | (0.04 | ) | | $ | (0.30 | ) | | | | | | $ | 3.95 | |
| | | | | | | | | | | | | | | | | | | | | | | | | |
| * Amounts may not add as a result of rounding | | | | | | | | | | | | | | | | | | | | | | | | |
COMPUTER SCIENCES CORPORATION
NOTES TO CONSOLIDATED FINANCIAL STATEMENTS (Continued)
(Dollars in millions except per-share amounts)
Note 2—Restatement of Consolidated Financial Statements (Continued)
The following tables set forth the effects of the adjustments on certain line items within the Company’s consolidated statement of cash flows for the fiscal years ended March 31, 2006 and April 1, 2005:
| | | Fiscal Year Ended March 31, 2006 | |
| | | As Reported | | | Adjustments | | | As Restated | |
| | | | | | | | | | |
| Cash flows from operating activities: | | | | | | | | | |
Net income | | $ | 634.0 | | | $ | (105.9 | ) | | $ | 528.1 | |
Adjustments to reconcile net income to net cash provided byoperating activities: | | | | | | | | | | | | |
Depreciation and amortization | | | 1,187.5 | | | | | | | | 1,187.5 | |
Stock based compensation | | | 12.3 | | | | 20.6 | | | | 32.9 | |
Cumulative effect of change in accounting principle | | | 4.3 | | | | | | | | 4.3 | |
Deferred taxes | | | 48.7 | | | | 80.7 | | | | 129.4 | |
Restructuring related special items | | | 77.3 | | | | | | | | 77.3 | |
Gain on dispositions, net of tax | | | (60.9 | ) | | | | | | | (60.9 | ) |
Provision for losses on accounts receivable | | | 28.7 | | | | | | | | 28.7 | |
Changes in assets and liabilities, net of effects of acquisitions and dispositions: | | | | | | | | | | | | |
Increase in receivables | | | (240.5 | ) | | | (21.0 | ) | | | (261.5 | ) |
Increase in prepaid expenses and other current assets | | | (193.4 | ) | | | | | | | (193.4 | ) |
Increase (decrease) in accounts payable and accruals | | | (70.5 | ) | | | 20.6 | | | | (49.9 | ) |
Increase in income taxes payable | | | 59.9 | | | | 12.7 | | | | 72.6 | |
Increase in deferred revenue | | | 76.0 | | | | (2.5 | ) | | | 73.5 | |
Other operating activities, net | | | (12.1 | ) | | | (5.2 | ) | | | (17.3 | ) |
Net cash provided by operating activities | | $ | 1,551.3 | | | | | | | $ | 1,551.3 | |
| | | Fiscal Year Ended April 1, 2005 | |
| | | As Reported | | | Adjustment | | | As Restated | |
| | | | | | | | | | |
| Cash flows from operating activities: | | | | | | | | | |
Net income | | $ | 810.2 | | | $ | (52.1 | ) | | $ | 758.1 | |
Adjustments to reconcile net income to net cash provided byoperating activities: | | | | | | | | | | | | |
Depreciation and amortization | | | 1,145.5 | | | | | | | | 1,145.5 | |
Stock based compensation | | | 9.9 | | | | 8.5 | | | | 18.4 | |
Deferred taxes | | | 192.7 | | | | (49.8 | ) | | | 142.9 | |
Special items | | | 28.6 | | | | | | | | 28.6 | |
Gain on dispositions, net of tax | | | (229.7 | ) | | | | | | | (229.7 | ) |
Provision for losses on accounts receivable | | | 10.7 | | | | | | | | 10.7 | |
Changes in assets and liabilities, net of effects of acquisitions and dispositions: | | | | | | | | | | | | |
Increase in receivables | | | (295.7 | ) | | | (19.0 | ) | | | (314.7 | ) |
Increase in prepaid expenses and other current assets | | | (400.2 | ) | | | | | | | (400.2 | ) |
Increase in accounts payable and accruals | | | 445.4 | | | | 48.1 | | | | 493.5 | |
Increase in income taxes payable | | | 29.8 | | | | 69.1 | | | | 98.9 | |
Increase in deferred revenue | | | 225.3 | | | | (2.5 | ) | | | 222.8 | |
Other operating activities, net | | | (31.0 | ) | | | (2.3 | ) | | | (33.3 | ) |
Net cash provided by operating activities | | $ | 1,941.5 | | | | | | | $ | 1,941.5 | |
COMPUTER SCIENCES CORPORATION
NOTES TO CONSOLIDATED FINANCIAL STATEMENTS (Continued)
(Dollars in millions except per-share amounts)
Note 3—Discontinued Operations
The Company exchanged its CSC Health Plan Solutions (HPS) business, which was previously included in the Global Commercial segment, for approximately 7.13 million of CSC common shares held by a subsidiary of DST Systems Inc., which shares were valued at $324.6 and included in treasury stock, on April 29, 2005. The transaction was structured in accordance with Section 355 of the Internal Revenue Code. The Company realized a gain of $22.9 on the transaction. The revenue and expenses of HPS have been classified as discontinued operations in accordance with SFAS No. 144, “Accounting for the Impairment or Disposal of Long-lived Assets.”
The Company sold its equity interest in the international and other select operations of DynCorp for $850 including $75 of 13% preferred stock of DynCorp International (DI) on February 11, 2005. The transaction included the sale of the stock of a wholly owned subsidiary which had a tax basis in excess of its carrying value for financial statement purposes. The tax benefit of this sale reduced the tax associated with the transaction by $151.8. The Company realized an initial after tax gain of approximately $228.8 on the transaction net of taxes of $59.3. The gain was subject to working capital adjustments. During fiscal 2006, the Company finalized the working capital adjustments, payable in preferred stock, for the sale of DI. As a result the Company recorded the receipt of $65.5 of 13% preferred stock, issued as of February 11, 2005 and an additional gain on sale for DI of $38.4 net of taxes of $20.7. Also during fiscal 2006, the Company recognized $20.2 of preferred stock dividend income which is included in interest income in the consolidated statements of income.
The following discloses the results of the discontinued operations:
| | | Fiscal Year | |
| | | 2006 | | | 2005 | |
| Revenue | | $ | 8.0 | | | $ | 1,790.5 | |
| Income before taxes | | | (.1 | ) | | | 138.3 | |
| Income from discontinued operations | | | | | | | 85.0 | |
COMPUTER SCIENCES CORPORATION
NOTES TO CONSOLIDATED FINANCIAL STATEMENTS (Continued)
(Dollars in millions except per-share amounts)
Note 4—Acquisitions
On December 22, 2006 CSC acquired all the outstanding shares of Datatrac Information Services, Inc., a privately held U.S. government services and solutions provider headquartered in Richardson, Texas for an initial purchase price of $123 subject to final purchase accounting adjustments. The acquisition extends CSC's ability to offer comprehensive solutions in identity management and credentialing, a market segment of strategic importance to CSC's North American Public Sector operation. It also expands the company's capabilities in offering customer contact solutions to clients across the broad U.S. federal market and strengthens CSC’s ability to compete for work within the U.S. Department of Homeland Security and other government agencies.
Datatrac’s results of operations have been included with the Company’s from the date of acquisition, December 22, 2006, to the end of the period. The purchase price of the acquisition was allocated to the net assets acquired based on estimates of the fair values at the date of the acquisition. CSC allocated fair values of $18.0 for certain intangible assets using an independent appraisal. The $18.0 of intangible assets includes $16.9 for customer contracts and related customer relationships with a weighted-average useful life of approximately 16 years and to be amortized based on the estimated timing of related cash flows, and the remainder is software licenses. The goodwill recognized of $92.2 was assigned to the North American Public Sector, and is expected to be deductible for tax purposes. In addition, the stock purchase agreement contains an earn-out provision with additional consideration based on the Company’s success in winning the recompete for its Service Center Operation Team (SCOT) contract with the U.S Federal Government. The additional consideration may be up to $20 based on the terms of the contract.
A summary of the assets acquired and liabilities assumed in the Datatrac acquisition and the net cash paid are as follows:
| | | Estimated Fair Values | |
| Accounts receivable | | $ | 25.3 | |
| Prepaids and other current assets | | | 1.7 | |
| Other assets, net | | | 0.5 | |
| Net property, plant and equipment | | | 15.3 | |
| Accounts payable and accrued expenses | | | (29.1 | ) |
| Long-term debt | | | (.1 | ) |
| Goodwill | | | 92.2 | |
| Intangible Asset | | | 18.0 | |
| Net assets acquired and goodwill | | $ | 123.8 | |
| | | | | |
| Purchase price | | $ | 126.0 | |
| Less cash acquired | | | (2.2 | ) |
| Purchase price net of cash acquired | | $ | 123.8 | |
The pro forma impact on net income and earnings per share have not been disclosed for the current or comparable prior periods, as the amounts were immaterial to the financial statements as a whole.
COMPUTER SCIENCES CORPORATION
NOTES TO CONSOLIDATED FINANCIAL STATEMENTS (Continued)
(Dollars in millions except per-share amounts)
Note 4—Acquisitions (Continued)
As a result of the Datatrac acquisition on December 22, 2006, the Company incurred costs to consolidate facilities and other costs to integrate Datatrac into the Company. The facility consolidations related to the abandonment and sublease of Datatrac facilities. The components of the final acquisition integration liabilities included in the purchase price allocation for Datatrac are presented in the following table.
| | | Acquisition Integration Liabilities | | | Paid as of March 30, 2007 | | | Balance Remaining at March 30, 2007 | |
| Facility consolidations | | $ | 6.5 | | | $ | .1 | | | $ | 6.4 | |
| Other | | | .1 | | | | | | | | .1 | |
| Total | | $ | 6.6 | | | $ | .1 | | | $ | 6.5 | |
During September 2006 Danske Regioner exercised its option to put its minority interest in CSC Scandihealth A/S (Scandihealth) to CSC. As a result, CSC acquired the remaining 40% share of Scandihealth it did not own for a purchase price of approximately $20.8. The purchase price was allocated to the related minority interest liability of $4 and the remainder to goodwill. The goodwill recognized was included in the Global Commercial segment, none of which is expected to be deductible for tax purposes. Prior to the exercise of the option Scandihealth was a consolidated subsidiary of CSC and, as such, its assets and liabilities were reflected in CSC’s consolidated balance sheet. The proforma impact on net income and earnings per share have not been disclosed for the current or comparable prior periods, as the amounts were immaterial to the financial statements as a whole.
As a result of the DynCorp acquisition on March 7, 2003, the Company incurred costs to exit and consolidate activities, involuntarily terminate employees, and other costs to integrate DynCorp into the Company. The facility consolidations related to the abandonment and sublease of DynCorp facilities. The components of the final acquisition integration liabilities included in the purchase price allocation for DynCorp are presented in the following table.
| | | Acquisition Integration Liabilities | | | Paid as of March 30, 2007 | | | Balance Remaining at March 30, 2007 | |
| Severance payments | | $ | 7.1 | | | $ | 7.1 | | | | |
| Facility consolidations | | | 66.7 | | | | 53.0 | | | $ | 13.7 | |
| Other | | | 6.1 | | | | 3.4 | | | | 2.7 | |
| Total | | $ | 79.9 | | | $ | 63.5 | | | $ | 16.4 | |
During fiscal 2006, the Company finalized a scheme of arrangement to acquire the 26.9% of CSA Holdings Ltd (CSAH) now owned by the Company’s wholly owned subsidiary, CSC Computer Sciences International Inc. (CSCI). The arrangement allows for better integration of similar businesses between CSAH and CSC’s other operations. The purchase price of the remaining interest was 75.5 million Singapore dollars (approximately $44). 100% of CSAH’s results of operations have been included with the Company’s from the date of acquisition, October 17, 2005. Revenue from the acquired interest has been reflected in the consolidated statements of income given the Company’s previous majority ownership. The pro forma impact on net income and earnings per share have not been disclosed for the current or comparable prior periods, as the amounts were immaterial to the financial statements as a whole.
COMPUTER SCIENCES CORPORATION
NOTES TO CONSOLIDATED FINANCIAL STATEMENTS (Continued)
(Dollars in millions except per-share amounts)
Note 5—Goodwill
During the second quarter ended September 29, 2006, the Company completed its annual goodwill impairment test. Based on the results of these tests, no impairment losses were identified and performance of step two was not required.
The following table summarizes the changes in the carrying amount of goodwill by segment for the years ended March 30, 2007 and March 31, 2006:
| | | Global Commercial Segment | | | North American Public Sector Segment | | | Total | |
| Balance as of April 1, 2005 | | $ | 1,793.5 | | | $ | 549.9 | | | $ | 2,343.4 | |
| Additions | | | 17.2 | | | | 3.7 | | | | 20.9 | |
| Dispositions | | | | | | | | | | | | |
| Foreign currency translation | | | (58.0 | ) | | | | | | | (58.0 | ) |
| Balance as of March 31, 2006 | | | 1,752.7 | | | | 553.6 | | | | 2,306.3 | |
| | | | | | | | | | | | | |
| Additions | | | 16.3 | | | | | | | | 16.3 | |
| Acquisitions | | | | | | | 92.2 | | | | 92.2 | |
| Dispositions | | | (.2 | ) | | | | | | | (.2 | ) |
| Foreign currency translation | | | 90.6 | | | | | | | | 90.6 | |
| Balance as of March 30, 2007 | | $ | 1,859.4 | | | $ | 645.8 | | | $ | 2,505.2 | |
The Global Commercial additions to goodwill during fiscal 2007 relates to the acquisition of the remaining interest of a majority owned joint venture. The North American Public Sector additions to goodwill during fiscal 2007 relates to the Datatrac Information Services acquisition on December 22, 2006. See Note 4 for further details. The Global Commercial disposals relates to the divestment of Insurer (I/90) Software Product Business in South Africa. The foreign currency translation amounts relates to the impact of foreign currency adjustments in accordance with SFAS No. 52, “Foreign Currency Translation.”
The Global Commercial additions to goodwill during fiscal 2006 relate to the acquisition of 26.9% of CSA Holdings Ltd. This addition to goodwill is not deductible for tax purposes. See Note 4 for further details. The North American Public Sector additions to goodwill during fiscal 2006 relate to a purchase adjustment for the acquisition of the minority share in a joint venture.
The foreign currency translation amounts related to the impact of foreign currency adjustments in accordance with SFAS No. 52, “Foreign Currency Translation.”
COMPUTER SCIENCES CORPORATION
NOTES TO CONSOLIDATED FINANCIAL STATEMENTS (Continued)
(Dollars in millions except per-share amounts)
Note 6—Other Intangible Assets
A summary of amortizable intangible assets as of March 30, 2007 and March 31, 2006 is as follows:
| | | March 30, 2007 | |
| | | Gross Carrying Value | | | Accumulated Amortization | | | Net | |
| Software | | $ | 1,343.6 | | | $ | 830.3 | | | $ | 513.3 | |
| Outsourcing contract costs | | | 2,197.4 | | | | 1,167.9 | | | | 1,029.5 | |
| Customer and other intangible assets | | | 189.1 | | | | 108.0 | | | | 81.1 | |
Total intangible assets | | $ | 3,730.1 | | | $ | 2,106.2 | | | $ | 1,623.9 | |
| | | March 31, 2006 | |
| | | Gross Carrying Value | | | Accumulated Amortization | | | Net | |
| Software | | $ | 1,185.7 | | | $ | 732.4 | | | $ | 453.3 | |
| Outsourcing contract costs | | | 2,288.1 | | | | 1,112.8 | | | | 1,175.3 | |
| Customer and other intangible assets | | | 172.2 | | | | 95.6 | | | | 76.6 | |
Total intangible assets | | $ | 3,646.0 | | | $ | 1,940.8 | | | $ | 1,705.2 | |
Amortization (including reduction of revenues as described in Note 1) related to intangible assets was $430.8, $435.6 and $403.2 for the years ended March 30, 2007, March 31, 2006 and April 1, 2005, respectively. Estimated amortization related to intangible assets at March 30, 2007 for each of the subsequent five years, fiscal 2008 through fiscal 2012, is as follows: $436, $414, $312, $229 and $90, respectively.
Capitalized and purchased software, net of accumulated amortization, consisted of the following:
| | | March 30, 2007 | | | March 31, 2006 | |
| Commercial software products | | $ | 188.2 | | | $ | 192.9 | |
| Internal-use software | | | 26.0 | | | | 26.8 | |
| Purchased software | | | 299.1 | | | | 233.6 | |
Total | | $ | 513.3 | | | $ | 453.3 | |
Amortization of capitalized software development costs and purchased software included in depreciation and amortization of $1,073.6, $1,091.8 and $1,051.0 for fiscal 2007, fiscal 2006 and fiscal 2005, respectively, consisted of the following:
| | | Fiscal Year Ended | |
| | | March 30, 2007 | | | March 31, 2006 | | | April 1, 2005 | |
| Commercial software products | | $ | 50.3 | | | $ | 53.4 | | | $ | 54.8 | |
| Internal-use software | | | 12.6 | | | | 15.9 | | | | 26.2 | |
| Purchased software | | | 87.2 | | | | 77.5 | | | | 61.7 | |
Total | | $ | 150.1 | | | $ | 146.8 | | | $ | 142.7 | |
COMPUTER SCIENCES CORPORATION
NOTES TO CONSOLIDATED FINANCIAL STATEMENTS (Continued)
(Dollars in millions except per-share amounts)
Note 7—Special Items
Special items totaling $316.1 were recorded during the year ended March 30, 2007. and consisted of: (1) a $333.4 restructuring charge (see discussion below), (2) a $1.0 true-up of an estimate related to the fiscal 2006 Nortel impairment charge and (3) an $18.3 gain from the redemption of DynCorp International preferred stock.
Restructuring
In April 2006, the Company announced a restructuring plan to be carried out during fiscal 2007 and 2008. The objectives of the plan are to 1) streamline CSC’s worldwide operations and 2) leverage the increased use of lower cost global resources. Restructuring charges consist predominantly of severance and related employee payments resulting from terminations. During the third quarter of fiscal 2007 the Company evaluated facility consolidation opportunities and other areas where operations can be streamlined and costs reduced consistent with the plan objectives, resulting in additional lease termination, asset impairment and other charges.
Workforce reductions of approximately 4,400 employees occurred in fiscal 2007, and an additional 1,100 reductions are planned for fiscal 2008. Termination-related charges of $294.3 were recorded in fiscal 2007. Other, primarily vacant space-related costs, of $39.1 were also recorded during the year, net of an $11.6 gain on the sale of a data center facility. All but approximately $.1 million of the restructuring charge was incurred in the Global Commercial reporting segment. Additional restructuring charges of not more than $110 are expected to be incurred in fiscal 2008.
A majority of the planned headcount reductions (3,000 in fiscal 2007 and 500 in 2008) were scheduled to take place in Europe. Approximately 1,100 and 500 positions were to be reduced in North America in fiscal 2007 and 2008, respectively, with the balance in Australia and Asia. Partially offsetting the reductions were planned headcount increases in certain lower cost regions of approximately 1,400 and 700 employees in fiscal 2007 and 2008, respectively. As of March 30, 2007, approximately 4,400 separations have been completed (approximately one-sixth due to attrition), with 3,000 in Europe, 1,100 in North America and the remainder in Australia and Asia. Approximately 2,100 new hires occurred in lower cost regions during the year ended March 30, 2007, including replacements of some of the 4,400 reductions as well as for previously-planned and on-going business activities.
The Company’s strategy in Europe has been to obtain negotiated, voluntary terminations to the extent possible, but involuntary terminations were also necessary in certain countries to attain targeted reductions. Outside of Europe, terminations have been predominantly involuntary. Involuntary termination benefits are determined in accordance with existing company policies and local legal requirements. In some countries, local regulations require the Company to consult with employee representatives such as works councils or unions in the determination of job categories and number of employees to be terminated, as well as the resulting termination benefit amounts.
The amounts of termination benefits are typically attributable to employees’ services already rendered and increase as length of service increases. The Company records charges for negotiated, voluntary terminations at the time an employee accepts the Company’s offer. Involuntary termination benefits are accrued at the time such obligations are considered probable and reasonably estimable. Such a calculation is based on estimates of benefit payouts as well as number and type of staff to be terminated. In cases where a plan calls for first attempting to garner voluntary terminations and then moves to involuntary terminations if targeted reductions are not achieved, a charge is accrued based on estimated involuntary benefits for all remaining reductions.
Accruals for future termination benefits are based on a number of assumptions and estimates. Such accruals may differ from actual results for a variety of reasons, including: different benefit amounts or mix of employees as a result of completed employee representative consultations; additional voluntary terminations in lieu of accrued involuntary terminations; changes in mix of actual terminated employees by age, years of service, or job class.
COMPUTER SCIENCES CORPORATION
NOTES TO CONSOLIDATED FINANCIAL STATEMENTS (Continued)
(Dollars in millions except per-share amounts)
Note 7—Special Items (Continued)
Restructuring-related pre-tax cash payments of approximately $207.2 were made in fiscal 2007 (excluding $25.8 cash proceeds received from sale of a data center) and are estimated to be approximately $195 in fiscal 2008. Included in the restructuring charge are pension benefit augmentations that are due to certain employees in accordance with legal or contractual obligations, which will be paid out over several years as part of normal pension distributions. Such liabilities are included in the consolidated pension liability account.
See the following table for a summary of fiscal 2007 activity:
| | | Total pre-tax charges recorded year-to-date fiscal 2007 | | | Less charges not affecting restructuring liability (1) | | | Less Payments (2) | | | Other (3) | | | Restructuring liability as of March 30, 2007 | |
| Workforce reductions | | $ | 294.3 | | | $ | (6.8 | ) | | $ | (201.7 | ) | | $ | 7.7 | | | $ | 93.5 | |
| Other | | | 39.1 | | | | 6.3 | | | | (5.5 | ) | | | 1.0 | | | | 40.9 | |
| Total | | $ | 333.4 | | | $ | (0.5 | ) | | $ | (207.2 | ) | | $ | 8.7 | | | $ | 134.4 | |
(1) | Charges primarily consist of pension benefit augmentations offset by gains on sale of restructured assets. |
(2) | Excludes $25.8 cash proceeds received from sale of a data center facility. |
(3) | Foreign currency translation adjustments. |
Effective February 28, 2006, Nortel Networks (Nortel) terminated the Company’s services for certain information technology outsourcing activities covered by the agreement between Nortel and the Company. As a result the Company recorded a non-cash special item charge of $77.3 ($48.3 after tax) or 26 cents per share. The charge relates to the write down of outsourcing contract costs and certain equipment associated with the Nortel contract to estimated fair value, the loss on sale of equipment to Nortel, severance costs and costs associated with terminating the contract. The Nortel contract is included in the Global Commercial reporting segment.
During fiscal 2005, the Company recorded special items of $28.6 ($18.4 after tax) or 10 cents per share. Special items included $27.8 of early redemption premiums and the write off of $1.7 of deferred debt issuance costs and unamortized discount as described in Note 10. Special items also included a $.9 reversal of special items recorded in fiscal 2001 in connection with the consolidation of facilities.
287.9(475.4)Note 8—Income Taxes
Total income tax expense was allocated as follows:
| | | Fiscal Year | |
| | | 2007 | | | 2006 | | | 2005 | |
| | | | | | As Restated (1) | | | As Restated (1) | |
| Income from continuing operations | | $ | 218.2 | | | $ | 332.2 | | | $ | 236.0 | |
| Income from discontinued operations | | | - | | | | 22.3 | | | | 53.3 | |
| Cumulative effect on prior years of changes in accounting principles | | | - | | | | (1.3 | ) | | | - | |
| | | $ | 218.2 | | | $ | 353.2 | | | $ | 289.3 | |
| (1) | See Note 2, "Restatement of Consolidated Financial Statements.” |
COMPUTER SCIENCES CORPORATION
NOTES TO CONSOLIDATED FINANCIAL STATEMENTS (Continued)
(Dollars in millions except per-share amounts)
Note 8—Income Taxes (Continued)
The sources of income before taxes from continuing operations, classified between domestic entities and those entities domiciled outside of the United States are as follows:
| | | Fiscal Year | |
| | | 2007 | | | 2006 | | | 2005 | |
| | | | | | As Restated (1) | | | As Restated (1) | |
| Domestic entities | | $ | 637.7 | | | $ | 570.3 | | | $ | 435.3 | |
| Entities outside the United States | | | (30.7 | ) | | | 233.0 | | | | 245.0 | |
| Total | | $ | 607.0 | | | $ | 803.3 | | | $ | 680.3 | |
| (1) | See Note 2, "Restatement of Consolidated Financial Statements.” |
The provision for income tax expense on income from continuing operations is classified between current and deferred and by taxing jurisdiction in the following manner:
| | | Fiscal Year | |
| | | 2007 | | | 2006 | | | 2005 | |
| | | | | | As Restated (1) | | | As Restated (1) | |
| Current | | | | | | | | | |
Federal | | $ | 246.2 | | | $ | 149.6 | | | $ | (6.8 | ) |
State | | | 22.2 | | | | 1.1 | | | | 13.1 | |
Foreign | | | 1.7 | | | | 52.1 | | | | 86.8 | |
| | | | 270.1 | | | | 202.8 | | | | 93.1 | |
| | | | | | | | | | | | | |
| Deferred | | | | | | | | | | | | |
Federal | | | (64.5 | ) | | | 67.0 | | | | 108.1 | |
State | | | (13.4 | ) | | | 25.0 | | | | 12.7 | |
Foreign | | | 26.0 | | | | 37.4 | | | | 22.1 | |
| | | | (51.9 | ) | | | 129.4 | | | | 142.9 | |
Total provision for taxes | | $ | 218.2 | | | $ | 332.2 | | | $ | 236.0 | |
| (1) | See Note 2, "Restatement of Consolidated Financial Statements.” |
The major elements contributing to the difference between the U.S. federal statutory tax rate of 35.0% and the effective tax rate are as follows:
| | | Fiscal Year | |
| | | 2007 | | | 2006 | | | 2005 | |
| | | | | | As Restated (1) | | | As Restated (1) | |
| Statutory rate | | | 35.0 | % | | | 35.0 | % | | | 35.0 | % |
| State income tax, net of federal tax | | | .7 | | | | 3.8 | | | | .7 | |
| Change in tax contingency | | | | | | | | | | | (5.5 | ) |
| Foreign rate differential | | | 8.2 | | | | 4.0 | | | | 3.0 | |
| Income tax credits | | | (7.7 | ) | | | (2.2 | ) | | | (.2 | ) |
| Penalties | | | .2 | | | | .2 | | | | 2.0 | |
| Other | | | (.5 | ) | | | .6 | | | | (.3 | ) |
| Effective tax rate | | | 35.9 | % | | | 41.4 | % | | | 34.7 | % |
| (1) | See Note 2, "Restatement of Consolidated Financial Statements.” |
COMPUTER SCIENCES CORPORATION
NOTES TO CONSOLIDATED FINANCIAL STATEMENTS (Continued)
(Dollars in millions except per-share amounts)
Note 8—Income Taxes (Continued)
The tax effects of significant temporary differences that comprise deferred tax balances are as follows:
| | | March 30, 2007 | | | March 31, 2006 | |
| | | | | | As Restated (1) | |
| Deferred tax assets (liabilities) | | | | | | |
Other accrued liabilities | | $ | 26.9 | | | | |
Currency exchange | | | 46.6 | | | $ | 11.8 | |
Other assets | | | 115.1 | | | | 65.9 | |
Employee benefits | | | 384.1 | | | | 196.0 | |
Tax loss/credit carryforwards | | | 392.0 | | | | 238.9 | |
Depreciation and amortization | | | (314.2 | ) | | | (357.1 | ) |
Contract accounting | | | (447.4 | ) | | | (443.2 | ) |
Investment basis differences | | | (14.6 | ) | | | 42.1 | |
Deferred revenue | | | (21.4 | ) | | | (55.3 | ) |
Prepayments | | | (46.2 | ) | | | (33.0 | ) |
Other liabilities | | | (67.2 | ) | | | 21.0 | |
| Subtotal | | | 53.7 | | | | (312.9 | ) |
Valuation allowance | | | (335.8 | ) | | | (189.1 | ) |
| Total deferred tax liabilities | | $ | (282.1 | ) | | $ | (502.0 | ) |
| (1) | See Note 2, "Restatement of Consolidated Financial Statements.” |
Of the deferred tax amounts above, $390.0, and $398.5 are included in the current income tax liability accounts at March 30, 2007 and March 31, 2006, respectively. All long-term deferred tax assets are included in other assets and all long-term deferred tax liabilities are included in other long-term liabilities in the accompanying consolidated balance sheets.
During fiscal 2001 the Company made a net investment in an unconsolidated limited partnership. The difference between the investment’s book and tax basis generated a deferred tax asset in the amount of $151.0. The remaining deferred tax asset at March 31, 2007 of $50.6 represents the expected reduction of the Company’s foreign income taxes payable or increases to loss carryforwards over the next two years.
The increase to the valuation allowance for the fiscal year ended March 30, 2007 of $146.7 relates primarily to deferred tax assets for net operating losses in certain foreign and state tax jurisdictions. In assessing the realizability of deferred tax assets, the Company considers whether it is more likely than not that some portion or all of the deferred tax assets will not be realized and adjusts the valuation allowance accordingly. In determining whether the deferred taxes are realizable the Company considers the period of expiration of the tax asset, and historical and projected taxable income as well as tax liabilities for the tax jurisdiction in which the tax asset is located. Valuation allowances are evaluated periodically and will be subject to change in each future reporting period as a result of changes in one or more of these factors.
In the opinion of management the Company has adequately provided for income tax issues not yet resolved with federal, state and foreign tax authorities. At March 30, 2007 and March 31, 2006, the Company has accrued $469.3 and $446.6, respectively, for these matters. The Company records contingent tax liabilities when it is probable that a liability has been incurred and the amount can be reasonably estimated at the date of the financial statements related to positions taken that could be challenged by taxing authorities under examination. These potential exposures result from differing interpretations or applications of tax laws and regulations, and from certain transactions, deductions or credits claimed on returns as filed. Timing of the resolution of these matters is highly uncertain. Although not probable, the most adverse resolution of these issues could result in additional charges to earnings in future periods. Based upon consideration of all relevant facts and circumstances, it is the opinion of the Company’s management the resolution of these matters will not have a material adverse impact on the Company’s consolidated financial position or results of operation.
COMPUTER SCIENCES CORPORATION
NOTES TO CONSOLIDATED FINANCIAL STATEMENTS (Continued)
(Dollars in millions except per-share amounts)
Note 8—Income Taxes (Continued)
At March 30, 2007 and March 31, 2006, the Company has available unused foreign net operating loss (NOL) carryforwards of approximately $1,349.9 and $736.6 and state NOL carryforwards of approximately $794.9 and $1,302.1. As of March 31, 2007, the foreign NOL carryforwards can be carried over indefinitely, except for $279.2 which expire at various dates through 2014. As of March 31, 2007, the state NOL carryforwards expire at various dates through 2027.
The Company is currently the beneficiary of tax holiday incentives in India which expire in fiscal years 2007 and 2009. As a result of the tax holiday incentives, the Company’s tax expense was reduced by approximately $7.2, $5.3 and $3.0 during fiscal years 2007, 2006 and 2005, respectively.
The cumulative undistributed earnings of the Company’s foreign subsidiaries were approximately $958.8 as of March 30, 2007. As the Company intends to permanently reinvest all such earnings, no provision has been made for income taxes that may become payable upon the distribution of such earnings, and it is not practicable to determine the amount of the related unrecognized deferred income tax liability.
During fiscal 2007, the Internal Revenue Service (IRS) commenced an examination of the Company’s federal income tax returns for fiscal years 2000 through 2004. In addition, the Company filed a protest with respect to the results of the IRS examination of fiscal years 1995 through 1999 with the Office of Appeals. Although the outcome of tax audits is always uncertain, in the opinion of management, the resolution of this audit is not expected to have a material effect on the Company’s consolidated financial position or results of operations.
Note 9—Receivables
Receivables consist of the following:
| | | March 30, 2007 | | | March 31, 2006 | |
| | | | | | As Restated (1) | |
| Billed trade accounts | | $ | 2,330.0 | | | $ | 2,107.4 | |
| Unbilled recoverable amounts under contracts in progress | | | 1,716.0 | | | | 1,487.3 | |
| Other receivables | | | 138.3 | | | | 137.9 | |
Total | | $ | 4,184.3 | | | $ | 3,732.6 | |
| (1) | See Note 2, "Restatement of Consolidated Financial Statements.” |
As of March 30, 2007, there were no billed trade accounts receivable for long-term contracts that are unpaid by customers under retainage provisions.
Unbilled recoverable amounts under contracts in progress generally become billable upon completion of a specified contract, negotiation of contract modifications, completion of government audit activities, achievement of project milestones or upon acceptance by the customer. Unbilled recoverable amounts under contracts in progress include amounts for long-term contracts of $955.4, including $427.6 which is expected to be collected during fiscal 2008 and $527.7 which is expected to be collected within fiscal 2009 and thereafter.
COMPUTER SCIENCES CORPORATION
NOTES TO CONSOLIDATED FINANCIAL STATEMENTS (Continued)
(Dollars in millions except per-share amounts)
Note 10—Debt
Short-term
The Company has a commercial paper program. The program is backed by a multi-year facility which expires on August 23, 2011. The Company’s outstanding commercial paper is classified as short term obligations. At March 30, 2007 and March 31, 2006, the Company had no commercial paper outstanding. The weighted average interest rate on the Company’s commercial paper borrowings was 5.4% and 3.2% for the years ended March 30, 2007 and March 31, 2006, respectively.
The Company had $51.9 and $56.6 of borrowings outstanding under its uncommitted lines of credit with certain foreign banks, as of March 30, 2007 and March 31, 2006, respectively. CSC has provided parent guarantees for these short-term lines of credit which carry no commitment fees or significant covenants. The weighted average interest rate on borrowings under these short-term lines of credit was 3.7% at March 30, 2007 and 3.8% at March 31, 2006.
On March 11, 2005, the Company redeemed all of its outstanding 7.50% term notes due August 2005 and all of its outstanding 6.75% term notes due June 2006. As the result of these redemptions, the Company recorded a $29.5 pre-tax charge during fiscal 2005 consisting of $27.8 of early redemption premiums and the write off of $1.7 of deferred issuance costs and unamortized discount. The debt redemption charge is included in special items in the Consolidated Statements of Income.
Long-term
The following is a summary of long-term debt:
| | | March 30, 2007 | | | March 31, 2006 | |
| 6.25% term notes, due March 2009 | | $ | 200.0 | | | $ | 200.0 | |
| 7.375% term notes, due June 2011 | | | 498.5 | | | | 498.1 | |
| 5.00% term notes, due February 2013 | | | 297.8 | | | | 297.4 | |
| 3.50% term notes, due April 2008 | | | 299.4 | | | | 298.7 | |
| Capitalized lease liabilities | | | 151.8 | | | | 106.9 | |
| Notes payable | | | 6.5 | | | | 4.4 | |
| Total long-term debt | | | 1,454.0 | | | | 1,405.5 | |
| Less current maturities | | | 41.8 | | | | 28.7 | |
Total | | $ | 1,412.2 | | | $ | 1,376.8 | |
Capitalized lease liabilities shown above represent amounts due under leases for the use of computers and other equipment. Included in property and equipment are related assets of $325.8 (2007) and $381.7 (2006), less accumulated amortization of $88.2 and $102.7, respectively.
Certain of the Company’s borrowing arrangements contain covenants that require the Company to maintain certain financial ratios and limit the amount of dividend payments. Under the most restrictive requirement, $4,250.6 of retained earnings was available for cash dividends at March 30, 2007. The Company was in compliance with all covenants at March 30, 2007.
The carrying value of the Company’s long-term debt was $1,454.0 and $1,405.5 at March 30, 2007 and March 31, 2006, as shown above. The corresponding fair value was approximately $1,474.5 and $1,409.3 using the interest rates available to the Company for debt of the same remaining maturities.
Maturities of long-term debt, capital lease payments, and other long-term obligations by fiscal year are $41.8 (2008), $527.6 (2009), $11.7 (2010), $12.3 (2011), $505.6 (2012), and $355.0 thereafter.
COMPUTER SCIENCES CORPORATION
NOTES TO CONSOLIDATED FINANCIAL STATEMENTS (Continued)
(Dollars in millions except per-share amounts)
Note 10—Debt (Continued)
In the normal course of business, the Company may provide certain customers and potential customers with financial performance guarantees, which are generally backed by standby letters of credit or surety bonds. In general, the Company would only be liable for the amount of these guarantees in the event of default in the performance of our obligations, the probability of which is remote in management’s opinion. The Company is in compliance with the performance obligations under all service contracts for which there is a performance guarantee, and any liability incurred in connection with these guarantees would not have a material adverse effect on the Company’s consolidated results of operations or financial position. In addition, the Company has other guarantees that represent parent guarantees in support of working capital credit lines established with local financial institutions for its foreign business units.
The following table summarizes the expiration of the Company’s financial guarantees outstanding as of March 30, 2007.
| | | Fiscal 2008 | | | Fiscal 2009 | | | Fiscal 2010 and thereafter | | | Total | |
| Performance guarantees: | | | | | | | | | | | | |
Surety bonds | | $ | 22.4 | | | $ | 2.4 | | | | | | $ | 24.8 | |
Letters of credit | | | 366.1 | | | | 186.2 | | | $ | 10.1 | | | | 562.4 | |
| Standby letters of credit | | | 72.0 | | | | 1.0 | | | | | | | | 73.0 | |
| Foreign subsidiary debt guarantees | | | 543.9 | | | | | | | | 23.2 | | | | 567.1 | |
Total | | $ | 1,004.4 | | | $ | 189.6 | | | $ | 33.3 | | | $ | 1,227.3 | |
Note 11 – Share Repurchase Program
On June 29, 2006 the Company’s Board of Directors authorized a share repurchase program of up to $2,000. In connection with the share repurchase program the Company entered into an accelerated share repurchase agreement and a collared accelerated share repurchase agreement with Goldman, Sachs & Co on June 29, 2006. Under the accelerated share repurchase agreement, which was effective as of June 29, 2006, the Company acquired 9.3 million shares of common stock on June 29, 2006 from Goldman, Sachs & Co for $500. Under the collared accelerated share repurchase transaction, which was effective July 5, 2006, the Company received an initial minimum delivery of common stock outstanding of 7.1 million shares for a payment of $500. The transactions were accounted for as a share retirement with common stock, paid-in capital and retained earnings reduced by $16.4, $152.6 and $831.0, respectively. The Company will receive additional shares pursuant to this agreement depending on movements in the market price of the Company’s common stock over the life of the agreement. The agreement has a term of six to twelve months after completion of the period establishing the hedge price, which was completed on July 28, 2006.
Under both the accelerated share repurchase and the collared accelerated share repurchase agreements, Goldman, Sachs & Co may repurchase an equivalent number of shares in the open market over the terms of the respective agreements. The accelerated share repurchase agreement may be completed at any time between January 29, 2007 and June 29, 2007. At the completion of the agreement, CSC’s initial price under the accelerated share repurchase agreement will be adjusted up or down based on the volume-weighted average price (VWAP) of the stock during this period. Such adjustment may be settled in cash or stock at the Company’s discretion. The collared accelerated share repurchase agreement may be completed at anytime between January 29, 2007 and July 30, 2007. The Company financed the accelerated share repurchase transactions initially with cash on hand and the issuance of approximately $600 of commercial paper.
COMPUTER SCIENCES CORPORATION
NOTES TO CONSOLIDATED FINANCIAL STATEMENTS (Continued)
(Dollars in millions except per-share amounts)
Note 11 – Share Repurchase Program (Continued)
The Company also entered into a purchase agreement with Goldman, Sachs & Co to acquire up to an additional $1,000 in market value of outstanding common stock through open market repurchase transactions under a Rule 10b5-1 plan. The share repurchase program will begin after completion of the accelerated share repurchase and the collared share repurchase agreement and is expected to be completed over a twelve month period.
Note 12—Pension and Other Benefit Plans
The Company and its subsidiaries offer a number of pension and postretirement benefit, life insurance benefit, deferred compensation, and other plans, as described below.
A contributory, defined benefit pension plan is generally available to U.S. employees. Certain non-U.S. employees are enrolled in defined benefit pension plans in the country of domicile. In addition, the Company has two supplemental executive retirement plans (SERP), which are nonqualified, noncontributory pension plans. The Company provides subsidized healthcare and life insurance retirement benefits for certain U.S. employees, generally for those employed prior to August 1992, as well as dental and prescription drug benefits for certain Canadian employees. Most employees outside the U.S. are covered by government sponsored programs at no direct cost to the Company other than related payroll taxes.
CSC utilizes actuarial methods required by SFAS No. 87, “Employers’ Accounting for Pensions,” and SFAS No. 106, “Employers’ Accounting for Postretirement Benefits Other Than Pensions,” to recognize the expense for pension and other postretirement benefit plans, respectively. CSC has implemented SFAS No. 132(R) (as modified by SFAS No. 158), “Employer’s Accounting for Defined Benefit Pension and Other Postretirement Plans,” for financial statement disclosures. Inherent in the application of these actuarial methods are key assumptions, including, but not limited to, discount rates and expected long-term rates of return on plan assets. Changes in the related pension and other postretirement benefit costs may occur in the future due to changes in the underlying assumptions, changes in the number and composition of plan participants and changes in the level of benefits provided.
CSC currently uses a measurement date of December 31 for the majority of its pension and other postretirement benefit plans.
COMPUTER SCIENCES CORPORATION
NOTES TO CONSOLIDATED FINANCIAL STATEMENTS (Continued)
(Dollars in millions except per-share amounts)
Note 12—Pension and Other Benefit Plans (Continued)
Pension Plans
The following tables provide reconciliations of the changes in the plans’ projected benefit obligations and assets, and a statement of their funded status:
| | | U.S. Plans | | | Non-U.S. Plans | |
| | | 2007 | | | 2006 | | | 2007 | | | 2006 | |
Reconciliation of Benefit Obligation | | | | | | | | | | | | |
| Projected benefit obligation at beginning of year | | $ | 1,961.6 | | | $ | 1,749.7 | | | $ | 2,087.8 | | | $ | 1,895.9 | |
| Service cost | | | 128.2 | | | | 118.3 | | | | 81.2 | | | | 81.4 | |
| Interest cost | | | 115.4 | | | | 101.6 | | | | 102.2 | | | | 87.7 | |
| Plan participants' contributions | | | 44.7 | | | | 43.6 | | | | 35.7 | | | | 30.2 | |
| Amendments | | | (20.3 | ) | | | | | | | (1.0 | ) | | | .4 | |
| Business combinations | | | | | | | 2.6 | | | | 1.4 | | | | 8.0 | |
| Settlement/curtailment | | | (.5 | ) | | | | | | | (11.4 | ) | | | | |
| Actuarial loss | | | 46.2 | | | | 7.4 | | | | 63.8 | | | | 248.7 | |
| Benefits paid | | | (72.4 | ) | | | (61.6 | ) | | | (95.2 | ) | | | (70.8 | ) |
| Other expenses | | | | | | | | | | | 1.7 | | | | | |
| Foreign currency exchange rate changes | | | | | | | | | | | 245.9 | | | | (193.7 | ) |
| Projected benefit obligation at end of year | | $ | 2,202.9 | | | $ | 1,961.6 | | | $ | 2,512.1 | | | $ | 2,087.8 | |
| | | U.S. Plans | | | Non-U.S. Plans | |
| | | 2007 | | | 2006 | | | 2007 | | | 2006 | |
Reconciliation of Fair Value of Plan Assets | | | | | | | | | | | | |
| Fair value of plan assets at beginning of year | | $ | 1,594.1 | | | $ | 1,393.9 | | | $ | 1,634.9 | | | $ | 1,421.6 | |
| Actual return on plan assets | | | 213.1 | | | | 90.0 | | | | 188.5 | | | | 240.7 | |
| Employer contribution | | | 113.4 | | | | 125.6 | | | | 118.5 | | | | 159.6 | |
| Plan participants' contributions | | | 44.7 | | | | 43.6 | | | | 35.7 | | | | 30.2 | |
| Benefits paid | | | (72.4 | ) | | | (61.6 | ) | | | (95.2 | ) | | | (70.8 | ) |
| Business/contract acquisitions (disposition) | | | (.3 | ) | | | 2.6 | | | | (3.1 | ) | | | .1 | |
| Other expenses | | | | | | | | | | | (9.1 | ) | | | | |
| Foreign currency exchange rate changes | | | | | | | | | | | 197.8 | | | | (146.5 | ) |
| Fair value of plan assets at end of year | | $ | 1,892.6 | | | $ | 1,594.1 | | | $ | 2,068.0 | | | $ | 1,634.9 | |
| | | | | | | | | | | | | | | | | |
Funded status | | $ | (310.3 | ) | | $ | (367.5 | ) | | $ | (444.1 | ) | | $ | (452.9 | ) |
| Unrecognized actuarial loss | | | | | | | 266.3 | | | | | | | | 427.0 | |
| Unrecognized transition obligation | | | | | | | | | | | | | | | 10.5 | |
| Unrecognized prior service cost | | | | | | | 9.3 | | | | | | | | 2.8 | |
| Contribution adjustment | | | 29.0 | | | | 20.2 | | | | 22.5 | | | | 22.0 | |
| Funded status at End of Year | | $ | (281.3 | ) | | $ | (71.7 | ) | | $ | (421.6 | ) | | $ | 9.4 | |
COMPUTER SCIENCES CORPORATION
NOTES TO CONSOLIDATED FINANCIAL STATEMENTS (Continued)
(Dollars in millions except per-share amounts)
Note 12—Pension and Other Benefit Plans (Continued)
The following table provides the amounts recorded in the Company’s consolidated balance sheet:
| | | U.S. Plans | | | Non-U.S. Plans | |
| | | 2007 | | | 2006 | | | 2007 | | | 2006 | |
| Non-current assets | | $ | .2 | | | | | | $ | 8.4 | | | $ | 96.2 | |
| Intangible asset | | | | | | $ | 13.6 | | | | | | | | 2.4 | |
| Current liabilities | | | (5.0 | ) | | | | | | | (6.5 | ) | | | | |
| Non-current liabilities | | | (276.5 | ) | | | (196.4 | ) | | | (423.5 | ) | | | (111.6 | ) |
| Accumulated other comprehensive loss | | | 201.9 | | | | 111.1 | | | | 471.3 | | | | 22.4 | |
| Net amount recorded | | $ | (79.4 | ) | | $ | (71.7 | ) | | $ | 49.7 | | | $ | 9.4 | |
The accumulated benefit obligation at the end of 2007 and 2006 was $4,093.9 and $3,474.2, respectively.
The following is a summary of amounts in accumulated other comprehensive loss as of March 30, 2007 and March 31, 2006 that have not been recognized in the consolidated statements of operations as components of net periodic pension cost:
| | | U.S. Plans | | | Non-U.S. Plans | |
| | | 2007 | | | 2006 | | | 2007 | | | 2006 | |
| Net transition obligation | | | | | | | | $ | (10.0 | ) | | | |
| Prior service credit (cost) | | $ | 14.3 | | | | | | | (2.9 | ) | | | |
| Net actuarial loss | | | (216.2 | ) | | | | | | (458.4 | ) | | | |
| Minimum pension liability | | | | | | $ | (111.1 | ) | | | | | | $ | (22.4 | ) |
| Accumulated other comprehensive loss | | $ | (201.9 | ) | | $ | (111.1 | ) | | $ | (471.3 | ) | | $ | (22.4 | ) |
As of March 30, 2007 and March 31, 2006, the balance of minimum liability adjustments included in accumulated other comprehensive loss was $457.4 (net of related taxes of $213.0) and $81.4 (net of related taxes of $52.0).
The following table summarizes the weighted average assumptions used in the determination of the Company’s pension plans’ benefit obligations for the years ended March 30, 2007 and March 31, 2006:
| | | U.S. Plans | | | Non-U.S. Plans | |
| | | 2007 | | | 2006 | | | 2007 | | | 2006 | |
| Discount rate | | | 6.0 | % | | | 5.9 | % | | | 5.1 | % | | | 4.9 | % |
| Rates of increase in compensation levels | | | 4.2 | % | | | 4.6 | % | | | 3.7 | % | | | 3.5 | % |
The following table lists selected information for the pension plans as of March 30, 2007 and March 31, 2006:
| | | U.S. Plans | | | Non-U.S. Plans | |
End of Year | | 2007 | | | 2006 | | | 2007 | | | 2006 | |
| Projected benefit obligation | | $ | 2,202.9 | | | $ | 1,961.6 | | | $ | 2,512.1 | | | $ | 2,087.8 | |
| Accumulated benefit obligation | | | 2,037.1 | | | | 1,806.6 | | | | 2,056.8 | | | | 1,667.6 | |
| Fair value of plan assets | | | 1,892.6 | | | | 1,594.1 | | | | 2,068.0 | | | | 1,634.9 | |
COMPUTER SCIENCES CORPORATION
NOTES TO CONSOLIDATED FINANCIAL STATEMENTS (Continued)
(Dollars in millions except per-share amounts)
Note 12—Pension and Other Benefit Plans (Continued)
| | | Plans with Projected | | | Plans with Accumulated | |
| | | Benefit Obligation in | | | Benefit Obligation in | |
| | | Excess of Plan Assets | | | Excess of Plan Assets | |
| | | (U.S. and Non-U.S.) | | | (U.S. and Non-U.S.) | |
End of Year | | 2007 | | | 2006 | | | 2007 | | | 2006 | |
| Projected benefit obligation | | $ | 4,496.9 | | | $ | 3,817.1 | | | $ | 2,286.1 | | | $ | 2,212.6 | |
| Accumulated benefit obligation | | | 3,876.8 | | | | 3,262.1 | | | | 2,104.6 | | | | 2,012.2 | |
| Fair value of plan assets | | | 3,734.6 | | | | 2,990.6 | | | | 1,855.6 | | | | 1,694.1 | |
The net periodic pension cost for U.S. and non-U.S. pension plans included the following components:
| | | U.S. Plans | | | Non-U.S. Plans | |
| | | 2007 | | | 2006 | | | 2005 | | | 2007 | | | 2006 | | | 2005 | |
| Service cost | | $ | 128.2 | | | $ | 118.3 | | | $ | 101.1 | | | $ | 81.2 | | | $ | 81.4 | | | $ | 69.5 | |
| Interest cost | | | 115.4 | | | | 101.6 | | | | 94.3 | | | | 102.2 | | | | 87.7 | | | | 75.9 | |
| Expected return on assets | | | (132.6 | ) | | | (111.8 | ) | | | (100.4 | ) | | | (121.4 | ) | | | (93.0 | ) | | | (76.3 | ) |
| Amortization of transition obligation | | | | | | | | | | | (.8 | ) | | | 1.2 | | | | 1.1 | | | | .9 | |
| Amortization of prior service costs | | | 3.4 | | | | 3.4 | | | | 3.2 | | | | (1.1 | ) | | | 1.0 | | | | 1.0 | |
| Amortization of unrecognized net loss | | | 16.0 | | | | 23.5 | | | | 14.7 | | | | 15.4 | | | | 16.2 | | | | 10.9 | |
| Settlement/curtailment | | | (.5 | ) | | | | | | | | | | | .7 | | | | | | | | | |
| Special termination benefits | | | | | | | | | | | | | | | 5.7 | | | | | | | | | |
| Net periodic pension cost | | $ | 129.9 | | | $ | 135.0 | | | $ | 112.1 | | | $ | 83.9 | | | $ | 94.4 | | | $ | 81.9 | |
The estimated net transitional obligation, prior service cost and actuarial loss for defined benefit plans that will be amortized from accumulated other comprehensive income into net periodic pension cost over the next fiscal year are $1.2, $1.5 and $34.7, respectively.
The weighted-averages of the assumptions used to determine net periodic pension cost were:
| | | U.S. Plans | | | Non-U.S. Plans | |
| | | 2007 | | | 2006 | | | 2005 | | | 2007 | | | 2006 | | | 2005 | |
| Discount or settlement rates | | | 5.9 | % | | | 5.9 | % | | | 6.3 | % | | | 4.9 | % | | | 5.3 | % | | | 5.4 | % |
| Expected long-term rates of return on assets | | | 8.5 | % | | | 8.5 | % | | | 8.5 | % | | | 7.0 | % | | | 7.1 | % | | | 6.9 | % |
| Rates of increase in compensation levels | | | 4.4 | % | | | 4.6 | % | | | 4.6 | % | | | 3.5 | % | | | 3.7 | % | | | 3.5 | % |
The discount rate assumption reflects the market rate for high-quality, fixed income debt instruments as of our annual measurement date and is therefore subject to change each year. The required use of an expected long-term rate of return on plan assets may result in recognized plan income that differs from the actual return on those plan assets in any given year. Over time, the actual long-term rate of return on plan assets is expected to approximate the return assumption utilized. Differences between expected and actual returns are recognized in the calculation of net periodic pension cost. Rate of increase in compensation levels and other assumptions, such as turnover and life expectancy, also impact pension calculations.
The expected long-term rate of return on plan assets assumption is selected by first identifying the expected range of long-term rates of return for each major asset class. Expected long-term rates of return are developed based on long-term historical averages as well as current expectations of future returns. Consideration is given to the extent active management is employed in each class. A single expected long-term rate of return on plan assets is then calculated by weighing each class.
COMPUTER SCIENCES CORPORATION
NOTES TO CONSOLIDATED FINANCIAL STATEMENTS (Continued)
(Dollars in millions except per-share amounts)
Note 12—Pension and Other Benefit Plans (Continued)
The asset allocation of pension plans at December 31, 2006 and 2005 is as follows:
| | | U.S. Plans | | | Non-U.S. Plans | |
Asset Category | | 2006 | | | 2005 | | | 2006 | | | 2005 | |
| Equity securities | | | 70 | % | | | 70 | % | | | 64 | % | | | 63 | % |
| Debt securities | | | 27 | % | | | 29 | % | | | 19 | % | | | 23 | % |
| Participant directed | | | | | | | | | | | 8 | % | | | 8 | % |
| Other | | | 3 | % | | | 1 | % | | | 9 | % | | | 6 | % |
| Total | | | 100 | % | | | 100 | % | | | 100 | % | | | 100 | % |
The Company’s investment strategy for plan assets takes into account a number of factors, including the time horizon of the pension plans’ obligations. For each of the largest plans, an allocation range by asset class is developed. The allocation has a significant weighting for equity investments in part due to the relatively long duration of the plans’ obligations. Third party investment managers are employed to invest assets in both passively-indexed and actively-managed strategies. The Company’s allocation range for its largest plan is 60-76% equities, 23-31% debt securities and 0-10% cash and other investments. The Company has typically used cash flow from employer and employee contributions to keep allocations within the range. The Company also has investments in insurance contracts to pay plan benefits in certain countries. The allocation above does not include certain amounts that are included in the fair value of assets such as cash awaiting investment or asset transfer receivable amounts from other plans.
Information about the expected cash flows for pension plans follows:
| | | Pension Plans | |
| | | U.S. | | | Non-U.S. | |
| | | Plans | | | Plans | |
| Employer contributions | | | | | | |
| 2008 (expected) | | $ | 125 | | | $ | 105 | |
| Expected Benefit Payments | | | | | | | | |
| 2008 | | $ | 90 | | | $ | 90 | |
| 2009 | | | 85 | | | | 80 | |
| 2010 | | | 90 | | | | 85 | |
| 2011 | | | 100 | | | | 90 | |
| 2012 | | | 110 | | | | 95 | |
| 2013-2017 | | | 730 | | | | 540 | |
No plan assets are expected to be returned to the Company in the next fiscal year.
COMPUTER SCIENCES CORPORATION
NOTES TO CONSOLIDATED FINANCIAL STATEMENTS (Continued)
(Dollars in millions except per-share amounts)
Note 12—Pension and Other Benefit Plans (Continued)
Other Postretirement Benefit Plans
The following tables provide reconciliations of the changes in postretirement plans’ benefit obligations and assets, and a statement of their funded status:
| | | U.S. Plans | | | Non-U.S. Plans | |
| | | 2007 | | | 2006 | | | 2007 | | | 2006 | |
Reconciliation of Benefit Obligation | | | | | | | | | | | | |
| Benefit obligation at beginning of year | | $ | 149.5 | | | $ | 121.4 | | | $ | 10.8 | | | $ | 7.0 | |
| Service cost | | | 2.2 | | | | 1.4 | | | | .3 | | | | .3 | |
| Interest cost | | | 8.8 | | | | 6.8 | | | | .5 | | | | .4 | |
| Plan participants' contributions | | | 1.7 | | | | 1.6 | | | | | | | | | |
| Amendments | | | (.5 | ) | | | | | | | | | | | .8 | |
| Business combination | | | | | | | .4 | | | | | | | | .1 | |
| Curtailment | | | (.5 | ) | | | (1.7 | ) | | | (2.1 | ) | | | | |
| Actuarial loss (gain) | | | 21.8 | | | | 27.5 | | | | | | | | 2.0 | |
| Benefits paid | | | (10.0 | ) | | | (7.9 | ) | | | (.1 | ) | | | (.1 | ) |
| Foreign currency exchange rate changes | | | | | | | | | | | .2 | | | | .3 | |
| Benefit obligation at end of year | | $ | 173.0 | | | $ | 149.5 | | | $ | 9.6 | | | $ | 10.8 | |
| | | | | | | | | | | | | | | | | |
Reconciliation of Fair Value of Plan Assets | | | | | | | | | | | | | | | | |
| Fair value of plan assets at beginning of year | | $ | 76.6 | | | $ | 74.0 | | | | | | | | | |
| Actual return on plan assets | | | 7.4 | | | | 3.5 | | | | | | | | | |
| Employer contribution | | | 7.5 | | | | 5.4 | | | $ | .1 | | | | | |
| Plan participants' contributions | | | 1.7 | | | | 1.6 | | | | | | | | | |
| Benefits paid | | | (10.0 | ) | | | (7.9 | ) | | | (.1 | ) | | | | |
| Fair value of plan assets at end of year | | $ | 83.2 | | | $ | 76.6 | | | | | | | | | |
| | | | | | | | | | | | | | | | | |
| | | U.S. Plans | | | Non-U.S. Plans | |
| | | 2007 | | | 2006 | | | 2007 | | | 2006 | |
Funded status | | $ | (89.8 | ) | | $ | (72.9 | ) | | $ | (9.6 | ) | | $ | (10.8 | ) |
| Unrecognized actuarial loss | | | | | | | 42.2 | | | | | | | | 3.5 | |
| Unrecognized transition obligation | | | | | | | 10.7 | | | | | | | | | |
| Unrecognized prior service cost | | | | | | | 3.3 | | | | | | | | .4 | |
| Contribution adjustment | | | .6 | | | | 1.4 | | | | | | | | | |
| Funded status at end of year | | $ | (89.2 | ) | | $ | (15.3 | ) | | $ | (9.6 | ) | | $ | (6.9 | ) |
COMPUTER SCIENCES CORPORATION
NOTES TO CONSOLIDATED FINANCIAL STATEMENTS (Continued)
(Dollars in millions except per-share amounts)
Note 12—Pension and Other Benefit Plans (Continued)
The following table provides the amounts recorded in the Company’s consolidated balance sheets:
| | | U.S. Plans | | | Non-U.S. Plans | |
| | | 2007 | | | 2006 | | | 2007 | | | 2006 | |
| Non-current assets | | | | | $ | 33.5 | | | | | | | |
| Current liabilities | | $ | (4.4 | ) | | | | | | $ | (.1 | ) | | | |
| Non-current liabilities | | | (84.8 | ) | | | (48.8 | ) | | | (9.5 | ) | | $ | (6.9 | ) |
| Accumulated other comprehensive loss | | | 70.3 | | | | | | | | 1.8 | | | | | |
| Net amount recorded | | $ | (18.9 | ) | | $ | (15.3 | ) | | $ | (7.8 | ) | | $ | (6.9 | ) |
The following is a summary of amounts in accumulated other comprehensive loss as of March 30, 2007 and March 31, 2006 that have not been recognized in the consolidated statements of operations as components of net periodic benefit cost:
| | | U.S. Plans | | | Non U.S. Plans | |
| | | 2007 | | | 2007 | |
| Net transition obligation | | $ | (9.0 | ) | | $ | (0.3 | ) |
| Prior service credit (cost) | | | (1.8 | ) | | | | |
| Net actuarial loss | | | (59.5 | ) | | | (1.5 | ) |
| Accumulated other comprehensive loss | | $ | (70.3 | ) | | $ | (1.8 | ) |
As of March 30, 2007, the balance of minimum liability adjustments included in accumulated other comprehensive loss was $43.8 (net of related taxes of $28.3).
The following table lists selected information for other postretirement benefit plans of March 30, 2007 and March 31, 2006:
| | | | | | | | | | | | | | | Plans with Accumulated | |
| | | | | | | | | | | | | | | Postretirement Benefit | |
| | | | | | | | | | | | | | | Obligation in Excess | |
| | | | | | | | | | | | | | | of the Fair Value of | |
| | | | | | | | | | | | | | | Plan Assets | |
| | | U.S. Plans | | | Non-U.S. Plans | | | (U.S. and Non-U.S.) | |
End of Year | | 2007 | | | 2006 | | | 2007 | | | 2006 | | | 2007 | | | 2006 | |
| Projected benefit obligation | | $ | 173.0 | | | $ | 149.5 | | | $ | 9.6 | | | $ | 10.8 | | | $ | 182.6 | | | | 160.3 | |
| Fair value of plan assets | | | 83.2 | | | | 76.6 | | | | | | | | | | | | 83.2 | | | | 76.6 | |
At March 30, 2007 and March 31, 2006, the Company had no postretirement healthcare plan assets outside the U.S. Benefits paid include amounts paid directly from plan assets and amounts paid by the Company.
For U.S. plans, a weighted-average discount rate of 5.8% and 5.9% was used in the determination of the Company’s postretirement benefit obligation for the years ended March 30, 2007 and March 31, 2006, respectively. For non-U.S. plans, a weighted-average discount rate of 5.5% and 5.2% was used in the determination of the Company’s postretirement healthcare obligation for the years ended March 30, 2007 and March 31, 2006, respectively.
The assumed healthcare cost trend rate used in measuring the expected benefit obligation for U.S. postretirement benefit plans was 9.0% for fiscal 2007, declining to 5.0% for 2013 and subsequent years. For the non-U.S. postretirement benefit plans, it was 9.0% for fiscal 2007, declining to 5.0% for 2017 and subsequent years.
COMPUTER SCIENCES CORPORATION
NOTES TO CONSOLIDATED FINANCIAL STATEMENTS (Continued)
(Dollars in millions except per-share amounts)
Note 12—Pension and Other Benefit Plans (Continued)
Assumed healthcare cost trend rates have a significant effect on the amounts reported for the healthcare plans. A one-percentage change in the assumed healthcare cost trend rates would have had the following effect:
| | | One Percentage Point | |
| | | Increase | | | Decrease | |
| Effect on accumulated postretirement healthcare obligation as of March 30, 2007 | | $ | 14.0 | | | $ | (13.7 | ) |
| Effect on net periodic postretirement healthcare cost for fiscal 2007 | | | 1.2 | | | | (1.2 | ) |
The net periodic benefit cost for U.S. and non-U.S. other postretirement benefit plans included the following components:
| | | U.S. Plans | | | Non-U.S. Plans | |
| | | 2007 | | | 2006 | | | 2005 | | | 2007 | | | 2006 | | | 2005 | |
| Service cost | | $ | 2.2 | | | $ | 1.4 | | | $ | 1.4 | | | $ | .3 | | | $ | .3 | | | $ | .2 | |
| Interest cost | | | 8.8 | | | | 6.8 | | | | 7.2 | | | | .5 | | | | .4 | | | | .3 | |
| Expected return on assets | | | (6.4 | ) | | | (6.2 | ) | | | (5.1 | ) | | | | | | | | | | | | |
| Amortization of transition obligation | | | 1.6 | | | | 1.6 | | | | 1.6 | | | | .1 | | | | .1 | | | | | |
| Amortization of prior service costs | | | .7 | | | | .7 | | | | .6 | | | | | | | | .7 | | | | .1 | |
| Recognized actuarial loss (gain) | | | 3.6 | | | | .1 | | | | .6 | | | | .1 | | | | .1 | | | | | |
| Settlement/curtailment | | | (.2 | ) | | | | | | | | | | | | | | | | | | | | |
| Net provision for postretirement benefits | | $ | 10.3 | | | $ | 4.4 | | | $ | 6.3 | | | $ | 1.0 | | | $ | 1.6 | | | $ | 0.6 | |
The estimated net transitional obligation, prior service cost and actuarial loss for other postretirement benefit plans that will be amortized from accumulated other comprehensive income into net periodic benefit cost over the next fiscal year are $1.7, $.6 and $4.2, respectively.
The weighted-averages of the assumptions used to determine net periodic benefit cost were as follows. See the above discussion of Pension Plans for how the assumptions are developed.
| | | U.S. Plans | | | Non-U.S. Plans | |
| | | 2007 | | | 2006 | | | 2005 | | | 2007 | | | 2006 | | | 2005 | |
| Discount or settlement rates | | | 5.9 | % | | | 5.9 | % | | | 6.3 | % | | | 5.2 | % | | | 5.5 | % | | | 6.4 | % |
Expected long-term rates of return on assets [1] | | | 8.5 | % | | | 8.5 | % | | | 8.5 | % | | | | | | | | | | | | |
[1] The Company had no other postretirement benefit plan assets outside the U.S.
The asset allocation for U.S. other postretirement benefit plans at December 31, 2006 and 2005 is as follows:
| | | Percentage of Plan Assets at Year End | |
Asset Category | | 2006 | | | 2005 | |
| Equity securities | | | 59 | % | | | 63 | % |
| Debt securities | | | 33 | % | | | 33 | % |
| Cash | | | 8 | % | | | 4 | % |
| Total | | | 100 | % | | | 100 | % |
COMPUTER SCIENCES CORPORATION
NOTES TO CONSOLIDATED FINANCIAL STATEMENTS (Continued)
(Dollars in millions except per-share amounts)
Note 12—Pension and Other Benefit Plans (Continued)
The Company’s investment strategy for its funded post retirement benefits is similar to the strategy for its pension assets. The Company’s target allocation for these assets is in the range of 50-70% equities, 30-50% debt securities and 0-10% cash and other investments.
Information about the expected cash flows for other postretirement benefit plans follows. No significant cash flow is expected for other postretirement benefit plans outside the U.S.
| Employer contributions | | | | |
| 2008 (expected) | | | $ | 10 | |
| Expected Benefit Payments | | | | | |
| 2008 | | | $ | 10 | |
| 2009 | | | | 10 | |
| 2010 | | | | 10 | |
| 2011 | | | | 10 | |
| 2012 | | | | 15 | |
| 2013-2017 | | | | | 60 | |
No plans are expected to be returned to the Company in the next fiscal year.
Other Benefit Plans
The Company sponsors several defined contribution plans for substantially all U.S. employees and certain foreign employees. The plans allow employees to contribute a portion of their earnings in accordance with specified guidelines. At March 30, 2007, plan assets included 9,251,407 shares of the Company’s common stock. During fiscal 2007, fiscal 2006 and fiscal 2005, the Company contributed $123.0, $123.6, and $108.1, respectively.
Effective August 14, 1995, the Company adopted the Computer Sciences Corporation Deferred Compensation Plan (the Plan). The Plan consists of two separate plans, one for the benefit of key executives and one for the benefit of non-employee directors. Pursuant to the Plan, certain management and highly compensated employees are eligible to defer all or a portion of their regular salary that exceeds the limitation set forth in Internal Revenue Section 401(a)(17) and all or a portion of their incentive compensation, and nonemployee directors are eligible to defer up to 100% of their compensation. Each plan participant is fully vested in all deferred compensation and earnings credited to his or her account.
The liability under this Plan amounted to $89.0 at March 30, 2007, and $83.1 at March 31, 2006. The Company’s expense under the Plan totaled $6.0, $5.8, and $5.2 for fiscal 2007, fiscal 2006 and fiscal 2005, respectively.
COMPUTER SCIENCES CORPORATION
NOTES TO CONSOLIDATED FINANCIAL STATEMENTS (Continued)
(Dollars in millions except per-share amounts)
Note 13—Commitments and Contingencies
Commitments
The Company has operating leases for the use of certain real estate and equipment. Substantially all operating leases are non-cancelable or cancelable only by the payment of penalties. All lease payments are based on the lapse of time but include, in some cases, payments for insurance, maintenance and property taxes. There are no purchase options on operating leases at favorable terms, but most real estate leases have one or more renewal options. Certain leases on real estate are subject to annual escalations for increases in utilities and property taxes. Lease rental expense amounted to $345.1, $299.6 and $330.8 for the years ended March 30, 2007, March 31, 2006, and April 1, 2005, respectively.
Minimum fixed rentals required for the next five years and thereafter under operating leases in effect at March 30, 2007 are as follows:
Fiscal Year | | Real Estate | | | Equipment | |
| 2008 | | $ | 217.3 | | | $ | 84.8 | |
| 2009 | | | 192.7 | | | | 29.5 | |
| 2010 | | | 160.2 | | | | 15.4 | |
| 2011 | | | 129.9 | | | | 4.7 | |
| 2012 | | | 64.5 | | | | .8 | |
| Thereafter | | | 125.6 | | | | | |
| | | $ | 890.2 | | | $ | 135.2 | |
The Company has signed long-term purchase agreements with certain software, hardware, telecommunication and other service providers to obtain favorable pricing and terms for services that are necessary for the operations of business activities. Under the terms of these agreements, the Company is contractually committed to purchase specified service minimums over periods ranging from one to five years. If the Company does not meet the specified service minimums, the Company would have an obligation to pay the service provider a portion or all of the shortfall. Minimum purchase commitments for each of the subsequent five years, fiscal 2008 through fiscal 2012, are as follows: $435.3, $279.1, $34.3, $53.7 and $.1, respectively. In addition, the Company also has $39.3 of sublease income to be received through 2017.
Contingencies
The primary financial instruments which potentially subject the Company to concentrations of credit risk are accounts receivable. The Company’s customer base includes Fortune 500 companies, the U.S. Federal and other governments and other significant, well-known companies operating in North America, Europe and the Pacific Rim. Credit risk with respect to accounts receivable is minimized because of the nature and diversification of the Company’s customer base. Furthermore, the Company continuously reviews its accounts receivables and records provisions for doubtful accounts as needed.
The Company guarantees working capital credit lines established with local financial institutions for its non-U.S. business units. Generally, guarantees have one-year terms and are renewed annually. CSC guarantees up to $567.1 of such working capital lines; however, as of March 30, 2007, the amount of the maximum potential payment is $51.9, the amount of the related outstanding subsidiary debt. The $51.9 outstanding debt is reflected in the Company’s consolidated financial statements.
The Company generally indemnifies its software license customers from claims of infringement on a United States patent, copyright, or trade secret. CSC’s indemnification covers costs to defend customers from claims, court awards or related settlements. The Company maintains the right to modify or replace software in order to eliminate any infringement. Historically, CSC has not incurred any significant costs related to customer software license indemnification. Management considers the likelihood of incurring future costs to be remote. Accordingly, the Company has not recorded a related liability.
COMPUTER SCIENCES CORPORATION
NOTES TO CONSOLIDATED FINANCIAL STATEMENTS (Continued)
(Dollars in millions except per-share amounts)
Note 13—Commitments and Contingencies (Continued)
CSC is engaged in providing services under contracts with the U.S. Government. The contracts are subject to extensive legal and regulatory requirements and, from time to time, agencies of the U.S. Government investigate whether the Company’s operations are being conducted in accordance with these requirements. U.S. Government investigations of the Company, whether related to the Company’s federal government contracts or conducted for other reasons, could result in administrative, civil or criminal liabilities, including repayments, fines or penalties being imposed upon the Company, or could lead to suspension or debarment from future U.S. Government contracting. The Company believes it has adequately reserved for any losses which may be experienced from these investigations.
In the course of business, discrepancies or claims may arise as to the use or reliability of various software products provided by the Company for its customers. On February 11, 2005, the Company was named, along with other vendors to the insurance industry, and dozens of insurance companies in Hensley, et al. vs. Computer Sciences Corporation, et al., filed as a putative nationwide class action in state court in Miller County, Arkansas shortly before President Bush signed the Class Action Fairness Act into law. The plaintiffs allege the defendants conspired to wrongfully use software products licensed by the Company and the other software vendors to reduce the amount paid to the licensees’ insureds for bodily injury claims. Plaintiffs also allege wrongful concealment of the manner in which these software programs evaluate claims and wrongful concealment of information about alleged inherent errors and flaws in the software. Plaintiffs seek injunctive and monetary relief of less than $.075 for each class member, as well as attorney’s fees and costs. The Company is vigorously defending itself against the allegations.
Litigation is inherently uncertain and it is not possible to predict the ultimate outcome of the matters discussed above. Considering the early stage of the Hensley case, the complicated issues presented by that matter, and the fact that no class has been certified, it is not possible at this time to make meaningful estimates of the amount or range of loss that could result from this matter. It is possible that the Company’s business, financial condition, results of operations, or cash flows could be affected by the resolution of this matter. Whether any losses, damages or remedies ultimately resulting from this proceeding could reasonably have a material effect on the Company’s business, financial condition, results of operations, or cash flows will depend on a number of variables, including, for example, the timing and amount of such losses or damages, if any, and the structure and type of any such remedies. Depending on the ultimate resolution of these matters, some may be material to the Company’s operating results for a particular period if an unfavorable outcome results, although such a material unfavorable result is not presently expected, and all other litigation, in the aggregate, is not expected to result in a material adverse impact to the consolidated financial statements.
As reflected by Form 8-K filings made by Sears Holdings Corporation (SHC) on May 13, 2005 (following merger with K-Mart Holding Corporation), and by the Company on May 16, 2005, ’HC's subsidiary, Sears, Roebuck and Co. (Sears), and the Company are in dispute over amounts due and owing and applicable termination fees following Sears' termination of its Master Services Agreement (Agreement) with the Company on May 11, 2005. The dispute which also involves billings for continued services and counterclaim allegations by Sears of contract breaches is expected to be resolved pursuant to negotiations or legal and arbitration proceedings. As of March 30, 2007, the Company’s investment in net assets associated with the Agreement was approximately $80. These net assets include accounts receivable, prepaid expenses, outsourcing contract costs, software, and property, plant and equipment. The Company will vigorously pursue recovery for its associated assets and commitments. While the Company expects full recovery of its investments associated with this Agreement, if unsuccessful, the Company may experience a charge, which could be material, associated with the impairment of these assets.
COMPUTER SCIENCES CORPORATION
NOTES TO CONSOLIDATED FINANCIAL STATEMENTS (Continued)
(Dollars in millions except per-share amounts)
Note 13—Commitments and Contingencies (Continued)
The Company has converted 16 submitted Requests for Equitable Adjustment (REAs) to interest bearing claims under the Contract Disputes Act (CDA) totaling in excess of $1,000 on two U.S. Federal contracts. Included in current assets on the Company’s balance sheet is approximately $820 of unbilled accounts receivable and deferred costs related to the contracts. CSC has requested payment for certain related out-of-scope work directed or caused by the customers in support of their critical missions. The contractual modification process for scope changes has lagged behind the need for CSC to provide critical on-going operational support. The Company does not record any profit element when it defers costs associated with such REAs/claims. The Company believes it has a legal basis for pursuing recovery of these REAs/claims and that collection is probable with interest on the claims accruing but not being recognized. Settlement of the amounts depends on individual circumstances, negotiations with the parties and prosecution of the claims; the Company is unable to predict the timing of resolution of these claims.
Several shareholders of the Company have filed purported derivative actions against the Company, as nominal defendant, as well as certain of CSC's executive officers and directors. These actions generally allege that certain individual defendants breached their fiduciary duty to the Company by purportedly “backdating” stock options granted to CSC executives, improperly recording and accounting for allegedly backdated stock options, producing and disseminating disclosures that improperly recorded and accounted for the allegedly backdated options, engaging in acts of Corporate waste, and committing violations of insider trading laws. They allege that certain of the defendants were unjustly enriched and seek to require them to disgorge their profits. The Company and certain directors and other individuals have also been sued in a class action proceeding alleging violations of the ERISA statute related to claims of alleged backdating of stock options.
In addition to the matters noted above, the Company is currently party to a number of disputes which involve or may involve litigation. The Company consults with legal counsel on those issues related to litigation and seeks input from other experts and advisors with respect to other matters in the ordinary course of business. Whether any losses, damages or remedies ultimately resulting from such other matters could reasonably have a material effect on the Company’s business, financial condition, results of operation, or cash flows will depend on a number of variables, including, for example, the timing and amount of such losses or damages (if any) and the structure and type of any such remedies. For these reasons, it is not possible to make reliable estimates of the amount or range of loss that could result from these other matters at this time. Company management does not, however, presently expect any of such other matters to have a material impact on the consolidated financial statements of the Company.
Note 14—Stock Incentive Plans
Employee Incentives
The Company has four stock incentive plans which authorize the issuance of stock options, restricted stock and other stock-based incentives to employees upon terms approved by the Compensation Committee of the Board of Directors. The Company issues authorized but previously unissued shares upon the exercise of stock options, the granting of restricted stock and the redemption of restricted stock units (RSUs). The Company’s standard vesting schedule for stock options and stock awards (restricted stock and RSUs) is one third on each of the first three anniversaries of the grant date, except for certain stock awards where one third of the shares vest on each of the third, fourth and fifth anniversaries of the grant date. Prior to April 2001, the Company’s standard vesting schedule for stock options and awards was one fifth of the shares vested on each of the first five anniversaries of the grant date. Stock options are generally granted for a term of ten years.
COMPUTER SCIENCES CORPORATION
NOTES TO CONSOLIDATED FINANCIAL STATEMENTS (Continued)
(Dollars in millions except per-share amounts)
Note 14—Stock Incentive Plans (Continued)
At March 30, 2007, 4,140,816 shares of CSC common stock were available for the grant of future stock options, restricted stock or other stock-based incentives to employees.
Stock Options
Information concerning stock options granted under stock incentive plans during fiscal 2007, fiscal 2006 and fiscal 2005 is as follows:
| | | Number of Shares | | | Weighted Average Exercise Price | | | Weighted Average Remaining Contractual Life | | | Aggregate Intrinsic Value | |
| Outstanding, at April 2, 2004 | | | 18,254,993 | | | $ | 40.23 | | | | | | | |
| Granted, market options | | | 3,089,370 | | | | 39.95 | | | | | | | |
| Granted, discounted options | | | 234,341 | | | | 9.76 | | | | | | | |
| Exercised | | | (3,052,857 | ) | | | 32.69 | | | | | | | |
| Canceled/Forfeited/Expired | | | (699,581 | ) | | | 48.10 | | | | | | | |
| Outstanding at April 1, 2005 | | | 17,826,266 | | | | 40.78 | | | | | | | |
| Granted | | | 3,084,300 | | | | 44.49 | | | | | | | |
| Exercised | | | (2,777,353 | ) | | | 34.71 | | | | | | | |
| Canceled/Forfeited/Expired | | | (883,772 | ) | | | 44.45 | | | | | | | |
| Outstanding at March 31, 2006 | | | 17,249,441 | | | | 42.36 | | | | 6.11 | | | $ | 185.3 | |
| Granted | | | 3,164,075 | | | | 55.20 | | | | | | | | | |
| Exercised | | | (2,567,074 | ) | | | 36.97 | | | | | | | | | |
| Canceled/Forfeited | | | (488,658 | ) | | | 47.64 | | | | | | | | | |
| Expired | | | (297,702 | ) | | | 52.33 | | | | | | | | | |
| Outstanding at March 30, 2007 | | | 17,060,082 | | | | 45.23 | | | | 5.86 | | | | 140.2 | |
| Vested and expected to vest in the future at March 30, 2007 | | | 16,845,782 | | | | 45.14 | | | | 5.82 | | | | 139.7 | |
| Exercisable at March 30, 2007 | | | 11,557,782 | | | | 43.36 | | | | 4.59 | | | | 114.8 | |
| | | | March 30, 2007 | |
| | | | Options Outstanding | | | Options Exercisable | |
Range of Option Exercise Price | | | Number Outstanding | | | Weighted Average Exercise Price | | | Weighted Average Remaining Contractual Life | | | Number Exercisable | | | Weighted Average Exercise Price | |
| $ | 8.29 – $34.04 | | | | 5,494,948 | | | $ | 34.29 | | | | 5.52 | | | | 4,766,456 | | | $ | 33.94 | |
| $ | 39.10 – $45.61 | | | | 4,504,100 | | | | 44.61 | | | | 6.89 | | | | 2,798,387 | | | | 44.84 | |
| $ | 45.70 – $55.35 | | | | 5,256,639 | | | | 52.37 | | | | 6.43 | | | | 2,267,544 | | | | 49.18 | |
| $ | 55.88 – $78.94 | | | | 1,804,395 | | | | 59.25 | | | | 2.67 | | | | 1,725,395 | | | | 59.31 | |
The total intrinsic value of options exercised during fiscal 2007, fiscal 2006 and fiscal 2005 was $43.1, $48.3 and $54.6, respectively. The total intrinsic value of stock options is based on the difference between the fair market value of the Company’s common stock at March 30, 2007 (for options outstanding), or date of exercise, for options exercised during the period less the applicable exercise price. The total grant date fair value of stock options vested during fiscal 2007, fiscal 2006 and fiscal 2005 was $36.5, $48.0 and $51.7, respectively.
The cash received from stock options exercised during fiscal 2007 was $94.8. During fiscal 2007 the Company realized income tax benefits of $19.5 and an excess tax benefit of $12.1 related to the exercise of these stock options.
As of March 30, 2007 there was $39.3 of total unrecognized compensation expense related to unvested stock options, net of expected forfeitures. The cost is expected to be recognized over a weighted-average period of 1.87 years.
COMPUTER SCIENCES CORPORATION
NOTES TO CONSOLIDATED FINANCIAL STATEMENTS (Continued)
(Dollars in millions except per-share amounts)
Note 14—Stock Incentive Plans (Continued)
Stock Awards
Stock awards consist of restricted stock and restricted stock units (“RSUs”). Restricted stock awards consist of shares of common stock of the Company issued at a price of $0. Upon issuance to an employee, shares of restricted stock become outstanding, receive dividends and have voting rights. The shares are subject to forfeiture and to restrictions which limit the sale or transfer during the restriction period. The restrictions on shares of CSC restricted stock normally lapse on the first, second and third anniversaries of the date of issuance for awards issued in lieu of cash bonuses and on the third, fourth and fifth anniversaries for all others. The restrictions on RSUs vest on the first, second and third anniversaries of the date of issuance for those issued in lieu of cash bonuses, and on the third, fourth and fifth anniversaries for all others. Upon the vesting date, the RSUs are automatically redeemed for shares of CSC common stock and dividend equivalents.
Information concerning stock awards granted under stock incentive plans during fiscal 2007, fiscal 2006 and fiscal 2005 is as follows:
| | | Number of Shares | | | Weighted Average Fair Value | |
| Outstanding at April 2, 2004 | | | 30,855 | | | | |
| Granted | | | 302,797 | | | | |
| Released/Redeemed | | | | | | | |
| Forfeited/Canceled | | | | | | | |
| Outstanding at April 1, 2005 | | | 333,652 | | | | |
| Granted | | | 505,928 | | | | |
| Released/Redeemed | | | (10,589 | ) | | | |
| Forfeited/Canceled | | | (33,000 | ) | | | |
| Outstanding at March 31, 2006 | | | 795,991 | | | $ | 42.48 | |
| Granted | | | 560,752 | | | | 55.35 | |
| Released/Redeemed | | | (193,584 | ) | | | 45.13 | |
| Forfeited/Canceled | | | (20,142 | ) | | | 45.22 | |
| Outstanding at March 30, 2007 | | | 1,143,017 | | | | 48.30 | |
As of March 30, 2007 there was $36.9 of total unrecognized compensation expense related to unvested restricted stock awards and restricted stock units. The cost is expected to be recognized over a weighted-average period of 2.82 years.
Nonemployee Director Incentives
The Company has two stock incentive plans which authorize the issuance of stock options, restricted stock and other stock-based incentives to nonemployee directors upon terms approved by the Company’s Board of Directors. At March 30, 2007, 92,383 shares of CSC common stock remained available for the grant to nonemployee directors of future RSUs or other stock-based incentives.
COMPUTER SCIENCES CORPORATION
NOTES TO CONSOLIDATED FINANCIAL STATEMENTS (Continued)
(Dollars in millions except per-share amounts)
Note 14—Stock Incentive Plans (Continued)
Generally, RSU awards to nonemployee directors vest in full as of the next annual meeting of the Company’s stockholders following the date they are granted and are issued at a price of $0. Information concerning RSUs granted to nonemployee directors during fiscal 2007, fiscal 2006 and fiscal 2005 is as follows:
| | | Number of Shares | | | Weighted Average Fair Value | |
| Outstanding at April 2, 2004 | | | 68,817 | | | | |
| Granted | | | 13,000 | | | | |
| Redeemed | | | (12,532 | ) | | | |
| Forfeited/Canceled | | | | | | | |
| Outstanding at April 1, 2005 | | | 69,285 | | | | |
| Granted | | | 11,400 | | | | |
| Redeemed | | | (21,164 | ) | | | |
| Forfeited/Canceled | | | | | | | |
| Outstanding at March 31, 2006 | | | 59,521 | | | $ | 42.45 | |
| Granted | | | 14,400 | | | | 52.39 | |
| Redeemed | | | (600 | ) | | | 37.81 | |
| Forfeited/Canceled | | | | | | | | |
| Outstanding at March 30, 2007 | | | 73,321 | | | | 44.44 | |
When a holder of RSUs ceases to be a director of the Company, the RSUs are automatically redeemed for shares of CSC common stock and dividend equivalents with respect to such shares. The number of shares to be delivered upon redemption is equal to the number of RSUs that are vested at the time the holder ceases to be a director. At the holder’s election the RSUs may be redeemed (i) as an entirety, upon the day the holder ceases to be a director, or (ii) in substantially equal amounts upon the first five, ten or fifteen anniversaries of such termination of service.
As of March 30, 2007 there was $0.3 of total unrecognized compensation expense related to unvested nonemployee director RSUs. The cost is expected to be fully recognized as of the annual stockholders’ meeting on July 30, 2007.
Note 15—Stockholder Purchase Rights Plan
On February 18, 1998, the Company adopted a stockholder rights plan pursuant to which it issued one right for each outstanding share of its common stock. These rights, which are attached to and trade only together with the common stock, are not currently exercisable. On the tenth business day after any person or entity becomes the beneficial owner of 15% or more of CSC’s common stock, each right (other than rights held by the 15% stockholder, which will become void) will become exercisable to purchase, for $250, CSC common stock having a market value of $500. The rights expire February 18, 2008, and may be redeemed by the Board of Directors at $.0005 per right at any time before they become exercisable.
COMPUTER SCIENCES CORPORATION
NOTES TO CONSOLIDATED FINANCIAL STATEMENTS (Continued)
(Dollars in millions except per-share amounts)
Note 16—Segment and Geographic Information
All of the Company’s business involves operations which provide I/T outsourcing, consulting and system integration services and other professional services. Although the Company presents estimates of revenue by business service and geography, the Company’s expenses and assets are not identified or accumulated in this manner due to, among other reasons, cross-utilization of personnel and assets across the Company. Based on SFAS No. 131 criteria, the Company aggregates operating segments into two reportable segments that consist of the North American Public Sector (formerly U.S. Federal Sector) and Global Commercial. The Company organizes Global Commercial operating segments by geographies and vertical operations. These operations serve large-scale corporations and organizations in a wide array of industries. The operating segments provide outsourcing, systems integration, consulting, and professional services within their assigned target geographic or vertical market. Further, operating segments’ service offerings and clientele overlap and the Company draws on multiple operating segments to serve clients.
As a result, the aggregated operating segments have similar economic characteristics, products, services, customers and methods of operation. The North American Public Sector operates principally within a regulatory environment subject to governmental contracting and accounting requirements, including Federal Acquisition Regulations, Cost Accounting Standards and audits by various U.S. federal agencies. The Company utilizes uniform accounting policies across all of its operating units (see Note 1). The table below presents financial information for the three fiscal years ended March 30, 2007, for the two reportable segments, and for financial items that cannot be allocated to either operating segment:
| | | Global Commercial Sector | | | North American Public Sector | | | Corporate | | | Total | |
2007 | | | | | | | | | | | | |
Revenues | | $ | 9,506.3 | | | $ | 5,350.3 | | | | | | $ | 14,856.6 | |
Earnings (loss) before special items, interest and taxes | | | 758.0 | | | | 363.6 | | | $ | (72.8 | ) | | | 1,048.8 | |
Depreciation and amortization | | | 915.0 | | | | 141.2 | | | | 17.4 | | | | 1,073.6 | |
Assets | | | 9,476.6 | | | | 3,685.2 | | | | 568.7 | | | | 13,730.5 | |
Capital expenditures for long-lived assets | | | 837.8 | | | | 74.1 | | | | 40.9 | | | | 952.8 | |
| | | | | | | | | | | | | | | | | |
2006 – As Restated (1) | | | | | | | | | | | | | | | | |
Revenues | | $ | 9,585.0 | | | $ | 5,054.0 | | | | | | | $ | 14,639.0 | |
Earnings (loss) before special items, interest and taxes | | | 665.7 | | | | 352.7 | | | $ | (57.7 | ) | | | 960.7 | |
Depreciation and amortization | | | 931.6 | | | | 142.9 | | | | 17.3 | | | | 1,091.8 | |
Assets | | | 8,345.5 | | | | 3,511.8 | | | | 1,164.4 | | | | 13,021.7 | |
Capital expenditures for long-lived assets | | | 1,105.6 | | | | 85.0 | | | | 29.9 | | | | 1,220.5 | |
| | | | | | | | | | | | | | | | | |
2005 – As Restated (1) | | | | | | | | | | | | | | | | |
Revenues | | $ | 9,404.1 | | | $ | 4,675.9 | | | | | | | $ | 14,080.0 | |
Earnings (loss) before special items, interest and taxes | | | 642.9 | | | | 313.3 | | | $ | (104.0 | ) | | | 852.2 | |
Depreciation and amortization | | | 890.6 | | | | 142.3 | | | | 18.1 | | | | 1,051.0 | |
Assets | | | 8,810.2 | | | | 3,169.7 | | | | 623.3 | | | | 12,603.2 | |
Capital expenditures for long-lived assets | | | 1,248.0 | | | | 185.1 | | | | 36.2 | | | | 1,469.3 | |
(1) See Note 2, "Restatement of Consolidated Financial Statements.”
| Note: | The capital expenditures for long-lived assets disclosed above are reported on a continuing operations basis and therefore may not agree to amounts disclosed in the consolidated statement of cash flows. |
COMPUTER SCIENCES CORPORATION
NOTES TO CONSOLIDATED FINANCIAL STATEMENTS (Continued)
(Dollars in millions except per-share amounts)
Note 16—Segment and Geographic Information (Continued)
A reconciliation of earnings before special items, interest and taxes to income before taxes is as follows:
| | | Fiscal Year | |
| | | 2007 | | | 2006 | | | 2005 | |
| | | | | | As Restated (1) | | | As Restated (1) | |
| Earnings before special items, interest and taxes | | $ | 1,048.8 | | | $ | 960.7 | | | $ | 852.2 | |
| Interest expense | | | (175.2 | ) | | | (120.9 | ) | | | (159.4 | ) |
| Interest income | | | 49.5 | | | | 40.8 | | | | 16.1 | |
| Special items | | | (316.1 | ) | | | (77.3 | ) | | | (28.6 | ) |
Income before taxes | | $ | 607.0 | | | $ | 803.3 | | | $ | 680.3 | |
(1) See Note 2, "Restatement of Consolidated Financial Statements.”
The earnings before special items, interest and taxes provide useful information to the Company’s management for assessment of the Company’s performance and results of operations. Components of the measure are utilized to determine executive compensation along with other measures.
Enterprise-wide information is provided in accordance with SFAS No. 131. Revenue by country is based on the location of the selling business unit. Property and equipment information is based on the physical location of the asset. Geographic revenue and property and equipment, net for the three years ended March 30, 2007 is as follows:
| | | Fiscal Year | |
| | | 2007 | | | 2006 | | | 2005 | |
| | | Revenues | | | Property and Equipment, Net | | | Revenues | | | Property and Equipment, Net | | | Revenues | | | Property and Equipment, Net | |
| | | | | | | | | As Restated (1) | | | | | | As Restated (1) | | | | |
| United States | | $ | 9,223.2 | | | $ | 1,392.8 | | | $ | 9,101.7 | | | $ | 1,372.2 | | | $ | 8,527.0 | | | $ | 1,340.3 | |
| Europe: | | | | | | | | | | | | | | | | | | | | | | | | |
United Kingdom | | | 1,900.3 | | | | 533.2 | | | | 2,005.1 | | | | 393.5 | | | | 2,083.0 | | | | 378.0 | |
Other Europe | | | 2,246.0 | | | | 281.1 | | | | 2,171.7 | | | | 244.1 | | | | 2,242.7 | | | | 298.3 | |
| Other International | | | 1,487.1 | | | | 332.0 | | | | 1,360.5 | | | | 310.3 | | | | 1,227.3 | | | | 348.8 | |
Total | | $ | 14,856.6 | | | $ | 2,539.1 | | | $ | 14,639.0 | | | $ | 2,320.1 | | | $ | 14,080.0 | | | $ | 2,365.4 | |
(1) See Note 2, "Restatement of Consolidated Financial Statements.”
The Company derives a significant portion of its revenues from departments and agencies of the United States government. U.S. Federal government revenue accounted for 36%, 35% and 33% of the Company’s revenues for fiscal 2007, 2006 and 2005, respectively. At March 30, 2007, approximately 46% of the Company’s accounts receivable were due from the federal government. No single commercial customer exceeded 10% of the Company’s revenues during fiscal 2007, fiscal 2006 or fiscal 2005.
Note 17—Agreements with Equifax
The Company has an agreement (the Operating Agreement) with Equifax Inc. and its subsidiary, Equifax Credit Information Services, Inc. (ECIS), pursuant to which certain of the Company’s subsidiaries (collectively, the Bureaus) are affiliated credit bureaus of ECIS and utilize ECIS’ credit database to provide credit reporting services from the ECIS system for resale to their customers. The Bureaus retain ownership of their credit files stored in the ECIS system and receive revenues generated from the sale of the credit information they contain. The Bureaus pay ECIS a fee for storing and maintaining the files and for each report supplied by the ECIS system.
Pursuant to the Operating Agreement, the Company has an option to require ECIS to purchase CSC’s credit reporting business (Credit Reporting Put Option). The option requires six months’ advance notice and expires on August 1, 2013. The exercise price of the option is equal to the appraised value of the credit reporting business.
COMPUTER SCIENCES CORPORATION
NOTES TO CONSOLIDATED FINANCIAL STATEMENTS (Continued)
(Dollars in millions except per-share amounts)
Note 17—Agreements with Equifax (Continued)
The Operating Agreement has a 10 year term, which will automatically be renewed indefinitely for successive 10 year periods unless the Company gives notice of termination at least six months prior to the expiration of any such term. In the event that on or prior to August 1, 2013 (i) the Company gives such notice of termination and does not exercise the Credit Reporting Put Option prior to the termination of the then-current term or (ii) there is a change in control of the Company, then ECIS has an option for 60 days thereafter to require the Company to sell to it the credit reporting business at the Credit Reporting Put Option exercise price.
Note 18—Subsequent Events
On April 25, 2007, the Company announced an agreement to acquire Covansys Corporation for $34.00 per share in an all-cash transaction. The transaction is valued at approximately $1.3 billion. The agreement was approved by the Board of Directors of CSC. The Covansys Board of Directors has approved the agreement and recommends that Covansys stockholders approve the merger. The transaction is expected to be completed during the second quarter of CSC's fiscal year 2008. Covansys is an information technology services company specializing in industry-specific solutions, strategic outsourcing and integration services. Covansys is known for strategic outsourcing and technology solutions in the healthcare, financial services, retail and distribution, manufacturing, telecommunications and high-tech industries. The acquisition of Covansys will increase the Company’s delivery capabilities in India, and accelerate development of strategic offshore offerings.
COMPUTER SCIENCES CORPORATION
Quarterly Financial Information (Unaudited)
| | | Fiscal 2007 | |
In millions except per-share amount * | | 1st Quarter (2) (3) | | | 2nd Quarter (2) | | | 3rd Quarter(2) | | | 4th Quarter(2) | |
| | | As Restated (1) | | | As Restated (1) | | | As Restated (1) | | | | |
| Revenues | | $ | 3,561.1 | | | $ | 3,609.1 | | | $ | 3,640.6 | | | $ | 4,045.8 | |
Cost of services (excluding depreciation and amortization) | | | 2,883.1 | | | | 2,896.4 | | | | 2,903.1 | | | | 3,135.3 | |
| Income from continuing operations before taxes | | | (19.7 | ) | | | 140.5 | | | | 168.0 | | | | 318.1 | |
| Income from continuing operations | | | (59.2 | ) | | | 88.7 | | | | 109.6 | | | | 249.7 | |
| Net Income | | | (59.2 | ) | | | 88.7 | | | | 109.6 | | | | 249.7 | |
| Earnings per common share: | | | | | | | | | | | | | | | | |
| Basic | | $ | (0.32 | ) | | $ | 0.52 | | | $ | 0.64 | | | $ | 1.44 | |
| Diluted | | $ | (0.31 | ) | | $ | 0.51 | | | $ | 0.62 | | | $ | 1.42 | |
| | | Fiscal 2006 | |
In millions except per-share amount * | | 1st Quarter | | | 2nd Quarter | | | 3rd Quarter | | | 4th Quarter | |
| | | As Restated (1) (5) (6) | | | As Restated (1) (4) | | | As Restated (1) (6) | | | As Restated (1) (4) | |
| Revenues | | $ | 3,587.1 | | | $ | 3,579.2 | | | $ | 3,581.1 | | | $ | 3,891.7 | |
Cost of services (excluding depreciation and amortization) | | | 2,926.7 | | | | 2,878.0 | | | | 2,851.4 | | | | 3,067.9 | |
| Income from continuing operations before taxes | | | 161.3 | | | | 140.8 | | | | 232.4 | | | | 268.7 | |
| Income from continuing operations | | | 92.6 | | | | 78.9 | | | | 136.5 | | | | 163.1 | |
| Discontinued operations, net of taxes | | | 22.9 | | | | | | | | 38.4 | | | | | |
Cumulative effect of change in accounting principle, net of taxes | | | | | | | | | | | | | | | (4.3 | ) |
| Net Income | | | 115.5 | | | | 78.9 | | | | 174.9 | | | | 158.8 | |
| Earnings per common share: | | | | | | | | | | | | | | | | |
| Continuing operations | | $ | 0.50 | | | $ | 0.43 | | | $ | 0.73 | | | $ | 0.87 | |
| Discontinued operations, net of taxes | | | 0.12 | | | | | | | | 0.21 | | | | | |
Cumulative effect of change in accounting principle, net of taxes | | | | | | | | | | | | | | | (0.02 | ) |
| Basic* | | $ | 0.62 | | | $ | 0.43 | | | $ | 0.94 | | | $ | 0.85 | |
| Continuing operations | | $ | 0.49 | | | $ | 0.42 | | | $ | 0.73 | | | $ | 0.86 | |
| Discontinued operations, net of taxes | | | 0.12 | | | | | | | | 0.20 | | | | | |
Cumulative effect of change in accounting principle, net of taxes | | | | | | | | | | | | | | | (0.02 | ) |
| Diluted* | | $ | 0.62 | | | $ | 0.42 | | | $ | 0.93 | | | $ | 0.84 | |
* Amounts may not add as a result of rounding.
A discussion of “Special Items” is included in Note 7 and a discussion of discontinued operations and the gain on sale of discontinued operations is included in Note 3 to the consolidated financial statements.
| (1) | | See Note 2, "Restatement of Consolidated Financial Statements," in Notes to Consolidated Financial Statements. |
| (2) | | Includes pre-tax restructuring charges of $215.0, $40.2, $42.0, and $36.2 million for the 1st, 2nd, 3rd, and 4th quarters, respectively. |
| (3) | | Includes a pre-tax $18.3 million gain from the redemption of DynCorp International preferred stock recorded during the 1st quarter of fiscal 2007. |
| (4) | | Includes a pre-tax $52.0, and $25.2 million Nortel networks impairment charge for the 2nd and 4th quarters, respectively during fiscal 2006. |
| (5) | | Includes a pre-tax realized gain of $22.9 million attributed to the exchange of the Company’s CSC Health Plan Solutions (HPS) business of DST Systems, Inc. in discontinued operations, which shares were valued at $324.6 million and included in treasury stock during 1st quarter of fiscal 2006. |
| (6) | | Includes a pre-tax $65.5 million gain on the sale of DynCorp International (DI) in discontinued operations during the 3rd quarter of fiscal 2006. |
The following table presents the effects of the adjustments made to the Company’s previously reported consolidated condensed statements of income for the three months ended July 1, 2005:
| | | First Quarter Ended July 1, 2005 | |
| | | | | | Adjustments | | | |
| | | As Reported | | | Revenue Recognition | | | Stock Options | | | Income Tax | | Other | | As Restated | |
| | | | | | | | | | | | | | | | | |
| Revenues | | $ | 3,582.5 | | | $ | 4.6 | | | | | | | | | | $ | 3,587.1 | |
| | | | | | | | | | | | | | | | | | | | |
| Costs of services (excludes depreciation and amortization) | | | 2,926.7 | | | | | | | | | | | | | | | 2,926.7 | |
| Selling, general and administrative | | | 205.1 | | | | | | | $ | 0.3 | | | $ | 1.0 | | | | | 206.4 | |
| Depreciation and amortization | | | 269.7 | | | | | | | | | | | | | | | | | 269.7 | |
| Interest expense | | | 24.1 | | | | | | | | | | | | 4.2 | | | | | 28.3 | |
| Interest income | | | (5.3 | ) | | | | | | | | | | | | | | | | (5.3 | ) |
| Special items | | | | | | | | | | | | | | | | | | | | | |
| Total costs and expenses | | | 3,420.3 | | | | | | | | 0.3 | | | | 5.2 | | | | | 3,425.8 | |
| | | | | | | | | | | | | | | | | | | | | | |
| Income before taxes | | | 162.2 | | | | 4.6 | | | | (0.3 | ) | | | (5.2 | ) | | | | 161.3 | |
| Taxes on income | | | 53.5 | | | | 1.8 | | | | (0.1 | ) | | | 13.5 | | | | | 68.7 | |
| Income from continuing operations | | | 108.7 | | | | 2.8 | | | | (0.2 | ) | | | (18.7 | ) | | | | 92.6 | |
| Discontinued operations, net of taxes | | | 22.9 | | | | | | | | | | | | | | | | | 22.9 | |
| Cumulative effect of change in accounting principle, net of taxes | | | | | | | | | | | | | | | | | | | | | |
| Net income | | $ | 131.6 | | | $ | 2.8 | | | $ | (0.2 | ) | | $ | (18.7 | ) | | | $ | 115.5 | |
| | | | | | | | | | | | | | | | | | | | | | |
| Earnings per share: | | | | | | | | | | | | | | | | | | | | | |
| Continuing operations | | $ | 0.59 | | | $ | 0.02 | | | | | | | $ | (0.10 | ) | | | $ | 0.50 | |
| Discontinued operations | | | 0.12 | | | | | | | | | | | | | | | | | 0.12 | |
| Cumulative effect of change in accounting principle, net of taxes | | | | | | | | | | | | | | | | | | | | | |
| Basic* | | $ | 0.71 | | | $ | 0.02 | | | | | | | $ | (0.10 | ) | | | $ | 0.62 | |
| | | | | | | | | | | | | | | | | | | | | | |
| Continuing operations | | $ | 0.58 | | | $ | 0.01 | | | | | | | $ | (0.10 | ) | | | $ | 0.49 | |
| Discontinued operations | | | 0.12 | | | | | | | | | | | | | | | | | 0.12 | |
| Cumulative effect of change in accounting principle, net of taxes | | | | | | | | | | | | | | | | | | | | | |
| Diluted* | | $ | 0.70 | | | $ | 0.01 | | | | | | | $ | (0.10 | ) | | | $ | 0.62 | |
* Amounts may not add as a result of rounding.
The following table presents the effects of the adjustments made to the Company’s previously reported consolidated condensed statements of income for the three months ended September 30, 2005:
| | | Second Quarter Ended September 30, 2005 | |
| | | | | | Adjustments | | | |
| | | As Reported | | | Revenue Recognition | | | Stock Options | | | Income Tax | | Other | | As Restated | |
| | | | | | | | | | | | | | | | | |
| Revenues | | $ | 3,572.6 | | | $ | 6.6 | | | | | | | | | | $ | 3,579.2 | |
| | | | | | | | | | | | | | | | | | | | |
| Costs of services (excludes depreciation and amortization) | | | 2,876.7 | | | | | | | $ | 1.3 | | | | | | | | 2,878.0 | |
| Selling, general and administrative | | | 207.8 | | | | | | | | 3.8 | | | $ | 1.0 | | | | | 212.6 | |
| Depreciation and amortization | | | 274.7 | | | | | | | | | | | | | | | | | 274.7 | |
| Interest expense | | | 25.9 | | | | | | | | | | | | 4.2 | | | | | 30.1 | |
| Interest income | | | (9.0 | ) | | | | | | | | | | | | | | | | (9.0 | ) |
| Special items | | | 52.0 | | | | | | | | | | | | | | | | | 52.0 | |
| Total costs and expenses | | | 3,428.1 | | | | | | | | 5.1 | | | | 5.2 | | | | | 3,438.4 | |
| | | | | | | | | | | | | | | | | | | | | | |
| Income before taxes | | | 144.5 | | | | 6.6 | | | | (5.1 | ) | | | (5.2 | ) | | | | 140.8 | |
| Taxes on income | | | 45.0 | | | | 2.6 | | | | (1.7 | ) | | | 16.0 | | | | | 61.9 | |
| Income from continuing operations | | | 99.5 | | | | 4.0 | | | | (3.4 | ) | | | (21.2 | ) | | | | 78.9 | |
| Discontinued operations, net of taxes | | | | | | | | | | | | | | | | | | | | | |
| Cumulative effect of change in accounting principle, net of taxes | | | | | | | | | | | | | | | | | | | | | |
| Net income | | $ | 99.5 | | | $ | 4.0 | | | $ | (3.4 | ) | | $ | (21.2 | ) | | | $ | 78.9 | |
| | | | | | | | | | | | | | | | | | | | | | |
| Earnings per share: | | | | | | | | | | | | | | | | | | | | | |
| Continuing operations | | $ | 0.54 | | | $ | 0.02 | | | $ | (0.02 | ) | | $ | (0.11 | ) | | | $ | 0.43 | |
| Discontinued operations | | | | | | | | | | | | | | | | | | | | | |
| Cumulative effect of change in accounting principle, net of taxes | | | | | | | | | | | | | | | | | | | | | |
| Basic* | | $ | 0.54 | | | $ | 0.02 | | | $ | (0.02 | ) | | $ | (0.11 | ) | | | $ | 0.43 | |
| | | | | | | | | | | | | | | | | | | | | | |
| Continuing operations | | $ | 0.53 | | | $ | 0.02 | | | $ | (0.02 | ) | | $ | (0.11 | ) | | | $ | 0.42 | |
| Discontinued operations | | | | | | | | | | | | | | | | | | | | | |
| Cumulative effect of change in accounting principle, net of taxes | | | | | | | | | | | | | | | | | | | | | |
| Diluted* | | $ | 0.53 | | | $ | 0.02 | | | $ | (0.02 | ) | | $ | (0.11 | ) | | | $ | 0.42 | |
* Amounts may not add as a result of rounding.
The following table presents the effects of the adjustments made to the Company’s previously reported consolidated condensed statements of income for the three months ended December 30, 2005:
| | | Third Quarter Ended December 30, 2005 | |
| | | | | | Adjustments | | | |
| | | As Reported | | | Revenue Recognition | | | Stock Options | | | Income Tax | | Other | | As Restated | |
| | | | | | | | | | | | | | | | | |
| Revenues | | $ | 3,577.0 | | | $ | 4.1 | | | | | | | | | | $ | 3,581.1 | |
| | | | | | | | | | | | | | | | | | | | |
| Costs of services (excludes depreciation and amortization) | | | 2,850.0 | | | | | | | $ | 1.4 | | | | | | | | 2,851.4 | |
| Selling, general and administrative | | | 207.7 | | | | | | | | 5.7 | | | $ | 1.0 | | | | | 214.4 | |
| Depreciation and amortization | | | 267.9 | | | | | | | | | | | | | | | | | 267.9 | |
| Interest expense | | | 24.6 | | | | | | | | | | | | 4.2 | | | | | 28.8 | |
| Interest income | | | (13.8 | ) | | | | | | | | | | | | | | | | (13.8 | ) |
| Special items | | | | | | | | | | | | | | | | | | | | | |
| Total costs and expenses | | | 3,336.4 | | | | | | | | 7.1 | | | | 5.2 | | | | | 3,348.7 | |
| | | | | | | | | | | | | | | | | | | | | | |
| Income before taxes | | | 240.6 | | | | 4.1 | | | | (7.1 | ) | | | (5.2 | ) | | | | 232.4 | |
| Taxes on income | | | 75.5 | | | | 1.6 | | | | (1.4 | ) | | | 20.2 | | | | | 95.9 | |
| Income from continuing operations | | | 165.1 | | | | 2.5 | | | | (5.7 | ) | | | (25.4 | ) | | | | 136.5 | |
| Discontinued operations, net of taxes | | | 38.4 | | | | | | | | | | | | | | | | | 38.4 | |
| Cumulative effect of change in accounting principle, net of taxes | | | | | | | | | | | | | | | | | | | | | |
| Net income | | $ | 203.5 | | | $ | 2.5 | | | $ | (5.7 | ) | | $ | (25.4 | ) | | | $ | 174.9 | |
| | | | | | | | | | | | | | | | | | | | | | |
| Earnings per share: | | | | | | | | | | | | | | | | | | | | | |
| Continuing operations | | $ | 0.89 | | | $ | 0.01 | | | $ | (0.03 | ) | | $ | (0.14 | ) | | | $ | 0.73 | |
| Discontinued operations | | | 0.21 | | | | | | | | | | | | | | | | | 0.21 | |
| Cumulative effect of change in accounting principle, net of taxes | | | | | | | | | | | | | | | | | | | | | |
| Basic* | | $ | 1.10 | | | $ | 0.01 | | | $ | (0.03 | ) | | $ | (0.14 | ) | | | $ | 0.94 | |
| | | | | | | | | | | | | | | | | | | | | | |
| Continuing operations | | $ | 0.88 | | | $ | 0.01 | | | $ | (0.03 | ) | | $ | (0.13 | ) | | | $ | 0.73 | |
| Discontinued operations | | | 0.20 | | | | | | | | | | | | | | | | | 0.20 | |
| Cumulative effect of change in accounting principle, net of taxes | | | | | | | | | | | | | | | | | | | | | |
| Diluted* | | $ | 1.08 | | | $ | 0.01 | | | $ | (0.03 | ) | | $ | (0.13 | ) | | | $ | 0.93 | |
* Amounts may not add as a result of rounding.
The following table presents the effects of the adjustments made to the Company’s previously reported consolidated condensed statements of income for the three months ended March 31, 2006:
| | | Fourth Quarter Ended March 31, 2006 | |
| | | | | | Adjustments | | | | |
| | | As Reported | | | Revenue Recognition | | | Stock Options | | | Income Tax | | | Other | | | As Restated | |
| | | | | | | | | | | | | | | | | | | |
| Revenues | | $ | 3,883.5 | | | $ | 8.2 | | | | | | | | | | | | $ | 3,891.7 | |
| | | | | | | | | | | | | | | | | | | | | | |
| Costs of services (excludes depreciation and amortization) | | | 3,066.4 | | | | | | | $ | 1.6 | | | | | | $ | (0.1 | ) | | | 3,067.9 | |
| Selling, general and administrative | | | 221.6 | | | | | | | | 6.6 | | | $ | 1.0 | | | | | | | | 229.2 | |
| Depreciation and amortization | | | 279.5 | | | | | | | | | | | | | | | | | | | | 279.5 | |
| Interest expense | | | 29.6 | | | | | | | | | | | | 4.2 | | | | | | | | 33.8 | |
| Interest income | | | (12.7 | ) | | | | | | | | | | | | | | | | | | | (12.7 | ) |
| Special items | | | 25.3 | | | | | | | | | | | | | | | | | | | | 25.3 | |
| Total costs and expenses | | | 3,609.7 | | | | | | | | 8.2 | | | | 5.2 | | | | (0.1 | ) | | | 3,623.0 | |
| | | | | | | | | | | | | | | | | | | | | | | | | |
| Income before taxes | | | 273.8 | | | | 8.2 | | | | (8.2 | ) | | | (5.2 | ) | | | 0.1 | | | | 268.7 | |
| Taxes on income | | | 70.1 | | | | 3.2 | | | | (2.2 | ) | | | 34.5 | | | | | | | | 105.6 | |
| Income from continuing operations | | | 203.7 | | | | 5.0 | | | | (6.0 | ) | | | (39.7 | ) | | | 0.1 | | | | 163.1 | |
| Discontinued operations, net of taxes | | | | | | | | | | | | | | | | | | | | | | | | |
| Cumulative effect of change in accounting principle, net of taxes | | | (4.3 | ) | | | | | | | | | | | | | | | | | | | (4.3 | ) |
| Net income | | $ | 199.4 | | | $ | 5.0 | | | $ | (6.0 | ) | | $ | (39.7 | ) | | $ | 0.1 | | | $ | 158.8 | |
| | | | | | | | | | | | | | | | | | | | | | | | | |
| Earnings per share: | | | | | | | | | | | | | | | | | | | | | | | | |
| Continuing operations | | $ | 1.08 | | | $ | 0.03 | | | $ | (0.03 | ) | | $ | (0.21 | ) | | | | | | $ | 0.87 | |
| Discontinued operations | | | | | | | | | | | | | | | | | | | | | | | | |
| Cumulative effect of change in accounting principle, net of taxes | | | (.02 | ) | | | | | | | | | | | | | | | | | | | (.02 | ) |
| Basic* | | $ | 1.07 | | | $ | 0.03 | | | $ | (0.03 | ) | | $ | (0.21 | ) | | | | | | $ | 0.85 | |
| | | | | | | | | | | | | | | | | | | | | | | | | |
| Continuing operations | | $ | 1.08 | | | $ | 0.03 | | | $ | (0.03 | ) | | $ | (0.21 | ) | | | | | | $ | 0.86 | |
| Discontinued operations | | | | | | | | | | | | | | | | | | | | | | | | |
| Cumulative effect of change in accounting principle, net of taxes | | | (.02 | ) | | | | | | | | | | | | | | | | | | | (.02 | ) |
| Diluted* | | $ | 1.05 | | | $ | 0.03 | | | $ | (0.03 | ) | | $ | (0.21 | ) | | | | | | $ | 0.84 | |
* Amounts may not add as a result of rounding.
The following table presents the effects of the adjustments made to the Company’s previously reported consolidated condensed statements of income for the three months ended June 30, 2006:
| | | First Quarter Ended June 30, 2006 | |
| | | | | | Adjustments | | | |
| | | As Reported | | | Revenue Recognition | | | Stock Options | | | Income Tax | | Other | | As Restated | |
| | | | | | | | | | | | | | | | | |
| Revenues | | $ | 3,556.2 | | | $ | 4.9 | | | | | | | | | | $ | 3,561.1 | |
| | | | | | | | | | | | | | | | | | | | |
| Costs of services (excludes depreciation and amortization) | | | 2,883.3 | | | | | | | $ | (0.2 | ) | | | | | | | 2,883.1 | |
| Selling, general and administrative | | | 227.6 | | | | | | | | | | | $ | 0.5 | | | | | 228.1 | |
| Depreciation and amortization | | | 260.9 | | | | | | | | | | | | | | | | | 260.9 | |
| Interest expense | | | 30.7 | | | | | | | | | | | | 7.1 | | | | | 37.8 | |
| Interest income | | | (26.0 | ) | | | | | | | | | | | | | | | | (26.0 | ) |
| Special items | | | 196.9 | | | | | | | | | | | | | | | | | 196.9 | |
| Total costs and expenses | | | 3,573.4 | | | | | | | | (0.2 | ) | | | 7.6 | | | | | 3,580.8 | |
| | | | | | | | | | | | | | | | | | | | | | |
| (Loss) income before taxes | | | (17.2 | ) | | | 4.9 | | | | 0.2 | | | | (7.6 | ) | | | | (19.7 | ) |
| Taxes on income | | | 38.1 | | | | 1.9 | | | | 0.1 | | | | (0.6 | ) | | | | 39.5 | |
| (Loss) income from continuing operations | | | (55.3 | ) | | | 3.0 | | | | 0.1 | | | | (7.0 | ) | | | | (59.2 | ) |
| Discontinued operations, net of taxes | | | | | | | | | | | | | | | | | | | | | |
| Cumulative effect of change in accounting principle, net of taxes | | | | | | | | | | | | | | | | | | | | | |
| Net (loss) income | | $ | (55.3 | ) | | $ | 3.0 | | | $ | 0.1 | | | $ | (7.0 | ) | | | $ | (59.2 | ) |
| | | | | | | | | | | | | | | | | | | | | | |
| Earnings per share: | | | | | | | | | | | | | | | | | | | | | |
| Continuing operations | | $ | (0.29 | ) | | $ | 0.02 | | | | | | | $ | (0.04 | ) | | | $ | (0.32 | ) |
| Discontinued operations | | | | | | | | | | | | | | | | | | | | | |
| Cumulative effect of change in accounting principle, net of taxes | | | | | | | | | | | | | | | | | | | | | |
| Basic* | | $ | (0.29 | ) | | $ | 0.02 | | | | | | | $ | (0.04 | ) | | | $ | (0.32 | ) |
| | | | | | | | | | | | | | | | | | | | | | |
| Continuing operations | | $ | (0.29 | ) | | $ | 0.02 | | | | | | | $ | (0.04 | ) | | | $ | (0.31 | ) |
| Discontinued operations | | | | | | | | | | | | | | | | | | | | | |
| Cumulative effect of change in accounting principle, net of taxes | | | | | | | | | | | | | | | | | | | | | |
| Diluted* | | $ | (0.29 | ) | | $ | 0.02 | | | | | | | $ | (0.04 | ) | | | $ | (0.31 | ) |
* Amounts may not add as a result of rounding.
The following table presents the effects of the adjustments made to the Company’s previously reported consolidated condensed statements of income for the three months ended September 29, 2006:
| | | Second Quarter Ended September 29, 2006 | |
| | | | | | Adjustments | | | |
| | | As Reported | | | Revenue Recognition | | Stock Options | | Income Tax | | Other | | As Restated | |
| | | | | | | | | | | | | | | |
| Revenues | | $ | 3,605.2 | | | $ | 3.9 | | | | | | | | $ | 3,609.1 | |
| | | | | | | | | | | | | | | | | | |
| Costs of services (excludes depreciation and amortization) | | | 2,896.4 | | | | | | | | | | | | | 2,896.4 | |
| Selling, general and administrative | | | 226.5 | | | | | | | | $ | 0.5 | | | | | 227.0 | |
| Depreciation and amortization | | | 266.3 | | | | | | | | | | | | | | 266.3 | |
| Interest expense | | | 38.3 | | | | | | | | | 7.1 | | | | | 45.4 | |
| Interest income | | | (7.5 | ) | | | | | | | | | | | | | (7.5 | ) |
| Special items | | | 41.0 | | | | | | | | | | | | | | 41.0 | |
| Total costs and expenses | | | 3,461.0 | | | | | | | | | 7.6 | | | | $ | 3,468.6 | |
| | | | | | | | | | | | | | | | | | | |
| Income before taxes | | | 144.2 | | | | 3.9 | | | | | (7.6 | ) | | | | 140.5 | |
| Taxes on income | | | 50.8 | | | | 1.5 | | | | | (0.5 | ) | | | | 51.8 | |
| (Loss) income from continuing operations | | | 93.4 | | | | 2.4 | | | | | (7.1 | ) | | | | 88.7 | |
| Discontinued operations, net of taxes | | | | | | | | | | | | | | | | | | |
| Cumulative effect of change in accounting principle, net of taxes | | | | | | | | | | | | | | | | | | |
| Net (loss) income | | $ | 93.4 | | | $ | 2.4 | | | | $ | (7.1 | ) | | | $ | 88.7 | |
| | | | | | | | | | | | | | | | | | | |
| Earnings per share: | | | | | | | | | | | | | | | | | | |
| Continuing operations | | $ | 0.54 | | | $ | 0.01 | | | | $ | (0.04 | ) | | | $ | 0.52 | |
| Discontinued operations | | | | | | | | | | | | | | | | | | |
| Cumulative effect of change in accounting principle, net of taxes | | | | | | | | | | | | | | | | | | |
| Basic* | | $ | 0.54 | | | $ | 0.01 | | | | $ | (0.04 | ) | | | $ | 0.52 | |
| | | | | | | | | | | | | | | | | | | |
| Continuing operations | | $ | 0.53 | | | $ | 0.01 | | | | $ | (0.04 | ) | | | $ | 0.51 | |
| Discontinued operations | | | | | | | | | | | | | | | | | | |
| Cumulative effect of change in accounting principle, net of taxes | | | | | | | | | | | | | | | | | | |
| Diluted* | | $ | 0.53 | | | $ | 0.01 | | | | $ | (0.04 | ) | | | $ | 0.51 | |
* Amounts may not add as a result of rounding.
The following table presents the effects of the adjustments made to the Company’s previously reported consolidated condensed statements of income for the three months ended December 29, 2006:
| | | Third Quarter Ended December 29, 2006 | |
| | | | | | Adjustments | | | |
| | | As Reported | | | Revenue Recognition | | Stock Options | | Income Tax | | Other | | As Restated | |
| | | | | | | | | | | | | | | |
| Revenues | | $ | 3,636.9 | | | $ | 3.7 | | | | | | | | $ | 3,640.6 | |
| | | | | | | | | | | | | | | | | | |
| Costs of services (excludes depreciation and amortization) | | | 2,903.1 | | | | | | | | | | | | | 2,903.1 | |
| Selling, general and administrative | | | 227.9 | | | | | | | | $ | .5 | | | | | 228.4 | |
| Depreciation and amortization | | | 262.0 | | | | | | | | | | | | | | 262.0 | |
| Interest expense | | | 38.4 | | | | | | | | | 7.1 | | | | | 45.5 | |
| Interest income | | | (8.4 | ) | | | | | | | | | | | | | (8.4 | ) |
| Special items | | | 42.0 | | | | | | | | | | | | | | 42.0 | |
| Total costs and expenses | | | 3,465.0 | | | | | | | | | 7.6 | | | | | 3,472.6 | |
| | | | | | | | | | | | | | | | | | | |
| Income before taxes | | | 171.9 | | | | 3.7 | | | | | (7.6 | ) | | | | 168.0 | |
| Taxes on income | | | 57.1 | | | | 1.5 | | | | | (0.2 | ) | | | | 58.4 | |
| (Loss) income from continuing operations | | | 114.8 | | | | 2.2 | | | | | (7.4 | ) | | | | 109.6 | |
| Discontinued operations, net of taxes | | | | | | | | | | | | | | | | | | |
| Cumulative effect of change in accounting principle, net of taxes | | | | | | | | | | | | | | | | | | |
| Net (loss) income | | $ | 114.8 | | | $ | 2.2 | | | | $ | (7.4 | ) | | | $ | 109.6 | |
| | | | | | | | | | | | | | | | | | | |
| Earnings per share: | | | | | | | | | | | | | | | | | | |
| Continuing operations | | $ | 0.67 | | | $ | 0.01 | | | | $ | (0.04 | ) | | | $ | 0.64 | |
| Discontinued operations | | | | | | | | | | | | | | | | | | |
| Cumulative effect of change in accounting principle, net of taxes | | | | | | | | | | | | | | | | | | |
| Basic* | | $ | 0.67 | | | $ | 0.01 | | | | $ | (0.04 | ) | | | $ | 0.64 | |
| | | | | | | | | | | | | | | | | | | |
| Continuing operations | | $ | 0.65 | | | $ | 0.01 | | | | $ | (0.04 | ) | | | $ | 0.62 | |
| Discontinued operations | | | | | | | | | | | | | | | | | | |
| Cumulative effect of change in accounting principle, net of taxes | | | | | | | | | | | | | | | | | | |
| Diluted* | | $ | 0.65 | | | $ | 0.01 | | | | $ | (0.04 | ) | | | $ | 0.62 | |
* Amounts may not add as a result of rounding.
The following table presents the effects of the restatement to the Company’s consolidated condensed balance sheet as of July 1, 2005:
| | | July 1, 2005 | |
| | | | | | Adjustments | | | | |
| | | As Reported | | | Revenue Recognition | | | Stock Options | | | Income Tax | | | Other | | | As Restated | |
| ASSETS | | | | | | | | | | | | | | | | | | |
| Cash and cash equivalents | | $ | 427.3 | | | | | | | | | | | | | | | $ | 427.3 | |
| Receivables | | | 3,722.9 | | | $ | (18.7 | ) | | | | | | | | | | | | 3,704.2 | |
| Prepaid expenses and other current assets | | | 1,157.8 | | | | | | | | | | | | | | | | | 1,157.8 | |
| Total current assets | | | 5,308.0 | | | | (18.7 | ) | | | | | | | | | | | | 5,289.3 | |
| Property and equipment, net | | | 2,368.7 | | | | | | | | | | | | | | | | | 2,368.7 | |
| Outsourcing contract costs, net | | | 1,288.5 | | | | | | | | | | | | | | | | | 1,288.5 | |
| Software, net | | | 459.4 | | | | | | | | | | | | | | | | | 459.4 | |
| Goodwill, net of accumulated amortization | | | 2,297.2 | | | | | | | | | | | | | | | | | 2,297.2 | |
| Other assets | | | 475.2 | | | | (32.7 | ) | | $ | 20.5 | | | $ | 4.0 | | | | | | | 467.0 | |
| Total assets | | $ | 12,197.0 | | | $ | (51.4 | ) | | $ | 20.5 | | | $ | 4.0 | | | | | | $ | 12,170.1 | |
| | | | | | | | | | | | | | | | | | | | | | | | |
| LIABILITIES | | | | | | | | | | | | | | | | | | | | | | | |
| Short-term debt and current maturities of long-term debt | | $ | 67.5 | | | | | | | | | | | | | | | | | | $ | 67.5 | |
| Accounts payable | | | 692.3 | | | | | | | | | | | | | | | | | | | 692.3 | |
| Accrued payroll and related costs | | | 716.8 | | | | | | | | | | | | | | | $ | 1.2 | | | | 718.0 | |
| Other accrued expenses | | | 1,296.1 | | | | | | | | | | | $ | 67.3 | | | | | | | | 1,363.4 | |
| Deferred revenue | | | 600.1 | | | $ | 7.1 | | | | | | | | | | | | | | | | 607.2 | |
| Federal, state, and foreign income taxes | | | 403.2 | | | | (23.1 | ) | | | | | | | 89.3 | | | | (.5 | ) | | | 468.9 | |
| Total current liabilities | | | 3,776.0 | | | | (16.0 | ) | | | | | | | 156.6 | | | | 0.7 | | | | 3,917.3 | |
| | | | | | | | | | | | | | | | | | | | | | | | | |
| Long-term debt, net | | | 1,301.6 | | | | | | | | | | | | | | | | | | | | 1,301.6 | |
| Other long-term liabilities | | | 924.4 | | | | | | | | | | | | 28.3 | | | | | | | | 952.7 | |
| | | | | | | | | | | | | | | | | | | | | | | | | |
| STOCKHOLDERS' EQUITY | | | | | | | | | | | | | | | | | | | | | | | | |
| Common stock, par value $1.00 per share; authorized 750,000,000 shares; issued 192,398,328 (2006) and 191,662,208 (2005) | | | 192.4 | | | | | | | | | | | | | | | | | | | | 192.4 | |
| Additional paid-in capital | | | 1,699.7 | | | | | | | | 65.6 | | | | | | | | (2.6 | ) | | | 1,762.7 | |
| Earnings retained for use in business | | | 4,539.7 | | | | (35.4 | ) | | | (45.1 | ) | | | (180.9 | ) | | | 1.9 | | | | 4,280.2 | |
| Accumulated other comprehensive income | | | 140.6 | | | | | | | | | | | | | | | | | | | | 140.6 | |
| | | | 6,572.4 | | | | (35.4 | ) | | | 20.5 | | | | (180.9 | ) | | | (0.7 | ) | | | 6,375.9 | |
| Less common stock in treasury, at cost, 7,652,138 shares (2006) and 455,242 shares (2005) | | | (347.0 | ) | | | | | | | | | | | | | | | | | | | (347.0 | ) |
| Unearned restricted stock | | | (30.4 | ) | | | | | | | | | | | | | | | | | | | (30.4 | ) |
| Total stockholders' equity | | | 6,195.0 | | | | (35.4 | ) | | | 20.5 | | | | (180.9 | ) | | | (0.7 | ) | | | 5,998.5 | |
| Total liabilities and stockholders' equity | | $ | 12,197.0 | | | $ | (51.4 | ) | | $ | 20.5 | | | $ | 4.0 | | | | | | | $ | 12,170.1 | |
The following table presents the effects of the restatement to the Company’s consolidated condensed balance sheet as of September 30, 2005:
| | | September 30, 2005 | |
| | | | | | Adjustments | | | | |
| | | As Reported | | | Revenue Recognition | | | Stock Options | | | Income Tax | | | Other | | | As Restated | |
| ASSETS | | | | | | | | | | | | | | | | | | |
| Cash and cash equivalents | | $ | 404.6 | | | | | | | | | | | | | | | $ | 404.6 | |
| Receivables | | | 3,724.1 | | | $ | (16.5 | ) | | | | | | | | | | | | 3,707.6 | |
| Prepaid expenses and other current assets | | | 1,305.1 | | | | | | | | | | | | | | | | | 1,305.1 | |
| Total current assets | | | 5,433.8 | | | | (16.5 | ) | | | | | | | | | | | | 5,417.3 | |
| Property and equipment, net | | | 2,359.6 | | | | | | | | | | | | | | | | | 2,359.6 | |
| Outsourcing contract costs, net | | | 1,196.7 | | | | | | | | | | | | | | | | | 1,196.7 | |
| Software, net | | | 467.1 | | | | | | | | | | | | | | | | | 467.1 | |
| Goodwill, net of accumulated amortization | | | 2,289.3 | | | | | | | | | | | | | | | | | 2,289.3 | |
| Other assets | | | 455.3 | | | | (28.9 | ) | | $ | 22.1 | | | $ | 3.6 | | | | | | | 452.1 | |
| Total assets | | $ | 12,201.8 | | | $ | (45.4 | ) | | $ | 22.1 | | | $ | 3.6 | | | | | | $ | 12,182.1 | |
| | | | | | | | | | | | | | | | | | | | | | | | |
| LIABILITIES | | | | | | | | | | | | | | | | | | | | | | | |
| Short-term debt and current maturities of long-term debt | | $ | 72.1 | | | | | | | | | | | | | | | | | | $ | 72.1 | |
| Accounts payable | | | 637.1 | | | | | | | | | | | | | | | | | | | 637.1 | |
| Accrued payroll and related costs | | | 625.6 | | | | | | | | | | | | | | | $ | 1.2 | | | | 626.8 | |
| Other accrued expenses | | | 1,268.6 | | | | | | | | | | | $ | 72.5 | | | | | | | | 1,341.1 | |
| Deferred revenue | | | 629.4 | | | $ | 6.5 | | | | | | | | | | | | | | | | 635.9 | |
| Federal, state, and foreign income taxes | | | 406.3 | | | | (20.5 | ) | | | | | | | 104.2 | | | | (0.5 | ) | | | 489.5 | |
| Total current liabilities | | | 3,639.1 | | | | (14.0 | ) | | | | | | | 176.7 | | | | 0.7 | | | | 3,802.5 | |
| | | | | | | | | | | | | | | | | | | | | | | | | |
| Long-term debt, net | | | 1,301.3 | | | | | | | | | | | | | | | | | | | | 1,301.3 | |
| Other long-term liabilities | | | 979.1 | | | | | | | | | | | | 29.0 | | | | | | | | 1,008.1 | |
| | | | | | | | | | | | | | | | | | | | | | | | | |
| STOCKHOLDERS' EQUITY | | | | | | | | | | | | | | | | | | | | | | | | |
| Common stock, par value $1.00 per share; authorized 750,000,000 shares; issued 192,631,751 (2006) and 191,662,208 (2005) | | | 192.6 | | | | | | | | | | | | | | | | | | | | 192.6 | |
| Additional paid-in capital | | | 1,708.3 | | | | | | | | 70.6 | | | | | | | | (2.6 | ) | | | 1,776.3 | |
| Earnings retained for use in business | | | 4,639.2 | | | | (31.4 | ) | | | (48.5 | ) | | | (202.1 | ) | | | 1.9 | | | | 4,359.1 | |
| Accumulated other comprehensive income | | | 117.6 | | | | | | | | | | | | | | | | | | | | 117.6 | |
| | | | 6,657.7 | | | | (31.4 | ) | | | 22.1 | | | | (202.1 | ) | | | (0.7 | ) | | | 6,445.6 | |
| Less common stock in treasury, at cost, 7,652,138 shares (2006) and 455,242 shares (2005) | | | (347.0 | ) | | | | | | | | | | | | | | | | | | | (347.0 | ) |
| Unearned restricted stock | | | (28.4 | ) | | | | | | | | | | | | | | | | | | | (28.4 | ) |
| Total stockholders' equity | | | 6,282.3 | | | | (31.4 | ) | | | 22.1 | | | | (202.1 | ) | | | (0.7 | ) | | | 6,070.2 | |
| Total liabilities and stockholders' equity | | $ | 12,201.8 | | | $ | (45.4 | ) | | $ | 22.1 | | | $ | 3.6 | | | | | | | $ | 12,182.1 | |
The following table presents the effects of the restatement to the Company’s consolidated condensed balance sheet as of December 30, 2005:
| | | December 30, 2005 | |
| | | | | | Adjustments | | | | |
| | | As Reported | | | Revenue Recognition | | | Stock Options | | | Income Tax | | | Other | | | As Restated | |
| ASSETS | | | | | | | | | | | | | | | | | | |
| Cash and cash equivalents | | $ | 773.2 | | | | | | | | | | | | | | | $ | 773.2 | |
| Receivables | | | 3,714.9 | | | $ | (16.0 | ) | | | | | | | | | | | | 3,698.9 | |
| Prepaid expenses and other current assets | | | 1,423.0 | | | | | | | | | | | | | | | | | 1,423.0 | |
| Total current assets | | | 5,911.1 | | | | (16.0 | ) | | | | | | | | | | | | 5,895.1 | |
| Property and equipment, net | | | 2,355.1 | | | | | | | | | | | | | | | | | 2,355.1 | |
| Outsourcing contract costs, net | | | 1,161.2 | | | | | | | | | | | | | | | | | 1,161.2 | |
| Software, net | | | 458.7 | | | | | | | | | | | | | | | | | 458.7 | |
| Goodwill, net of accumulated amortization | | | 2,293.2 | | | | | | | | | | | | | | | | | 2,293.2 | |
| Other assets | | | 444.5 | | | | (26.0 | ) | | $ | 23.3 | | | $ | 2.8 | | | | | | | 444.6 | |
| Total assets | | $ | 12,623.8 | | | $ | (42.0 | ) | | $ | 23.3 | | | $ | 2.8 | | | | | | $ | 12,607.9 | |
| | | | | | | | | | | | | | | | | | | | | | | | |
| LIABILITIES | | | | | | | | | | | | | | | | | | | | | | | |
| Short-term debt and current maturities of long-term debt | | $ | 115.3 | | | | | | | | | | | | | | | | | | $ | 115.3 | |
| Accounts payable | | | 615.3 | | | | | | | | | | | | | | | | | | | 615.3 | |
| Accrued payroll and related costs | | | 647.8 | | | | | | | | | | | | | | | $ | 1.2 | | | | 649.0 | |
| Other accrued expenses | | | 1,422.3 | | | | | | | | | | | $ | 77.9 | | | | | | | | 1,500.2 | |
| Deferred revenue | | | 647.1 | | | $ | 5.8 | | | | | | | | | | | | | | | | 652.9 | |
| Federal, state, and foreign income taxes | | | 494.2 | | | | (18.9 | ) | | | | | | | 122.4 | | | | (0.5 | ) | | | 597.2 | |
| Total current liabilities | | | 3,942.0 | | | | (13.1 | ) | | | | | | | 200.3 | | | | 0.7 | | | | 4,129.9 | |
| | | | | | | | | | | | | | | | | | | | | | | | | |
| Long-term debt, net | | | 1,321.6 | | | | | | | | | | | | | | | | | | | | 1,321.6 | |
| Other long-term liabilities | | | 851.9 | | | | | | | | | | | | 30.0 | | | | | | | | 881.9 | |
| | | | | | | | | | | | | | | | | | | | | | | | | |
| STOCKHOLDERS' EQUITY | | | | | | | | | | | | | | | | | | | | | | | | |
| Common stock, par value $1.00 per share; authorized 750,000,000 shares; issued 193,865,395 (2006) and 191,662,208 (2005) | | | 193.9 | | | | | | | | | | | | | | | | | | | | 193.9 | |
| Additional paid-in capital | | | 1,756.0 | | | | | | | | 77.5 | | | | | | | | (2.6 | ) | | | 1,830.9 | |
| Earnings retained for use in business | | | 4,842.7 | | | | (28.9 | ) | | | (54.2 | ) | | | (227.5 | ) | | | 1.9 | | | | 4,534.0 | |
| Accumulated other comprehensive income | | | 88.8 | | | | | | | | | | | | | | | | | | | | 88.8 | |
| | | | 6,881.4 | | | | (28.9 | ) | | | 23.3 | | | | (227.5 | ) | | | (0.7 | ) | | | 6,647.6 | |
| Less common stock in treasury, at cost, 7,652,657 shares (2006) and 455,242 shares (2005) | | | (347.1 | ) | | | | | | | | | | | | | | | | | | | (347.1 | ) |
| Unearned restricted stock | | | (26.0 | ) | | | | | | | | | | | | | | | | | | | (26.0 | ) |
| Total stockholders' equity | | | 6,508.3 | | | | (28.9 | ) | | | 23.3 | | | | (227.5 | ) | | | (0.7 | ) | | | 6,274.5 | |
| Total liabilities and stockholders' equity | | $ | 12,623.8 | | | $ | (42.0 | ) | | $ | 23.3 | | | $ | 2.8 | | | | | | | $ | 12,607.9 | |
The following table presents the effects of the restatement to the Company’s consolidated condensed balance sheet as of June 30, 2006:
| | | June 30, 2006 | |
| | | | | | Adjustments | | | | |
| | | As Reported | | | Revenue Recognition | | | Stock Options | | | Income Tax | | | Other | | | As Restated | |
| ASSETS | | | | | | | | | | | | | | | | | | |
| Cash and cash equivalents | | $ | 1,008.0 | | | | | | | | | | | | | | | $ | 1,008.0 | |
| Receivables | | | 4,012.9 | | | $ | (11.9 | ) | | | | | | | | | | | | 4,001.0 | |
| Prepaid expenses and other current assets | | | 1,250.2 | | | | | | | | | | | | | | | | | 1,250.2 | |
| Total current assets | | | 6,271.1 | | | | (11.9 | ) | | | | | | | | | | | | 6,259.2 | |
| Property and equipment, net | | | 2,392.9 | | | | | | | | | | | | | | | | | 2,392.9 | |
| Outsourcing contract costs, net | | | 1,116.6 | | | | | | | | | | | | | | | | | 1,116.6 | |
| Software, net | | | 455.8 | | | | | | | | | | | | | | | | | 455.8 | |
| Goodwill, net of accumulated amortization | | | 2,339.5 | | | | | | | | | | | | | | | | | 2,339.5 | |
| Other assets | | | 465.1 | | | | (18.3 | ) | | $ | 25.3 | | | $ | 4.2 | | | | | | | 476.3 | |
| Total assets | | $ | 13,041.0 | | | $ | (30.2 | ) | | $ | 25.3 | | | $ | 4.2 | | | | | | $ | 13,040.3 | |
| | | | | | | | | | | | | | | | | | | | | | | | |
| LIABILITIES | | | | | | | | | | | | | | | | | | | | | | | |
| Short-term debt and current maturities of long-term debt | | $ | 86.8 | | | | | | | | | | | | | | | | | | $ | 86.8 | |
| Accounts payable | | | 597.5 | | | | | | | | | | | | | | | | | | | 597.5 | |
| Accrued payroll and related costs | | | 750.1 | | | | | | | | | | | | | | | $ | 1.1 | | | | 751.2 | |
| Other accrued expenses | | | 1,933.6 | | | | | | | | | | | $ | 90.6 | | | | | | | | 2,024.2 | |
| Deferred revenue | | | 578.6 | | | $ | 4.7 | | | | | | | | | | | | | | | | 583.3 | |
| Federal, state, and foreign income taxes | | | 612.4 | | | | (13.8 | ) | | $ | 0.4 | | | | 156.6 | | | | (0.5 | ) | | | 755.1 | |
| Total current liabilities | | | 4,559.0 | | | | (9.1 | ) | | | 0.4 | | | | 247.2 | | | | 0.6 | | | | 4,798.1 | |
| | | | | | | | | | | | | | | | | | | | | | | | | |
| Long-term debt, net | | | 1,397.3 | | | | | | | | | | | | | | | | | | | | 1,397.3 | |
| Other long-term liabilities | | | 737.1 | | | | | | | | | | | | 31.2 | | | | | | | | 768.3 | |
| | | | | | | | | | | | | | | | | | | | | | | | | |
| STOCKHOLDERS' EQUITY | | | | | | | | | | | | | | | | | | | | | | | | |
| Common stock, par value $1.00 per share; authorized 750,000,000 shares; issued 186,459,540 (2007) and 194,904,250 (2006) | | | 186.5 | | | | | | | | | | | | | | | | | | | | 186.5 | |
| Additional paid-in capital | | | 1,753.3 | | | | | | | | 85.0 | | | | | | | | (2.7 | ) | | | 1,835.6 | |
| Earnings retained for use in business | | | 4,581.6 | | | | (21.1 | ) | | | (60.1 | ) | | | (274.2 | ) | | | 2.1 | | | | 4,228.3 | |
| Accumulated other comprehensive income | | | 175.3 | | | | | | | | | | | | | | | | | | | | 175.3 | |
| | | | 6,696.7 | | | | (21.1 | ) | | | 24.9 | | | | (274.2 | ) | | | (0.6 | ) | | | 6,425.7 | |
| Less common stock in treasury, at cost, 7,689,335 shares (2007) and 7,653,655 shares (2006) | | | (349.1 | ) | | | | | | | | | | | | | | | | | | | (349.1 | ) |
| Unearned restricted stock | | | | | | | | | | | | | | | | | | | | | | | | |
| Total stockholders' equity | | | 6,347.6 | | | | (21.1 | ) | | | 24.9 | | | | (274.2 | ) | | | (0.6 | ) | | | 6,076.6 | |
| Total liabilities and stockholders' equity | | $ | 13,041.0 | | | $ | (30.2 | ) | | $ | 25.3 | | | $ | 4.2 | | | | | | | $ | 13,040.3 | |
The following table presents the effects of the restatement to the Company’s consolidated condensed balance sheet as of September 29, 2006:
| | | September 29, 2006 | |
| | | | | | Adjustments | | | | |
| | | As Reported | | | Revenue Recognition | | | Income Tax | | | Other | | | As Restated | |
| ASSETS | | | | | | | | | | | | | | | |
| Cash and cash equivalents | | $ | 703.2 | | | | | | | | | | | | $ | 703.2 | |
| Receivables | | | 3,922.9 | | | $ | (10.6 | ) | | | | | | | | | 3,912.3 | |
| Prepaid expenses and other current assets | | | 1,388.7 | | | | | | | | | | | | | | 1,388.7 | |
| Total current assets | | | 6,014.8 | | | | (10.6 | ) | | | | | | | | | 6,004.2 | |
| Property and equipment, net | | | 2,404.5 | | | | | | | | | | | | | | 2,404.5 | |
| Outsourcing contract costs, net | | | 1,067.0 | | | | | | | | | | | | | | 1,067.0 | |
| Software, net | | | 456.0 | | | | | | | | | | | | | | 456.0 | |
| Goodwill, net of accumulated amortization | | | 2,369.6 | | | | | | | | | | | | | | 2,369.6 | |
| Other assets | | | 484.9 | | | | (16.2 | ) | | $ | 7.0 | | | | | | | 475.7 | |
| Total assets | | $ | 12,796.8 | | | $ | (26.8 | ) | | $ | 7.0 | | | | | | $ | 12,777.0 | |
| | | | | | | | | | | | | | | | | | | | |
| LIABILITIES | | | | | | | | | | | | | | | | | | | |
| Short-term debt and current maturities of long-term debt | | $ | 697.5 | | | | | | | | | | | | | | $ | 697.5 | |
| Accounts payable | | | 639.5 | | | | | | | | | | | | | | | 639.5 | |
| Accrued payroll and related costs | | | 611.3 | | | | | | | | | | | $ | 1.1 | | | | 612.4 | |
| Other accrued expenses | | | 1,415.5 | | | | | | | $ | 98.2 | | | | | | | | 1,513.7 | |
| Deferred revenue | | | 567.1 | | | $ | 4.1 | | | | | | | | | | | | 571.2 | |
| Federal, state, and foreign income taxes | | | 588.1 | | | | (12.2 | ) | | | 159.0 | | | | (0.5 | ) | | | 734.4 | |
| Total current liabilities | | | 4,519.0 | | | | (8.1 | ) | | | 257.2 | | | | 0.6 | | | | 4,768.7 | |
| | | | | | | | | | | | | | | | | | | | | |
| Long-term debt, net | | | 1,425.5 | | | | | | | | | | | | | | | | 1,425.5 | |
| Other long-term liabilities | | | 796.9 | | | | | | | | 31.1 | | | | | | | | 828.0 | |
| | | | | | | | | | | | | | | | | | | | | |
| STOCKHOLDERS' EQUITY | | | | | | | | | | | | | | | | | | | | |
| Common stock, par value $1.00 per share; authorized 750,000,000 shares; issued 186,459,540 (2007) and 194,904,250 (2006) | | | 179.7 | | | | | | | | | | | | | | | | 179.7 | |
| Additional paid-in capital | | | 1,800.9 | | | | | | | | | | | | (2.7 | ) | | | 1,798.2 | |
| Earnings retained for use in business | | | 4,189.2 | | | | (18.7 | ) | | | (281.3 | ) | | | 2.1 | | | | 3,891.3 | |
| Accumulated other comprehensive income | | | 236.6 | | | | | | | | | | | | | | | | 236.6 | |
| | | | 6,406.4 | | | | (18.7 | ) | | | (281.3 | ) | | | (0.6 | ) | | | 6,105.8 | |
| Less common stock in treasury, at cost, 7,689,335 shares (2007) and 7,653,655 shares (2006) | | | (351.0 | ) | | | | | | | | | | | | | | | (351.0 | ) |
| Unearned restricted stock | | | | | | | | | | | | | | | | | | | | |
| Total stockholders' equity | | | 6,055.4 | | | | (18.7 | ) | | | (281.3 | ) | | | (0.6 | ) | | | 5,754.8 | |
| Total liabilities and stockholders' equity | | $ | 12,796.8 | | | $ | (26.8 | ) | | $ | 7.0 | | | | | | | $ | 12,777.0 | |
The following table presents the effects of the restatement to the Company’s consolidated condensed balance sheet as of December 29, 2006:
| | | December 29, 2006 | |
| | | | | | Adjustments | | | | |
| | | As Reported | | | Revenue Recognition | | | Income Tax | | | Other | | | As Restated | |
| ASSETS | | | | | | | | | | | | | | | |
| Cash and cash equivalents | | $ | 726.0 | | | | | | | | | | | | $ | 726.0 | |
| Receivables | | | 3,960.7 | | | $ | (9.6 | ) | | | | | | | | | 3,951.1 | |
| Prepaid expenses and other current assets | | | 1,487.2 | | | | | | | | | | | | | | 1,487.2 | |
| Total current assets | | | 6,173.9 | | | | (9.6 | ) | | | | | | | | | 6,164.3 | |
| Property and equipment, net | | | 2,439.4 | | | | | | | | | | | | | | 2,439.4 | |
| Outsourcing contract costs, net | | | 1,047.4 | | | | | | | | | | | | | | 1,047.4 | |
| Software, net | | | 465.5 | | | | | | | | | | | | | | 465.5 | |
| Goodwill, net of accumulated amortization | | | 2,491.6 | | | | | | | | | | | | | | 2,491.6 | |
| Other assets | | | 502.9 | | | | (14.2 | ) | | $ | 9.9 | | | | | | | 498.6 | |
| Total assets | | $ | 13,120.7 | | | $ | (23.8 | ) | | $ | 9.9 | | | | | | $ | 13,106.8 | |
| | | | | | | | | | | | | | | | | | | | |
| LIABILITIES | | | | | | | | | | | | | | | | | | | |
| Short-term debt and current maturities of long-term debt | | $ | 587.1 | | | | | | | | | | | | | | $ | 587.1 | |
| Accounts payable | | | 552.9 | | | | | | | | | | | | | | | 552.9 | |
| Accrued payroll and related costs | | | 665.1 | | | | | | | | | | | $ | 1.1 | | | | 666.2 | |
| Other accrued expenses | | | 1,605.6 | | | | | | | $ | 105.8 | | | | | | | | 1,711.4 | |
| Deferred revenue | | | 589.0 | | | $ | 3.6 | | | | | | | | | | | | 592.6 | |
| Federal, state, and foreign income taxes | | | 617.0 | | | | (10.9 | ) | | | 161.7 | | | | (0.5 | ) | | | 767.3 | |
| Total current liabilities | | | 4,616.7 | | | | (7.3 | ) | | | 267.5 | | | | 0.6 | | | | 4,877.5 | |
| | | | | | | | | | | | | | | | | | | | | |
| Long-term debt, net | | | 1,421.8 | | | | | | | | | | | | | | | | 1,421.8 | |
| Other long-term liabilities | | | 804.8 | | | | | | | | 31.1 | | | | | | | | 835.9 | |
| | | | | | | | | | | | | | | | | | | | | |
| STOCKHOLDERS' EQUITY | | | | | | | | | | | | | | | | | | | | |
| Common stock, par value $1.00 per share; authorized 750,000,000 shares; issued 186,459,540 (2007) and 194,904,250 (2006) | | | 180.5 | | | | | | | | | | | | | | | | 180.5 | |
| Additional paid-in capital | | | 1,844.8 | | | | | | | | | | | | (2.6 | ) | | | 1,842.2 | |
| Earnings retained for use in business | | | 4,304.1 | | | | (16.5 | ) | | | (288.7 | ) | | | 2.0 | | | | 4,000.9 | |
| Accumulated other comprehensive income | | | 301.5 | | | | | | | | | | | | | | | | 301.5 | |
| | | | 6,630.9 | | | | (16.5 | ) | | | (288.7 | ) | | | (0.6 | ) | | | 6,325.1 | |
| Less common stock in treasury, at cost, 7,689,335 shares (2007) and 7,653,655 shares (2006) | | | (353.5 | ) | | | | | | | | | | | | | | | (353.5 | ) |
| Unearned restricted stock | | | | | | | | | | | | | | | | | | | | |
| Total stockholders' equity | | | 6,277.4 | | | | (16.5 | ) | | | (288.7 | ) | | | (0.6 | ) | | | 5,971.6 | |
| Total liabilities and stockholders' equity | | $ | 13,120.7 | | | $ | (23.8 | ) | | $ | 9.9 | | | | | | | $ | 13,106.8 | |
COMPUTER SCIENCES CORPORATION AND SUBSIDIARIES
SCHEDULE II, Valuation and Qualifying Accounts
Three Years Ended March 30, 2007
(Dollars in Millions)
| | | | | | Additions | | | | | | | |
In millions | | Balance, beginning of period | | | Charged to cost and expenses | | | Other (1) | | | Deductions | | | Balance, end of period | |
| Year ended March 30, 2007 | | | | | | | | | | | | | | | |
| Allowance for doubtful receivables | | $ | 68.4 | | | $ | 5.5 | | | $ | .1 | | | $ | 16.0 | | | $ | 58.0 | |
| Year ended March 31, 2006 | | | | | | | | | | | | | | | | | | | | |
| Allowance for doubtful receivables | | | 53.1 | | | | 28.7 | | | | 2.5 | | | | 15.9 | | | | 68.4 | |
| Year ended April 1, 2005 | | | | | | | | | | | | | | | | | | | | |
| Allowance for doubtful receivables | | | 49.4 | | | | 10.7 | | | | 5.8 | | | | 12.8 | | | | 53.1 | |
| (1) | Includes balances from acquisitions, changes in balances due to foreign currency exchange rates and recovery of prior-year charges. |
PART II (Continued)
Item 9. Changes in and Disagreements with Accountants on Accounting and Financial Disclosure
None.
Item 9A. Controls and Procedures Evaluation of Disclosure Controls and Procedures
“Disclosure controls and procedures” are the controls and other procedures of an issuer that are designed to ensure that information required to be disclosed by the issuer in the reports filed or submitted by it under the Securities Exchange Act of 1934, as amended (Exchange Act) is recorded, processed, summarized and reported, within the time periods specified in the Securities and Exchange Commission’s rules and forms. “Disclosure controls and procedures” include, without limitation, controls and procedures designed to ensure that information required to be disclosed by an issuer in its Exchange Act reports is accumulated and communicated to the issuer’s management, including its principal executive and financial officers, as appropriate to allow timely decisions regarding required disclosure.
The Company has completed the investigation of its stock option grant practices, as reported by the Company in the Form 8-K filed February 28, 2007 with the Securities and Exchange Commission. The investigation resulted in adjustments to the Company’s previously issued financial statements (refer to Note 2 to the consolidated financial statements included herein). The Company has concluded these adjustments resulted from control deficiencies which existed in prior years over the stock option grant process, but which the Company believes were remediated subsequent to December 29, 2006.
Under the direction of the Company’s Chief Executive Officer and Chief Financial Officer, the Company has evaluated the Company’s disclosure controls and procedures as of March 30, 2007. We have identified the following material weakness in our internal control over financial reporting: there are insufficient knowledgeable and competent personnel in certain key positions within the tax function and processes and procedures over accounting for income taxes are not adequate for the Company’s size and complexity. This material weakness and the resulting restatement are further discussed in the Management Report on Internal Control over Financial Reporting and in Note 2 to the consolidated financial statements. As a result of this material weakness, the Company has concluded that its disclosure controls and procedures were not effective as of March 30, 2007. See “Management Report on Internal Control over Financial Reporting” and “Report of Independent Registered Public Accounting Firm” on pages 49 and 50 through 52 of this Annual Report on Form 10-K.
Changes in Internal Controls
“Internal controls over financial reporting” is a process designed by, or under the supervision of, the issuer’s principal executive and financial officers, and effected by the issuer’s board of directors, management, and other personnel, to provide reasonable assurance regarding the reliability of financial reporting and the preparation of consolidated financial statements for external purposes in accordance with generally accepted accounting principles and includes those policies and procedures that:
(1) pertain to the maintenance of records that in reasonable detail accurately and fairly reflect the transactions and dispositions of the assets of the issuer;
(2) provide reasonable assurance that transactions are recorded as necessary to permit preparation of consolidated financial statements in accordance with generally accepted accounting principles, and that receipts and expenditures of the issuer are being made only in accordance with authorization of management and directors of the issuer; and
(3) provide reasonable assurance regarding prevention or timely detection of unauthorized acquisition, use or disposition of the issuer’s assets that could have a material effect on the consolidated financial statements.
There was no change in the Company’s internal control over financial reporting during the fiscal quarter ended March 30, 2007, that has materially affected, or is reasonably likely to materially affect, the Company’s internal control over financial reporting. The Company has initiated remediation measures to address the material weakness over the accounting for income taxes. These measures include recruitment of executive tax personnel, re-evaluation of the overall organization structure and reassignment of responsibilities within the function, recruitment of additional staff personnel with tax, accounting and financial reporting expertise and improvement in the tax provision process and the underlying procedures and internal controls.
Item 9B. Other Information
None.
PART III
Item 10. Directors and Executive Officers of the Registrant
Item 11. Executive Compensation
Item 12. Security Ownership of Certain Beneficial Owners and Management and Related Stockholder Matters
Item 13. Certain Relationships and Related Transactions
Item 14. Principal Accountant Fees and Services
Information regarding executive officers of the Company is included in Part I. For the other information called for by Items 10, 11, 12, 13 and 14 reference is made to the sections entitled “Stock Ownership,” “Proposal 1—Election of Directors” and “Executive Compensation” in the Registrant’s definitive Proxy Statement for its 2007 Annual Meeting of Stockholders, which will be filed with the Securities and Exchange Commission within 120 days after March 30, 2007. Such sections are incorporated herein by reference in their entirety, except for the material included in the “Executive Compensation” section under the captions “Compensation Committee Report” and “Stock Performance.”
PART IV
Item 15. Exhibits, and Financial Statement Schedule
(1) and (2) Consolidated Financial Statements and Financial Statement Schedule
These documents are included in the response to Item 8 of this report. See the index on page 48.
(3) Exhibits
The following exhibits are filed with this report:
Exhibit Number | | Description of Exhibit |
| 2.1 | | Agreement and Plan of Merger, dated as of April 25, 2007, by and among Computer Sciences Corporation, Surfside Acquisition Corp. and Covansys Corporation (incorporated by reference to Exhibit 10.1 to the Company’s Current Report on Form 8-K dated April 30, 2007) |
| 3.1 | | Restated Articles of Incorporation filed with the Nevada Secretary of State on June 11, 2003 (incorporated by reference to Exhibit 3.1 to the Company’s Annual Report on Form 10-K for the fiscal year ended March 28, 2003) |
| 3.2 | | Certificate of Amendment of Certificate of Designations of Series A Junior Participating Preferred Stock (incorporated by reference to Exhibit 3.2 to the Company’s Quarterly Report on Form 10-Q for the fiscal quarter ended October 3, 2003) |
| 3.3 | | Bylaws, amended and restated effective February 23, 2007 |
| 10.1 | | 1998 Stock Incentive Plan* (incorporated by reference to Exhibit 10.10 to the Company’s Quarterly Report on Form 10-Q for the fiscal quarter ended July 3, 1998) |
| 10.2 | | 2001 Stock Incentive Plan* (incorporated by reference to Appendix B to the Company’s Proxy Statement for the Annual Meeting of Stockholders held on August 13, 2001) |
| 10.3 | | Schedule to the 2001 Stock Incentive Plan for United Kingdom personnel* (incorporated by reference to Exhibit 10.12 to the Company’s Annual Report on form 10-K for the fiscal year ended April 2, 2004) |
| 10.4 | | 2004 Incentive Plan* (incorporated by reference to Appendix B to the Company’s Proxy Statement for the Annual Meeting of Stockholders held on August 9, 2004) |
| 10.5 | | Form of Stock Option Agreement for employees* (incorporated by reference to Exhibit 10.5 to the Company’s Quarterly Report on Form 10-Q for the fiscal quarter ended July 1, 2005) |
| 10.6 | | Form of Restricted Stock Agreements for employees (incorporated by reference to Exhibit 10.6 to the Company’s Quarterly Report on Form 10-Q for the fiscal quarter ended July 1, 2005) |
| 10.7 | | Form of Restricted Stock Unit Agreements for employees* (incorporated by reference to Exhibit 10.7 to the Company’s Quarterly Report on Form 10-Q for the fiscal quarter ended December 30, 2005) |
| 10.8 | | Annual Management Incentive Plan, effective April 2, 1983* (incorporated by reference to Exhibit X(i) to the Company’s Annual Report on Form 10-K for the fiscal year ended March 30, 1984) |
| 10.9 | | Form FY2006 Annual Management Incentive Plan 1 Worksheet* (incorporated by reference to Exhibit 10.8 to the Company’s Quarterly Report on Form 10-Q for the fiscal quarter ended July 1, 2005) |
| 10.10 | | Supplemental Executive Retirement Plan, amended and restated effective February 14, 2006* (incorporated by reference to Exhibit 10.1 to the Company’s Current Report on Form 8-K dated February 17, 2006) |
| 10.11 | | Deferred Compensation Plan, amended and restated effective January 1, 2005* (incorporated by reference to Exhibit 10.1 to the Company’s Report on Form 8-K dated December 6, 2005) |
| 10.12 | | Severance Plan for Senior Management and Key Employees, amended and restated effective January 1, 2005* (incorporated by reference to Exhibit 10.3 to the Company’s Report on Form 8-K dated December 6, 2005) |
Exhibit Number | | Description of Exhibit |
| 10.13 | | Severance Agreement with Van B. Honeycutt, effective February 2, 1998* (incorporated by reference to Exhibit 10.14 to the Company’s Quarterly Report on Form 10-Q for the fiscal quarter ended December 26, 1997) |
| 10.14 | | Employment Agreement with Van B. Honeycutt, effective May 1, 1999* (incorporated by reference to Exhibit 10.18 to the Company’s Annual Report on Form 10-K for the fiscal year ended April 2, 1999) |
| 10.15 | | Amendment of Employment Agreement with Van B. Honeycutt, effective February 3, 2003* (incorporated by reference to Exhibit 10.18 to the Company’s Quarterly Report on Form 10-Q for the quarter ended December 27, 2002) |
| 10.16 | | Amendment No. 2 to Employment Agreement with Van B. Honeycutt, effective December 5, 2005* (incorporated by reference to Exhibit 10.4 to the Company’s Current Report on Form 8-K dated December 6, 2005) |
| 10.17 | | Retirement Agreement with Van B. Honeycutt, effective May 21, 2007* (incorporated by reference to Exhibit 10.1 to the Company’s Current Report on Form 8-K dated May 25, 2007) |
| 10.18 | | Form of Indemnification Agreement for officers (incorporated by reference to Exhibit 10.17 to the Company’s Annual Report on Form 10-K for the fiscal year ended March 31, 1995) |
| 10.19 | | Form of Indemnification Agreement for directors (incorporated by reference to Exhibit X(xxvi) to the Company’s Annual Report on Form 10-K for the fiscal year ended April 1, 1988) |
| 10.20 | | 1997 Nonemployee Director Stock Incentive Plan (incorporated by reference to Appendix A to the Company’s Proxy Statement for the Annual Meeting of Stockholders held on August 11, 1997) |
| 10.21 | | 2006 Non-Employee Director Incentive Plan (incorporated by reference to Appendix B to the Company’s Proxy Statement for the Annual Meeting of Stockholders held on July 31, 2006 |
| 10.22 | | Form of Restricted Stock Unit Agreement for directors (incorporated by reference to Exhibit 10.18 to the Company’s Quarterly Report on Form 10-Q for the fiscal quarter ended July 1, 2005) |
| 10.23 | | Form of Amendment to Restricted Stock Unit Agreement with directors (incorporated by reference to Exhibit 10.5 to the Company’s Current Report on Form 8-K dated December 6, 2005) |
| 10.24 | | Rights Agreement dated February 18, 1998, as amended and restated effective February 7, 2005 (incorporated by reference to Exhibit 10.1 to the Company’s Current Report on Form 8-K filed on February 28, 2005) |
| 10.25 | | Credit Agreement dated as of August 23, 2006 (incorporated by reference to Exhibit 10.23 to the Company’s Quarterly Report on Form 10-Q for the fiscal quarter ended September 29, 2006) |
| 10.26 | | Accelerated Share Repurchase Transaction – VWAP Pricing Agreement and Supplemental confirmation dated June 29, 2006 between Goldman, Sachs & Co. and the Company (1) (incorporated by reference to Exhibit 10.24 to the Company’s Quarterly Report on Form 10-Q for the quarter ended June 30, 2006). |
| 10.27 | | Collared Accelerated Share Repurchase Transaction Agreement and Supplemental confirmation dated June 29, 2006 between Goldman, Sachs & Co. and the Company.(1) (incorporated by reference to Exhibit 10.25 to the Company’s Quarterly Report on Form 10-Q for the quarter ended June 30, 2006). |
| 21 | | Significant Active Subsidiaries and Affiliates of the Registrant |
| 23 | | Consent of Independent Registered Public Accounting Firm |
| 31.1 | | Section 302 Certification of the Chief Executive Officer |
| 31.2 | | Section 302 Certification of the Chief Financial Officer |
| 32.1 | | Section 906 Certification of the Chief Executive Officer |
| 32.2 | | Section 906 Certification of the Chief Financial Officer |
* Management contract or compensatory plan or agreement
(1) Confidential treatment has been requested pursuant to Rule 24b-2 under the Securities Exchange Act of 1934, as amended, for portions of this exhibit that contain confidential commercial and financial information.
SIGNATURES AND CERTIFICATIONS
Pursuant to the requirements of Section 13 or 15(d) of the Securities Exchange Act of 1934, the Registrant has duly caused this report to be signed on its behalf by the undersigned, thereunto duly authorized.
| | | |
| | COMPUTER SCIENCES CORPORATION |
| Dated: June 13, 2007 | | |
| | By: | /s/ Michael W. Laphen |
| | | Michael W. Laphen, Chief Executive Officer |
Pursuant to the requirements of the Securities Exchange Act of 1934, this report has been signed by the following persons on behalf of the Registrant and in the capacities and on the dates indicated.
| | | | | |
Signature | | Title | | Date |
| | | | | |
| | | | | |
/s/ MICHAEL W. LAPHEN
Michael W. Laphen | | Chief Executive Officer (Principal Executive Officer) | | June 13, 2007 |
| | | | | |
/s/ MICHAEL E. KEANE
Michael E. Keane | | Vice President, Chief Financial Officer (Principal Financial Officer) | | June 13 2007 |
| | | | | |
/s/ DONALD G. DEBUCK
Donald G. DeBuck | | Vice President and Controller (Principal Accounting Officer) | | June 13, 2007 |
| | | | | |
/s/ VAN B. HONEYCUTT
Van B. Honeycutt | | Chairman | | June 13, 2007 |
| | | | | |
/s/ IRVING W. BAILEY, II
Irving W. Bailey, II | | Director | | June 13, 2007 |
| | | | | |
/s/ DAVID J. BARRAM
David J. Barram | | Director | | June 13, 2007 |
| | | | | |
/s/ STEPHEN L. BAUM
Stephen L. Baum | | Director | | June 13, 2007 |
| | | | | |
/s/ RODNEY F. CHASE
Rodney F. Chase | | Director | | June 13, 2007 |
| | | | | |
/s/ F. WARREN MCFARLAN
F. Warren McFarlan | | Director | | June 13, 2007 |
| | | | | |
/s/ THOMAS H. PATRICK
Thomas H. Patrick | | Director | | June 13, 2007 |