Exhibit 99.1
Comtech Second Quarter Fiscal Year 2022 Shareholder Letter
Fellow Shareholders:
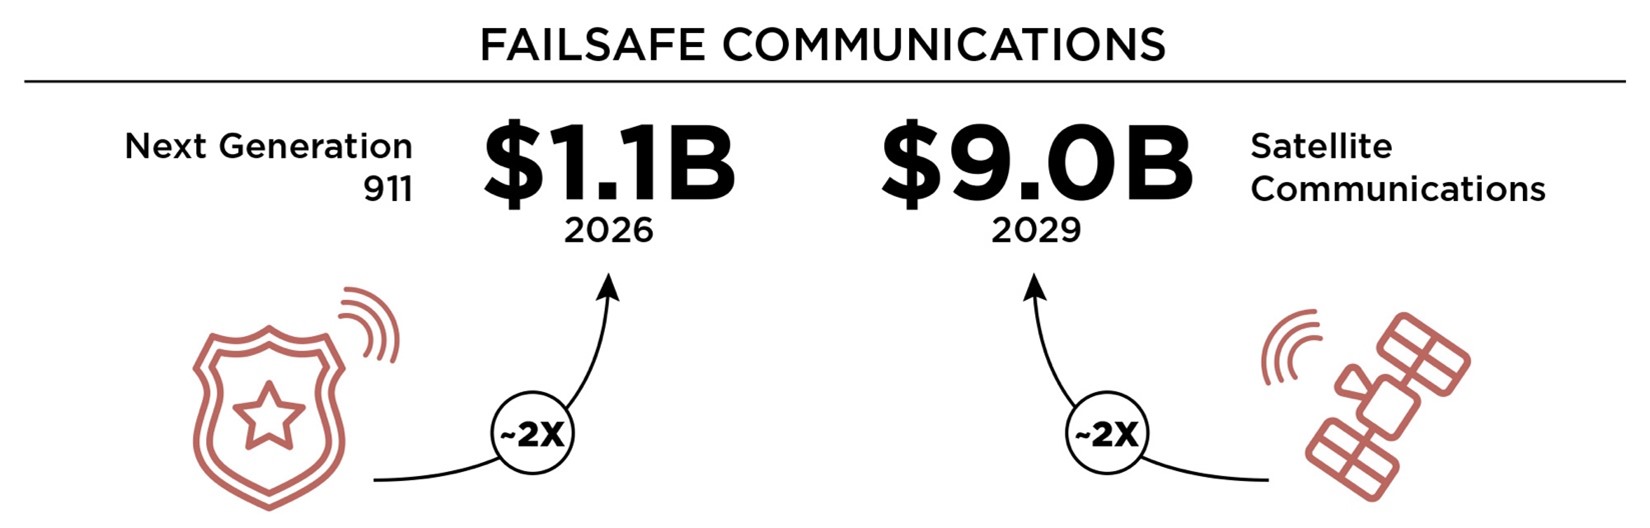
The second quarter of fiscal year 2022 was transformative for Comtech. I took on a new role as CEO, we welcomed new independent members to our Board of Directors, furthered plans to deploy the proceeds of our $100 million strategic growth investment, and continued to solidify our position as a leading solutions provider in our two key end-markets: 1) Next Generation 911 Public Safety and 2) Satellite and Space Communications. Both are at the beginning of a long-term investment and upgrade cycle and are expected to significantly grow over the next four and seven years, respectively.
We see these two end-markets as part of what Comtech will now call the “Failsafe Communications Market.” This market includes the critical communications infrastructure that people, businesses, and governments know they can rely on, no matter where they are – on land, at sea, or in the air – and no matter what’s going on outside – from armed conflict to natural disaster.
As defined in independent market studies and forecasts produced by NSR and Frost & Sullivan dated December 2020 and May 2021, respectively.
For more than 40 years, Comtech’s DNA was developing and manufacturing highly reliable communications equipment. As markets changed, so did Comtech. Our customers, who are Next Generation 911 (“NG-911”) and Public Safety providers, mobile network operators, governments and defense agencies and other enterprises, require communications and data transmission solutions that work every time, under the most demanding conditions. As such, over the past several years, our DNA has evolved to include more secure and sophisticated wireless technologies, cyber training, and public safety software solutions. With new leadership in place and added flexibility to invest significantly in our strategic initiatives, our company will continue evolving, confident in its ability to seize enormous opportunities ahead.
Comtech is a natural, dependable and highly valued partner. Our satellite network equipment enables broadband connectivity in underserved communities and geographies, by permitting our customers to leapfrog legacy network requirements and deliver robust data transmission anywhere on the globe.
Although we are optimistic about the future, we know that we face short-term challenges and continued uncertainties in the second half of our fiscal 2022.
The repercussions of the military conflict between Russia and Ukraine are significant. It has been said that war follows the Law of Unintended Consequences. Large-scale military engagements can profoundly dislocate political, economic and social conditions. They produce not only immediate change, but have the capacity to create extraordinary, and often unforeseen longer-term transformations.
For Comtech, the current conflict is directly impacting short-term elements of our sales pipelines. Certain customers have paused procurement and deployment of satellite and troposcatter communication systems, and instead began purchasing war-fighting equipment, such as anti-tank missiles and other “lethal equipment.” The U.S. defense budget, and defense budgets worldwide, are now being adjusted in real-time to reflect the priorities of war and changing European geopolitics.
Given the economic sanctions against Russia and the daily evolution of the situation on the ground, we are assuming no new sales in Russia for the remainder of fiscal 2022, which translates into roughly a $5.0 million reduction in order flow. We are actively hiring new employees to replace certain support activities previously conducted in Russia. In addition, we have asset exposure (primarily cash and accounts receivables) of approximately $1.5 million.
On the other hand, our experience suggests that Comtech will benefit from an up-tick in demand as conflict and uncertainties create new and different opportunities for the types of communication solutions we supply. Once rockets and missiles are purchased and deployed, communication equipment deployments usually follow. We are seeing this play out live right now, but the magnitude and timing of demand is not yet predictable.
And, like many other companies around the world, we are working around supply chain constraints that include component shortages and quality issues as well as delays. Additionally, we are dealing with inflation. Freight costs were already impacted by COVID-19 issues and higher oil prices have not helped. Component prices are up approximately 10% in the past several months and freight costs, in some cases, have doubled.
Finally, while we are a stronger and more powerful organization for it, we are only just emerging from a drawn-out proxy contest, and the distraction of an unsolicited acquisition offer. These events required time and focus from leadership and slowed strategic execution, while competitors used this short-term uncertainty to their advantage. We experienced a higher level of employee stress and turnover, some bookings and contract wins were delayed, and in some cases, we lost them.
Nevertheless, we are incredibly proud that despite the cumulative challenges Comtech faced during our second quarter of fiscal 2022, we achieved a solid quarter of financial performance that exceeded our bottom-line expectations.
Key Second Quarter 2022 Financial Highlights:
•Consolidated net sales were $120.4 million, up 3.1% sequentially from Q1 2022;
•GAAP net loss attributable to common stockholders was $23.5 million, and included $13.6 million of CEO leadership transition charges (of which $7.4 million related to amortization of stock-based awards) and $9.1 million related to our settled proxy contest;
•GAAP EPS loss of $0.89 and Non-GAAP EPS loss of $0.03;
•Adjusted EBITDA was $9.8 million, a 76.7% sequential increase from Q1 2022. Adjusted EBITDA and Non-GAAP EPS are Non-GAAP financial measures that are reconciled to the most directly comparable GAAP financial measure and are more fully defined in the Appendix below;
 2
2
•New bookings, also referred to as orders, were $102.9 million, a 19.2% sequential increase from Q1 2022, resulting in a quarterly book-to-bill ratio of 0.86x (a measure defined as bookings divided by net sales);
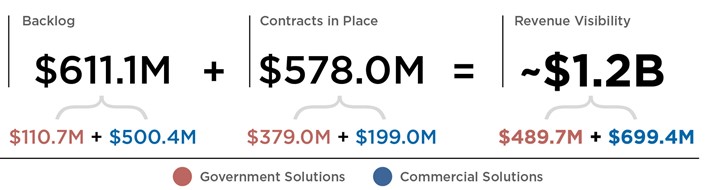
•Q2 2022 ending backlog was $611.1 million compared to $628.5 million as of the end of Q1 2022;
•Our revenue visibility is approximately $1.2 billion. We measure this revenue visibility as the sum of our $611.1 million backlog plus the total unfunded value of certain multi-year contracts that we have received and from which we expect future orders; and
•We generated $4.8 million of cash flows from operating activities despite making $2.8 million of cash payments for our settled proxy contest.
Additional discussion of our Q2 fiscal 2022 results including discussion of comparative amounts in Q2 fiscal 2021 is set forth below and in our Form 10-Q filed today with the Securities and Exchange Commission. Also, we have provided comparative condensed consolidated Statements of Operations and Balance Sheets in the Appendix to this letter. Our investor relations section at www.comtechtel.com (and our new web site coming soon at www.comtech.com) also contains an updated shareholder presentation.
Key Contract Wins
The following were ten key contract wins (including extensions and follow-on orders) awarded to us during Q2 fiscal 2022:
| | | | | |
$38.3M IN KEY WINS |
1.$7.4 Million Order for X-Band Satellite Ground Station Equipment for the U.S. Government 2.$5.1 Million of Ka-Band Amplifiers for a Trailer-based Satellite Communications Ground System 3.$4.7 Million of Contracts to Supply Amplifiers for an Electronic Warfare System 4.$4.4 Million of Mobile Satellite Equipment to the U.S. Army 5.$3.8 Million of Amplifiers for In-Flight Communication Applications 6.$3.2 Million Renewal for 911 Trusted LocationTM Software 7.$2.7 Million Contract to Deploy NG-911 Call Handling Software 8.$2.6 Million Contract to Deploy NG-911 Call Handling Software 9.$2.4 Million Order for Satellite Ground Station Equipment for an International Mobile Network Operator 10.$2.0 Million Order for High-Power Solid-State Amplifiers |
3
Product News
In January 2022, we announced the launch of our new very small aperture terminal (“VSAT”) platform, ELEVATE™, a scalable, reliable, software-defined satellite communications solution. ELEVATE™ enables our customers to create private VSAT networks of any size and topology, with infinite scalability. We are incredibly excited about ELEVATE™, as it will offer any user the opportunity to build data and communications networks with full functionality on land, at sea or in the air, using next-generation satellite constellations, that are completely private, fast and reliable.
The use cases for our ELEVATE™ technology span multiple industries because it works everywhere: aerospace, agriculture, land mobile, maritime, energy, and any other application or geography where a community, government or enterprise needs reliable, secure Failsafe Communications. In a future defined by the increasing proliferation of so-called “edge devices” comprising the Internet of Things, we believe ELEVATE™ will give Comtech – and our customers – a competitive edge.
In March 2022, we announced that our new SmartResponse™ solution is now compatible with the RapidSOS platform. SmartResponse™ is a cloud-native solution for emergency communications centers that combines the most accurate location data available with caller information, live traffic, weather, routing, points of interest, and Department of Transportation camera feeds into a single Common Operating Picture (“COP”). This product is being offered to our NG-911 Public Safety and Security customers, is data agnostic and can interface with any call handling or dispatch platforms through its use of flexible application programming interfaces (“APIs”). RapidSOS is an emergency response data platform that securely links life-saving data directly to emergency service providers and first responders. Together, these solutions arm emergency communication professionals with the most accurate information available, improving response times and performance in any situation.
Second Quarter 2022 Financial Discussion
In our December 9, 2021 earnings call, I discussed the reasons we believed fiscal 2022 was starting to shape up in-line with our expectations for our second quarter and fiscal 2022. Immediately following, the Omicron COVID-19 strain surged across Europe and the U.S, causing further delays in an already strained supply chain. Certain suppliers were forced to shut-down production and ceased deliveries of expected parts. Other parts, which did arrive, fell below our quality standards and we declined to use them. As a result, we were unable to get several million dollars of shipments out the door. Nevertheless, in line with our thinking at the time, our second quarter results showed improvements in sales, bookings, and Adjusted EBITDA versus Q1 fiscal 2022.
For Q2 fiscal 2022, we recorded $120.4 million of consolidated net sales, of which $81.3 million were reported in our Commercial Solutions Segment, and $39.1 million were reported in our Government Solutions Segment. Both segments reported slightly higher sales than achieved in Q1 fiscal 2022, but lower sales than Q2 of fiscal 2021.
Of the $120.4 million in consolidated net sales, 74.7% were to U.S. based customers (including 27.1% to the U.S. government) with the remaining 25.3% to international customers. Compared to the year ago quarter, our consolidated Q2 net revenues declined $40.9 million or a 25.4% drop, the large majority of which related to lower revenue from field support activities associated with the withdrawal of U.S. troops in Afghanistan and other program changes.
Gross margins were 38.1% reflecting an improvement from the 35.7% we achieved in the first quarter of fiscal 2022. This improvement related to a more favorable product mix, as well as lower than expected warranty costs in our NG-911 product line. Gross margins in Q2 2021 were 34.5%.
4
Our selling, general and administrative expenses (“SGA”) of $29.8 million, or 24.8% of sales, reflect tight labor markets and our decision to continue to invest in both existing and new talent. SGA costs also include $1.7 million of restructuring costs to move and streamline our operations. SGA expenses in Q2 2021 were $29.5 million or 18.3% of sales. We are actively seeking new engineers and software developers, as well as marketing and sales professionals, across every single one of our product lines. If you know of someone looking for an exciting place to work, please ask them to visit our job postings at LinkedIn and our new career pages at www.comtech.com.
While we have been judicious, we have been investing in our future and will continue to do so. This includes making significant capital expenditures and building out cloud-based computer networks to support our previously announced NG-911 contract wins for the states of Pennsylvania, South Carolina and Arizona.
We will also continue investments in capital equipment and building improvements in connection with the opening of a new 146,000 square-foot facility in Chandler, Arizona, and the establishment of a new 56,000 square-foot facility in Basingstoke, United Kingdom. Although COVID-19 and supply chain issues have extended our original build-out schedule, both manufacturing centers are expected to support production of next-generation broadband satellite technology and should be operational by early fiscal 2023. With respect to capital investments for these and other initiatives, we expect to spend approximately $30.0 million in fiscal 2022. In the first half of fiscal 2022, we have spent $8.8 million in property, plant and equipment.
On the R&D side, we continue to make long-term investments. R&D investments in Q2 2022 were $12.6 million or 10.5% of sales. Although it would be easy to improve short-term profits by delaying projects and/or reducing staffing, this would directly impair our ability to achieve our long-term business plan. R&D in Q2 2021 was $12.7 million or 7.9% of sales.
Operating loss in Q2 2022 was $24.6 million and includes charges of $24.8 million, including $13.6 million of CEO leadership transition costs (including $7.4 million of amortization of stock-based awards), $9.1 million related to our settled proxy contest, $1.7 million of restructuring costs and $0.4 million of COVID-19 incremental operating costs. As a result of these and other costs, our GAAP net loss attributable to common stockholders was $23.5 million and GAAP EPS was a loss of $0.89. Our GAAP results also reflect $5.3 million of amortization of intangibles, $2.3 million of depreciation expense, $2.0 million of amortization of stock-based compensation, and other costs such as interest and taxes.
We utilize a Non-GAAP measure we refer to as Adjusted EBITDA (see table of reconciliation below) as an additional measure of our results. During Q2 fiscal 2022, Adjusted EBITDA was $9.8 million, a 76.7% sequential increase. As a percentage of net sales, it was 8.1%, an improvement from the 4.7% we achieved in Q1 fiscal 2022. Our Q2 2022 Adjusted EBITDA does reflect a decrease from the $18.1 million (or 11.2% of sales) we achieved in Q2 2021. This decrease primarily reflects the impact of lower sales in our Government Solutions segment that were largely driven by significantly lower sales of global field support services and advanced VSAT products as a result of the U.S. government’s April 2021 decision to withdraw troops from Afghanistan, and other program changes.
5
Updated Fiscal 2022 Business Outlook and New Initiatives
First, the good news. We believe our combined sales pipeline and opportunities have never been stronger.
However, as I indicated above, the Russia/Ukraine military conflict and geopolitical uncertainty in Europe have created a new set of pressures. For us, we have specifically changed our expectations related to bookings and revenues associated with large orders for our Comtech COMET™ troposcatter systems that were originally going to be deployed in one European country, which we are now disclosing as Ukraine. As we discussed in our earnings call on December 9, 2021, this country had (and still has) an immediate need for wireless communication systems for defense and communications reasons. Comtech originally expected such orders to book and ship in the second half of fiscal 2022 and funding provided by the customer and the U.S. government. Despite ongoing and intense efforts to obtain immediate funding to deploy COMET™ and other satellite related systems, it has now become impossible for us to predict the funding, timing or amount of these awards for the remainder of fiscal 2022. Additionally, anticipated funding for other expected orders, including for our satellite and space communications products, has been shifted to other programs and/or temporarily delayed as a result of a change in defense spending priorities. The aggregate amount of the aforementioned items approximated $35.0 million and we are no longer including these opportunities in our updated fiscal 2022 consolidated net sales and Adjusted EBITDA targets.
As we thought about our adjusted targets for the second half fiscal 2022, we have tried to account for the impact of global supply chain disruptions on our customers and the possibility of extended purchase decision cycles or delays in execution. In some cases, we have depleted our stock inventory and are on a waiting list for components. Like many businesses, we anticipate that global supply chain constraints and COVID-19 pandemic aftershocks will continue to pressure our component availability and pricing, and impact logistics costs. These disruptions have and are expected to continue to affect our satellite and space communication customers as well as our NG-911 customers. We are assuming no new sales to Russia. As a result of these issues, we are no longer including approximately $35.0 million of revenue in our second half of fiscal 2022.
In light of these developments and resulting challenges, we have lowered our financial targets for fiscal 2022 as follows:
•We expect fiscal 2022 consolidated net sales to approximate $520.0 million.
•We expect Adjusted EBITDA to approximate $50.0 million or 9.6% of targeted net sales.
6
Financial performance during the second half of fiscal 2022 is still expected to improve versus the first half of fiscal 2022. Q3’s consolidated net sales and Adjusted EBITDA are expected to approximate $122.0 million and $10.0 million, respectively – with the remainder of our targeted fiscal 2022 consolidated net sales and Adjusted EBITDA occurring in Q4.
While reliable forecasting continues to remain a challenge, we do believe our targets for the second half are reasonable. Heading into the third quarter, we have approximately 85% and 50%, respectively, of our Q3 and Q4 targeted revenues in our backlog. If shipments from our backlog are delayed or we are unable to obtain expected orders or components to fulfill orders, we may not be able to achieve our financial targets.
Despite current market headwinds, we are excited to report several important initiatives in the second half of fiscal 2022.
Evaluating New Segment Reporting and Non-GAAP Metrics - We are evaluating a change in segment reporting, as we want to make sure our businesses and the way we present them to our customers and investors are aligned with the way the market itself is growing and changing, and the way I intend to lead Comtech. We are also reviewing use of Non-GAAP metrics, with a particular focus on the way we present Non-GAAP EPS. Some companies in our markets eliminate amortization of intangibles and stock-based compensation when calculating EPS. We historically have not. Several investors have informed us that this difference makes it difficult to compare our results to competitors and we are evaluating changing to this new Non-GAAP EPS metric.
Investments in New Talent and Social Marketing - During the second half of fiscal 2022, we expect to continue to invest in our brand, visibility, and people. This includes new social media activities, marketing and other initiatives that we believe will allow us to achieve our longer-term business goals. Part of investing in our future means continuing to invest in our employees and bringing on new talent. So far, we have welcomed a new Vice President of Human Resources and have active searches ongoing for new talent in other key areas around the company. I hope to announce some other exciting new hires shortly.
Building Out New Organizations to Serve our Satellite Ground Station Customers - As an organization, we are also ensuring that we have the appropriate structure to serve our end markets most effectively and for the long-term. This means a renewed focus on increasing company-wide collaboration to exploit emerging opportunities. It also has resulted in the creation of two new business units. Each of these units will have its own agile and nimble business structure, which together, will formalize and improve our ability to serve U.S. and other governments as a defense contractor and establish a major innovation center for Comtech’s growing VSAT platforms in Canada. This organizational shift, which was announced on January 27, 2022, is a prime example of how we are transforming our company to anticipate and meet the changing needs of our customers.
Despite challenging times and short-term issues that are driving our adjustment of second half fiscal 2022 targets, we believe that the fundamental demand drivers for our business have not changed. Our experience is that in our industry, near term disruptions created by geopolitical risks tend to be outweighed by the long-term demand those same risks create. Put simply, military conflicts and disruption – as unwelcomed as they are – tend to highlight the value, and necessity, of Failsafe Communications. More broadly, while we believe that market headwinds are temporary, we are encouraged that the secular demand drivers for Comtech’s technology solutions will remain intact for years to come.
7
Conclusion
Things are changing at Comtech… and this letter to shareholders is part of that change.
In the past, we have traditionally issued a quarterly earnings press release that summarized comparative financial results, highlighted a few contract wins and included a quote or two from management. As I took out my “blank” piece of paper, I thought this letter format might be a better way to communicate with our shareholder base and analysts, and provide prospective shareholders a quick way to learn more about us.
I also thought it provided a good forum to share insights into my thinking, and the way I intend to lead Comtech.
Although I am making no promises, I intend to keep to this letter format, though I am sure, along the way, I will make adjustments to form, content and presentation. And, in the spirit of engagement, communication, and transparency with our shareholders, I welcome any input you may have.
This is a unique and exhilarating time for Comtech. Our markets, our customers, and the technologies they need are all transforming, as governments and communities everywhere make significant investments in next-generation Failsafe Communications infrastructure. Comtech is transforming alongside them: with new leadership, significant investment capital for our strategic initiatives, and advanced technologies that we believe put us in a leadership position. We are optimistic as we look ahead to the balance of 2022 and beyond. Reflecting this confidence in our long-term business outlook, our Board of Directors again declared a dividend of $0.10 per common share payable on May 20, 2022, to shareholders of record at the close of business on April 20, 2022.
Finally, I want to thank our customers, employees and our shareholders for their continued support.
Sincerely,
Mike Porcelain
President and CEO
8
Conference Call Information
We have scheduled an investor conference call for 4:30 PM (ET) on Thursday, March 10, 2022. Investors and the public are invited to access a live webcast of the conference call from the Investor Relations section of the Comtech website at www.comtechtel.com. Investors can also access the webcast and preview its new web site coming soon at www.comtech.com. Alternatively, investors can access the conference call by dialing (800) 895-3361 (domestic), or (785) 424-1062 (international) and using the conference I.D. "Comtech." A replay of the conference call will be available for seven days by dialing (800) 839-2475 or (402) 220-7220.
About Comtech
Comtech Telecommunications Corp. is a leading global provider of next-generation 911 emergency systems and secure wireless communications technologies to commercial and government customers around the world. Headquartered in Melville, New York and with a passion for customer success, Comtech designs, produces and markets advanced and secure wireless solutions. For more information, please visit www.comtechtel.com (and preview our new web site coming soon at www.comtech.com).
Investor Contact
Comtech Investor Relations
Investors@comtech.com
(631) 962-7005
Appendix:
–Cautionary Statement Regarding Forward-Looking Statements
–Condensed Consolidated Statements of Operations (Unaudited)
–Condensed Consolidated Balance Sheets (Unaudited)
–Use of Non-GAAP Financial Measures
Cautionary Statement Regarding Forward-Looking Statements
Certain information in this shareholder letter contains forward-looking statements, including but not limited to, information relating to our future performance and financial condition, plans and objectives of our management and our assumptions regarding such future performance, financial condition, and plans and objectives that involve certain significant known and unknown risks and uncertainties and other factors not under our control which may cause our actual results, future performance and financial condition, and achievement of plans and objectives of our management to be materially different from the results, performance or other expectations implied by these forward-looking statements. These factors include, among other things: the possibility that the expected synergies and benefits from recent acquisitions will not be fully realized, or will not be realized within the anticipated time periods; the risk that the acquired businesses will not be integrated with Comtech successfully; the possibility of disruption from recent acquisitions, making it more difficult to maintain business and operational relationships or retain key personnel; the risk that Comtech will be unsuccessful in implementing a tactical shift in its Government Solutions segment away from bidding on large commodity service contracts and toward pursuing contracts for its niche products with higher margins; the nature and timing of receipt of, and our performance on, new or existing orders that can cause significant fluctuations in net sales and operating results; the timing and funding of government contracts; adjustments to gross profits on long-term contracts; risks associated with international sales; rapid technological change; evolving industry standards; new product announcements and enhancements; changing customer demands and or procurement strategies; changes in prevailing economic and political conditions, including as a result of Russia's military incursion into Ukraine; changes in the price of oil in global markets; changes in foreign currency exchange rates; risks associated with our legal proceedings, customer claims for indemnification, and other similar matters; risks associated with our obligations under its Credit Facility; risks associated with our large contracts; risks associated with the COVID-19 pandemic and related supply chain disruptions; and other factors described in this and our other filings with the Securities and Exchange Commission.
9
COMTECH TELECOMMUNICATIONS CORP. AND SUBSIDIARIES
Condensed Consolidated Statements of Operations
(Unaudited)
| | | | | | | | | | | | | | | | | | | | | | | | | | |
| | Three months ended January 31, | | Six months ended January 31, |
| | 2022 | | 2021 | | 2022 | | 2021 |
| Net sales | | $ | 120,381,000 | | | 161,292,000 | | | $ | 237,140,000 | | | 296,510,000 | |
| Cost of sales | | 74,523,000 | | | 105,612,000 | | | 149,547,000 | | | 190,622,000 | |
| Gross profit | | 45,858,000 | | | 55,680,000 | | | 87,593,000 | | | 105,888,000 | |
| | | | | | | | |
| Expenses: | | | | | | | | |
| Selling, general and administrative | | 29,827,000 | | | 29,462,000 | | | 58,069,000 | | | 57,002,000 | |
| Research and development | | 12,632,000 | | | 12,664,000 | | | 25,129,000 | | | 24,299,000 | |
| Amortization of intangibles | | 5,349,000 | | | 4,795,000 | | | 10,698,000 | | | 10,361,000 | |
| CEO transition costs | | 13,554,000 | | | — | | | 13,554,000 | | | — | |
| Proxy solicitation costs | | 9,086,000 | | | — | | | 11,248,000 | | | — | |
| Acquisition plan expenses | | — | | | 3,357,000 | | | — | | | 94,540,000 | |
| | | 70,448,000 | | | 50,278,000 | | | 118,698,000 | | | 186,202,000 | |
| | | | | | | | |
| Operating (loss) income | | (24,590,000) | | | 5,402,000 | | | (31,105,000) | | | (80,314,000) | |
| | | | | | | | |
| Other expenses (income): | | | | | | | | |
| Interest expense | | 988,000 | | | 1,418,000 | | | 2,595,000 | | | 3,715,000 | |
| Interest (income) and other | | (30,000) | | | (66,000) | | | 189,000 | | | — | |
Change in fair value of convertible
preferred stock purchase option liability | | (398,000) | | | — | | | (702,000) | | | — | |
| | | | | | | | |
| (Loss) income before benefit from income taxes | | (25,150,000) | | | 4,050,000 | | | (33,187,000) | | | (84,029,000) | |
| Benefit from income taxes | | (3,276,000) | | | (155,000) | | | (5,329,000) | | | (2,394,000) | |
| | | | | | | | |
| Net (loss) income | | $ | (21,874,000) | | | 4,205,000 | | | $ | (27,858,000) | | | (81,635,000) | |
| | | | | | | | |
| Adjustments to reflect redemption value of convertible preferred stock: | | | | | | | | |
| Convertible preferred stock issuance costs | | — | | | — | | | (4,007,000) | | | — | |
Establishment of initial convertible
preferred stock purchase option liability | | — | | | — | | | (1,005,000) | | | — | |
| Dividend on convertible preferred stock | | (1,632,000) | | | — | | | (1,867,000) | | | — | |
| Net (loss) income attributable to common stockholders | | $ | (23,506,000) | | | 4,205,000 | | | $ | (34,737,000) | | | (81,635,000) | |
| | | | | | | | |
| Net (loss) income per common share: | | | | | | | | |
| Basic | | $ | (0.89) | | | 0.17 | | | $ | (1.31) | | | (3.22) | |
| Diluted | | $ | (0.89) | | | 0.17 | | | $ | (1.31) | | | (3.22) | |
| | | | | | | | |
| Weighted average number of common shares outstanding – basic | | 26,472,000 | | | 25,337,000 | | | 26,449,000 | | | 25,321,000 | |
| | | | | | | | |
| Weighted average number of common and common equivalent shares outstanding – diluted | | 26,472,000 | | | 25,420,000 | | | 26,449,000 | | | 25,321,000 | |
| | | | | | | | |
10
COMTECH TELECOMMUNICATIONS CORP. AND SUBSIDIARIES
Condensed Consolidated Balance Sheets
(Unaudited)
| | | | | | | | | | | | |
| January 31, 2022 | | July 31, 2021 | |
| Assets | | | | |
| Current assets: | | | | |
| Cash and cash equivalents | $ | 30,918,000 | | | 30,861,000 | | |
| Accounts receivable, net | 138,767,000 | | | 158,110,000 | | |
| Inventories, net | 90,274,000 | | | 80,358,000 | | |
| Prepaid expenses and other current assets | 21,443,000 | | | 18,167,000 | | |
| Total current assets | 281,402,000 | | | 287,496,000 | | |
| Property, plant and equipment, net | 42,445,000 | | | 35,286,000 | | |
| Operating lease right-of-use assets, net | 54,328,000 | | | 44,486,000 | | |
| | | | |
| Goodwill | 347,692,000 | | | 347,698,000 | | |
| Intangibles with finite lives, net | 258,001,000 | | | 268,699,000 | | |
| Deferred financing costs, net | 1,419,000 | | | 1,824,000 | | |
| Other assets, net | 9,567,000 | | | 7,622,000 | | |
| Total assets | $ | 994,854,000 | | | 993,111,000 | | |
| Liabilities, Convertible Preferred Stock and Stockholders’ Equity | | | | |
| Current liabilities: | | | | |
| Accounts payable | $ | 32,550,000 | | | 36,193,000 | | |
| Accrued expenses and other current liabilities | 96,899,000 | | | 89,601,000 | | |
| Operating lease liabilities, current | 9,531,000 | | | 8,841,000 | | |
| Dividends payable | 2,640,000 | | | 2,601,000 | | |
| Contract liabilities | 77,732,000 | | | 66,130,000 | | |
| Interest payable | 138,000 | | | 195,000 | | |
| | | | |
| Total current liabilities | 219,490,000 | | | 203,561,000 | | |
| Non-current portion of long-term debt | 114,500,000 | | | 201,000,000 | | |
| Operating lease liabilities, non-current | 48,892,000 | | | 39,569,000 | | |
| Income taxes payable | 3,204,000 | | | 2,717,000 | | |
| Deferred tax liability, net | 19,248,000 | | | 21,230,000 | | |
| Long-term contract liabilities | 10,823,000 | | | 9,808,000 | | |
| Other liabilities | 8,966,000 | | | 14,507,000 | | |
| Total liabilities | 425,123,000 | | | 492,392,000 | | |
| Commitments and contingencies | | | | |
| Convertible preferred stock, par value $0.10 per share; authorized 125,000 shares; issued 100,000 at January 31, 2022 (includes accrued dividends of $549,000) | 101,867,000 | | | — | | |
| Stockholders’ equity: | | | | |
| Preferred stock, par value $0.10 per share; authorized and unissued 1,875,000 shares | — | | | — | | |
| Common stock, par value $0.10 per share; authorized 100,000,000 shares; issued 41,553,244 and 41,281,812 shares at January 31, 2022 and July 31, 2021, respectively | 4,155,000 | | | 4,128,000 | | |
| Additional paid-in capital | 612,780,000 | | | 605,439,000 | | |
| Retained earnings | 292,778,000 | | | 333,001,000 | | |
| 909,713,000 | | | 942,568,000 | | |
| Less: | | | | |
| Treasury stock, at cost (15,033,317 shares at January 31, 2022 and July 31, 2021) | (441,849,000) | | | (441,849,000) | | |
| Total stockholders’ equity | 467,864,000 | | | 500,719,000 | | |
| Total liabilities, convertible preferred stock and stockholders’ equity | $ | 994,854,000 | | | 993,111,000 | | |
11
Use of Non-GAAP Financial Measures
To provide investors with additional information regarding our financial results, this shareholder letter contains "Non-GAAP financial measures" under the rules of the SEC. Our Adjusted EBITDA is a Non-GAAP measure that represents earnings (loss) before income taxes, interest (income) and other, change in fair value of the convertible preferred stock purchase option liability, write-off of deferred financing costs, interest expense, amortization of stock-based compensation, amortization of intangibles, depreciation expense, estimated contract settlement costs, settlement of intellectual property litigation, acquisition plan expenses, restructuring costs, COVID-19 related costs, strategic emerging technology costs (for next-generation satellite technology), facility exit costs, CEO transition costs, proxy solicitation costs, strategic alternatives analysis expenses and other. Our definition of Adjusted EBITDA may differ from the definition of EBITDA or Adjusted EBITDA used by other companies and therefore may not be comparable to similarly titled measures used by other companies. Adjusted EBITDA is also a measure frequently requested by our investors and analysts. We believe that investors and analysts may use Adjusted EBITDA, along with other information contained in its SEC filings, in assessing our performance and comparability of its results with other companies. Our Non-GAAP measures reflect the GAAP measures as reported, adjusted for certain items as described below and also excludes the effects of our outstanding convertible preferred stock. These Non-GAAP financial measures have limitations as an analytical tool as they exclude the financial impact of transactions necessary to conduct our business, such as the granting of equity compensation awards, and are not intended to be an alternative to financial measures prepared in accordance with GAAP. These measures are adjusted as described in the reconciliation of GAAP to Non-GAAP in the tables below, but these adjustments should not be construed as an inference that all of these adjustments or costs are unusual, infrequent or non-recurring. Non-GAAP financial measures should be considered in addition to, and not as a substitute for or superior to, financial measures determined in accordance with GAAP. Investors are advised to carefully review the GAAP financial results that are disclosed in our SEC filings. We have not quantitatively reconciled our fiscal 2022 Adjusted EBITDA target to the most directly comparable GAAP measure because items such as stock-based compensation, adjustments to the provision for income taxes, amortization of intangibles and interest expense, which are specific items that impact these measures, have not yet occurred, are out of our control, or cannot be predicted. For example, quantification of stock-based compensation expense requires inputs such as the number of shares granted and market price that are not currently ascertainable. Accordingly, reconciliations to the Non-GAAP forward looking metrics are not available without unreasonable effort and such unavailable reconciling items could significantly impact our financial results.
| | | | | | | | | | | | | | | | | | | | | | | | | | | | | |
| Three months ended | | Six months ended | | Fiscal |
| January 31, | | January 31, | | Year |
| 2022 | | 2021 | | 2022 | | 2021 | | 2021 |
| Reconciliation of GAAP Net (Loss) Income to Adjusted EBITDA: | | | | | | | | | |
| Net (loss) income | $ | (21,874,000) | | | 4,205,000 | | | $ | (27,858,000) | | | (81,635,000) | | | $ | (73,480,000) | |
| Benefit from income taxes | (3,276,000) | | | (155,000) | | | (5,329,000) | | | (2,394,000) | | | (1,500,000) | |
| Interest (income) and other | (30,000) | | | (66,000) | | | 189,000 | | | — | | | (139,000) | |
| Change in fair value of convertible preferred stock purchase option liability | (398,000) | | | — | | | (702,000) | | | — | | | — | |
| Interest expense | 988,000 | | | 1,418,000 | | | 2,595,000 | | | 3,715,000 | | | 6,821,000 | |
| Amortization of stock-based compensation | 1,983,000 | | | 1,287,000 | | | 2,904,000 | | | 1,986,000 | | | 9,983,000 | |
| Amortization of intangibles | 5,349,000 | | | 4,795,000 | | | 10,698,000 | | | 10,361,000 | | | 21,020,000 | |
| Depreciation | 2,334,000 | | | 2,457,000 | | | 4,575,000 | | | 5,009,000 | | | 9,379,000 | |
| Acquisition plan expenses | — | | | 3,357,000 | | | — | | | 94,540,000 | | | 100,292,000 | |
| CEO transition costs | 13,554,000 | | | — | | | 13,554,000 | | | — | | | — | |
| Proxy solicitation costs | 9,086,000 | | | — | | | 11,248,000 | | | — | | | — | |
| Restructuring costs | 1,726,000 | | | 601,000 | | | 2,438,000 | | | 601,000 | | | 2,782,000 | |
| COVID-19 related costs | 355,000 | | | 160,000 | | | 1,029,000 | | | 160,000 | | | 1,046,000 | |
| Strategic emerging technology costs | — | | | — | | | — | | | — | | | 315,000 | |
| Adjusted EBITDA | $ | 9,797,000 | | | 18,059,000 | | | $ | 15,341,000 | | | 32,343,000 | | | $ | 76,519,000 | |
| | | | | | | | | |
12
Reconciliations of Comtech's GAAP consolidated operating (loss) income, net (loss) income attributable to common stockholders and net (loss) income per diluted common share to the corresponding Non-GAAP measures are shown in the tables below. Non-GAAP net (loss) income attributable to common stockholders and Non-GAAP EPS reflect Non-GAAP provisions for income taxes based on year-to-date results, as adjusted for the Non-GAAP reconciling items included in the tables below. We evaluate our Non-GAAP effective income tax rate on an ongoing basis, and it can change from time to time. Our Non-GAAP effective income tax rate can differ materially from its GAAP effective income tax rate.
| | | | | | | | | | | | | | | | | | | | | | | | | | | | | | | | | | | | | | | | | | | | | | |
| January 31, 2022 | | | | | | | | | | | |
| Three months ended | | Six months ended | | | | | | | |
| Operating
(Loss)
Income | | Net Loss Attributable to Common Stockholders | | Net Loss per Diluted Common Share* | | Operating
Loss | | Net Loss Attributable to Common Stockholders | | Net Loss per Diluted Common Share* | | | | | | | | | | | |
| Reconciliation of GAAP to Non-GAAP Earnings: | | | | | | | | | | | | | | | | | | | | | | |
| GAAP measures, as reported | $ | (24,590,000) | | | $ | (23,506,000) | | | $ | (0.89) | | | $ | (31,105,000) | | | $ | (34,737,000) | | | $ | (1.31) | | | | | | | | | | | | |
| Adjustments to reflect redemption value of convertible preferred stock | — | | | 1,632,000 | | | 0.06 | | | — | | | 6,879,000 | | | 0.26 | | | | | | | | | | | | |
| CEO transition costs | 13,554,000 | | | 12,959,000 | | | 0.49 | | | 13,554,000 | | | 12,959,000 | | | 0.49 | | | | | | | | | | | | |
| Proxy solicitation costs | 9,086,000 | | | 7,026,000 | | | 0.27 | | | 11,248,000 | | | 8,671,000 | | | 0.33 | | | | | | | | | | | | |
| | | | | | | | | | | | | | | | | | | | | | |
| | | | | | | | | | | | | | | | | | | | | | |
| Restructuring costs | 1,726,000 | | | 1,427,000 | | | 0.05 | | | 2,438,000 | | | 1,975,000 | | | 0.07 | | | | | | | | | | | | |
| COVID-19 related costs | 355,000 | | | 302,000 | | | 0.01 | | | 1,029,000 | | | 807,000 | | | 0.03 | | | | | | | | | | | | |
| Change in fair value of convertible preferred stock purchase option liability | — | | | (398,000) | | | (0.02) | | | — | | | (702,000) | | | (0.03) | | | | | | | | | | | | |
| | | | | | | | | | | | | | | | | | | | | | |
| | | | | | | | | | | | | | | | | | | | | | |
| Net discrete tax benefit | — | | | (136,000) | | | (0.01) | | | — | | | (501,000) | | | (0.02) | | | | | | | | | | | | |
| Non-GAAP measures | $ | 131,000 | | | $ | (694,000) | | | $ | (0.03) | | | $ | (2,836,000) | | | $ | (4,649,000) | | | $ | (0.18) | | | | | | | | | | | | |
| | | | | | | | | | | | | | | | | | | | | | |
| January 31, 2021 | | | | | | | | | | | |
| Three months ended | | Six months ended | | | | | | | | | | | |
| Operating Income | | Net Income | | Net Income per Diluted Share* | | Operating
(Loss) Income | | Net (Loss) Income | | Net (Loss) Income per Diluted Share* | | | | | | | | | | | |
| Reconciliation of GAAP to Non-GAAP Earnings: | | | | | | | | | | | | | | | | | | | | | | |
| GAAP measures, as reported | $ | 5,402,000 | | | $ | 4,205,000 | | | $ | 0.17 | | | $ | (80,314,000) | | | $ | (81,635,000) | | | $ | (3.22) | | | | | | | | | | | | |
| | | | | | | | | | | | | | | | | | | | | | |
| Acquisition plan expenses | 3,357,000 | | | 2,786,000 | | | 0.11 | | | 94,540,000 | | | 90,368,000 | | | 3.56 | | | | | | | | | | | | |
| | | | | | | | | | | | | | | | | | | | | | |
| Restructuring costs | 601,000 | | | 499,000 | | | 0.02 | | | 601,000 | | | 499,000 | | | 0.02 | | | | | | | | | | | | |
| COVID-19 related costs | 160,000 | | | 133,000 | | | 0.01 | | | 160,000 | | | 133,000 | | | 0.01 | | | | | | | | | | | | |
| Interest expense | — | | | — | | | — | | | — | | | 978,000 | | | 0.04 | | | | | | | | | | | | |
| Net discrete tax benefit | — | | | (843,000) | | | (0.03) | | | — | | | (9,000) | | | — | | | | | | | | | | | | |
| Non-GAAP measures | $ | 9,520,000 | | | $ | 6,780,000 | | | $ | 0.27 | | | $ | 14,987,000 | | | $ | 10,334,000 | | | $ | 0.41 | | | | | | | | | | | | |
13
| | | | | | | | | | | | | | | | | | | | | | | |
| Fiscal Year 2021 | | |
| Operating (Loss) Income | | Net (Loss) Income | | Net (Loss) Income per Diluted Share* | | | | | | |
| Reconciliation of GAAP to Non-GAAP Earnings: | | | | | | | | | | | |
| GAAP measures, as reported | $ | (68,298,000) | | | $ | (73,480,000) | | | $ | (2.86) | | | | | | | |
| Acquisition plan expenses | 100,292,000 | | | 93,273,000 | | | 3.60 | | | | | | | |
| | | | | | | | | | | |
| | | | | | | | | | | |
| Restructuring costs | 2,782,000 | | | 2,132,000 | | | 0.08 | | | | | | | |
| COVID-19 related costs | 1,046,000 | | | 847,000 | | | 0.03 | | | | | | | |
| Strategic emerging technology costs | 315,000 | | | 255,000 | | | 0.01 | | | | | | | |
| Interest expense | — | | | 910,000 | | | 0.04 | | | | | | | |
| Net discrete tax benefit | — | | | (1,575,000) | | | (0.06) | | | | | | | |
| Non-GAAP measures | $ | 36,137,000 | | | $ | 22,362,000 | | | $ | 0.86 | | | | | | | |
* Per share amounts may not foot due to rounding. In addition, due to the GAAP net loss for the respective periods, Non-GAAP EPS for: the six months ended January 31, 2021 was computed using 25,365,000 weighted average diluted shares outstanding; and the fiscal year ended July 31, 2021 was computed using 25,885,000 weighted average diluted shares outstanding.
ECMTL
###
14