Exhibit 99.1
Comtech Third Quarter Fiscal Year 2022 Shareholder Letter
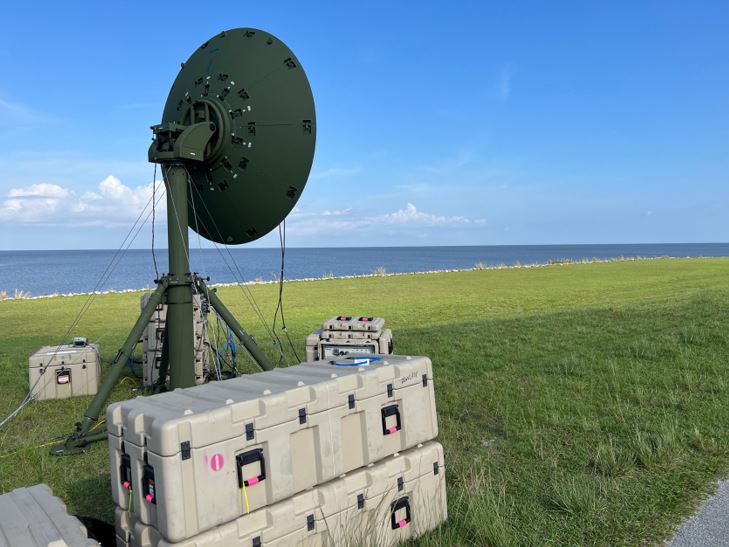
Picture of Comtech’s Next-Generation Troposcatter System at a May 2022 demonstration for the U.S. Army and Allied Nations.
Fellow Shareholders:
Despite an operating environment that remains both challenging and unpredictable, Comtech delivered financial results for our third quarter ended April 30, 2022, that were ahead of our expectations. This was the second straight quarter in which we exceeded our bottom-line expectations and showed sequential quarterly revenue and Adjusted EBITDA growth.
Five months in as CEO, I can relay that we are making demonstrable progress against several initiatives vital to the Company’s future success. These strategic initiatives include: expanding our talent pool to bring fresh ideas, take advantage of our market leading positions to capitalize on new multi-year investment cycles, increasing company-wide collaboration to exploit emerging opportunities and refreshing our corporate branding (including evaluation of new segment reporting). We are also assessing our product lines and reviewing M&A opportunities to establish strategic priorities and determine appropriate capital allocation.
Our team is energized by the exciting trends and opportunities visible in our core markets, and we believe Comtech’s technologies and customer relationships position us to capitalize on them. Of course, there is much work to be done, and we will continue to provide you with meaningful and candid updates on our progress each quarter.
While the long-term prospects for our business are strong, the near-term economic environment promises to be challenging. Elon Musk isn’t the only person with a “super bad feeling” about the economy. Additionally, Jamie Dimon’s warning that a “hurricane is right out there down the road coming our way” may prove to be true. I too, feel that the economic backdrop is more uncertain than it was earlier in our fiscal year ---- as a result ---- I am adjusting our Q4 and fiscal 2022 targets.
Right now, the business challenges we face are a combination of near-term supply side constraints and timing issues rather than softening demand. In fact, and as I’ll talk about later, given the opportunity funnel, our initiatives are setting the stage for sustainable multi-year growth. Before I talk about outlook and strategic initiatives in more detail, let me discuss some of the key results for FYQ3 2022 and our updated FYQ4 and fiscal 2022 guidance.
Overview of Key Results:
Our financial highlights for the quarter include:
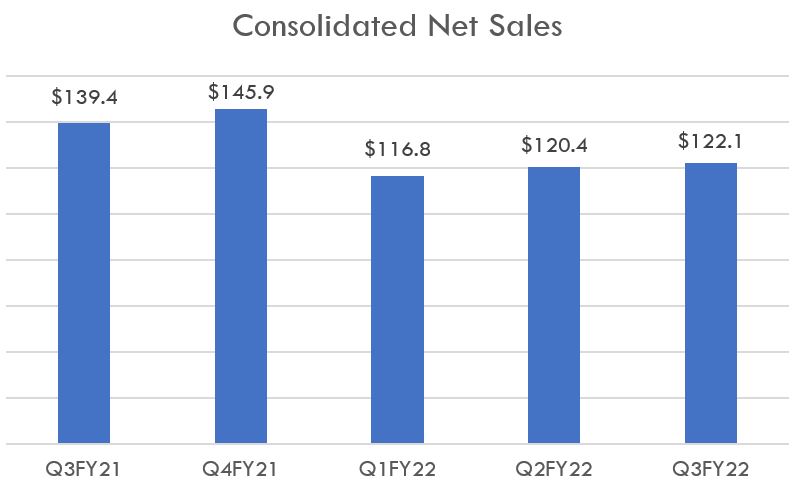
•Consolidated net sales were $122.1 million, up 1.4% sequentially from Q2 2022;
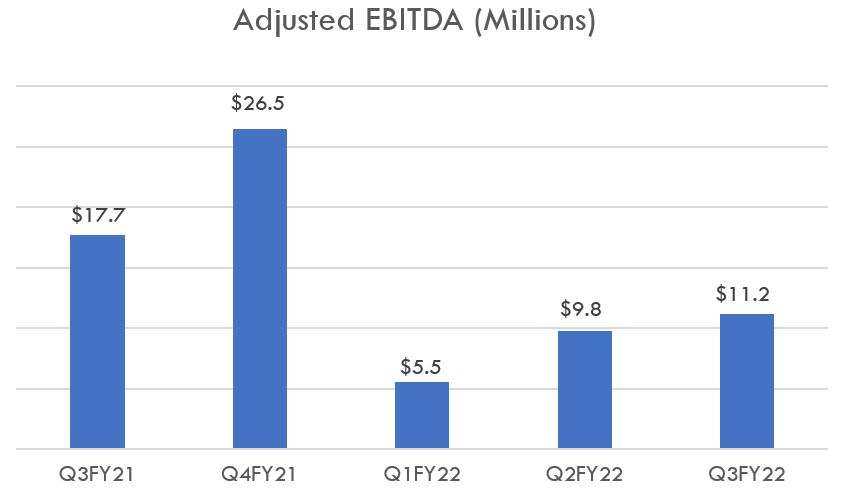
•Adjusted EBITDA1 (a Non-GAAP financial measure discussed below) of $11.2 million, a 14.3% sequential increase;
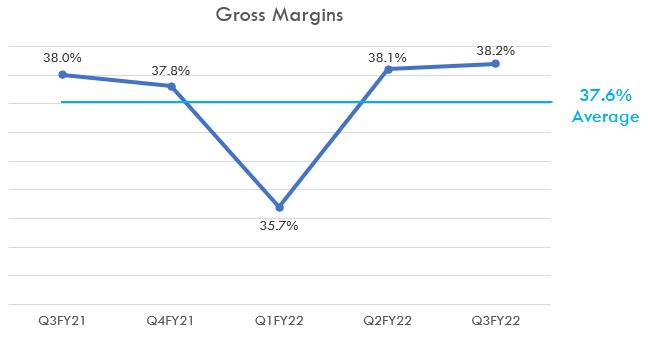
•Gross margins improved sequentially ten basis points to 38.2%;
•GAAP net loss attributable to common stockholders was $1.7 million, and included $0.9 million of strategic emerging technology costs for next-generation satellite technology, as discussed below;
•GAAP EPS loss of $0.06 and Non-GAAP EPS income of $0.06;
•New bookings, also referred to as orders, were $113.4 million, a 10.2% sequential increase and resulting in a quarterly book-to-bill ratio of 0.93x;
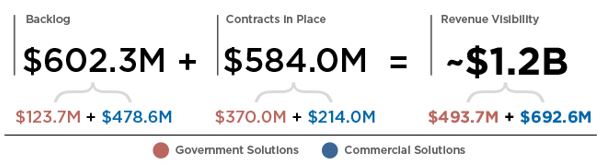
•Backlog of $602.3 million as of April 30, 2022, as compared to $611.1 million as of January 31, 2022;
•Revenue visibility of approximately $1.2 billion (the sum of our $602.3 million backlog plus the total unfunded value of certain multi-year contracts that we have received and for which we have a high confidence of expected future orders); and
•Cash flows used in operating activities of $1.1 million (excluding $10.6 million in aggregate payments for our former CEO transition and settled proxy contest, cash inflow from operating activities would have been $9.5 million for Q3 2022).
Updated Fiscal 2022 Business Outlook:
We, like businesses everywhere, continue to confront one of the most difficult operating environments in memory, as the global economy struggles to find its footing amidst a pandemic, geopolitical conflict, surging inflationary pressures, changes in government spending priorities, and worsening supply chain disruptions. Simply, this is a genuinely tough environment in which to do business.
Given market conditions and near-term uncertainties, I have become more cautious with regards to our outlook and are adjusting our financial targets for fiscal 2022 as follows:
•Q4 fiscal 2022 net sales are expected to approximate $123.0 million resulting in expected fiscal 2022 consolidated net sales of approximately $482.0 million; and
•Q4 fiscal 2022 Adjusted EBITDA is expected to approximate $11.5 million resulting in expected fiscal 2022 Adjusted EBITDA of approximately $38.0 million.
This updated guidance reflects incremental research and development expenses and the removal of several identified and viable opportunities in both our Commercial Solutions and Government Solutions segments that we no longer expect to occur in Q4.
In the Commercial Solutions segment, two NG-911 opportunities which we expected to generate bookings and revenue in fiscal 2022, are now in holding patterns. The larger of these opportunities relates to a signed contract to deploy a state-wide NG-911 system for the state of Ohio. The second opportunity is for initial work for a smaller NG-911 infrastructure project in the southwest. In the case of Ohio, it was originally expected to be funded during Q4 but the legislative vote to do so is now expected to occur in the Fall 2022. Although a vote for the smaller opportunity may occur soon, it has been delayed several times already, and it doesn’t seem prudent to expect that contract to be finalized in our Q4.
Additionally, supply chain constraints remain a challenge. Inflation is now a significant issue on several fronts.
1 Adjusted EBITDA is a Non-GAAP financial measure that is reconciled to the most directly comparable GAAP financial measure and more fully defined in the Appendix
Unpredictable cost shifts, whether from logistics, component pricing, or even the availability of professionals with the skills we require, create situations where we may need to delay or renegotiate contracts to pass along costs, or in some cases, exit them (which may sound extreme, but we will be disciplined to avoid taking a loss on bookings). Inflation remains a big concern and, in some cases, we are seeing price increases of ten to twenty times. We have been successful in some cases working with our customers to pass along some of our increased costs, but we have also had customers push back given their own challenges. For instance, in our Government Solutions segment, a large customer in Asia balked at paying a significant price increase for solutions valued at more than $10 million that we’d previously expected to book and ship in Q4. Rather than book and ship the product at a loss, we removed the opportunity from our updated guidance.
The conflict in Ukraine continues to have significant repercussions for our business. We have advanced our dialogue with the U.S. government, NATO allies, and the Ukrainian government with respect to a formalized purchase of new troposcatter technology systems for Ukraine. However, given the priority for weapons systems spending as opposed to communications equipment spending right now, we continue to expect no meaningful bookings or related sales for the rest of fiscal 2022.
With regard to Russia, as we said before, we are assuming no new sales for the foreseeable future. For context, FY21 sales into Russia were less than 1% of our consolidated net sales, and in FY22, sales were originally expected to be approximately $10-$15 million, with higher amounts previously expected in FY23. Like other companies, we are continuing to shift certain commercial software development and related support activities conducted in our Russian office to locations outside of the country. Our updated guidance reflects additional expenses of roughly $1.5 million (or $6.0 million on an annual basis) associated with shifting these development resources. We are in an environment where software engineering talent is already in high demand and commands a premium, so this is no easy task, but we are moving quickly.
What we are doing at Comtech in the face of these challenges is remaining focused on execution, whether that’s making the key investments in our products, people, and facilities that reflect and amplify our long-term strategy, or ensuring that on a day-to-day basis we are doing everything we can to accelerate sales, win business, ship products, and protect our margins.
Notwithstanding economic crosswinds, you should not be surprised to hear me say that I am optimistic about Comtech’s future, both as it relates to our end markets, and our position in those markets. I believe we are about to embark on a multi-year journey of building significant long-term shareholder value.
Growing Market Opportunities:
Although we would all like to see immediate results, my optimism for our business is grounded in what we see as a long-term, secular investment cycle in our end markets.
I’m not alone: recent in-depth market research on the global satellite ground equipment segment from Northern Sky Research was prefaced with the observation that “the huge amount of satellite capacity supply coming to the industry is a massive opportunity for equipment vendors,” and that disruptions due to supply chain constraints are “a short-term issue that should not distract the industry from the extraordinary long-term potential driven by infrastructure requirements…and growth in data verticals.”2
| | | | | |
“The huge amount of satellite capacity supply coming to the industry is a massive opportunity for equipment vendors” | Specifically, if the publicly disclosed plans of several well-capitalized companies become a reality, roughly 50,000 active satellites will orbit the earth over the next 10 years, with a majority of those being LEOs. Anyone looking to operationalize or access those LEO satellite constellations for communications will need ground station equipment, installation, maintenance, and ongoing support.
NSR forecasts that the overall total addressable market (“TAM”) for satellite ground equipment will represent nearly $16 billion in revenue in 2030, and that the cellular backhaul market will expand at an approximately 17.5% compound annual growth rate ("CAGR") from now through the end of 2030. |
2 Northern Sky Research, “Global Satellite Ground Segment”, 6th Edition, December 2021
Today, Comtech’s serviceable available market (“SAM”) is much smaller. But every day we are expanding our SAM and approaching new opportunities from a position of strength and increasing our R&D resources related to new LEO and MEO satellite technologies. Although many of these new LEO and MEO systems are currently closed systems, we believe that over time, like the Internet, open standards will become the norm and industry participants will need to work together for the benefit of end-users. In this regard, we have and are developing partnerships with several companies, and our new Elevate™ satellite networking solution is attracting significant attention. Since our equipment is designed to be systems agnostic, open to anyone that wants to work with us, or who requires our expertise, I believe we are in a good place.
To be clear, we have only limited revenues related to these opportunities in fiscal 2022 and foresee only modest revenues in fiscal 2023. Significant launches of these satellite constellations are not expected to take place before the end of next calendar year at the earliest. Industry reports indicate that full constellations will be deployed over an estimated seven-to-ten-year period, with second and third generations coming thereafter. As I personally speak with our customers and industry experts, those conversations have me convinced Comtech’s investments will pay off over a period that lasts years.
Importantly, my long-term optimism is not limited to the satellite and space communications market.
According to a May 2022 report from market research firm Frost & Sullivan, the total annual NG-911 revenue opportunity in the U.S. is estimated to be $1.2 billion by 2026, up from $888.1 million in 2021, growing at a CAGR of 6.1%. Furthermore, the research firm estimates NG-911 market penetration, based on the percentage of the U.S. population covered by closed 911 contracts, will grow from roughly 70.5% last year to 96.0% by 2026. With 25% market share, Comtech is currently the second leading NG-911 primary contract holder in the U.S.
While the COVID pandemic and recent inflation spikes have increased short-term pressure on certain states and local governments, new growth opportunities are likely to emerge through the buildout of smart cities and expansion of the Internet of Things, wearable devices and connected vehicles. As this new infrastructure becomes more widely available, our complementary solutions such as Comtech’s SmartResponse™ and Solacom's 911 Call Handling applications should see ample growth opportunities. We have many pilots going on and are talking to several partners on how best to approach this market.
Critically, we are the only company in the industry offering a single-source, next-generation 911 approach that includes comprehensive in-house capabilities spanning deployment and ongoing systems management. In the future, first responders will have enhanced incidence intelligence with real-time information through video, pictures, and other crucial data. In many cases, first responders typically arrive at a scene with very little situational awareness, and the more information we can provide to them, the better chance they have of preventing tragedies. One thing for sure, providing technology solutions to first responders to save lives or protect themselves is clearly the best part of my job.
In Five Months - We Have Strengthened Comtech:
In the roughly five months since I took on the role of CEO, I have been making the changes necessary to drive day-to-day performance, while simultaneously ensuring Comtech is in the best possible position to capitalize on the long-term opportunities our markets present. As we execute on our strategic initiatives, I believe we are on a three-to-five-year journey where we will see meaningful progress and creation of shareholder value along the way.
So far, I’m incredibly proud of the work the entire Comtech team has done these past five months. We have delivered sequential quarters of growing revenue, gross margin, and Adjusted EBITDA. We’ve done this despite challenging business environments, fast-changing markets, and a Comtech that is itself transforming, starting with our people.
A key Comtech strategic initiative has been to build out leadership and expertise in every area of our business. During the quarter, we welcomed Maria Hedden as our new Chief Operating Officer. Maria joins us from Leidos, where she was responsible for establishing manufacturing excellence across a multi-billion-dollar product portfolio. She is a true operator, overseeing multiple manufacturing and engineering organizations across the globe. Her time spent living in the United Kingdom will be invaluable as we look to deliver manufacturing efficiencies and excellence at our Basingstoke, UK location. Maria is a road warrior, and I feel I see her more often at the airport than our headquarters as we both travel to various Comtech facilities and customers around the world. Maria is already making an immediate impact on our operations and has quickly gained the respect of our talented engineers and customers alike.
Another key addition for us, particularly in the context of my commitment to improve shareholder engagement and communications, is Rob Samuels, who joins us as Vice President of Investor Relations and Corporate Communications. Rob was previously at UBS Global Wealth Management where he served in the Chief Investment Office, producing company-specific and thematic research, as well as marketing collateral for the firm’s financial advisors and private clients. Having a seasoned investment professional like Robert on our team strengthens our ability to tell Comtech’s compelling story and elevate our brand. Rob is actively assisting me in my ongoing evaluation of potential new segment reporting and Non-GAAP financial measures as well as the roll-out of our new social media initiatives. Rob has already been engaging with our shareholders and reporting feedback to me, both good and bad. If you haven’t connected with Rob yet, feel free to give him a ring.
We also recently announced that Tim Jenkins was appointed President of our Safety and Security Technologies product group, effective June 1. Tim succeeds the retiring Kent Hellebust, who deserves thanks for his many years of service to Comtech. Tim has been with Comtech for three years, most recently serving as Group Vice President and General Manager within the Safety and Security Technologies organization. Tim has extensive experience in the 911 business, having served several years as a senior executive at Intrado (formerly known as West Corporation). I look forward to his continued leadership and contributions to our business.
Further, we strengthened the leadership team of our U.S. based satellite business line with the appointment of Jon Opalski as new divisional Chief Operating Officer and Bob Pescatore as General Manager of Digital Products. Jon will be responsible for driving operational excellence at both Comtech’s existing Santa Clara site and our new Arizona high-volume manufacturing and technology facility. Bob will lead the Satellite Network Technologies Digital Products Team, continuing development of industry-leading satellite modems, network products, and cybersecurity support.
Finally, we recently welcomed Ken Peterman as a new independent director to our board. Ken’s accomplished career spans over forty years in the defense sector, and he has unparalleled credentials across a wide array of markets, in both commercial and government satellite systems. Ken’s significant expertise in satellite technology and decades of experience with U.S. government contracting will help lead Comtech into a new era of commercial success and shareholder value.
These additions are part of a larger process that I announced at the beginning of the year to ensure we have the right team in place at Comtech. Numerous organizational and reporting changes have made our company stronger, even as they have, at times, involved making difficult decisions about whether we had the right skillsets, in the right positions, to ensure Comtech will thrive. All of which is to say I have kept the folks in HR, and our recruiting partners, busy for the best possible reason: we are attracting and moving talented individuals into roles where they can execute on our strategic initiative to capitalize on multi-year investment cycles in our market leading satellite and 911 public safety market positions.
Working with our new Board, I am intently focused on mapping out how our strategic initiatives are expected to play out over a multi-year period for Comtech. As part of that process, I am taking a clear-eyed look at our entire portfolio. As I meet with customers, employees, and industry experts, I aim to build an honest comprehensive appraisal of our markets, industry, and competitive landscape. My goal is to ensure that our strategy, the organization, product portfolio, our Board, and talent deployment all come together. When I write my next letter, I hope to share with you our multi-year plans in more detail and be able to report our business in new segments that will align with our strategies. For now, I have no doubt, we are embarking on the right plan to generate growth and stockholder value. To that end, we are achieving success today.
A Bright Future Underpinned by Investments and New Partnerships:
Just a few weeks ago, at the request of the U.S. Army, we conducted in-field demonstrations of our troposcatter equipment in Central Florida for both U.S. and NATO allied government customers. The demonstration consisted of end-to-end data communications links showcasing small, medium, and large troposcatter terminals. The picture you see at the top of this letter is just some of our troposcatter equipment that can transmit a link more than one hundred miles at speeds of more than 100 Mbps. The system is almost a 100% internally developed solution consisting of technologies developed throughout our company and is tangible output of our strategy to increase company-wide collaboration.
From what I saw first-hand, no one in the world can do what we do. In the words of our potential customers, these demonstrations “vastly exceeded expectations”, and we believe there are long-term opportunities for our troposcatter solutions.
Earlier, I noted the headwinds the conflict in Ukraine presented. However, there are also longer-term opportunities. At the request of the Ukrainian government, we were proud to donate multiple COMET™ troposcatter systems to support that country’s armed forces' need for secure, reliable communications. As you may appreciate, the most urgent need on the ground in Ukraine is for weapons systems, but our view is that tactical communications equipment can’t be far behind.
During the quarter, we also announced our partnership with SES. Here, we have supplied and will be further supplying gateway and user terminal antenna systems to SES for its second generation MEO satellite constellation. These antenna solutions will be manufactured at our new technology center in Basingstoke, United Kingdom.
The Basingstoke facility is an example of the competitive advantage Comtech’s investments in R&D and production streamlining provides, as it allows us to meet the unique demands of our existing and future customers. The Basingstoke facility is representative of an important element of the capital investment strategy I highlighted last quarter: the build-out of new facilities advances Comtech’s position as a leading supplier of ground station products and services for next generation satellite constellations. Basingstoke is one of two new facilities Comtech has made capital investments in, with the other being our 146,000 square foot facility in Chandler, Arizona.
Picture of Comtech’s New High Volume Technology Manufacturing Center in Chandler AZ scheduled to fully open in the Fall of 2022.
It has become increasingly clear that manufacturing capacity in the U.S. is a competitive advantage, insulating against both supply chain and political volatility. Centrally located and in proximity to other major technology companies, the Chandler, Arizona facility will consolidate multiple nearby facilities under one roof.
There is no doubt that COVID and supply chain disruptions have interrupted our original move-in timetable, and increased the total cost of build-out by a few million dollars. Assuming no snags, we are currently targeting early fall for a complete move-in to this state-of-the-art building, which will be foundational to our future business plans, and is expected to support production of our next-generation satellite technology. This carefully architected building design enables efficient material flow and a new layout to support lean manufacturing methodologies. A secured ITAR (International Traffic in Arms Regulations) area will allow for highly classified U.S. defense work, and we expect new equipment, including Surface Mount Technology and Pick-and-Place machines, to improve quality and productivity while reducing labor costs. Finally, the new location should help to facilitate better recruitment and retention as more people head back to the office.
In addition to new facilities, we have been making significant capital expenditures and building out cloud-based computer networks to support our previously announced NG-911 contract wins for the states of Pennsylvania, South Carolina, and Arizona. In total, with respect to capital investments for these and other initiatives, we expect to incur approximately $30.0 million of capital expenditures in fiscal 2022, of which we have paid $14.4 million through the end of Q3.
We have also been working closely with a number of current and potential customers and making strategic R&D investments to create or enhance designs for new applications of Comtech gear, or to meet emerging requirements. Our customers know that Comtech is 100% committed to devoting the resources necessary to forge durable, long-lasting partnerships.
A good example of such a partnership is evident in the continued expansion of our role as a key vendor for a satellite network project undertaken by the Indonesian Ministry of Communications, providing critical communications coverage for unserved, and underserved, communities across Indonesia. It may be one of the world’s largest satellite networks in the world – almost all of it connected with Comtech equipment. Comtech was already in place as a key vendor for the initial phase of this project, which began last year, and during the second phase, Comtech will provide satellite connectivity to one of the largest telecom service providers in Southern Asia, to extend coverage from over 800 to approximately 1,700 communities. We’re honored to have been selected to continue to support this project and ensure Indonesia has improved access to much-needed communications: we know that if we had not exceeded customer expectations, we would not have the opportunity to continue as partners. We take this ongoing partnership to be a validation of our technology and strategic commitment to gain share in the global VSAT systems and solutions market. While 5G infrastructure receives a lot of attention, the fact is that there is a huge and unmet need around the world to provide cellular backhaul for legacy 4G LTE networks - like the one in Indonesia. We have the right people and products in place to be winners in this market.
In our Next-Gen 911 public safety business, we were awarded a services contract during the quarter to provide our Solacom Guardian call management solution to the London (Ontario) Police Services. The London Police Service is our latest customer in the southern Ontario region, joining the Toronto Paramedic and Toronto Police Services, both of which also recently awarded contracts to Comtech. Elsewhere, we are performing significant state-wide work in Washington, Pennsylvania, Massachusetts, Arizona and South Carolina.
With travel and in-person meetings resuming, I am looking forward to attending the NENA (a 911 association) Trade Show in person this June. Many conversations with customers and potential partners have been scheduled. I hope to hear positive feedback with respect to SmartResponse™, our cloud-native solution that combines the most accurate location data with caller information, live traffic, weather, POIs, and DOT camera feeds into a single Common Operating Picture.
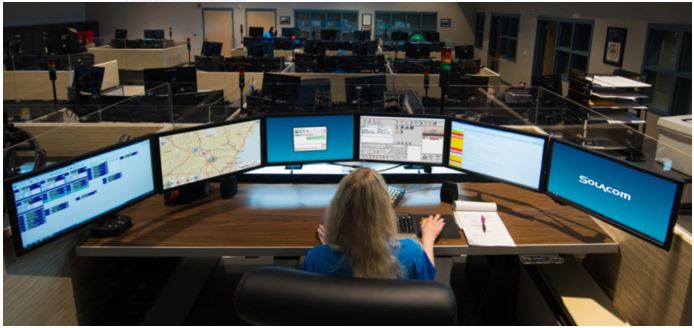
Picture of Comtech's Next-Generation 911 Call Handling Suite
Key Contract Wins:
The following were ten key contract wins (including extensions and follow-on orders) awarded to us during Q3 fiscal 2022:
| | | | | | | | |
$51.4M IN WINS | 1. | $9.3 Million Order for Cyber Security Training Solutions for the U.S. Government |
| 2. | $8.8 Million Contract for 911 Trusted Location™ Software |
| 3. | $7.0 Million Order for Gateway and User Terminal Antenna Systems from SES |
| 4. | $6.5 Million Order for Ongoing Support of the U.S. Army’s Ground Satellite Terminals |
| 5. | $4.2 Million Renewal for Technical Operations Support Services to the State of Maryland Department of Human Services |
| 6. | $4.0 Million of High-Powered Amplifiers for a U.S. Military Service Branch |
| 7. | $3.1 Million Order for Modems from a Multi-Orbit Global Satellite Operator |
| 8. | $2.9 Million Contract for the Maintenance of Equipment and Launch Facilities for an International Government Customer |
| 9. | $2.9 Million Order for Amplifiers Used to Support Maritime Communications Throughout the World |
| 10. | $2.7 Million Order of Satellite Ground Station Equipment for a Foreign Partner |
Third Quarter 2022 Financial Discussion:
For Q3 fiscal 2022, we recorded $122.1 million of consolidated net sales, of which $88.1 million were reported in our Commercial Solutions segment and $34.0 million were reported in our Government Solutions segment.
Of the $122.1 million in consolidated net sales, 71.9% were to U.S. based customers (including 23.3% to the U.S. government), with the remaining 28.1% to international customers. Compared to the year ago quarter, our consolidated Q3 fiscal 2022 net sales declined $17.3 million, or 12.4%, the large majority of which related to lower revenue in our Government Solution's segment reflecting the impact of the withdrawal of U.S. troops in Afghanistan and other program changes, as well as the impact of the Russia/Ukraine military conflict and geopolitical uncertainty in Europe on previously anticipated orders.
Gross margins were 38.2% reflecting modest improvement from the 38.1% we achieved in the second quarter of fiscal 2022, and 38.0% we achieved in the third quarter of fiscal 2021. This improvement primarily related to a more favorable product mix during the most recent quarter and a lower provision for warranty obligations in light of the reduced level of sales activity during the period, partially offset by significant cost increases in raw materials, electronic components, and labor. Inflationary pressures do not seem to be going away any time soon. While difficult, we have initiated conversations with customers about price increases to reflect increased costs and protect our margins.
Our selling, general and administrative (“SG&A”) expenses of $27.6 million, or 22.6% of net sales, reflect tight labor markets and our decision to continue to invest in both existing and new talent. SG&A costs during the most recent fiscal quarter also include $1.6 million of restructuring costs to move and streamline our operations. SG&A expenses in Q3 fiscal 2021 were $27.0 million, or 19.4% of net sales and include $0.6 million of restructuring costs.
On the R&D side, we continue to make long-term investments. R&D expense in Q3 fiscal 2022 was $14.3 million, or 11.7% of net sales and, as discussed above, included $0.9 million of strategic emerging technology costs. These costs relate to projects in the LEO and MEO satellite markets that have high technical risks and for which there is virtually no chance of generating revenue in the short-term. Although it would be easy to improve short-term profits by stopping these efforts or delaying projects, we are continuing to evaluate this new market in relation to our long-term business strategies and may incur additional costs in future periods. Such investments form an integral part of our strategy to secure and expand our relationships with key customers. R&D in Q3 fiscal 2021 was $13.1 million or 9.4% of net sales and include $0.3 million of strategic emerging technology costs.
Operating loss in Q3 fiscal 2022 was $0.6 million and reflects $1.6 million of restructuring costs, $0.9 million of strategic emerging technology costs and $0.1 million of incremental operating costs due to the lingering impact of COVID-19.
Interest expense in Q3 fiscal 2022 was $1.0 million.
Our GAAP net loss attributable to common stockholders was $1.7 million and GAAP EPS was a loss of $0.06. Excluding $1.7 million of dividends on our convertible preferred stock, our GAAP earnings would be break-even.
Our GAAP results reflect $5.3 million of amortization of intangibles, $2.5 million of depreciation expense, $1.1 million of amortization of stock-based compensation, and other costs such as interest and taxes.
On a normalized basis, it was a strong quarter of cash flows from operating activities. Excluding former CEO transition payments and costs associated with our settled proxy contest, net cash provided by operating activities for Q3 fiscal 2022 was $9.5 million and for the first nine months of fiscal 2022 would have been $21.9 million. This is to say that even in a difficult environment, our business generates a healthy amount of cash.
We utilize a Non-GAAP measure we refer to as Adjusted EBITDA (see table of reconciliation below) as an additional measure of our results. During Q3 fiscal 2022, Adjusted EBITDA was $11.2 million, a 14.3% sequential increase from Q2 fiscal 2022. As a percentage of net sales, Adjusted EBITDA was 9.2%, an improvement from the 8.1% we achieved in Q2 fiscal 2022.
Our Q3 fiscal 2022 Adjusted EBITDA does reflect a decrease from the $17.7 million (or 12.7% of net sales) we achieved in Q3 of fiscal 2021. This decrease in Adjusted EBITDA primarily reflects the impact of lower sales in our Government Solutions segment that was largely driven by significantly lower sales of global field support services and advanced VSAT products as a result of the U.S. government’s April 2021 decision to withdraw troops from Afghanistan, and other program changes.
Closing Remarks:
Last quarter I wrote that things were changing at Comtech, and I hope that you, our shareholders, can see we are making important strides in building our company, even as we hold our own in a challenging environment.
Investors should not conflate timing uncertainty with underlying demand dynamics. Knowledgeable and long-term investors will know from experience that our business - particularly as it relates to government and government agency contracts - is difficult to time with precision, as policy, procurement and approval processes all combine to influence execution and delivery dates.
The headwinds identified in this letter, and that are plainly evident in daily newspaper headlines, have created timing issues with regard to booking certain orders. For Comtech, the underlying demand environment remains intact, and we believe it is growing stronger.
As shown in the chart below, our combined sales pipeline and opportunities remain solid:
Our Government Solutions segment backlog is up from last quarter, and the slight decrease in total backlog from Q2 is attributable to recognizing revenue associated with multi-year contracts (such as 911) that are not yet up for renewal or extension. Overall demand for our satellite earth station products is solid, and our pipeline for those products is growing.
Communication is what connects all of us, all the time, and yet some circumstances set those communications apart: emergencies, disasters, and conflict. Comtech’s products and solutions connect people when it matters most. Recent events both abroad and at home underscore this. For our part, everyone at Comtech continues to strive to ensure that our customers are as well-equipped as possible to meet the challenges they face. This means delivering Next-Gen 911 solutions that provide first responders with actionable information – including live video, pictures, and other crucial real-time data – so that informed decisions can be made faster, potentially saving lives in our homes, businesses, communities, and schools when emergencies do happen. It means our satellite communications solutions can connect and network people in hard-to-reach and often harsh environments, including the battlefield.
At Comtech, it is our hope that with every connection, we will make a difference.
We remain confident in the importance and value of the markets we serve, and the way we are serving them. Reflecting this confidence in our business, our Board of Directors again declared a dividend of $0.10 per common share payable on August 19, 2022, to shareholders of record at the close of business on July 20, 2022.
Sincerely,
Mike Porcelain
President and CEO
Conference Call Information
We have scheduled an investor conference call for 5:00 PM (ET) on Thursday, June 9, 2022. Investors and the public are invited to access a live webcast of the conference call from the Investor Relations section of the Comtech website at www.comtech.com. Alternatively, investors can access the conference call by dialing (800) 895-3361 (domestic), or (785) 424-1062 (international) and using the conference I.D. "Comtech." A replay of the conference call will be available for seven days by dialing (877) 856-8965 or (402) 220-1609.
About Comtech
Comtech Telecommunications Corp. is a leading global provider of next-generation 911 emergency systems and secure wireless communications technologies to commercial and government customers around the world. Headquartered in Melville, New York and with a passion for customer success, Comtech designs, produces and markets advanced and secure wireless solutions. For more information, please visit www.comtech.com.
Investor Contact
Robert Samuels
robert.samuels@comtech.com
(631) 962-7102
Appendix:
–Cautionary Statement Regarding Forward-Looking Statements
–Condensed Consolidated Statements of Operations (Unaudited)
–Condensed Consolidated Balance Sheets (Unaudited)
–Use of Non-GAAP Financial Measures
Cautionary Statement Regarding Forward-Looking Statements
Certain information in this shareholder letter contains forward-looking statements, including but not limited to, information relating to our future performance and financial condition, plans and objectives of our management and our assumptions regarding such future performance, financial condition, and plans and objectives that involve certain significant known and unknown risks and uncertainties and other factors not under our control which may cause our actual results, future performance and financial condition, and achievement of plans and objectives of our management to be materially different from the results, performance or other expectations implied by these forward-looking statements. These factors include, among other things: the possibility that the expected synergies and benefits from recent acquisitions will not be fully realized, or will not be realized within the anticipated time periods; the risk that the acquired businesses will not be integrated with Comtech successfully; the possibility of disruption from recent acquisitions, making it more difficult to maintain business and operational relationships or retain key personnel; the risk that Comtech will be unsuccessful in implementing a tactical shift in its Government Solutions segment away from bidding on large commodity service contracts and toward pursuing contracts for its niche products with higher margins; the nature and timing of receipt of, and our performance on, new or existing orders that can cause significant fluctuations in net sales and operating results; the timing and funding of government contracts; adjustments to gross profits on long-term contracts; risks associated with international sales; rapid technological change; evolving industry standards; new product announcements and enhancements; changing customer demands and or procurement strategies; changes in prevailing economic and political conditions; including as a result of Russia's military incursion into Ukraine; changes in the price of oil in global markets; changes in foreign currency exchange rates; risks associated with our legal proceedings, customer claims for indemnification, and other similar matters; risks associated with our obligations under our Credit Facility; risks associated with our large contracts; risks associated with the COVID-19 pandemic and related supply chain disruptions; and other factors described in this and our other filings with the Securities and Exchange Commission.
COMTECH TELECOMMUNICATIONS CORP. AND SUBSIDIARIES
Condensed Consolidated Statements of Operations
(Unaudited)
| | | | | | | | | | | | | | | | | | | | | | | | | | |
| | Three months ended April 30, | | Nine months ended April 30, |
| | 2022 | | 2021 | | 2022 | | 2021 |
| Net sales | | $ | 122,116,000 | | | 139,376,000 | | | $ | 359,256,000 | | | 435,886,000 | |
| Cost of sales | | 75,452,000 | | | 86,360,000 | | | 224,999,000 | | | 276,982,000 | |
| Gross profit | | 46,664,000 | | | 53,016,000 | | | 134,257,000 | | | 158,904,000 | |
| | | | | | | | |
| Expenses: | | | | | | | | |
| Selling, general and administrative | | 27,626,000 | | | 26,997,000 | | | 85,695,000 | | | 83,999,000 | |
| Research and development | | 14,255,000 | | | 13,092,000 | | | 39,384,000 | | | 37,391,000 | |
| Amortization of intangibles | | 5,349,000 | | | 5,310,000 | | | 16,047,000 | | | 15,671,000 | |
| Former CEO transition costs | | — | | | — | | | 13,554,000 | | | — | |
| Proxy solicitation costs | | — | | | — | | | 11,248,000 | | | — | |
| Acquisition plan expenses | | — | | | 5,267,000 | | | — | | | 99,807,000 | |
| | | 47,230,000 | | | 50,666,000 | | | 165,928,000 | | | 236,868,000 | |
| | | | | | | | |
| Operating (loss) income | | (566,000) | | | 2,350,000 | | | (31,671,000) | | | (77,964,000) | |
| | | | | | | | |
| Other expenses (income): | | | | | | | | |
| Interest expense | | 981,000 | | | 1,518,000 | | | 3,576,000 | | | 5,233,000 | |
| Interest (income) and other | | (449,000) | | | (276,000) | | | (260,000) | | | (276,000) | |
Change in fair value of convertible preferred
stock purchase option liability | | (302,000) | | | — | | | (1,004,000) | | | — | |
| | | | | | | | |
| (Loss) income before (benefit from) provision for income taxes | | (796,000) | | | 1,108,000 | | | (33,983,000) | | | (82,921,000) | |
| (Benefit from) provision for income taxes | | (771,000) | | | 316,000 | | | (6,100,000) | | | (2,078,000) | |
| | | | | | | | |
| Net (loss) income | | $ | (25,000) | | | 792,000 | | | $ | (27,883,000) | | | (80,843,000) | |
| | | | | | | | |
Adjustments to reflect redemption value of
convertible preferred stock: | | | | | | | | |
| Convertible preferred stock issuance costs | | — | | | — | | | (4,007,000) | | | — | |
Establishment of initial convertible
preferred stock purchase option liability | | — | | | — | | | (1,005,000) | | | — | |
| Dividend on convertible preferred stock | | (1,655,000) | | | — | | | (3,522,000) | | | — | |
Net (loss) income attributable to common
stockholders | | $ | (1,680,000) | | | 792,000 | | | $ | (36,417,000) | | | (80,843,000) | |
| | | | | | | | |
| Net (loss) income per common share: | | | | | | | | |
| Basic | | $ | (0.06) | | | 0.03 | | | $ | (1.37) | | | (3.12) | |
| Diluted | | $ | (0.06) | | | 0.03 | | | $ | (1.37) | | | (3.12) | |
| | | | | | | | |
| Weighted average number of common shares outstanding – basic | | 26,528,000 | | | 25,911,000 | | | 26,582,000 | | | 25,875,000 | |
| | | | | | | | |
| Weighted average number of common and common equivalent shares outstanding – diluted | | 26,528,000 | | | 26,266,000 | | | 26,582,000 | | | 25,875,000 | |
| | | | | | | | |
COMTECH TELECOMMUNICATIONS CORP. AND SUBSIDIARIES
Condensed Consolidated Balance Sheets
(Unaudited) | | | | | | | | | | | | |
| April 30, 2022 | | July 31, 2021 | |
| Assets | | | | |
| Current assets: | | | | |
| Cash and cash equivalents | $ | 32,831,000 | | | 30,861,000 | | |
| Accounts receivable, net | 124,091,000 | | | 158,110,000 | | |
| Inventories, net | 95,243,000 | | | 80,358,000 | | |
| Prepaid expenses and other current assets | 23,300,000 | | | 18,167,000 | | |
| Total current assets | 275,465,000 | | | 287,496,000 | | |
| Property, plant and equipment, net | 45,016,000 | | | 35,286,000 | | |
| Operating lease right-of-use assets, net | 52,216,000 | | | 44,486,000 | | |
| | | | |
| Goodwill | 347,692,000 | | | 347,698,000 | | |
| Intangibles with finite lives, net | 252,652,000 | | | 268,699,000 | | |
| Deferred financing costs, net | 1,216,000 | | | 1,824,000 | | |
| Other assets, net | 9,380,000 | | | 7,622,000 | | |
| Total assets | $ | 983,637,000 | | | 993,111,000 | | |
| Liabilities, Convertible Preferred Stock and Stockholders’ Equity | | | | |
| Current liabilities: | | | | |
| Accounts payable | $ | 32,140,000 | | | 36,193,000 | | |
| Accrued expenses and other current liabilities | 84,164,000 | | | 89,601,000 | | |
| Operating lease liabilities, current | 9,203,000 | | | 8,841,000 | | |
| Dividends payable | 2,646,000 | | | 2,601,000 | | |
| Contract liabilities | 76,647,000 | | | 66,130,000 | | |
| Interest payable | 121,000 | | | 195,000 | | |
| | | | |
| Total current liabilities | 204,921,000 | | | 203,561,000 | | |
| Non-current portion of long-term debt | 127,000,000 | | | 201,000,000 | | |
| Operating lease liabilities, non-current | 46,540,000 | | | 39,569,000 | | |
| Income taxes payable | 3,003,000 | | | 2,717,000 | | |
| Deferred tax liability, net | 15,946,000 | | | 21,230,000 | | |
| Long-term contract liabilities | 10,778,000 | | | 9,808,000 | | |
| Other liabilities | 7,367,000 | | | 14,507,000 | | |
| Total liabilities | 415,555,000 | | | 492,392,000 | | |
| Commitments and contingencies | | | | |
| Convertible preferred stock, par value $0.10 per share; authorized 125,000 shares; issued 100,000 at April 30, 2022 (includes accrued dividends of $558,000) | 103,522,000 | | | — | | |
| Stockholders’ equity: | | | | |
| Preferred stock, par value $0.10 per share; authorized and unissued 1,875,000 shares | — | | | — | | |
| Common stock, par value $0.10 per share; authorized 100,000,000 shares; issued 41,560,361 and 41,281,812 shares at April 30, 2022 and July 31, 2021, respectively | 4,156,000 | | | 4,128,000 | | |
| Additional paid-in capital | 613,898,000 | | | 605,439,000 | | |
| Retained earnings | 288,355,000 | | | 333,001,000 | | |
| 906,409,000 | | | 942,568,000 | | |
| Less: | | | | |
| Treasury stock, at cost (15,033,317 shares at April 30, 2022 and July 31, 2021) | (441,849,000) | | | (441,849,000) | | |
| Total stockholders’ equity | 464,560,000 | | | 500,719,000 | | |
| Total liabilities, convertible preferred stock and stockholders’ equity | $ | 983,637,000 | | | 993,111,000 | | |
Use of Non-GAAP Financial Measures
To provide investors with additional information regarding our financial results, this shareholder letter contains "Non-GAAP financial measures" under the rules of the SEC. Our Adjusted EBITDA is a Non-GAAP measure that represents earnings (loss) before income taxes, interest (income) and other, change in fair value of the convertible preferred stock purchase option liability, write-off of deferred financing costs, interest expense, amortization of stock-based compensation, amortization of intangibles, depreciation expense, amortization of cost to fulfill assets, estimated contract settlement costs, settlement of intellectual property litigation, acquisition plan expenses, restructuring costs, COVID-19 related costs, strategic emerging technology costs (for next-generation satellite technology), facility exit costs, former CEO transition costs, proxy solicitation costs, strategic alternatives analysis expenses and other. Our definition of Adjusted EBITDA may differ from the definition of EBITDA or Adjusted EBITDA used by other companies and therefore may not be comparable to similarly titled measures used by other companies. Adjusted EBITDA is also a measure frequently requested by our investors and analysts. We believe that investors and analysts may use Adjusted EBITDA, along with other information contained in our SEC filings, in assessing our performance and comparability of our results with other companies. Our Non-GAAP measures reflect the GAAP measures as reported, adjusted for certain items as described below and also excludes the effects of our outstanding convertible preferred stock. These Non-GAAP financial measures have limitations as an analytical tool as they exclude the financial impact of transactions necessary to conduct our business, such as the granting of equity compensation awards, and are not intended to be an alternative to financial measures prepared in accordance with GAAP. These measures are adjusted as described in the reconciliation of GAAP to Non-GAAP in the tables below, but these adjustments should not be construed as an inference that all of these adjustments or costs are unusual, infrequent or non-recurring. Non-GAAP financial measures should be considered in addition to, and not as a substitute for or superior to, financial measures determined in accordance with GAAP. Investors are advised to carefully review the GAAP financial results that are disclosed in our SEC filings. We have not quantitatively reconciled our fiscal 2022 Adjusted EBITDA target to the most directly comparable GAAP measure because items such as stock-based compensation, adjustments to the provision for income taxes, amortization of intangibles and interest expense, which are specific items that impact these measures, have not yet occurred, are out of our control, or cannot be predicted. For example, quantification of stock-based compensation expense requires inputs such as the number of shares granted and market price that are not currently ascertainable. Accordingly, reconciliations to the Non-GAAP forward looking metrics are not available without unreasonable effort and such unavailable reconciling items could significantly impact our financial results.
| | | | | | | | | | | | | | | | | | | | | | | | | | | | | |
| Three months ended | | Nine months ended | | Fiscal |
| April 30, | | April 30, | | Year |
| 2022 | | 2021 | | 2022 | | 2021 | | 2021 |
| Reconciliation of GAAP Net (Loss) Income to Adjusted EBITDA: | | | | | | | | | |
| Net (loss) income | $ | (25,000) | | | 792,000 | | | $ | (27,883,000) | | | (80,843,000) | | | $ | (73,480,000) | |
| (Benefit from) provision for income taxes | (771,000) | | | 316,000 | | | (6,100,000) | | | (2,078,000) | | | (1,500,000) | |
| Interest (income) and other | (449,000) | | | (276,000) | | | (260,000) | | | (276,000) | | | (139,000) | |
Change in fair value of convertible preferred stock
purchase option liability | (302,000) | | | — | | | (1,004,000) | | | — | | | — | |
| Interest expense | 981,000 | | | 1,518,000 | | | 3,576,000 | | | 5,233,000 | | | 6,821,000 | |
| Amortization of stock-based compensation | 1,071,000 | | | 1,204,000 | | | 3,975,000 | | | 3,190,000 | | | 9,983,000 | |
| Amortization of intangibles | 5,349,000 | | | 5,310,000 | | | 16,047,000 | | | 15,671,000 | | | 21,020,000 | |
| Depreciation | 2,482,000 | | | 2,274,000 | | | 7,057,000 | | | 7,283,000 | | | 9,379,000 | |
| Amortization of cost to fulfill assets | 233,000 | | | — | | | 233,000 | | | — | | | — | |
| Acquisition plan expenses | — | | | 5,267,000 | | | — | | | 99,807,000 | | | 100,292,000 | |
| Former CEO transition costs | — | | | — | | | 13,554,000 | | | — | | | — | |
| Proxy solicitation costs | — | | | — | | | 11,248,000 | | | — | | | — | |
| Restructuring costs | 1,600,000 | | | 594,000 | | | 4,038,000 | | | 1,195,000 | | | 2,782,000 | |
| COVID-19 related costs | 115,000 | | | 416,000 | | | 1,144,000 | | | 576,000 | | | 1,046,000 | |
| Strategic emerging technology costs | 912,000 | | | 315,000 | | | 912,000 | | | 315,000 | | | 315,000 | |
| Adjusted EBITDA | $ | 11,196,000 | | | 17,730,000 | | | $ | 26,537,000 | | | 50,073,000 | | | $ | 76,519,000 | |
| | | | | | | | | |
Reconciliations of Comtech's GAAP consolidated operating (loss) income, net (loss) income attributable to common stockholders and net (loss) income per diluted common share to the corresponding Non-GAAP measures are shown in the tables below. Non-GAAP net (loss) income attributable to common stockholders and Non-GAAP EPS reflect Non-GAAP provisions for income taxes based on year-to-date results, as adjusted for the Non-GAAP reconciling items included in the tables below. We evaluate our Non-GAAP effective income tax rate on an ongoing basis, and it can change from time to time. Our Non-GAAP effective income tax rate can differ materially from our GAAP effective income tax rate.
| | | | | | | | | | | | | | | | | | | | | | | | | | | | | | | | | | | | | | | | | | | | | | |
| April 30, 2022 | | | | | | | | | | | |
| Three months ended | | Nine months ended | | | | | | | |
| Operating
(Loss)
Income | | Net (Loss) Income Attributable to Common Stockholders | | Net (Loss) Income per Diluted Common Share* | | Operating
Loss | | Net Loss Attributable to Common Stockholders | | Net Loss per Diluted Common Share* | | | | | | | | | | | |
| Reconciliation of GAAP to Non-GAAP Earnings: | | | | | | | | | | | | | | | | | | | | | | |
| GAAP measures, as reported | $ | (566,000) | | | $ | (1,680,000) | | | $ | (0.06) | | | $ | (31,671,000) | | | $ | (36,417,000) | | | $ | (1.37) | | | | | | | | | | | | |
Adjustments to reflect redemption value of convertible preferred stock | — | | | 1,655,000 | | | 0.06 | | | — | | | 8,534,000 | | | 0.32 | | | | | | | | | | | | |
| Former CEO transition costs | — | | | — | | | — | | | 13,554,000 | | | 12,959,000 | | | 0.49 | | | | | | | | | | | | |
| Proxy solicitation costs | — | | | — | | | — | | | 11,248,000 | | | 8,671,000 | | | 0.33 | | | | | | | | | | | | |
| | | | | | | | | | | | | | | | | | | | | | |
| | | | | | | | | | | | | | | | | | | | | | |
| Restructuring costs | 1,600,000 | | | 1,128,000 | | | 0.04 | | | 4,038,000 | | | 3,103,000 | | | 0.12 | | | | | | | | | | | | |
| COVID-19 related costs | 115,000 | | | 90,000 | | | — | | | 1,144,000 | | | 897,000 | | | 0.03 | | | | | | | | | | | | |
Strategic emerging technology costs | 912,000 | | | 690,000 | | | 0.03 | | | 912,000 | | | 690,000 | | | 0.03 | | | | | | | | | | | | |
Change in fair value of
convertible preferred stock
purchase option liability | — | | | (302,000) | | | (0.01) | | | — | | | (1,004,000) | | | (0.04) | | | | | | | | | | | | |
| | | | | | | | | | | | | | | | | | | | | | |
| | | | | | | | | | | | | | | | | | | | | | |
| Net discrete tax expense (benefit) | — | | | 166,000 | | | 0.01 | | | — | | | (335,000) | | | (0.01) | | | | | | | | | | | | |
| Non-GAAP measures | $ | 2,061,000 | | | $ | 1,747,000 | | | $ | 0.06 | | | $ | (775,000) | | | $ | (2,902,000) | | | $ | (0.11) | | | | | | | | | | | | |
| | | | | | | | | | | | | | | | | | | | | | |
| April 30, 2021 | | | | | | | | | | | |
| Three months ended | | Nine months ended | | | | | | | | | | | |
| Operating Income | | Net Income | | Net Income per Diluted Share* | | Operating
(Loss) Income | | Net (Loss) Income | | Net (Loss) Income per Diluted Share* | | | | | | | | | | | |
| Reconciliation of GAAP to Non-GAAP Earnings: | | | | | | | | | | | | | | | | | | | | | | |
| GAAP measures, as reported | $ | 2,350,000 | | | $ | 792,000 | | | $ | 0.03 | | | $ | (77,964,000) | | | $ | (80,843,000) | | | $ | (3.12) | | | | | | | | | | | | |
| | | | | | | | | | | | | | | | | | | | | | |
| Acquisition plan expenses | 5,267,000 | | | 4,661,000 | | | 0.18 | | | 99,807,000 | | | 96,379,000 | | | 3.70 | | | | | | | | | | | | |
| | | | | | | | | | | | | | | | | | | | | | |
| Restructuring costs | 594,000 | | | 526,000 | | | 0.02 | | | 1,195,000 | | | 1,058,000 | | | 0.04 | | | | | | | | | | | | |
| COVID-19 related costs | 416,000 | | | 368,000 | | | 0.01 | | | 576,000 | | | 510,000 | | | 0.02 | | | | | | | | | | | | |
Strategic emerging technology costs | 315,000 | | | 279,000 | | | 0.01 | | | 315,000 | | | 279,000 | | | 0.01 | | | | | | | | | | | | |
| Interest expense | — | | | — | | | — | | | — | | | 1,043,000 | | | 0.04 | | | | | | | | | | | | |
| Net discrete tax expense (benefit) | — | | | 189,000 | | | 0.01 | | | — | | | (592,000) | | | (0.02) | | | | | | | | | | | | |
| Non-GAAP measures | $ | 8,942,000 | | | $ | 6,815,000 | | | $ | 0.26 | | | $ | 23,929,000 | | | $ | 17,834,000 | | | $ | 0.69 | | | | | | | | | | | | |
| | | | | | | | | | | | | | | | | | | | | | | |
| Fiscal Year 2021 | | |
| Operating (Loss) Income | | Net (Loss) Income | | Net (Loss) Income per Diluted Share* | | | | | | |
| Reconciliation of GAAP to Non-GAAP Earnings: | | | | | | | | | | | |
| GAAP measures, as reported | $ | (68,298,000) | | | $ | (73,480,000) | | | $ | (2.86) | | | | | | | |
| Acquisition plan expenses | 100,292,000 | | | 93,273,000 | | | 3.60 | | | | | | | |
| | | | | | | | | | | |
| | | | | | | | | | | |
| Restructuring costs | 2,782,000 | | | 2,132,000 | | | 0.08 | | | | | | | |
| COVID-19 related costs | 1,046,000 | | | 847,000 | | | 0.03 | | | | | | | |
| Strategic emerging technology costs | 315,000 | | | 255,000 | | | 0.01 | | | | | | | |
| Interest expense | — | | | 910,000 | | | 0.04 | | | | | | | |
| Net discrete tax benefit | — | | | (1,575,000) | | | (0.06) | | | | | | | |
| Non-GAAP measures | $ | 36,137,000 | | | $ | 22,362,000 | | | $ | 0.86 | | | | | | | |
* Per share amounts may not foot due to rounding. In addition, due to the GAAP net loss for the respective periods, Non-GAAP EPS for: the three months ended April 30, 2022 was computed using 27,225,000 weighted average diluted shares outstanding; the nine months ended April 30, 2021 was computed using 26,016,000 weighted average diluted shares outstanding; and the fiscal year ended July 31, 2021 was computed using the 25,885,000 weighted average diluted shares outstanding.
ECMTL
###