Searchable text section of graphics shown above
[LOGO]
MARCH 2006
Analyst & Investor Event
[LOGO]
1
Note on Forward-Looking Statements | [LOGO] |
This presentation, contains forward-looking statements within the meaning of the Private Securities Litigation Reform Act of 1995. These statements are based on management’s current views and assumptions of future events and financial performance and are subject to uncertainty and changes in circumstances. Readers of this presentation should understand that these statements are not guarantees of performance or results. Many factors could affect the company’s actual financial results and cause them to vary materially from the expectations contained in the forward-looking statements. These factors include, among other things, future economic circumstances, industry conditions, company performance and financial results, availability and prices of raw materials, product pricing, competitive environment and related market conditions, operating efficiencies, access to capital, actions of governments and regulatory factors affecting the company’s businesses and other risks described in the company’s reports filed with the Securities and Exchange Commission. The company cautions readers not to place undue reliance on any forward-looking statements included in this presentation, which speak only as of the date made.
This presentation includes certain “non-GAAP” financial measures as defined by SEC rules. As required by the SEC we have provided a reconciliation of those measures to the most directly comparable GAAP measures and presented in accordance with Generally Accepted Accounting Principles located in the appendix of this presentation.
2
[LOGO]
MARCH 2006
Analyst & Investor Event
Welcome
Gary Rodkin
President and CEO
[LOGO]
3
[LOGO]
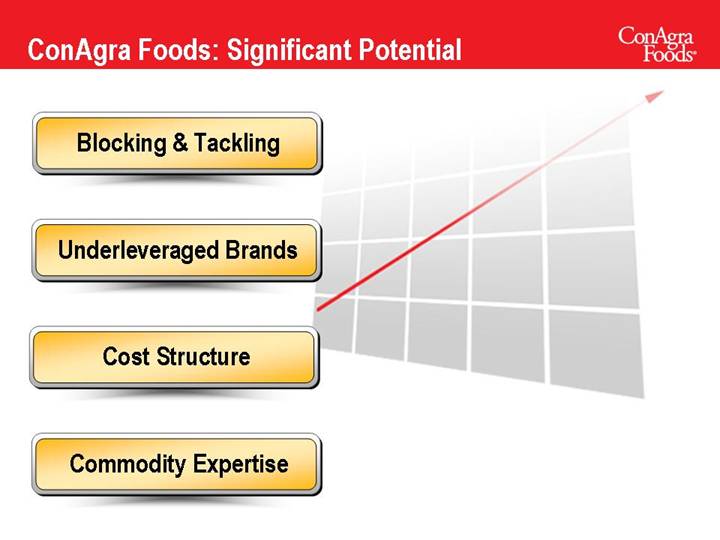
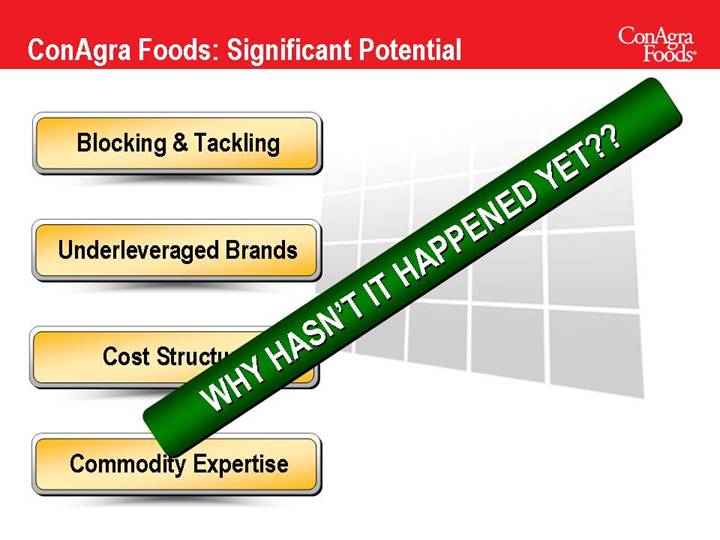
ConAgra Foods: Significant Potential
Blocking & Tackling | |
| |
Underleveraged Brands | |
| [GRAPHIC] |
Cost Structure | |
| |
Commodity Expertise | |
4
Blocking & Tackling | |
| |
Underleveraged Brands | |
| [GRAPHIC] |
Cost Structure | |
| |
Commodity Expertise | |
| |
WHY HASN’T IT HAPPENED YET?? | |
5
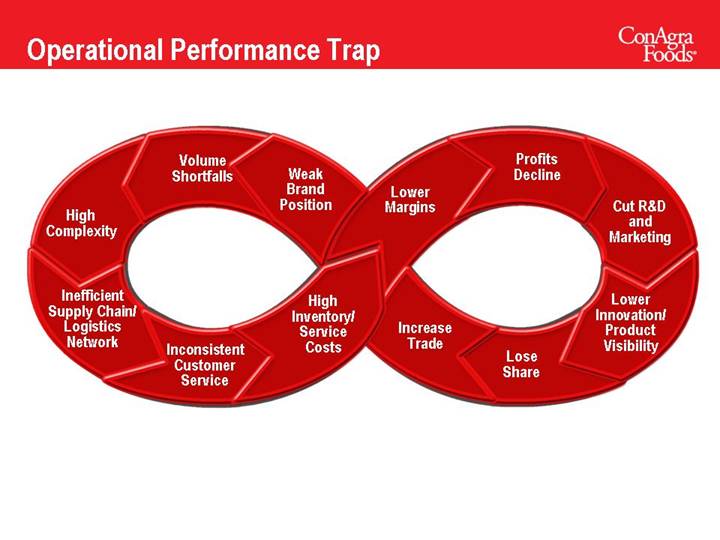
Operational Performance Trap
High
Complexity | | Volume
Shortfalls | | Weak
Brand
Position | | Lower
Margins | | Profits
Decline | | Cut R&D
and
Marketing |
| | | | | | | | | | |
Inefficient
Supply Chain/
Logistics
Network | | Inconsistent
Customer
Service | | High
Inventory/
Service
Costs | | Increase
Trade | | Lose
Share | | Lower
Innovation/
Product
Visibility |
6
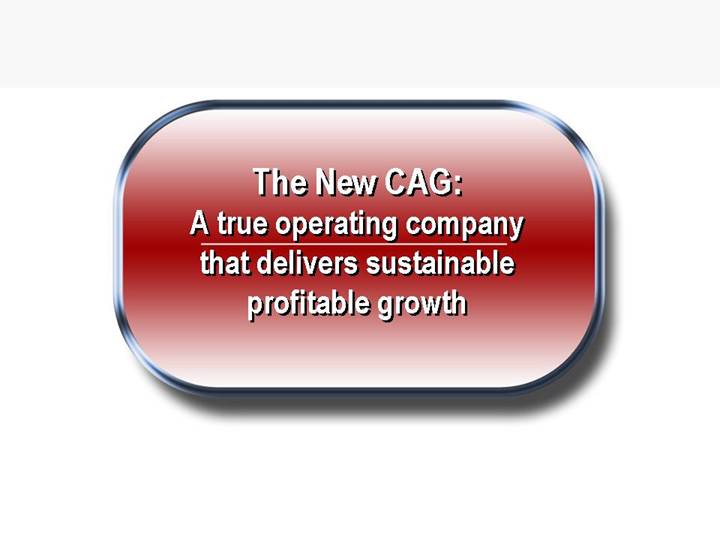
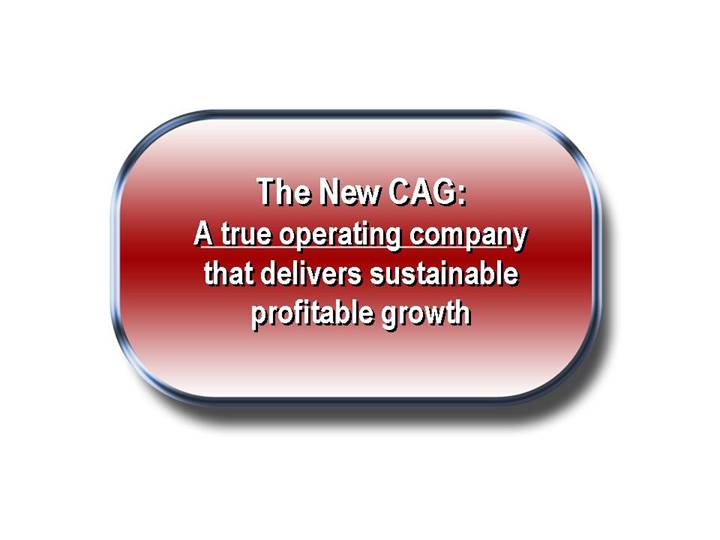
The New CAG:
A true operating company
that delivers sustainable
profitable growth
7
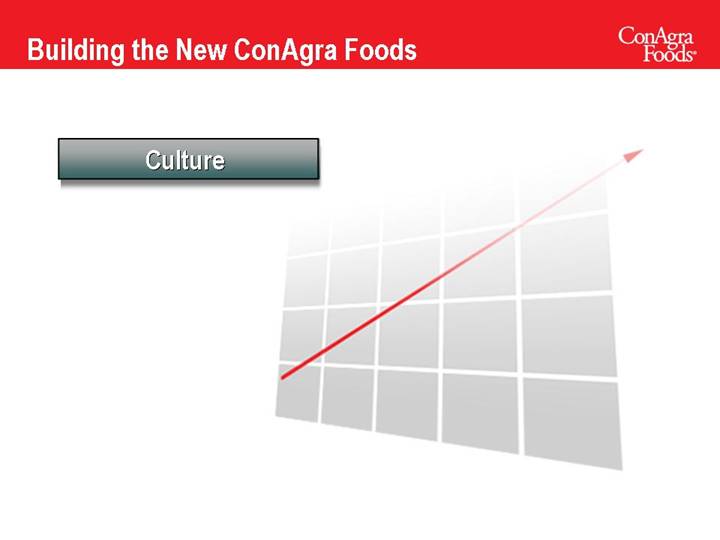
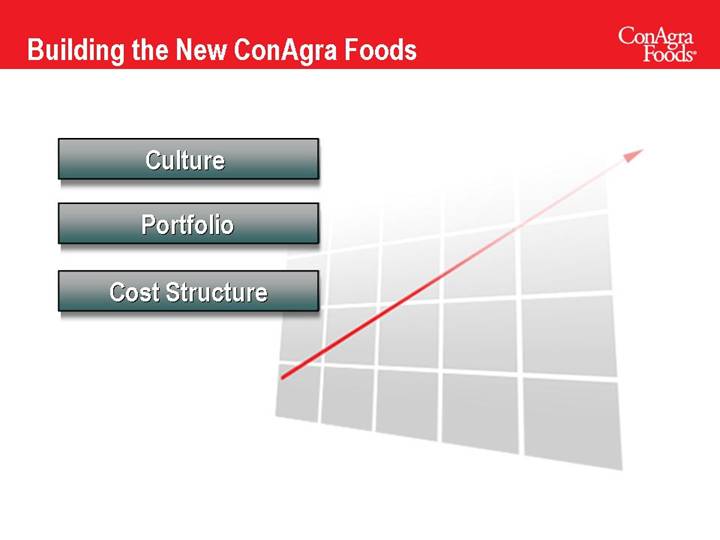
Building the New ConAgra Foods
8
Culture: A Root Cause of Underperformance
Independent Operating Company Heritage
Silo Mentality
Resistance to “Corporate”
Size, Not Scale
9
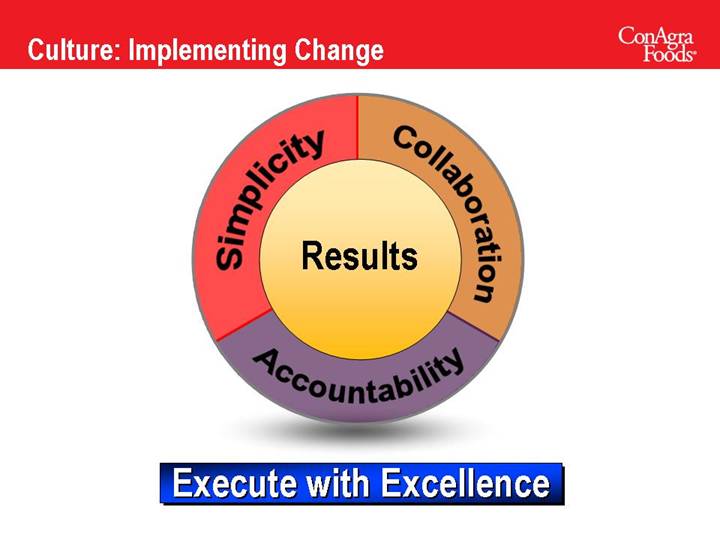
Culture: Implementing Change
Simplicity | | Collaboration |
| | |
Results |
| | |
Accountability |
Execute with Excellence
10
Building the New ConAgra Foods
Culture | |
| |
| [GRAPHIC] |
| |
Portfolio | |
11
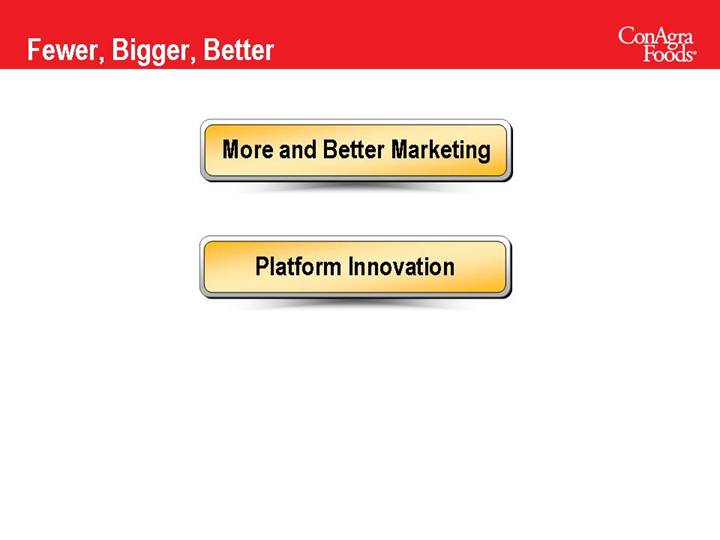
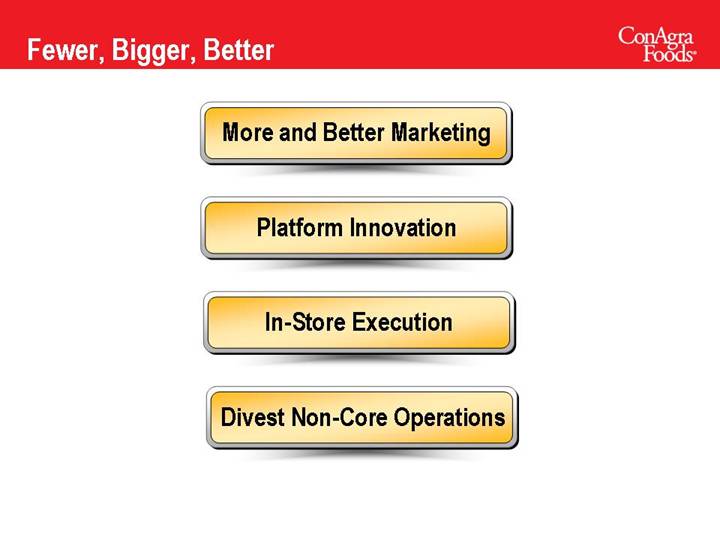
Fewer, Bigger, Better
More and Better Marketing
12
More and Better Marketing
[LOGO]
13
More & Better
[LOGO]
[GRAPHIC]
16
Fewer, Bigger, Better
More and Better Marketing
Platform Innovation
17
Platform Innovation: Brands
[LOGO]
18
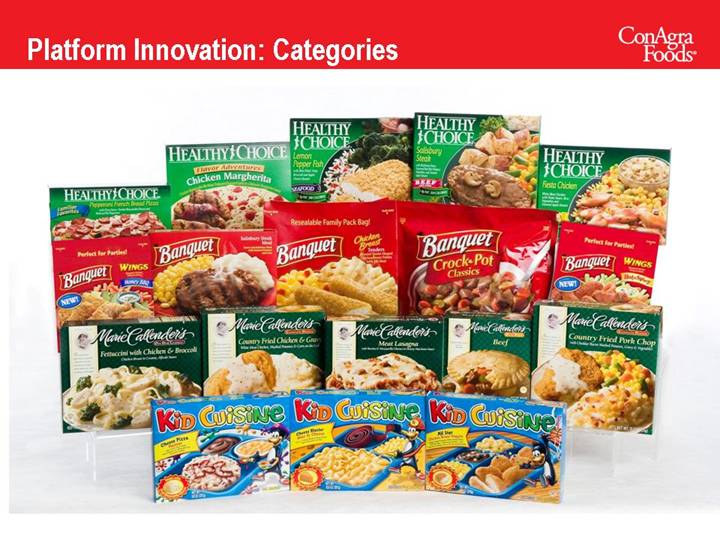
Platform Innovation: Categories
[GRAPHIC]
19
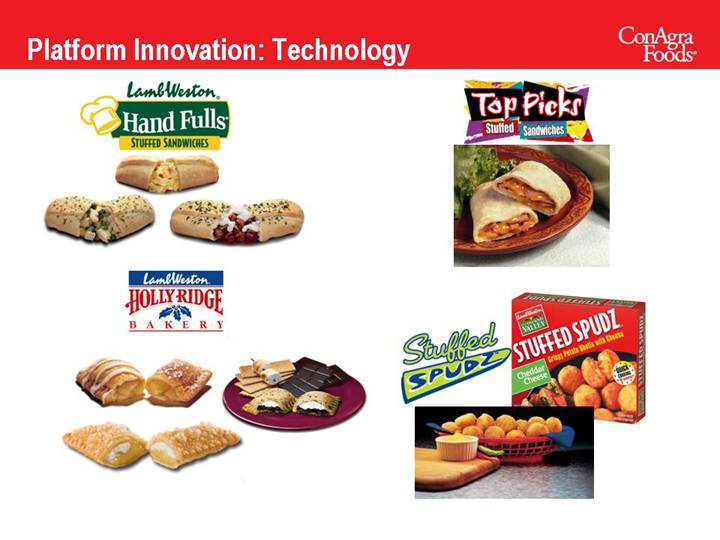
Platform Innovation: Technology
[LOGO] | | [LOGO] |
[GRAPHIC] | | [GRAPHIC] |
| | |
[LOGO] | | [LOGO] |
[GRAPHIC] | | [GRAPHIC] |
20
Fewer, Bigger, Better
More and Better Marketing
Platform Innovation
In-Store Execution
21
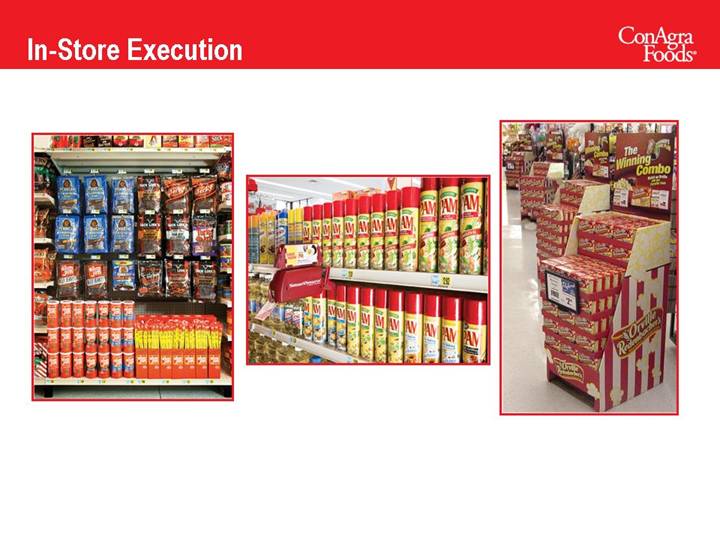
In-Store Execution
[GRAPHIC]
22
Fewer, Bigger, Better
More and Better Marketing
Platform Innovation
In-Store Execution
Divest Non-Core Operations
23
Divest Non-Core Operations
• Packaged Meats | [LOGO] |
• Cheese | |
• Seafood | |
24
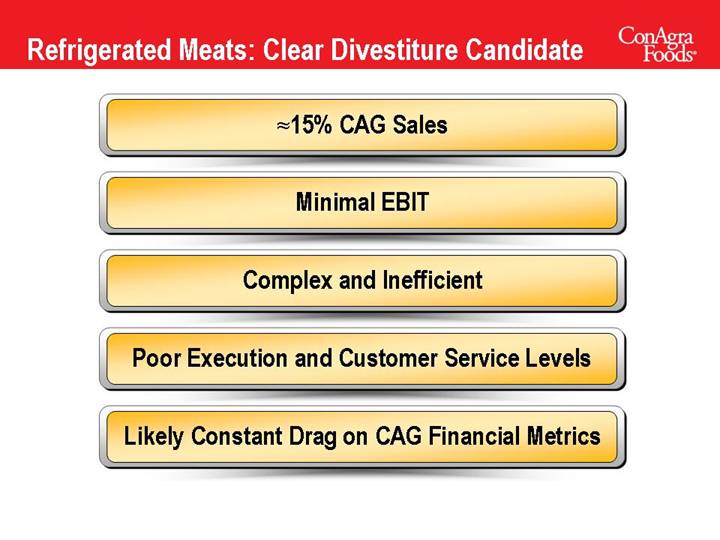
Refrigerated Meats: Clear Divestiture Candidate
 15% CAG Sales
Minimal EBIT
Complex and Inefficient
Poor Execution and Customer Service Levels
Likely Constant Drag on CAG Financial Metrics
25
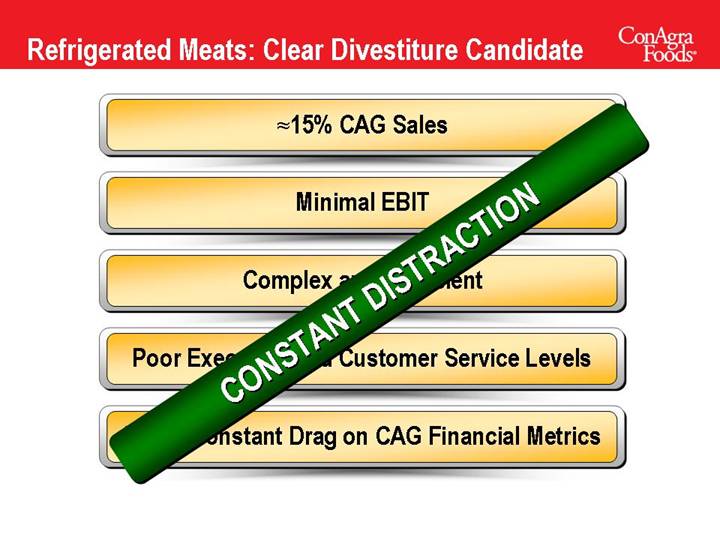
Refrigerated Meats: Clear Divestiture Candidate
 15% CAG Sales
Minimal EBIT
Complex and Inefficient
Poor Execution and Customer Service Levels
Likely Constant Drag on CAG Financial Metrics
CONSTANT DISTRACTION
26
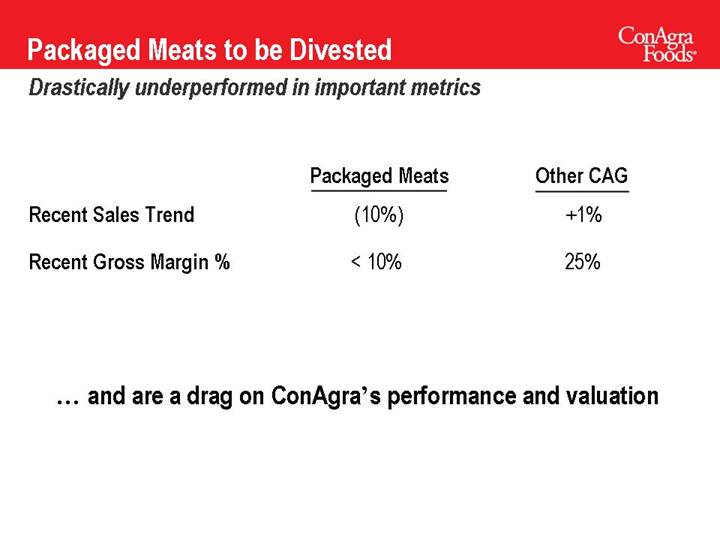
Packaged Meats to be Divested
Drastically underperformed in important metrics
| | Packaged Meats | | Other CAG | |
Recent Sales Trend | | (10 | )% | +1 | % |
Recent Gross Margin % | | < 10 | % | 25 | % |
… and are a drag on ConAgra’s performance and valuation
27
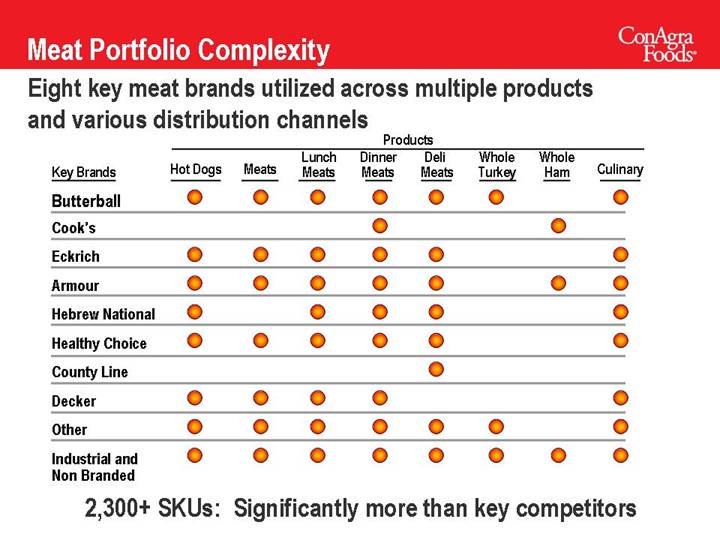
Meat Portfolio Complexity
Eight key meat brands utilized across multiple products and various distribution channels
| | Products | |
Key Brands | | Hot Dogs | | Meats | | Lunch
Meats | | Dinner
Meats | | Deli
Meats | | Whole
Turkey | | Whole
Ham | | Culinary | |
Butterball | | X | | X | | X | | X | | X | | X | | | | X | |
Cook’s | | | | | | | | X | | | | | | X | | | |
Eckrich | | X | | X | | X | | X | | X | | | | | | X | |
Armour | | X | | X | | X | | X | | X | | | | X | | X | |
Hebrew National | | X | | | | X | | X | | X | | | | | | X | |
Healthy Choice | | X | | X | | X | | X | | X | | | | | | X | |
County Line | | | | | | | | | | X | | | | | | | |
Decker | | X | | X | | X | | X | | | | | | | | X | |
Other | | X | | X | | X | | X | | X | | X | | | | X | |
Industrial and Non Branded | | X | | X | | X | | X | | X | | X | | X | | X | |
2,300+ SKUs: Significantly more than key competitors
28
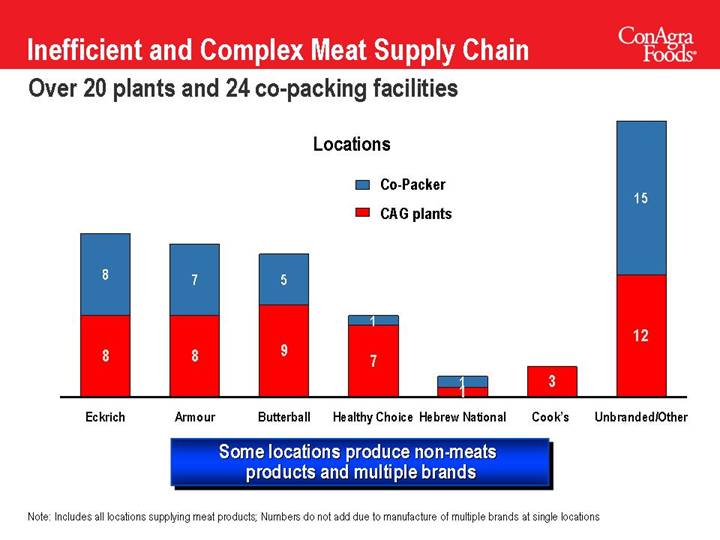
Inefficient and Complex Meat Supply Chain
Over 20 plants and 24 co-packing facilities
Locations
[CHART]
Some locations produce non-meats products and multiple brands
Note: Includes all locations supplying meat products; Numbers do not add due to manufacture of multiple brands at single locations
29
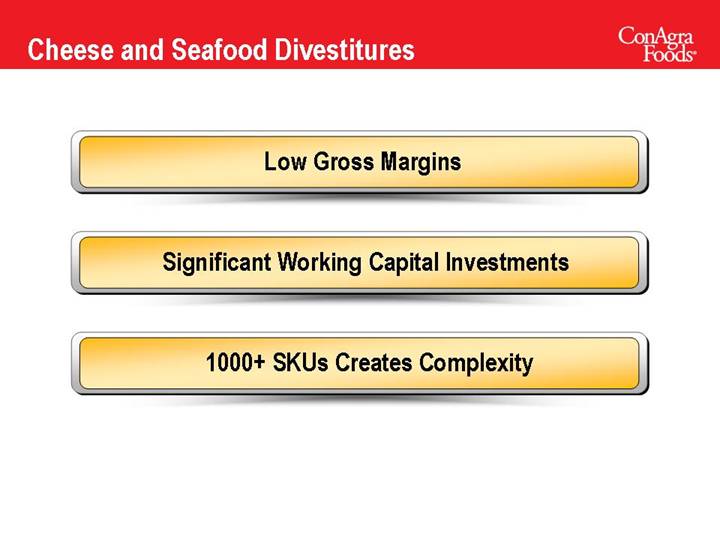
Cheese and Seafood Divestitures
Low Gross Margins
Significant Working Capital Investments
1000+ SKUs Creates Complexity
30
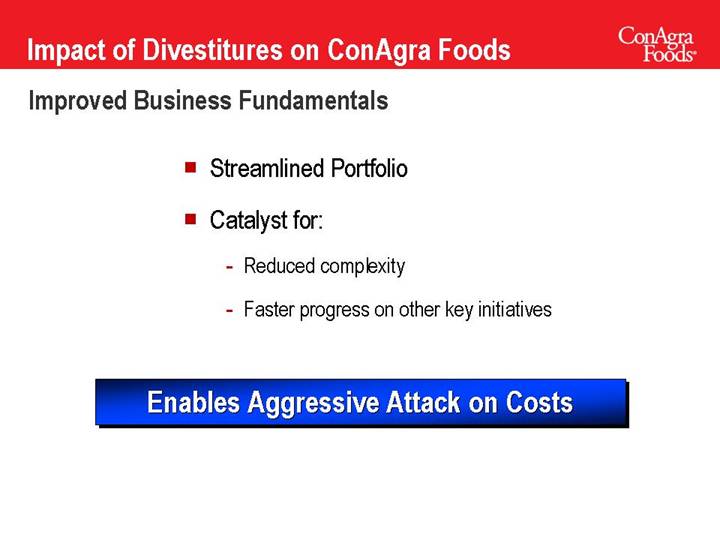
Impact of Divestitures on ConAgra Foods
Improved Business Fundamentals
• Streamlined Portfolio
• Catalyst for:
• Reduced complexity
• Faster progress on other key initiatives
Enables Aggressive Attack on Costs
31
Building the New ConAgra Foods
Culture | |
| |
Portfolio | [GRAPHIC] |
| |
Cost Structure | |
32
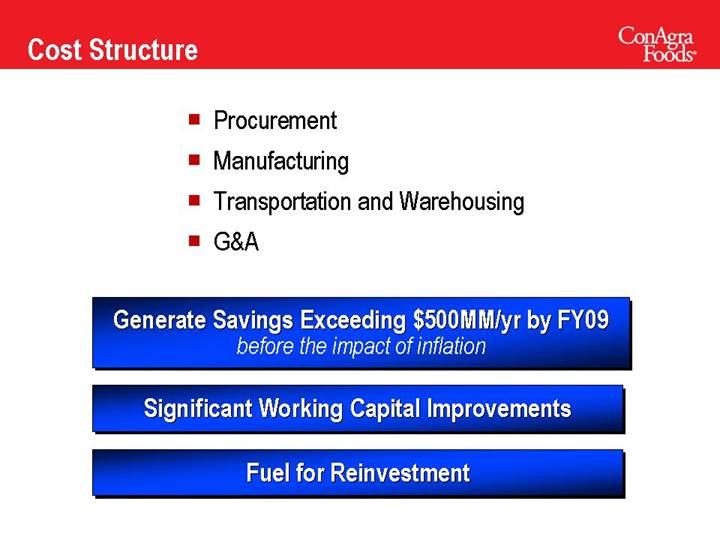
Cost Structure
• Procurement
• Manufacturing
• Transportation and Warehousing
• G&A
Generate Savings Exceeding $500MM/yr by FY09
before the impact of inflation
Significant Working Capital Improvements
Fuel for Reinvestment
33
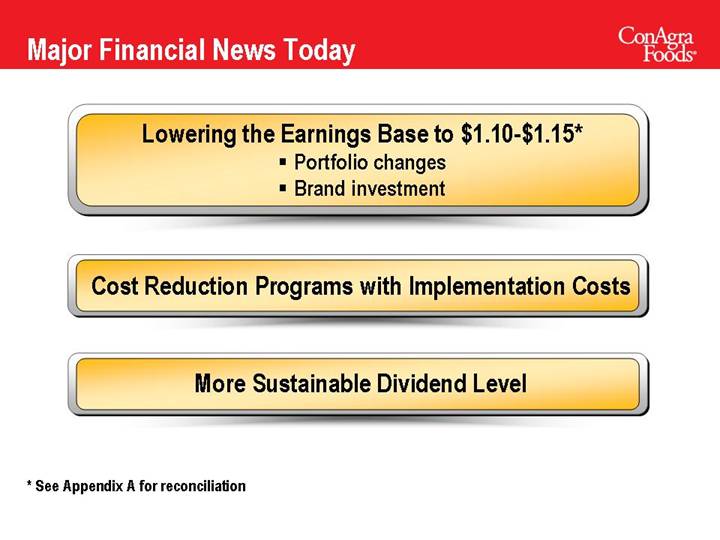
Major Financial News Today
Lowering the Earnings Base to $1.10-$1.15*
• Portfolio changes
• Brand investment
Cost Reduction Programs with Implementation Costs
More Sustainable Dividend Level
* See Appendix A for reconciliation
34
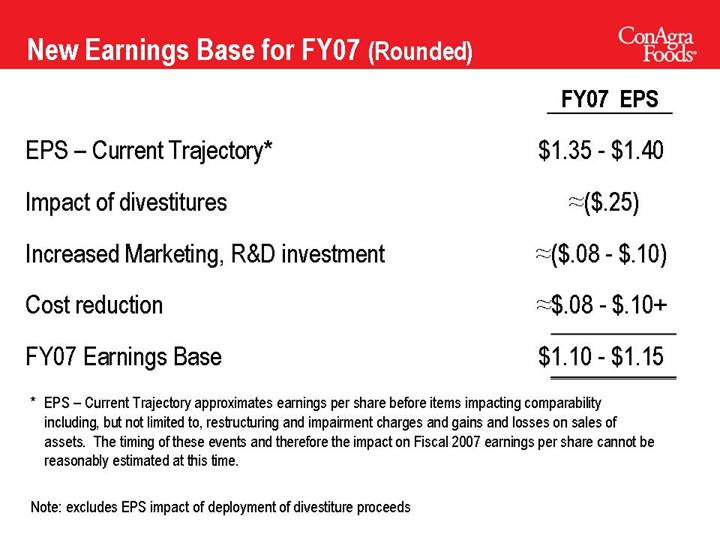
New Earnings Base for FY07 (Rounded)
| | FY07 EPS | |
EPS – Current Trajectory* | | $1.35 - $1.40 | |
| | | |
Impact of divestitures | |  ($.25) ($.25)
| |
| | | |
Increased Marketing, R&D investment | |  ($.08 - $.10) ($.08 - $.10)
| |
| | | |
Cost reduction | |  $.08 - $.10+ $.08 - $.10+
| |
| | | |
FY07 Earnings Base | | $1.10 - $1.15 | |
* EPS – Current Trajectory approximates earnings per share before items impacting comparability including, but not limited to, restructuring and impairment charges and gains and losses on sales of assets. The timing of these events and therefore the impact on Fiscal 2007 earnings per share cannot be reasonably estimated at this time.
Note: excludes EPS impact of deployment of divestiture proceeds
35
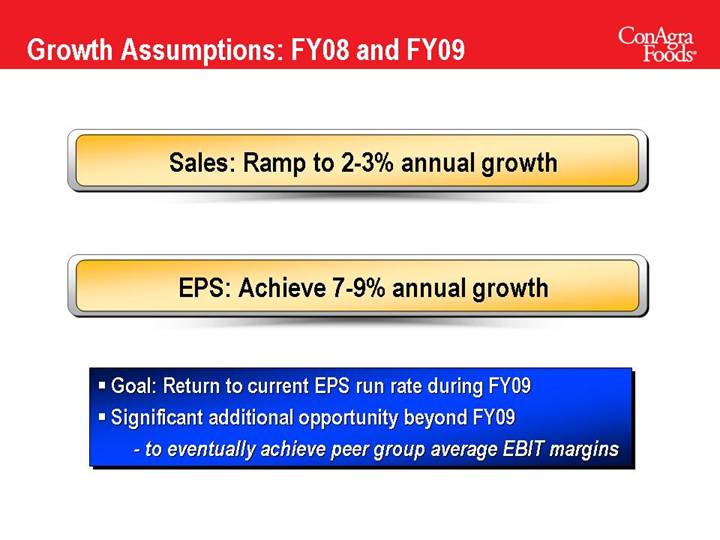
Growth Assumptions: FY08 and FY09
Sales: Ramp to 2-3% annual growth
EPS: Achieve 7-9% annual growth
• Goal: Return to current EPS run rate during FY09
• Significant additional opportunity beyond FY09
• to eventually achieve peer group average EBIT margins
36
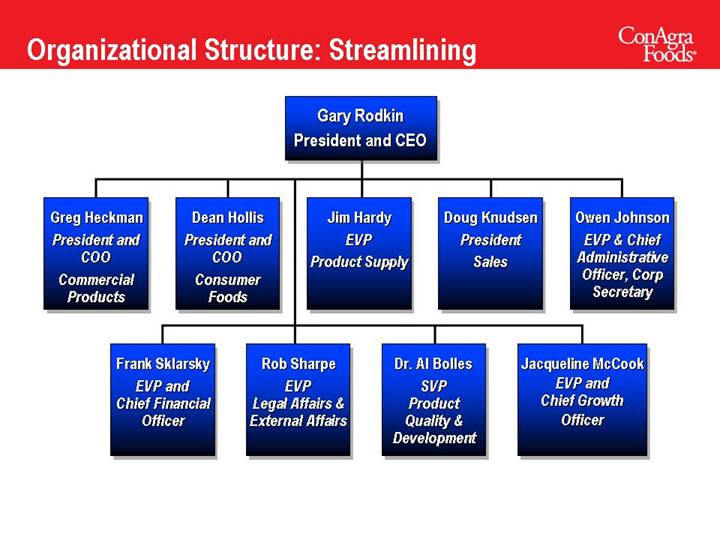
Organizational Structure: Streamlining
| | | | Gary Rodkin
President and CEO | | | | |
| | | | | | | | |
Greg Heckman
President and
COO
Commercial
Products | | Dean Hollis
President and
COO
Consumer
Foods | | Jim Hardy
EVP
Product Supply | | Doug Knudsen
President
Sales | | Owen Johnson
EVP & Chief
Administrative
Officer, Corp
Secretary |
| | | | | | |
Frank Sklarsky
EVP and
Chief Financial
Officer | | Rob Sharpe
EVP
Legal Affairs &
External Affairs | | Dr. Al Bolles
SVP
Product
Quality &
Development | | Jacqueline McCook
EVP and
Chief Growth Officer |
37
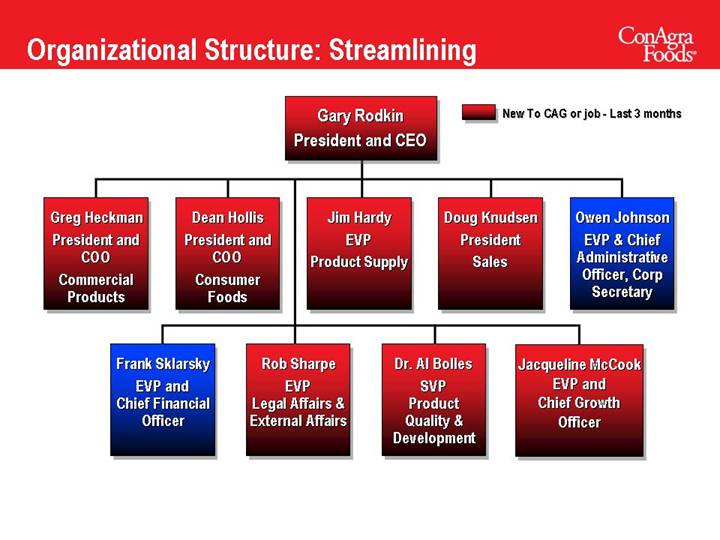
| | | | Gary Rodkin
President and CEO | | New To CAG or job - Last 3 months |
| | | | | | | | |
Greg Heckman
President and
COO
Commercial
Products | | Dean Hollis
President and
COO
Consumer
Foods | | Jim Hardy
EVP
Product Supply | | Doug Knudsen
President
Sales | | Owen Johnson
EVP & Chief
Administrative
Officer, Corp
Secretary |
| | | | | | |
Frank Sklarsky
EVP and
Chief Financial
Officer | | Rob Sharpe
EVP
Legal Affairs &
External Affairs | | Dr. Al Bolles
SVP
Product
Quality &
Development | | Jacqueline McCook
EVP and
Chief Growth
Officer |
38
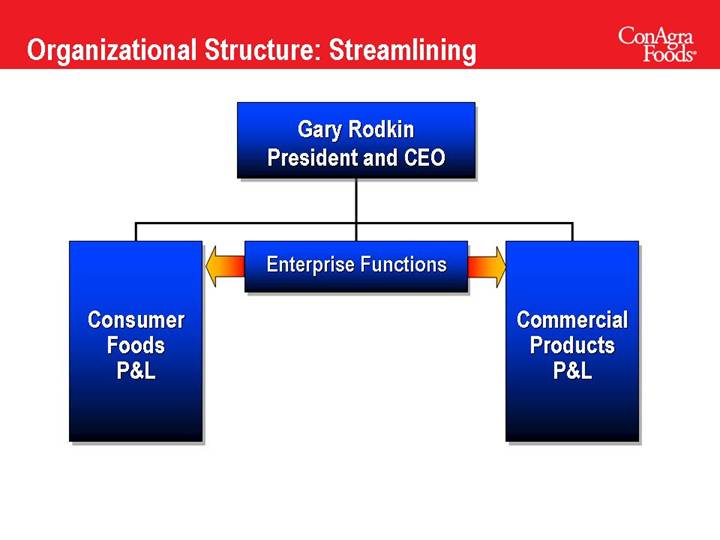
| | Gary Rodkin President and CEO | | |
| | | | |
Consumer
Foods
P&L | | Enterprise Functions | | Commercial
Products
P&L |
39
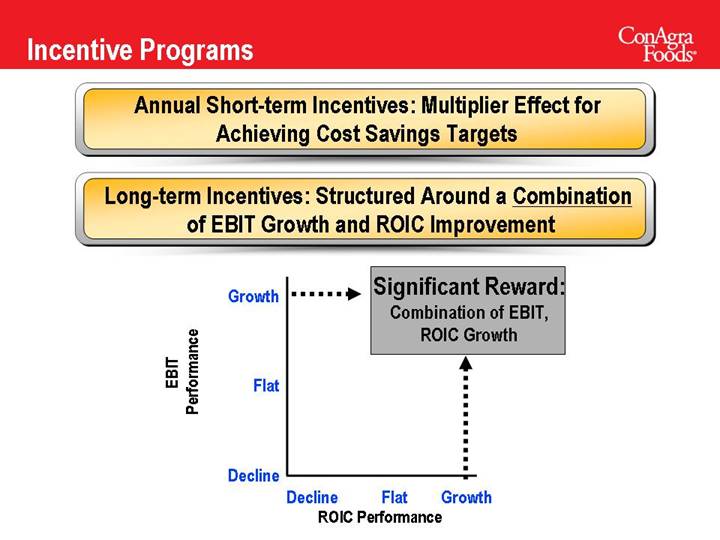
Incentive Programs
Annual Short-term Incentives: Multiplier Effect for Achieving Cost Savings Targets
Long-term Incentives: Structured Around a Combination
of EBIT Growth and ROIC Improvement
[CHART]
40
Former Vision
America’s
Favorite
Food Company
41
New Focus
The New CAG:
A true operating company
that delivers sustainable
profitable growth
42
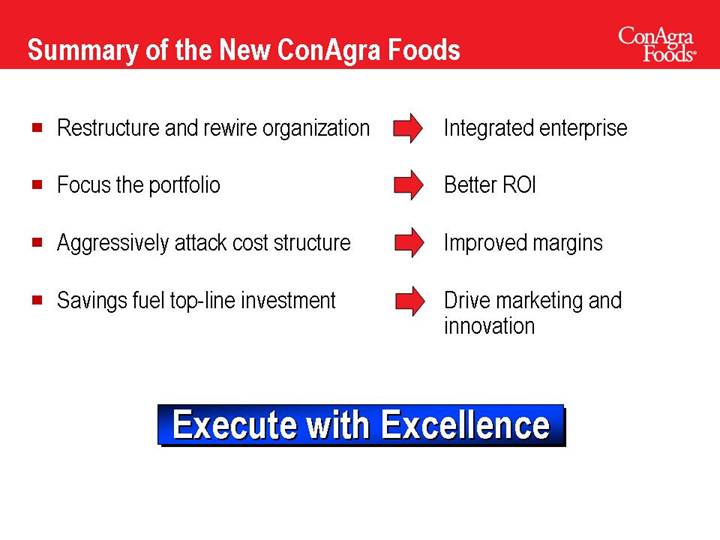
Summary of the New ConAgra Foods
• | | Restructure and rewire organization | | Integrated enterprise | |
• | | Focus the portfolio | | Better ROI | |
• | | Aggressively attack cost structure | | Improved margins | |
• | | Savings fuel top-line investment | | Drive marketing and innovation | |
Execute with Excellence
43
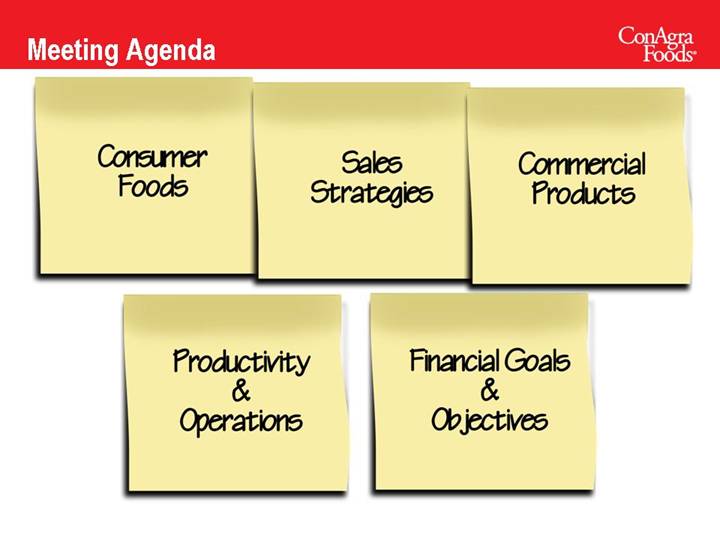
Meeting Agenda
Consumer
Foods | | Sales
Strategies | | Commercial
Products |
Productivity
&
Operations | | Financial Goals
&
Objectives |
44
[GRAPHIC]
[LOGO]
MARCH 2006
Analyst & Investor Event
Consumer Foods
Dean Hollis
President & COO,
Consumer Foods
45
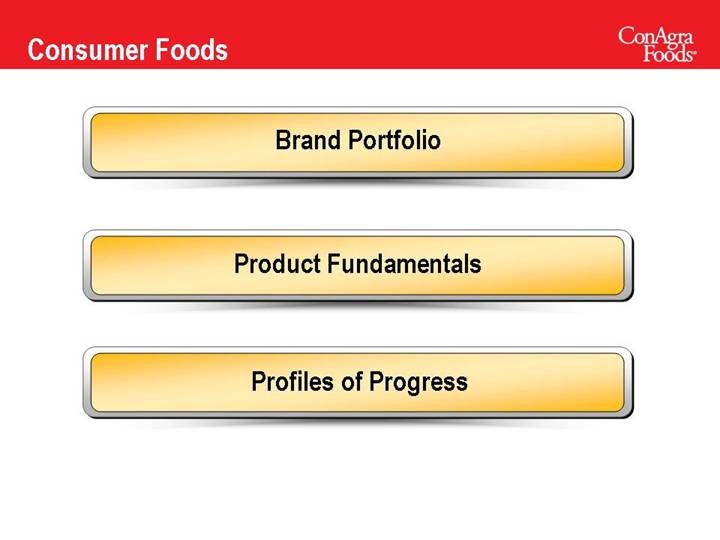
Consumer Foods
[LOGO]
Brand Portfolio
Product Fundamentals
Profiles of Progress
46
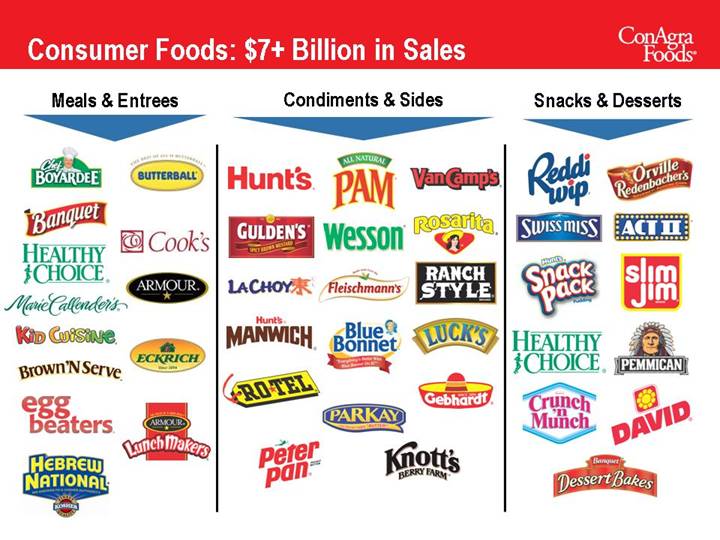
Consumer Foods: $7+ Billion in Sales
Meals & Entrees | | Condiments & Sides | | Snacks & Desserts |
| | | | |
[LOGO] | | [LOGO] | | [LOGO] |
47
Brand Portfolio
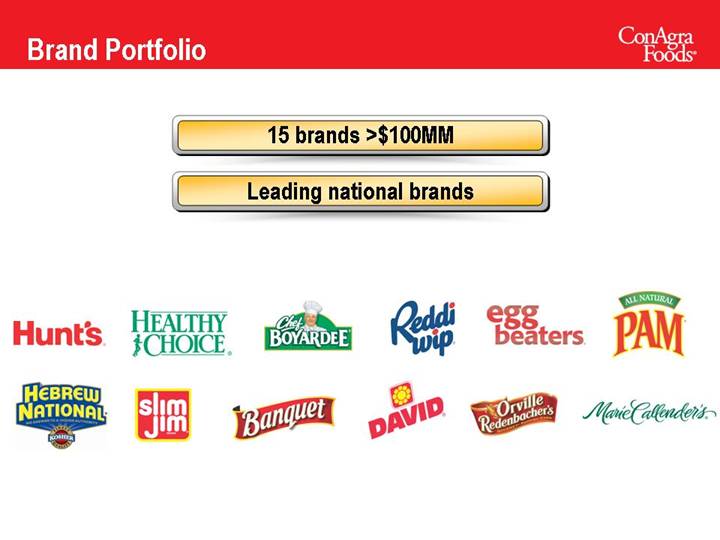
15 brands >$100MM
Leading national brands
[LOGO]
48
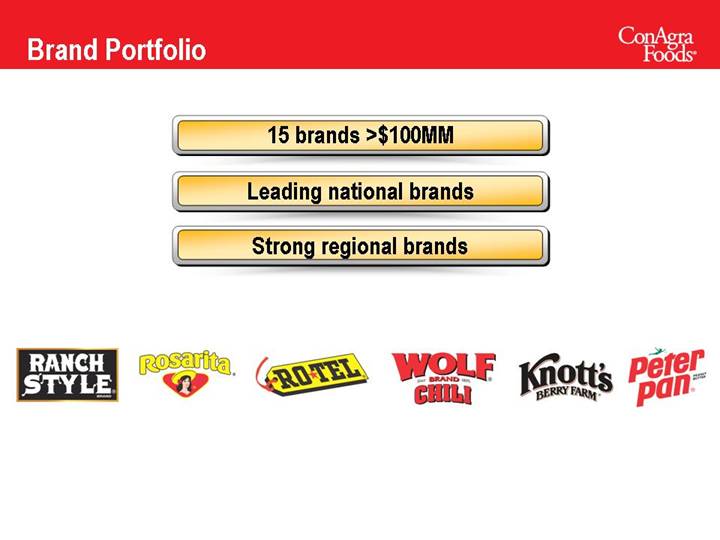
15 brands >$100MM
Leading national brands
Strong regional brands
[LOGO]
49
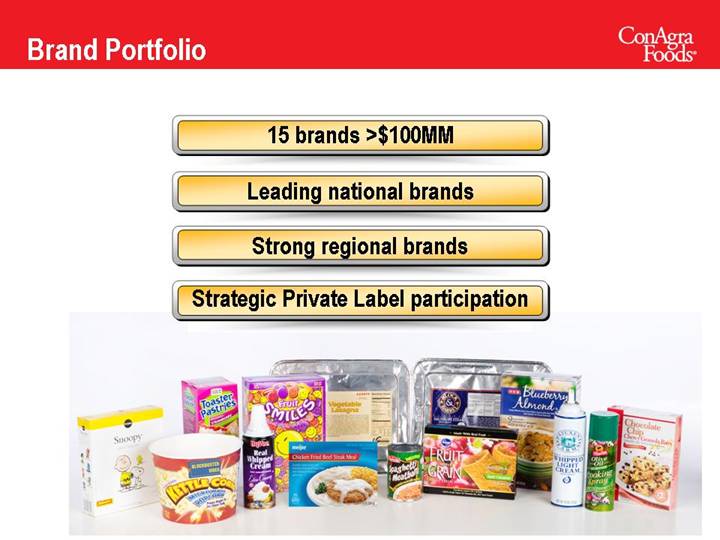
15 brands >$100MM
Leading national brands
Strong regional brands
Strategic Private Label participation
[GRAPHIC]
50
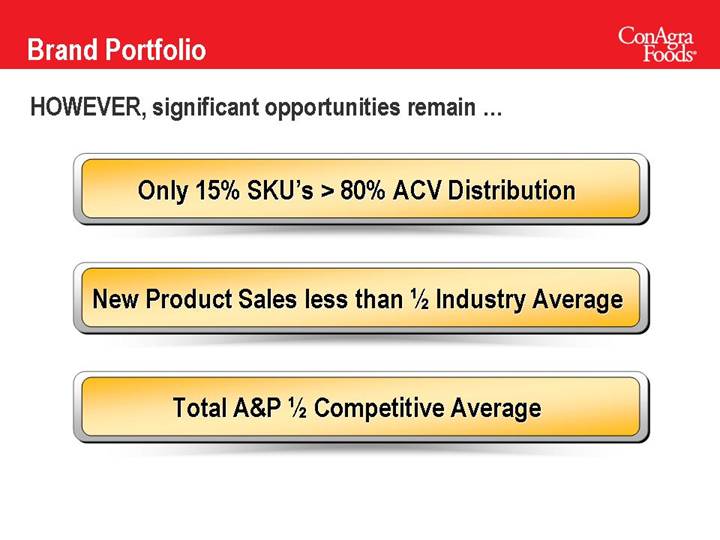
HOWEVER, significant opportunities remain …
Only 15% SKU’s > 80% ACV Distribution
New Product Sales less than 1/2 Industry Average
Total A&P ½ Competitive Average
51
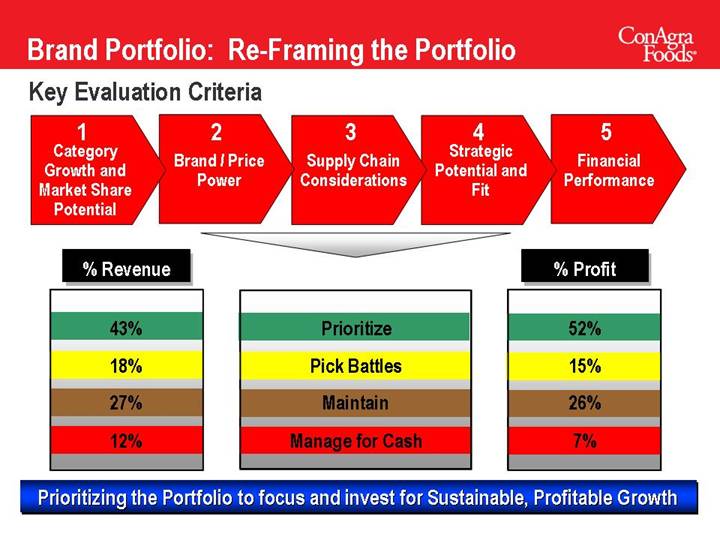
Brand Portfolio: Re-Framing the Portfolio
Key Evaluation Criteria
1 | | 2 | | 3 | | 4 | | 5 |
Category Growth and Market Share Potential | | Brand / Price
Power | | Supply Chain
Considerations | | Strategic
Potential and
Fit | | Financial
Performance |
% Revenue | | | | % Profit |
| | | | |
43% | | Prioritize | | 52% |
| | | | |
18% | | Pick Battles | | 15% |
| | | | |
27% | | Maintain | | 26% |
| | | | |
12% | | Manage for Cash | | 7% |
Prioritizing the Portfolio to focus and invest for Sustainable, Profitable Growth
52
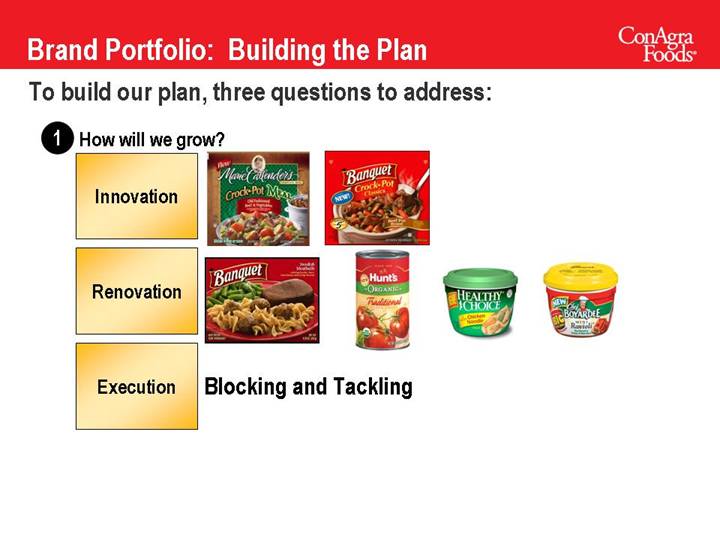
Brand Portfolio: Building the Plan
To build our plan, three questions to address:
1 How will we grow?
Innovation | | [GRAPHIC] | | | | | | |
| | | | | | | | |
Renovation | | [GRAPHIC] | | | | | | |
| | | | | | | | |
Execution | | Blocking and Tackling | | | | | | |
53
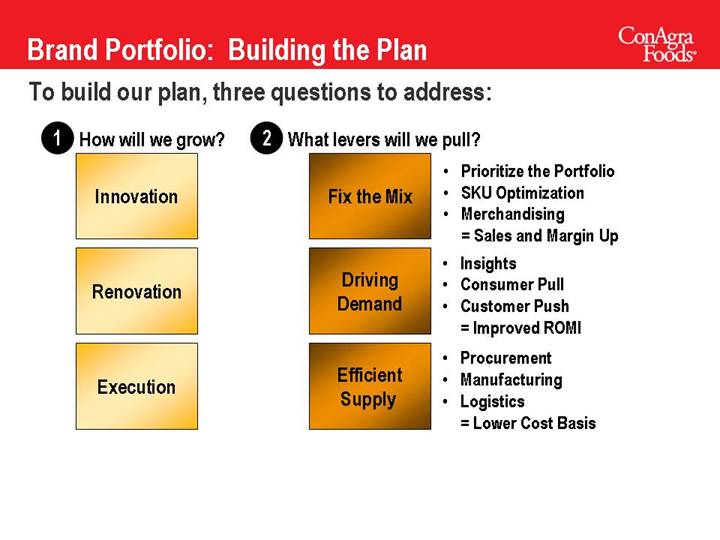
To build our plan, three questions to address:
1 How will we grow? | | 2 What levers will we pull? | | |
| | | | |
Innovation
| | Fix the Mix
| | • Prioritize the Portfolio
• SKU Optimization
• Merchandising • Sales and Margin Up |
| | | | |
Renovation
| | Driving
Demand
| | • Insights
• Consumer Pull
• Customer Push • Improved ROMI |
| | | | |
Execution
| | Efficient
Supply
| | • Procurement
• Manufacturing
• Logistics • Lower Cost Basis |
54
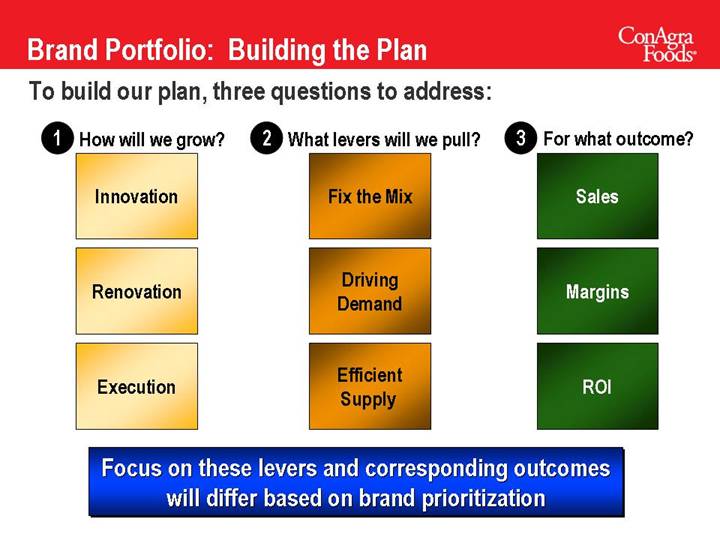
To build our plan, three questions to address:
1 How will we grow? | | 2 What levers will we pull? | | 3 For what outcome? |
| | | | |
Innovation | | Fix the Mix | | Sales |
| | | | |
Renovation
| | Driving
Demand | | Margins
|
| | | | |
Execution
| | Efficient
Supply | | ROI
|
Focus on these levers and corresponding outcomes will differ based on brand prioritization
55
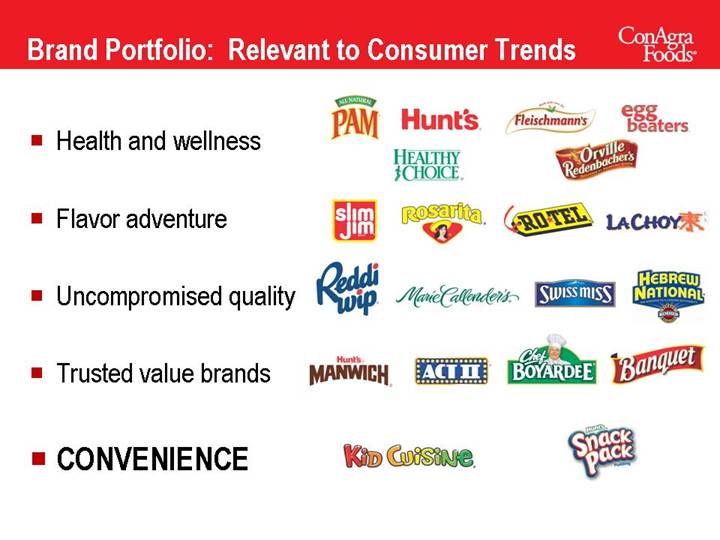
Brand Portfolio: Relevant to Consumer Trends
• Health and wellness | | [LOGO] |
| | |
• Flavor adventure | | |
| | |
• Uncompromised quality | | |
| | |
• Trusted value brands | | |
| | |
• CONVENIENCE | | |
56
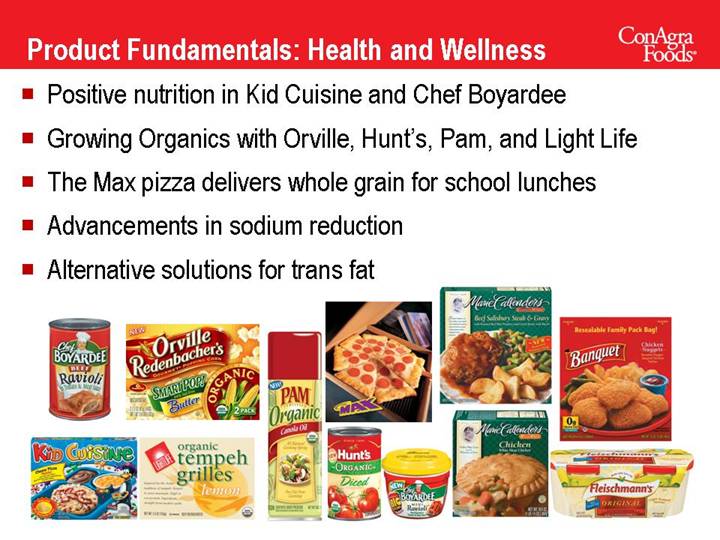
Product Fundamentals: Health and Wellness
• Positive nutrition in Kid Cuisine and Chef Boyardee
• Growing Organics with Orville, Hunt’s, Pam, and Light Life
• The Max pizza delivers whole grain for school lunches
• Advancements in sodium reduction
• Alternative solutions for trans fat
[GRAPHIC]
57
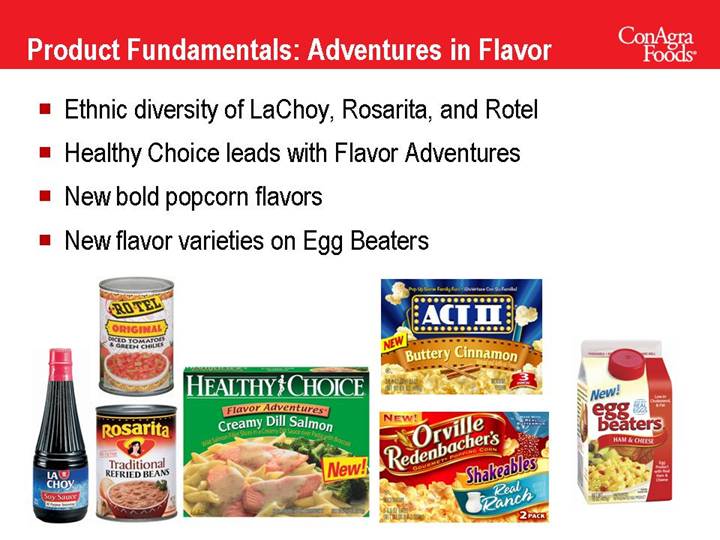
Product Fundamentals: Adventures in Flavor
• Ethnic diversity of LaChoy, Rosarita, and Rotel
• �� Healthy Choice leads with Flavor Adventures
• New bold popcorn flavors
• New flavor varieties on Egg Beaters
[GRAPHIC]
58
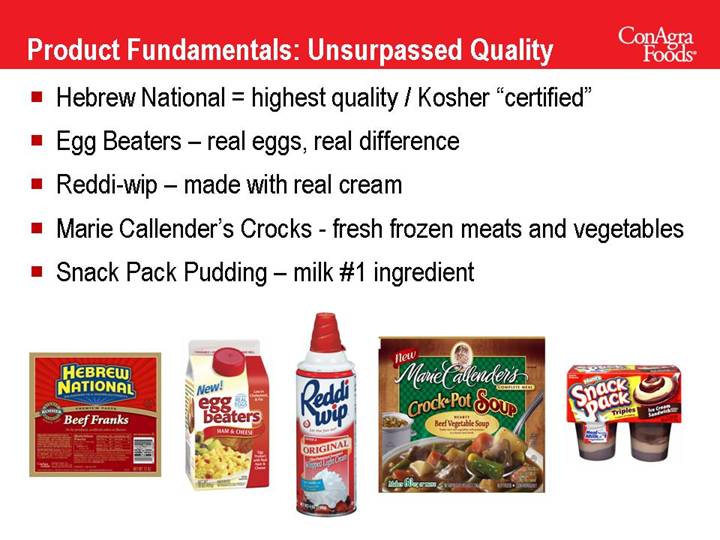
Product Fundamentals: Unsurpassed Quality
• Hebrew National = highest quality / Kosher “certified”
• Egg Beaters – real eggs, real difference
• Reddi-wip – made with real cream
• Marie Callender’s Crocks - fresh frozen meats and vegetables
• Snack Pack Pudding – milk #1 ingredient
[GRAPHIC]
59
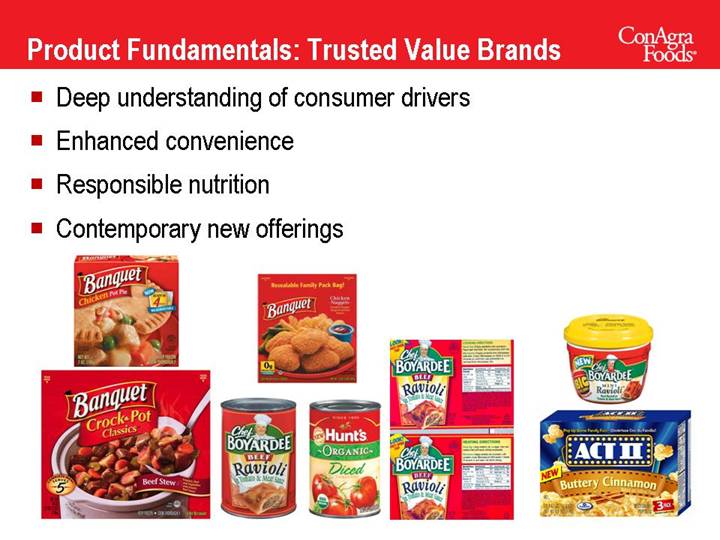
Product Fundamentals: Trusted Value Brands
• Deep understanding of consumer drivers
• Enhanced convenience
• Responsible nutrition
• Contemporary new offerings
[GRAPHIC]
60
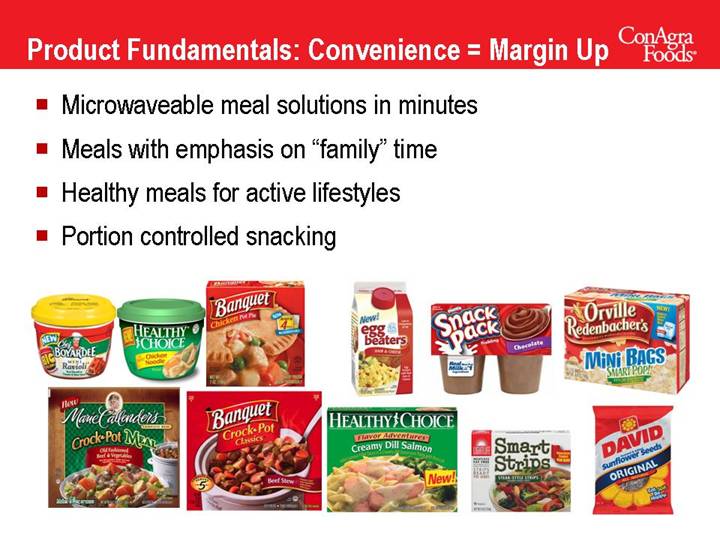
Product Fundamentals: Convenience = Margin Up
• Microwaveable meal solutions in minutes
• Meals with emphasis on “family” time
• Healthy meals for active lifestyles
• Portion controlled snacking
[GRAPHIC]
61
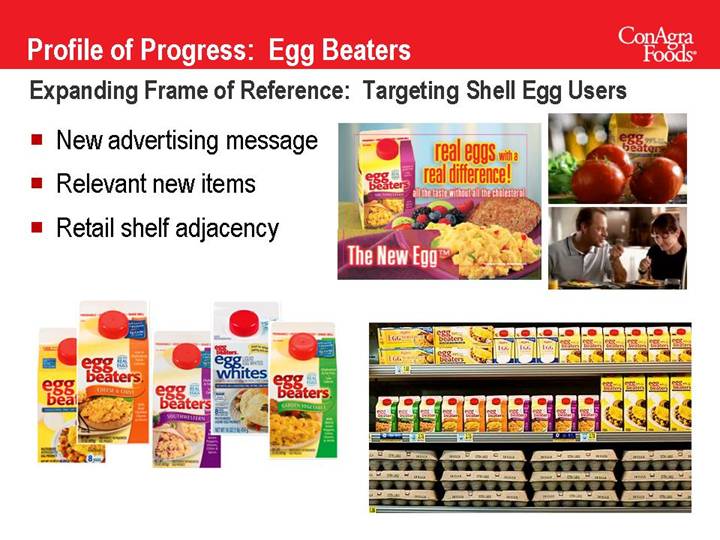
Profile of Progress: Egg Beaters
Expanding Frame of Reference: Targeting Shell Egg Users
• New advertising message
• Relevant new items
• Retail shelf adjacency
[GRAPHIC]
62
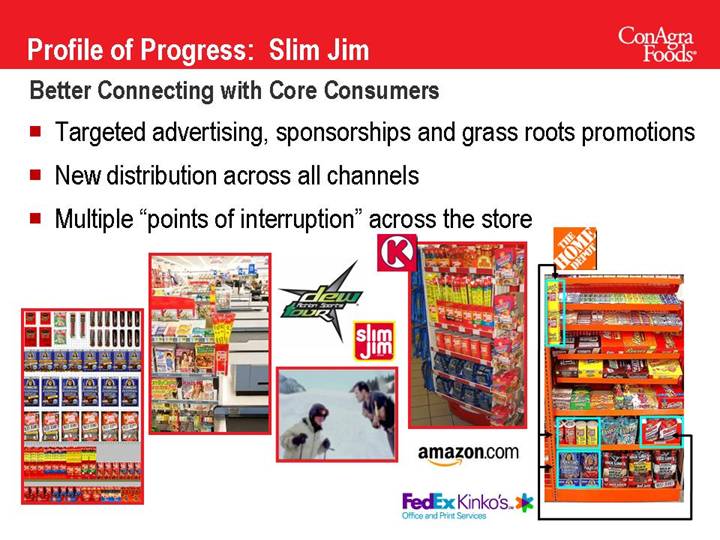
Profile of Progress: Slim Jim
Better Connecting with Core Consumers
• Targeted advertising, sponsorships and grass roots promotions
• New distribution across all channels
• Multiple “points of interruption” across the store
[GRAPHIC]
64
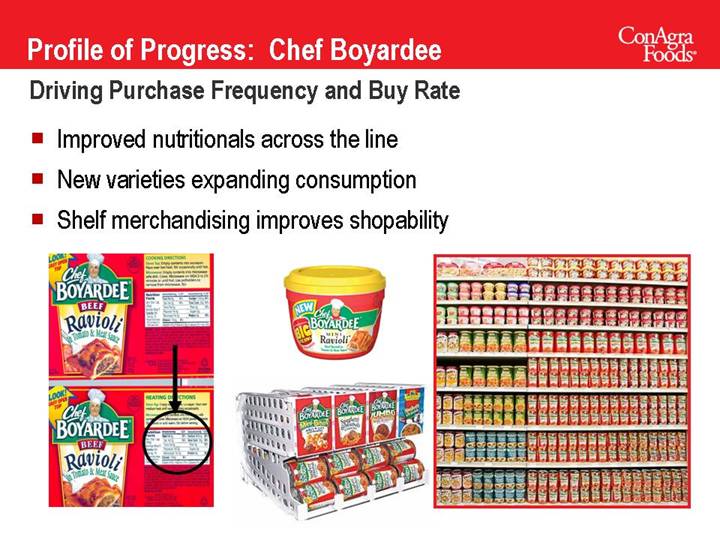
Profile of Progress: Chef Boyardee
Driving Purchase Frequency and Buy Rate
• Improved nutritionals across the line
• New varieties expanding consumption
• Shelf merchandising improves shopability
[GRAPHIC]
65
Profile of Progress: Reddi-wip
Increasing Usage Occasions
• In-store tie-ins with seasonal “host foods”
• New advertising and in-store promotions reinforcing everyday usage
• New distribution opportunities, initially in club channel
[GRAPHIC]
67
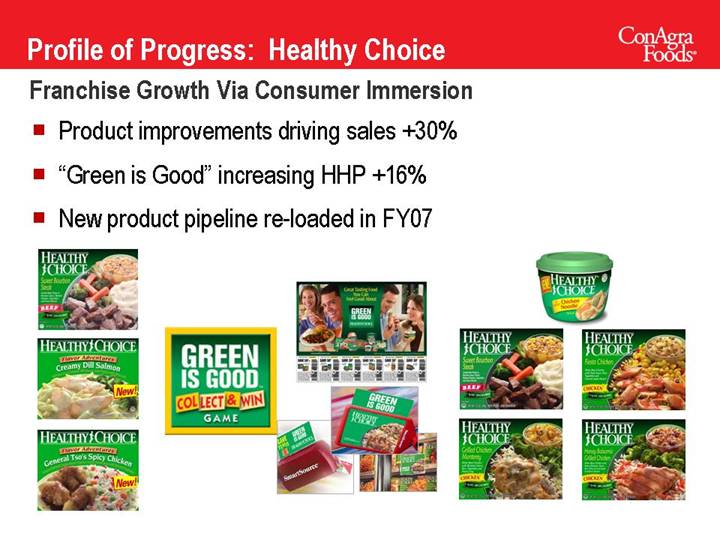
Profile of Progress: Healthy Choice
Franchise Growth Via Consumer Immersion
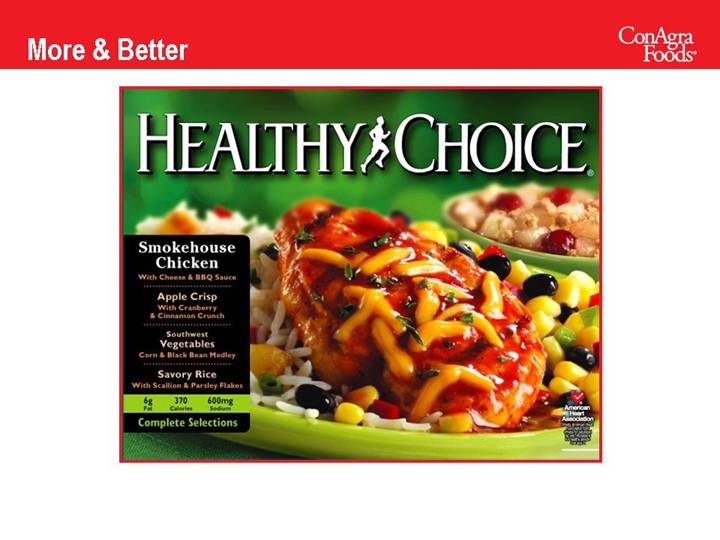
• Product improvements driving sales +30%
• “Green is Good” increasing HHP +16%
• New product pipeline re-loaded in FY07
[GRAPHIC]
68
The New ConAgra Foods
Finally, Prioritizing the Brand Portfolio
Focused on Meaningful Consumer Trends
Serious about Renovation and Innovation
Execute with Excellence
69
[GRAPHIC]
[LOGO]
MARCH 2006
Analyst & Investor Event
Sales Strategies
Doug Knudsen
President, Sales
[LOGO]
70
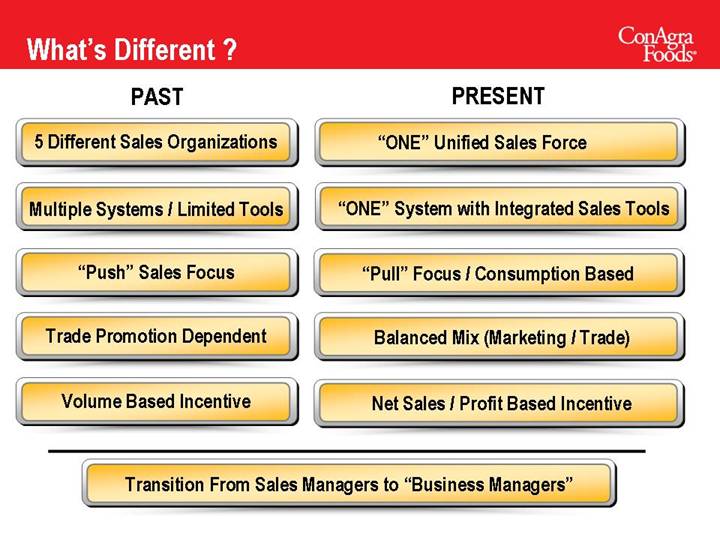
What’s Different ?
PAST | | PRESENT |
| | |
5 Different Sales Organizations | | “ONE” Unified Sales Force |
| | |
Multiple Systems / Limited Tools | | “ONE” System with Integrated Sales Tools |
| | |
“Push” Sales Focus | | “Pull” Focus / Consumption Based |
| | |
Trade Promotion Dependent | | Balanced Mix (Marketing / Trade) |
| | |
Volume Based Incentive | | Net Sales / Profit Based Incentive |
Transition From Sales Managers to “Business Managers”
71
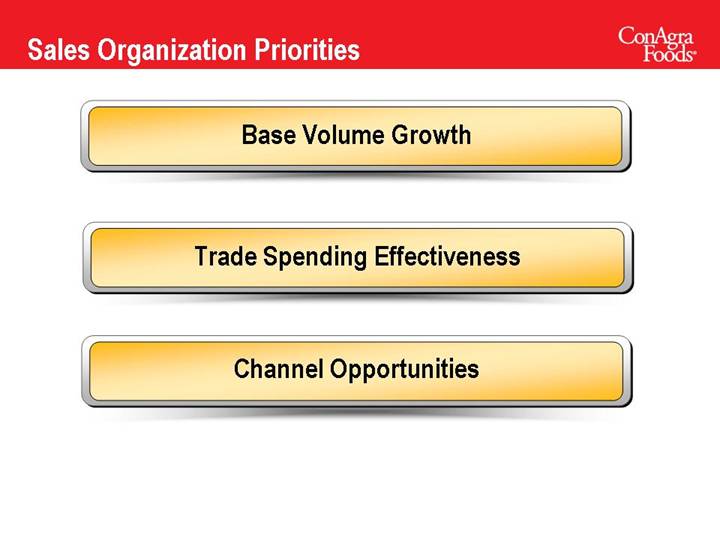
Sales Organization Priorities
Base Volume Growth
Trade Spending Effectiveness
Channel Opportunities
72
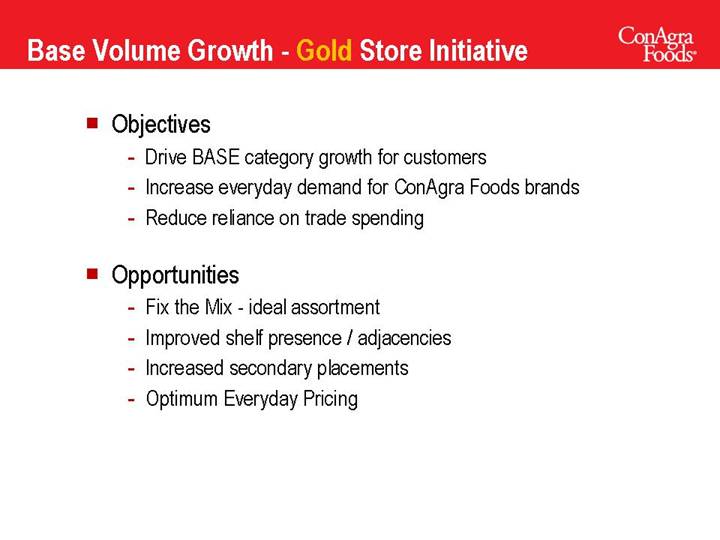
Base Volume Growth - Gold Store Initiative
• Objectives
• Drive BASE category growth for customers
• Increase everyday demand for ConAgra Foods brands
• Reduce reliance on trade spending
• Opportunities
• Fix the Mix - ideal assortment
• Improved shelf presence / adjacencies
• Increased secondary placements
• Optimum Everyday Pricing
73
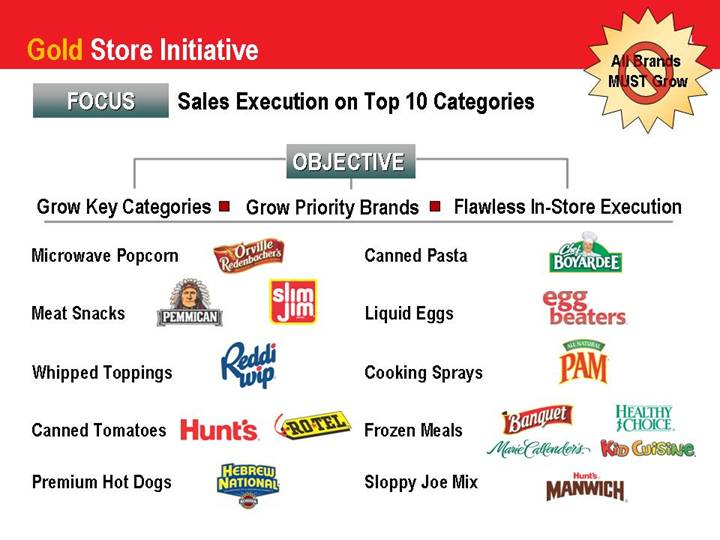
Gold Store Initiative | [GRAPHIC] |
All Brands MUST Grow
FOCUS Sales Execution on Top 10 Categories
OBJECTIVE
Grow Key Categories | | • Grow Priority Brands | | • Flawless In-Store Execution |
Microwave Popcorn | | | | Canned Pasta | | |
| | | | | | |
Meat Snacks | | | | Liquid Eggs | | |
| | | | | | |
Whipped Toppings | | [LOGO] | | Cooking Sprays | | [LOGO] |
| | | | | | |
Canned Tomatoes | | | | Frozen Meals | | |
| | | | | | |
Premium Hot Dogs | | | | Sloppy Joe Mix | | |
74
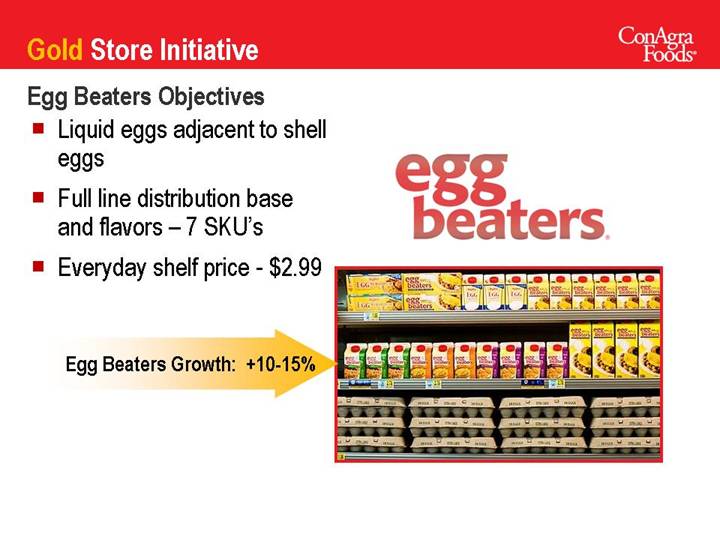
Egg Beaters Objectives
• | Liquid eggs adjacent to shell eggs | |
| | |
• | Full line distribution base and flavors – 7 SKU’s | [LOGO] |
| | |
• | Everyday shelf price - $2.99 | |
| | |
| Egg Beaters Growth: +10-15% | [GRAPHIC] |
75
Whipped Topping Objectives
• | Adjacent to rfg pudding at eye level | |
| | |
• | Minimum 5 SKU’s | |
| | |
• | Cooler Program with Host Foods | [LOGO] |
| | |
| • Cocoa, Pies, Berries, Ice Cream | |
| | |
| Reddi-Wip Growth: +10-12% | [GRAPHIC] |
| | |
| [GRAPHIC] | |
76
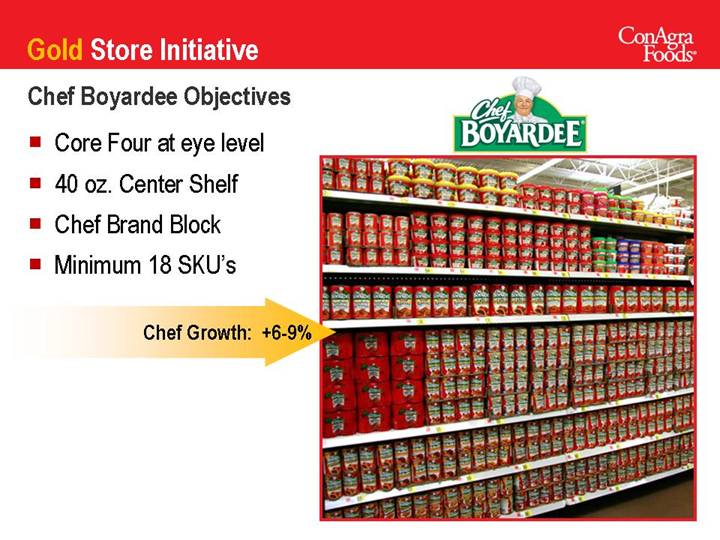
Chef Boyardee Objectives
• | Core Four at eye level | |
| | |
• | 40 oz. Center Shelf | |
| | [LOGO] |
• | Chef Brand Block | |
| | |
• | Minimum 18 SKU’s | |
| | |
| Chef Growth: +6-9% | [GRAPHIC] |
77
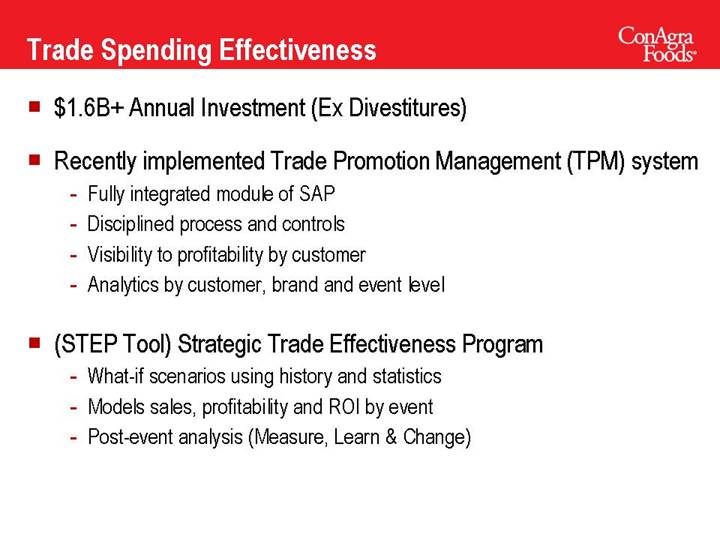
Trade Spending Effectiveness
• $1.6B+ Annual Investment (Ex Divestitures)
• Recently implemented Trade Promotion Management (TPM) system
• Fully integrated module of SAP
• Disciplined process and controls
• Visibility to profitability by customer
• Analytics by customer, brand and event level
• (STEP Tool) Strategic Trade Effectiveness Program
• What-if scenarios using history and statistics
• Models sales, profitability and ROI by event
• Post-event analysis (Measure, Learn & Change)
78
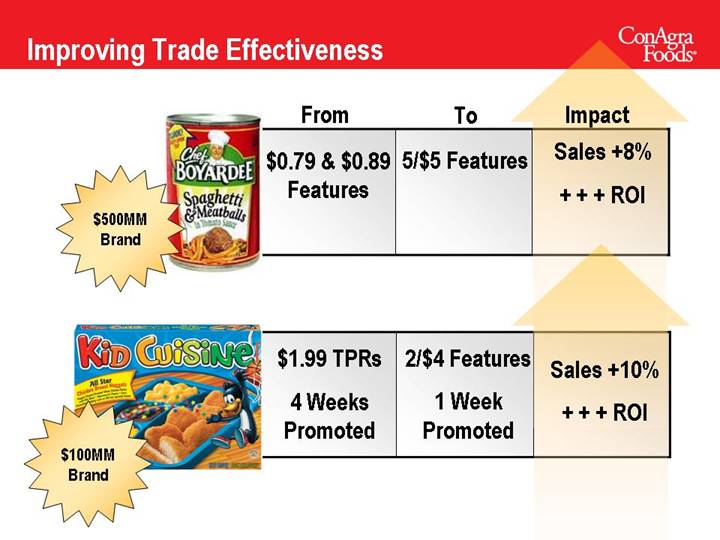
Improving Trade Effectiveness
| | From | | To | | Impact |
| | | | | | |
[GRAPHIC]
$500MM Brand | | $0.79 & $0.89
Features | | 5/$5 Features | | Sales +8%
+ + + ROI |
| | | | | | |
[GRAPHIC] | | $1.99 TPRs | | 2/$4 Features | | |
$100MM Brand | | | | | | Sales +10% |
| | 4 Weeks | | 1 Week | | + + + ROI |
| | Promoted | | Promoted | | |
79
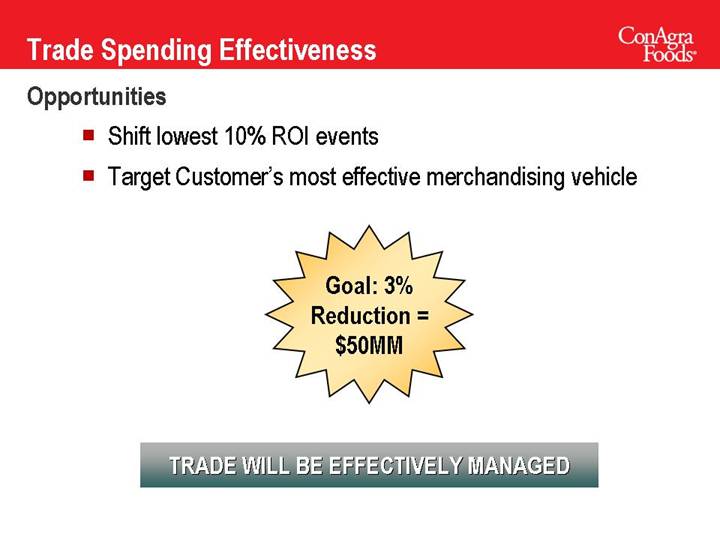
Trade Spending Effectiveness
Opportunities
• Shift lowest 10% ROI events
• Target Customer’s most effective merchandising vehicle
Goal: 3% Reduction = $50MM
TRADE WILL BE EFFECTIVELY MANAGED
80
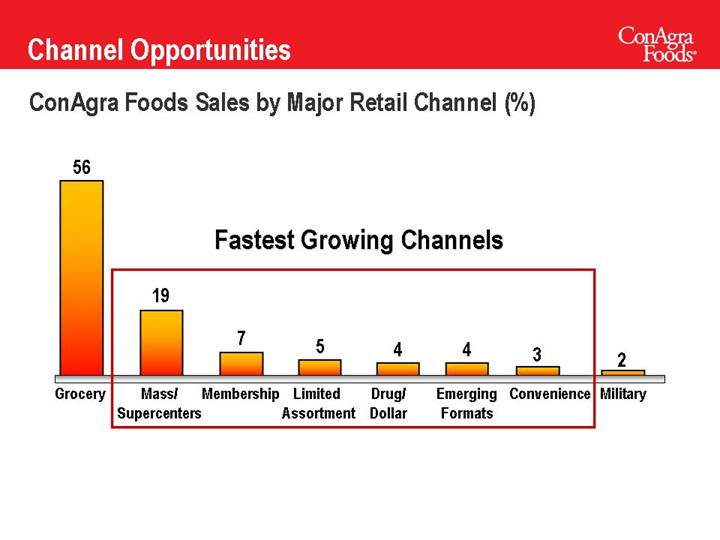
Channel Opportunities
ConAgra Foods Sales by Major Retail Channel (%)
Fastest Growing Channels
[CHART]
81
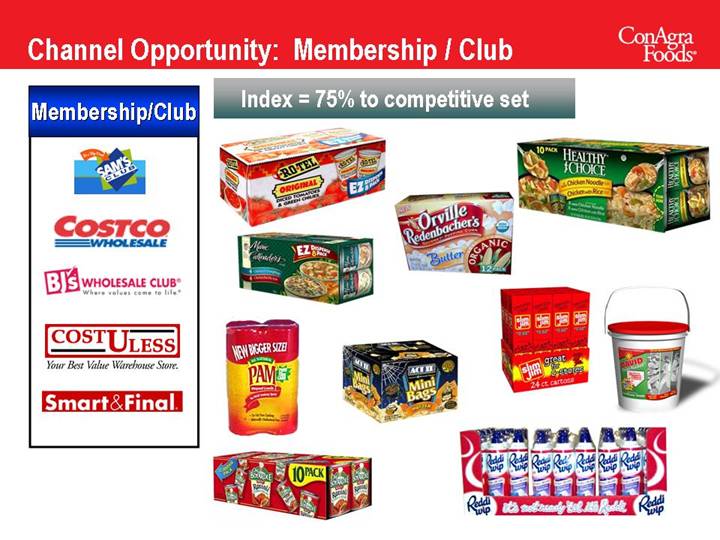
Channel Opportunity: Membership / Club
| Index = 75% to competitive set |
Membership/Club | |
| |
[GRAPHIC] | [GRAPHIC] |
82
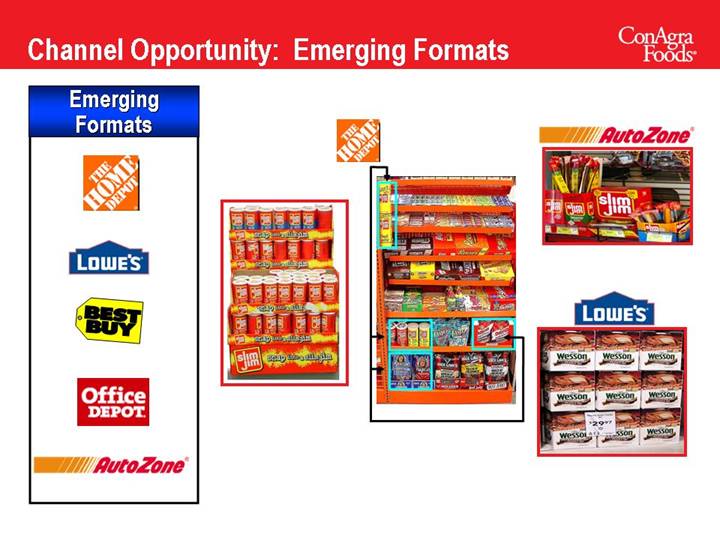
Channel Opportunity: Emerging Formats
Emerging Formats | |
| |
[LOGO] | [GRAPHIC] |
83
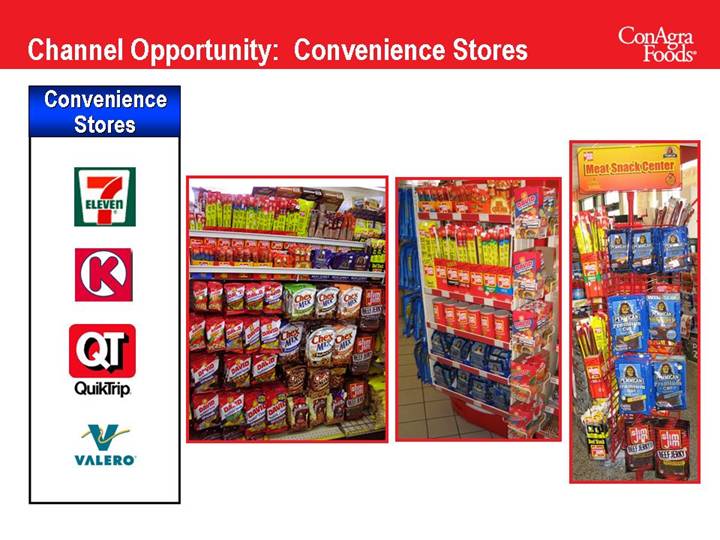
Channel Opportunity: Convenience Stores
Convenience Stores | |
| |
[LOGO] | [GRAPHIC] |
84
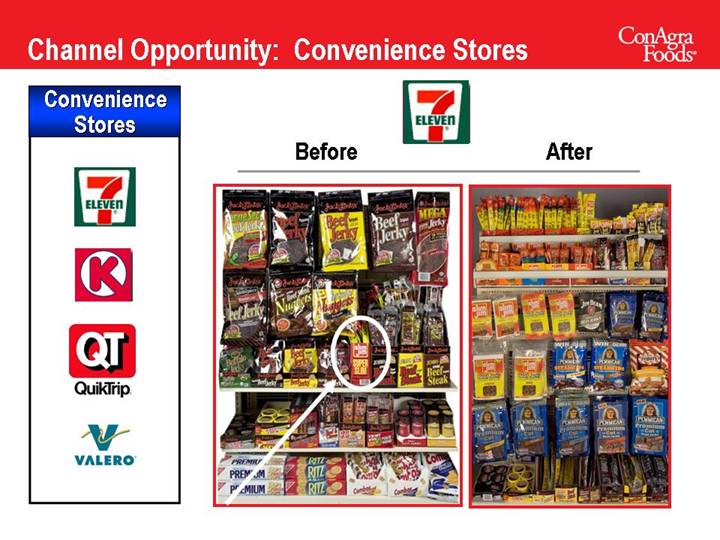
Convenience Stores | | [LOGO] |
| | Before | | After |
| | | | |
[LOGO] | | [GRAPHIC] | | [GRAPHIC] |
85
The New ConAgra Foods
Base Volume Growth
Trade Spending Effectiveness
Channel Opportunities
Execute with Excellence
86
[GRAPHIC] | [LOGO] | |
| MARCH 2006 | |
| Analyst & Investor Event | |
| Commercial Products | |
| | |
| Greg Heckman | |
| | |
| President & COO, | |
| Commercial Products | |
[LOGO]
87
Food Products Sales Channel Breakdown
Consumer
Foods | | Sales
Channels | | Commercial
Products |
| | | | |
80% | | Retail Outlets | | 10% |
| | | | |
15% | | Foodservice | | 60% |
| | | | |
5% | | Food Mfg/Industrial | | 30% |
88
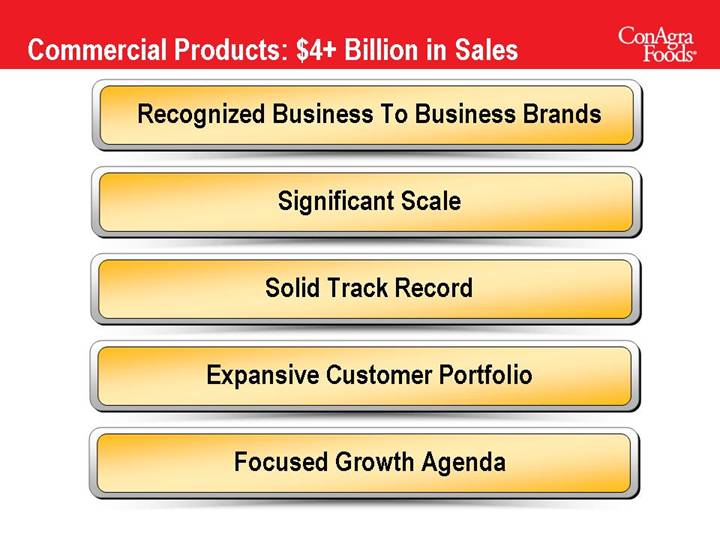
Commercial Products: $4+ Billion in Sales
Recognized Business To Business Brands
Significant Scale
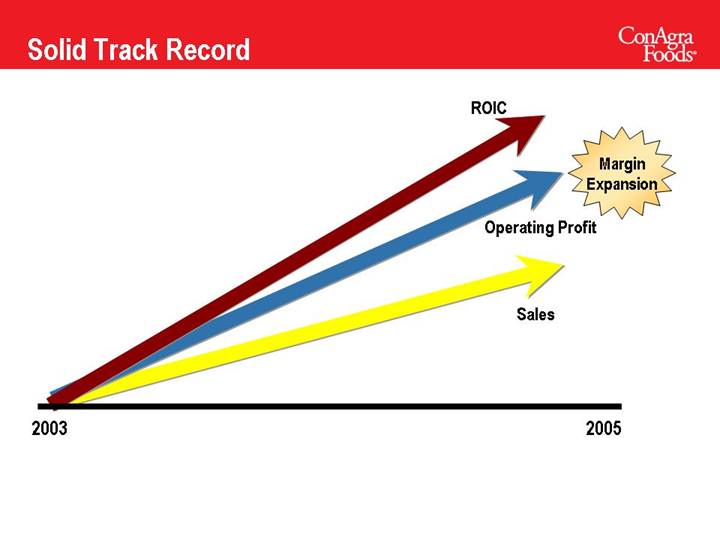
Solid Track Record
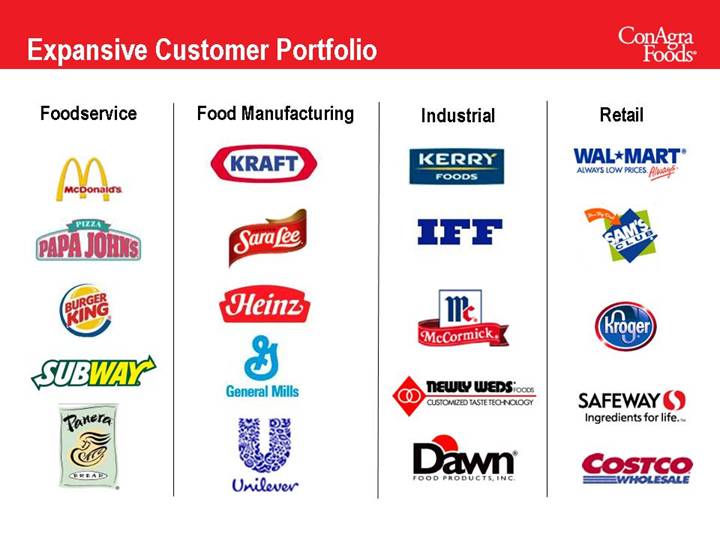
Expansive Customer Portfolio
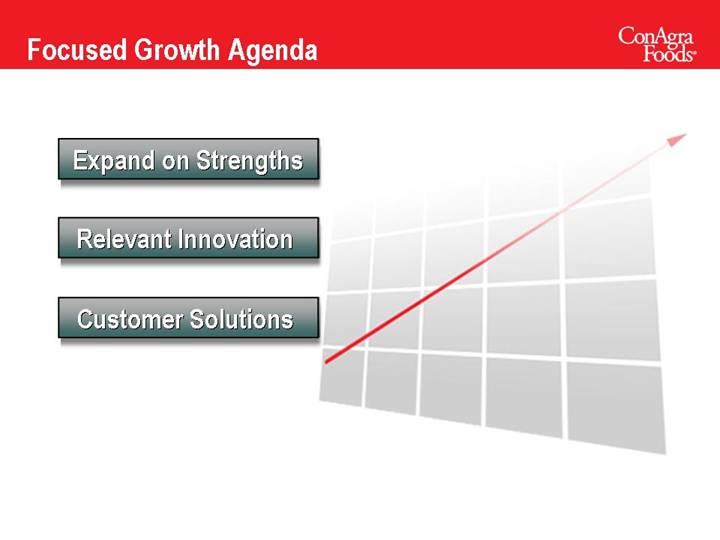
Focused Growth Agenda
89
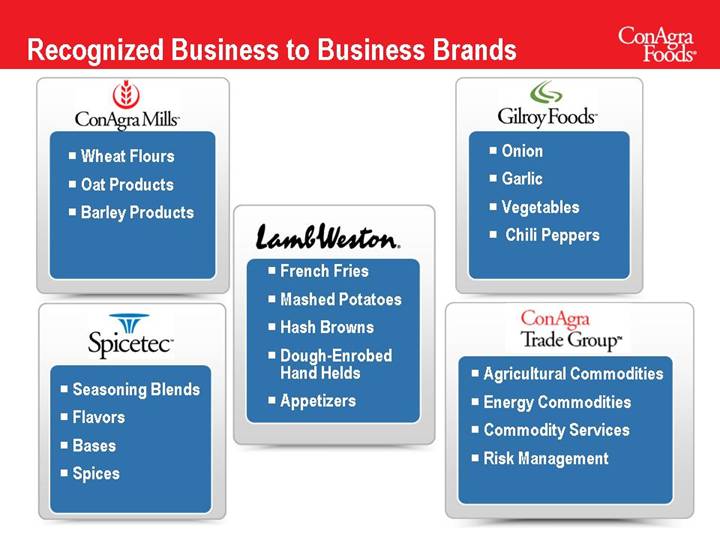
Recognized Business to Business Brands
[LOGO] | | | | [LOGO] |
| | | | |
• Wheat Flours | | | | • Onion |
• Oat Products | | | | • Garlic |
• Barley Products | | [LOGO] | | • Vegetables |
| | | | • Chili Peppers |
| | • French Fries | | |
| | • Mashed Potatoes | | |
[LOGO] | | • Hash Browns | | |
| | • Dough-Enrobed Hand Helds | | |
• Seasoning Blends | | • Appetizers | | [LOGO] |
• Flavors | | | | |
• Bases | | | | • Agricultural Commodities |
• Spices | | | | • Energy Commodities |
| | | | • Commodity Services |
| | | | • Risk Management |
90
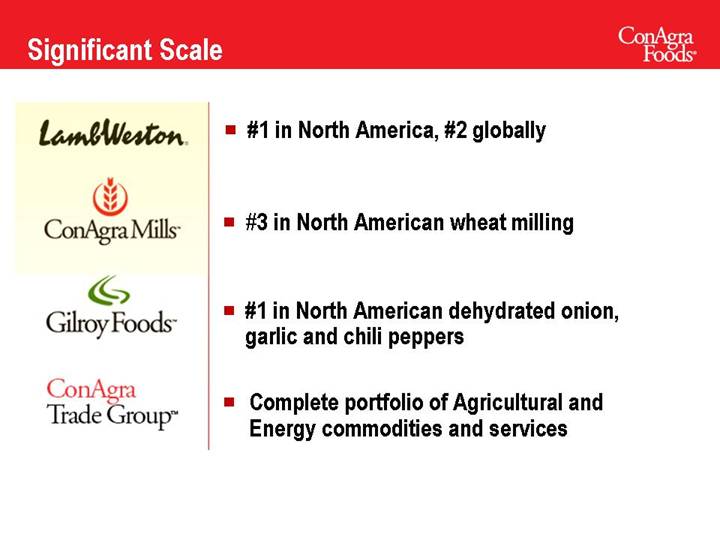
Significant Scale
[LOGO] | | • #1 in North America, #2 globally |
| | |
| | • #3 in North American wheat milling |
| | |
| | • #1 in North American dehydrated onion, garlic and chili peppers |
| | |
| | • Complete portfolio of Agricultural and Energy commodities and services |
91
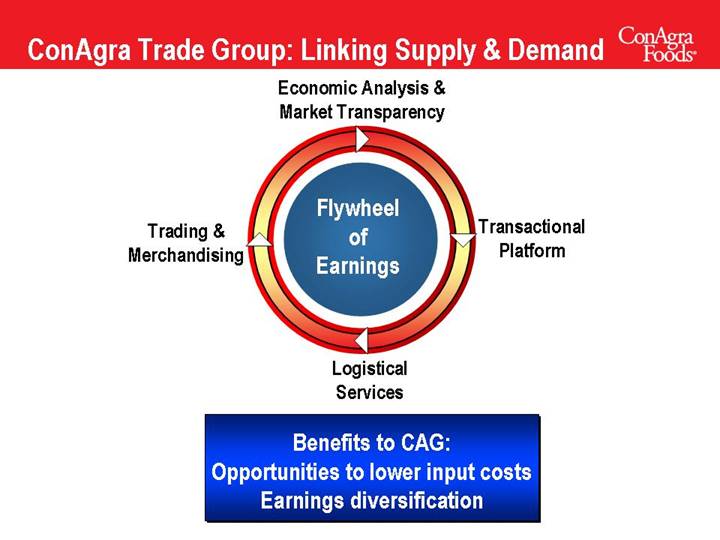
ConAgra Trade Group: Linking Supply & Demand
| Economic Analysis & | |
| Market Transparency | |
| | |
| | |
Trading & | Flywheel | Transactional |
Merchandising | of | Platform |
| Earnings | |
| | |
| | |
| Logistical | |
| Services | |
Benefits to CAG:
Opportunities to lower input costs
Earnings diversification
92
Solid Track Record
[CHART]
93
Expansive Customer Portfolio
Foodservice | | Food Manufacturing | | Industrial | | Retail | |
| | | | | | | |
| | | | | | | |
[LOGO] | | [LOGO] | | [LOGO] | | [LOGO] | |
94
Focused Growth Agenda
Expand on Strengths | | |
| | |
Relevant Innovation | | [CHART] |
| | |
Customer Solutions | | |
95
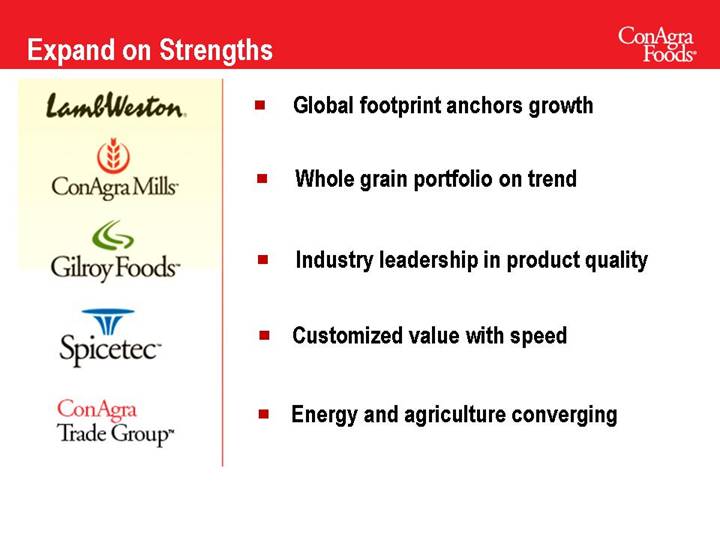
Expand on Strengths
[LOGO] | | • Global footprint anchors growth |
| | |
[LOGO] | | • Whole grain portfolio on trend |
| | |
[LOGO] | | • Industry leadership in product quality |
| | |
[LOGO] | | • Customized value with speed |
| | |
[LOGO] | | • Energy and agriculture converging |
96
Relevant Innovation
[LOGO] | | |
| | |
“MyFries” with i3 Advantage | | |
indulgent — intelligent — innovative | | |
| | |
• 100% satisfaction with up to 25% less fat | | |
| | [GRAPHIC] |
• No compromise on taste or texture | | |
| | |
• New process technology | | |
| | |
• Launching this year | | |
97
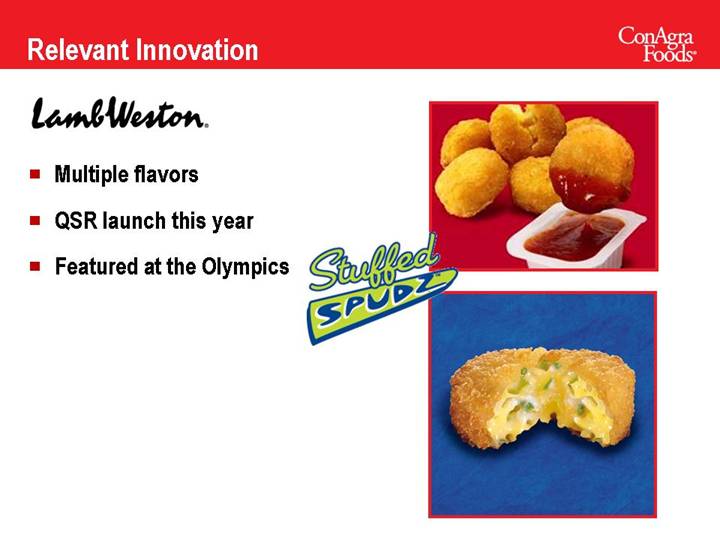
[LOGO] | | |
| | |
• Multiple flavors | | |
| | [GRAPHIC] |
• QSR launch this year | | |
| | |
• Featured at the Olympics | | |
98
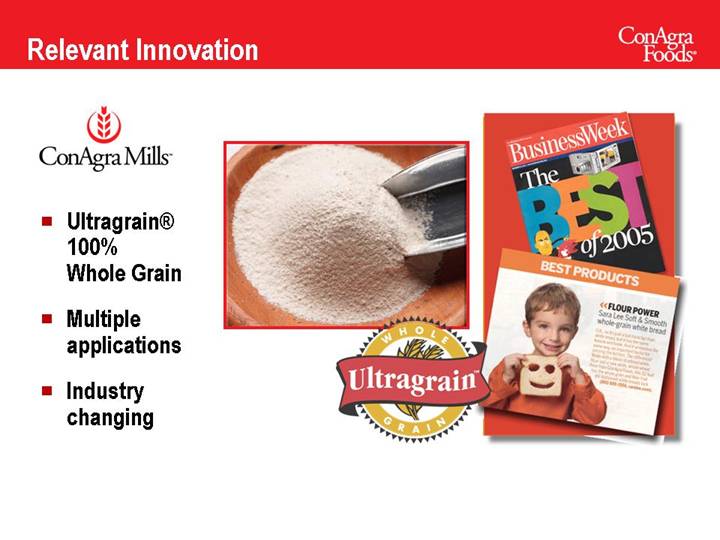
[LOGO] | | |
| | |
• Ultragrain® 100% Whole Grain | | |
| | [GRAPHIC] |
• Multiple applications | | |
| | |
• Industry changing | | |
99
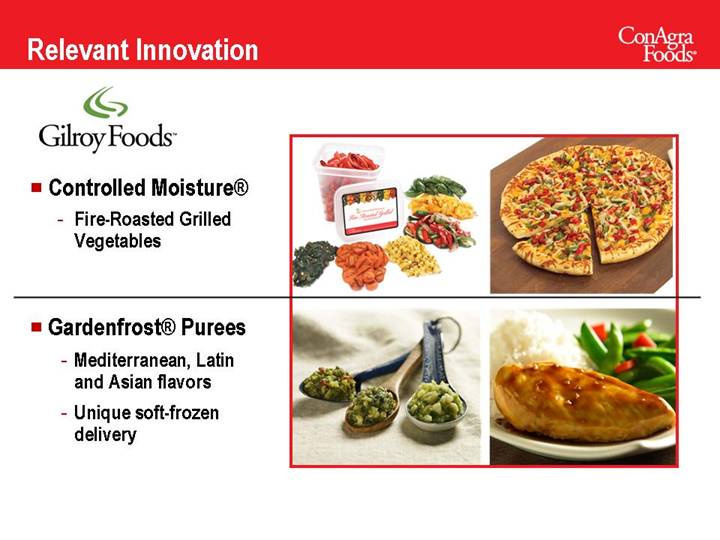
[LOGO] | | |
| | |
• Controlled Moisture® | | |
| | |
• Fire-Roasted Grilled Vegetables | | |
| | [GRAPHIC] |
| | |
• Gardenfrost® Purees | | |
| | |
• Mediterranean, Latin and Asian flavors | | |
| | |
• Unique soft-frozen delivery | | |
100
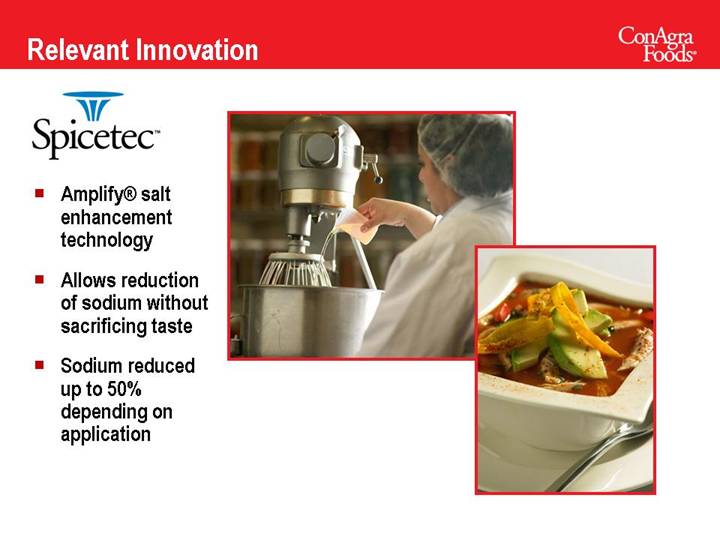
[LOGO] | | |
| | |
• Amplify® salt enhancement technology | | |
| | [GRAPHIC] |
• Allows reduction of sodium without sacrificing taste | | |
| | |
• Sodium reduced up to 50% depending on application | | |
101
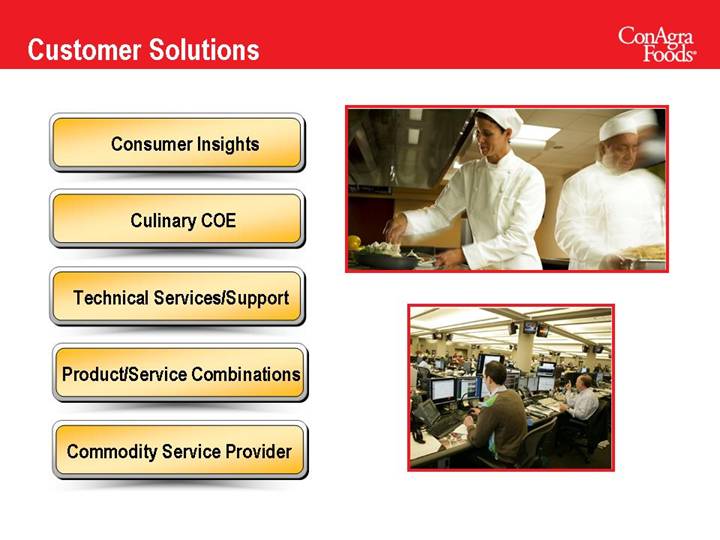
Customer Solutions
Consumer Insights | | |
| | |
Culinary COE | | |
| | |
Technical Services/Support | | [GRAPHIC] |
| | |
Product/Service Combinations | | |
| | |
Commodity Service Provider | | |
102
The New ConAgra Foods
Extend Core Competencies
Sustain Momentum
Capture Opportunities
Leverage ConAgra Foods
Execute with Excellence
103
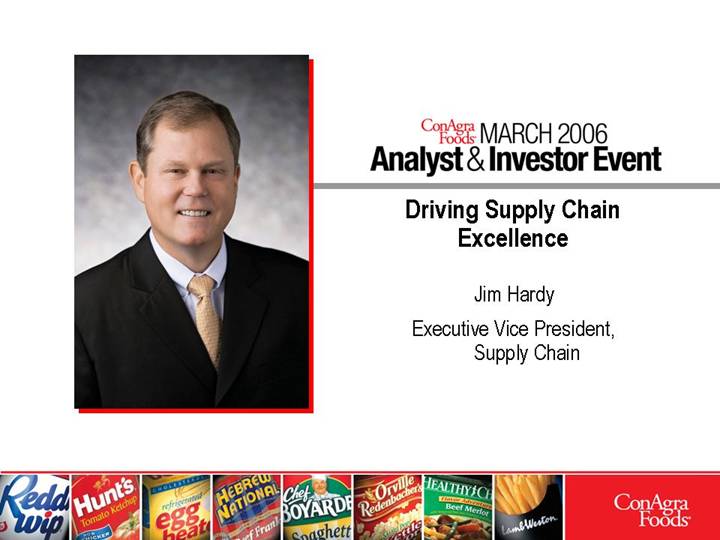
[GRAPHIC] | [LOGO] |
| MARCH 2006 |
| Analyst & Investor Event |
| Driving Supply Chain |
| Excellence |
| |
| Jim Hardy |
| |
| Executive Vice President, |
| Supply Chain |
[LOGO]
104
Product Supply
Link and Leverage
Opportunity Ahead
105
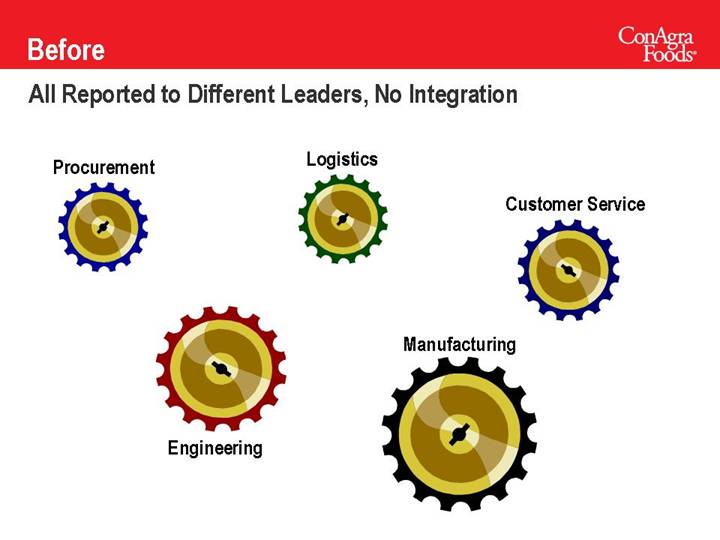
Before
All Reported to Different Leaders, No Integration
| | Logistics | | |
Procurement | | [GRAPHIC] | | |
[GRAPHIC] | | | | Customer Service |
| | | | [GRAPHIC] |
| Engineering | | Manufacturing | |
| [GRAPHIC] | | [GRAPHIC] | |
106
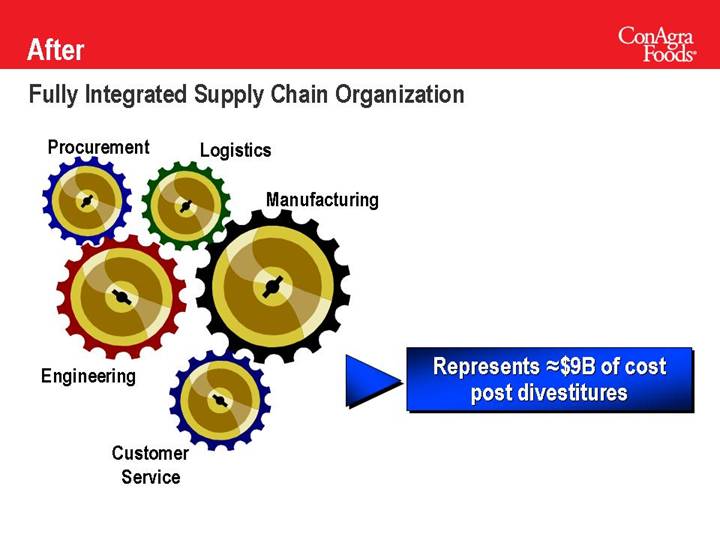
After
Fully Integrated Supply Chain Organization
Procurement | Logistics | | |
[GRAPHIC] | [GRAPHIC] | | |
| | Manufacturing | |
| | [GRAPHIC] | |
| | | |
[GRAPHIC] | | | |
Engineering | | | |
| [GRAPHIC] | | Represents  $9B of cost post divestitures $9B of cost post divestitures |
| Customer | | |
| Service | | |
| | | |
107
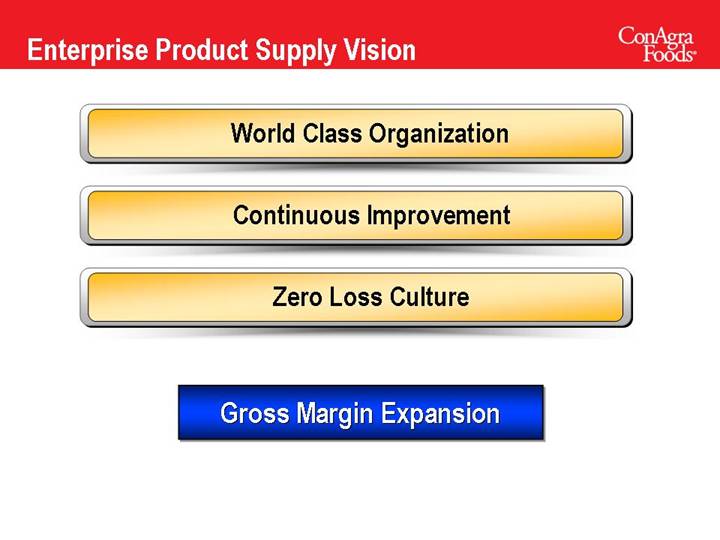
Enterprise Product Supply Vision
World Class Organization
Continuous Improvement
Zero Loss Culture
Gross Margin Expansion
108
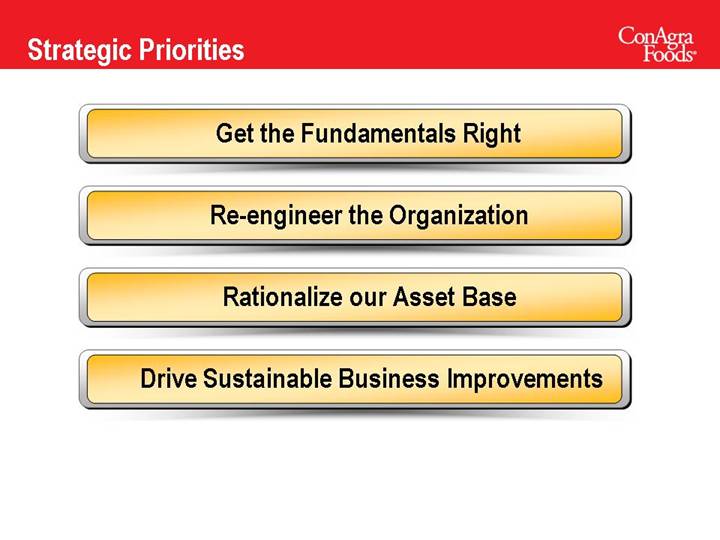
Strategic Priorities
Get the Fundamentals Right
Re-engineer the Organization
Rationalize our Asset Base
Drive Sustainable Business Improvements
109
Product Supply
Opportunity Ahead
110
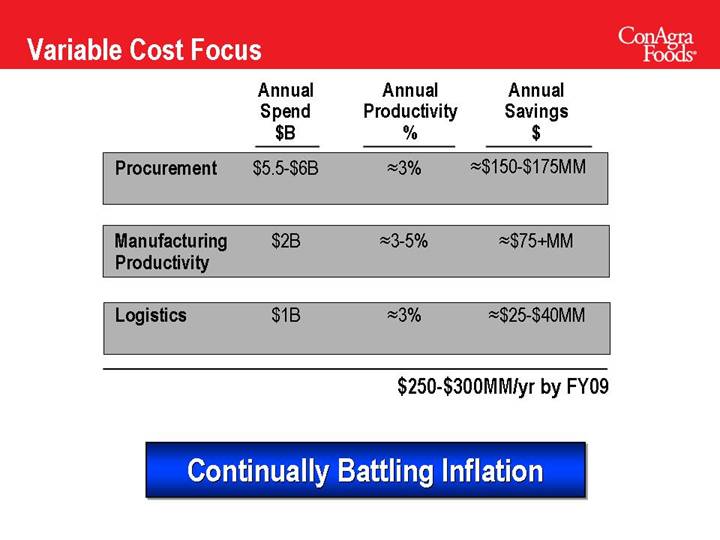
Variable Cost Focus
| | Annual
Spend | | Annual
Productivity | | Annual
Savings | |
| | $B | | % | | $ | |
Procurement | | $5.5-$6B | |  3% 3%
| |  $150-$175MM $150-$175MM
| |
| | | | | | | |
Manufacturing Productivity | | $2B | |  3-5% 3-5%
| |  $75+MM $75+MM
| |
| | | | | | | |
Logistics | | $1B | |  3% 3%
| |  $25-$40MM $25-$40MM
| |
$250-$300MM/yr by FY09
Continually Battling Inflation
111
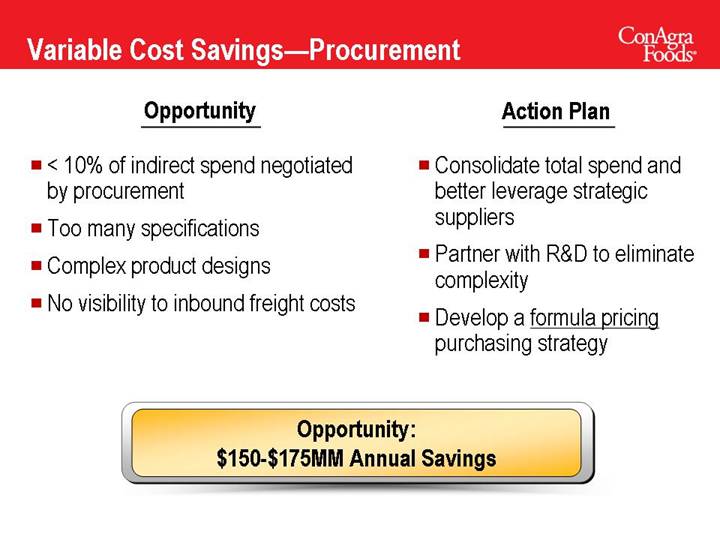
Variable Cost Savings—Procurement
Opportunity
• < 10% of indirect spend negotiated by procurement
• Too many specifications
• Complex product designs
• No visibility to inbound freight costs
Action Plan
• Consolidate total spend and better leverage strategic suppliers
• Partner with R&D to eliminate complexity
• Develop a formula pricing purchasing strategy
Opportunity:
$150-$175MM Annual Savings
112
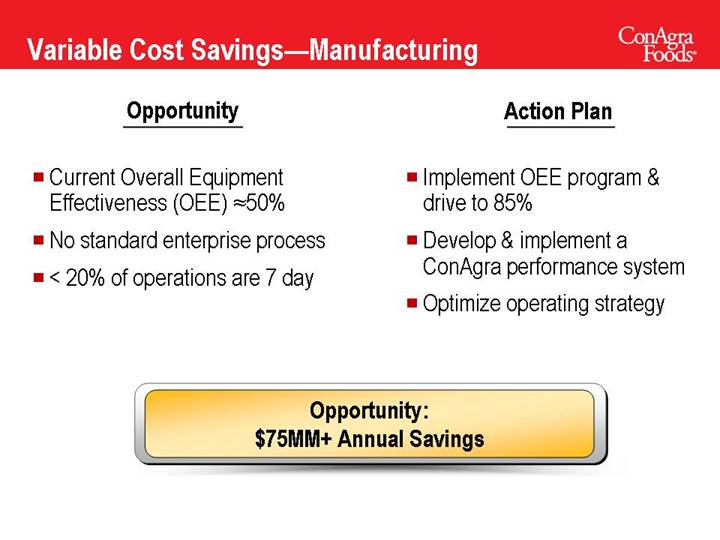
Variable Cost Savings—Manufacturing
Opportunity
• Current Overall Equipment Effectiveness (OEE)  50%
50%
• No standard enterprise process
• < 20% of operations are 7 day
Action Plan
• Implement OEE program & drive to 85%
• Develop & implement a ConAgra performance system
• Optimize operating strategy
Opportunity:
$75MM+ Annual Savings
113
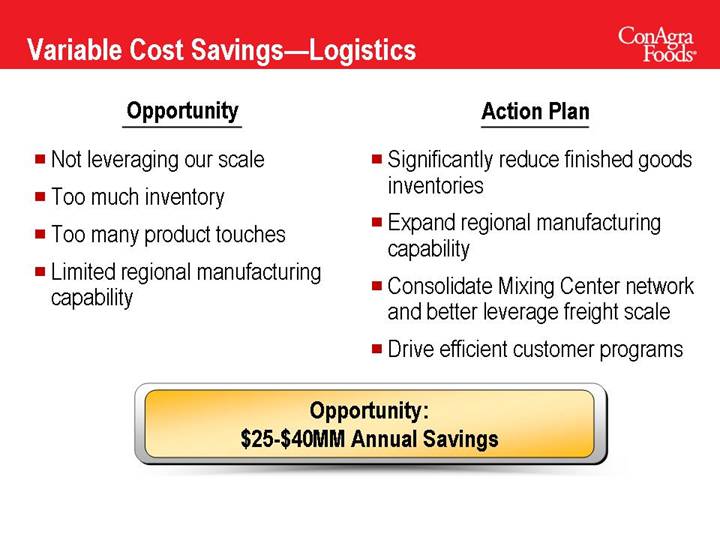
Variable Cost Savings—Logistics
Opportunity
• Not leveraging our scale
• Too much inventory
• Too many product touches
• Limited regional manufacturing capability
Action Plan
• Significantly reduce finished goods inventories
• Expand regional manufacturing capability
• Consolidate Mixing Center network and better leverage freight scale
• Drive efficient customer programs
Opportunity:
$25-$40MM Annual Savings
114
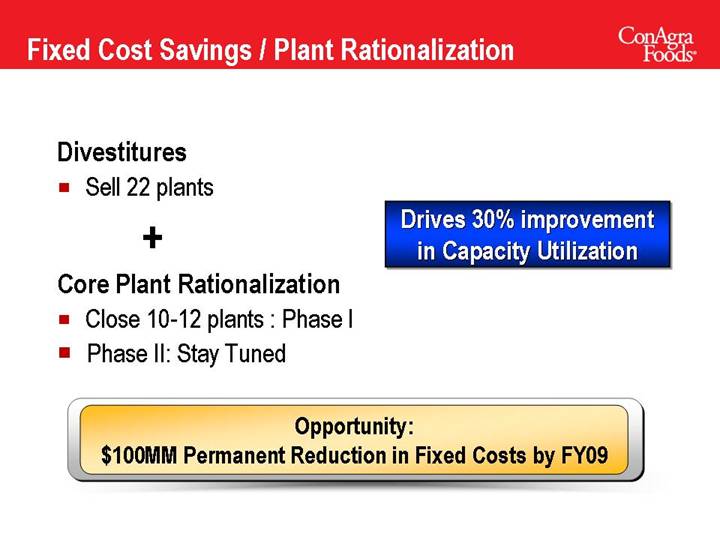
Fixed Cost Savings / Plant Rationalization
Divestitures | | |
| | |
• Sell 22 plants | | |
| | Drives 30% improvement |
+ | | in Capacity Utilization |
| | |
Core Plant Rationalization | | |
| | |
• Close 10-12 plants : Phase I | | |
| | |
• Phase II: Stay Tuned | | |
Opportunity:
$100MM Permanent Reduction in Fixed Costs by FY09
115
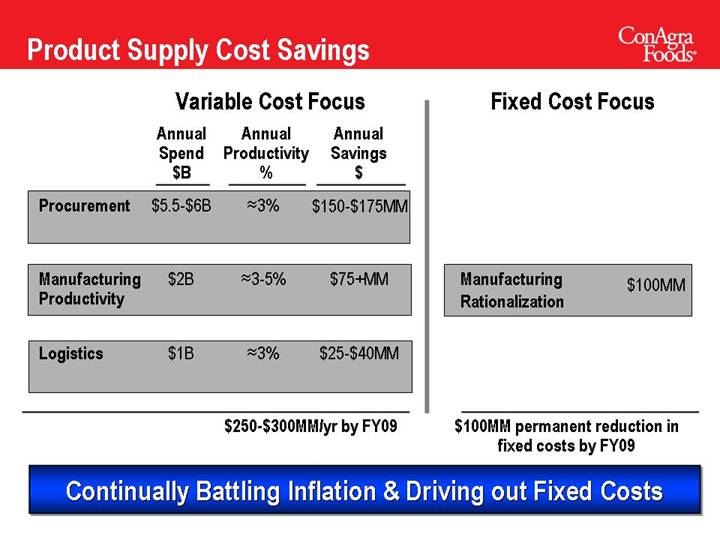
Product Supply Cost Savings
Variable Cost Focus |
| | | | | | | |
| | Annual
Spend | | Annual
Productivity | | Annual
Savings | |
| | $B | | % | | $ | |
| | | | | | | |
Procurement | | $5.5-$6B | |  3% 3%
| | $150-$175MM | |
| | | | | | | |
Manufacturing Productivity | | $2B | |  3-5% 3-5%
| | $75+MM | |
| | | | | | | |
Logistics | | $1B | |  3% 3%
| | $25-$40MM | |
| | | | | | | |
| | | | | | | |
| | | | $250-$300MM/yr by FY09 | |
Fixed Cost Focus |
| | |
Manufacturing | $100MM | |
Rationalization | | |
| | |
$100MM permanent reduction in
fixed costs by FY09 | |
Continually Battling Inflation & Driving out Fixed Costs
116
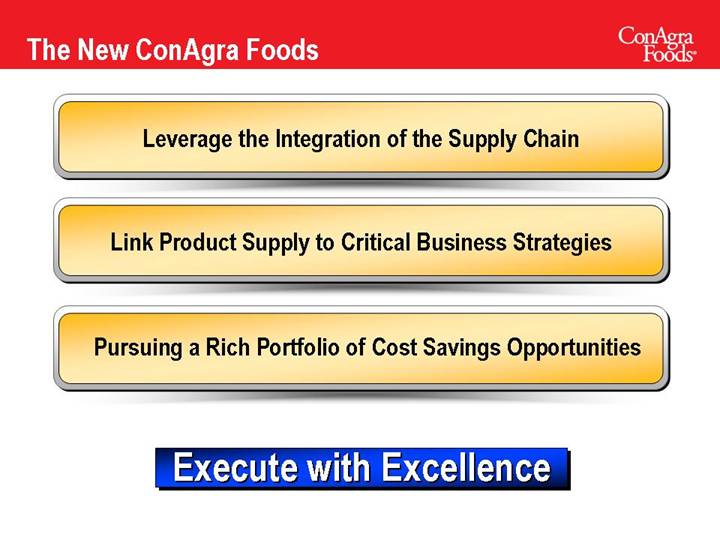
The New ConAgra Foods
Leverage the Integration of the Supply Chain
Link Product Supply to Critical Business Strategies
Pursuing a Rich Portfolio of Cost Savings Opportunities
Execute with Excellence
117
[LOGO]
MARCH 2006
Analyst & Investor Event
[LOGO]
118
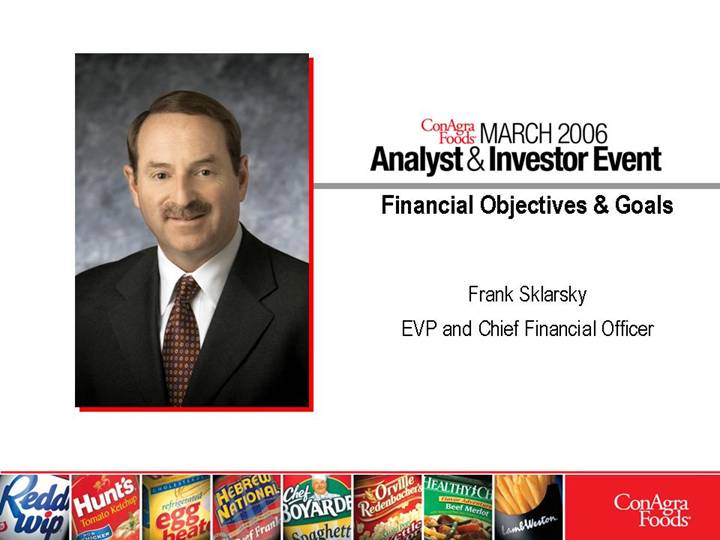
[GRAPHIC] | [LOGO] |
| MARCH 2006 |
| Analyst & Investor Event |
| Financial Objectives & Goals |
| |
| Frank Sklarsky |
| EVP and Chief Financial Officer |
[LOGO]
119
Topics for Discussion
• Major Factors Influencing Outlook | | • Special Charges |
| | |
• New Earnings Base | | • Capital Spending |
| | |
• FY07 - FY09 Goals | | • Capital Allocation |
• Leading Indicators
120
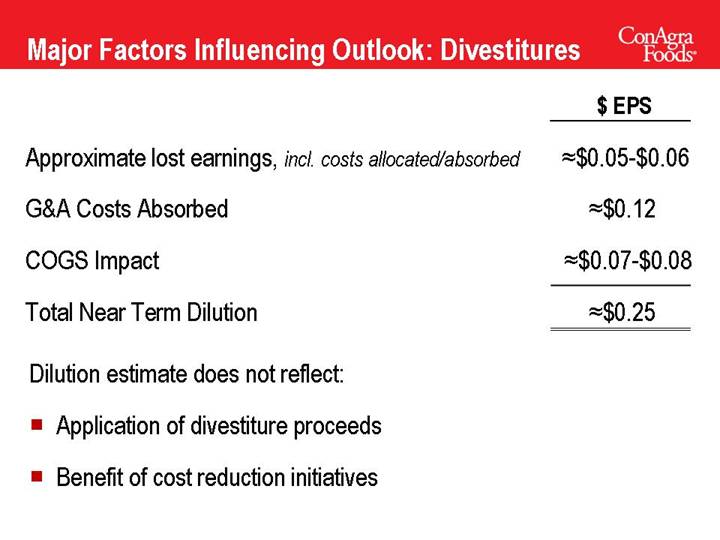
Major Factors Influencing Outlook: Divestitures
| | $ EPS | |
| | | |
Approximate lost earnings, incl. costs allocated/absorbed | |  $0.05-$0.06 $0.05-$0.06
| |
| | | |
G&A Costs Absorbed | |  $0.12 $0.12
| |
| | | |
COGS Impact | |  $0.07-$0.08 $0.07-$0.08
| |
| | | |
Total Near Term Dilution | |  $0.25 $0.25
| |
Dilution estimate does not reflect:
• Application of divestiture proceeds
• Benefit of cost reduction initiatives
121
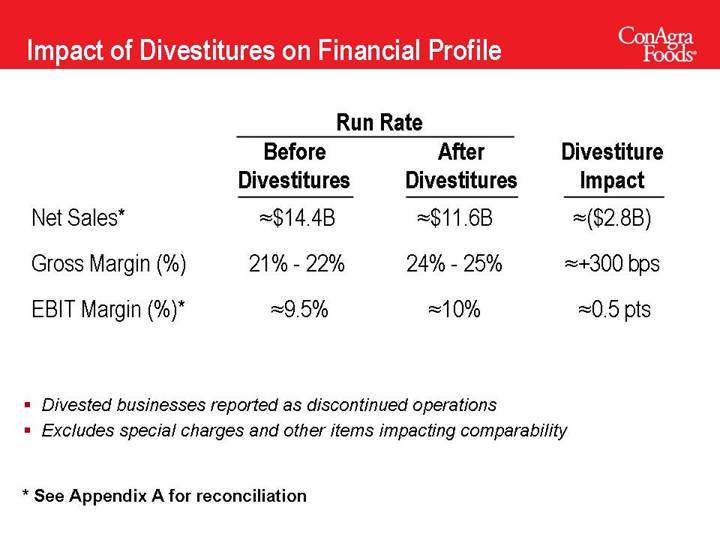
Impact of Divestitures on Financial Profile
| | Run Rate | | | |
| | Before | | After | | Divestiture | |
| | Divestitures | | Divestitures | | Impact | |
| | | | | | | |
Net Sales* | |  $14.4B $14.4B
| |  $11.6B $11.6B
| |  ($2.8B) ($2.8B)
| |
| | | | | | | |
Gross Margin (%) | | 21% - 22% | | 24% - 25% | |  +300 bps +300 bps
| |
| | | | | | | |
EBIT Margin (%)* | |  9.5% 9.5%
| |  10% 10%
| |  0.5 pts 0.5 pts
| |
• Divested businesses reported as discontinued operations
• Excludes special charges and other items impacting comparability
* See Appendix A for reconciliation
122
Major Factors Influencing Outlook
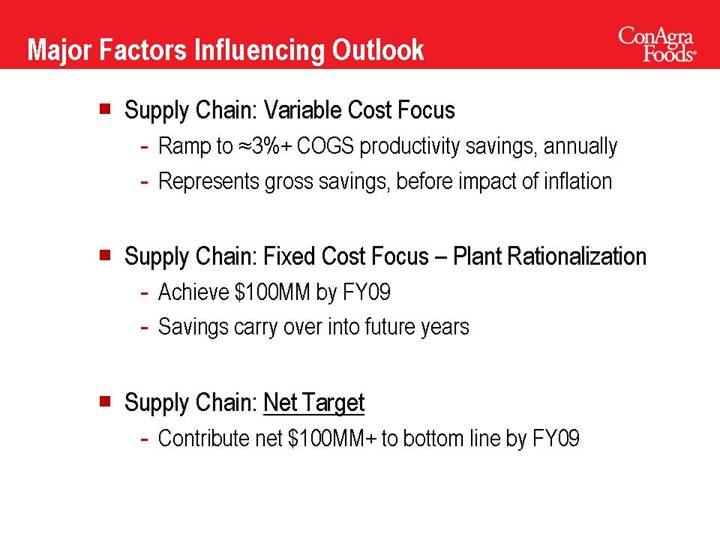
• Supply Chain: Variable Cost Focus
• Ramp to  3%+ COGS productivity savings, annually
• Represents gross savings, before impact of inflation
• Supply Chain: Fixed Cost Focus – Plant Rationalization
• Achieve $100MM by FY09
• Savings carry over into future years
• Supply Chain: Net Target
• Contribute net $100MM+ to bottom line by FY09
123
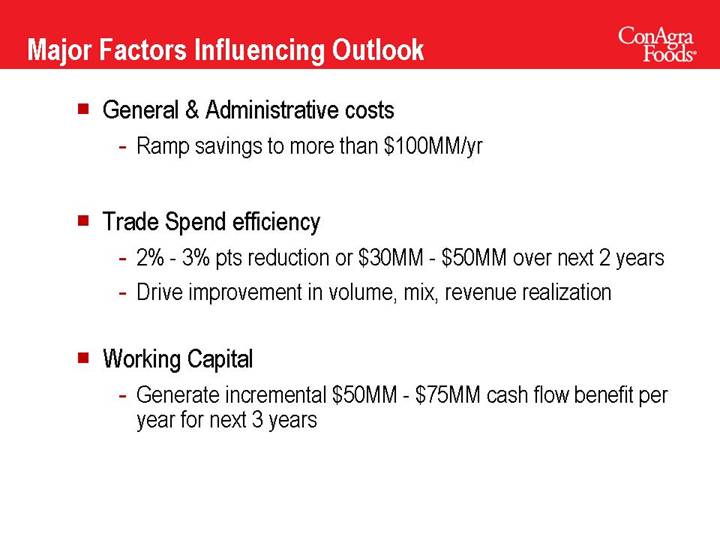
• General & Administrative costs
• Ramp savings to more than $100MM/yr
• Trade Spend efficiency
• 2% - 3% pts reduction or $30MM - $50MM over next 2 years
• Drive improvement in volume, mix, revenue realization
• Working Capital
• Generate incremental $50MM - $75MM cash flow benefit per year for next 3 years
124
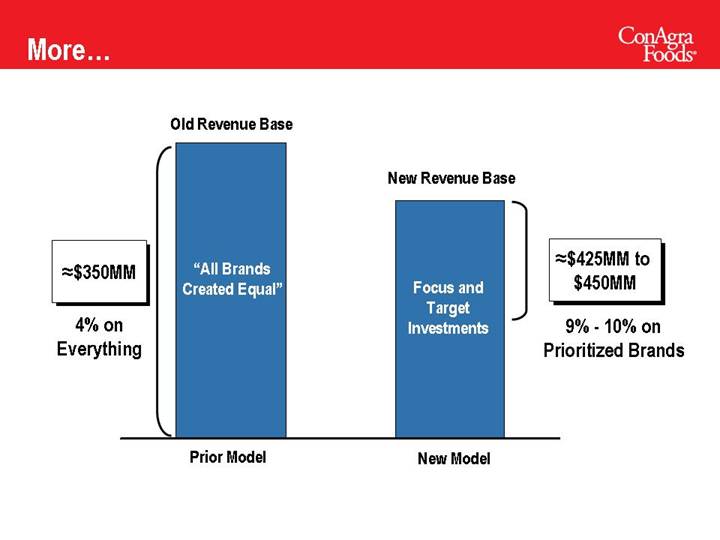
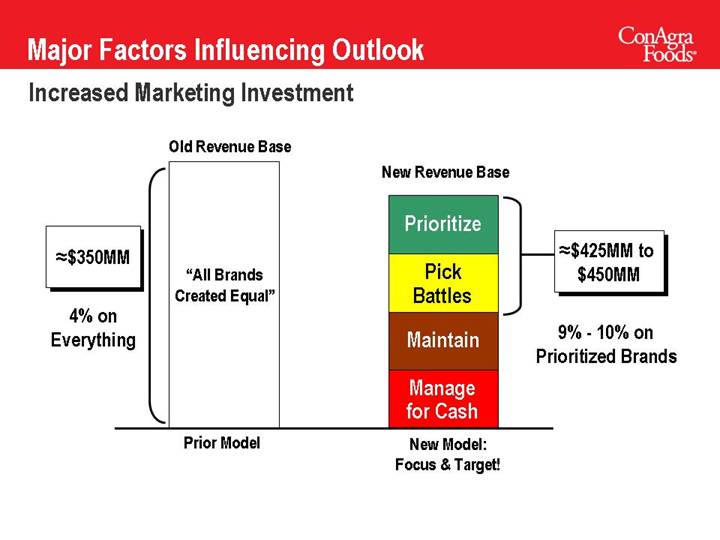
Increased Marketing Investment | | | |
| | | | |
| Old Revenue Base | | New Revenue Base | |
| | | | |
| | | Prioritize |  $425MM to $425MM to
|
 $350MM $350MM
| | | | $450MM |
| “All Brands | | Pick | |
| Created Equal” | | Battles | |
| | | | |
4% on | | | Maintain | 9% - 10% on |
Everything | | | | Prioritized Brands |
| | | Manage | |
| | | for Cash | |
| | | | |
| | | | |
| Prior Model | | New Model: | |
| | | Focus & Target! | |
125
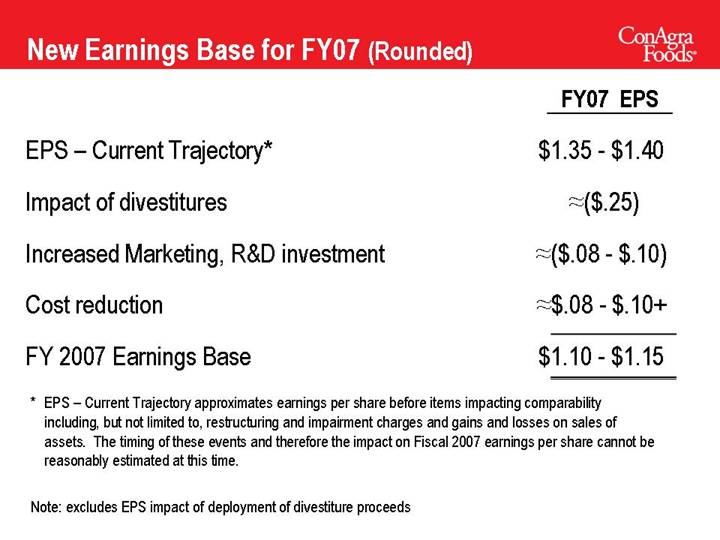
New Earnings Base for FY07 (Rounded)
| | FY07 EPS | |
| | | |
EPS – Current Trajectory* | | $1.35 - $1.40 | |
| | | |
Impact of divestitures | |  ($.25) ($.25)
| |
| | | |
Increased Marketing, R&D investment | |  ($.08 - $.10) ($.08 - $.10)
| |
| | | |
Cost reduction | |  $.08 - $.10+ $.08 - $.10+
| |
| | | |
FY 2007 Earnings Base | | $1.10 - $1.15 | |
* EPS – Current Trajectory approximates earnings per share before items impacting comparability including, but not limited to, restructuring and impairment charges and gains and losses on sales of assets. The timing of these events and therefore the impact on Fiscal 2007 earnings per share cannot be reasonably estimated at this time.
Note: excludes EPS impact of deployment of divestiture proceeds
126
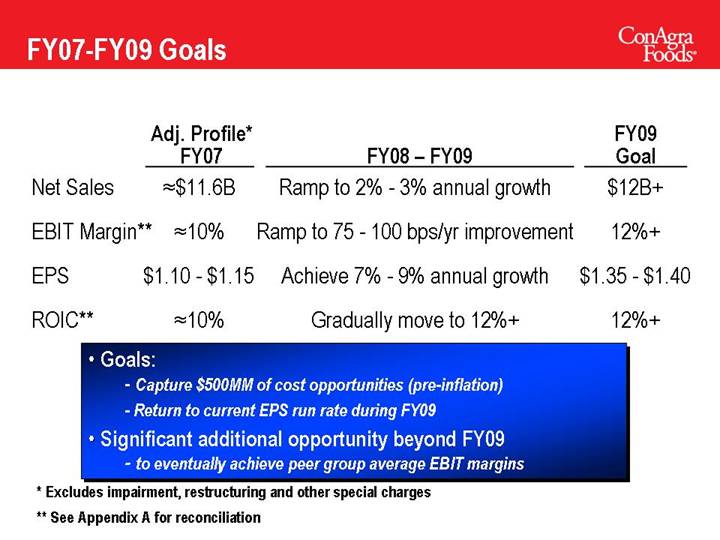
FY07-FY09 Goals
| | Adj. Profile*
FY07 | | FY08 – FY09 | | FY09
Goal | |
| | | | | | | |
Net Sales | |  $11.6B $11.6B
| | Ramp to 2% - 3% annual growth | | $12B+ | |
| | | | | | | |
EBIT Margin** | |  10% 10%
| | Ramp to 75 - 100 bps/yr improvement | | 12%+ | |
| | | | | | | |
EPS | | $1.10 - $1.15 | | Achieve 7% - 9% annual growth | | $1.35 - $1.40 | |
| | | | | | | |
ROIC** | |  10% 10%
| | Gradually move to 12%+ | | 12%+ | |
• Goals:
• Capture $500MM of cost opportunities (pre-inflation)
• Return to current EPS run rate during FY09
• Significant additional opportunity beyond FY09
• to eventually achieve peer group average EBIT margins
* Excludes impairment, restructuring and other special charges
** See Appendix A for reconciliation
127
EBIT Growth Model: Directional Patterns
Near Term: | |
SG&A savings more significant | |
1 -2 Yrs And After: | |
Gross Margin more significant | |
[CHART]
128
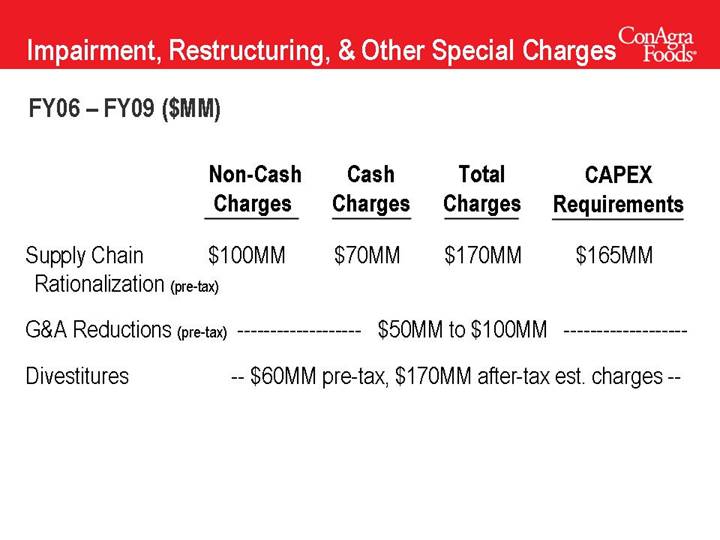
Impairment, Restructuring, & Other Special Charges
FY06 – FY09 ($MM)
| | Non-Cash | | Cash | | Total | | CAPEX | |
| | Charges | | Charges | | Charges | | Requirements | |
| | | | | | | | | |
Supply Chain Rationalization (pre-tax) | | $100MM | | $70MM | | $170MM | | $165MM | |
| | | | | | | | | |
G&A Reductions (pre-tax) | | | | $50MM to $100MM | | | |
| | | | | | | |
Divestitures | | — $60MM pre-tax, $170MM after-tax est. charges — | |
129
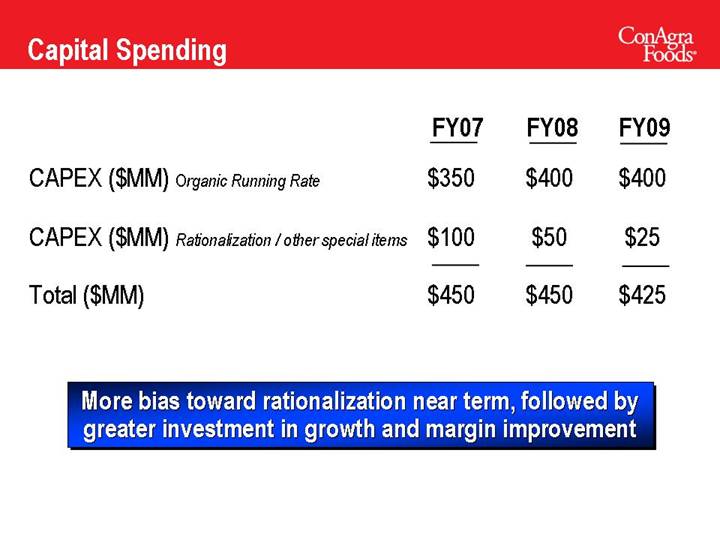
Capital Spending
| | FY07 | | FY08 | | FY09 | |
| | | | | | | |
CAPEX ($MM) Organic Running Rate | | $ | 350 | | $ | 400 | | $ | 400 | |
| | | | | | | |
CAPEX ($MM) Rationalization / other special items | | $ | 100 | | $ | 50 | | $ | 25 | |
| | | | | | | |
Total ($MM) | | $ | 450 | | $ | 450 | | $ | 425 | |
More bias toward rationalization near term, followed by greater investment in growth and margin improvement
130
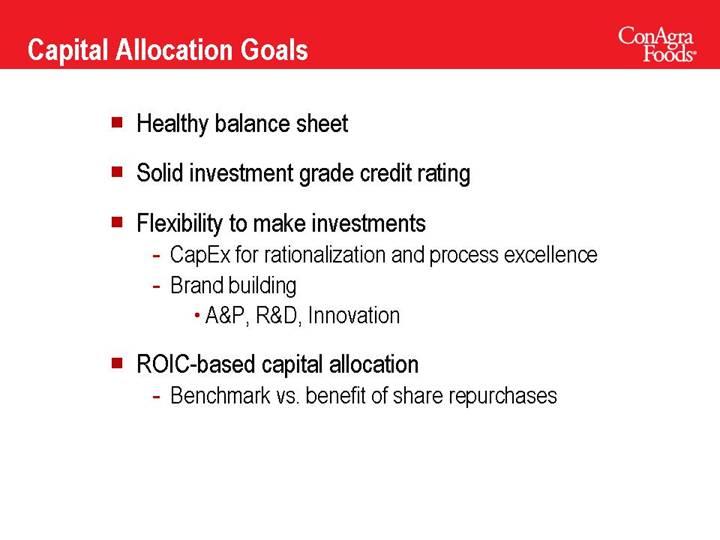
Capital Allocation Goals
��
• Healthy balance sheet
• Solid investment grade credit rating
• Flexibility to make investments
• CapEx for rationalization and process excellence
• Brand building
• A&P, R&D, Innovation
• ROIC-based capital allocation
• Benchmark vs. benefit of share repurchases
131
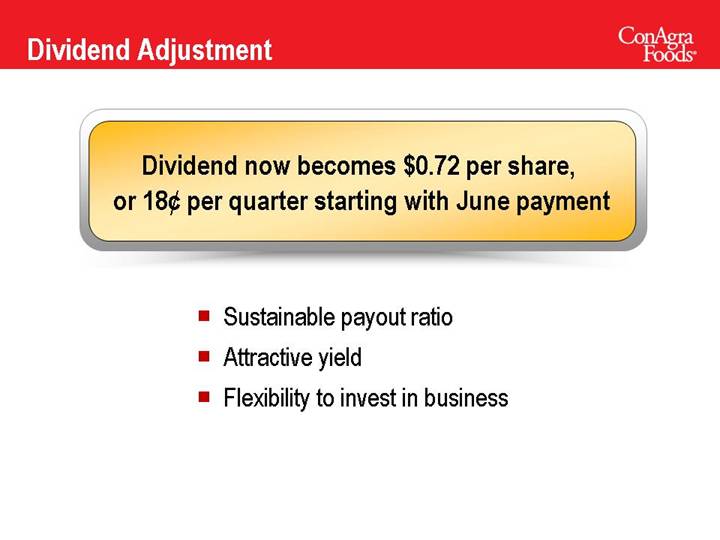
Dividend Adjustment
Dividend now becomes $0.72 per share, or 18¢ per quarter starting with June payment
• Sustainable payout ratio
• Attractive yield
• Flexibility to invest in business
132
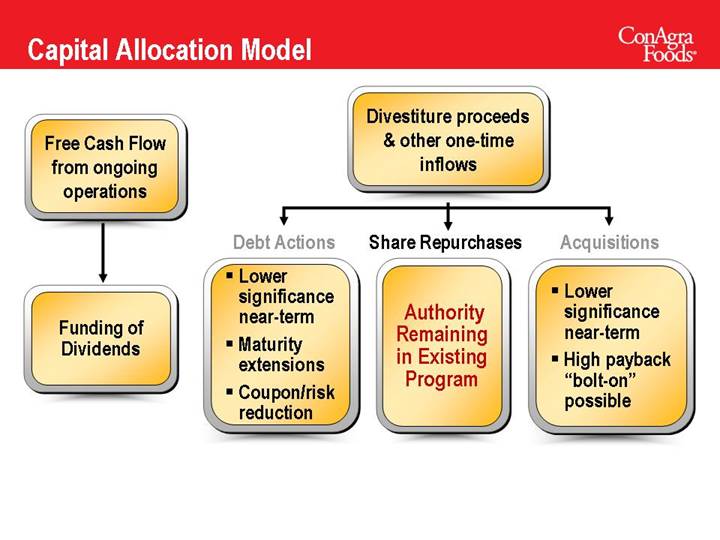
Capital Allocation Model
Free Cash Flow
from ongoing
operations | | Divestiture proceeds
& other one-time
inflows |
| | | | | | |
| | Debt Actions | | Share Repurchases | | Acquisitions |
| | | | | | |
| | • Lower significance near-term | | Authority Remaining in | | • Lower significance near-term |
Funding of Dividends | | • Maturity extensions • Coupon/risk reduction | | Existing
Program | | • High payback “bolt-on” possible |
133
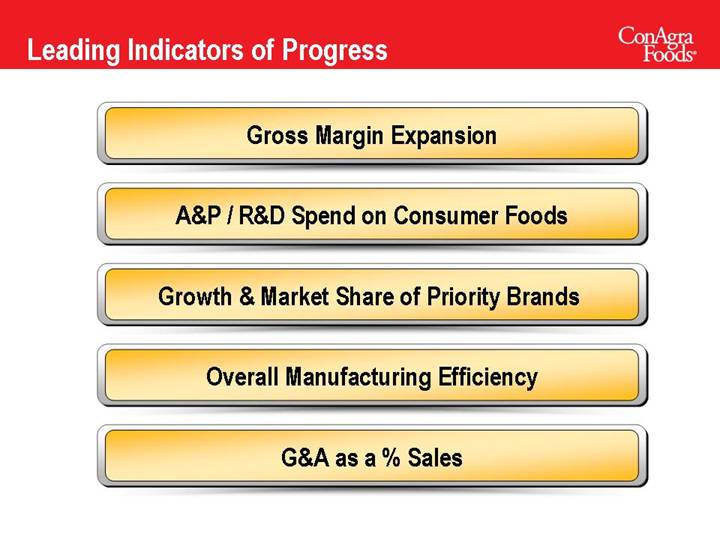
Leading Indicators of Progress
Gross Margin Expansion
A&P / R&D Spend on Consumer Foods
Growth & Market Share of Priority Brands
Overall Manufacturing Efficiency
G&A as a % Sales
134
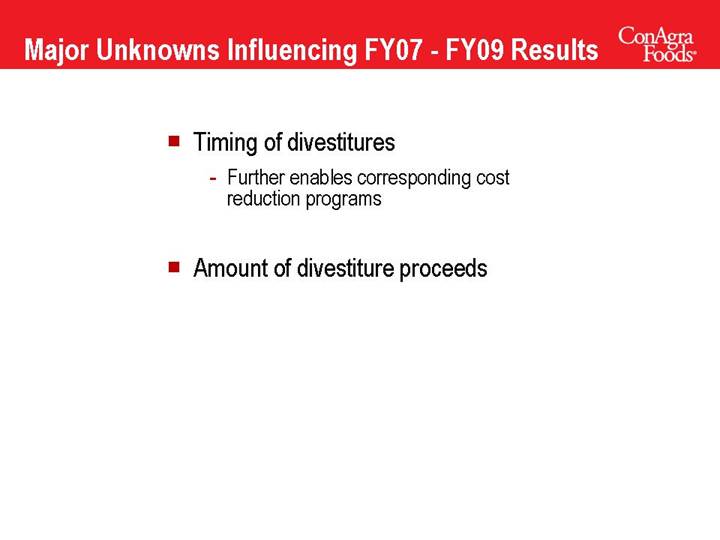
Major Unknowns Influencing FY07 - FY09 Results
• Timing of divestitures
• Further enables corresponding cost reduction programs
• Amount of divestiture proceeds
135
[LOGO] |
|
MARCH 2006 |
Analyst & Investor Event |
Summary |
| |
Gary Rodkin |
|
President and CEO |
[LOGO]
136
Operational Excellence
Simplification | | Consistent Bottom Line Through Top Line Growth | | Stronger
Base
Foundation | | Higher
Margins | | Growing
Profits | | Higher R&D
and
Marketing
Investment |
| | | | | | | | | | |
Rationalized
Supply Chain | | Consistently
Great Customer
Service | | Lower
Inventory/
Service
Costs | | Gain
Share | | Grow
Volume | | Consumer/
Customer
Bigger/Better
Innovation |
Execute with Excellence
137
The New CAG:
A true operating company that delivers sustainable profitable growth
138
[LOGO]
MARCH 2006
Analyst & Investor Event
[LOGO]
139
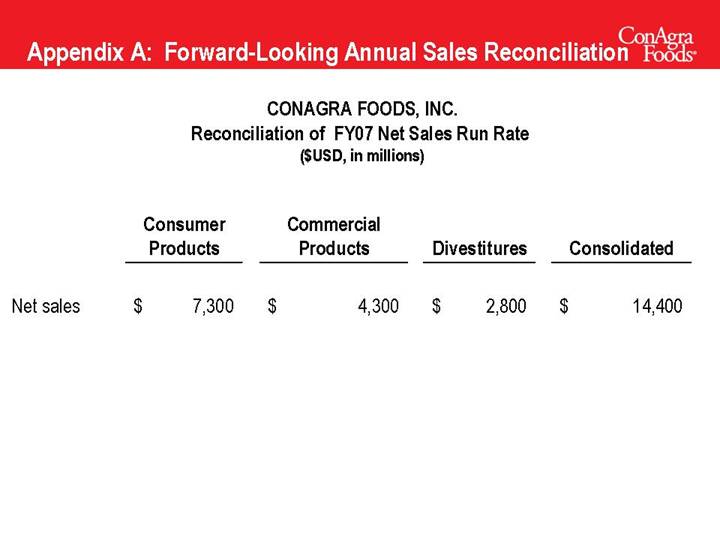
Appendix A: Forward-Looking Annual Sales Reconciliation
CONAGRA FOODS, INC.
Reconciliation of FY07 Net Sales Run Rate
($USD, in millions)
| | Consumer
Products | | Commercial
Products | | Divestitures | | Consolidated | |
| | | | | | | | | |
Net sales | | $ | 7,300 | | $ | 4,300 | | $ | 2,800 | | $ | 14,400 | |
| | | | | | | | | | | | | |
140
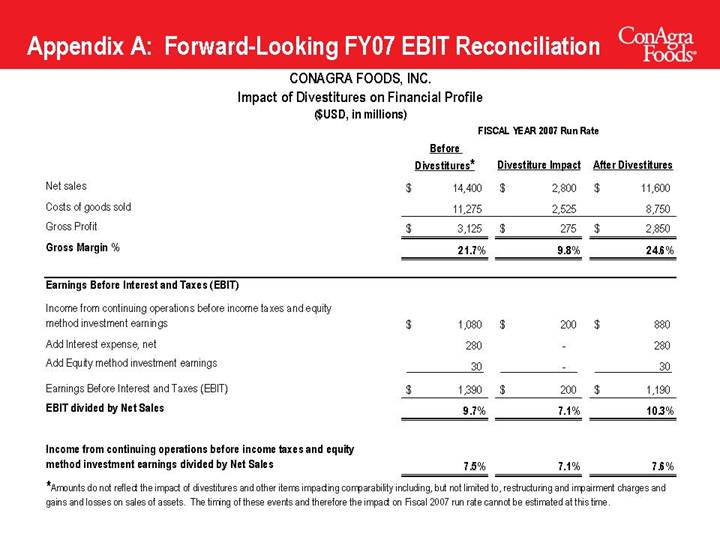
Appendix A: Forward-Looking FY07 EBIT Reconciliation
CONAGRA FOODS, INC.
Impact of Divestitures on Financial Profile
($USD, in millions)
| | FISCAL YEAR 2007 Run Rate | |
| | Before
Divestitures* | | Divestiture Impact | | After Divestitures | |
| | | | | | | |
Net sales | | $ | 14,400 | | $ | 2,800 | | $ | 11,600 | |
Costs of goods sold | | 11,275 | | 2,525 | | 8,750 | |
Gross Profit | | $ | 3,125 | | $ | 275 | | $ | 2,850 | |
Gross Margin % | | 21.7 | % | 9.8 | % | 24.6 | % |
| | | | | | | |
Earnings Before Interest and Taxes (EBIT) | | | | | | | |
| | | | | | | |
Income from continuing operations before income taxes and equity method investment earnings | | $ | 1,080 | | $ | 200 | | $ | 880 | |
Add Interest expense, net | | 280 | | — | | 280 | |
Add Equity method investment earnings | | 30 | | — | | 30 | |
Earnings Before Interest and Taxes (EBIT) | | $ | 1,390 | | $ | 200 | | $ | 1,190 | |
EBIT divided by Net Sales | | 9.7 | % | 7.1 | % | 10.3 | % |
| | | | | | | |
Income from continuing operations before income taxes and equity method investment earnings divided by Net Sales | | 7.5 | % | 7.1 | % | 7.6 | % |
*Amounts do not reflect the impact of divestitures and other items impacting comparability including, but not limited to, restructuring and impairment charges and gains and losses on sales of assets. The timing of these events and therefore the impact on Fiscal 2007 run rate cannot be estimated at this time.
141
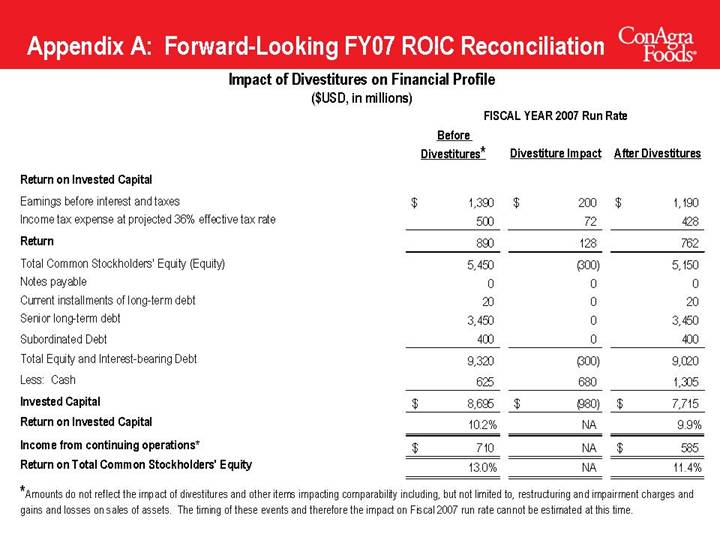
Appendix A: Forward-Looking FY07 ROIC Reconciliation
Impact of Divestitures on Financial Profile
($USD, in millions)
| | FISCAL YEAR 2007 Run Rate | |
| | Before
Divestitures* | | Divestiture Impact | | After Divestitures | |
| | | | | | | |
Return on Invested Capital | | | | | | | |
Earnings before interest and taxes | | $ | 1,390 | | $ | 200 | | $ | 1,190 | |
Income tax expense at projected 36% effective tax rate | | 500 | | 72 | | 428 | |
Return | | 890 | | 128 | | 762 | |
Total Common Stockholders’ Equity (Equity) | | 5,450 | | (300 | ) | 5,150 | |
Notes payable | | 0 | | 0 | | 0 | |
Current installments of long-term debt | | 20 | | 0 | | 20 | |
Senior long-term debt | | 3,450 | | 0 | | 3,450 | |
Subordinated Debt | | 400 | | 0 | | 400 | |
Total Equity and Interest-bearing Debt | | 9,320 | | (300 | ) | 9,020 | |
Less: Cash | | 625 | | 680 | | 1,305 | |
Invested Capital | | $ | 8,695 | | $ | (980 | ) | $ | 7,715 | |
Return on Invested Capital | | 10.2 | % | NA | | 9.9 | % |
Income from continuing operations* | | $ | 710 | | NA | | $ | 585 | |
Return on Total Common Stockholders’ Equity | | 13.0 | % | NA | | 11.4 | % |
*Amounts do not reflect the impact of divestitures and other items impacting comparability including, but not limited to, restructuring and impairment charges and gains and losses on sales of assets. The timing of these events and therefore the impact on Fiscal 2007 run rate cannot be estimated at this time.
142
