 1 CAGNY CAGNY 2012 2012 Exhibit 99.2 |
 2 Gary Rodkin Gary Rodkin CEO CEO |
 3 This presentation contains forward-looking statements within the meaning of the Private Securities Litigation Reform Act of 1995. These statements are based on management’s current views and assumptions of future events and financial performance and are subject to uncertainty and changes in circumstances. The company undertakes no responsibility for updating these statements. Readers of this presentation should understand that these statements are not guarantees of performance or results. Many factors could affect the company’s actual financial results and cause them to vary materially from the expectations contained in the forward- looking statements. These factors include, among other things: availability and prices of raw materials, including any negative effects caused by inflation; the effectiveness of the company’s product pricing, including any pricing actions and promotional changes; future economic circumstances; industry conditions; the company’s ability to execute its operating and restructuring plans; the success of the company’s innovation, marketing, and cost-saving initiatives; the competitive environment and related market conditions; operating efficiencies; the ultimate impact of any product recalls; the company’s succes in efficiently and effectively integrating the company’s acquisitions; access to capital; actions of governments and regulatory factors affecting the company’s businesses, including the Patient Protection and Affordable Care Act; the amount and timing of repurchases of the company’s common stock, if any; and other risks described in the company’s reports filed with the Securities and Exchange Commission. The company’s cautions readers not to place undue reliance on any forward-looking statements included in this presentation, which speak only as of the date made. Note on forward-looking statements |
 Today’s agenda Today’s agenda • • Gary Rodkin, CEO Gary Rodkin, CEO • • Recipe for Growth Recipe for Growth • • Customer Connect Customer Connect • • Innovation and marketing Innovation and marketing • • Supply chain Supply chain • • Algorithm and goals Algorithm and goals • • Capital allocation Capital allocation 4 • • André André Hawaux, Hawaux, President President Consumer Foods Consumer Foods • • John Gehring, CFO John Gehring, CFO |
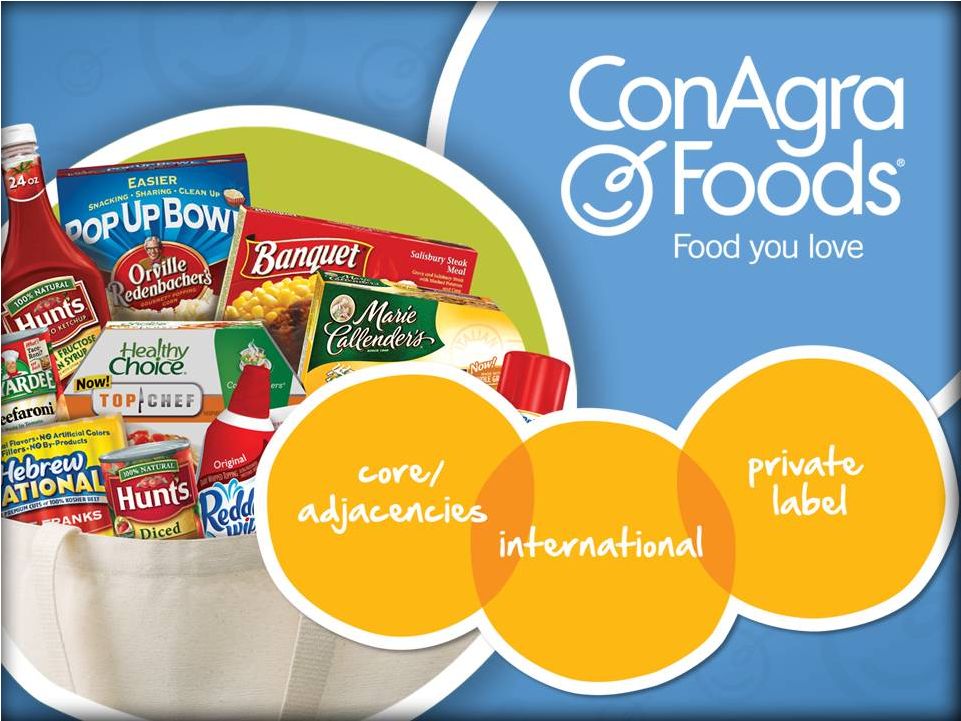
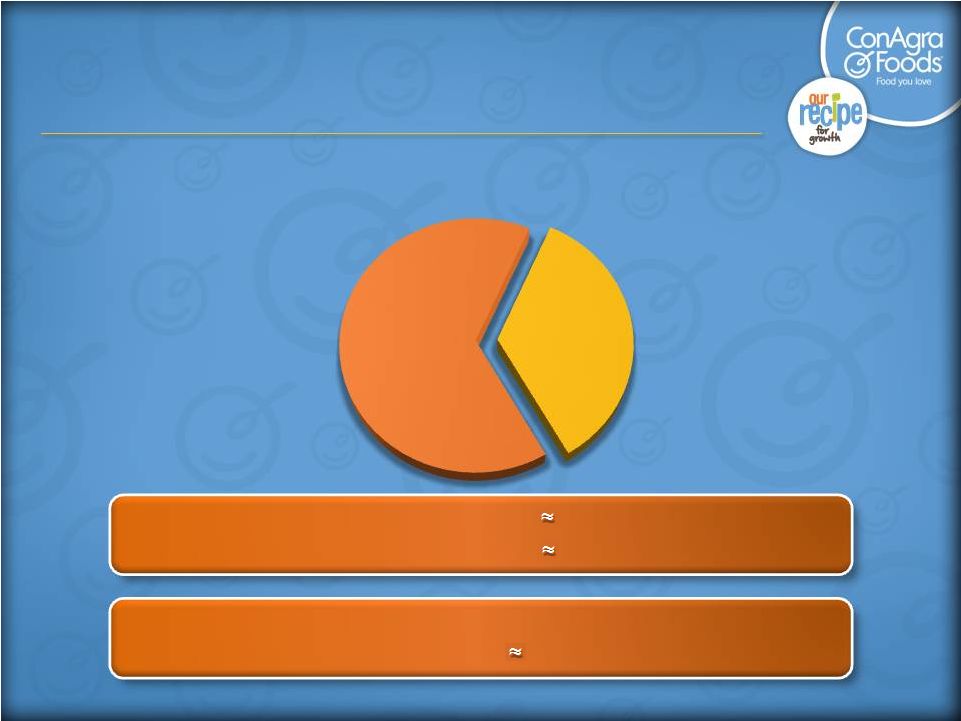 Company overview Company overview 5 FY12 Operating Cash Flow FY12 Operating Cash Flow FY12 Debt/EBITDA** FY12 Debt/EBITDA** $1.3 billion* (est.) $1.3 billion* (est.) 2X (est.) 2X (est.) Current Annualized Dividend: $0.96 / share Current Annualized Dividend: $0.96 / share Current Dividend Yield: Current Dividend Yield: 3.5% 3.5% 35% 35% 65% 65% Consumer Foods Consumer Foods Commercial Foods Commercial Foods Fiscal 2012 sales: Approaching $13 billion (est.) Fiscal 2012 sales: Approaching $13 billion (est.) *Excludes any FY12 discretionary pension contributions **The inability to predict the amount and timing of future items makes a detailed reconciliation of projections impracticable. |
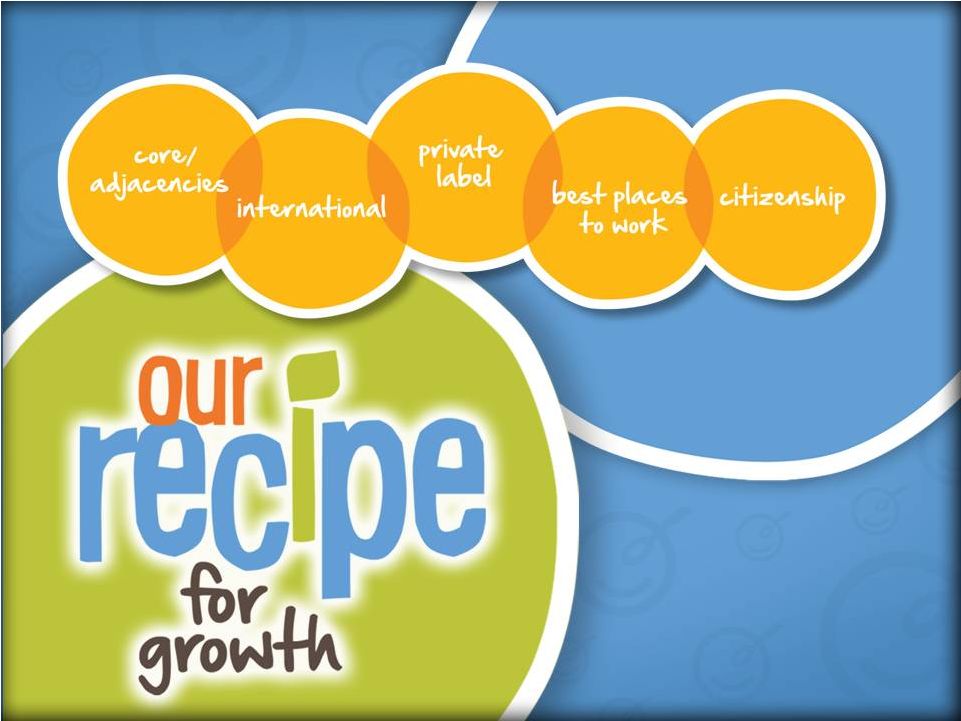
 Our journey: entering phase 2 Our journey: entering phase 2 • • Phase 1 Phase 1 – – Operational progress Operational progress • • Organizational wiring Organizational wiring • • Culture Culture • • Cost structure Cost structure • • Marketing and innovation Marketing and innovation • • Balance sheet Balance sheet • • Portfolio Portfolio • • Phase 2 Phase 2 – – Leverage strong foundation Leverage strong foundation – – Our Recipe for Growth Our Recipe for Growth 6 |
 7 |
 8 |
 Platform Platform Sustainable growth Sustainable growth Core: drivers of success Core: drivers of success 9 1. Innovation 1. Innovation Significantly improved capabilities Significantly improved capabilities Insights = clarity + consistency of message Insights = clarity + consistency of message 2. Pricing 2. Pricing 3. Marketing 3. Marketing |
 10 1. Innovation 1. Innovation Core: drivers of success Core: drivers of success Platform Platform Sustainable growth Sustainable growth |
 Core: drivers of success Core: drivers of success 11 1. Innovation 1. Innovation Significantly improved capabilities Significantly improved capabilities Insights = clarity + consistency of message Insights = clarity + consistency of message 2. Pricing 2. Pricing 3. Marketing 3. Marketing Platform Platform Sustainable growth Sustainable growth |
 Core: drivers of success Core: drivers of success 12 1. Innovation 1. Innovation Significantly improved capabilities Significantly improved capabilities Insights = clarity + consistency of message Insights = clarity + consistency of message 2. Pricing 2. Pricing 3. Marketing 3. Marketing Platform Platform Sustainable growth Sustainable growth |
 13 PAM commercial PAM commercial |
 14 Hebrew National commercial Hebrew National commercial |
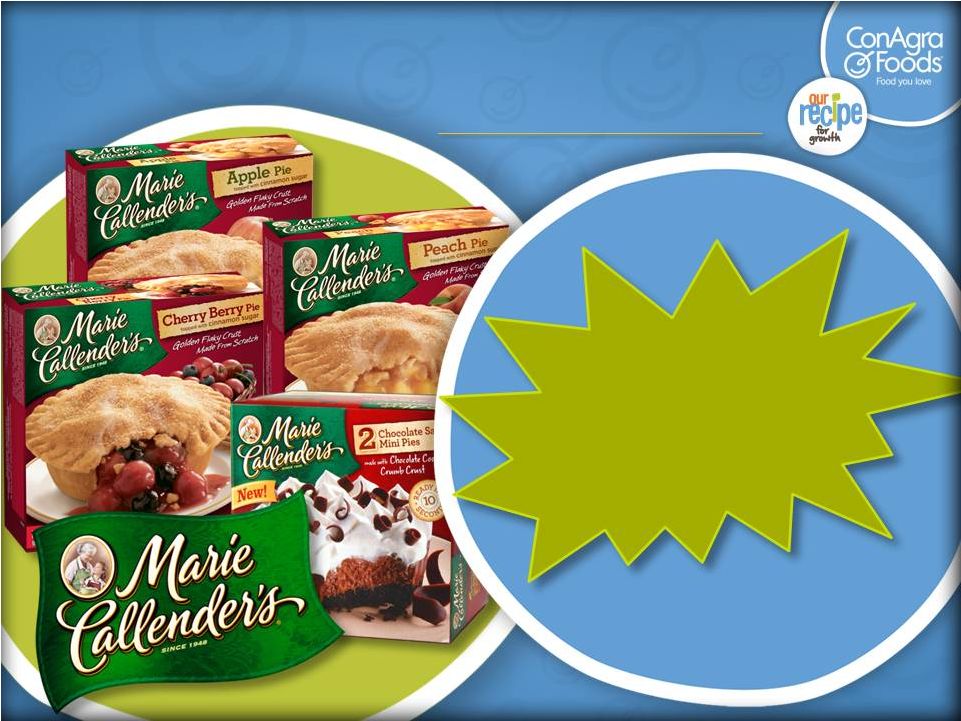 Marie Callender’s dessert pies Marie Callender’s dessert pies 15 FY12 YTD FY12 YTD Net Sales Net Sales 1 1 +27% +27% 1 June 2011 – December 2011 |
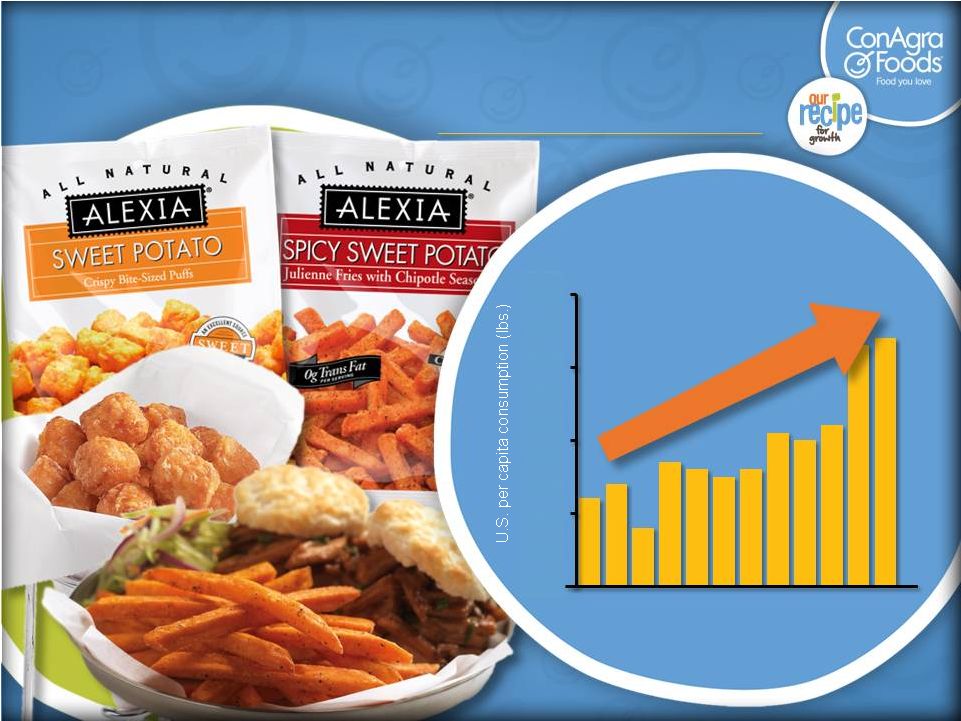 Sweet potatoes Sweet potatoes 16 2000 2000 2011 2011 Sweet Potatoes: Consumption Sweet Potatoes: Consumption +52% +52% Source: USDA Economic Research Service, Source: USDA Economic Research Service, November 11, 2011. November 11, 2011. 3.0 4.0 5.0 6.0 7.0 |
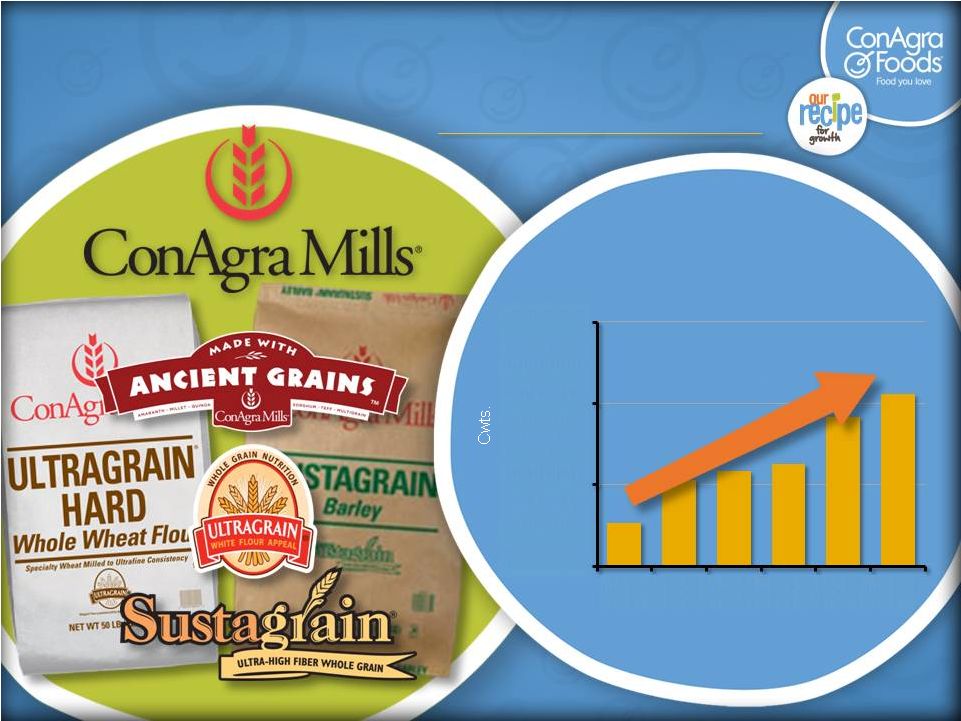 Whole grains Whole grains 17 Whole Grain Growth, FY06 to FY11 Whole Grain Growth, FY06 to FY11 Source: Milling and Baking News, 07/26/11 Source: Milling and Baking News, 07/26/11 10,000,000 15,000,000 20,000,000 25,000,000 FY06 FY07 FY08 FY09 FY10 FY11 +10% CAGR +10% CAGR |
 18 |
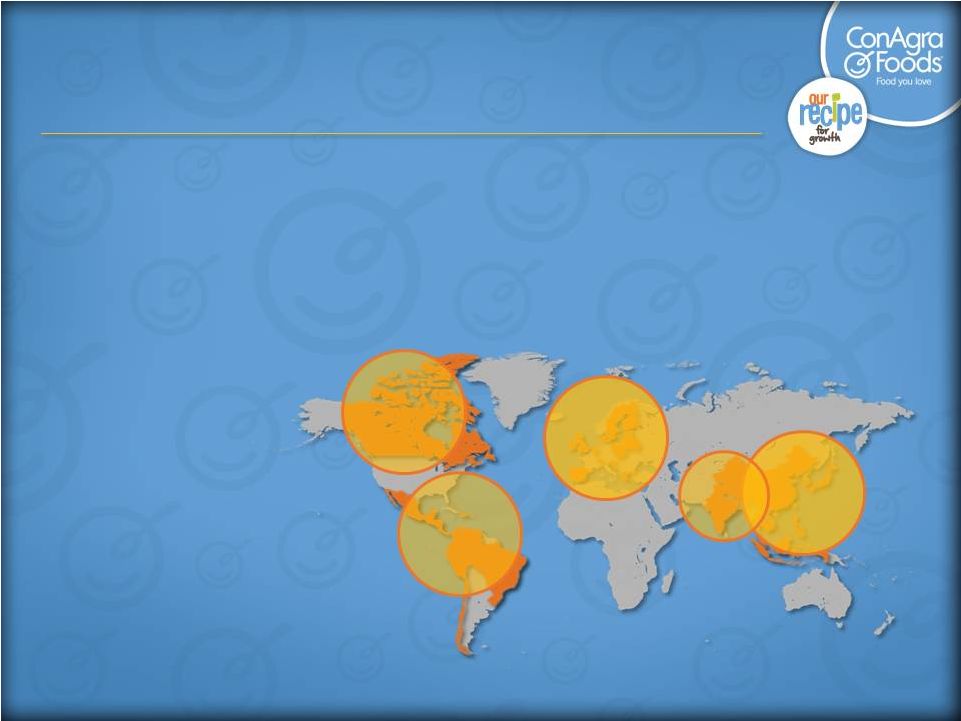 International markets International markets • • Commercial Foods primary markets Commercial Foods primary markets – – Europe, Canada, Latin America and Asia (includes JVs) Europe, Canada, Latin America and Asia (includes JVs) • • Consumer Foods primary markets Consumer Foods primary markets – – India India 1 1 – – Mexico Mexico – – Canada Canada – – Caribbean Caribbean 19 1 Consumer Foods’ market in India is through Agro Tech Foods Limited, an Indian publicly-held company in which ConAgra Foods owns a majority interest, and consolidates for GAAP accounting purposes. Latin Latin America America Canada Canada Europe Europe India India 1 1 Asia Asia |
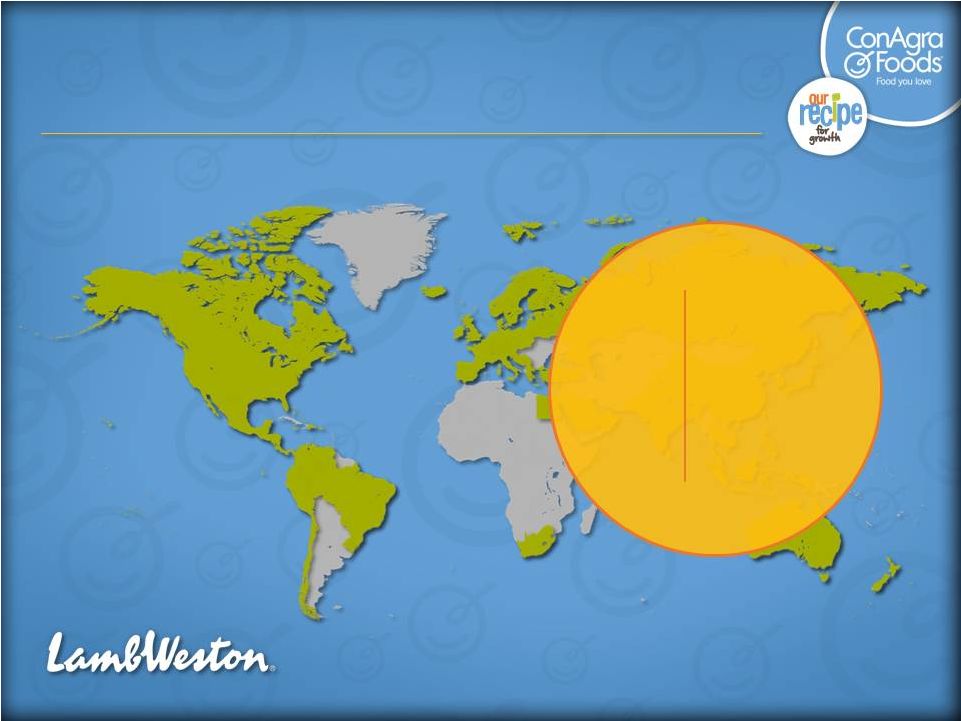 Lamb Weston International Lamb Weston International 20 In nearly 100 countries (includes JVs) In nearly 100 countries (includes JVs) Japan Japan China China Korea Korea Middle East Middle East Leader: Leader: |
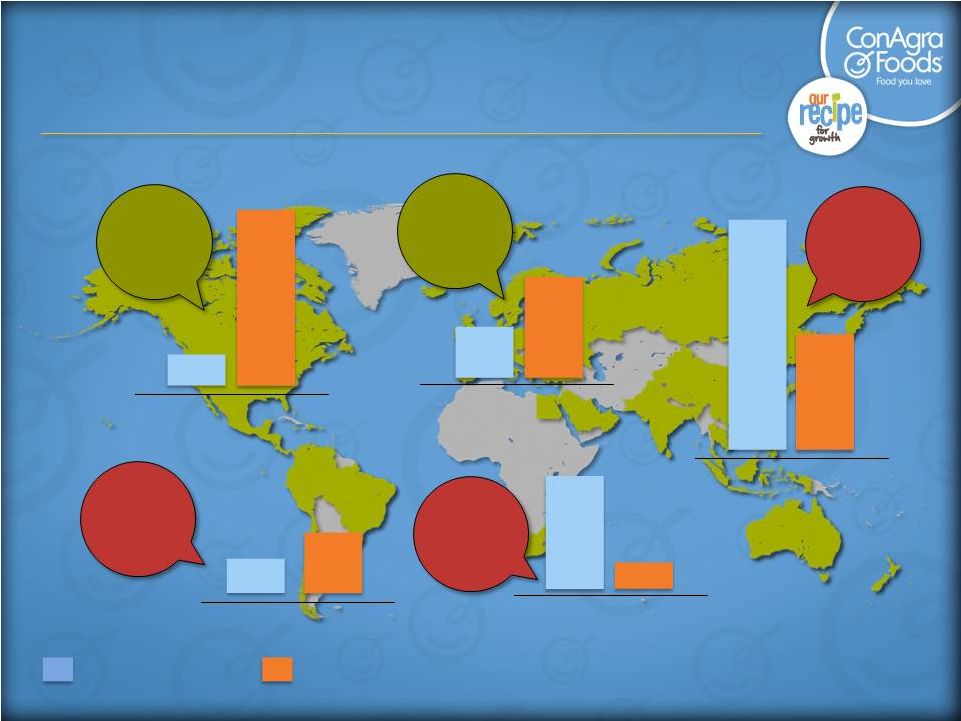
 Total international sales Total international sales Country performance: Country performance: 12% 12% 83% 83% 51% 51% Total International Sales Total International Sales $ Sales $ Sales increase vs. increase vs. year ago year ago FY12 YTD: June 2011 – December 2011 21 Lamb Weston FY12 YTD Lamb Weston FY12 YTD China/Hong Kong China/Hong Kong 32% 32% 24% 24% 39% 39% Australia Australia Singapore Singapore Taiwan Taiwan Malaysia Malaysia |
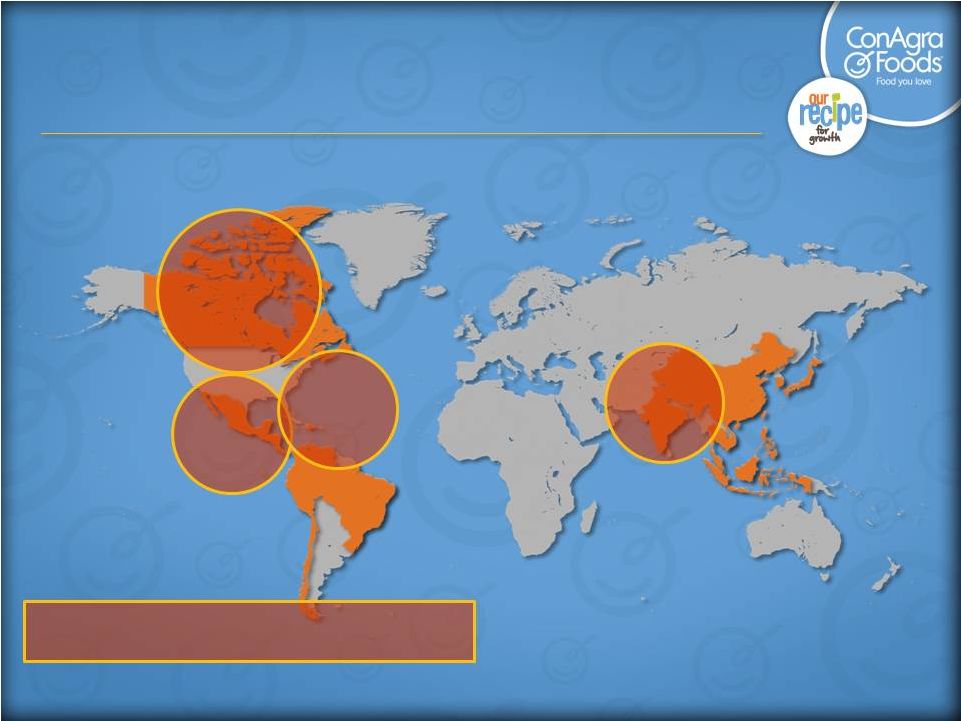
 Lamb Weston international opportunity Lamb Weston international opportunity 3.8 B 3.8 B 3.8 B 1.8 B 1.8 B 1.8 B 344 M 344 M 344 M 9.9 B 9.9 B 9.9 B 590 M 590 M 590 M 1.3 B 1.3 B 1.3 B 595 M 595 M 595 M 5.9 B 5.9 B 5.9 B 0.5 B 0.5 B 0.5 B 1.3 B 1.3 B 1.3 B U.S. and Canada U.S. and Canada U.S. and Canada Europe Europe Europe Asia Pacific Asia Pacific Asia Pacific Latin America Latin America Latin America Middle East and Africa Middle East and Africa Middle East and Africa = Population = Population = Pounds consumed = Pounds consumed 27 27 lbs/cap lbs/cap 10 10 lbs/cap lbs/cap <1 <1 lbs/cap lbs/cap 2 2 lbs/cap lbs/cap <1 <1 lbs/cap lbs/cap 22 |
 Focus on key strategies Focus on key strategies • • Potato pizza innovation Potato pizza innovation – – Introduced in Korea ten years ago Introduced in Korea ten years ago – – Beyond Korea; carried by major Beyond Korea; carried by major pizza chains across Asia pizza chains across Asia – – Drives 10 million lbs. of business for Drives 10 million lbs. of business for Lamb Weston annually Lamb Weston annually 23 Expanding original regional ideas Expanding original regional ideas |
 International International 24 India India Mexico Mexico Canada Canada Caribbean Caribbean Consumer Foods primary markets Consumer Foods primary markets 1 Consumer Foods’ market in India is through Agro Tech Foods Limited, an Indian publicly-held company in which ConAgra Foods owns a majority interest, and consolidates for GAAP accounting purposes. 1 |
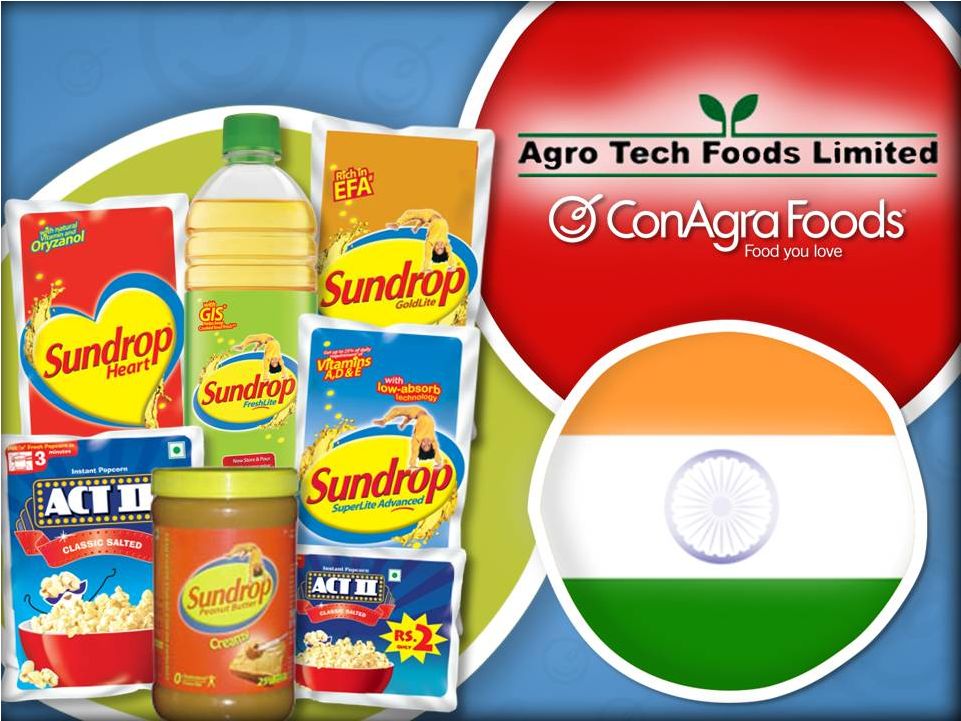 25 India |
 26 Canada |
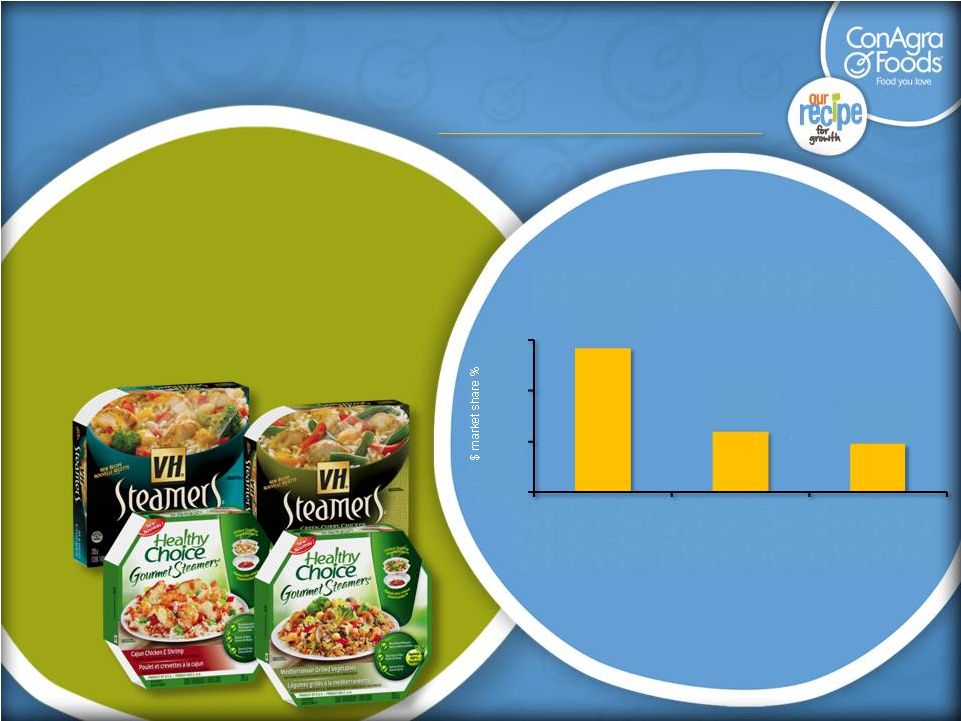 Canada: A leader in Frozen Canada: A leader in Frozen 27 • • Growing share Growing share with 15-20% price premium with 15-20% price premium • • Most significant innovation Most significant innovation in a decade in a decade • • Strong retailer support Strong retailer support +2.5 0.0 +1.8 $ Share - Health & Wellness 27.7 24.4 23.9 28 26 24 22 Healthy Choice Lean Cuisine selections Smart Ones Source: Nielsen MarketTrack: National GB+DR+MM – Dollars – L52 Weeks Ending January 14, 2012 – Share of Single Serve Health & Wellness |
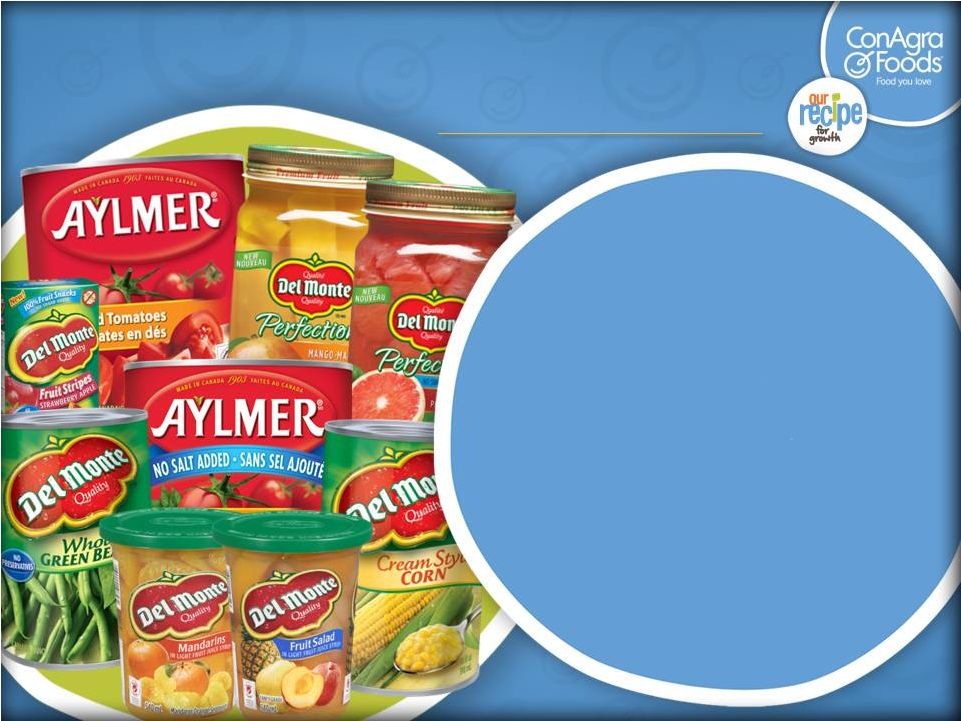 Del Monte Canada acquisition Del Monte Canada acquisition 28 • • Acquisition pending; Acquisition pending; anticipate close in Q4 FY12 anticipate close in Q4 FY12 • • $150 million in sales $150 million in sales • • Tomatoes Tomatoes • • Vegetables Vegetables • • Fruit and fruit snacks Fruit and fruit snacks |
 29 |
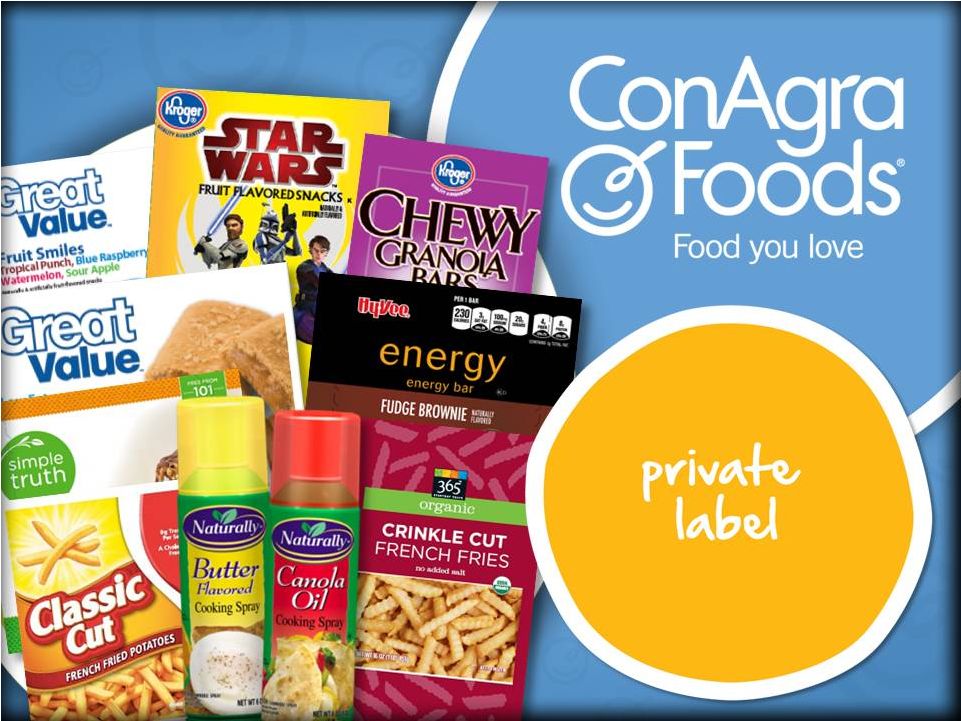
 Private label: Growing and Private label: Growing and important to customers important to customers • • Consumer appeal Consumer appeal • • Retailers expanding offerings Retailers expanding offerings • • Strong market share potential Strong market share potential 30 Focused Focused on on high high opportunity opportunity private private label label categories categories |
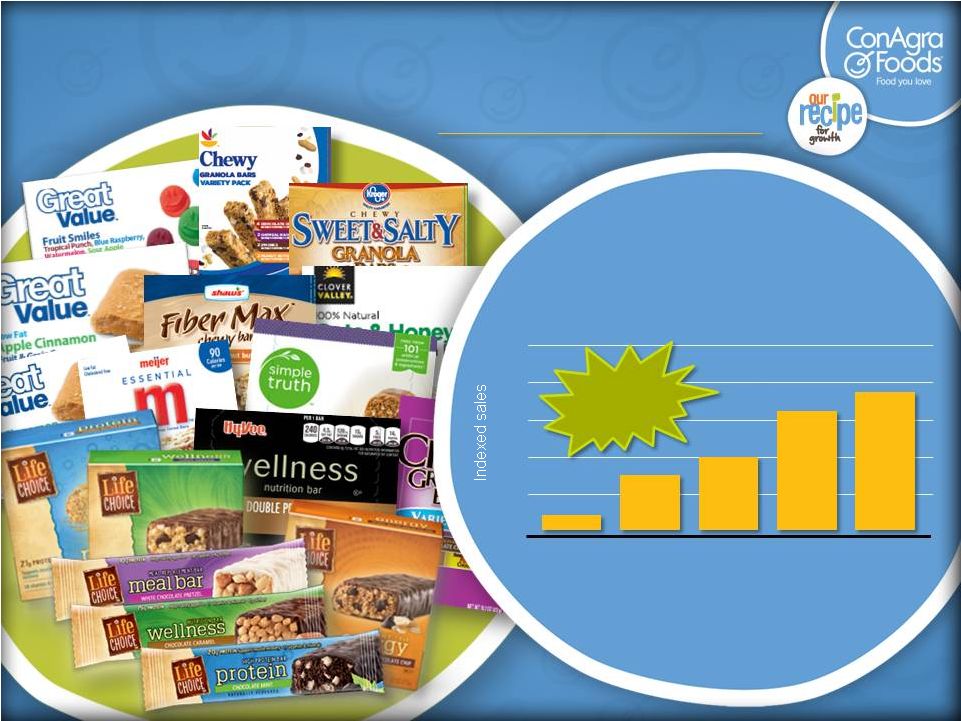 Great success in bars business Great success in bars business 31 FY08 FY08 FY09 FY09 FY10 FY10 FY11 FY11 FY12 (est.) FY12 (est.) 250 250 220 220 190 190 160 160 130 130 100 100 Bars Bars business business trends trends – – net net sales sales FY08 – FY08 – FY12 (est.) FY12 (est.) +18% +18% CAGR CAGR Includes acquisitions |
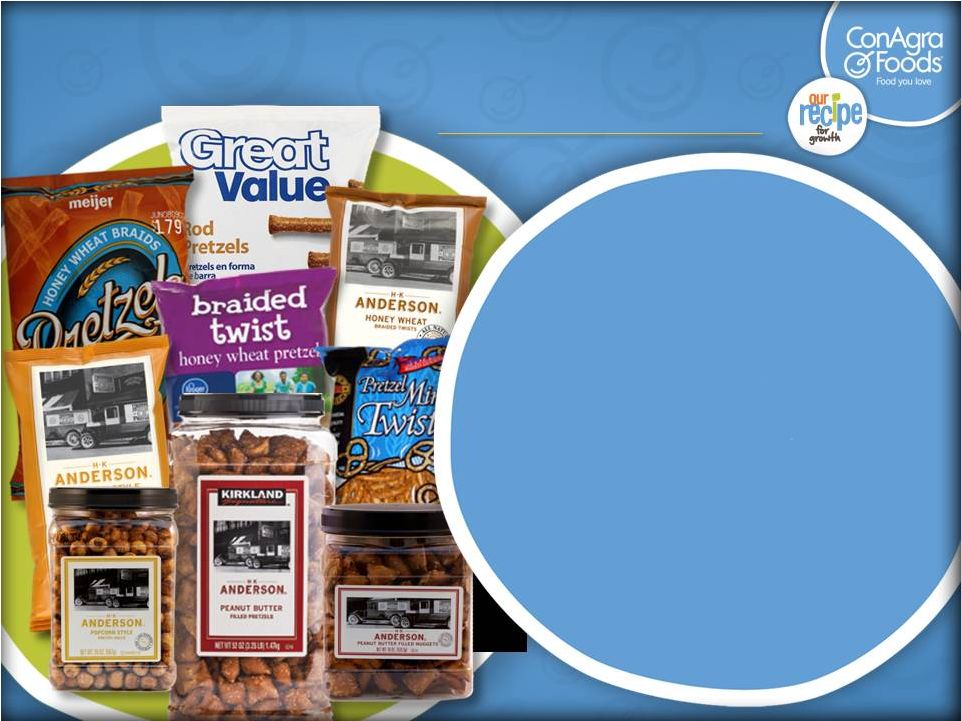 Recent acquisition: National Pretzel Company Recent acquisition: National Pretzel Company 32 • • Sales approaching Sales approaching $200 million $200 million • • 7% sales CAGR 7% sales CAGR over 3 years over 3 years • • Salty snacks: strong Salty snacks: strong growth potential growth potential |
 33 |
 |
 35 |
 36 André Hawaux, President Consumer Foods |
 37 |
 Consumer Foods growth focus 38 Total $ Margin Management |
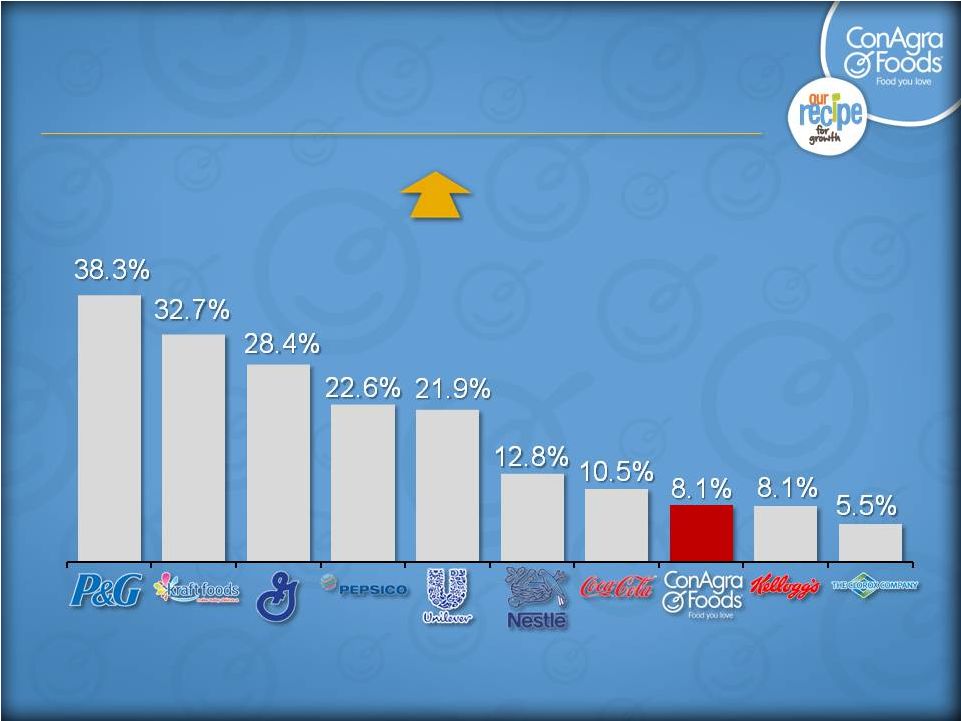 2011 Kantar PoweRanking ® report ConAgra Foods moves from #9 to 39 #8 |
 • • Adopting best-in-class pricing and trade practices Adopting best-in-class pricing and trade practices • • Driving category growth Driving category growth • • Developing win-win multi-year joint business plans Developing win-win multi-year joint business plans • • Presenting ONE ConAgra Foods voice Presenting ONE ConAgra Foods voice Five key areas of focus Five key areas of focus • • Establishing customer P&Ls as key measurement Establishing customer P&Ls as key measurement |
 Customer Connect strategies Customer Connect strategies 41 Customer-facing organization redesign Customer-facing organization redesign New Customer Development capabilities New Customer Development capabilities Joint Business Planning Joint Business Planning |
 Customer-facing redesign Customer-facing redesign 42 One ConAgra Foods voice One ConAgra Foods voice Decision making closer to customer Decision making closer to customer “General business managers" “General business managers" Delivering growth and profit with valued solutions Delivering growth and profit with valued solutions across categories across categories Customer focused Customer focused Collaborative and simplified Collaborative and simplified Accountable Accountable |
 Customer development capabilities Customer development capabilities 43 Category Plan Commercialization Category Plan Commercialization Revenue Growth Management Revenue Growth Management Customer Insights and Analytics Customer Insights and Analytics Shopper Marketing Shopper Marketing In-Store Experience In-Store Experience Customer Customer and margin and margin impact! impact! |
 Revenue Growth Management Revenue Growth Management 44 Creatig one centralized team focused on holistic revenue growth Establishing a consistent approach to pricing and trade Employing specialists to deliver robust pricing and trade analytics Building pricing mindset across the organization |
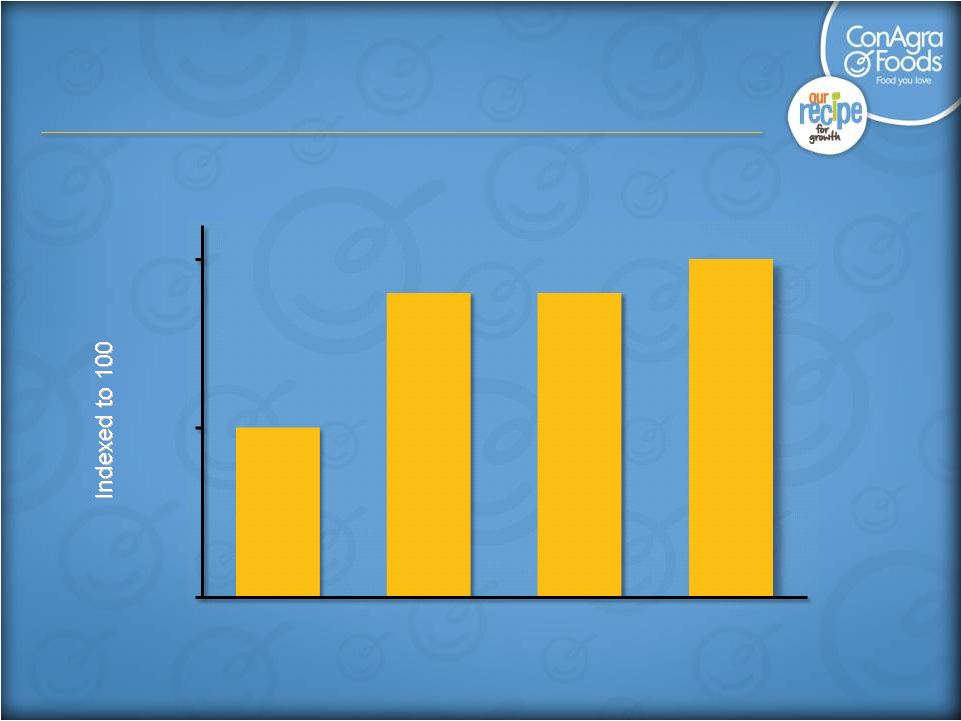 Pricing progress Pricing progress Q4 Q4 FY11 FY11 Q3 Q3 FY11 FY11 Q2 Q2 FY12 FY12 Q1 Q1 FY12 FY12 Indexed Net Realized Price Indexed Net Realized Price 45 100 100 104 104 104 104 105 105 95 100 105 |
 Joint Business Planning (JBP) • Two-way dialogue with customers • Category growth focus • Strategic, multi-year planning • Tailored to customers’ specific needs • Engaging the full organization 46 |
 + 2% CAGR +4% CAGR + 1.7 pts. + 3.1 pts.* Frozen success 47 *IRI all outlet HH Panel dollar share SSM 52 week ending 6/29/2008 and 52 week ending 9/25/2011, FY12 Forecast FY2008 to FY2011 progress ConAgra Foods frozen success: $2.0 billion and growing Volume Net Sales Gross Margin Share |
 Frozen Recipe for Growth 48 Steaming MicroRite Tray Adjacencies MicroRite® (trademark and technology) is owned by Graphic Packaging International, Inc. (GPI) |
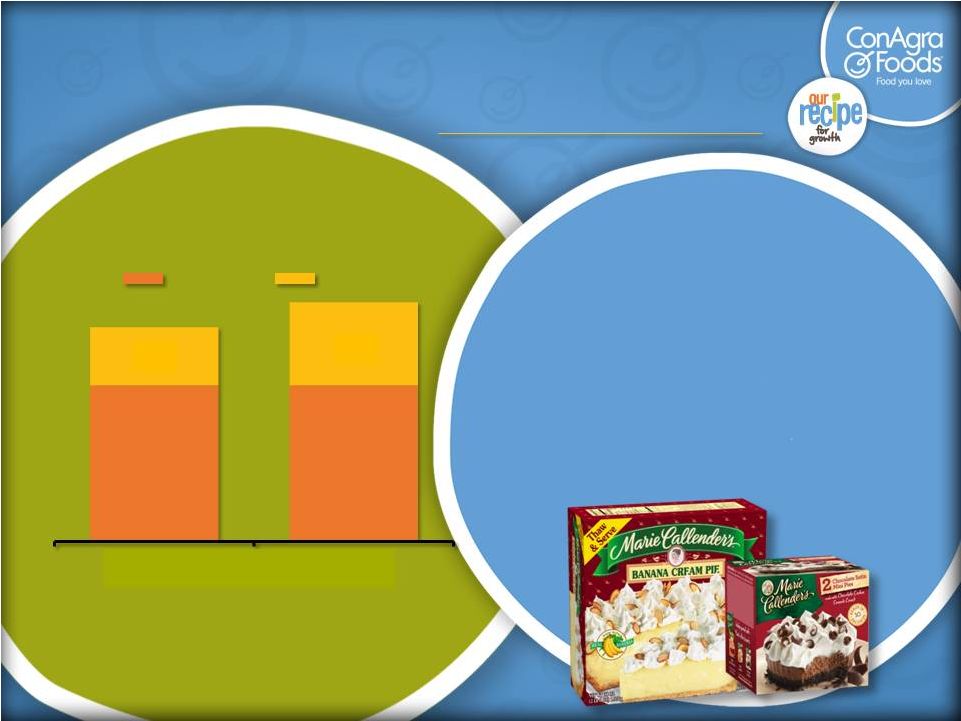 Frozen desserts are a growing adjacency 49 • $2 billion category (retail $) • Occasion/flavor innovation • Distribution expansion • Strategic acquisitions • $50 million + CAG sales growth over last 2 years Frozen Pie Category & Share Trend (All Outlet Dollars, 12-week Holiday Period) Source: IRI All Outlets sales, 12-week period ending January 1, 2012 Total Category $171M (+11%) $153M Competitors CAG $111 $42 $60 Holiday 10 Holiday 11 $111 |
 50 Marie Callender’s/Reddi-wip |
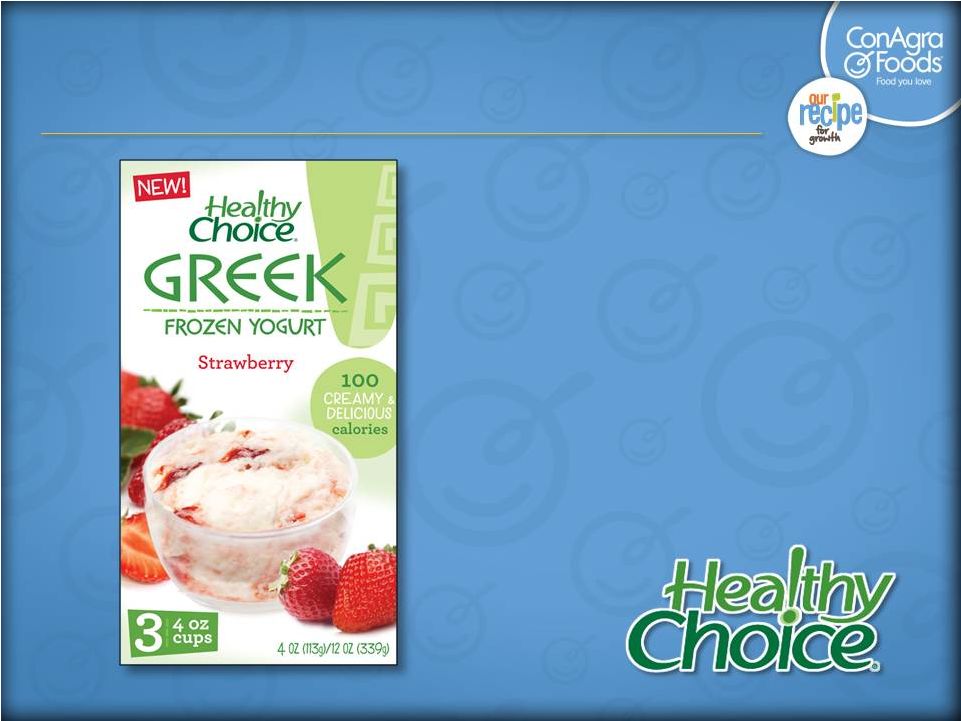 Healthy Choice Greek Frozen Yogurt • Deliciously thick and creamy • Made with healthy ingredients like real fruit and yogurt cultures • Perfectly portioned at only 100 calories 51 |
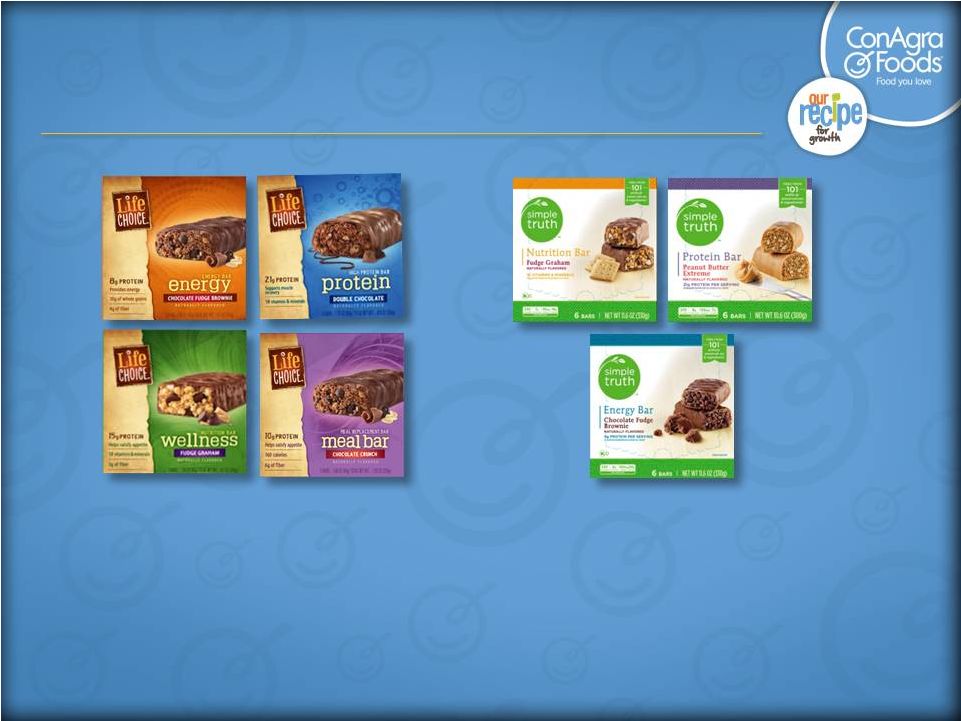 Health and nutrition bars 52 • 20 SKUs • 1150 Stores • Strong takeaway • 8 SKUs • All divisions • April 2012 ship date |
 Customer Connect transformation Customer Connect transformation 53 Tactical pricer Tactical pricer Multiple brand languages Multiple brand languages Sales quota driven Sales quota driven ONE ConAgra Foods voice ONE ConAgra Foods voice From From To To Multi-year strategic plans Multi-year strategic plans Category growth focus Category growth focus Strategic pricing and trade Strategic pricing and trade Short-term plans Short-term plans Brand-centric Brand-centric P&L focused sales leaders P&L focused sales leaders |
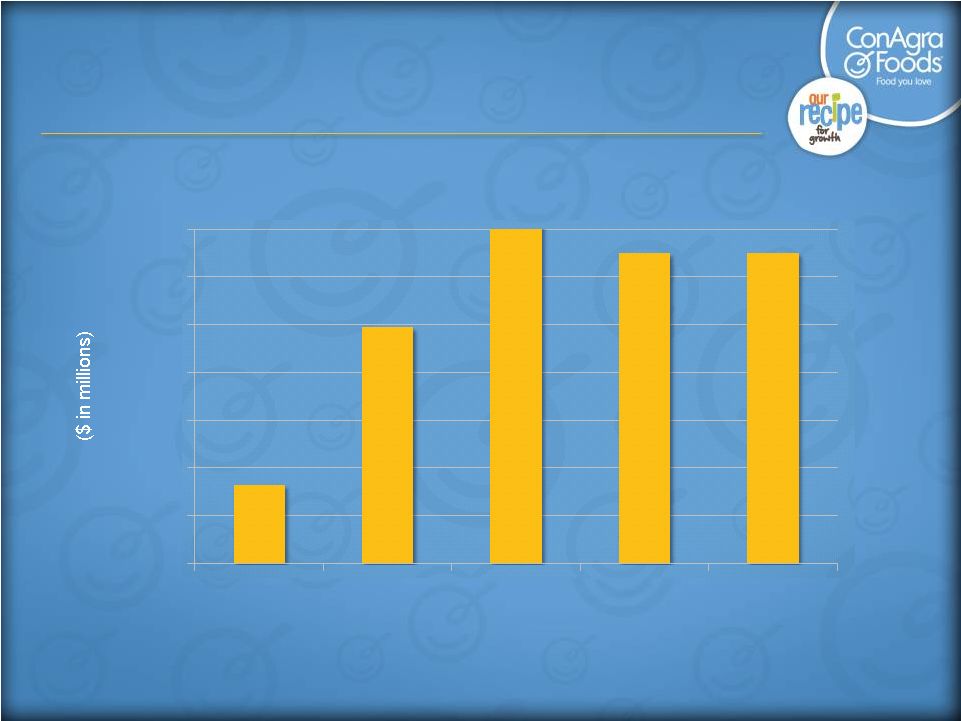
 Cost savings ($ in millions) Cost savings ($ in millions) About $1.7 billion in savings delivered since beginning of initiatives in FY07 About $1.7 billion in savings delivered since beginning of initiatives in FY07 “Fuel” “Fuel” driven cost reductions driven cost reductions • • Supplier collaboration Supplier collaboration • • Complexity reduction Complexity reduction • • Plant optimization Plant optimization • • Network optimization Network optimization • • Leverage SAP Leverage SAP • • Base productivity Base productivity $275 $240 $300 $300 $280 $275 FY07 FY08 FY09 FY10 FY11 FY12 (est.) |
 Supply Chain commitments FY13-15 Supply Chain commitments FY13-15 World Class Safety 99% Launch Fill Rate Top 3 Kantar Supply Chain 18% Cash Conversion Cycle Improvement 100% TEAM COMMITMENT Uncompromised Food Safety & Quality $200-250MM Annual Cost Reductions |
 Food safety recognition • SQFI 2011 Quality Achievement Award Manufacturer of the Year • Strong food safety culture driven by – Leadership and employee commitment – Behaviors, training and education – Policies and procedures – Recognition – Investment 56 |
 Consumer Foods growth focus 57 Total $ Margin Management |
 58 John Gehring CFO ConAgra Foods |
 Long-term goals • Sales growth of 3% annually • EPS* growth of 6-8% annually • ROIC* of 13-14% 59 *EPS and ROIC guidance discussed in this presentation has been adjusted for items impacting comparability. EPS guidance is based on diluted EPS, adjusted for items impacting comparability. The inability to predict the timing and amount of future items impacting comparability makes a detailed reconciliation of projections impracticable. |
 Financial priorities 1. Strong earnings and cash flows 2. Healthy balance sheet and strong liquidity 3. High-return capital allocation with top-tier dividend 60 |
 61 Operating cash flow Operating Cash Flow (continuing operations) *Excludes any FY12 discretionary pension contributions $0 $200 $400 $600 $800 $1,000 $1,200 $1,400 FY 08 FY09 FY10 FY11 FY12* (est.) |
 Cash flow • EPS: Long-term EPS* growth of 6-8% annually • Working capital efficiency • Capital expenditures – Approximately $450 million/year FY13-15 – Focused on growth and cost reduction *Diluted EPS, adjusted for items impacting comparability Target Operating Cash Flows $1.2 to $1.4 billion per year for the next 3 fiscal years 62 |
 Healthy balance sheet and strong liquidity • Strong investment grade credit rating • Strong liquidity, improved financial flexibility – Over $700 million of cash at end of Q2 FY12 – Continued access to commercial paper markets – $1.5 billion revolving credit facility in place for 5 years – Manageable debt maturities 63 Debt-to-Capital Debt/EBITDA* 42.4% 2.5x 41.4% 2.2x 40.7% 1.8x FY09 FY09 FY10 FY10 FY11 FY11 38% 2.0x FY12 (est.) FY12 (est.) *See Appendix for Regulation G reconciliation. For FY12 estimate, the inability to predict the amount and timing of future items makes a detailed reconciliation of projections impracticable. |
 Capital allocation: Dividends & organic growth • Dividend payout: Top tier • Growth and profit enhancement investments – New product and capacity expansion – Supply Chain efficiency Dividends & Organic Growth 64 |
 Capital allocation: M&A process guidelines Category upside / position within category Customer need / relationships Potential for ConAgra Foods to improve through: – Innovation – Supply chain – Distribution Operating leverage/scale Organic sales growth potential Margin structure EPS contribution ROIC Strategic fit Financial fit Acquisitions Right assets / Right growth potential / Right price |
 Capital allocation: Share repurchase • Recently increased program by $750 million • As of Q2 earnings release (12/20/11): $780 million remaining Share Repurchase 66 |
 Fiscal 2012: Confirming guidance • Low- to mid-single digit EPS growth over $1.75* in FY11 • Second-half expectations: – Y-O-Y growth concentrated in Q4 – Toughest inflation headwinds in Q3 • Consumer Foods inflation 10% for full fiscal year • Operating cash flow (continuing operations): $1.3B** 67 *Diluted EPS, adjusted for items impacting comparability. See Appendix for Regulation G reconciliation. **Excludes any FY12 discretionary pension contributions |
 • Sales growth of 3% annually • EPS* growth of 6-8% annually Margin improvement Operating leverage Capital allocation • ROIC* of 13-14% *EPS and ROIC guidance discussed in this presentation has been adjusted for items impacting comparability. EPS guidance is based on diluted EPS, adjusted for items impacting comparability. The inability to predict the timing and amount of future items impacting comparability makes a detailed reconciliation of projections impracticable. 68 Long-term goals |
 Summary 1. Focus: strong earnings and cash flow, healthy balance sheet and liquidity, and high-return capital allocation 2. Cash flow expected to support strong dividend and investments to drive sustainable business model 3. FY12 EPS* on track 4. Committed to EPS* growth of 6-8% long-term 69 *Diluted EPS, adjusted for items impacting comparability. See Appendix for Regulation G reconciliation. |
 70 CAGNY 2012 |
 Appendix 71 |
 Appendix: Regulation G 72 Reconciliation of FY11 diluted earnings per share, adjusted for items impacting comparability. Amounts may be impacted by rounding. FY11 Diluted EPS Total FY11 Diluted EPS from continuing operations $ 1.90 Items impacting comparability: Expense related to restructuring charges 0.08 (Benefit) related to unallocated mark-to-market impact of derivatives (0.05) (Benefit) related to receipt of insurance proceeds from Garner, N.C., accident (0.15) (Benefit) of gain on early repayment of Trading & Merchandising divestiture-related PIK note (0.04) Rounding 0.01 Diluted EPS adjusted for items impacting comparability $ 1.75 |
 Appendix: Regulation G 73 Reconciliation of EBITDA to Income from continuing operations before income taxes and equity method investment earnings EBITDA: Income from continuing operations before income taxes, equity method investment earnings, depreciation and amortization. Fifty-two Weeks Ended Fifty-two Weeks Ended Fifty-two Weeks Ended (Dollars in millions) Q4 FY11 Q4 FY10 Q4 FY09 EBITDA $ 1,763.3 $ 1,565.9 $ 1,399.2 Items excluded from EBITDA: Interest expense, net 177.5 160.4 186.0 Depreciation and Amortization 360.9 324.1 304.9 Income from continuing operations before income taxes and equity method investment earnings $ 1,224.9 $ 1,081.4 $ 908.3 EBITDA is not a measure of financial performance under GAAP and should not be considered as a substitute of Income from continuing operations before income taxes and equity method investment earnings. However, management believes EBITDA may provide additional information with respect to the ConAgra Foods' cash generating capacity and its ability to meet its future debt service. Because EBITDA excludes some, but not all, items that affect net income and the definition of EBITDA may vary among other companies, the EBITDA measure presented by ConAgra Foods may not be comparable to EBITDA measures of other companies. |
 Consumer Foods COGS Major components $1.4 B $1.4 B $4.1 B Logistics Manufacturing Procurement $0.7 B COGS base % of procurement spend by commodity class (current FY12 est.) $6.2 B Proteins Fats & oils Dairy Grains and other ingredients Seeds and nuts Fruits, vegetables, legumes Sweeteners, starches, other Packaging Energy 22% 13% 5% 10% 5% 8% 6% 29% 2% 74 |