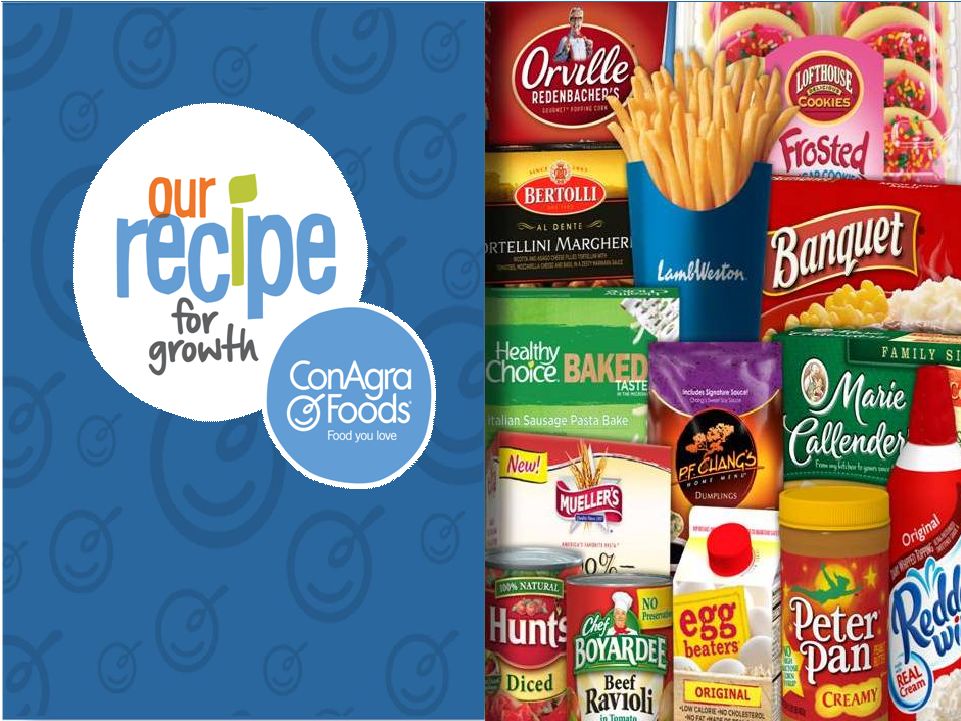
 1 Feb. 18, 2014 Exhibit 99.1 CAGNY 2014 |
 Agenda • Gary Rodkin, CEO • John Gehring, CFO 2 |
 Note on forward-looking statements 3 This presentation contains forward-looking statements within the meaning of the Private Securities Litigation Reform Act of 1995. These forward-looking statements are based on management’s current expectations and are subject to uncertainty and changes in circumstances. These risks and uncertainties include, among other things: ConAgra Foods’ ability to realize the synergies and benefits contemplated by the acquisition of Ralcorp Holdings, Inc., and its ability to effectively integrate the business of Ralcorp; the timing and ability to consummate the potential joint venture combining the flour milling businesses of ConAgra Foods, Cargill, Incorporated, and CHS Inc., including, satisfying the financing and other closing conditions as well as the divestiture of flour milling facilities within the expected timeframe or at all; ConAgra Foods’ ability to realize the synergies and benefits contemplated by the potential joint venture; the availability and prices of raw materials, including any negative effects caused by inflation or adverse weather conditions; the effectiveness of ConAgra Foods’ product pricing, including any pricing actions and promotional changes; the ultimate outcome of litigation, including the lead paint matter; future economic circumstances; industry conditions; ConAgra Foods’ ability to execute its operating and restructuring plans; the success of ConAgra Foods’ cost-saving initiatives, innovation, and marketing investments; the competitive environment and related market conditions; operating efficiencies; the ultimate impact of any ConAgra Foods product recalls; access to capital; actions of governments and regulatory factors affecting ConAgra Foods’ businesses, including the Patient Protection and Affordable Care Act; the amount and timing of repurchases of ConAgra Foods’ common stock and debt, if any; and other risks described in ConAgra Foods’ reports filed with the Securities and Exchange Commission, including its most recent annual report on Form 10-K and subsequent reports on Forms 10-Q and 8-K. Investors and security holders are cautioned not to place undue reliance on these forward-looking statements, which speak only as of the date they are made. ConAgra Foods disclaims any obligation to update or revise statements contained in this presentation to reflect future events or circumstances or otherwise. |
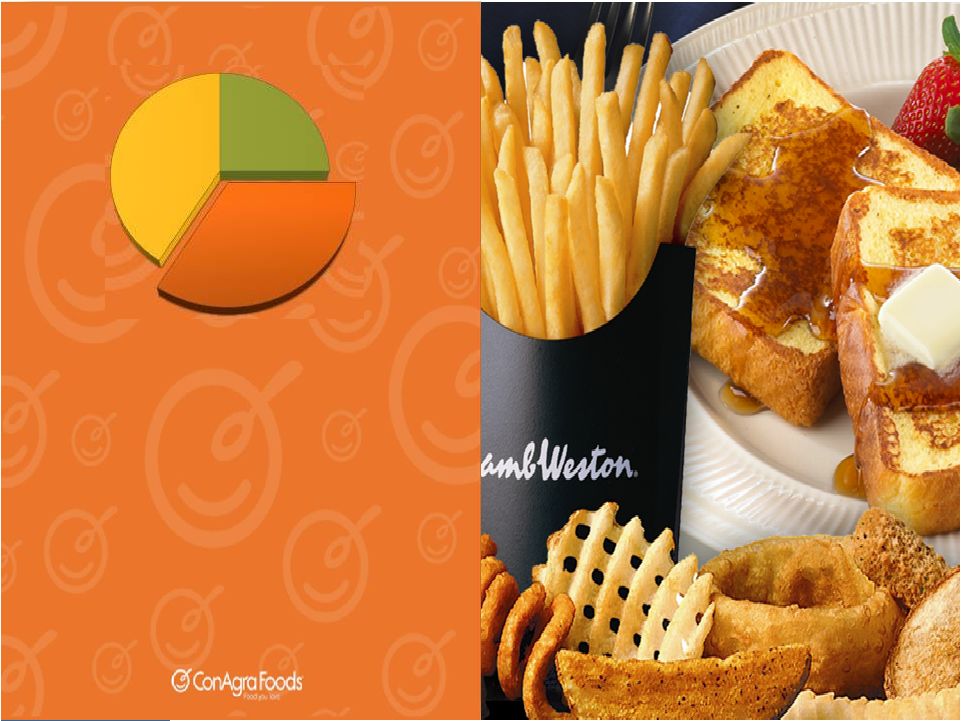
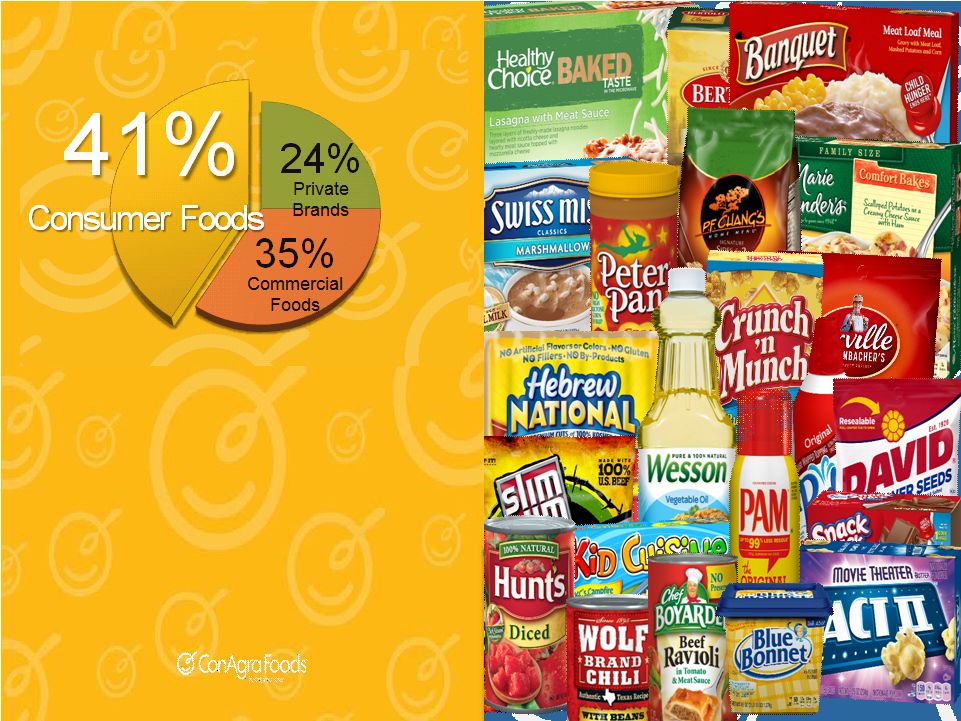
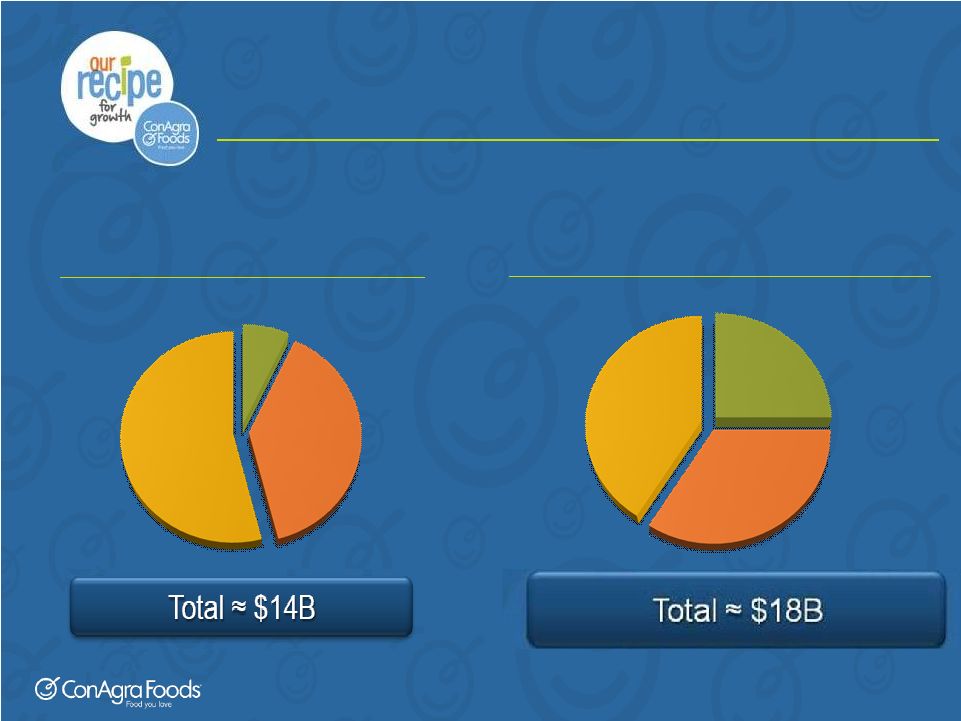 Current snapshot 4 ConAgra Foods’ FY 2013 sales mix ConAgra Foods’ FY 2013 sales mix ConAgra Foods’ FY 2014 (est.) sales mix ConAgra Foods’ FY 2014 (est.) sales mix Commercial Foods Commercial Foods Consumer Foods Consumer Foods Private Brands Private Brands 41% 35% 24% Commercial Foods Commercial Foods Consumer Foods Consumer Foods Private Brands Private Brands 54% 39% 7% |
 Fiscal 2014: short-term issues • Ralcorp integration • Foodservice customer disruption • Consumer brand challenges 5 |
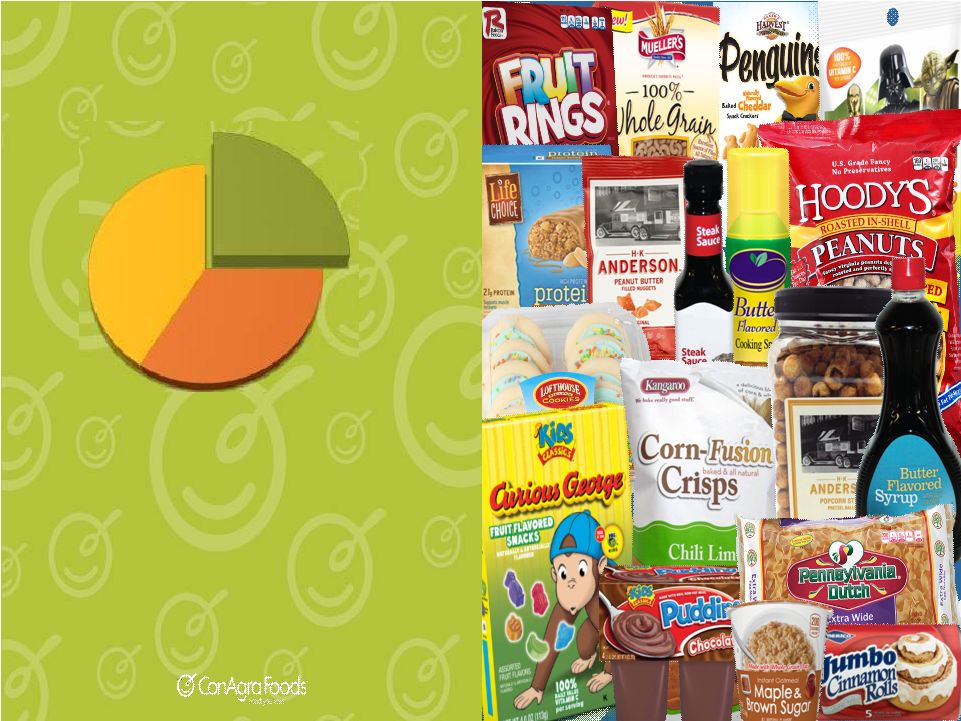 Largest private brand food business in North America. Makes and sells private brands to retail customers. 24% 24% 41% Consumer Foods 35% Commercial Foods Private Private Brands Brands |
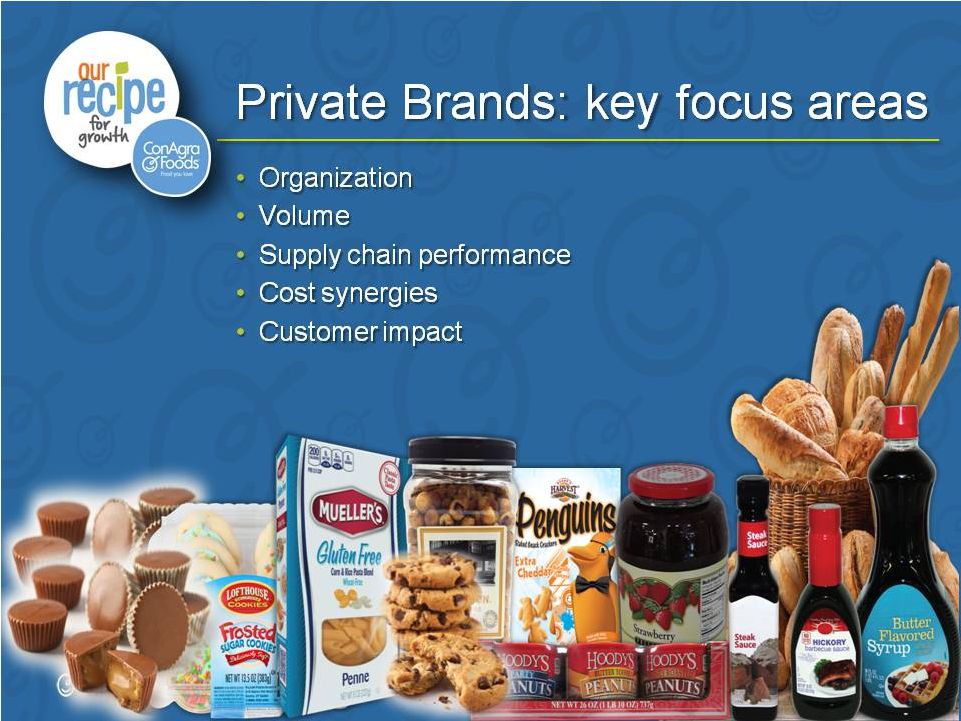 |
 Cost synergies 8 • On track to deliver on commitments • Using scale in sourcing and procurement contracts • Robust pipeline |
 Engaging with customers 9 “We’re excited by the potential of leveraging the entire portfolio. It really simplifies doing business with you.” – ConAgra Foods retail customer |
 Fast-growing retailers: a focus on Private Label 10 Source: High-focus Private Label retailers comprised of 5 retailers. Kantar Retail – Edible Grocery; Planet Retail; Deloitte American pantry study, Progressive Grocer; Nielsen. Dollar Sales Growth “You’re a key partner on our journey. We will move from good to great with private brands as our differentiator.” – ConAgra Foods retail customer High Focus High Focus Private Label Private Label Retailers Retailers Remaining Remaining Top 30 Top 30 Retailers Retailers 2x |
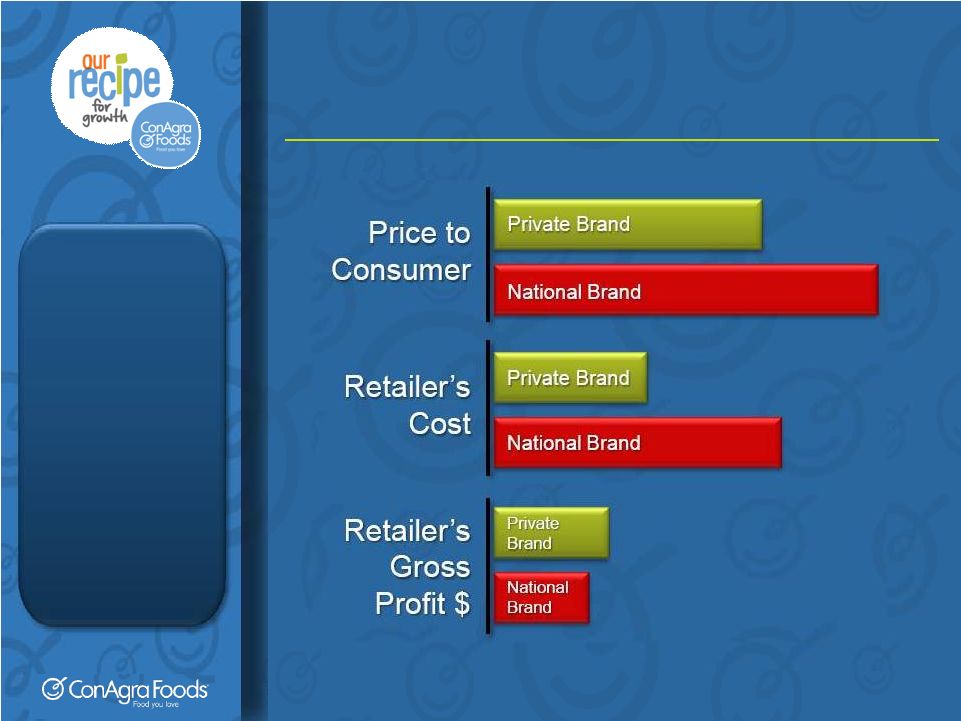 Private vs. National Brands 11 Source: Wall Street research. Comparisons based on a $10 national brand retail price illustration. “We like your strategy for Private Brands. You offer both scale and flexibility.” – ConAgra Foods retail customer |
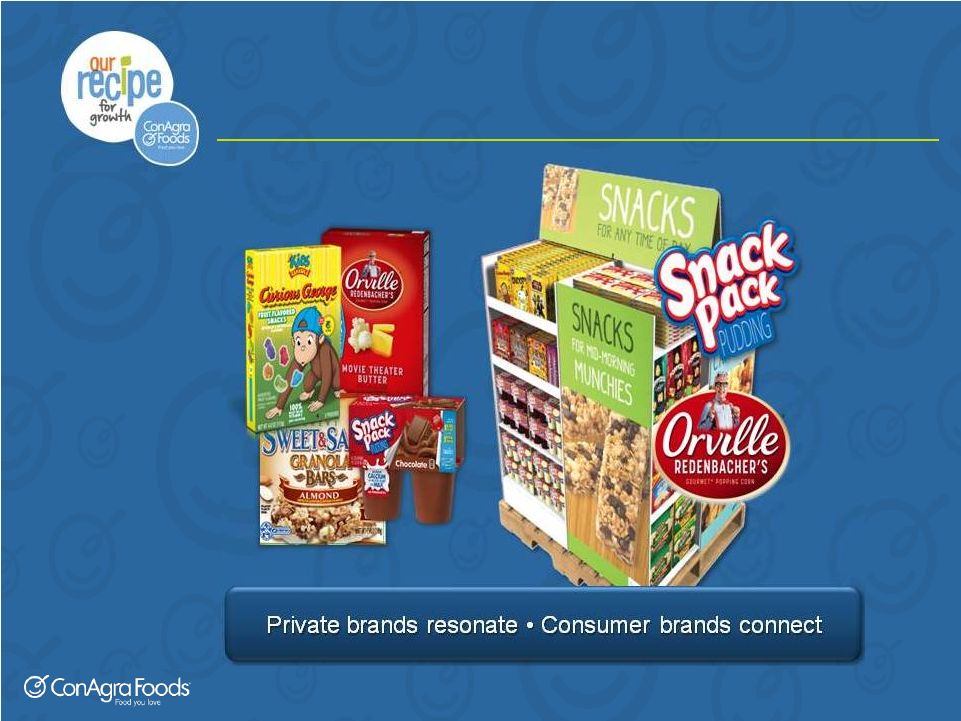 Private Brands + Consumer Brands 12 |
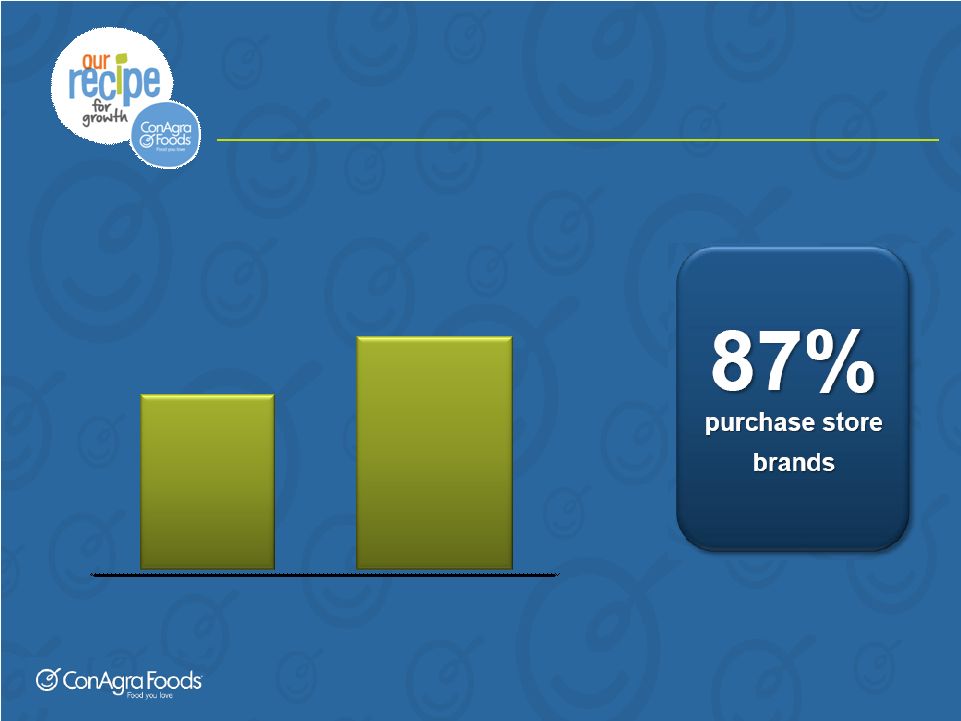 Growing appeal to consumers 13 Store brands as good as national brands Source: 71% say brand names are not better products. 87% say they purchase store brands occasionally or more often. Integer Group® and M/A/R/C® Research, 2013. PLMA 2013 survey of primary shoppers. 2010 57% agree 71% agree 2013 |
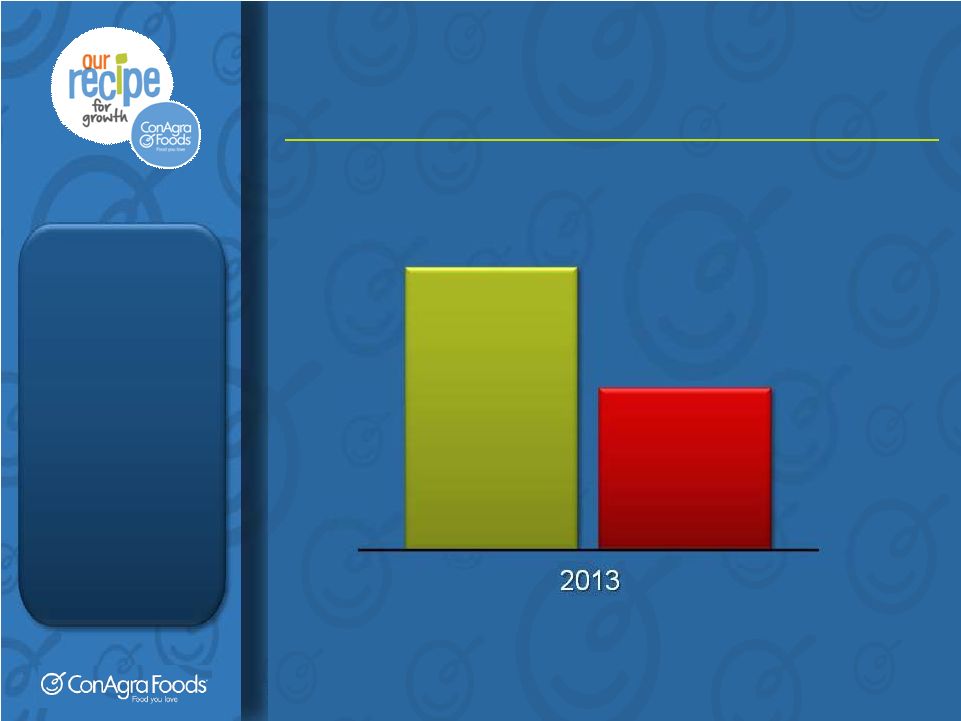
 Private label growth Private label growth 14 Source: Nielsen Jan. 13, 2014 Scantrack, Total U.S. – All Outlets Combined, UPC-coded. Bars reflect excess growth of private label vs. branded food in terms of year-over-year dollar sales growth ($ billions). |
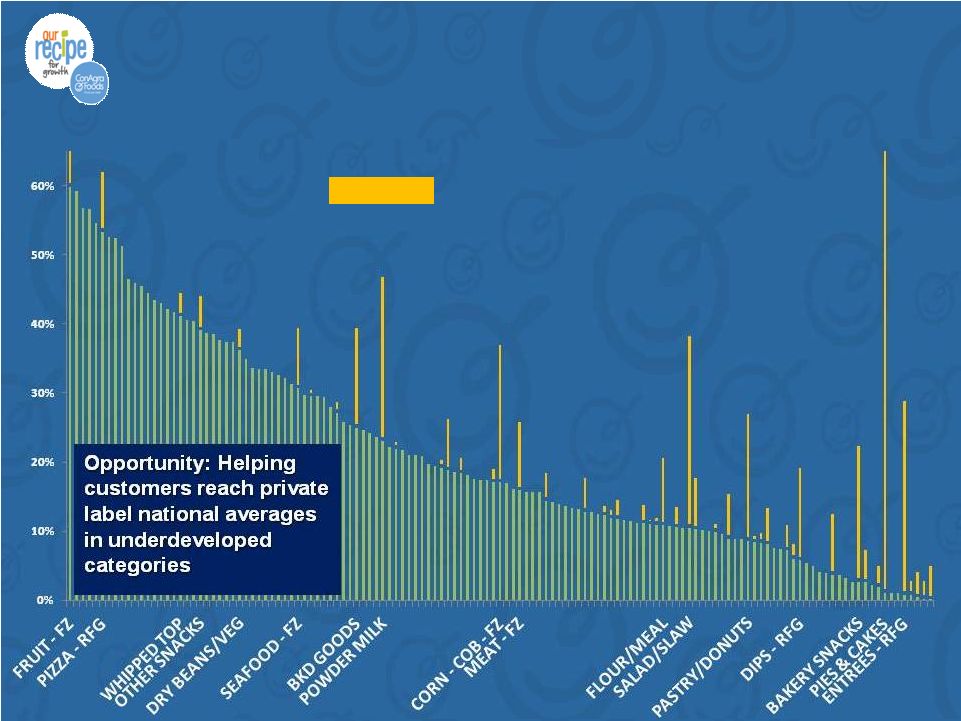 Distribution opportunity for ConAgra Foods Potential: $20 million of sales at one customer 15 = incremental sales opportunity for ConAgra Foods in select categories |
 |
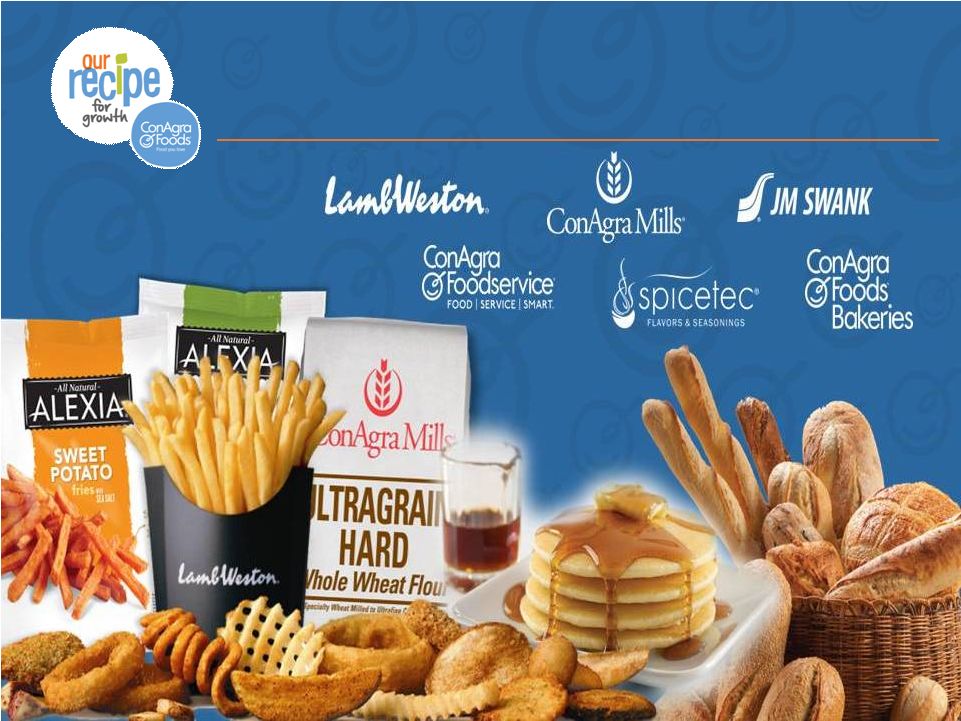
 Makes and sells specialty food and ingredients to restaurants, foodservice operators and other food makers across the world. 35% 35% 24% Private Brands 41% Consumer Foods Commercial Foods Commercial Foods |
 Commercial Foods 18 |
 Lamb Weston • Leading North American supplier • Double-digit international growth • Major customer transition • Crop quality challenge |
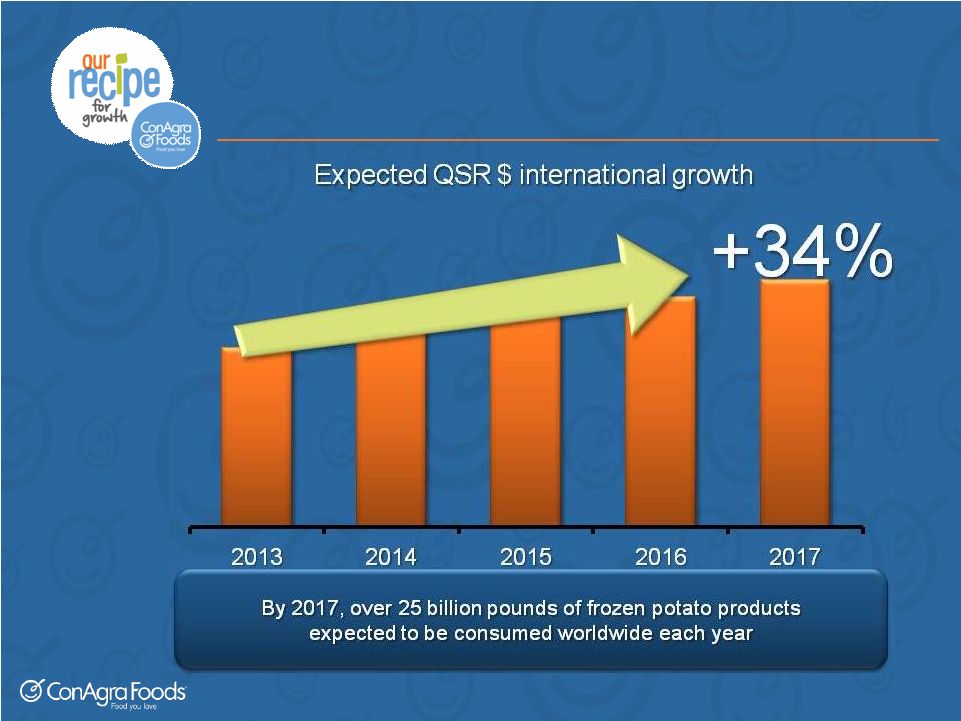 Global growth opportunity 20 Source: Euromonitor projections. 34% 34% represents represents nominal nominal growth growth from from 2012 2012 – – 2017. 2017. |
 Ardent Mills: focused joint venture • Proposed JV to be owned by ConAgra Foods, Cargill and CHS • Combine operations of ConAgra Mills and Horizon Milling (a Cargill/CHS joint venture) to create a premier flour milling company • Supported across North America by strong network of mills and bakery mix facilities • Strategically and financially beneficial 21 |
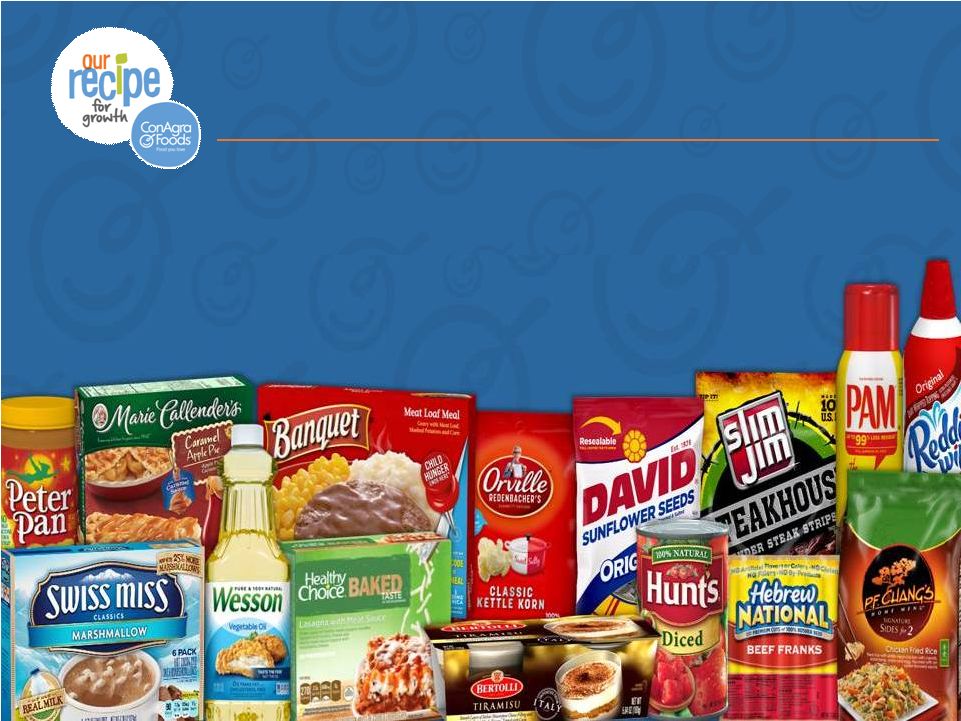
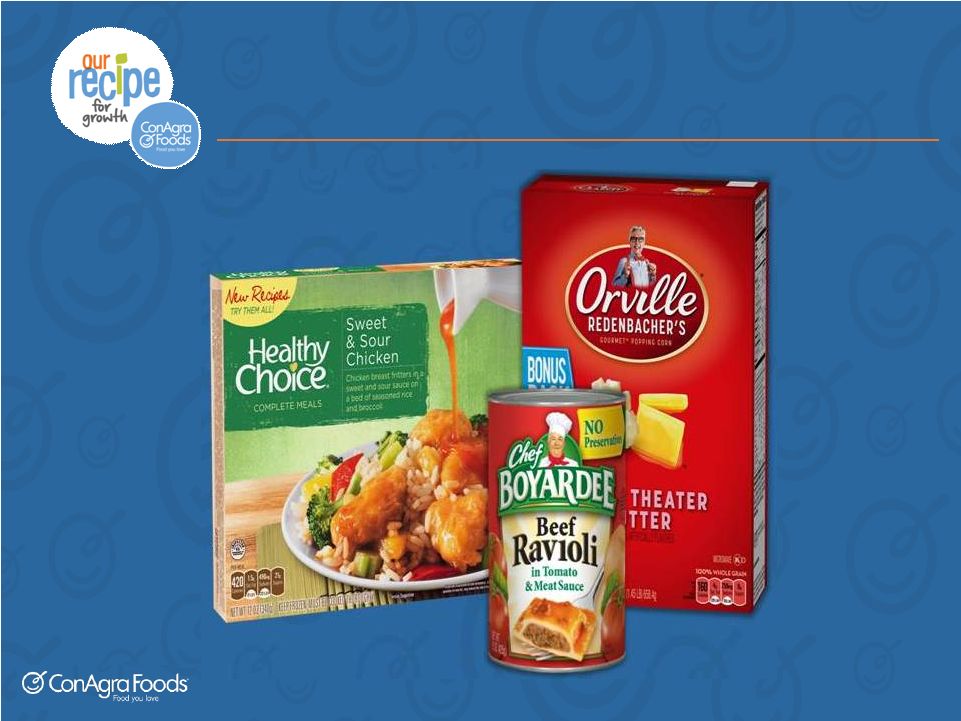
 Makes and sells leading consumer branded food to retail customers. |
 Consumer Foods • “Perfect at Retail” 4Ps approach • Brands to fix |
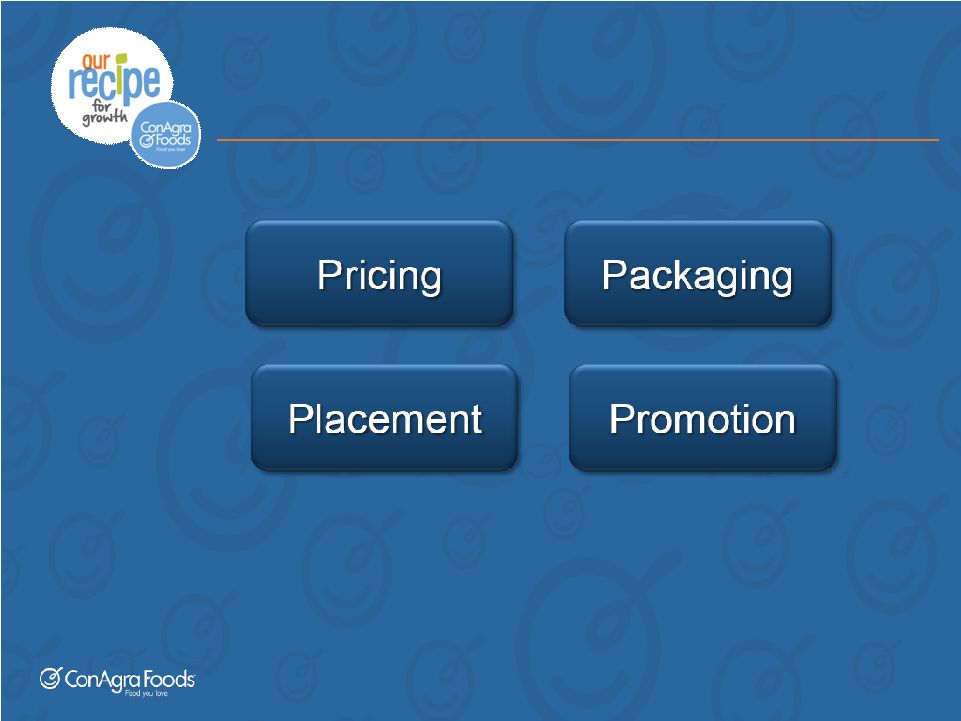 “Perfect at Retail” 24 |
 Pricing • Right everyday pricing • Competitive promotions • Overall value 25 |
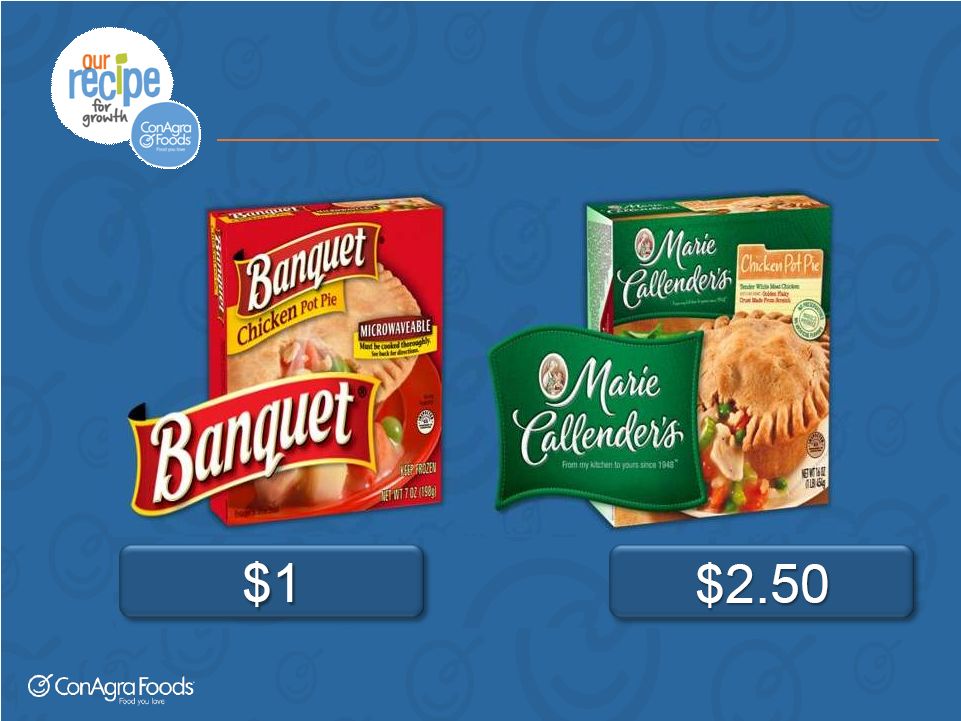 Value at multiple price-points 26 |
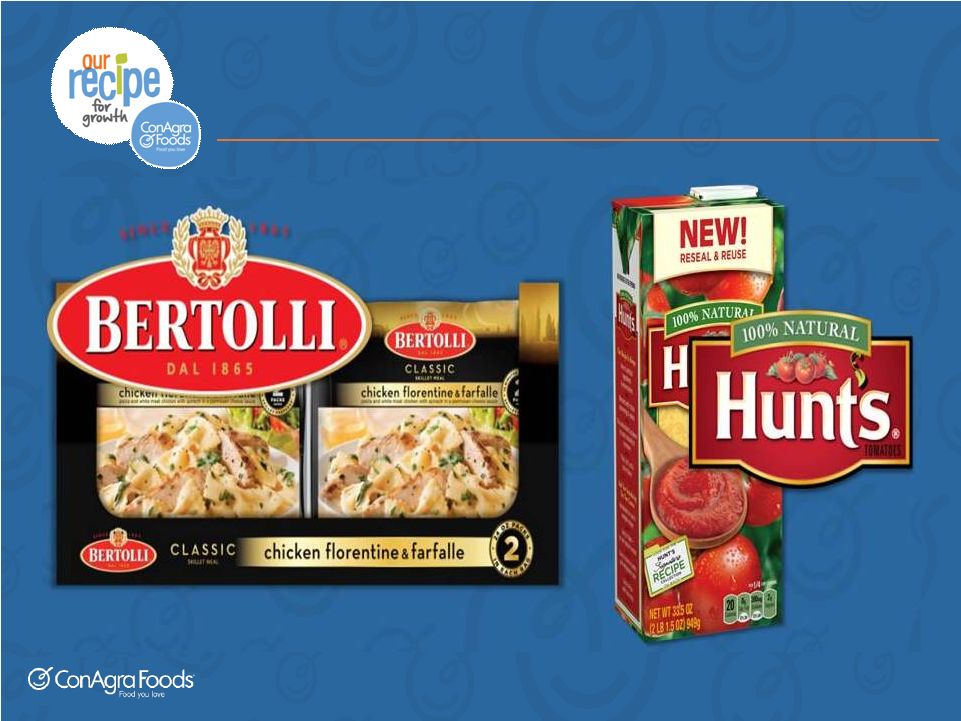 Packaging 27 |
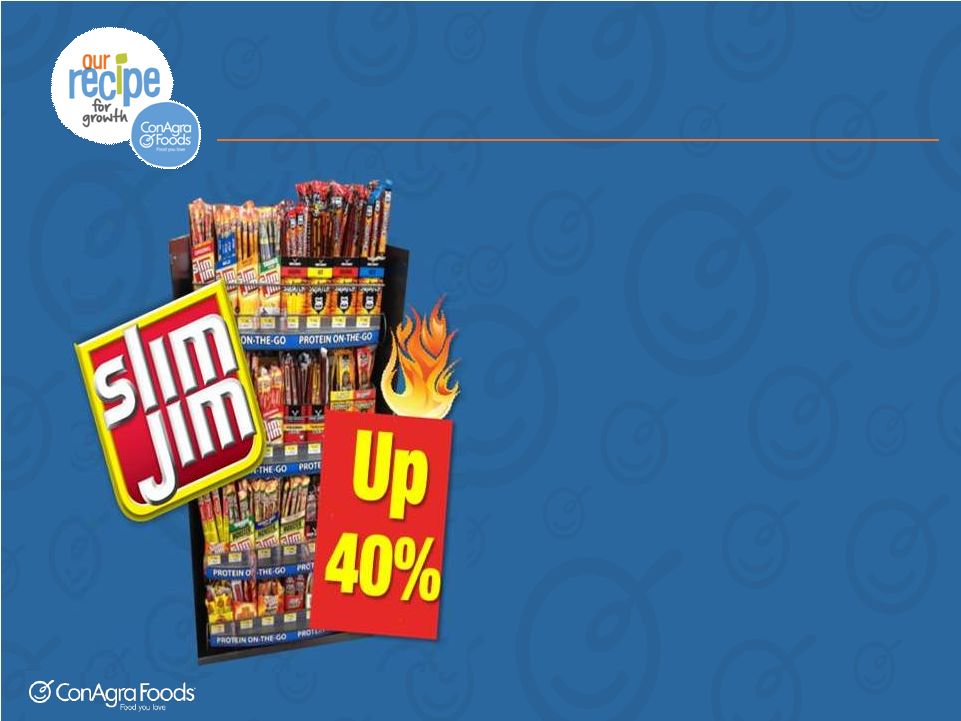 Placement • More facings for best sellers • Shopper-oriented displays • Retailer-efficient space designs 28 Source: IRI Sales, 13 weeks ended Jan. 26, 2014 Source: IRI Sales, 13 weeks ended Jan. 26, 2014 |
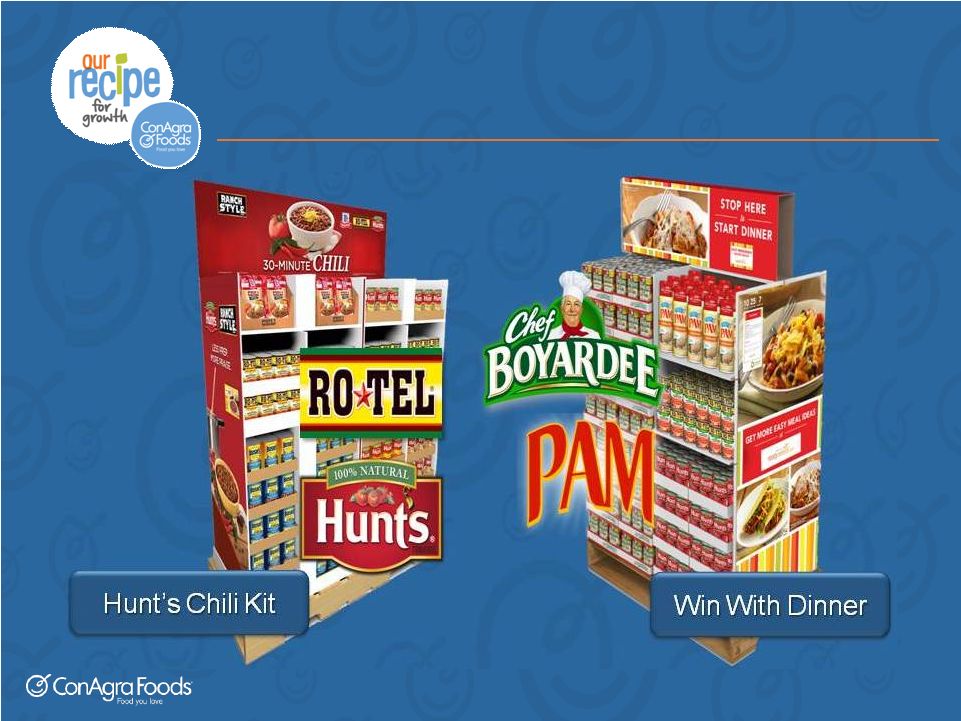 Promotion 29 |
 Focused improvement initiatives 30 |
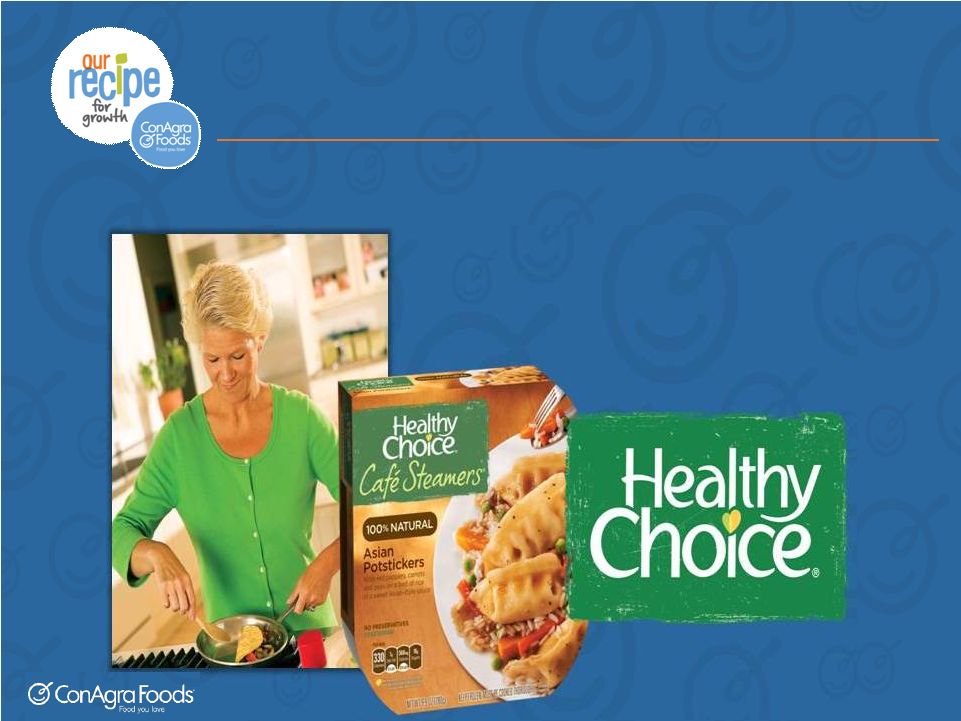 Healthy Choice Turnaround Transform by: • Focus on the core consumer • Leverage Café Steamers 31 |
 ConAgra Foods: moving forward • Progress on near-term issues in FY15 • Conviction in differentiating strategy • Confident in long-term goals |
 Feb. 18, 2014 CAGNY 2014 33 John Gehring Chief Financial Officer |
 CFO agenda • Financial priorities • Productivity • EPS outlook 34 |
 Financial priorities • Strong earnings and cash flows • Healthy balance sheet and strong liquidity • Capital allocation 35 — Debt repayment — Maintain strong dividend — Dividend growth, M&A, share repurchase — Debt repayment Near term Long term |
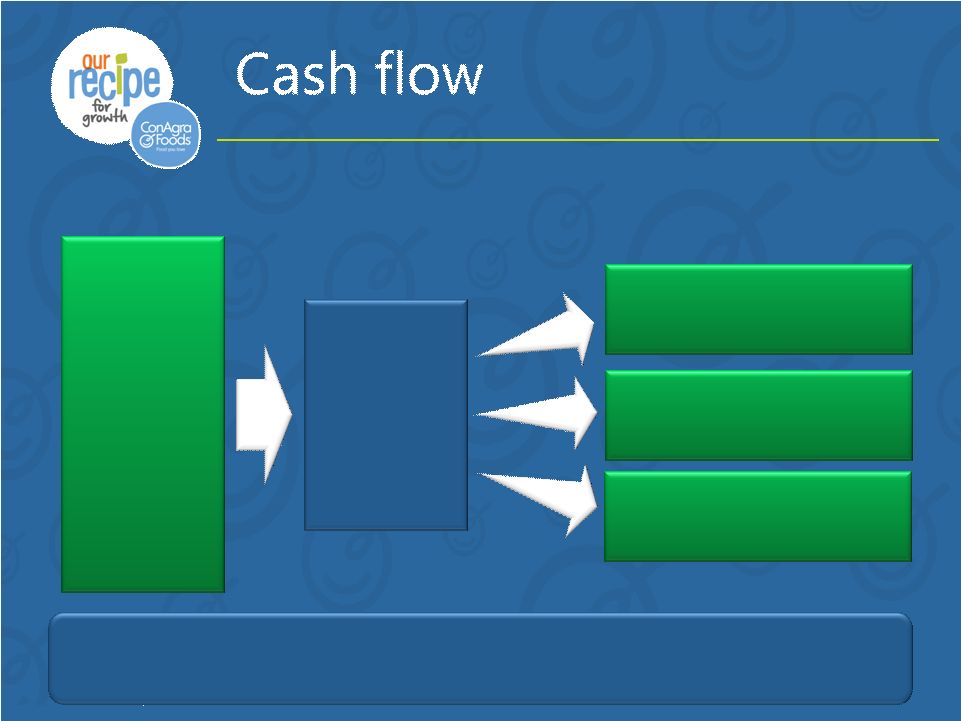
 Cash flow • Strong earnings drivers – Top-line fundamentals – Productivity – SG&A discipline • Working capital efficiency • Capital expenditure discipline 36 |
 37 Operating & free cash flow growth $1.5 billion of debt repayment by FYE 2015 Strong dividend Investment in growth & cost savings Earnings growth + Working capital efficiency + CAPEX discipline Estimated operating cash flow: FYE 2014 = $1.4 billion, FYE 2015 = $1.6+ billion |
 Healthy balance sheet and strong liquidity • Commitment to investment grade • Debt / EBITDA* Long-term target: < 3.0x • $1.5 billion by FY15 • Additional $400+ million (Ardent Mills proceeds) • $1.5 billion revolver • Manageable debt maturities 38 Balance sheet Debt repayment Liquidity *The inability to predict the amount and timing of future items makes a detailed reconciliation of projections impracticable. |
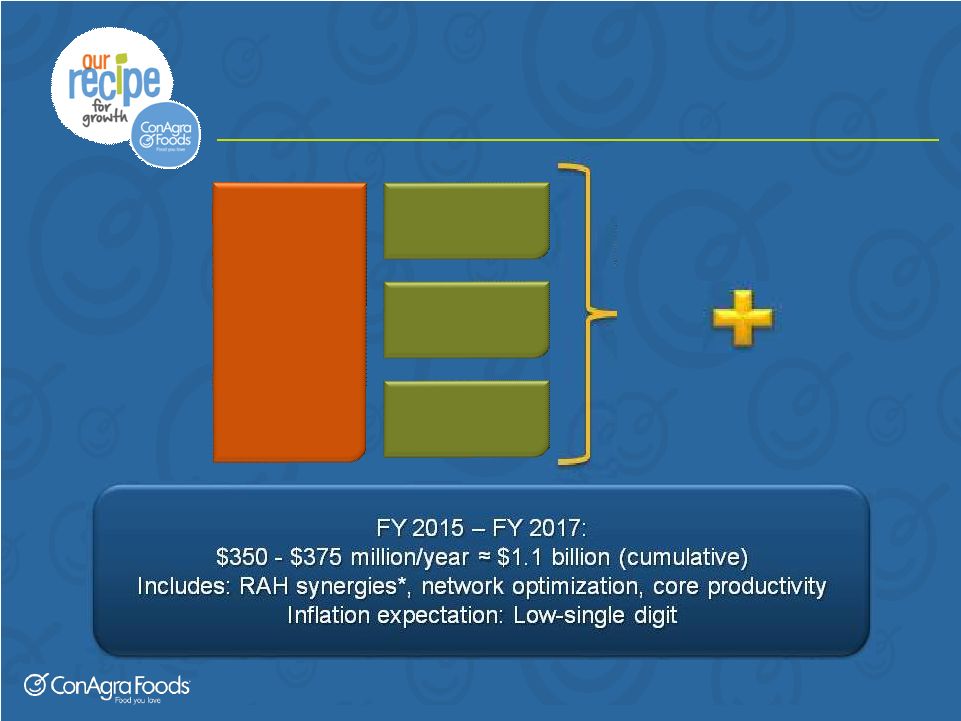 Productivity to fuel growth 39 Procurement Manufacturing Logistics Supply chain Base productivity Synergies *$300 million cumulative by the end of fiscal 2017. All numbers cited exclude items impacting comparability. The inability to predict the amount and timing of future items makes a detailed reconciliation of projections impracticable. |
 Supply Chain Opportunities – Scale – Collaborative sourcing – Design for preference and value – Commodity procurement and hedging – ConAgra Performance System – Reliability improvement – Zero-loss culture – Network optimization – Scale – Transportation sourcing – Single distribution network 40 Procurement Manufacturing Logistics |
 Incremental SG&A benefit Enabled by restructuring 41 Corporate overhead / SG&A Administrative efficiency Incremental $ from SG&A efficiency initiatives: $100+ million annual savings (run rate) by the end of FYE 2016 |
 Earnings Per Share (EPS*) • FY 2014: $2.22 to $2.25 per share* • Q3: approximately $0.60 per share* • Q4: approximately $0.65 per share* 42 *Diluted EPS, adjusted for items impacting comparability. The inability to predict the amount and timing of future items makes a detailed reconciliation of projections impracticable. |
 FY 2015 outlook - headlines Top line • Address specific brand challenges • Stabilize and grow private brands • Drive international growth in Lamb Weston Margin management • Low inflation • Strong productivity – base and synergies SG&A • Administrative cost efficiency Ardent Mills first-year dilution 43 EPS growth expected, more details with Q4 FYE 2014 release Major drivers |
 Long-term goals Annual EPS* growth = 10%+ Annual EPS* growth 7-9% 44 ROIC: targeting a low double digit ROIC in 3 years FY 2016 –17 After FY 2017 *Diluted EPS and ROIC guidance in this presentation assumes adjustment for items impacting comparability. The inability to predict the amount and timing of future items makes a detailed reconciliation of projections impracticable. Long-term annual sales growth target = 3 - 4% ~ ~ |
 |