CAGNY 2018 Exhibit 99.1
Forward-Looking Statements & Non-GAAP Measures Note on Forward-Looking Statements This document contains forward-looking statements within the meaning of the federal securities laws. These forward-looking statements are based on management's current expectations and are subject to uncertainty and changes in circumstances. Readers of this document should understand that these statements are not guarantees of performance or results. Many factors could affect our actual financial results and cause them to vary materially from the expectations contained in the forward-looking statements, including those set forth in this document. These risks and uncertainties include, among other things: the ability and timing to obtain required regulatory approvals and satisfy other closing conditions for the pending divestitures of our Wesson oil business and our Del Monte processed fruit and vegetable business in Canada; our ability to achieve the intended benefits of recent and pending acquisitions and divestitures, including the recent spin-off of our Lamb Weston business; general economic and industry conditions; our ability to successfully execute our long-term value creation strategy; our ability to access capital; our ability to execute our operating and restructuring plans and achieve our targeted operating efficiencies from cost-saving initiatives and to benefit from trade optimization programs; the effectiveness of our hedging activities, and our ability to respond to volatility in commodities; the competitive environment and related market conditions; our ability to respond to changing consumer preferences and the success of our innovation and marketing investments; the ultimate impact of any product recalls and litigation, including litigation related to the lead paint and pigment matters; actions of governments and regulatory factors affecting our businesses, including the ultimate impact of recently enacted U.S tax legislation and related regulations or interpretations; the availability and prices of raw materials, including any negative effects caused by inflation or weather conditions; risks and uncertainties associated with intangible assets, including any future goodwill or intangible assets impairment charges; the costs, disruption, and diversion of management's attention associated with campaigns commenced by activist investors; and other risks described in our reports filed from time to time with the Securities and Exchange Commission. We caution readers not to place undue reliance on any forward-looking statements included in this document, which speak only as of the date of this document. We undertake no responsibility to update these statements. Note on Non-GAAP Financial Measures This document includes certain non-GAAP financial measures. Management considers GAAP financial measures as well as such non-GAAP financial information in its evaluation of the Company’s financial statements and believes these non-GAAP measures provide useful supplemental information to assess the Company’s operating performance and financial position. These measures should be viewed in addition to, and not in lieu of, the Company’s diluted earnings per share, operating performance and financial measures as calculated in accordance with GAAP.
What We Want You to Take Away From Today New company with significant potential On track with transformation plan Key to success: focus, discipline, capabilities, and culture Modernizing iconic brands is at the center of what we do Compelling investment opportunity 1 2 3 4 5
Compelling Investment Opportunity Dynamic sector with latent value creation opportunities Diverse, inherently-hedged portfolio with leading iconic brands Aggressive, efficient, and agile leadership team Long-term growth and profitability will be achieved via strong innovation, execution, and M&A Disciplined balance sheet management and strong cash flow provide opportunities to return capital to shareholders
WHO WE ARE 1. WHAT WE HAVE DONE 2. HOW WE CREATE VALUE FROM HERE 3.
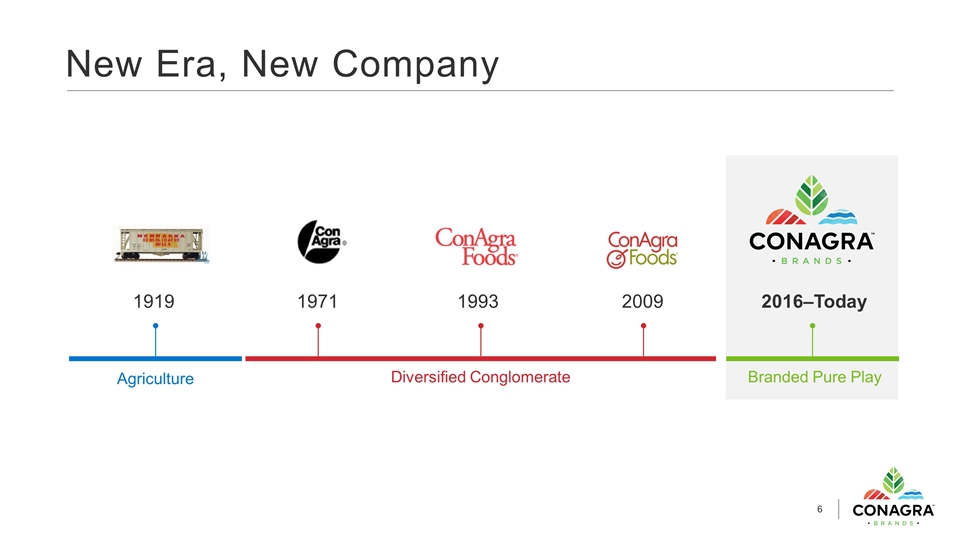
New Era, New Company 1919 1971 Diversified Conglomerate Agriculture Branded Pure Play 1993 2009 2016–Today
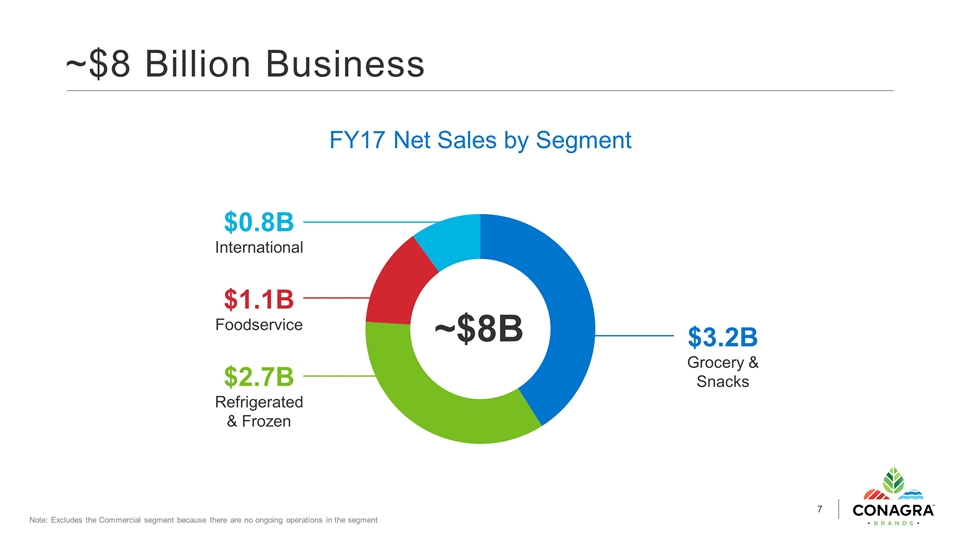
~$8 Billion Business $3.2B Grocery & Snacks $2.7B Refrigerated & Frozen $0.8B International $1.1B Foodservice FY17 Net Sales by Segment Note: Excludes the Commercial segment because there are no ongoing operations in the segment ~$8B
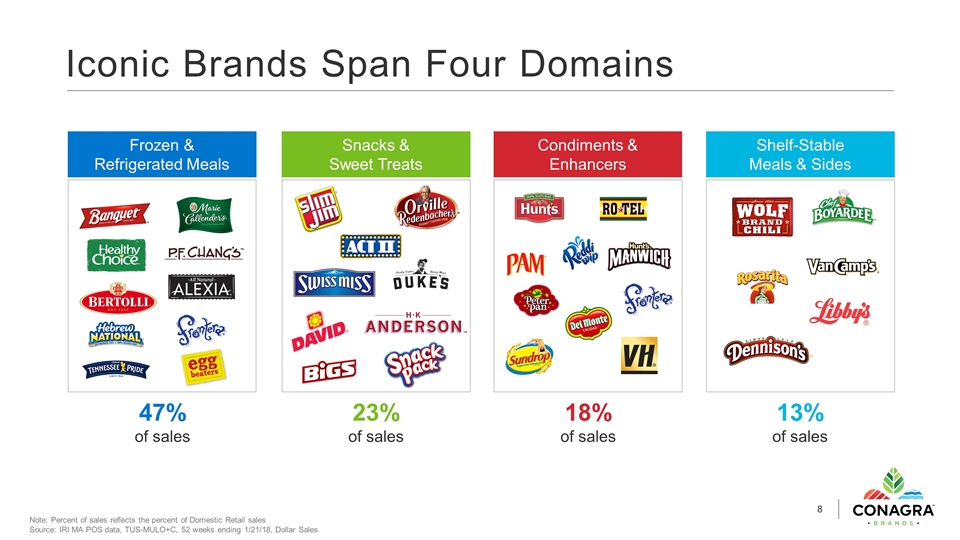
Iconic Brands Span Four Domains Frozen & Refrigerated Meals 47% of sales Snacks & Sweet Treats 23% of sales Condiments & Enhancers 18% of sales Shelf-Stable Meals & Sides 13% of sales Note: Percent of sales reflects the percent of Domestic Retail sales Source: IRI MA POS data, TUS-MULO+C, 52 weeks ending 1/21/18, Dollar Sales
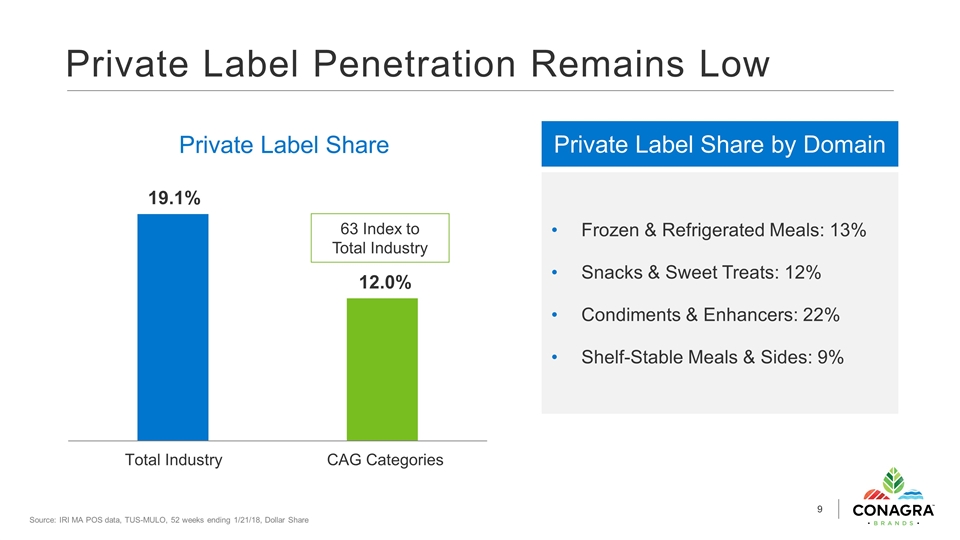
Private Label Penetration Remains Low Source: IRI MA POS data, TUS-MULO, 52 weeks ending 1/21/18, Dollar Share Private Label Share Total Industry CAG Categories 63 Index to Total Industry Private Label Share by Domain Frozen & Refrigerated Meals: 13% Snacks & Sweet Treats: 12% Condiments & Enhancers: 22% Shelf-Stable Meals & Sides: 9%
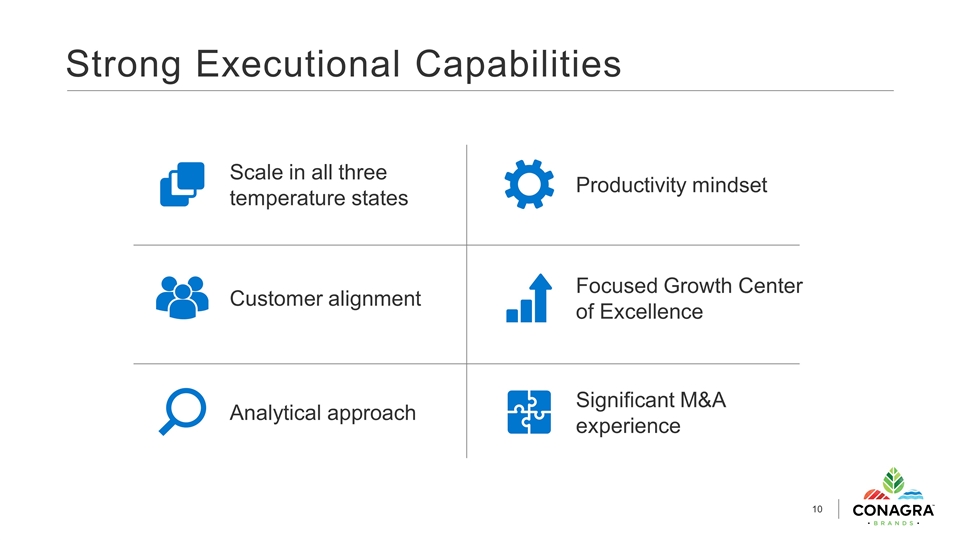
Strong Executional Capabilities Scale in all three temperature states Productivity mindset Customer alignment Focused Growth Center of Excellence Analytical approach Significant M&A experience
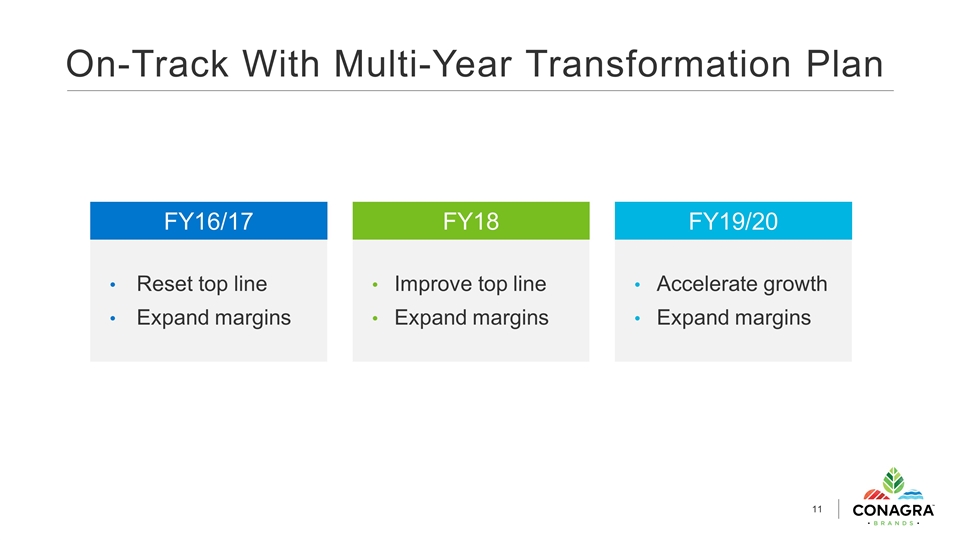
On-Track With Multi-Year Transformation Plan Reset top line Expand margins FY16/17 Improve top line Expand margins FY18 Accelerate growth Expand margins FY19/20

WHO WE ARE 1. WHAT WE HAVE DONE 2. HOW WE CREATE VALUE FROM HERE 3.
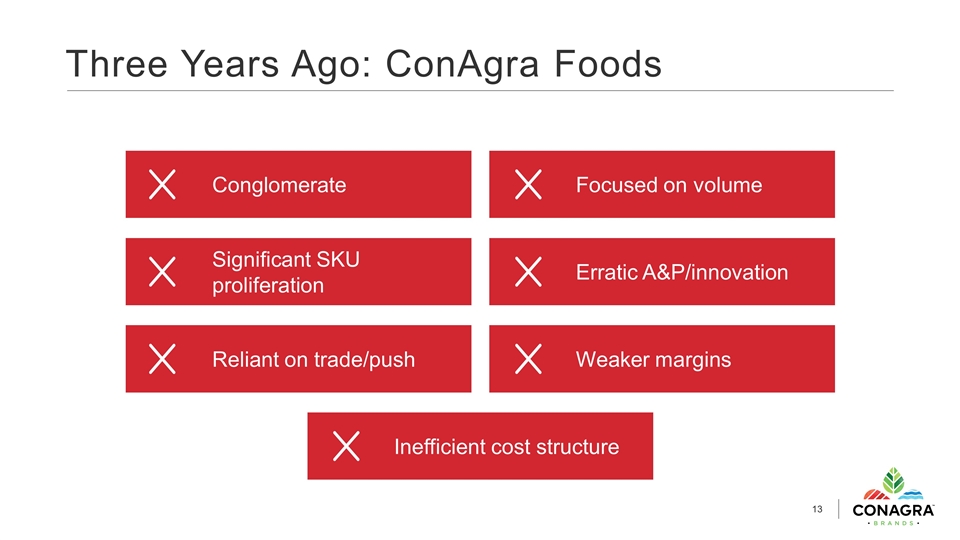
Three Years Ago: ConAgra Foods Conglomerate Focused on volume Significant SKU proliferation Erratic A&P/innovation Inefficient cost structure Reliant on trade/push Weaker margins
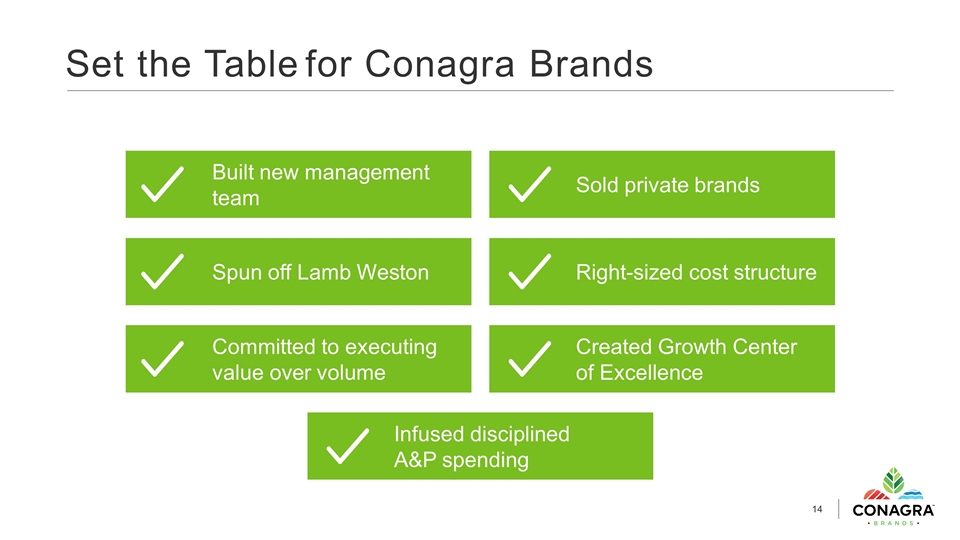
Set the Tablefor Conagra Brands Built new management team Sold private brands Spun off Lamb Weston Right-sized cost structure Infused disciplined A&P spending Committed to executing value over volume Created Growth Center of Excellence
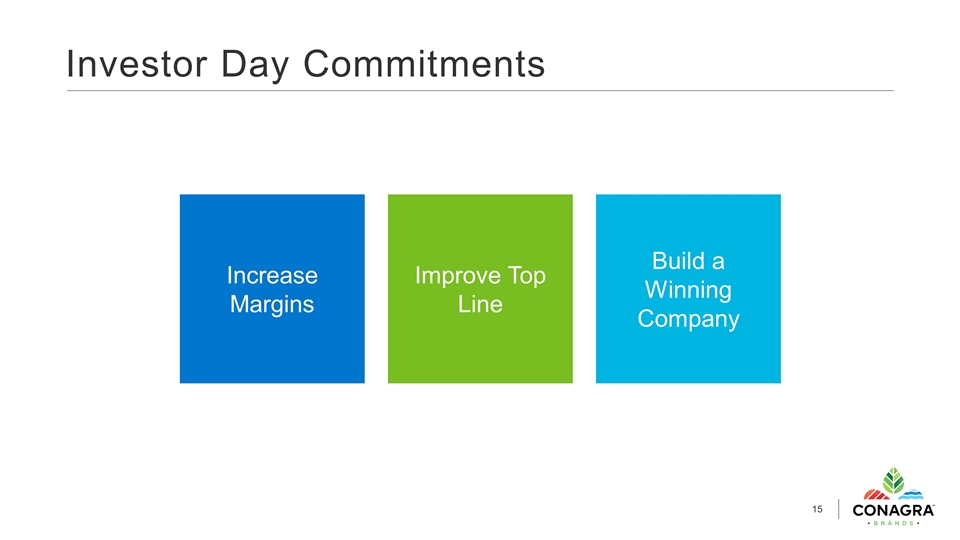
Investor Day Commitments Increase Margins Improve Top Line Build a Winning Company
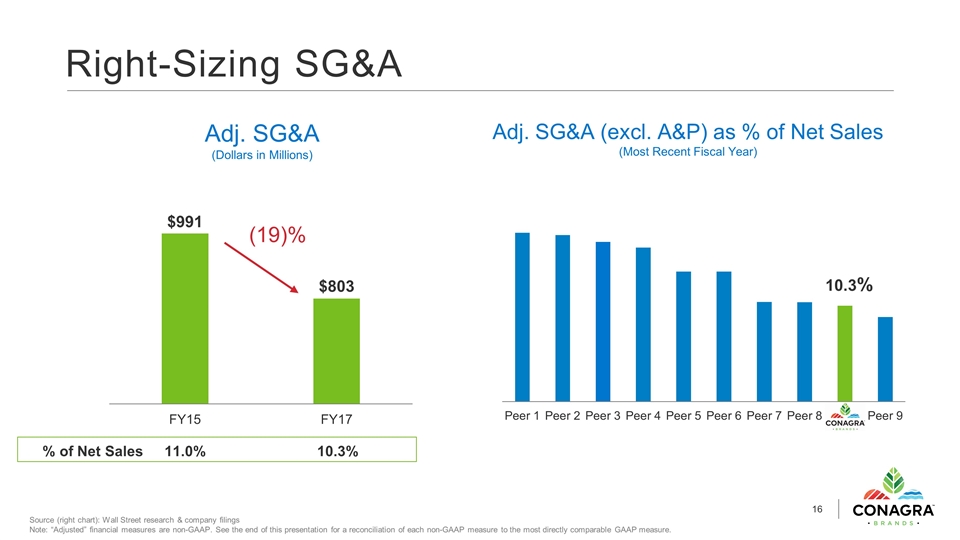
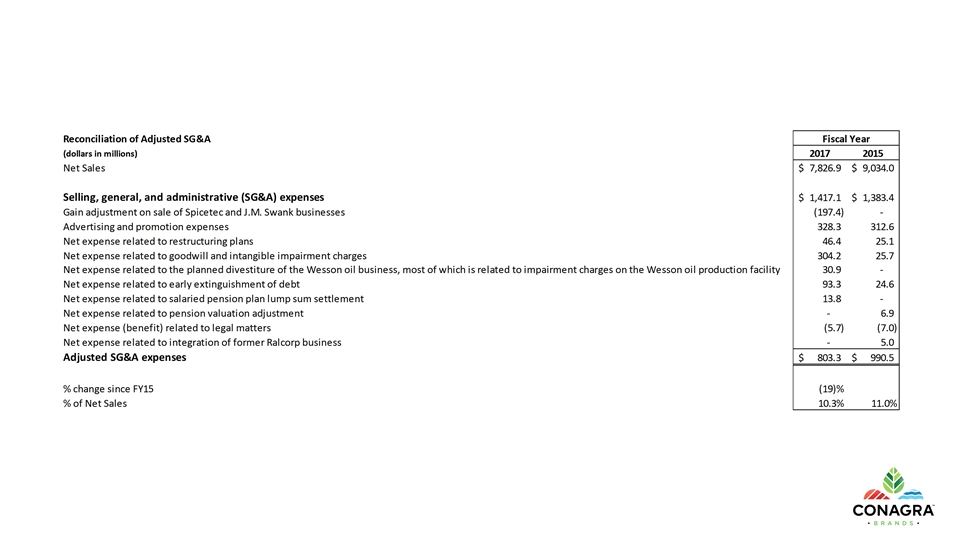
(19)% % of Net Sales 11.0% 10.3% Source (right chart): Wall Street research & company filings Note: “Adjusted” financial measures are non-GAAP. See the end of this presentation for a reconciliation of each non-GAAP measure to the most directly comparable GAAP measure. Right-Sizing SG&A Adj. SG&A (Dollars in Millions) Adj. SG&A (excl. A&P) as % of Net Sales (Most Recent Fiscal Year)
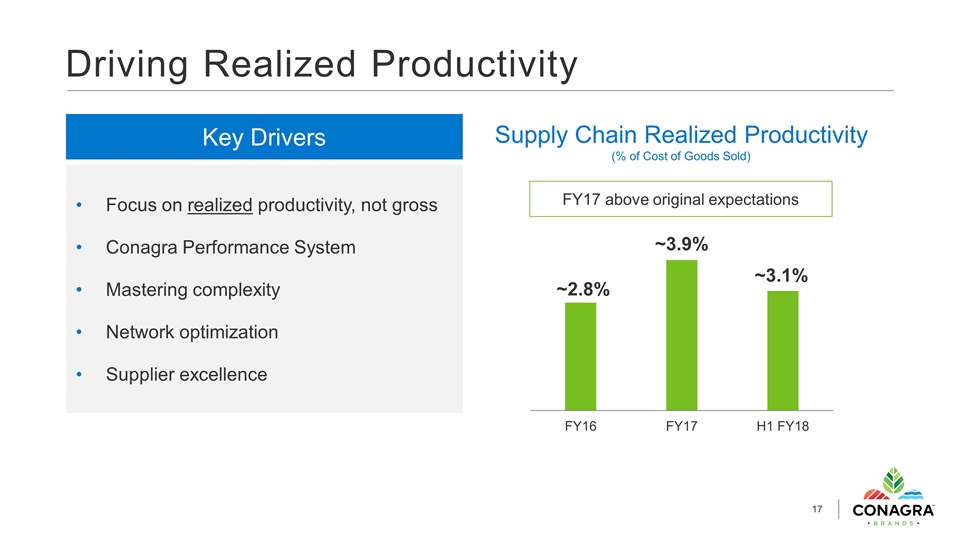
FY17 above original expectations Driving Realized Productivity Supply Chain Realized Productivity (% of Cost of Goods Sold) Key Drivers Focus on realized productivity, not gross Conagra Performance System Mastering complexity Network optimization Supplier excellence
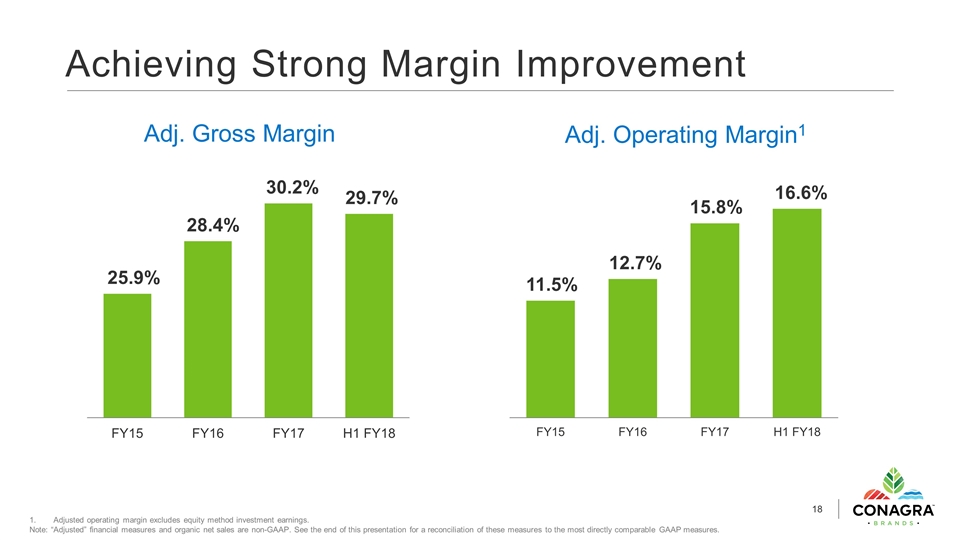
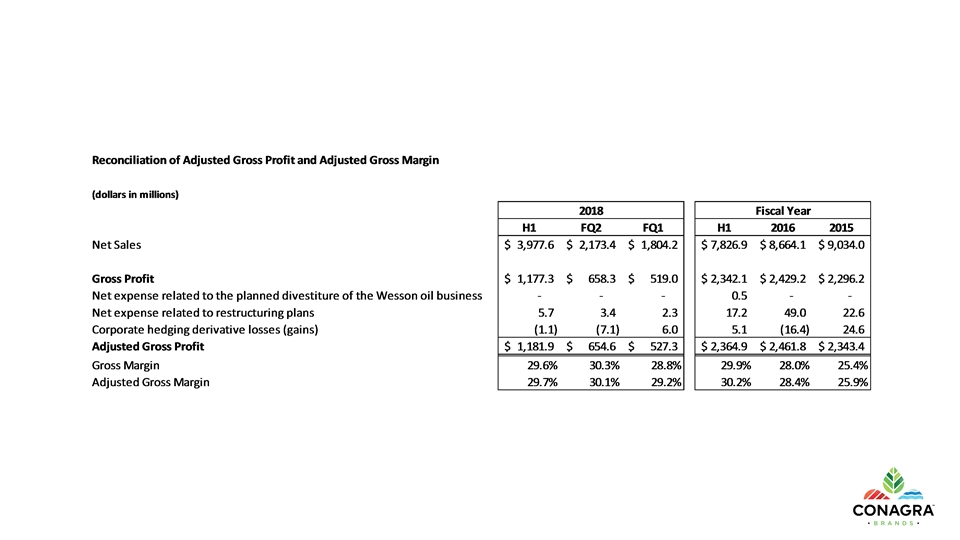
Achieving Strong Margin Improvement Adjusted operating margin excludes equity method investment earnings. Note: “Adjusted” financial measures and organic net sales are non-GAAP. See the end of this presentation for a reconciliation of these measures to the most directly comparable GAAP measures. Adj. Gross Margin Adj. Operating Margin1
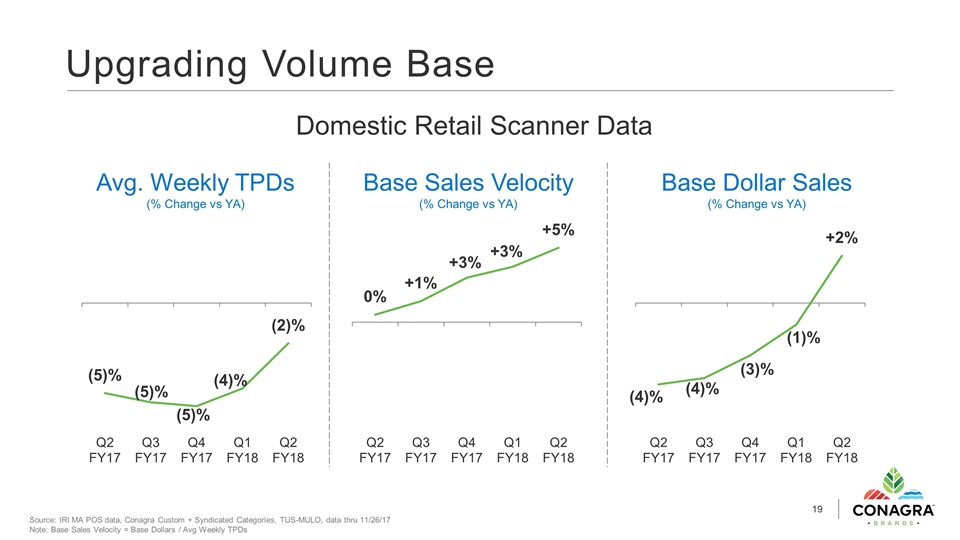
Source: IRI MA POS data, Conagra Custom + Syndicated Categories, TUS-MULO, data thru 11/26/17 Note: Base Sales Velocity = Base Dollars / Avg Weekly TPDs Upgrading Volume Base Domestic Retail Scanner Data Avg. Weekly TPDs (% Change vs YA) Base Sales Velocity (% Change vs YA) Base Dollar Sales (% Change vs YA)
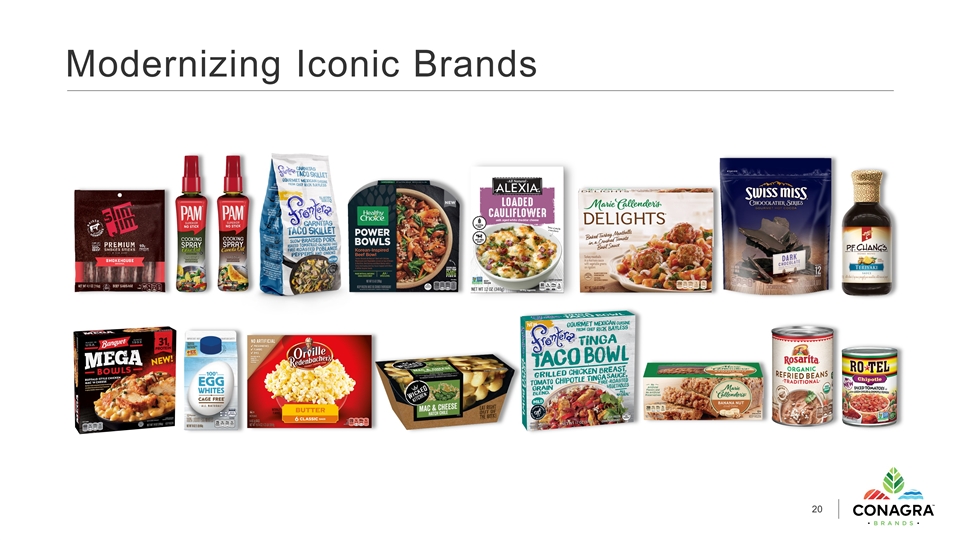
Modernizing Iconic Brands
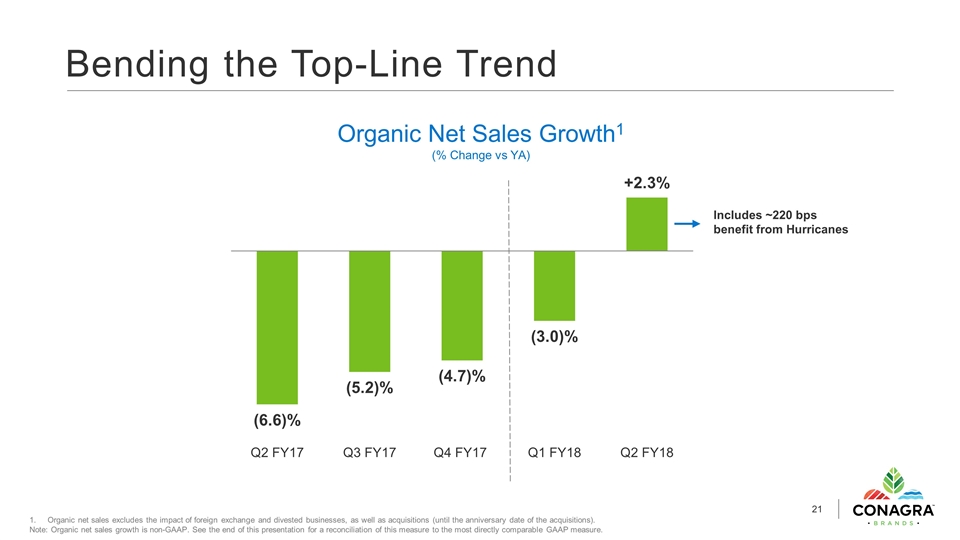
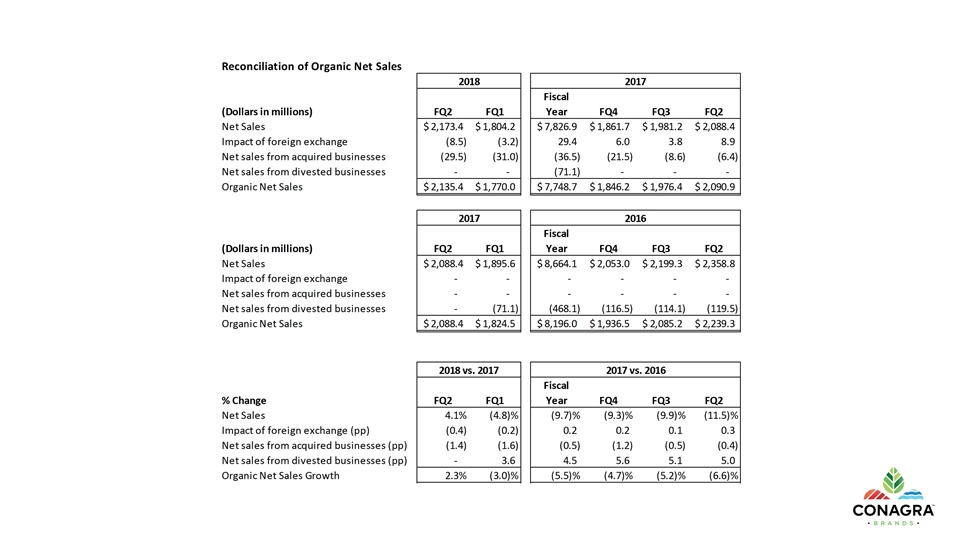
Bending the Top-Line Trend Includes ~220 bps benefit from Hurricanes Organic Net Sales Growth1 (% Change vs YA) Organic net sales excludes the impact of foreign exchange and divested businesses, as well as acquisitions (until the anniversary date of the acquisitions). Note: Organic net sales growth is non-GAAP. See the end of this presentation for a reconciliation of this measure to the most directly comparable GAAP measure.
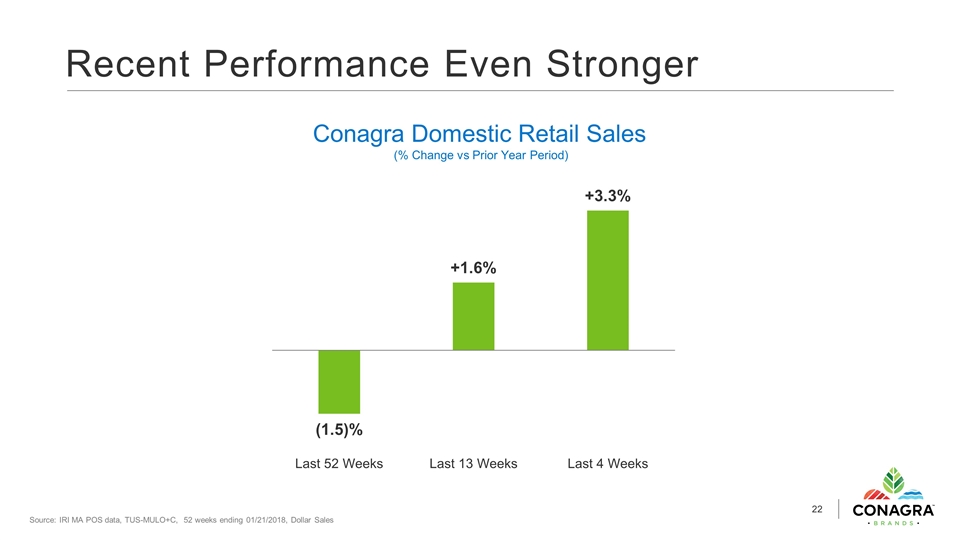
Recent Performance Even Stronger Conagra Domestic Retail Sales (% Change vs Prior Year Period) Source: IRI MA POS data, TUS-MULO+C, 52 weeks ending 01/21/2018, Dollar Sales
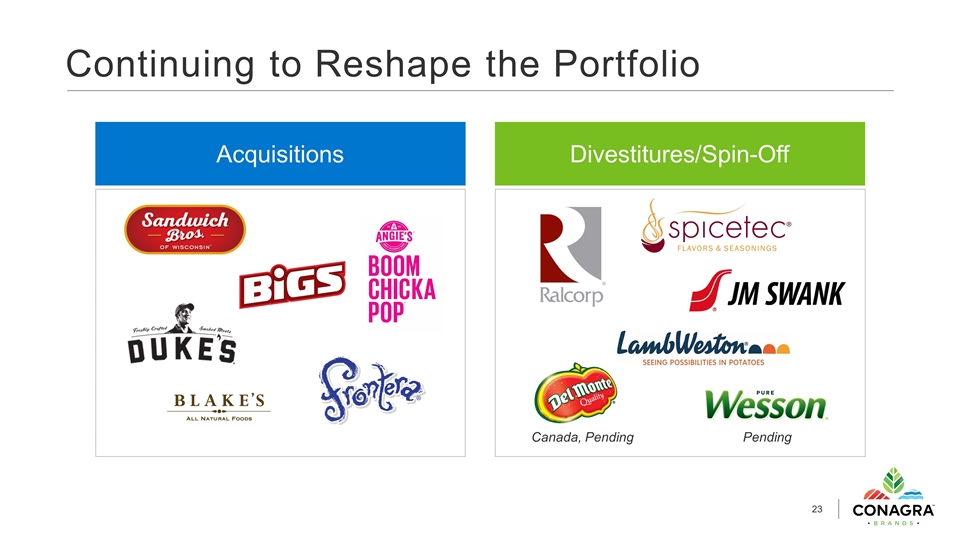
Continuing to Reshape the Portfolio Acquisitions Divestitures/Spin-Off Pending Canada, Pending
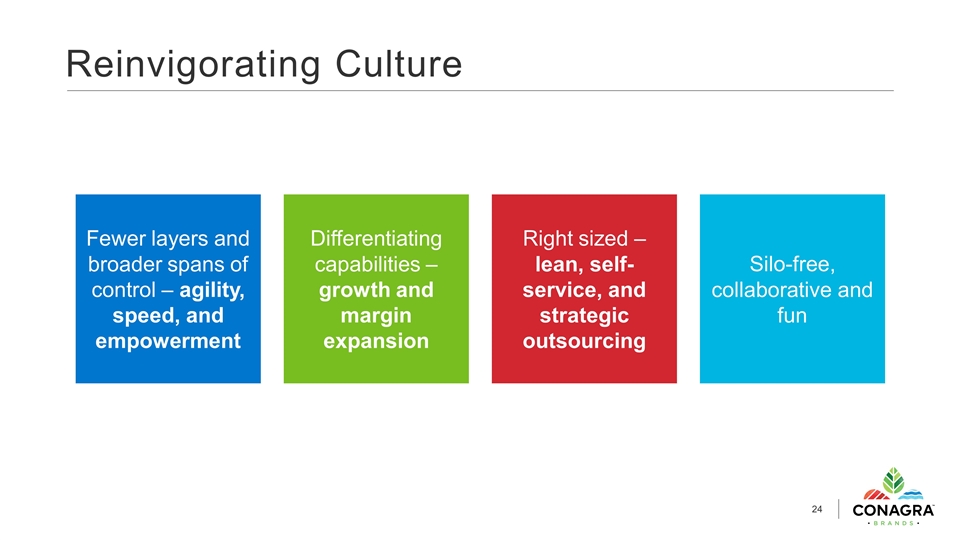
Reinvigorating Culture Fewer layers and broader spans of control – agility, speed, and empowerment Differentiating capabilities – growth and margin expansion Right sized – lean, self-service, and strategic outsourcing Silo-free, collaborative and fun

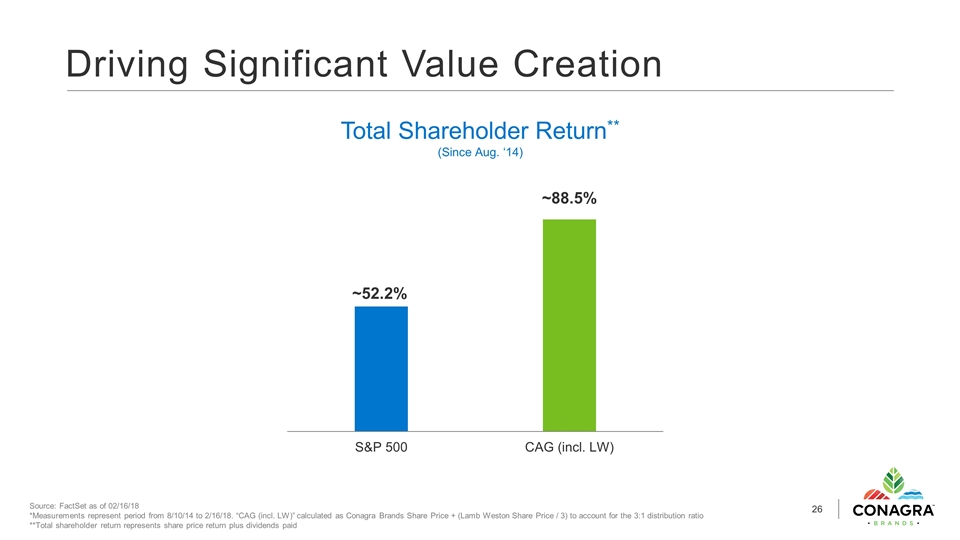
Driving Significant Value Creation Source: FactSet as of 02/16/18 *Measurements represent period from 8/10/14 to 2/16/18. “CAG (incl. LW)” calculated as Conagra Brands Share Price + (Lamb Weston Share Price / 3) to account for the 3:1 distribution ratio **Total shareholder return represents share price return plus dividends paid Total Shareholder Return** (Since Aug. ‘14)
WHO WE ARE 1. WHAT WE HAVE DONE 2. HOW WE CREATE VALUE FROM HERE 3.
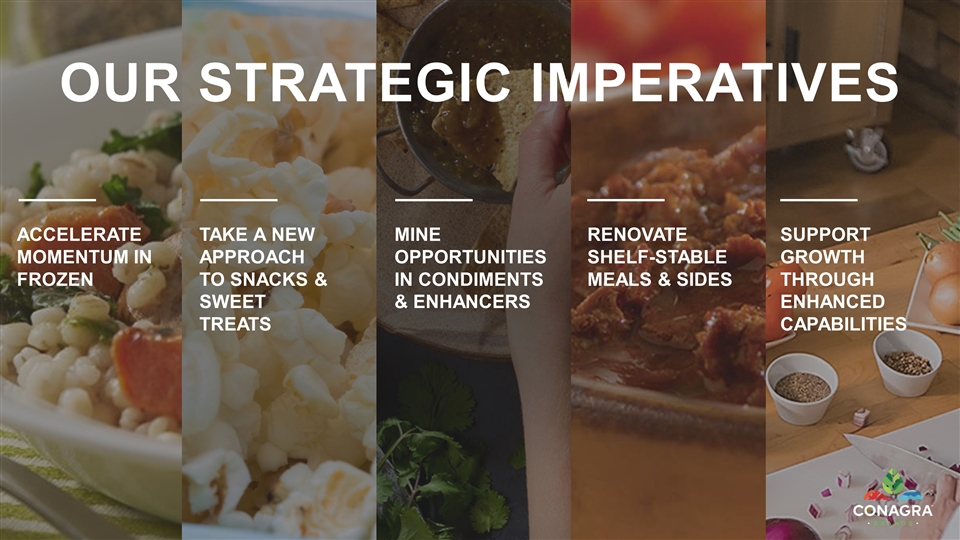
ACCELERATE MOMENTUM IN FROZEN TAKE A NEW APPROACH TO SNACKS & SWEET TREATS MINE OPPORTUNITIES IN CONDIMENTS & ENHANCERS RENOVATE SHELF-STABLE MEALS & SIDES SUPPORT GROWTH THROUGH ENHANCED CAPABILITIES OUR STRATEGIC IMPERATIVES
Significant Opportunity in Frozen Large space poised to capture long-term tailwinds Stronger velocities enable large, modernized brands to outperform smaller brands We are well-positioned with a scaled business of authentic brands across dayparts and need states Significant opportunity for expansion and growth
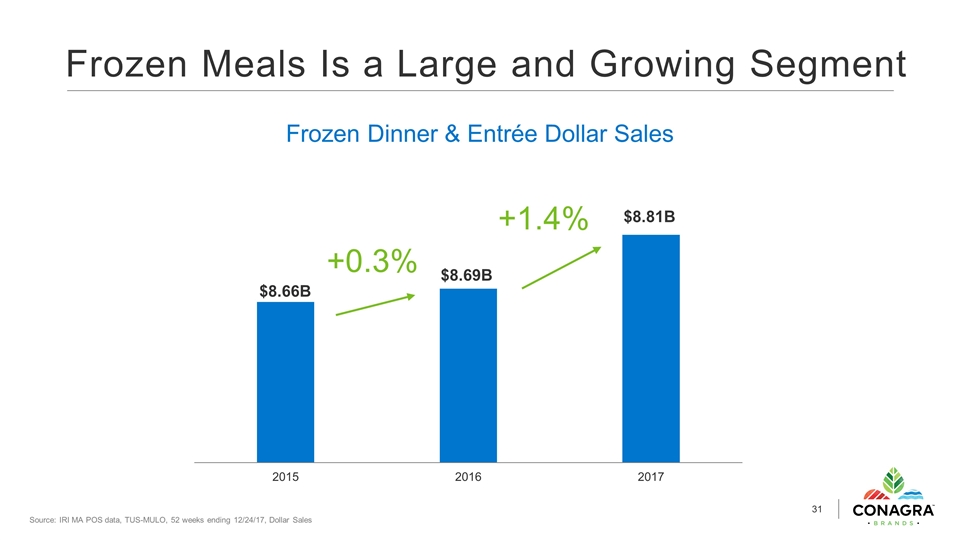
Frozen Meals Is a Large and Growing Segment $8.66B $8.69B $8.81B Source: IRI MA POS data, TUS-MULO, 52 weeks ending 12/24/17, Dollar Sales +1.4% +0.3% Frozen Dinner & Entrée Dollar Sales
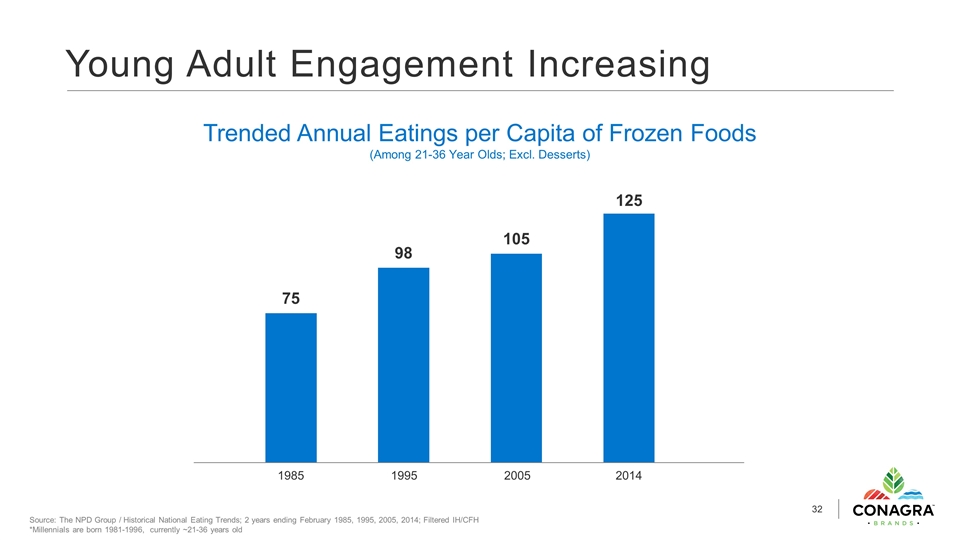
Young Adult Engagement Increasing Source: The NPD Group / Historical National Eating Trends; 2 years ending February 1985, 1995, 2005, 2014; Filtered IH/CFH *Millennials are born 1981-1996, currently ~21-36 years old Trended Annual Eatings per Capita of Frozen Foods (Among 21-36 Year Olds; Excl. Desserts) 1985 1995 2005 2014
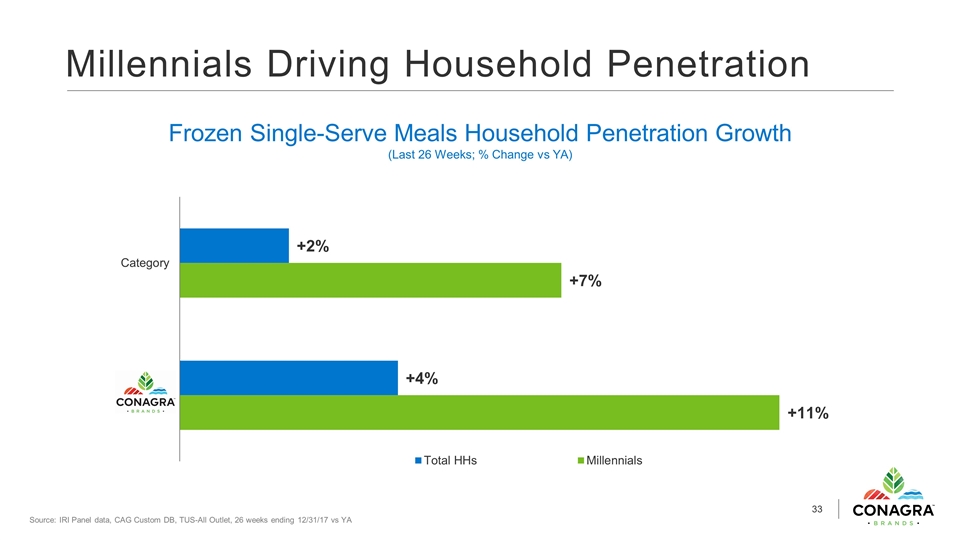
Millennials Driving Household Penetration Source: IRI Panel data, CAG Custom DB, TUS-All Outlet, 26 weeks ending 12/31/17 vs YA Frozen Single-Serve Meals Household Penetration Growth (Last 26 Weeks; % Change vs YA)
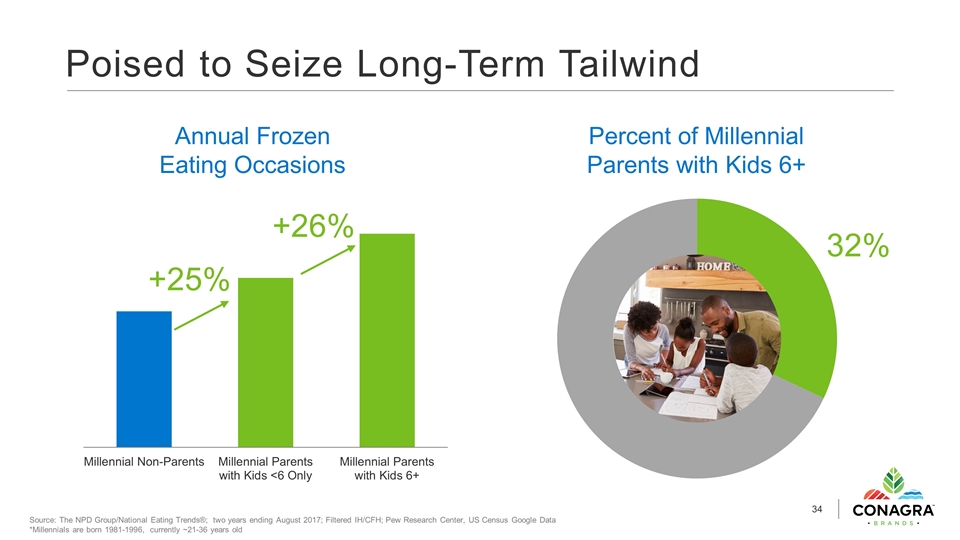
Poised to Seize Long-Term Tailwind Source: The NPD Group/National Eating Trends®; two years ending August 2017; Filtered IH/CFH; Pew Research Center, US Census Google Data *Millennials are born 1981-1996, currently ~21-36 years old Percent of Millennial Parents with Kids 6+ Annual Frozen Eating Occasions 32% +26% +25%
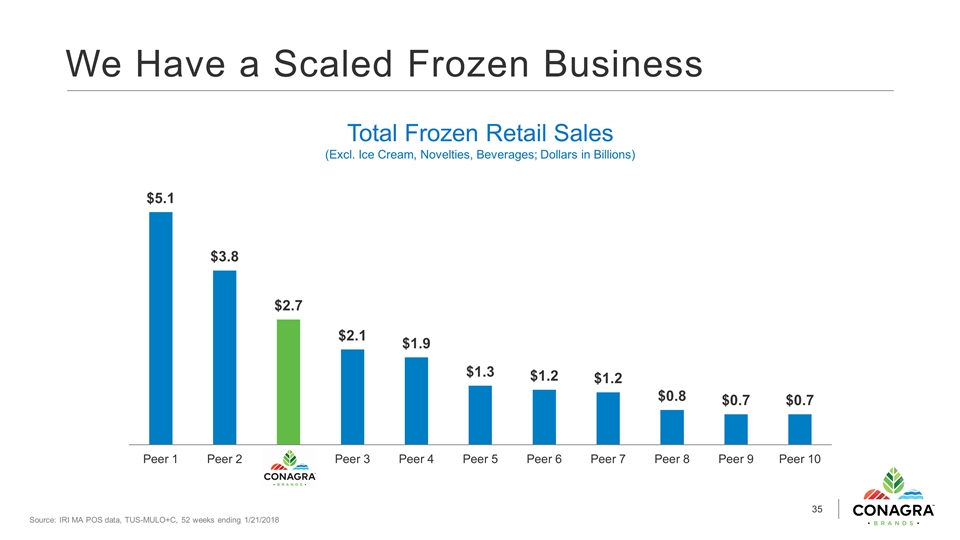
We Have a Scaled Frozen Business Source: IRI MA POS data, TUS-MULO+C, 52 weeks ending 1/21/2018 Total Frozen Retail Sales (Excl. Ice Cream, Novelties, Beverages; Dollars in Billions)
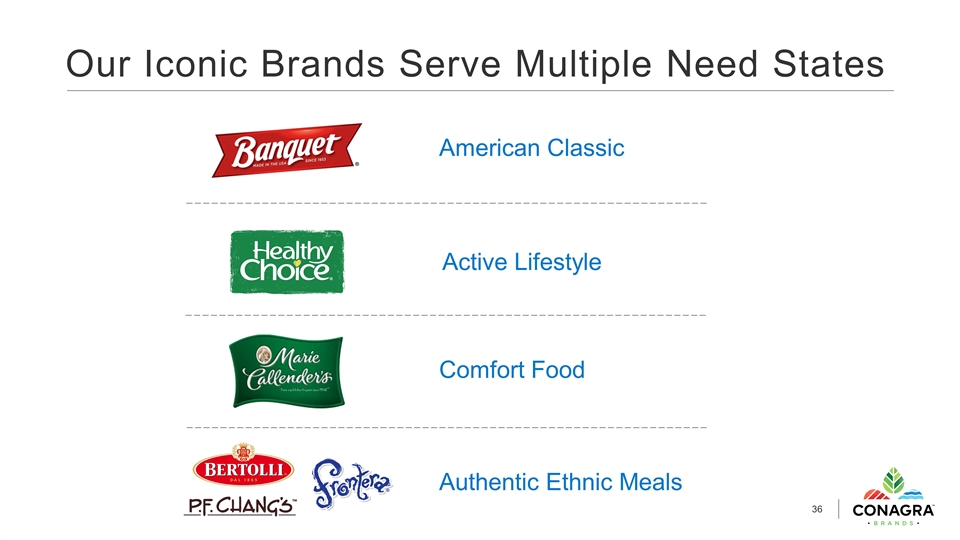
Our Iconic Brands Serve Multiple Need States Active Lifestyle Comfort Food Authentic Ethnic Meals American Classic
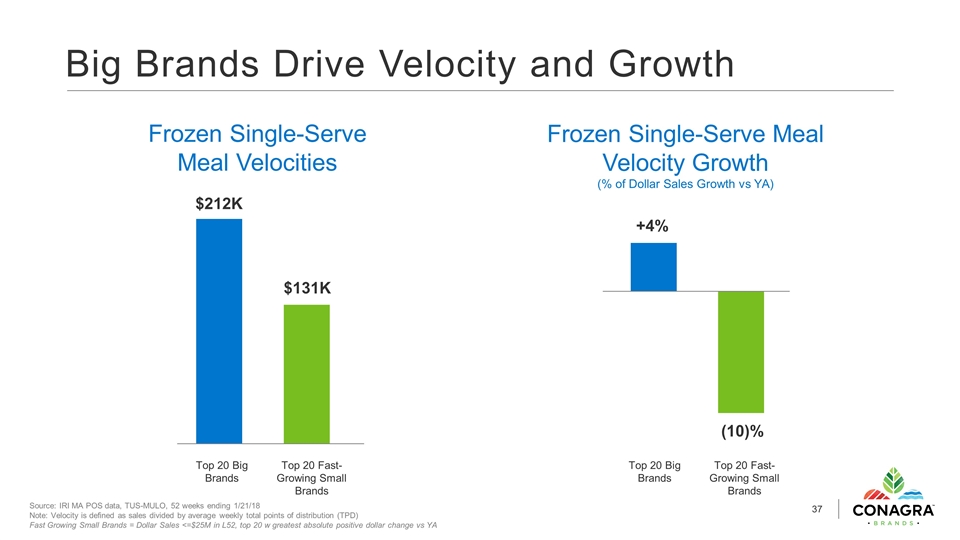
Big Brands Drive Velocity and Growth Source: IRI MA POS data, TUS-MULO, 52 weeks ending 1/21/18 Note: Velocity is defined as sales divided by average weekly total points of distribution (TPD) Fast Growing Small Brands = Dollar Sales <=$25M in L52, top 20 w greatest absolute positive dollar change vs YA +4% (10)% Frozen Single-Serve Meal Velocity Growth (% of Dollar Sales Growth vs YA) Frozen Single-Serve Meal Velocities $212K $131K Top 20 Big Brands Top 20 Fast-Growing Small Brands Top 20 Big Brands Top 20 Fast-Growing Small Brands

Our Brands Are Leaders in Velocity and Velocity Growth Source: IRI MA POS data, CAG Custom DB, TUS-MULO, 26 weeks ending 1/21/18 Brands Shown Are Top 10 Dollar Sales Note: Velocity is defined as sales divided by average weekly total points of distribution (TPD) Frozen Single-Serve Meal Velocities Frozen Single-Serve Meal Velocity Growth (% of Dollar Sales Growth vs YA) Brand 1 Brand 2 Brand 3 Brand 4 Brand 5 Brand 6 Brand 7 Brand 1 Brand 2 Brand 3 Brand 4 Brand 5 Brand 6 Brand 7
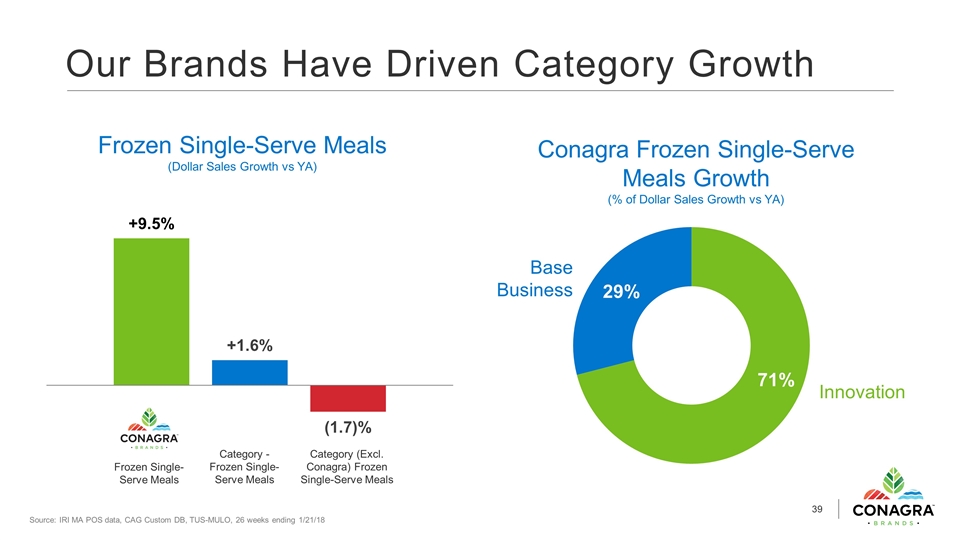
Our Brands Have Driven Category Growth Source: IRI MA POS data, CAG Custom DB, TUS-MULO, 26 weeks ending 1/21/18 Base Business Innovation Frozen Single-Serve Meals Category - Frozen Single-Serve Meals Category (Excl. Conagra) Frozen Single-Serve Meals Frozen Single-Serve Meals (Dollar Sales Growth vs YA) Conagra Frozen Single-Serve Meals Growth (% of Dollar Sales Growth vs YA)

Innovation Driving Improved Pricing Source: IRI MA POS data, CAG Custom DB, TUS-MULO, 26 weeks ending 1/21/18 Conagra Price Growth Drivers (Frozen Single-Serve Meals) Trade Efficiency/ Price Increase Premiumization Through Innovation Percent of Price Growth Average Price/Unit (Growth vs YA) +4.4 %
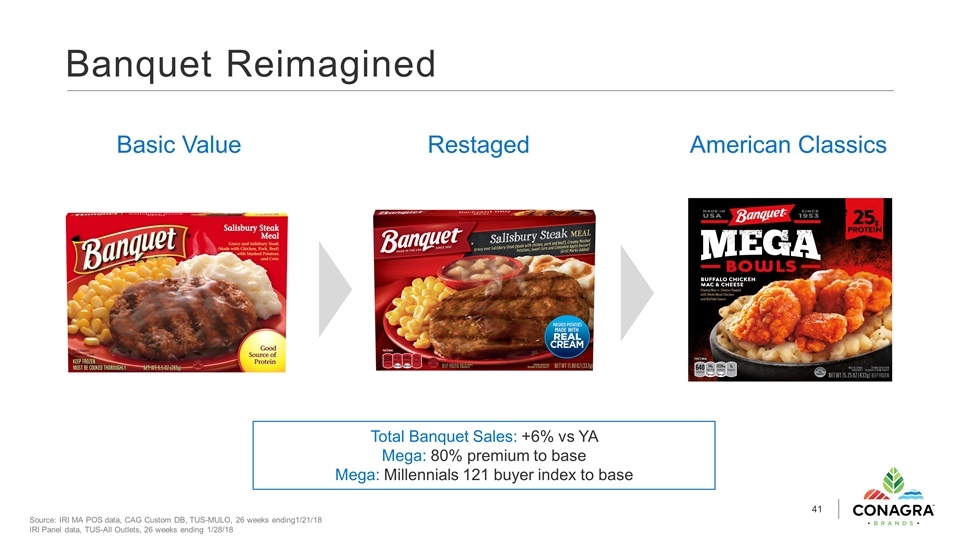
Banquet Reimagined Basic Value Restaged American Classics Total Banquet Sales: +6% vs YA Mega: 80% premium to base Mega: Millennials 121 buyer index to base Source: IRI MA POS data, CAG Custom DB, TUS-MULO, 26 weeks ending1/21/18 IRI Panel data, TUS-All Outlets, 26 weeks ending 1/28/18
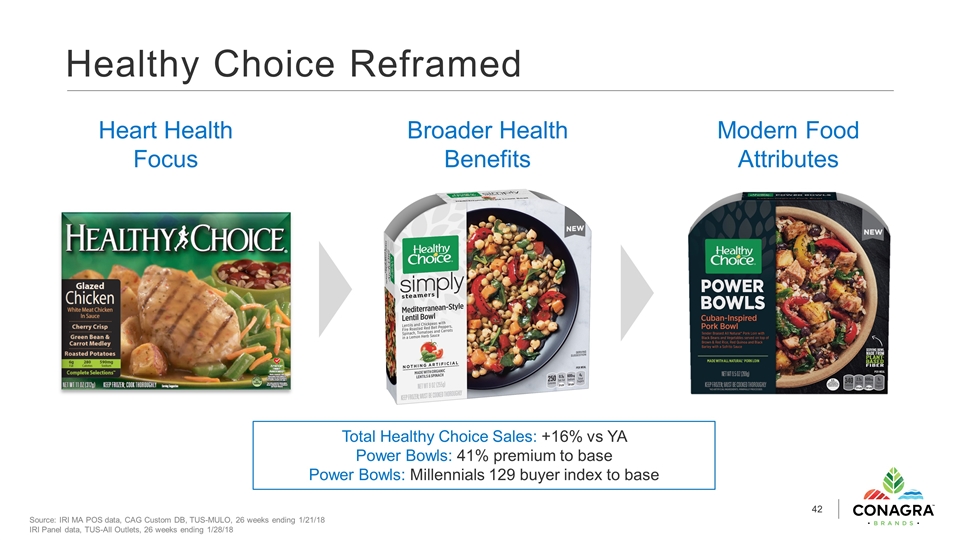
Healthy Choice Reframed Heart Health Focus Broader Health Benefits Modern Food Attributes Source: IRI MA POS data, CAG Custom DB, TUS-MULO, 26 weeks ending 1/21/18 IRI Panel data, TUS-All Outlets, 26 weeks ending 1/28/18 Total Healthy Choice Sales: +16% vs YA Power Bowls: 41% premium to base Power Bowls: Millennials 129 buyer index to base
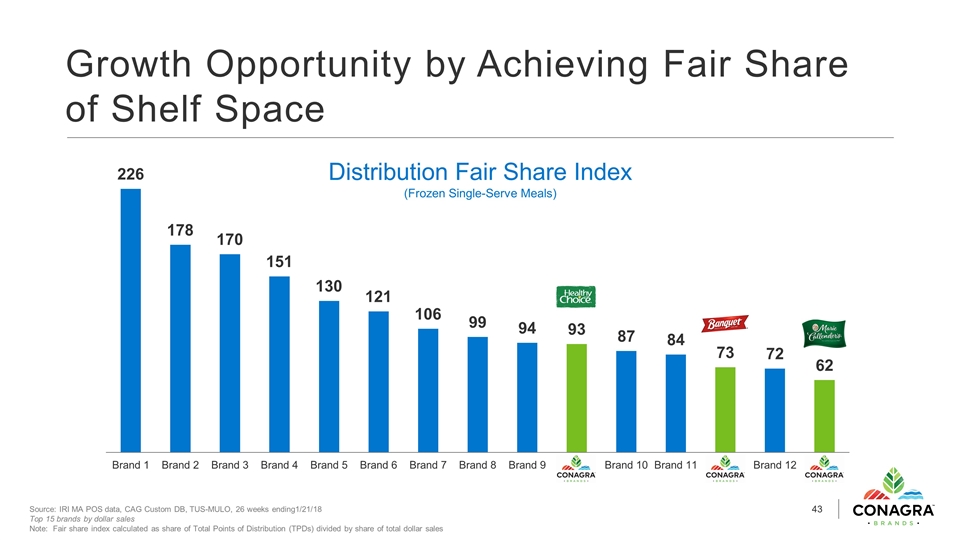
Growth Opportunity by Achieving Fair Share of Shelf Space Source: IRI MA POS data, CAG Custom DB, TUS-MULO, 26 weeks ending1/21/18 Top 15 brands by dollar sales Note: Fair share index calculated as share of Total Points of Distribution (TPDs) divided by share of total dollar sales Distribution Fair Share Index (Frozen Single-Serve Meals)
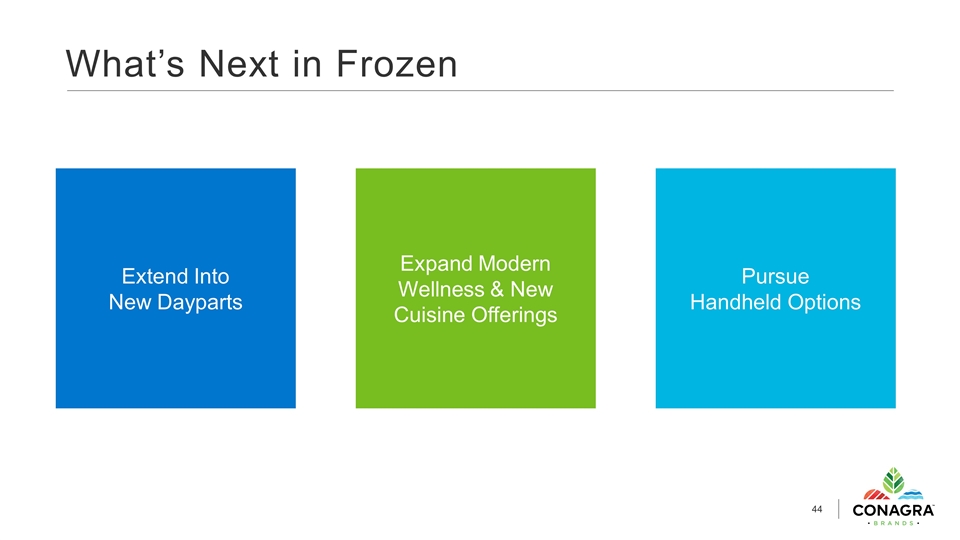
What’s Next in Frozen Extend Into New Dayparts Expand Modern Wellness & New Cuisine Offerings Pursue Handheld Options
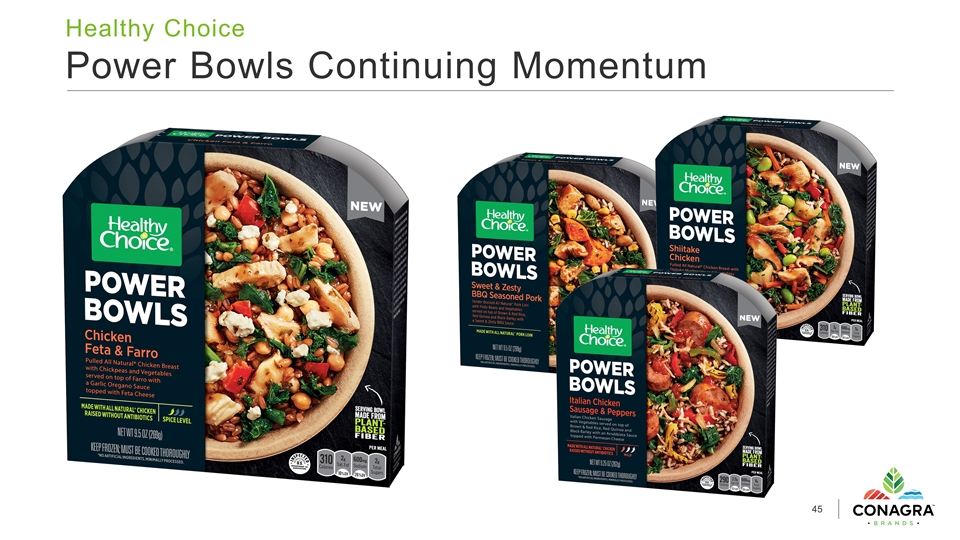
Healthy Choice Power Bowls Continuing Momentum
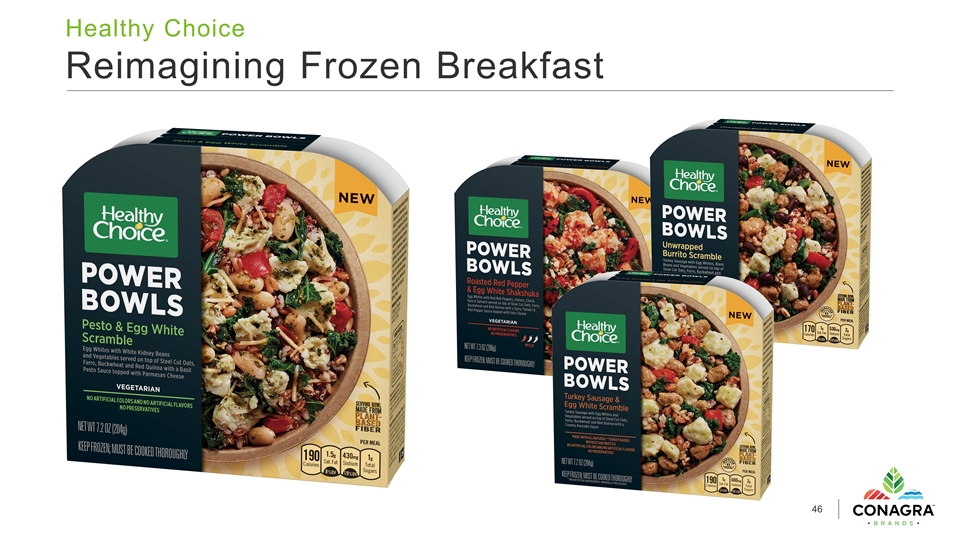
Healthy Choice Reimagining Frozen Breakfast
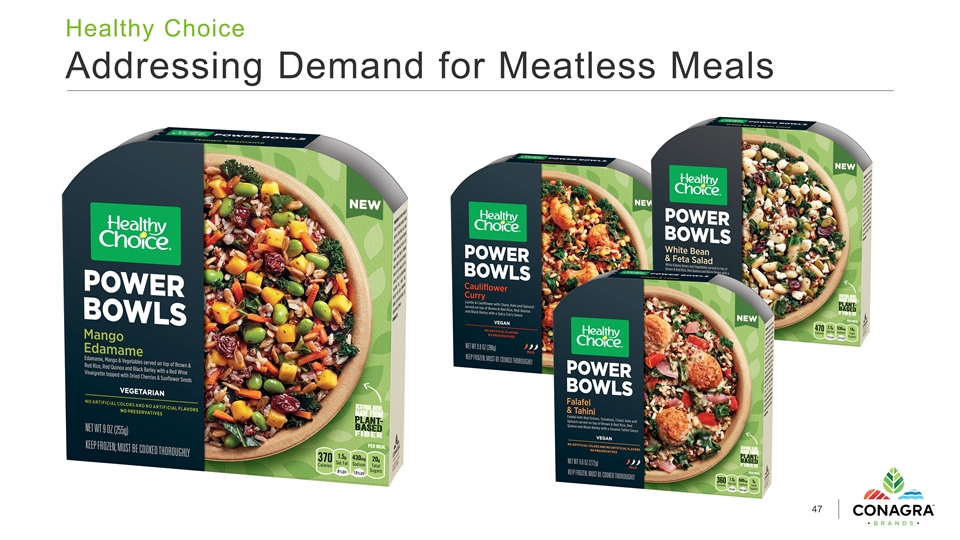
Healthy Choice Addressing Demand for Meatless Meals
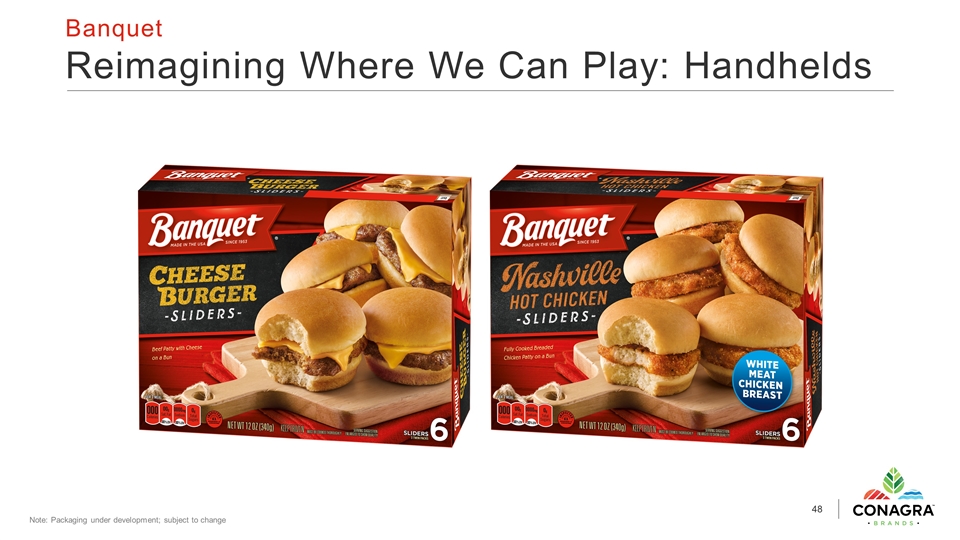
Banquet Reimagining Where We Can Play: Handhelds Note: Packaging under development; subject to change
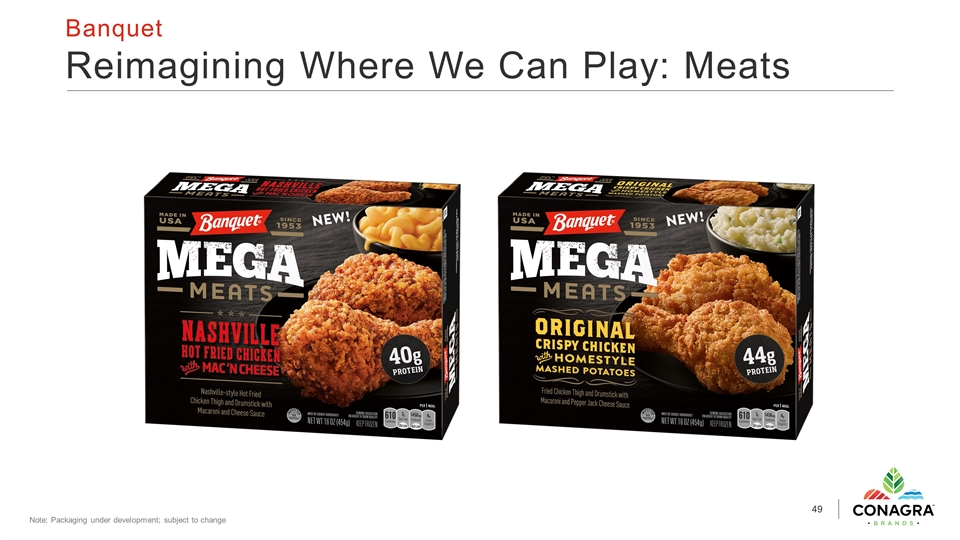
Banquet Reimagining Where We Can Play: Meats Note: Packaging under development; subject to change
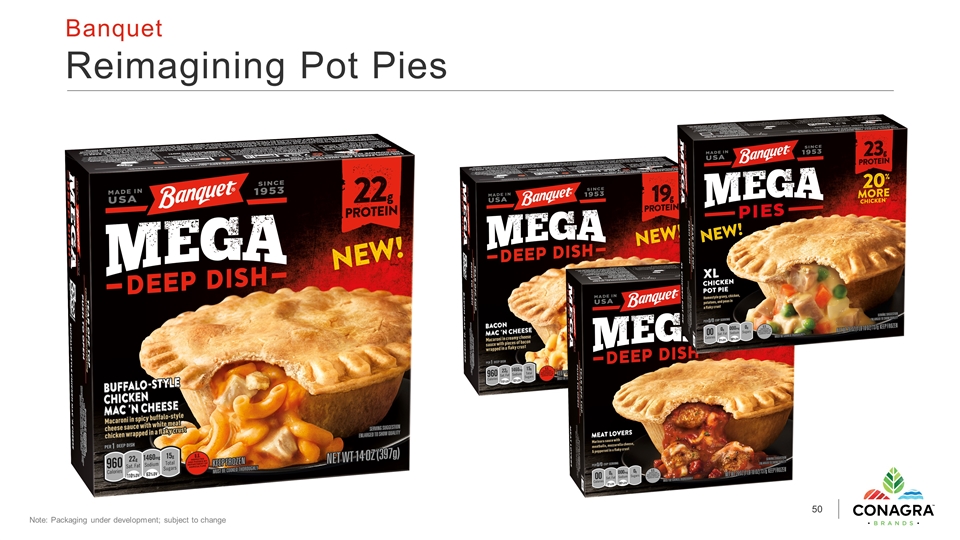
Banquet Reimagining Pot Pies Note: Packaging under development; subject to change
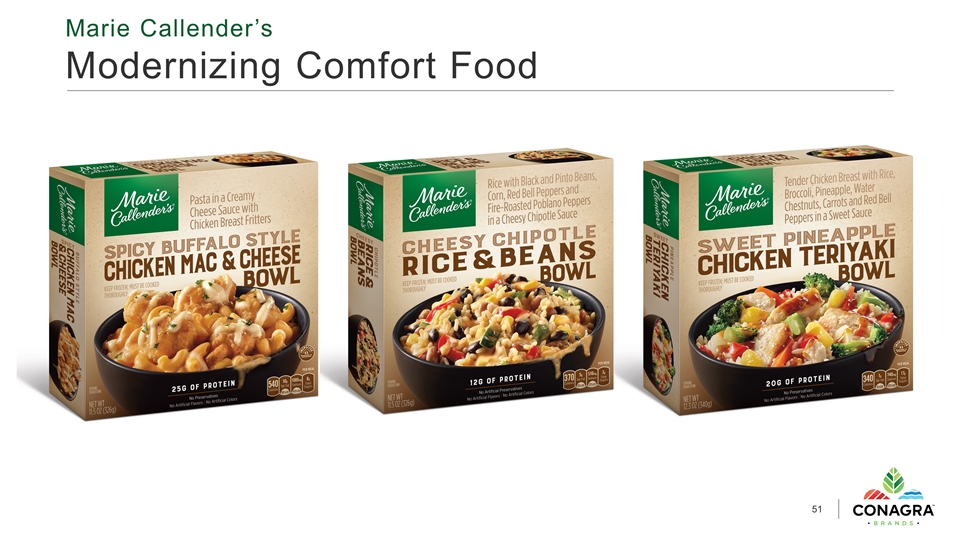
Marie Callender’s Modernizing Comfort Food
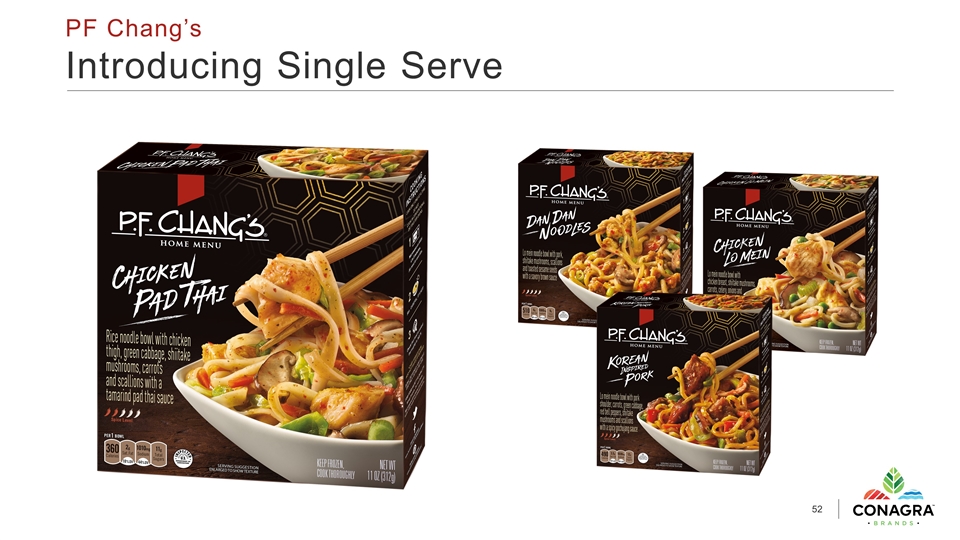
PF Chang’s Introducing Single Serve
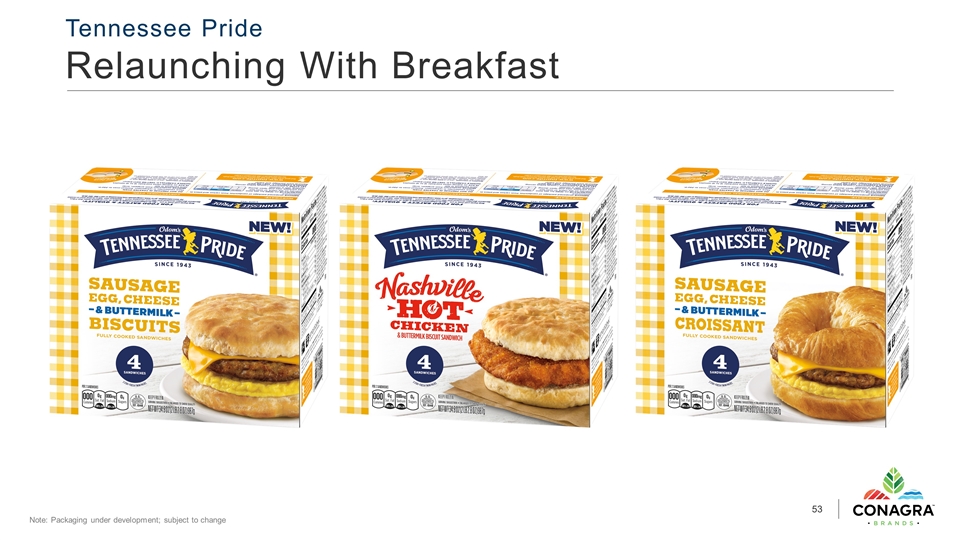
Tennessee Pride Relaunching With Breakfast Note: Packaging under development; subject to change
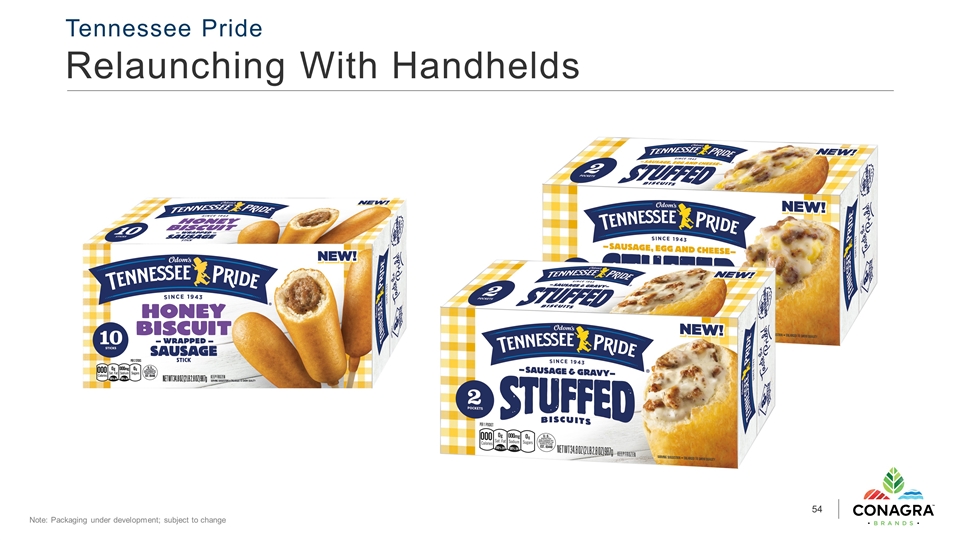
Tennessee Pride Relaunching With Handhelds Note: Packaging under development; subject to change
Compelling Opportunity in Snacks We compete in strong, vibrant categories that are aligned with consumer demands Well-positioned in the categories in which we compete Instilling a snacking mindset will enable future success
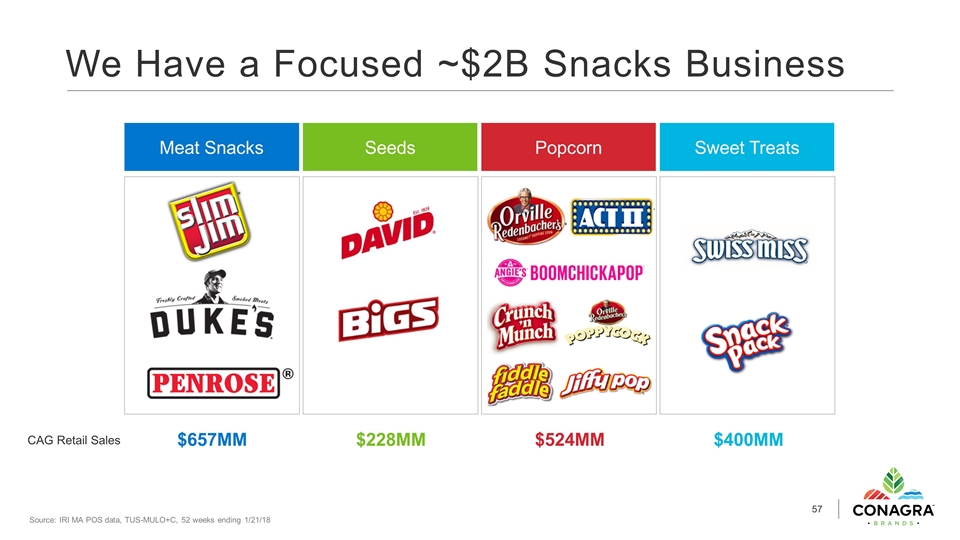
We Have a Focused ~$2B Snacks Business Source: IRI MA POS data, TUS-MULO+C, 52 weeks ending 1/21/18 $657MM $524MM $228MM $400MM Meat Snacks Popcorn Seeds Sweet Treats CAG Retail Sales
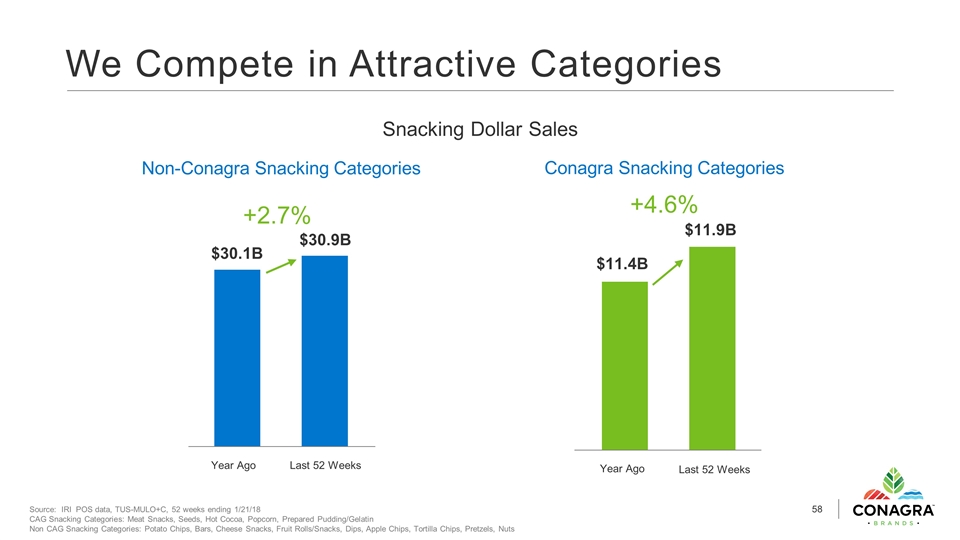
We Compete in Attractive Categories Source: IRI POS data, TUS-MULO+C, 52 weeks ending 1/21/18 CAG Snacking Categories: Meat Snacks, Seeds, Hot Cocoa, Popcorn, Prepared Pudding/Gelatin Non CAG Snacking Categories: Potato Chips, Bars, Cheese Snacks, Fruit Rolls/Snacks, Dips, Apple Chips, Tortilla Chips, Pretzels, Nuts Conagra Snacking Categories Snacking Dollar Sales $30.1B $30.9B Year Ago Last 52 Weeks Non-Conagra Snacking Categories $11.4B $11.9B Year Ago Last 52 Weeks +2.7% +4.6%
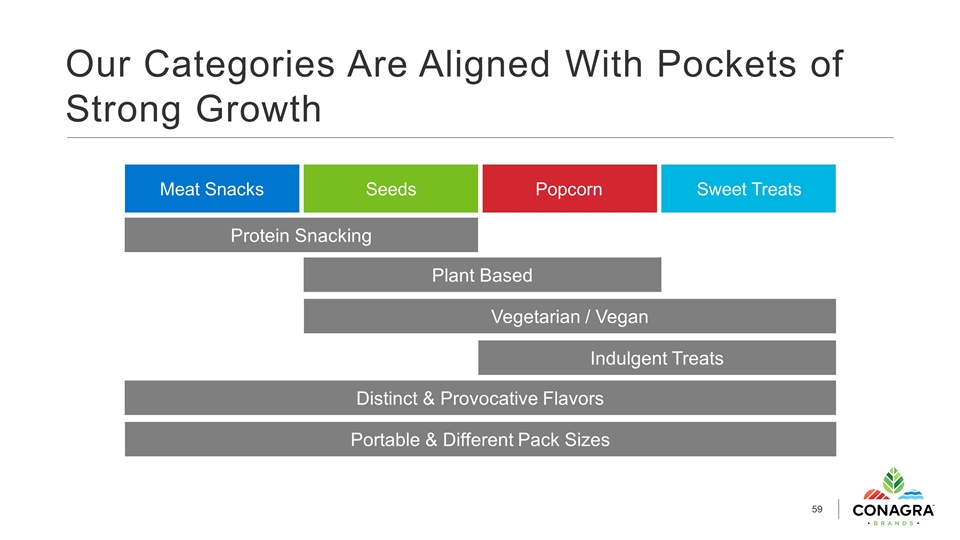
Our Categories Are Aligned With Pockets of Strong Growth Popcorn Meat Snacks Seeds Sweet Treats Protein Snacking Plant Based Vegetarian / Vegan Distinct & Provocative Flavors Portable & Different Pack Sizes Indulgent Treats
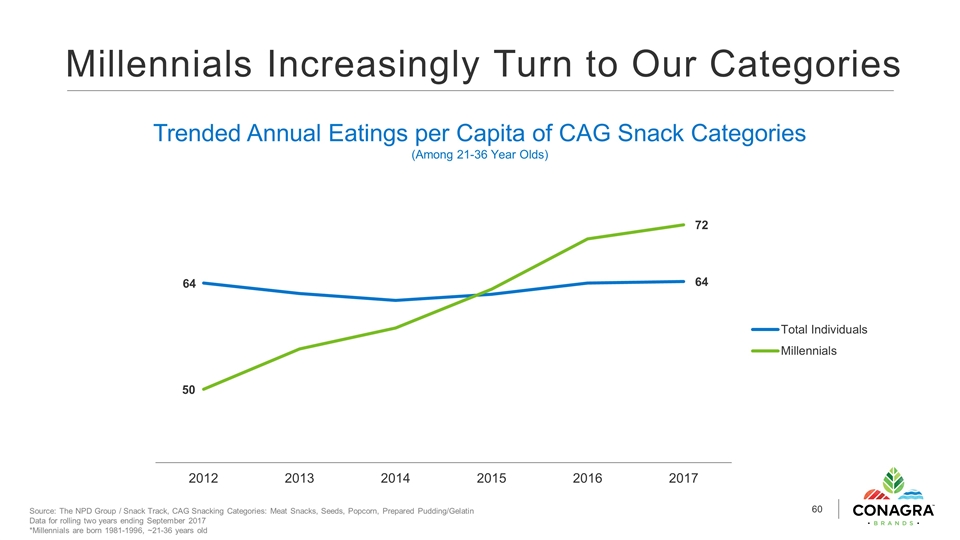
Millennials Increasingly Turn to Our Categories Source: The NPD Group / Snack Track, CAG Snacking Categories: Meat Snacks, Seeds, Popcorn, Prepared Pudding/Gelatin Data for rolling two years ending September 2017 *Millennials are born 1981-1996, ~21-36 years old Trended Annual Eatings per Capita of CAG Snack Categories (Among 21-36 Year Olds)
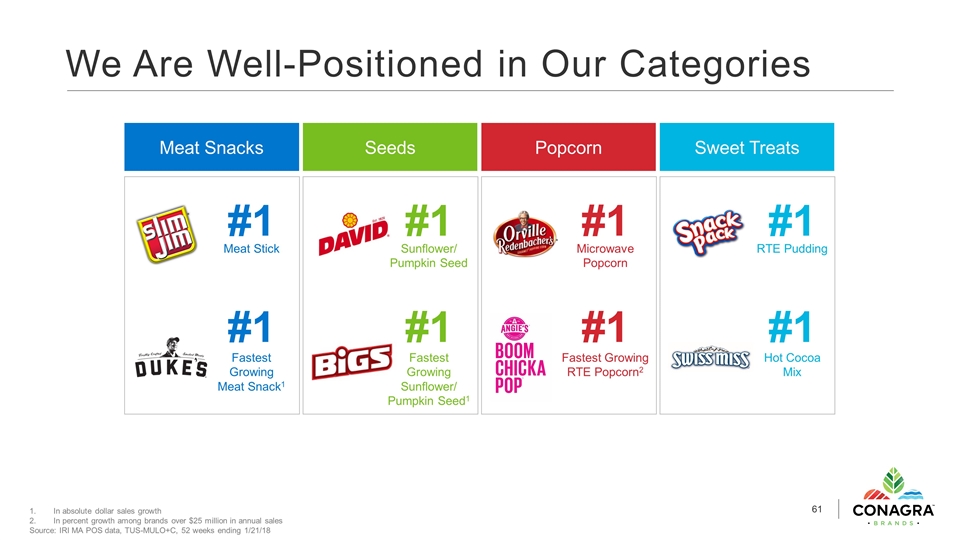
We Are Well-Positioned in Our Categories Meat Snacks Popcorn Seeds Sweet Treats #1 Fastest Growing Sunflower/ Pumpkin Seed1 #1 Sunflower/ Pumpkin Seed #1 Microwave Popcorn #1 Fastest Growing RTE Popcorn2 #1 RTE Pudding #1 Hot Cocoa Mix #1 Meat Stick #1 Fastest Growing Meat Snack1 In absolute dollar sales growth In percent growth among brands over $25 million in annual sales Source: IRI MA POS data, TUS-MULO+C, 52 weeks ending 1/21/18
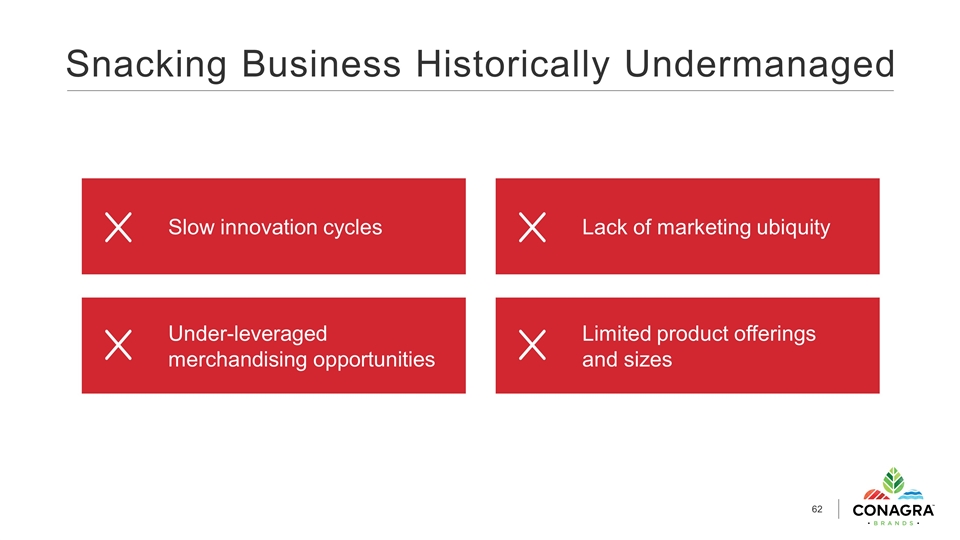
Snacking Business Historically Undermanaged Slow innovation cycles Under-leveraged merchandising opportunities Lack of marketing ubiquity Limited product offerings and sizes
Instilling a Snacking Mindset Into Conagra Increase innovation Market with purpose Drive impulse consumption Master price / pack architecture
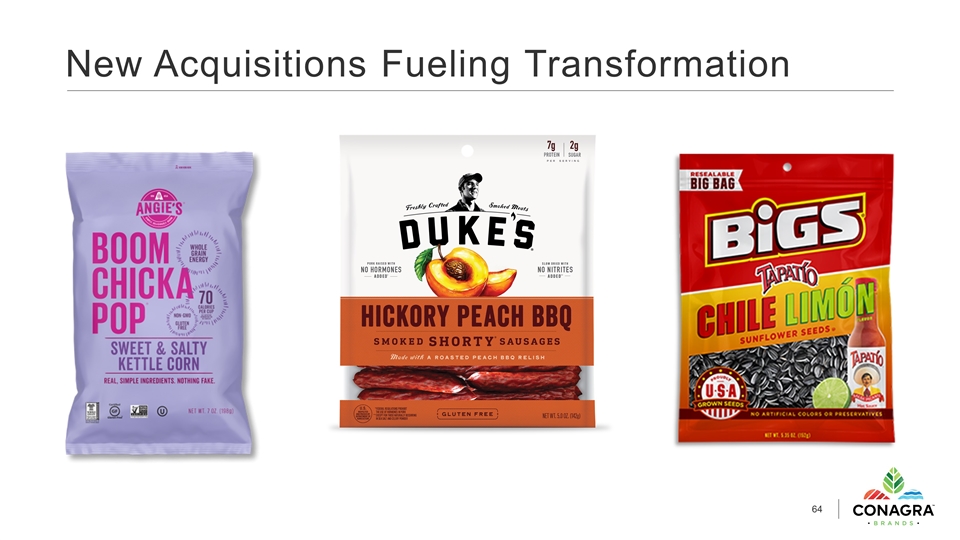
New Acquisitions Fueling Transformation
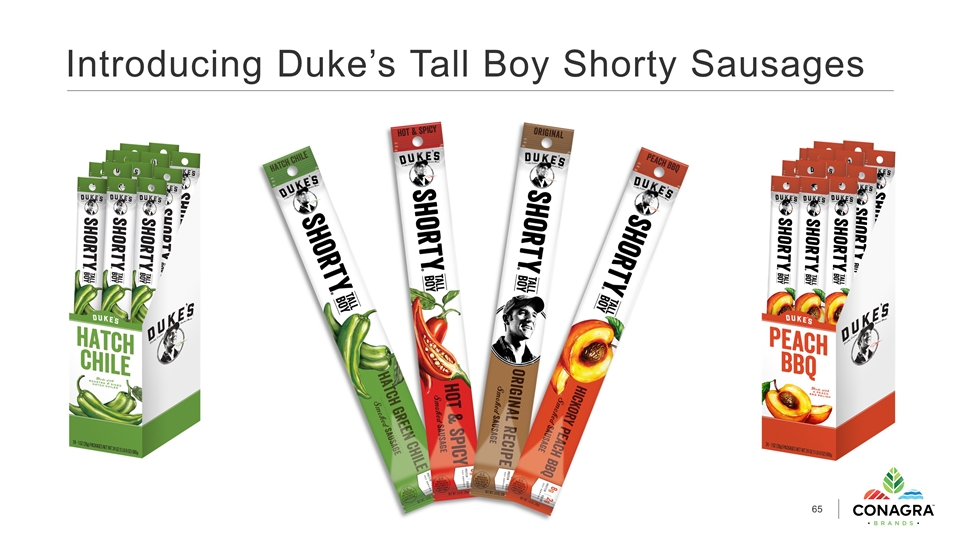
Introducing Duke’s Tall Boy Shorty Sausages
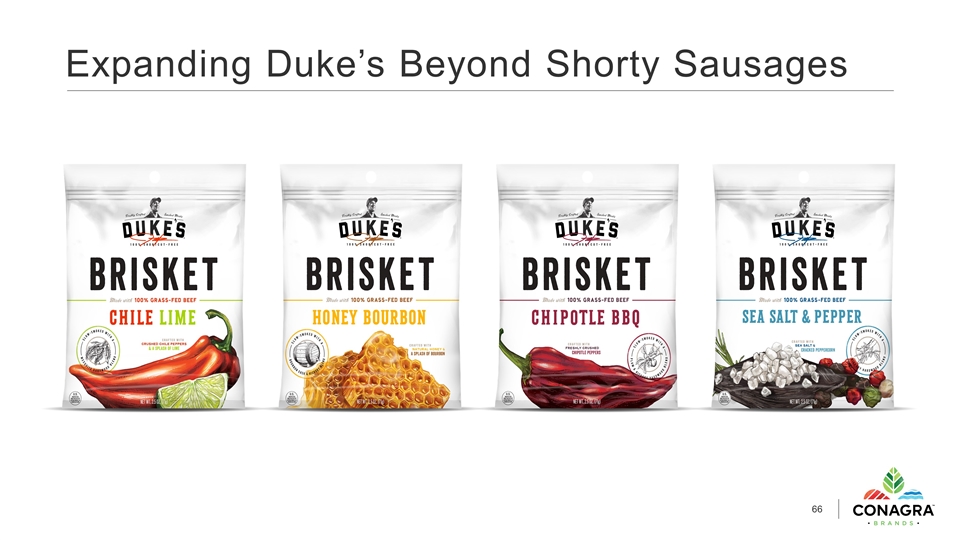
Expanding Duke’s Beyond Shorty Sausages
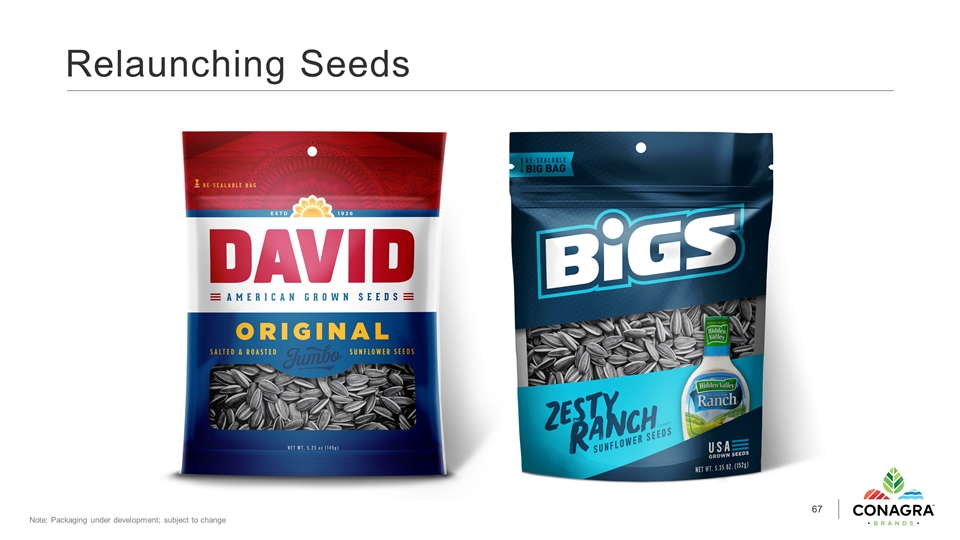
Relaunching Seeds Note: Packaging under development; subject to change
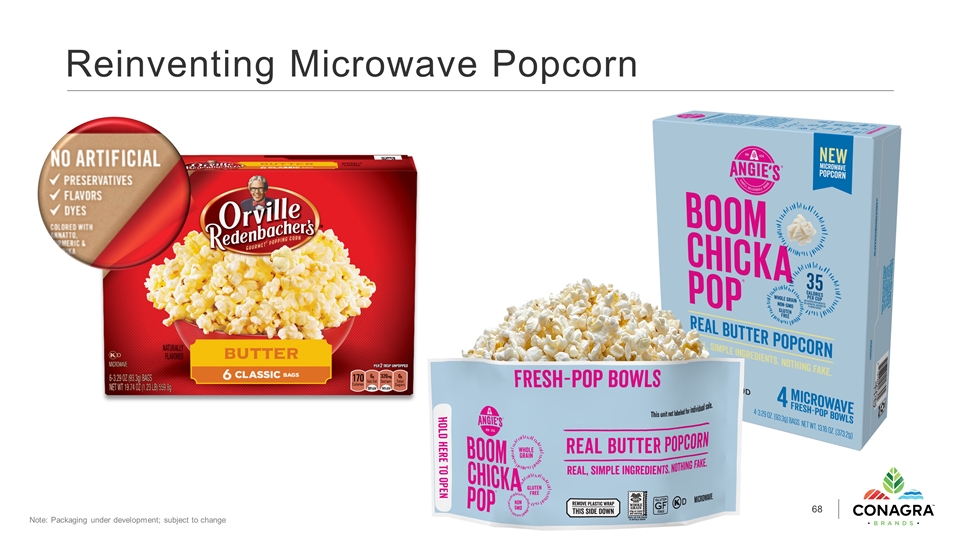
Reinventing Microwave Popcorn Note: Packaging under development; subject to change
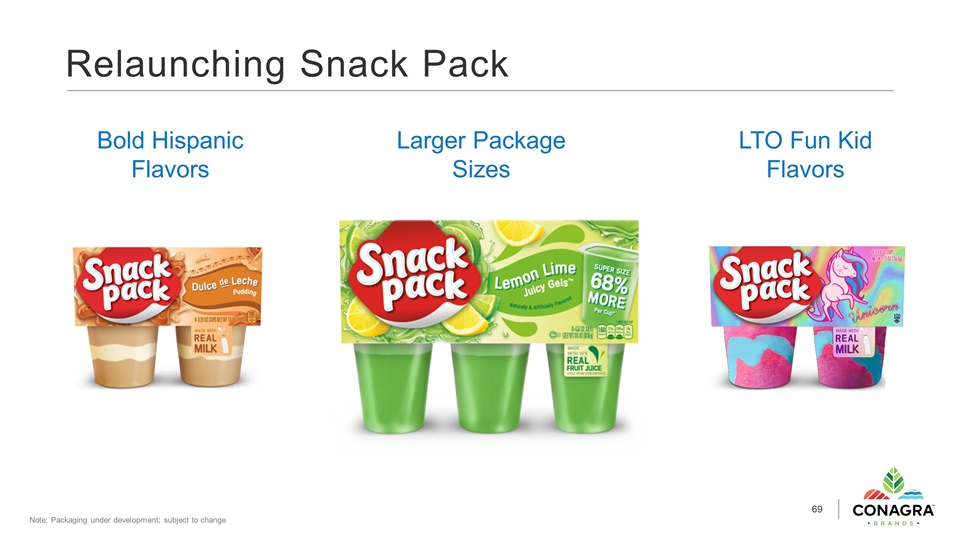
Relaunching Snack Pack Bold Hispanic Flavors LTO Fun Kid Flavors Larger Package Sizes Note: Packaging under development; subject to change
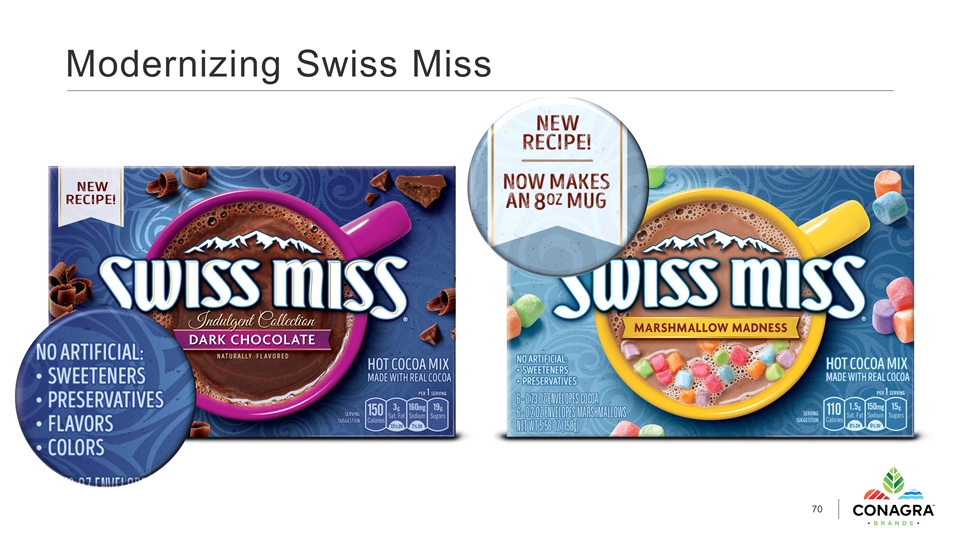
Modernizing Swiss Miss
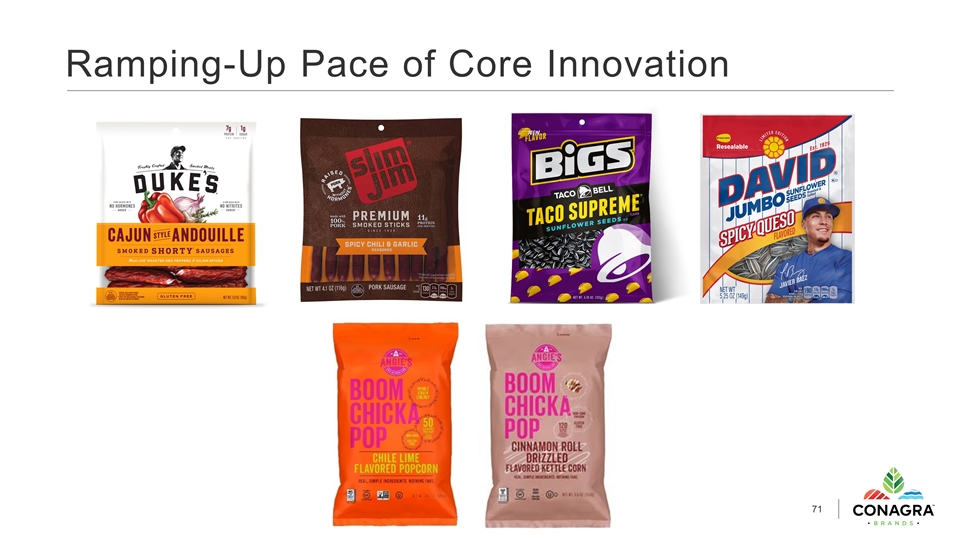
Ramping-Up Pace of Core Innovation
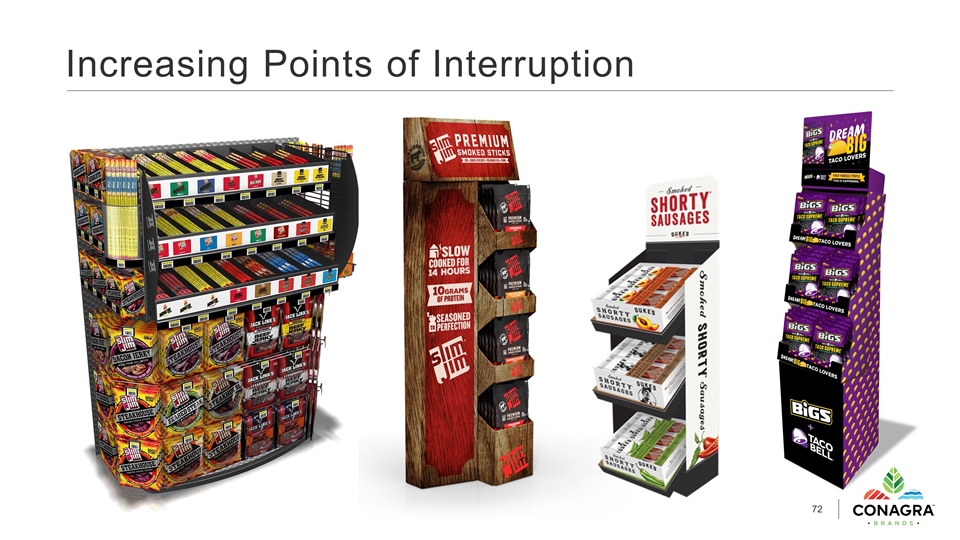
Increasing Points of Interruption
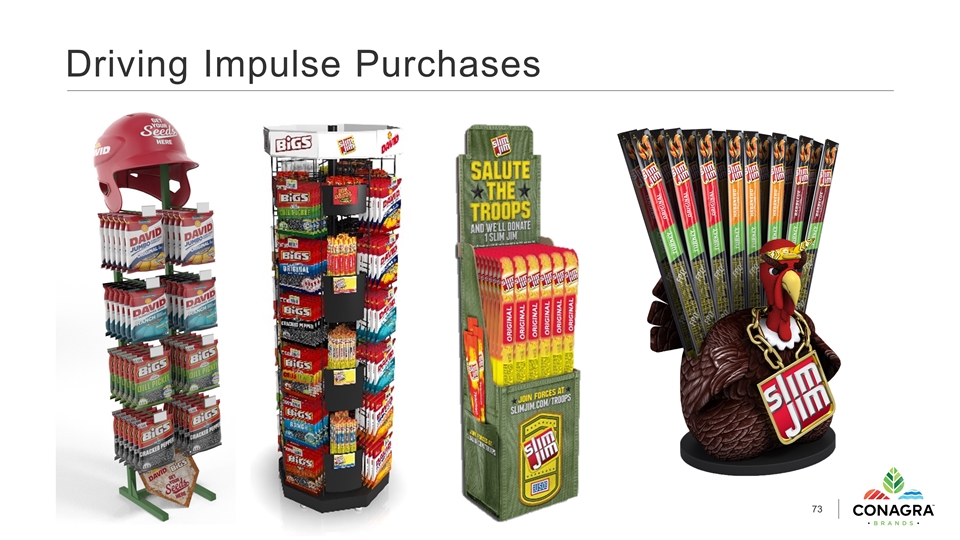
Driving Impulse Purchases
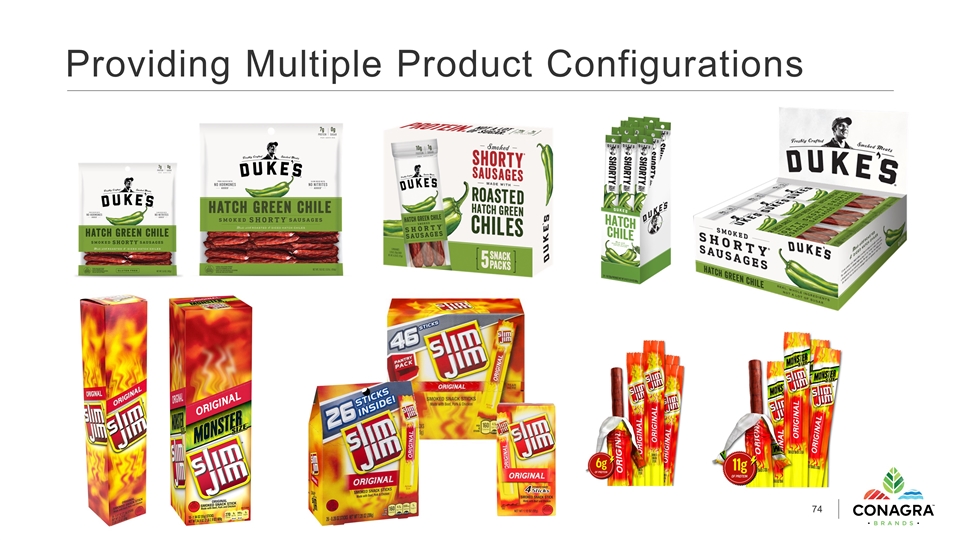
Providing Multiple Product Configurations
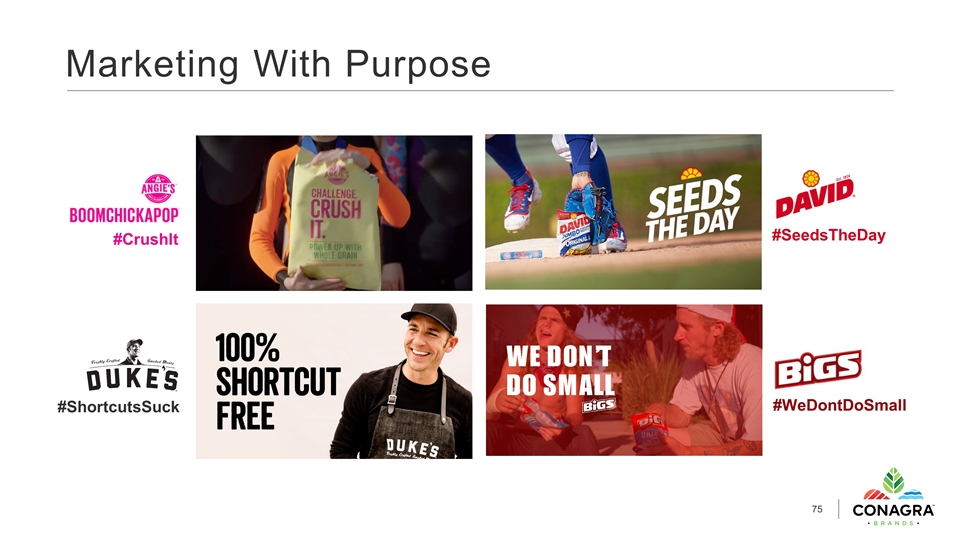
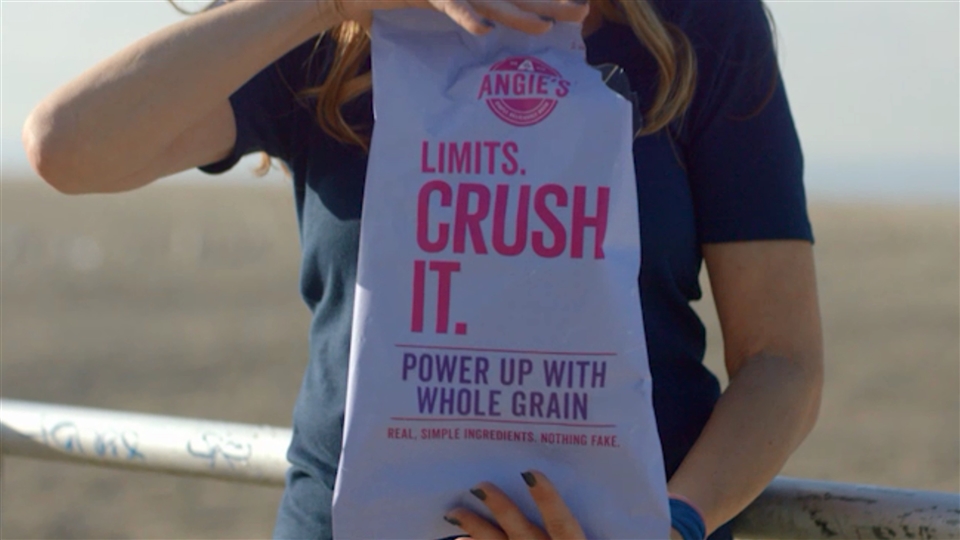
Marketing With Purpose #CrushIt #ShortcutsSuck #SeedsTheDay #WeDontDoSmall
FOCUSED PRIORITIES IN REMAINDER OF PORTFOLIO RENOVATE SHELF-STABLE MEALS & SIDES MINE OPPORTUNITIES IN CONDIMENTS & ENHANCERS
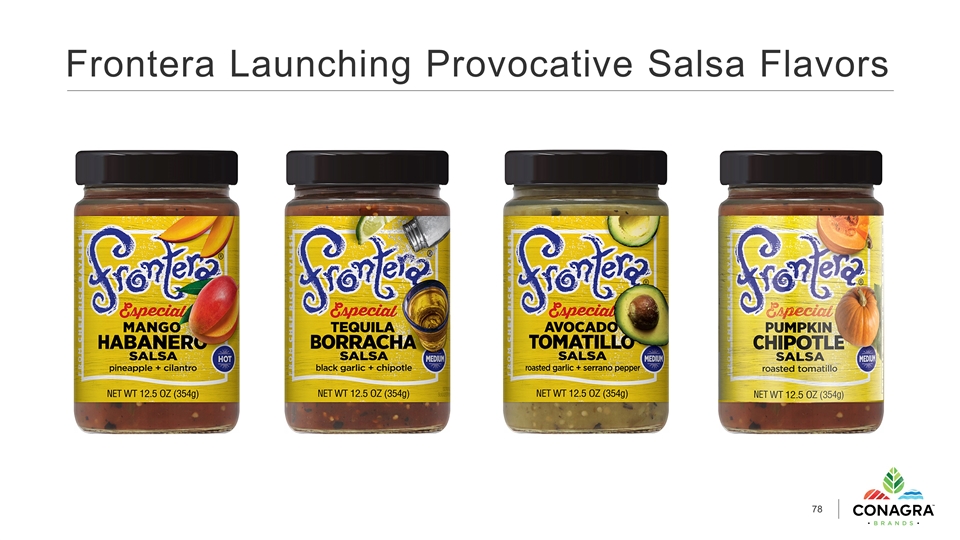
Frontera Launching Provocative Salsa Flavors

Reddi-wip Extending Into Non-Dairy Note: Packaging under development; subject to change
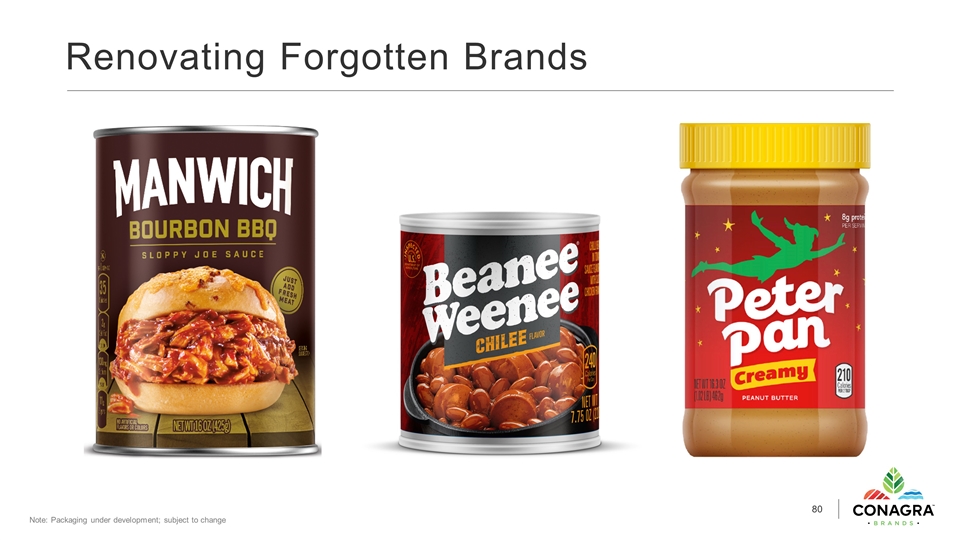
Renovating Forgotten Brands Note: Packaging under development; subject to change
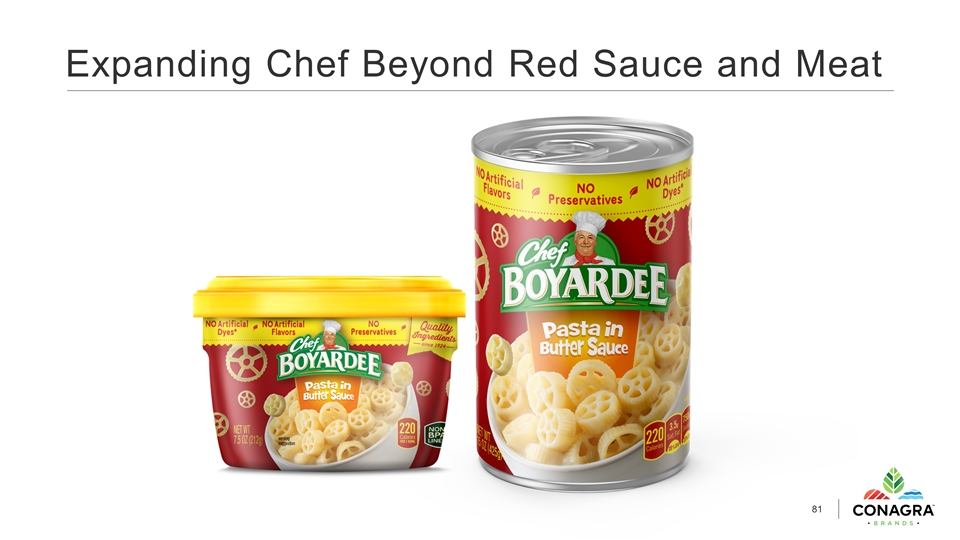
Expanding Chef Beyond Red Sauce and Meat
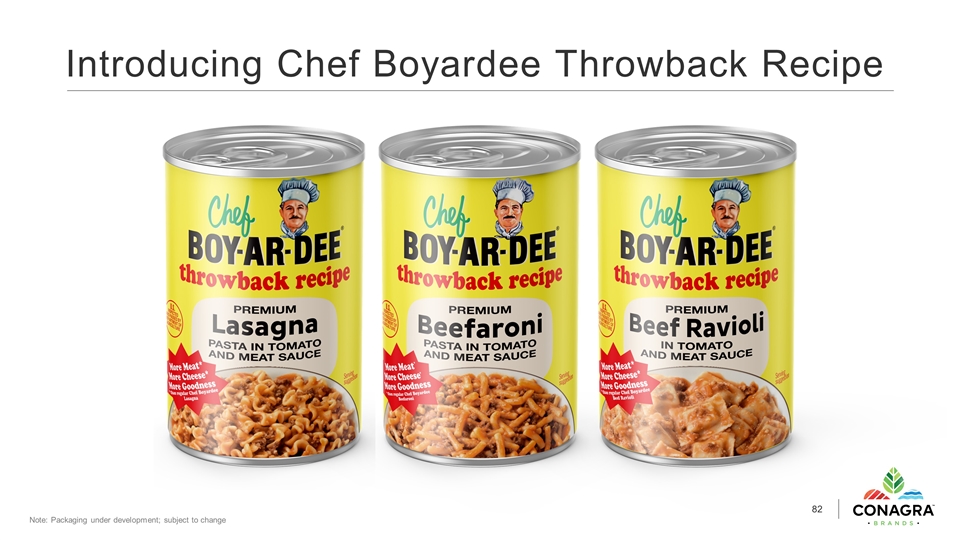
Introducing Chef Boyardee Throwback Recipe Note: Packaging under development; subject to change
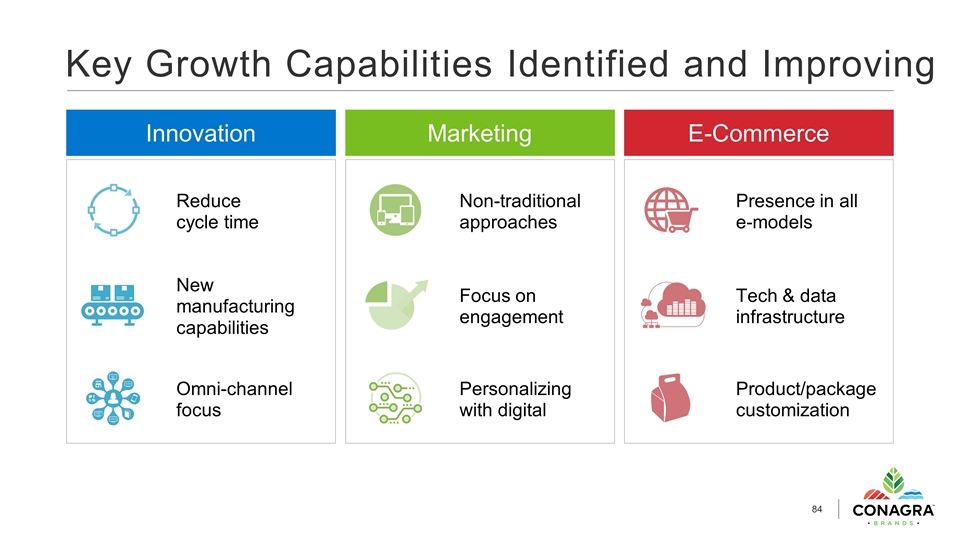
E-Commerce Marketing Innovation Key Growth Capabilities Identified and Improving Reduce cycle time New manufacturing capabilities Omni-channel focus Non-traditional approaches Focus on engagement Personalizing with digital Tech & data infrastructure Product/package customization Presence in all e-models
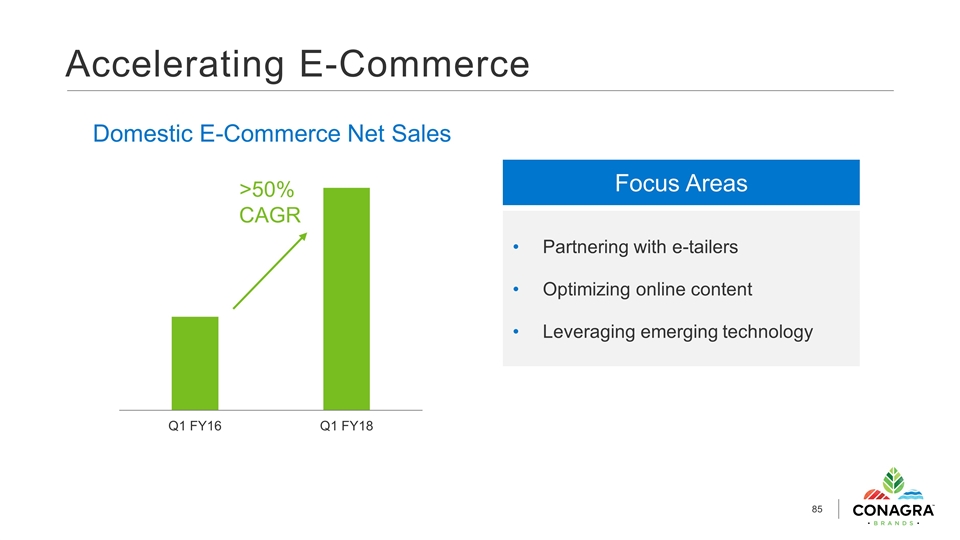
Accelerating E-Commerce >50% CAGR Domestic E-Commerce Net Sales Focus Areas Partnering with e-tailers Optimizing online content Leveraging emerging technology
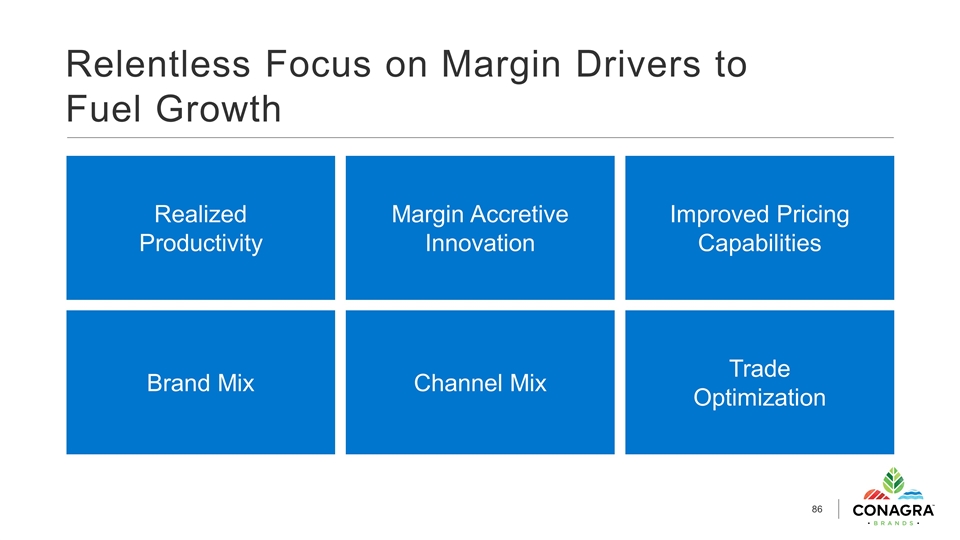
Relentless Focus on Margin Drivers to Fuel Growth Realized Productivity Margin Accretive Innovation Improved Pricing Capabilities Brand Mix Channel Mix Trade Optimization
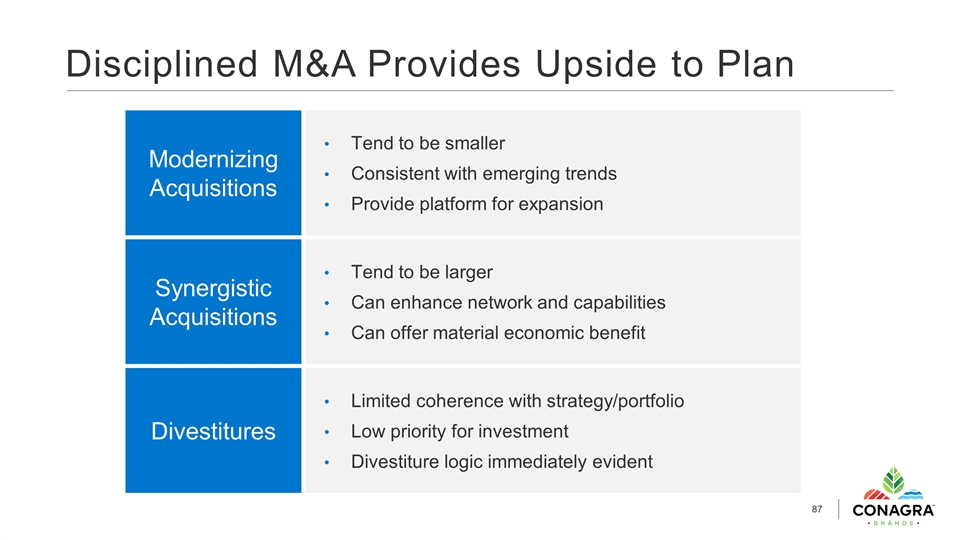
Disciplined M&A Provides Upside to Plan Modernizing Acquisitions Synergistic Acquisitions Tend to be smaller Consistent with emerging trends Provide platform for expansion Tend to be larger Can enhance network and capabilities Can offer material economic benefit Divestitures Limited coherence with strategy/portfolio Low priority for investment Divestiture logic immediately evident
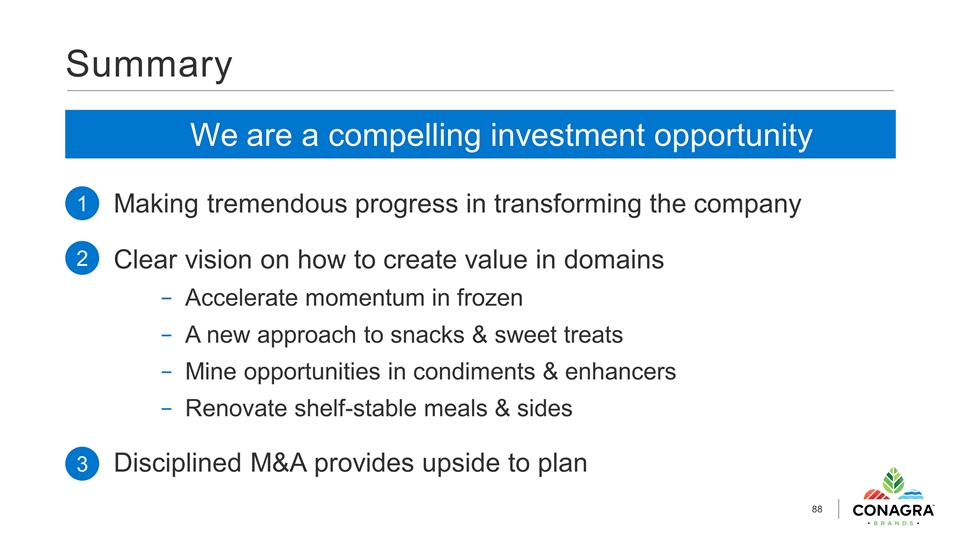
Summary Making tremendous progress in transforming the company Clear vision on how to create value in domains Accelerate momentum in frozen A new approach to snacks & sweet treats Mine opportunities in condiments & enhancers Renovate shelf-stable meals & sides Disciplined M&A provides upside to plan 1 2 3 We are a compelling investment opportunity
DAVE MARBERGER EXECUTIVE VICE PRESIDENT AND CFO
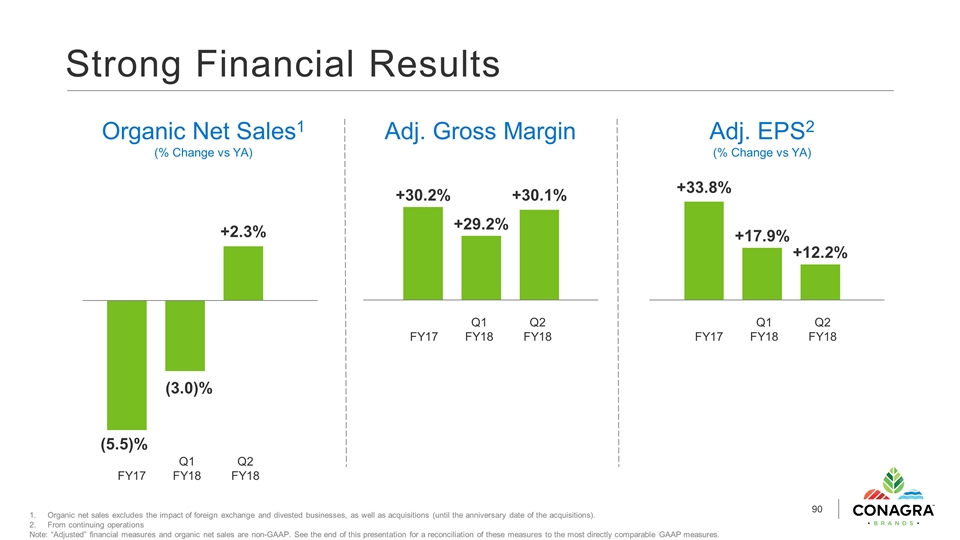
Strong Financial Results Organic Net Sales1 (% Change vs YA) Adj. Gross Margin Adj. EPS2 (% Change vs YA) Organic net sales excludes the impact of foreign exchange and divested businesses, as well as acquisitions (until the anniversary date of the acquisitions). From continuing operations Note: “Adjusted” financial measures and organic net sales are non-GAAP. See the end of this presentation for a reconciliation of these measures to the most directly comparable GAAP measures. FY17 Q1 FY18 Q2 FY18 FY17 Q1 FY18 Q2 FY18 FY17 Q1 FY18 Q2 FY18 +33.8%
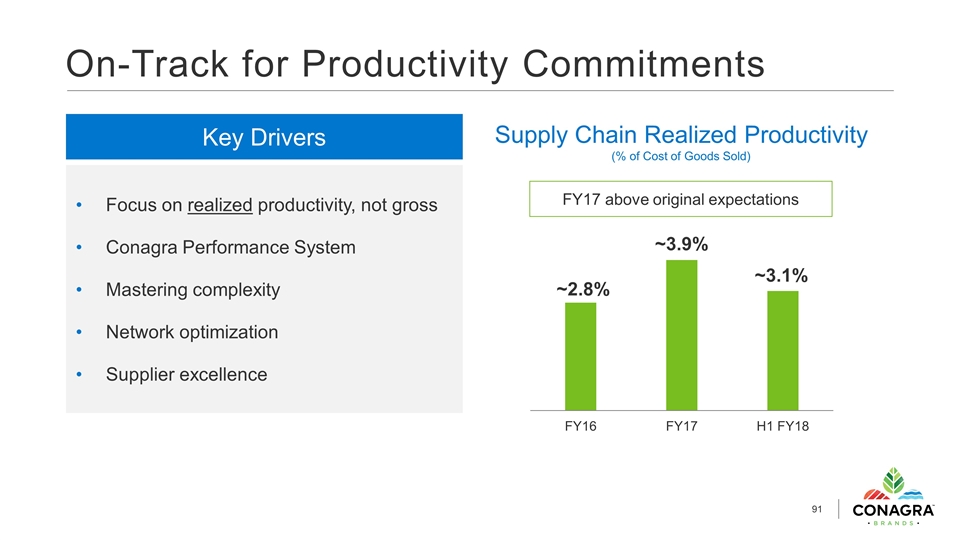
FY17 above original expectations On-Track for Productivity Commitments Supply Chain Realized Productivity (% of Cost of Goods Sold) Key Drivers Focus on realized productivity, not gross Conagra Performance System Mastering complexity Network optimization Supplier excellence
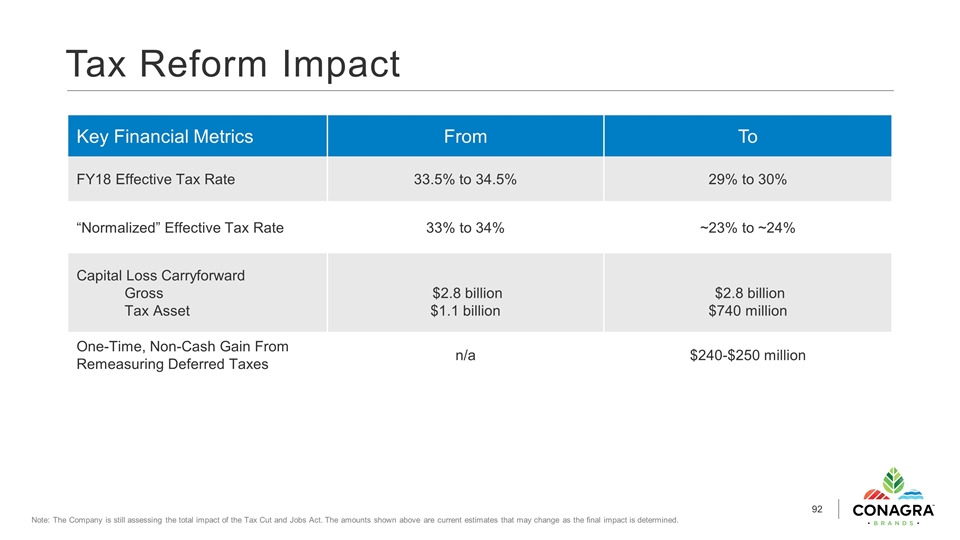
Tax Reform Impact Key Financial Metrics From To FY18 Effective Tax Rate 33.5% to 34.5% 29% to 30% “Normalized” Effective Tax Rate 33% to 34% ~23% to ~24% Capital Loss Carryforward Gross Tax Asset $2.8 billion $1.1 billion $2.8 billion $740 million One-Time, Non-Cash Gain From Remeasuring Deferred Taxes n/a $240-$250 million Note: The Company is still assessing the total impact of the Tax Cut and Jobs Act. The amounts shown above are current estimates that may change as the final impact is determined.
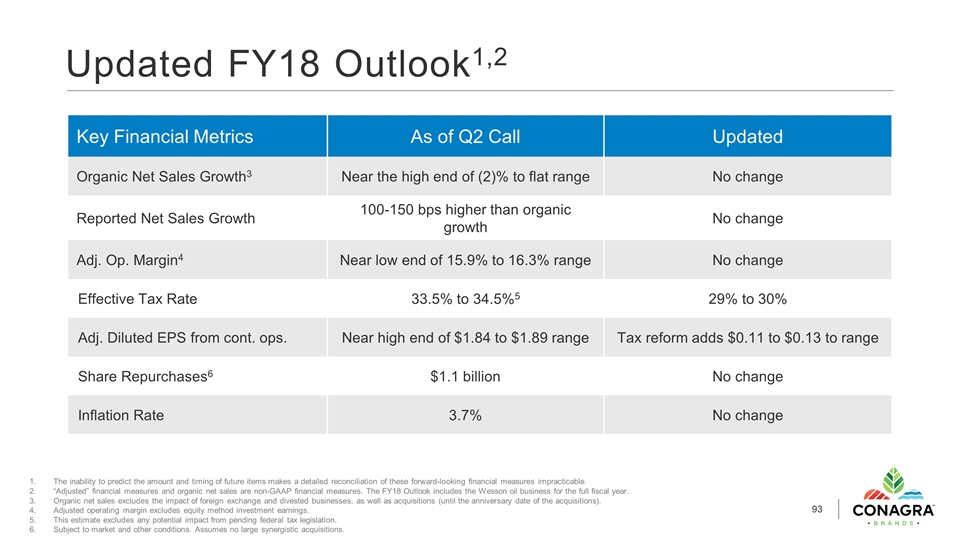
The inability to predict the amount and timing of future items makes a detailed reconciliation of these forward-looking financial measures impracticable. “Adjusted” financial measures and organic net sales are non-GAAP financial measures. The FY18 Outlook includes the Wesson oil business for the full fiscal year. Organic net sales excludes the impact of foreign exchange and divested businesses, as well as acquisitions (until the anniversary date of the acquisitions). Adjusted operating margin excludes equity method investment earnings. This estimate excludes any potential impact from pending federal tax legislation. Subject to market and other conditions. Assumes no large synergistic acquisitions. Updated FY18 Outlook1,2 Key Financial Metrics As of Q2 Call Updated Organic Net Sales Growth3 Near the high end of (2)% to flat range No change Reported Net Sales Growth 100-150 bps higher than organic growth No change Adj. Op. Margin4 Near low end of 15.9% to 16.3% range No change Effective Tax Rate 33.5% to 34.5%5 29% to 30% Adj. Diluted EPS from cont. ops. Near high end of $1.84 to $1.89 range Tax reform adds $0.11 to $0.13 to range Share Repurchases6 $1.1 billion No change Inflation Rate 3.7% No change
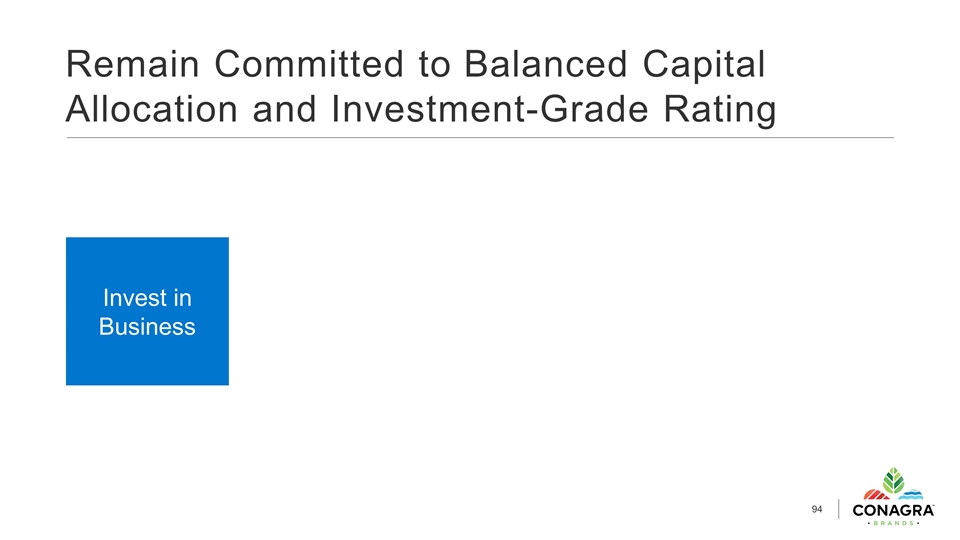
Remain Committed to Balanced Capital Allocation and Investment-Grade Rating Invest in Business
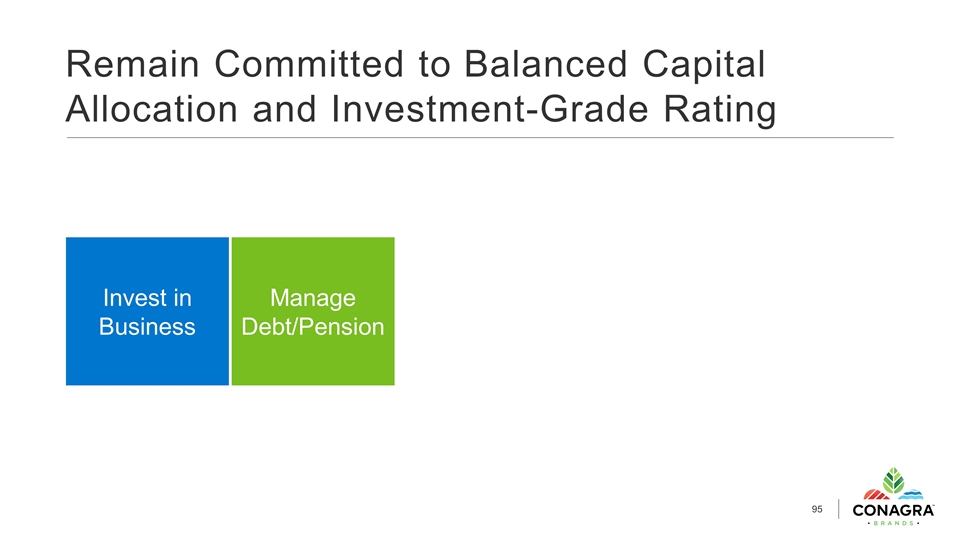
Remain Committed to Balanced Capital Allocation and Investment-Grade Rating Manage Debt/Pension Invest in Business
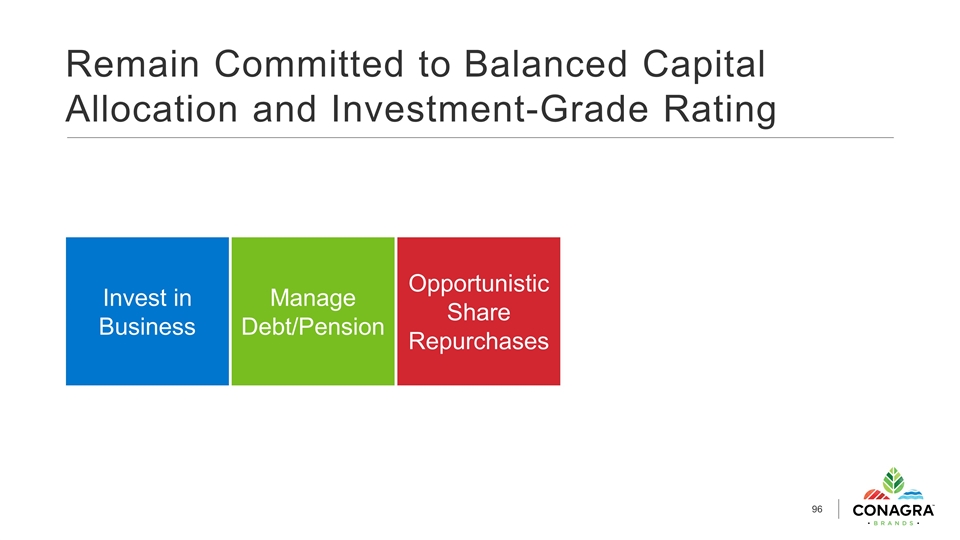
Remain Committed to Balanced Capital Allocation and Investment-Grade Rating Manage Debt/Pension Opportunistic Share Repurchases Invest in Business
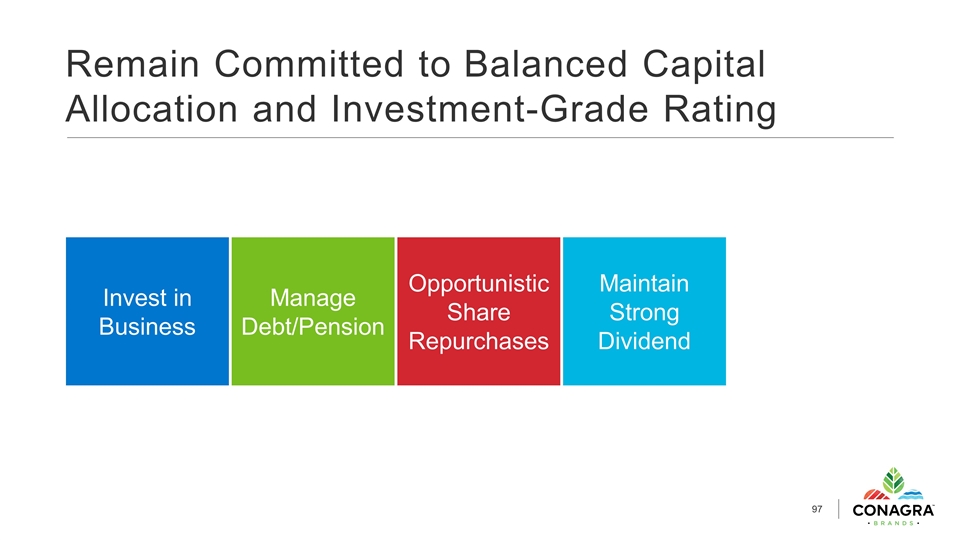
Remain Committed to Balanced Capital Allocation and Investment-Grade Rating Manage Debt/Pension Opportunistic Share Repurchases Maintain Strong Dividend Invest in Business
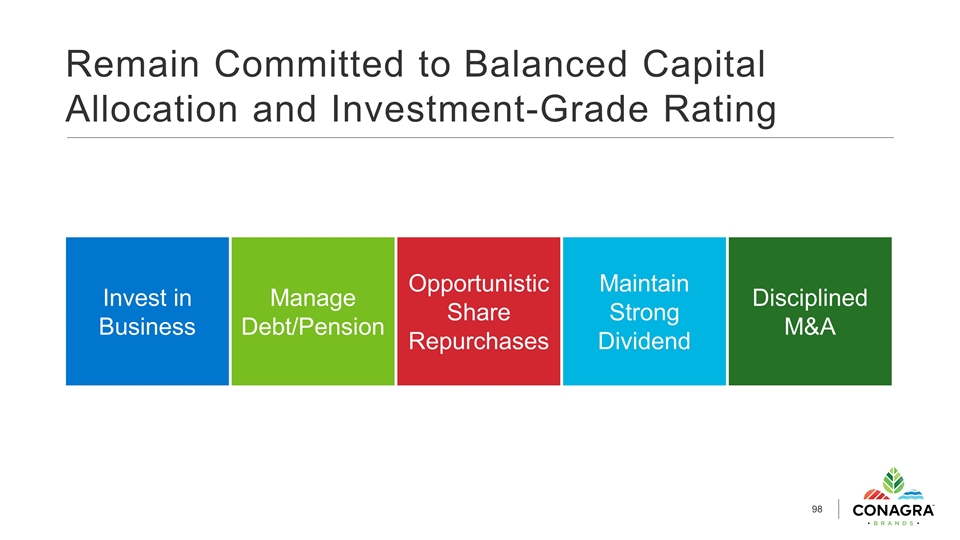
Remain Committed to Balanced Capital Allocation and Investment-Grade Rating Manage Debt/Pension Opportunistic Share Repurchases Maintain Strong Dividend Disciplined M&A Invest in Business
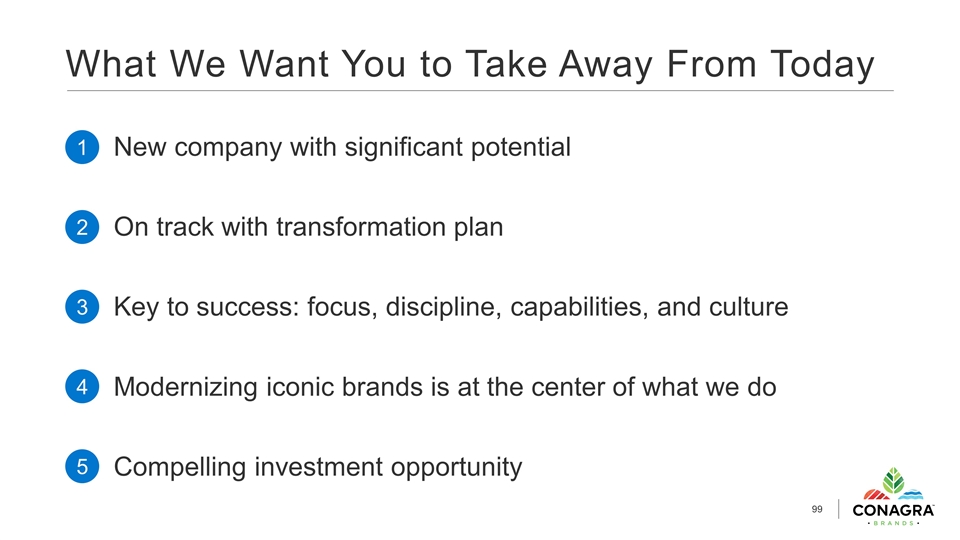
What We Want You to Take Away From Today New company with significant potential On track with transformation plan Key to success: focus, discipline, capabilities, and culture Modernizing iconic brands is at the center of what we do Compelling investment opportunity 1 2 3 4 5
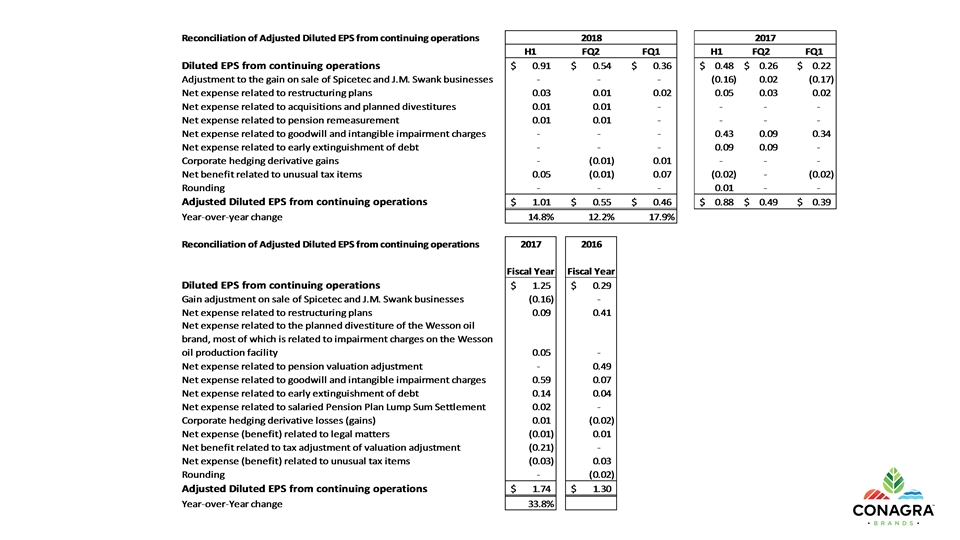
RECONCILIATIONS
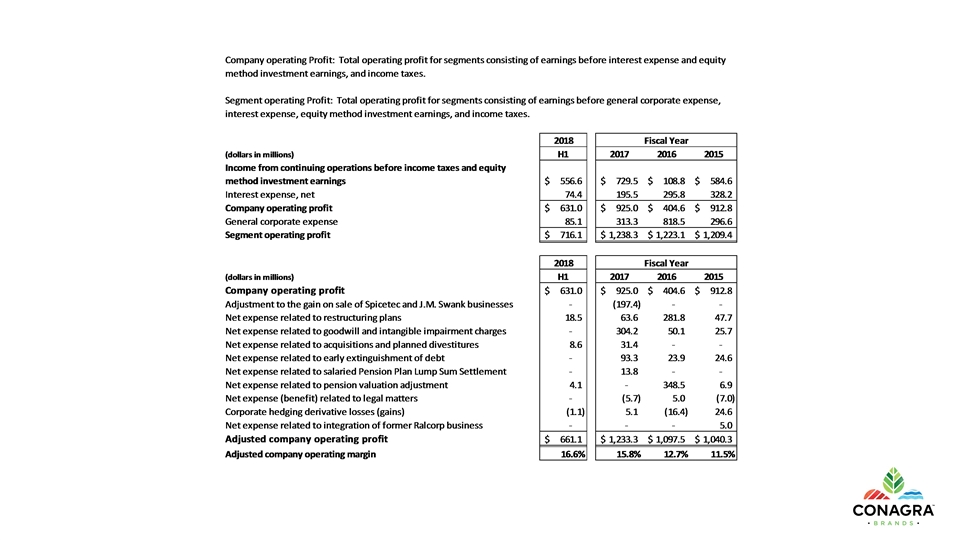
Reconciliation of Adjusted Operating Profit and Adjusted Operating Margin Company operating Profit: Total operating profit for segments consisting of earnings before interest expense and equity method investment earnings, and income taxes. Segment operating Profit: Total operating profit for segments consisting of earnings before general corporate expense, interest expense, equity method investment earnings, and income taxes. 2018 Fiscal Year (dollars in millions) H1 2017 2016 2015 Income from continuing operations before income taxes and equity method investment earnings $556.6 $729.5 $108.8 $584.6 Interest expense, net 74.400000000000006 195.5 295.8 328.2 Company operating profit $631 $925 $404.6 $912.8 General corporate expense 85.1 313.3 818.5 296.60000000000002 Segment operating profit $716.1 $1,238.3 $1,223.999999999999 $1,209.4000000000001 2018 Fiscal Year (dollars in millions) H1 2017 2016 2015 Company operating profit $631 $925 $404.6 $912.8 Adjustment to the gain on sale of Spicetec and J.M. Swank businesses 0 -,197.4 0 0 Net expense related to restructuring plans 18.5 63.6 281.8 47.7 Net expense related to goodwill and intangible impairment charges 0 304.2 50.1 25.7 Net expense related to acquisitions and planned divestitures 8.6 31.4 0 0 Net expense related to early extinguishment of debt 0 93.3 23.9 24.6 Net expense related to salaried Pension Plan Lump Sum Settlement 0 13.8 0 0 Net expense related to pension valuation adjustment 4.0999999999999996 0 348.5 6.9 Net expense (benefit) related to legal matters 0 -5.7 5 -7 Corporate hedging derivative losses (gains) -1.0999999999999996 5.0999999999999996 -16.399999999999999 24.6 Net expense related to integration of former Ralcorp business 0 0 0 5 Adjusted company operating profit $661.1 $1,233.3 $1,097.5 $1,040.3 Adjusted company operating margin 0.16622134969975005 0.15757494462004246 0.12665654575707644 0.11515386318352888
