EVERSOURCE ENERGY Q1 2023 RESULTS May 4, 2023 2023 First Quarter Results Exhibit 99.3

EVERSOURCE ENERGY Q1 2023 RESULTS 1 Safe Harbor Statement All per - share amounts in this presentation are reported on a diluted basis. The only common equity securities that are publicly traded are common shares of Eversource Energy. The earnings and EPS of each business do not represent a direct legal interest in the assets and liabilities of such bu siness, but rather represent a direct interest in Eversource Energy's assets and liabilities as a whole. EPS by business is a financial measure that is not recogn ize d under generally accepted accounting principles (non - GAAP) and is calculated by dividing the net income or loss attributable to common shareholders of each business by the weighted average diluted Eversource Energy common shares outstanding for the period. Earnings discussions also include non - GAAP financial measures refer encing earnings and EPS excluding certain transaction and transition costs. Eversource Energy uses these non - GAAP financial measures to evaluate and provide deta ils of earnings results by business and to more fully compare and explain results without including these items. This information is among the primary indicator s m anagement uses as a basis for evaluating performance and planning and forecasting of future periods. Management believes the impacts of transaction and tra nsi tion costs are not indicative of Eversource Energy’s ongoing costs and performance. Management views these charges as not directly related to the ongoing operat ions of the business and therefore not an indicator of baseline operating performance. Due to the nature and significance of the effect of these items on net i nco me attributable to common shareholders and EPS, management believes that the non - GAAP presentation is a more meaningful representation of Eversource Energy’s financial performance and provides additional and useful information to readers in analyzing historical and future performance of the business. These non - GAAP fin ancial measures should not be considered as alternatives to Eversource Energy’s reported net income attributable to common shareholders or EPS determined i n a ccordance with GAAP as indicators of Eversource Energy’s operating performance. This document includes statements concerning Eversource Energy’s expectations, beliefs, plans, objectives, goals, strategies, as sumptions of future events, future financial performance or growth and other statements that are not historical facts. These statements are “forward - looking statem ents” within the meaning of the Private Securities Litigation Reform Act of 1995. Generally, readers can identify these forward - looking statements through the use of w ords or phrases such as “estimate,” “expect,” “anticipate,” “intend,” “plan,” “project,” “believe,” “forecast,” “should,” “could” and other similar expressions. Fo rward - looking statements involve risks and uncertainties that may cause actual results or outcomes to differ materially from those included in the forward - looking statemen ts. Forward - looking statements are based on the current expectations, estimates, assumptions or projections of management and are not guarantees of future perfo rma nce. These expectations, estimates, assumptions or projections may vary materially from actual results. Accordingly, any such statements are qualified in their entirety by reference to, and are accompanied by, the following important factors that may cause our actual results or outcomes to differ materially from those co ntained in our forward - looking statements, including, but not limited to: cyberattacks or breaches, including those resulting in the compromise of the confi den tiality of our proprietary information and the personal information of our customers; disruptions in the capital markets or other events that make our access to necessa ry capital more difficult or costly; changes in economic conditions, including impact on interest rates, tax policies, and customer demand and payment ability; ability or in ability to commence and complete our major strategic development projects and opportunities; acts of war or terrorism, physical attacks or grid disturbances that may damage and disrupt our electric transmission and electric, natural gas, and water distribution systems; actions or inaction of local, state and federal regul ato ry, public policy and taxing bodies; substandard performance of third - party suppliers and service providers; fluctuations in weather patterns, including extreme weat her due to climate change; changes in business conditions, which could include disruptive technology or development of alternative energy sources related to our cu rre nt or future business model; contamination of, or disruption in, our water supplies; changes in levels or timing of capital expenditures; changes in laws, re gulations or regulatory policy, including compliance with environmental laws and regulations; changes in accounting standards and financial reporting regulations; acti ons of rating agencies; and other presently unknown or unforeseen factors. Other risk factors are detailed in Eversource Energy’s reports filed with the Securities and Exchange Commission (SEC). They ar e updated as necessary and available on Eversource Energy’s website at www.eversource.com and on the SEC’s website at www.sec.gov. All such factors are difficult to predict and contain uncertainties that may materially affect Eversource Energy’s actual results, many of which are beyond our control. You should not place undue r eli ance on the forward - looking statements, as each speaks only as of the date on which such statement is made, and, except as required by federal securities la ws, Eversource Energy undertakes no obligation to update any forward - looking statement or statements to reflect events or circumstances after the date on which such statement is made or to reflect the occurrence of unanticipated events.
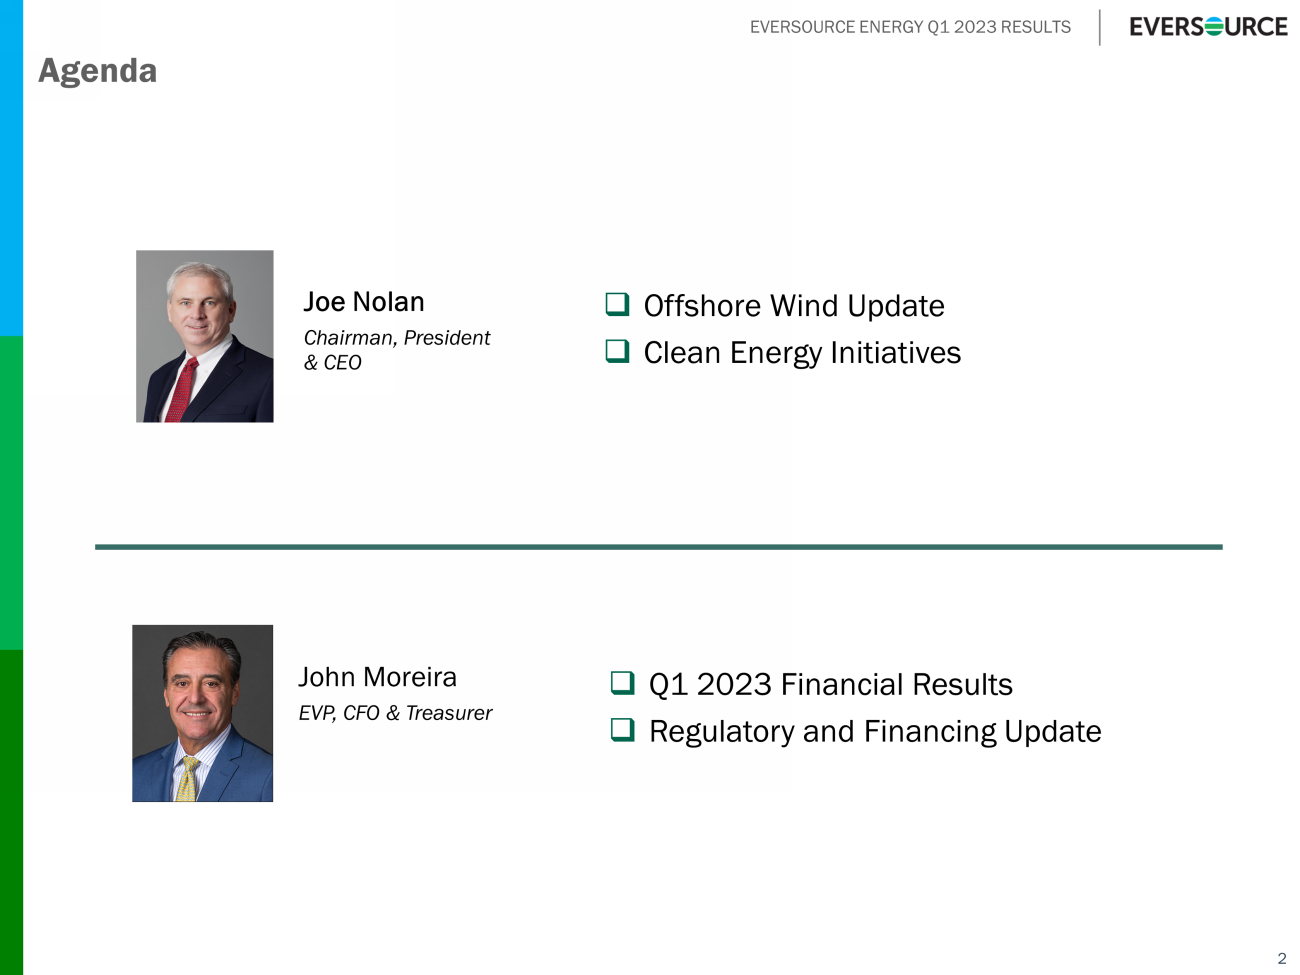
EVERSOURCE ENERGY Q1 2023 RESULTS Agenda 2 Joe Nolan Chairman, President & CEO John Moreira EVP, CFO & Treasurer □ Offshore Wind Update □ Clean Energy Initiatives □ Q1 2023 Financial Results □ Regulatory and Financing Update
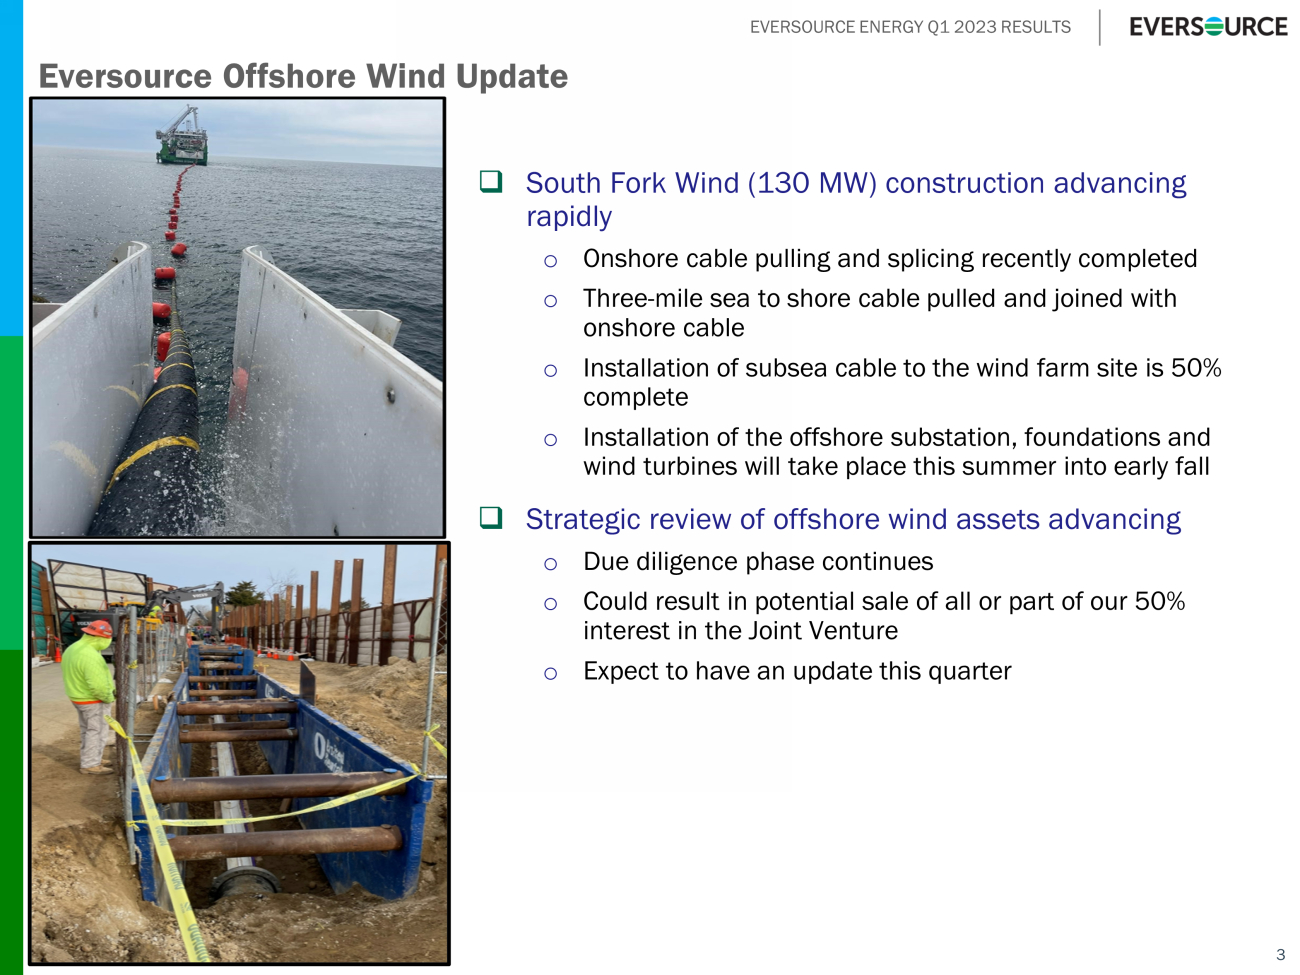
EVERSOURCE ENERGY Q1 2023 RESULTS Eversource Offshore Wind Update □ South Fork Wind (130 MW) construction advancing rapidly o Onshore cable pulling and splicing recently completed o Three - mile sea to shore cable pulled and joined with onshore cable o Installation of subsea cable to the wind farm site is 50% complete o Installation of the offshore substation, foundations and wind turbines will take place this summer into early fall □ Strategic review of offshore wind assets advancing o Due diligence phase continues o Could result in potential sale of all or part of our 50% interest in the Joint Venture o Expect to have an update this quarter 3

EVERSOURCE ENERGY Q1 2023 RESULTS 4 Assumptions Feb 2023 May 2023 Costs Locked in for Three Projects ~90% ~92% Offshore Investment at Quarter End $1.95B $2.16B Expected Spending in 2023 $1.9B - $2.1B $1.4B - $1.6B Expected Spending 2024 – 2026 $1.6B - $1.9B $2.1B - $2.4B Expected Long - Term Average ROE 11 - 13% 11 - 13% South Fork Wind In Service Late 2023 (Under Construction) Late 2023 (Under Construction) Revolution Wind In Service In 2025 In 2025 Sunrise Wind In Service Late 2025 Late 2025 Offshore Wind Updates
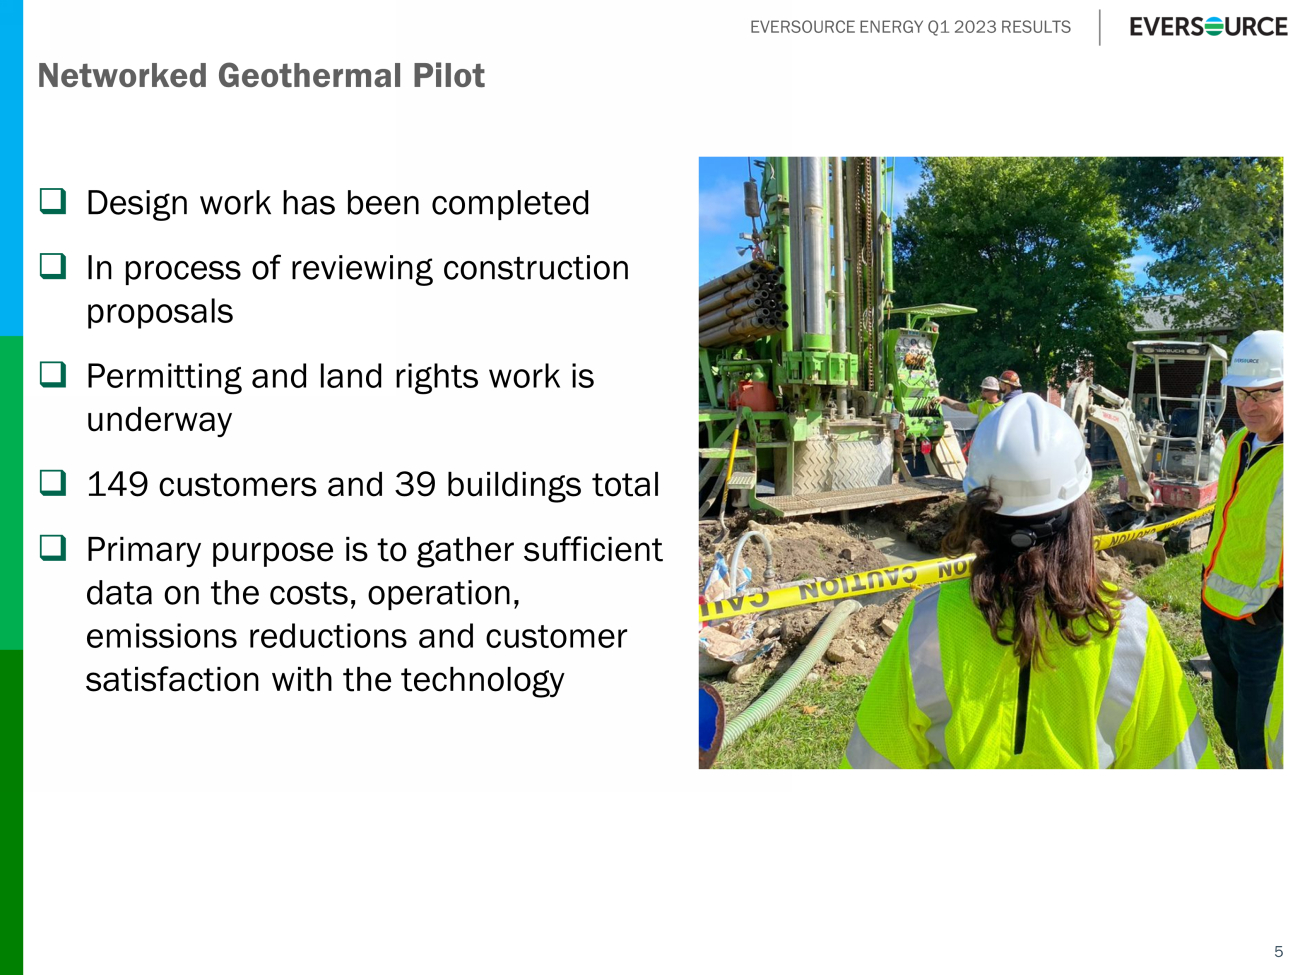
EVERSOURCE ENERGY Q1 2023 RESULTS □ Design work has been completed □ In process of reviewing construction proposals □ Permitting and land rights work is underway □ 149 customers and 39 buildings total □ Primary purpose is to gather sufficient data on the costs, operation, emissions reductions and customer satisfaction with the technology 5 Networked Geothermal Pilot

EVERSOURCE ENERGY Q1 2023 RESULTS 1Q 2023 1Q 2022 Change $0.45 $0.43 $0.02 0.47 0.41 0.06 0.49 0.47 0.02 0.00 0.01 (0.01) 0.00 (0.02) 0.02 $1.41 $1.30 $0.11 0.00 (0.02) 0.02 $1.41 $1.28 $0.13 Natural Gas Distribution Electric Transmission Electric Distribution Water Distribution Reported EPS (GAAP) 6 Parent & Other (Non - GAAP) EPS, Ex. Transaction/Transition Costs (Non - GAAP) Transaction/Transition Costs Q1 2023 vs. Q1 2022 Financial Results
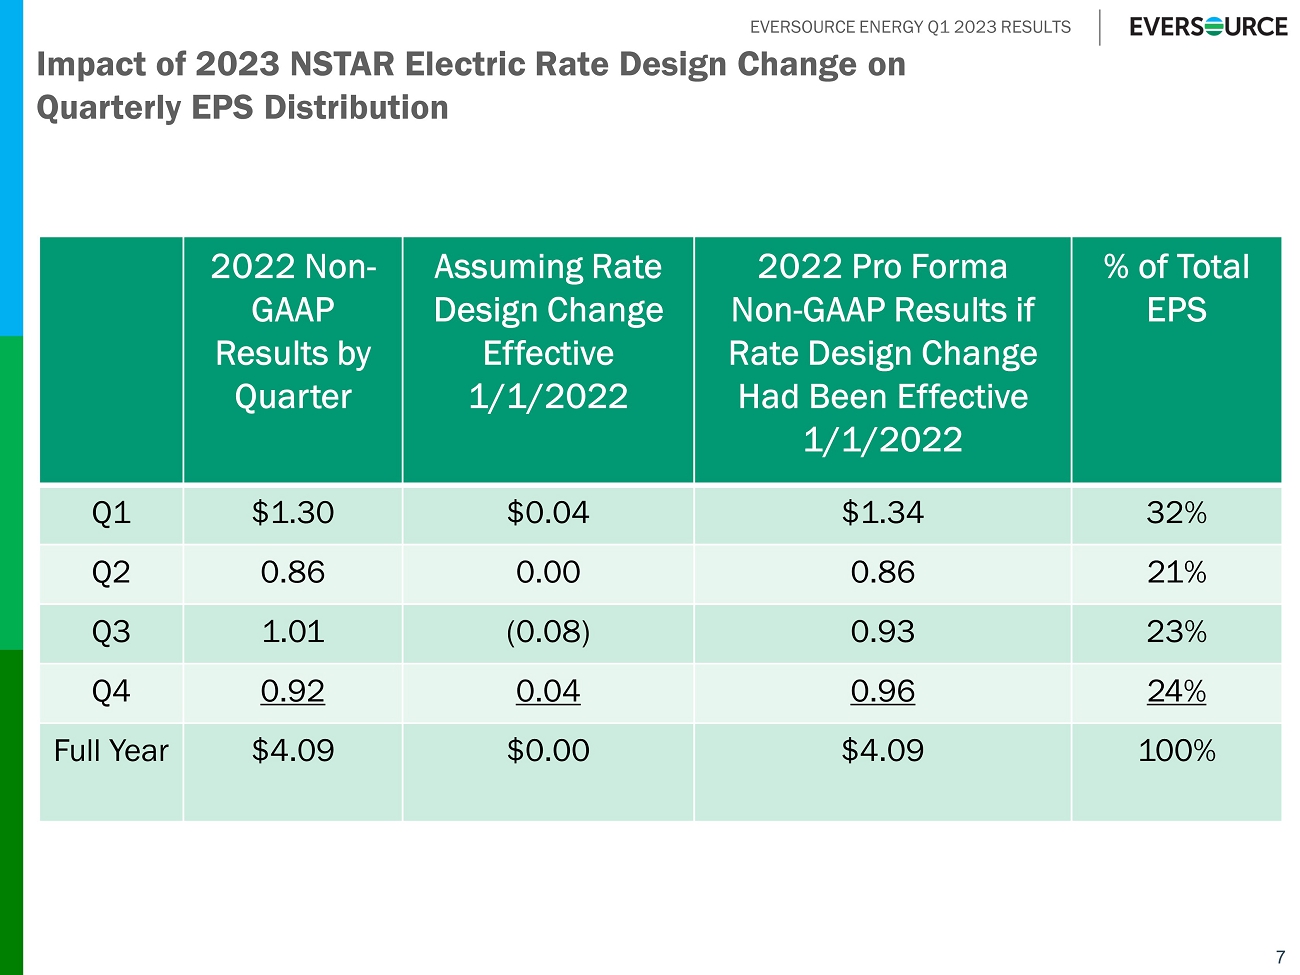
EVERSOURCE ENERGY Q1 2023 RESULTS 7 Impact of 2023 NSTAR Electric Rate Design Change on Quarterly EPS Distribution 2022 Non - GAAP Results by Quarter Assuming Rate Design Change Effective 1/1/2022 2022 Non - GAAP Pro Forma Results if Rate Design Change Had Been Effective 1/1/2022 % of Total EPS Q1 $1.30 $0.04 $1.34 32% Q2 0.86 0.00 0.86 21% Q3 1.01 (0.08) 0.93 23% Q4 0.92 0.04 0.96 24% Full Year $4.09 $0.00 $4.09 100%

EVERSOURCE ENERGY Q1 2023 RESULTS 8 Well Performing Core Businesses Drive EPS CAGR Solidly into Upper Half of 5 – 7% Through 2027 $2.28 $2.53 $2.65 $2.81 $2.96 $3.11 $3.25 $3.45 $3.64 $3.86 $4.09 $4.25 - $4.43 2012A* 2013A* 2014A* 2015A* 2016A 2017A 2018A 2019A* 2020A* 2021A* 2022A* 2023E* 2024E 2025E 2026E 2027E * Reflects non - GAAP results, excludes nonrecurring charges

EVERSOURCE ENERGY Q1 2023 RESULTS Equity Issuance Update New Shares □ $1.2 billion At - The - Market Program issued 2.17M shares at a weighted average price of $92.31 in 2022 with proceeds of approximately $200 million. □ No additional shares issued through April 2023 Treasury Shares □ Dividend reinvestment, employee equity programs continue with approximately 950,000 shares issued in 2022 □ Approximately 400,000 additional shares issued through April 2023 9

EVERSOURCE ENERGY Q1 2023 RESULTS 10 APPENDIX

EVERSOURCE ENERGY Q1 2023 RESULTS Projected Capital Expenditures For Core Businesses 11 $964 $1,115 $1,207 $1,196 $1,109 $1,012 $1,012 $956 $1,189 $1,244 $1,354 $1,847 $1,750 $1,768 $1,870 $1,628 $545 $799 $804 $1,035 $1,038 $1,146 $1,115 $918 $127 $144 $155 $170 $194 $203 $218 $235 $239 $239 $266 $215 $213 $244 $219 $208 $3,064 $3,541 $3,786 $4,463 $4,304 $4,373 $4,434 $3,945 $0 $500 $1,000 $1,500 $2,000 $2,500 $3,000 $3,500 $4,000 $4,500 $5,000 2020A 2021A 2022A 2023E 2024E 2025E 2026E 2027E Transmission Electric Distribution Natural Gas Distribution Water IT and Facilities $ In Millions $21.5 Billion 2023 - 2027

EVERSOURCE ENERGY Q1 2023 RESULTS Company Size/Coupon Maturity CL&P $400M @ 2.50% Jan 15, 2023 Parent $450M @ 2.80% May 1, 2023 Parent $350M @ SOFR + 25 b.p. Aug 15, 2023 PSNH $325M @ 3.50% Nov 1, 2023 NSTAR Electric $80M @ 3.88% Nov 15, 2023 Parent $400M @ 3.80% Dec 1, 2023 12 2023 Debt Issuances to Fund Utility Capital Needs and Maturities 2023 Issuances to Date 2023 Larger Maturities Company Size/Coupon Maturity CL&P $500M @ 5.25% Jan 15, 2053 PSNH $300M @ 5.15% Jan 15, 2053 Parent $750M @ 5.45% Mar 1, 2028


