EVERSOURCE ENERGY Q3 2023 RESULTS November 6, 2023 2023 Third Quarter Results Exhibit 99.3
EVERSOURCE ENERGY Q3 2023 RESULTS 1 Safe Harbor Statement All per - share amounts in this presentation are reported on a diluted basis. The only common equity securities that are publicly traded are common shares of Eversource Energy. The earnings discussion includes financial measures that are not recognized under generally accepted accounting principles (n on - GAAP) referencing earnings and EPS excluding the impairment charge for the offshore wind investment and certain transaction, transition and other charge s. EPS by business is also a non - GAAP financial measure and is calculated by dividing the net income attributable to common shareholders of each business by the we igh ted average diluted Eversource Energy common shares outstanding for the period. The earnings and EPS of each business do not represent a direct legal interest in t he assets and liabilities of such business, but rather represent a direct interest in Eversource Energy’s assets and liabilities as a whole. Eversource Energy uses these non - GAAP financial measures to evaluate and provide details of earnings results by business and to more fully compare and explain results without including these ite ms. This information is among the primary indicators management uses as a basis for evaluating performance and planning and forecasting of future periods. Management b eli eves the impacts of the impairment charge for the offshore wind investment and transaction, transition and other charges are not indicative of Eversource Energy ’s ongoing costs and performance. Management views these charges as not directly related to the ongoing operations of the business and therefore not an indicat or of baseline operating performance. Due to the nature and significance of the effect of these items on net income attributable to common shareholder s a nd EPS, management believes that the non - GAAP presentation is a more meaningful representation of Eversource Energy’s financial performance and provides additional a nd useful information to readers in analyzing historical and future performance of the business. These non - GAAP financial measures should not be considered as alternatives to Eversource Energy’s reported net income attributable to common shareholders or EPS determined in accordance with GAAP as indicators of Eversource En ergy’s operating performance. This document includes statements concerning Eversource Energy’s expectations, beliefs, plans, objectives, goals, strategies, assu mpt ions of future events, future financial performance or growth and other statements that are not historical facts. These statements are “forward - looking statements” with in the meaning of the Private Securities Litigation Reform Act of 1995. Generally, readers can identify these forward - looking statements through the use of words or phrases such as “estimate,” “expec t,” “anticipate,” “intend,” “plan,” “project,” “believe,” “forecast,” “should,” “could” and other similar expressions. Forward - looking statements involve risks and uncertainties that may cause actual results or outcomes to differ materially from those included in the forward - looking statements. Forward - lo oking statements are based on the current expectations, estimates, assumptions or projections of management and are not guarantees of future performance. These ex pectations, estimates, assumptions or projections may vary materially from actual results. Accordingly, any such statements are qualified in their entirety by r efe rence to, and are accompanied by, the following important factors that may cause our actual results or outcomes to differ materially from those contained in our fo rwa rd - looking statements, including, but not limited to: cyberattacks or breaches, including those resulting in the compromise of the confidentiality of our proprietary i nfo rmation and the personal information of our customers; disruptions in the capital markets or other events that make our access to necessary capital more difficult or cos tly ; changes in economic conditions, including impact on interest rates, tax policies, and customer demand and payment ability; ability or inability to commence and complet e o ur major strategic development projects and opportunities; the ability to sell Eversource’s 50 percent interest in three offshore wind projects under development on the timeline we expect, to satisfy the investment tax credit qualifications related to the tax equity investment in the South Fork Wind project, and the ability of the Revolution Wind and Sunrise Wind projects to qualify for the investment tax credit adders, and to successfully rebid the Sunrise Wind OREC contract at an increased value; ac ts of war or terrorism, physical attacks or grid disturbances that may damage and disrupt our electric transmission and electric, natural gas, and water distribution sys tem s; actions or inaction of local, state and federal regulatory, public policy and taxing bodies; substandard performance of third - party suppliers and service providers; flu ctuations in weather patterns, including extreme weather due to climate change; changes in business conditions, which could include disruptive technology or developme nt of alternative energy sources related to our current or future business model; contamination of, or disruption in, our water supplies; changes in levels or timing of capital expenditures; changes in laws, regulations or regulatory policy, including compliance with environmental laws and regulations; changes in accounting standar ds and financial reporting regulations; actions of rating agencies; and other presently unknown or unforeseen factors. Other risk factors are detailed in Eversource Energy’s reports filed with the Securities and Exchange Commission (SEC). They ar e updated as necessary and available on Eversource Energy’s website at www.eversource.com and on the SEC’s website at www.sec.gov. All such factors are difficult to pr edict and contain uncertainties that may materially affect Eversource Energy’s actual results, many of which are beyond our control. You should not place undue relia nce on the forward - looking statements, as each speaks only as of the date on which such statement is made, and, except as required by federal securities laws, Eversour ce Energy undertakes no obligation to update any forward - looking statement or statements to reflect events or circumstances after the date on which such statement is made or to reflect the occurrence of unanticipated events.

EVERSOURCE ENERGY Q3 2023 RESULTS Agenda 2 Joe Nolan Chairman, President & CEO □ Offshore Wind Update □ Supply Prices and Customer Initiatives □ Clean Energy Transition John Moreira EVP, CFO & Treasurer □ Q3 2023 Financial Results □ Offshore Wind Investment Update □ Cash Flow Update
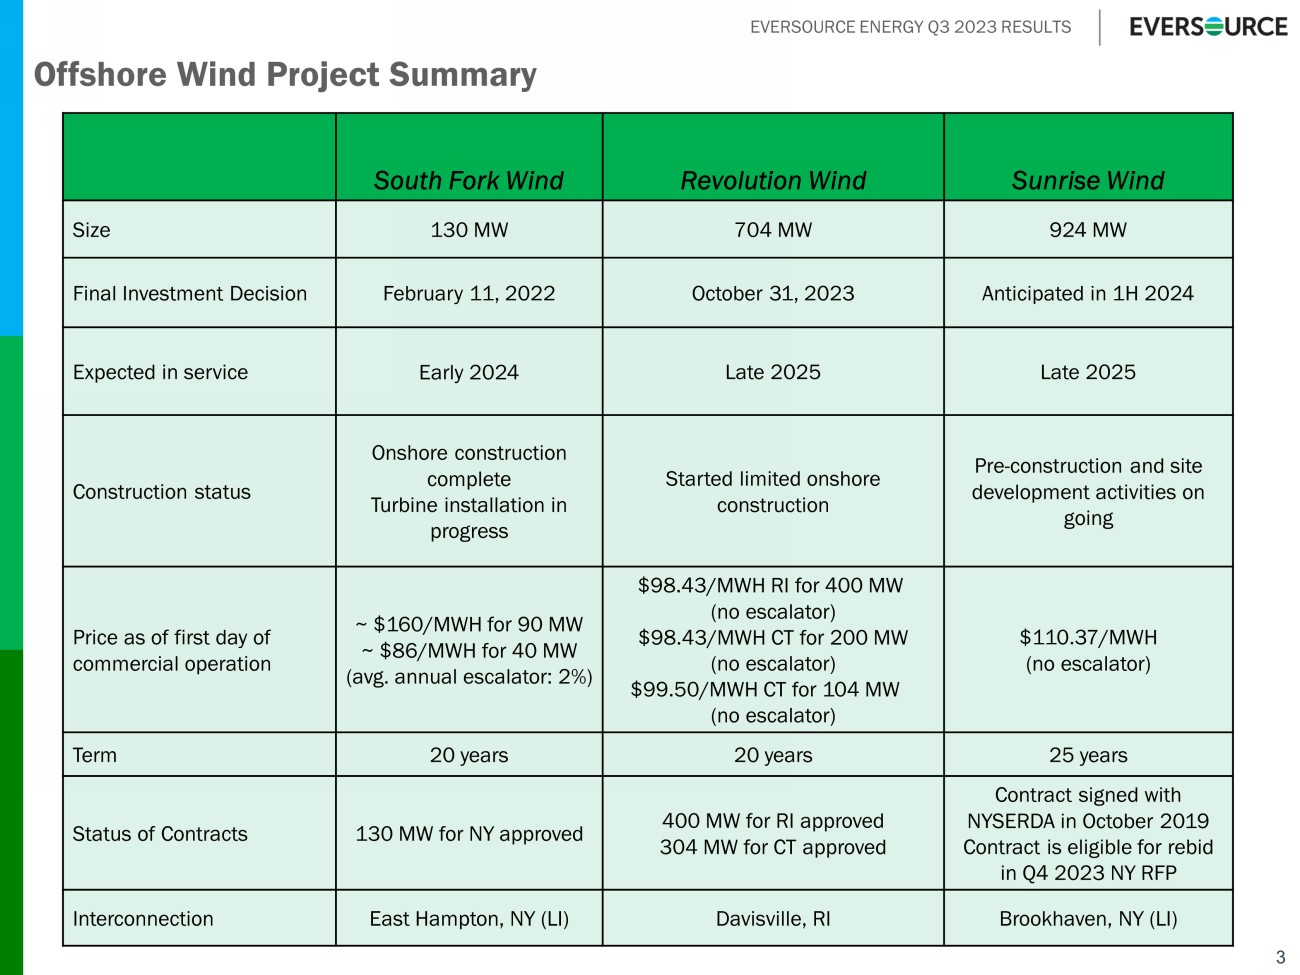
EVERSOURCE ENERGY Q3 2023 RESULTS 3 Offshore Wind Project Summary South Fork Wind Revolution Wind Sunrise Wind Size 130 MW 704 MW 924 MW Final Investment Decision February 11, 2022 October 31, 2023 Anticipated in 1H 2024 Expected in service Early 2024 Late 2025 Late 2025 Construction status Onshore construction complete Turbine installation in progress Started limited onshore construction Pre - construction and site development activities on going Price as of first day of commercial operation ~ $160/MWH for 90 MW ~ $86/MWH for 40 MW (avg. annual escalator: 2%) $98.43/MWH RI for 400 MW (no escalator) $98.43/MWH CT for 200 MW (no escalator) $99.50/MWH CT for 104 MW (no escalator) $110.37/MWH (no escalator) Term 20 years 20 years 25 years Status of Contracts 130 MW for NY approved 400 MW for RI approved 304 MW for CT approved Contract signed with NYSERDA in October 2019 Contract is eligible for rebid in Q4 2023 NY RFP Interconnection East Hampton, NY (LI) Davisville, RI Brookhaven, NY (LI)
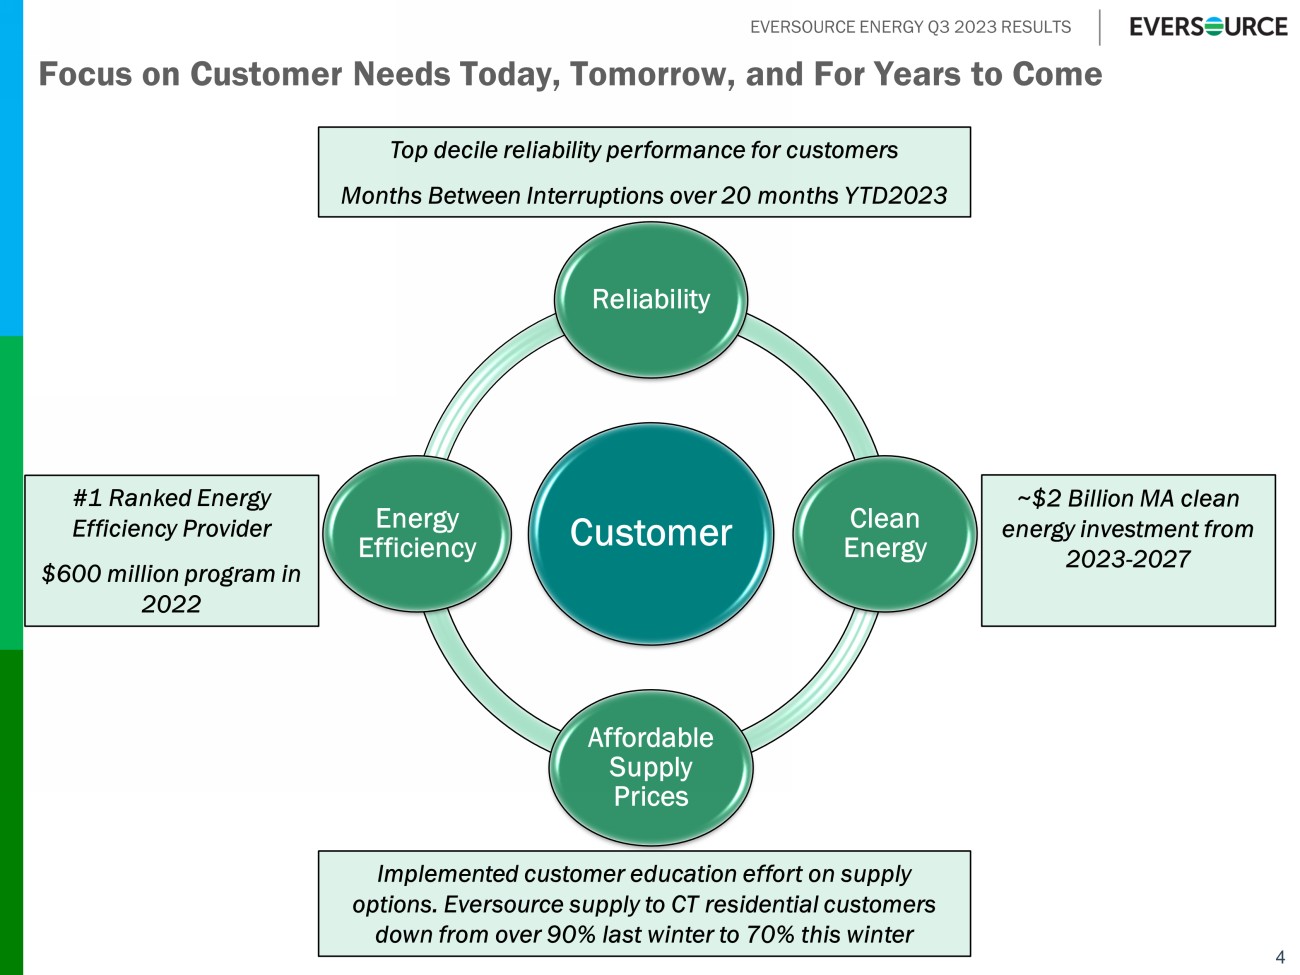
EVERSOURCE ENERGY Q3 2023 RESULTS Focus on Customer Needs Today, Tomorrow, and For Years to Come 4 Customer Reliability Clean Energy Affordable Supply Prices Energy Efficiency #1 Ranked Energy Efficiency Provider $600 million program in 2022 Top decile reliability performance for customers Months Between Interruptions over 20 months YTD2023 Implemented customer education effort on supply options. Eversource supply to CT residential customers down from over 90% last winter to 70% this winter ~$2 Billion MA clean energy investment from 2023 - 2027
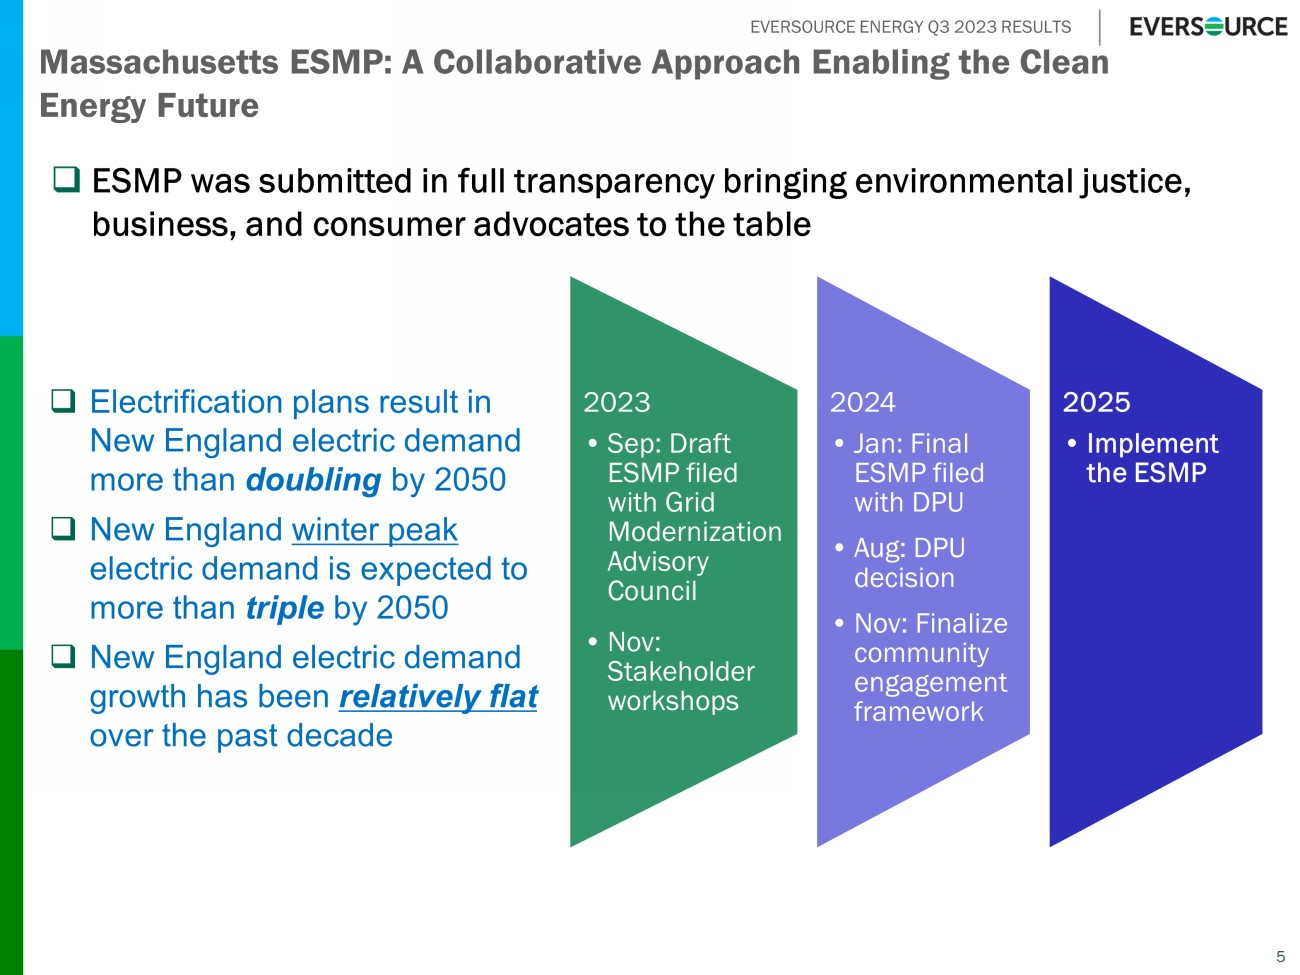
EVERSOURCE ENERGY Q3 2023 RESULTS 5 Massachusetts ESMP: A Collaborative Approach Enabling the Clean Energy Future 2023 • Sep: Draft ESMP filed with Grid Modernization Advisory Council • Nov: Stakeholder workshops 2024 • Jan: Final ESMP filed with DPU • Aug: DPU decision • Nov: Finalize community engagement framework 2025 • Implement the ESMP □ ESMP was submitted in full transparency bringing environmental justice, business, and consumer advocates to the table □ Electrification plans result in New England electric demand more than doubling by 2050 □ New England winter peak electric demand is expected to more than triple by 2050 □ New England electric demand growth has been relatively flat over the past decade
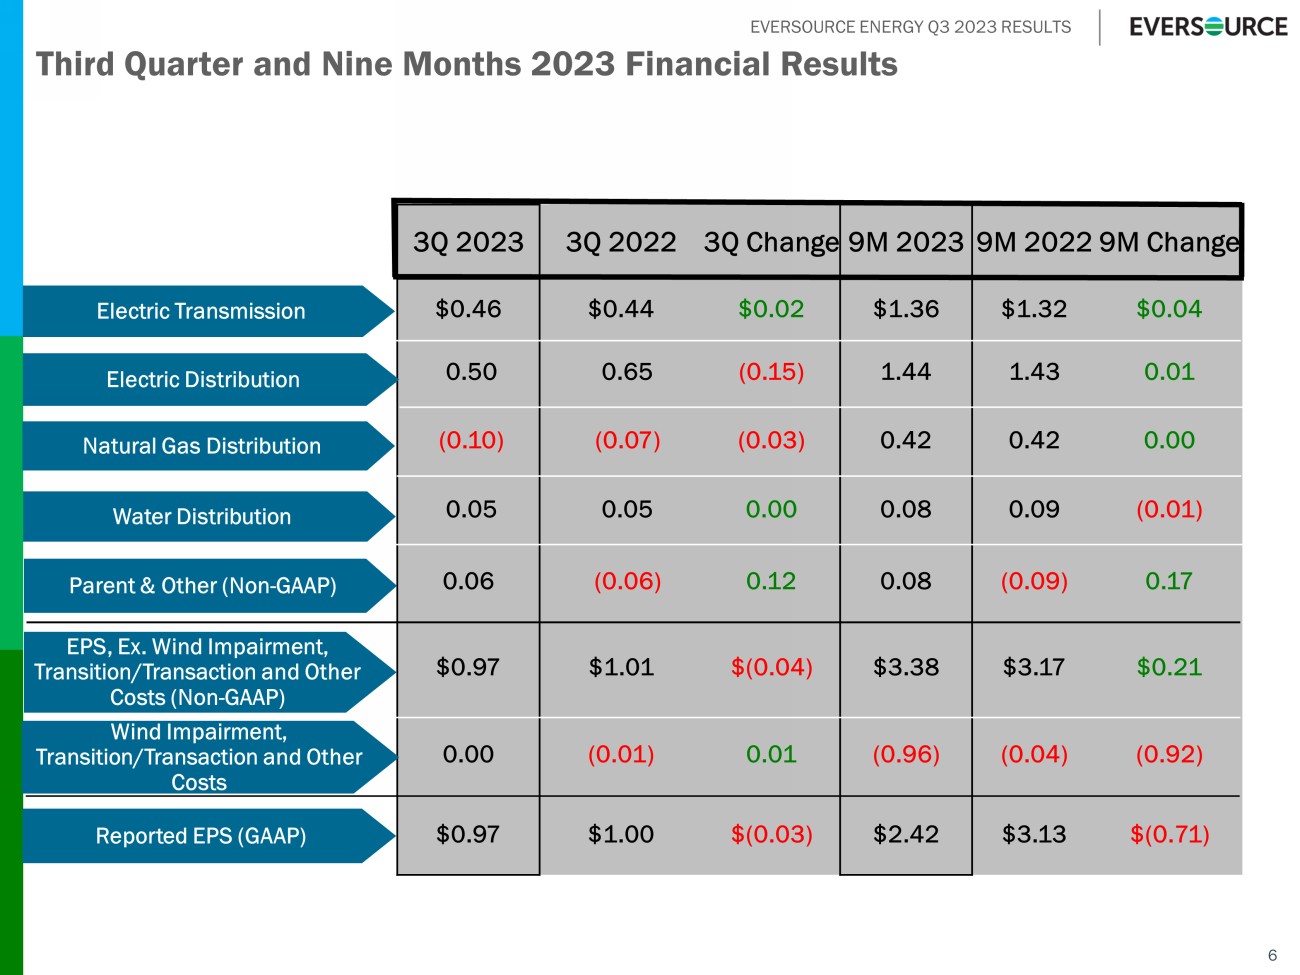
EVERSOURCE ENERGY Q3 2023 RESULTS 6 3Q 2023 3Q 2022 3Q Change 9M 2023 9M 2022 9M Change $0.46 $0.44 $0.02 $1.36 $1.32 $0.04 0.50 0.65 (0.15) 1.44 1.43 0.01 (0.10) (0.07) (0.03) 0.42 0.42 0.00 0.05 0.05 0.00 0.08 0.09 (0.01) 0.06 (0.06) 0.12 0.08 (0.09) 0.17 $0.97 $1.01 $(0.04) $3.38 $3.17 $0.21 0.00 (0.01) 0.01 (0.96) (0.04) (0.92) $0.97 $1.00 $(0.03) $2.42 $3.13 $(0.71) Electric Transmission Electric Distribution Natural Gas Distribution Parent & Other (Non - GAAP) Water Distribution EPS, Ex. Wind Impairment, Transition/Transaction and Other Costs (Non - GAAP) Wind Impairment, Transition/Transaction and Other Costs Reported EPS (GAAP) Third Quarter and Nine Months 2023 Financial Results
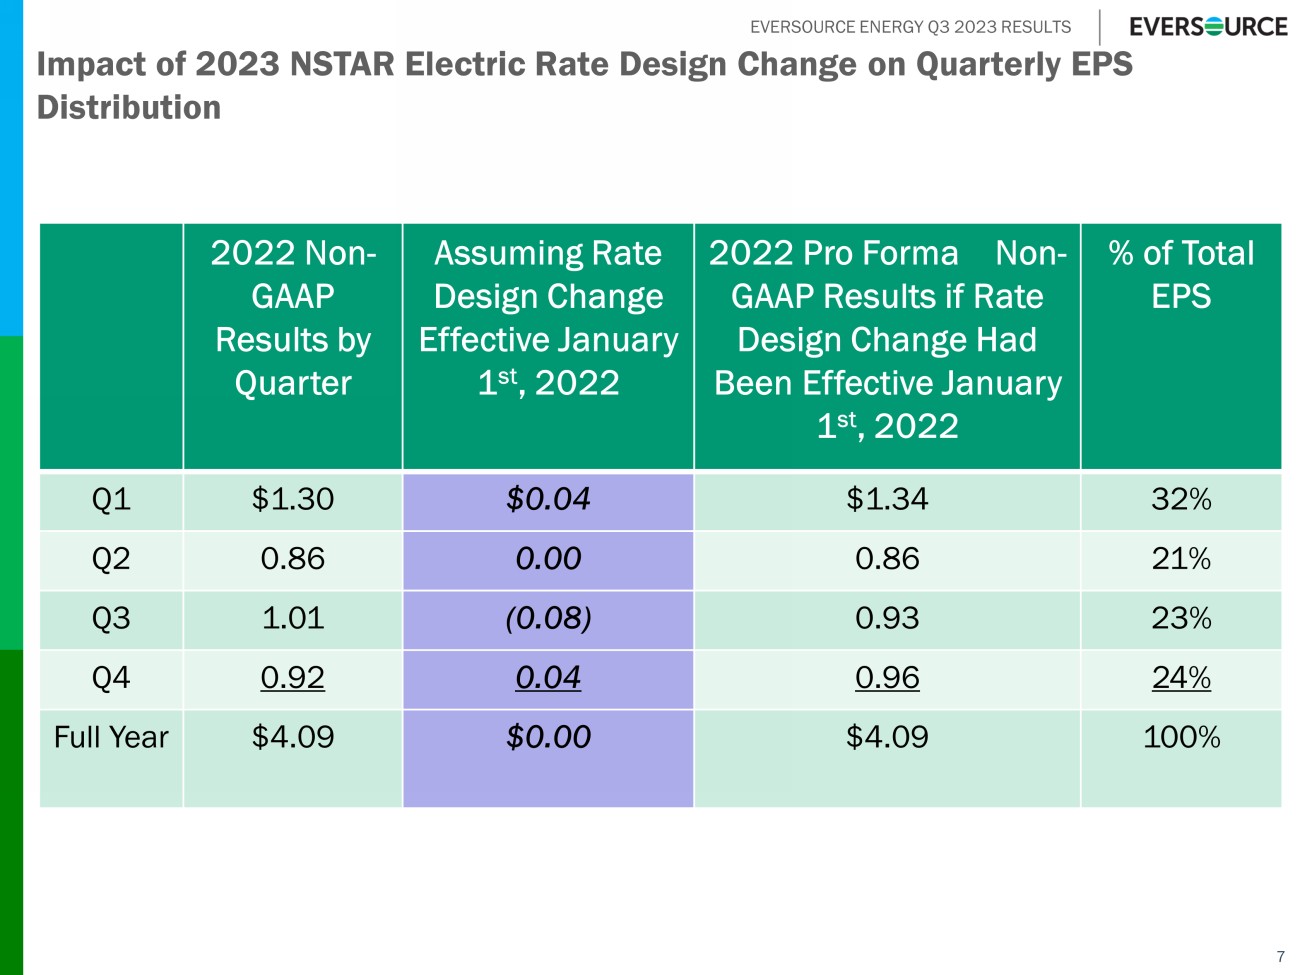
EVERSOURCE ENERGY Q3 2023 RESULTS 7 Impact of 2023 NSTAR Electric Rate Design Change on Quarterly EPS Distribution 2022 Non - GAAP Results by Quarter Assuming Rate Design Change Effective January 1 st , 2022 2022 Pro Forma Non - GAAP Results if Rate Design Change Had Been Effective January 1 st , 2022 % of Total EPS Q1 $1.30 $0.04 $1.34 32% Q2 0.86 0.00 0.86 21% Q3 1.01 (0.08) 0.93 23% Q4 0.92 0.04 0.96 24% Full Year $4.09 $0.00 $4.09 100%
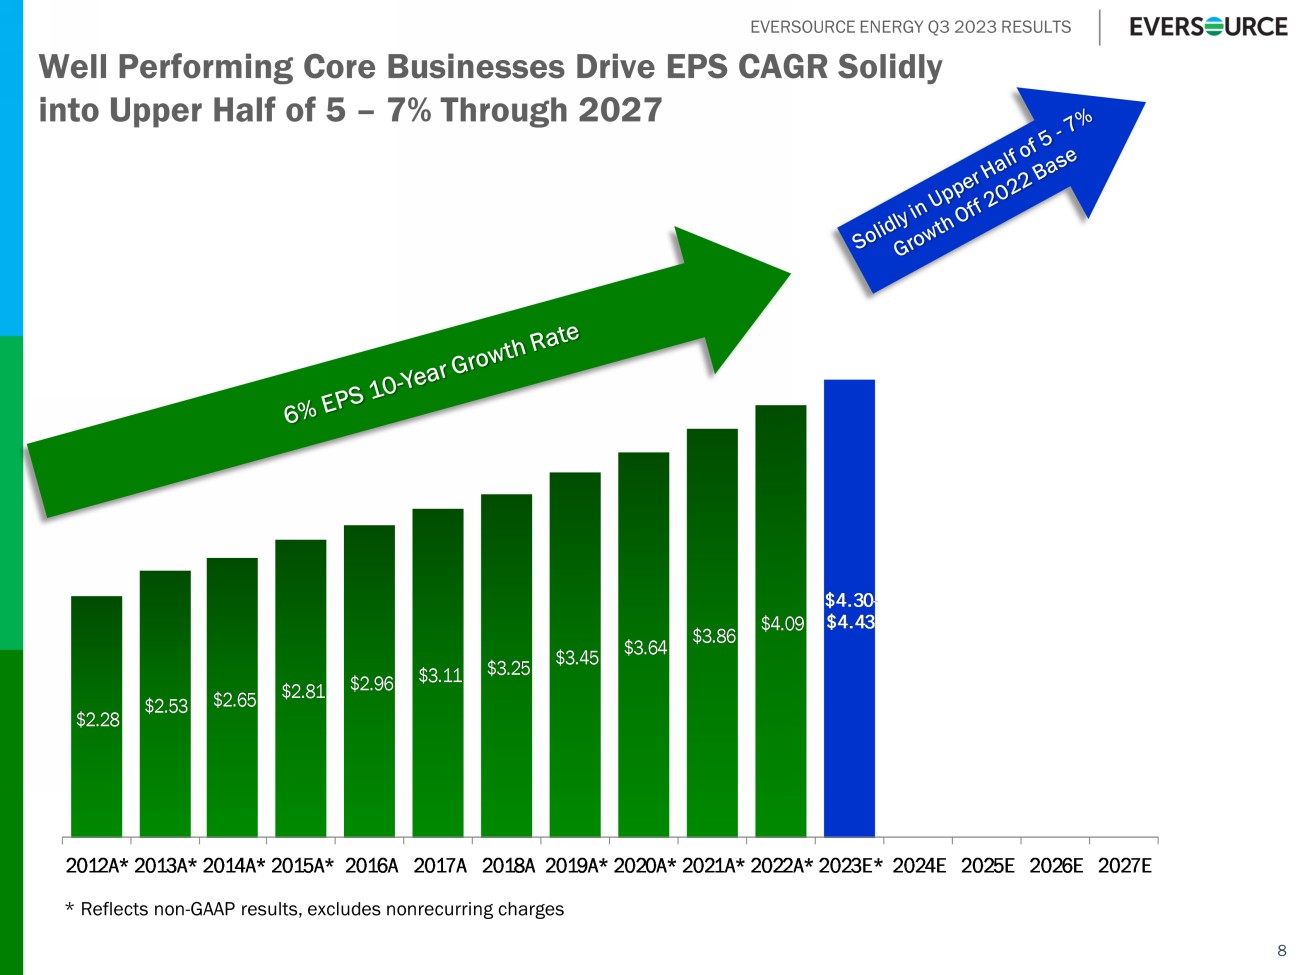
EVERSOURCE ENERGY Q3 2023 RESULTS 8 Well Performing Core Businesses Drive EPS CAGR Solidly into Upper Half of 5 – 7% Through 2027 $2.28 $2.53 $2.65 $2.81 $2.96 $3.11 $3.25 $3.45 $3.64 $3.86 $4.09 $4.30 - $4.43 2012A* 2013A* 2014A* 2015A* 2016A 2017A 2018A 2019A* 2020A* 2021A* 2022A* 2023E* 2024E 2025E 2026E 2027E * Reflects non - GAAP results, excludes nonrecurring charges
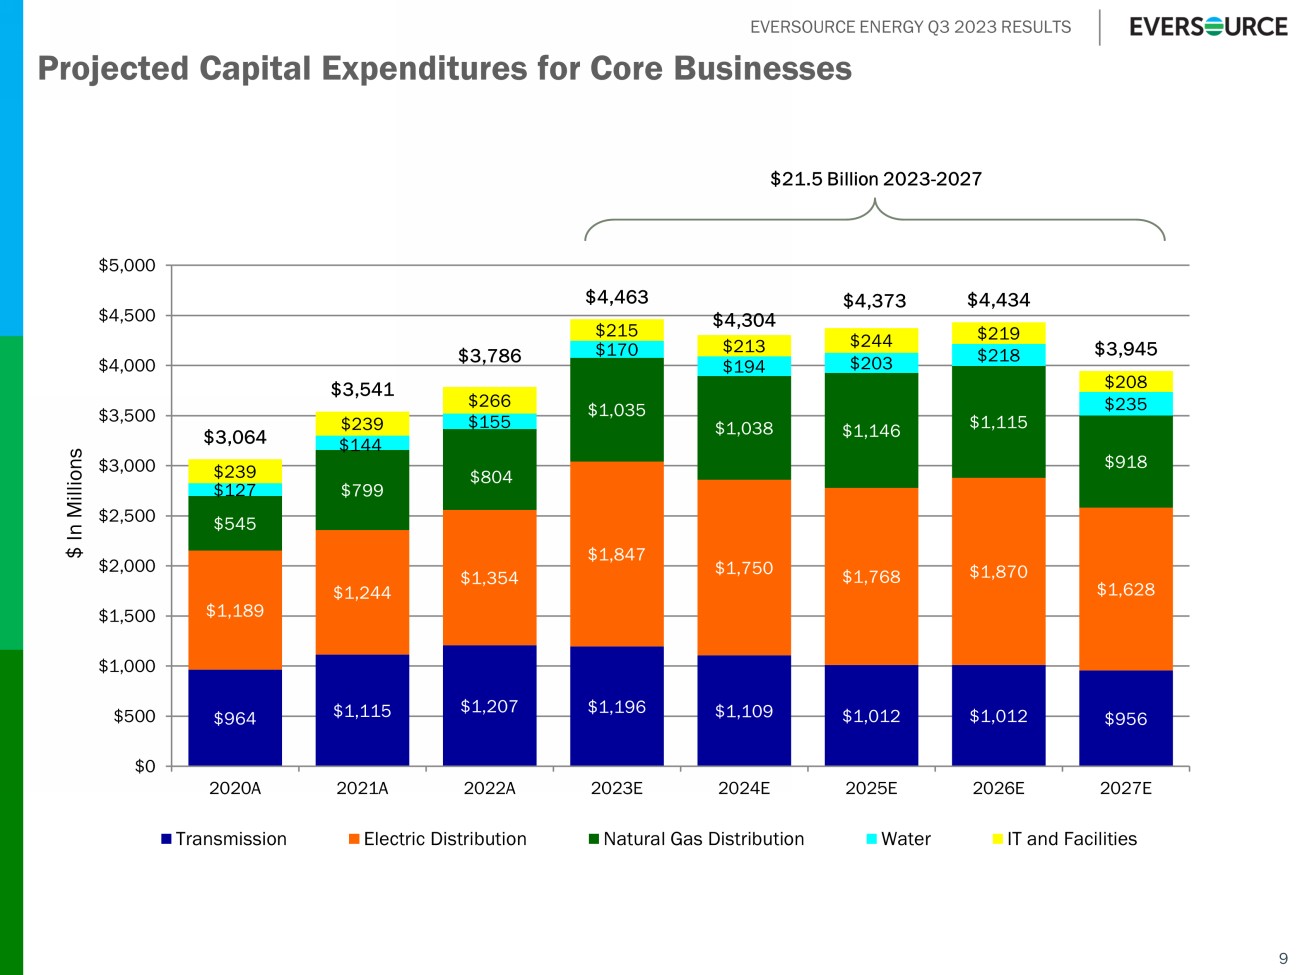
EVERSOURCE ENERGY Q3 2023 RESULTS Projected Capital Expenditures for Core Businesses 9 $964 $1,115 $1,207 $1,196 $1,109 $1,012 $1,012 $956 $1,189 $1,244 $1,354 $1,847 $1,750 $1,768 $1,870 $1,628 $545 $799 $804 $1,035 $1,038 $1,146 $1,115 $918 $127 $144 $155 $170 $194 $203 $218 $235 $239 $239 $266 $215 $213 $244 $219 $208 $3,064 $3,541 $3,786 $4,463 $4,304 $4,373 $4,434 $3,945 $0 $500 $1,000 $1,500 $2,000 $2,500 $3,000 $3,500 $4,000 $4,500 $5,000 2020A 2021A 2022A 2023E 2024E 2025E 2026E 2027E Transmission Electric Distribution Natural Gas Distribution Water IT and Facilities $ In Millions $21.5 Billion 2023 - 2027

EVERSOURCE ENERGY Q3 2023 RESULTS Company Size/Coupon Maturity Parent $450M @ 2.80% May 1, 2023 Parent $350M @ SOFR + 25 bps. Aug 15, 2023 Parent $400M @ 3.80% Dec 1, 2023 10 2023 Parent Debt and Equity Issuances and Maturities 2023 Debt Issuances through October 2023 Maturities Company Size/Coupon Maturity Parent $750M @ 5.45% Mar 1, 2028 Parent $550M @ 5.45% Mar 1, 2028 Parent $450M @ 4.75% May 15, 2026 Parent $800M @ 5.125% May 15, 2033 New Shares □ $1.2 billion At - The - Market Program issued 2.17M shares at a weighted average price of $92.31 in 2022 with proceeds of approximately $200 million. □ No additional shares issued through October 2023 Treasury Shares □ Dividend reinvestment, employee equity programs continue with approximately 950,000 shares issued in 2022 □ Approximately 882,000 additional shares issued through October 2023 2023 Equity Issuances through October


