Exhibit 99.3
EVERSOURCE ENERGY Q1 2024 EARNINGS REPORT EVERSOURCE ENERGY Q1 2024 EARNINGS REPORT MAY 2, 2024 CUSTOMER COMMUNITY FINANCIAL EMPLOYEE CLEAN ENERGY RELIABILITY
EVERSOURCE ENERGY Q1 2024 EARNINGS REPORT Safe Harbor Statement 1 All per - share amounts in this presentation are reported on a diluted basis. The only common equity securities that are publicly traded are common shares of Eversource Energy. The earnings discussion includes financial measures that are not recognized under generally accepted accounting principles (non - GAAP) referencing earnings and EP S excluding the 2023 impairment charges for the offshore wind investments and certain transaction, transition and other charges. EPS by business is also a non - GAAP financial measure and is calculated by di viding the net income attributable to common shareholders of each business by the weighted average diluted Eversource Energy common shares outstanding for the period. The earnings and EPS of each business do no t represent a direct legal interest in the assets and liabilities of such business, but rather represent a direct interest in Eversource Energy’s assets and liabilities as a whole. Eversource Energy uses thes e n on - GAAP financial measures to evaluate and provide details of earnings results by business and to more fully compare and explain results without including these items. This information is among the primary ind icators management uses as a basis for evaluating performance and planning and forecasting of future periods. Management believes the impacts of the impairment charges for the offshore wind investments an d t ransaction; transition and other charges are not indicative of Eversource Energy’s ongoing costs and performance. Management views these charges as not directly related to the ongoing operations of the busin ess and therefore not an indicator of baseline operating performance. Due to the nature and significance of the effect of these items on net income attributable to common shareholders and EPS, management be lie ves that the non - GAAP presentation is a more meaningful representation of Eversource Energy’s financial performance and provides additional and useful information to readers in analyzing historical a nd future performance of the business. These non - GAAP financial measures should not be considered as alternatives to Eversource Energy’s reported net income attributable to common shareholders or EPS determine d i n accordance with GAAP as indicators of Eversource Energy’s operating performance. This document includes statements concerning Eversource Energy’s expectations, beliefs, plans, objectives, goals , s trategies, assumptions of future events, future financial performance or growth and other statements that are not historical facts. These statements are “forward - looking statements” within the meaning of the Private Securities Litigation Reform Act of 1995. Generally, readers can identify these forward - looking statements through the use of words or phrases such as “estimate,” “expect,” “anticipate,” “intend,” “plan ,” “project,” “believe,” “forecast,” “should,” “could” and other similar expressions. Forward - looking statements involve risks and uncertainties that may cause actual results or outcomes to differ materially from t hose included in the forward - looking statements. Forward - looking statements are based on the current expectations, estimates, assumptions or projections of management and are not guarantees of future perfo rma nce. These expectations, estimates, assumptions or projections may vary materially from actual results. Accordingly, any such statements are qualified in their entirety by reference to, and are acc omp anied by, the following important factors that may cause our actual results or outcomes to differ materially from those contained in our forward - looking statements, including, but not limited to: cyberattacks or brea ches, including those resulting in the compromise of the confidentiality of our proprietary information and the personal information of our customers; our ability to complete the offshore wind investments sales proces s o n the timelines, terms and pricing we expect; if we and the potential purchasers are unable to reach the definitive agreements necessary to consummate the purchase and sale transactions; if we are unable to qua lif y for investment tax credits related to these projects; if we experience variability in the projected construction costs of the offshore wind projects, if there is a deterioration of market conditions in the offsh ore wind industry; and if the projects do not commence operation as scheduled or within budget or are not completed, disruptions in the capital markets or other events that make our access to necessary capital mor e d ifficult or costly; changes in economic conditions, including impact on interest rates, tax policies, and customer demand and payment ability; ability or inability to commence and complete our major strategic deve lop ment projects and opportunities; acts of war or terrorism, physical attacks or grid disturbances that may damage and disrupt our electric transmission and electric, natural gas, and water distribution systems; ac tions or inaction of local, state and federal regulatory, public policy and taxing bodies; substandard performance of third - party suppliers and service providers; fluctuations in weather patterns, including extreme weat her due to climate change; changes in business conditions, which could include disruptive technology or development of alternative energy sources related to our current or future business model; contamina tio n of, or disruption in, our water supplies; changes in levels or timing of capital expenditures; changes in laws, regulations or regulatory policy, including compliance with environmental laws and regulations ; c hanges in accounting standards and financial reporting regulations; actions of rating agencies; and other presently unknown or unforeseen factors. Other risk factors are detailed in Eversource Energy’s reports filed with the Securities and Exchange Commission (SEC). They ar e updated as necessary and available on Eversource Energy’s website at www.eversource.com and on the SEC’s website at www.sec.gov . All such factors are difficult to predict and contain uncertainties that may materially affect Eversource Energy’s actual res ults, many of which are beyond our control. You should not place undue reliance on the forward - looking statements, as each speaks only as of the date o n which such statement is made, and, except as required by federal securities laws, Eversource Energy undertakes no obligation to update any forward - looking statement or statements to reflect events or circ umstances after the date on which such statement is made or to reflect the occurrence of unanticipated events.

EVERSOURCE ENERGY Q1 2024 EARNINGS REPORT Agenda Business Update ▪ Offshore Wind Update ▪ Operational Excellence ▪ Progress on Meeting Aggressive Climate Goals 2 Joe Nolan Chairman, President & CEO John Moreira EVP, CFO & Treasurer Financial Update ▪ Q1 2024 Financial Results ▪ Regulatory Update ▪ Drivers for Cash Flow Enhancement
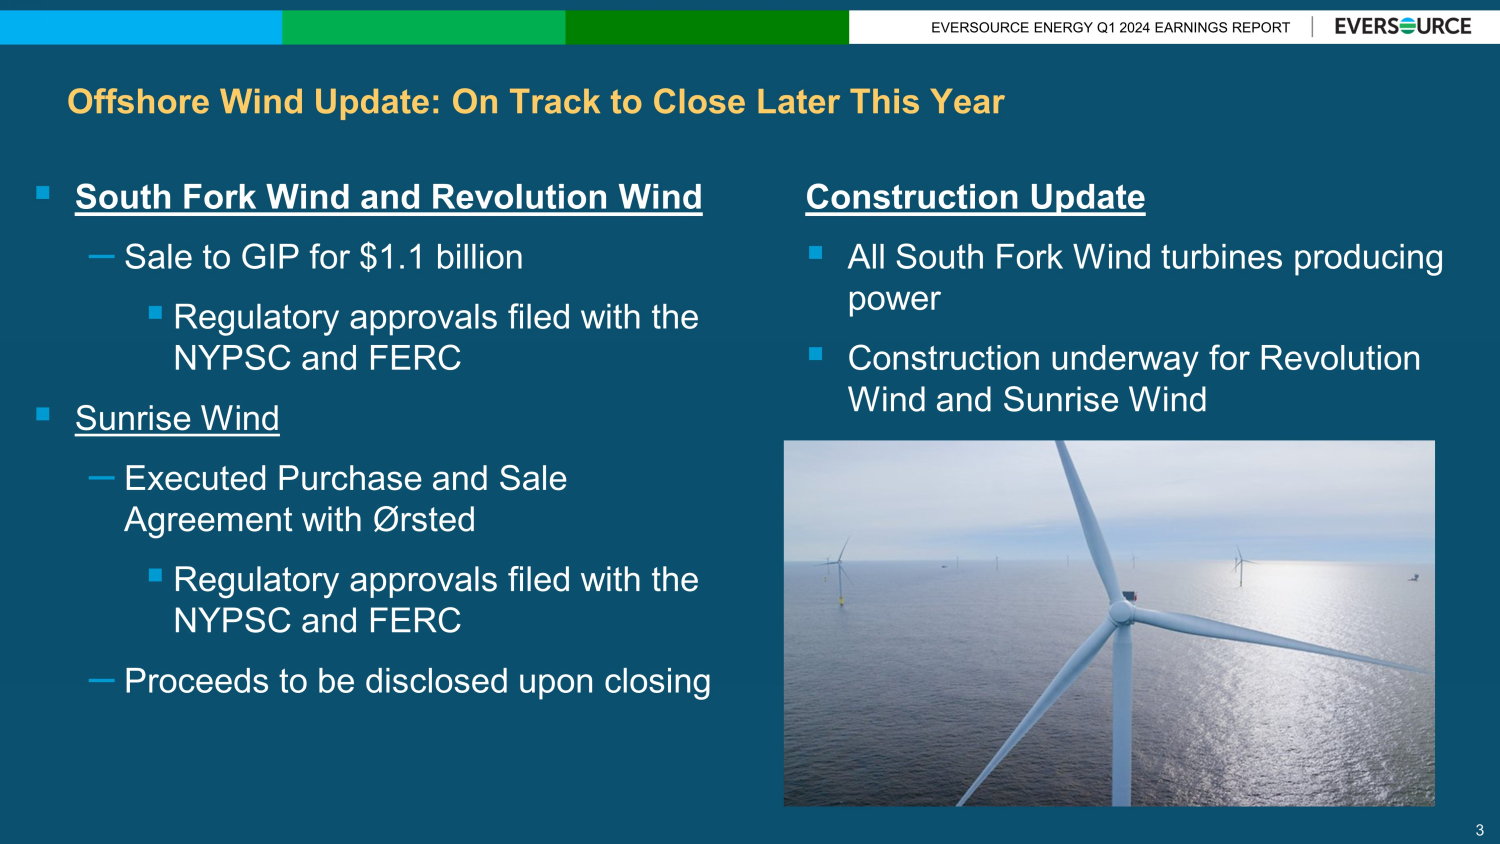
EVERSOURCE ENERGY Q1 2024 EARNINGS REPORT Offshore Wind Update: On Track to Close Later This Year ▪ South Fork Wind and Revolution Wind – Sale to GIP for $1.1 billion ▪ Regulatory approvals filed with the NYPSC and FERC ▪ Sunrise Wind – Executed Purchase and Sale Agreement with Ørsted ▪ Regulatory approvals filed with the NYPSC and FERC – Proceeds to be disclosed upon closing 3 Construction Update ▪ All South Fork Wind turbines producing power ▪ Construction underway for Revolution Wind and Sunrise Wind
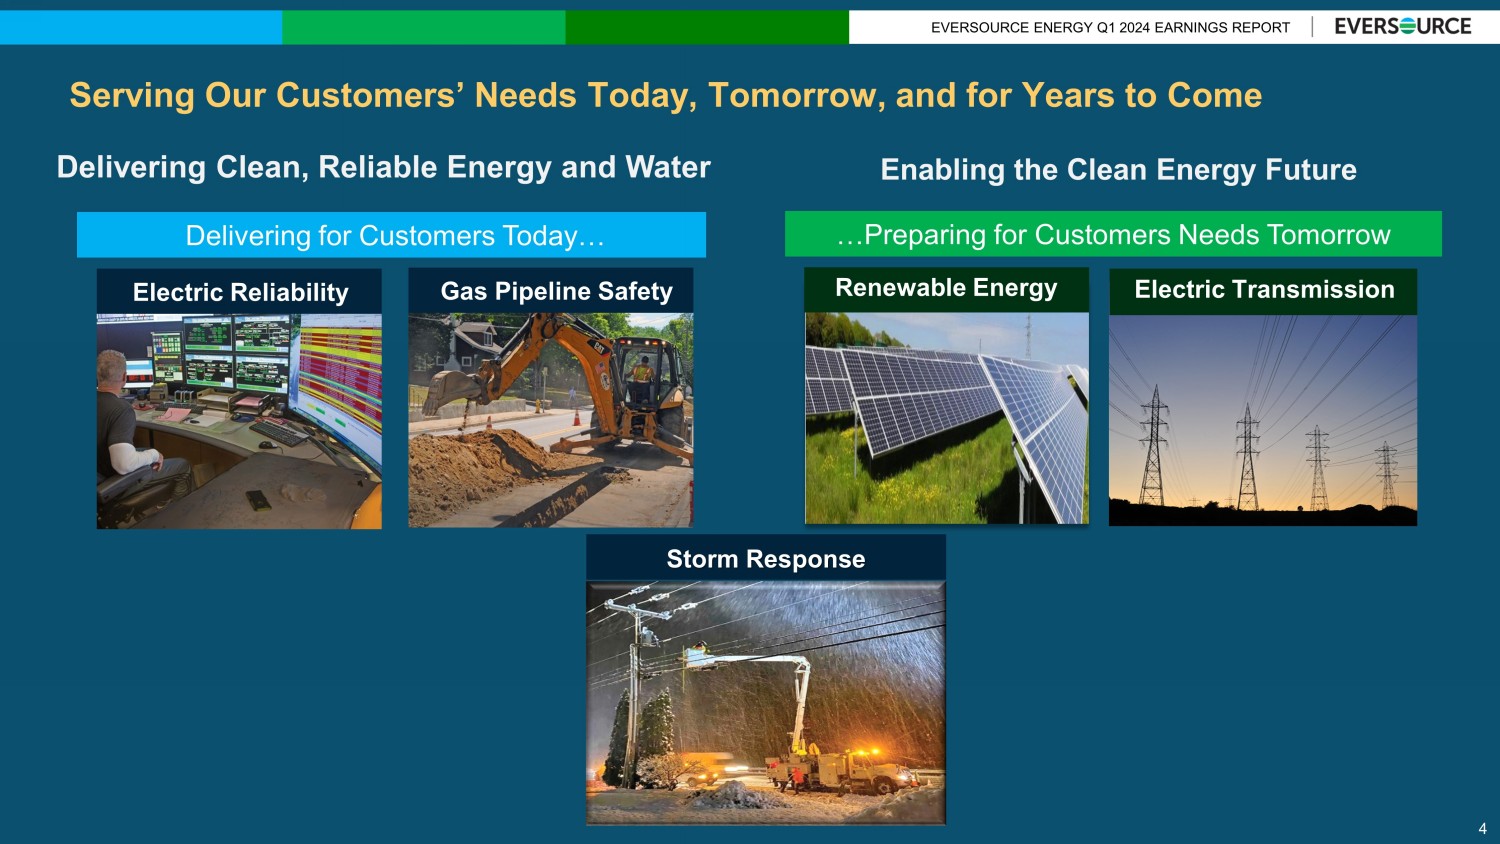
EVERSOURCE ENERGY Q1 2024 EARNINGS REPORT Serving Our Customers’ Needs Today, Tomorrow, and for Years to Come Delivering for Customers Today… Enabling the Clean Energy Future Delivering Clean, Reliable Energy and Water …Preparing for Customers Needs Tomorrow Electric Reliability Gas Pipeline Safety Renewable Energy Electric Transmission Storm Response 4
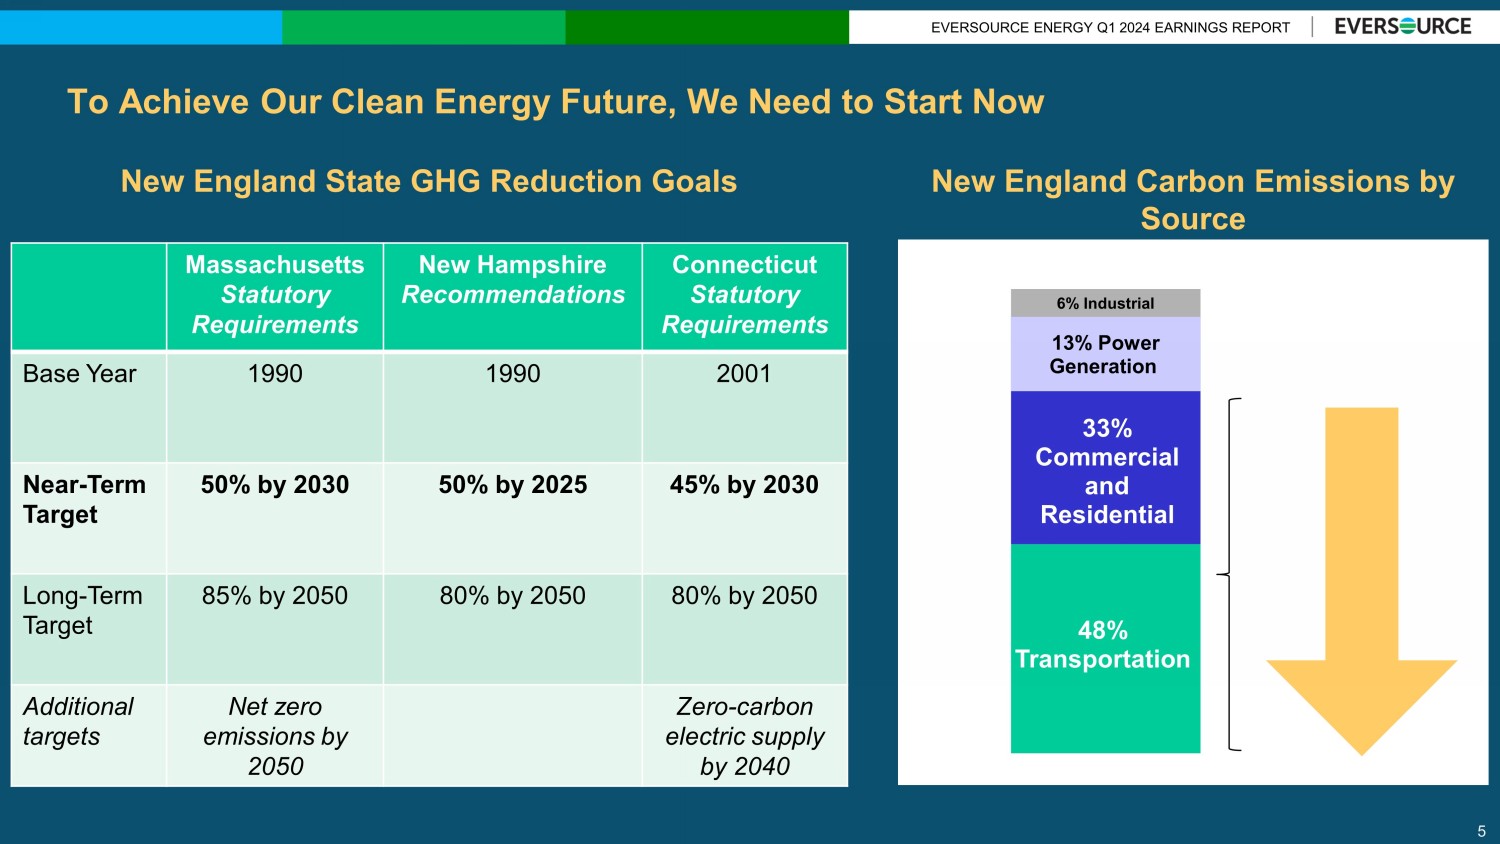
EVERSOURCE ENERGY Q1 2024 EARNINGS REPORT To Achieve Our Clean Energy Future, We Need to Start Now 5 Massachusetts Statutory Requirements New Hampshire Recommendations Connecticut Statutory Requirements Base Year 1990 1990 2001 Near - Term Target 50% by 2030 50% by 2025 45% by 2030 Long - Term Target 85% by 2050 80% by 2050 80% by 2050 Additional targets Net zero emissions by 2050 Zero - carbon electric supply by 2040 48% Transportation 33% Commercial and Residential 13% Power Generation 6% Industrial New England State GHG Reduction Goals New England Carbon Emissions by Source

EVERSOURCE ENERGY Q1 2024 EARNINGS REPORT Electric Sector Modernization Plan A Comprehensive Roadmap to Achieve Massachusetts’ Clean Energy Goals 6 SYSTEM PLANNING PROCESS Incorporated MA’s anticipated demand growth assumptions for EV adoption and electric heating Analyzed expected growth by region, community and circuit Identified areas where system upgrades are needed, focusing first on lowest - cost options and non - wires alternatives Leveraged formal stakeholder engagement process to seek communities’ perspectives before projects proceed to siting PLAN TO ENHANCE THE GRID & ENABLE CLEAN ENERGY IDENTIFIES NEEDED INVESTMENTS OVER THE NEXT 10 YEARS to support clean energy resources and drive improvements in grid reliability and resiliency Increases electrification hosting capacity by 180% over the next decade Allows for the adoption of 2.5 million electric vehicles statewide and 1 million heat pumps, meeting over 80% of the state’s 2050 goals Enables 5.8 GW of solar, exceeding the state’s 2040 goals, and reaching over 63% of its 2050 goals
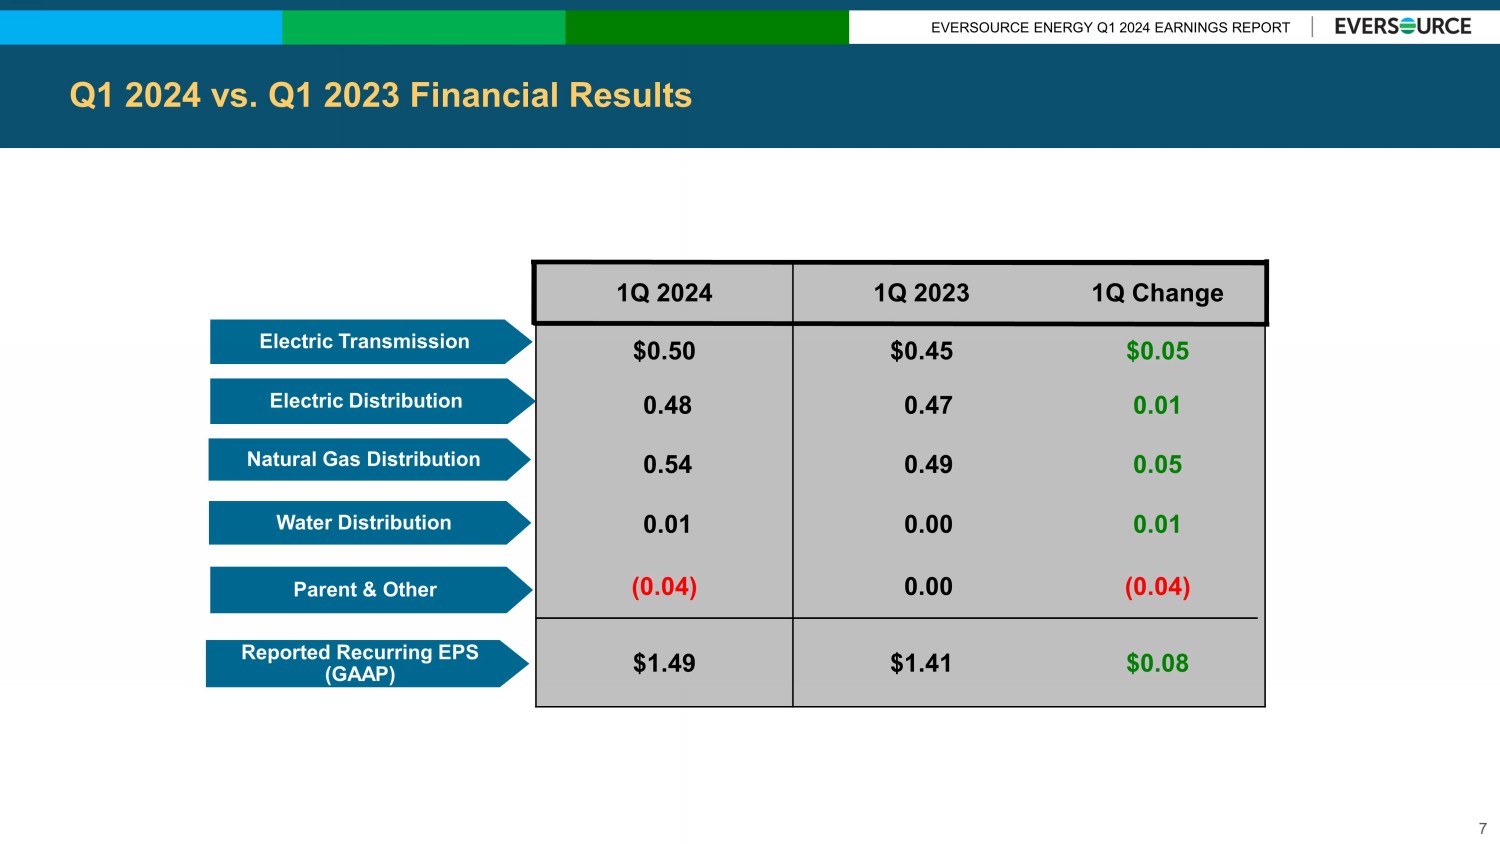
EVERSOURCE ENERGY Q1 2024 EARNINGS REPORT Q1 2024 vs. Q1 2023 Financial Results 7 1Q 2024 1Q 2023 1Q Change $0.50 $0.45 $0.05 0.48 0.47 0.01 0.54 0.49 0.05 0.01 0.00 0.01 (0.04) 0.00 (0.04) $1.49 $1.41 $0.08 Electric Transmission Electric Distribution Natural Gas Distribution Water Distribution Parent & Other Reported Recurring EPS (GAAP)
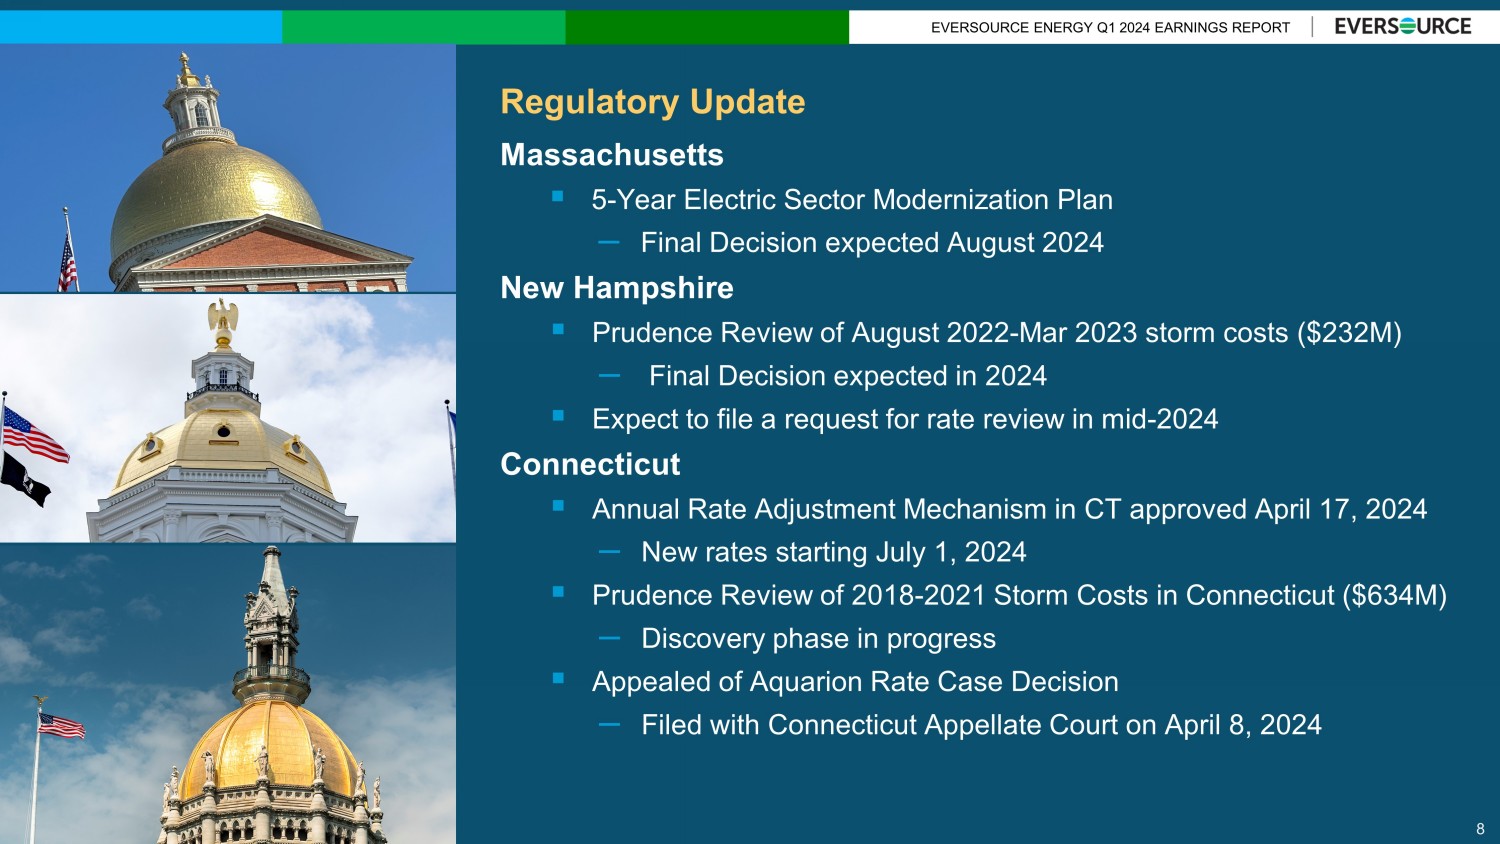
EVERSOURCE ENERGY Q1 2024 EARNINGS REPORT Regulatory Update Massachusetts ▪ 5 - Year Electric Sector Modernization Plan – Final Decision expected August 2024 New Hampshire ▪ Prudence Review of August 2022 - Mar 2023 storm costs ($232M) – Final Decision expected in 2024 ▪ Expect to file a request for rate review in mid - 2024 Connecticut ▪ Annual Rate Adjustment Mechanism in CT approved April 17, 2024 – New rates starting July 1, 2024 ▪ Prudence Review of 2018 - 2021 Storm Costs in Connecticut ($634M) – Discovery phase in progress ▪ Appealed of Aquarion Rate Case Decision – Filed with Connecticut Appellate Court on April 8, 2024 8
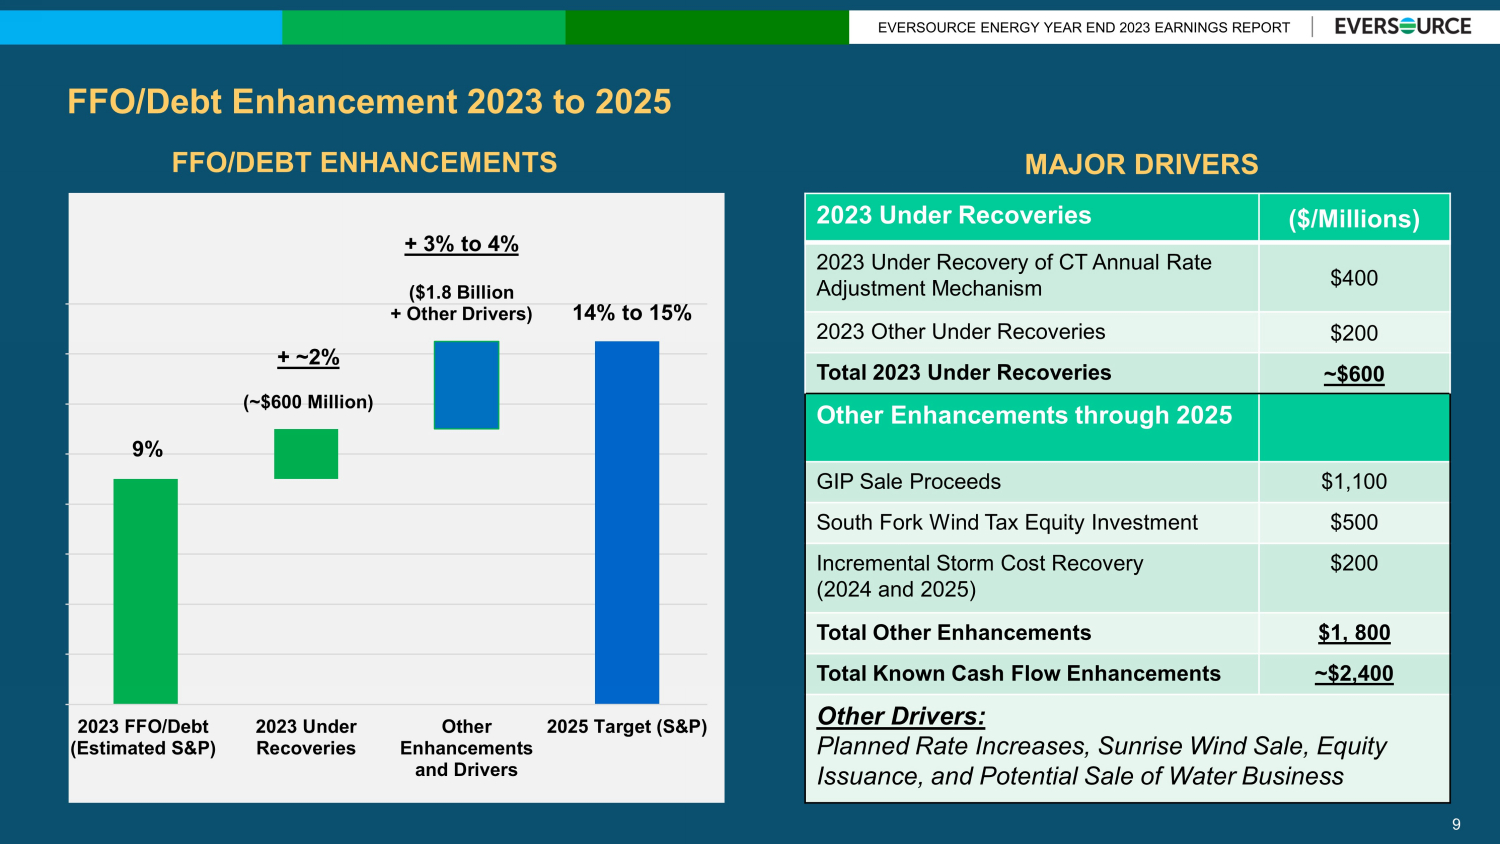
EVERSOURCE ENERGY YEAR END 2023 EARNINGS REPORT FFO/Debt Enhancement 2023 to 2025 9 FFO/DEBT ENHANCEMENTS 9% + ~2% (~$600 Million) + 3% to 4% ($1.8 Billion + Other Drivers) 14% to 15% 2023 FFO/Debt (Estimated S&P) 2023 Under Recoveries Other Enhancements and Drivers 2025 Target (S&P) 2023 Under Recoveries ($/Millions) 2023 Under Recovery of CT Annual Rate Adjustment Mechanism $400 2023 Other Under Recoveries $200 Total 2023 Under Recoveries ~$600 Other Enhancements through 2025 GIP Sale Proceeds $1,100 South Fork Wind Tax Equity Investment $500 Incremental Storm Cost Recovery (2024 and 2025) $200 Total Other Enhancements $1, 800 Total Known Cash Flow Enhancements ~$2,400 Other Drivers: Planned Rate Increases, Sunrise Wind Sale, Equity Issuance, and Potential Sale of Water Business MAJOR DRIVERS
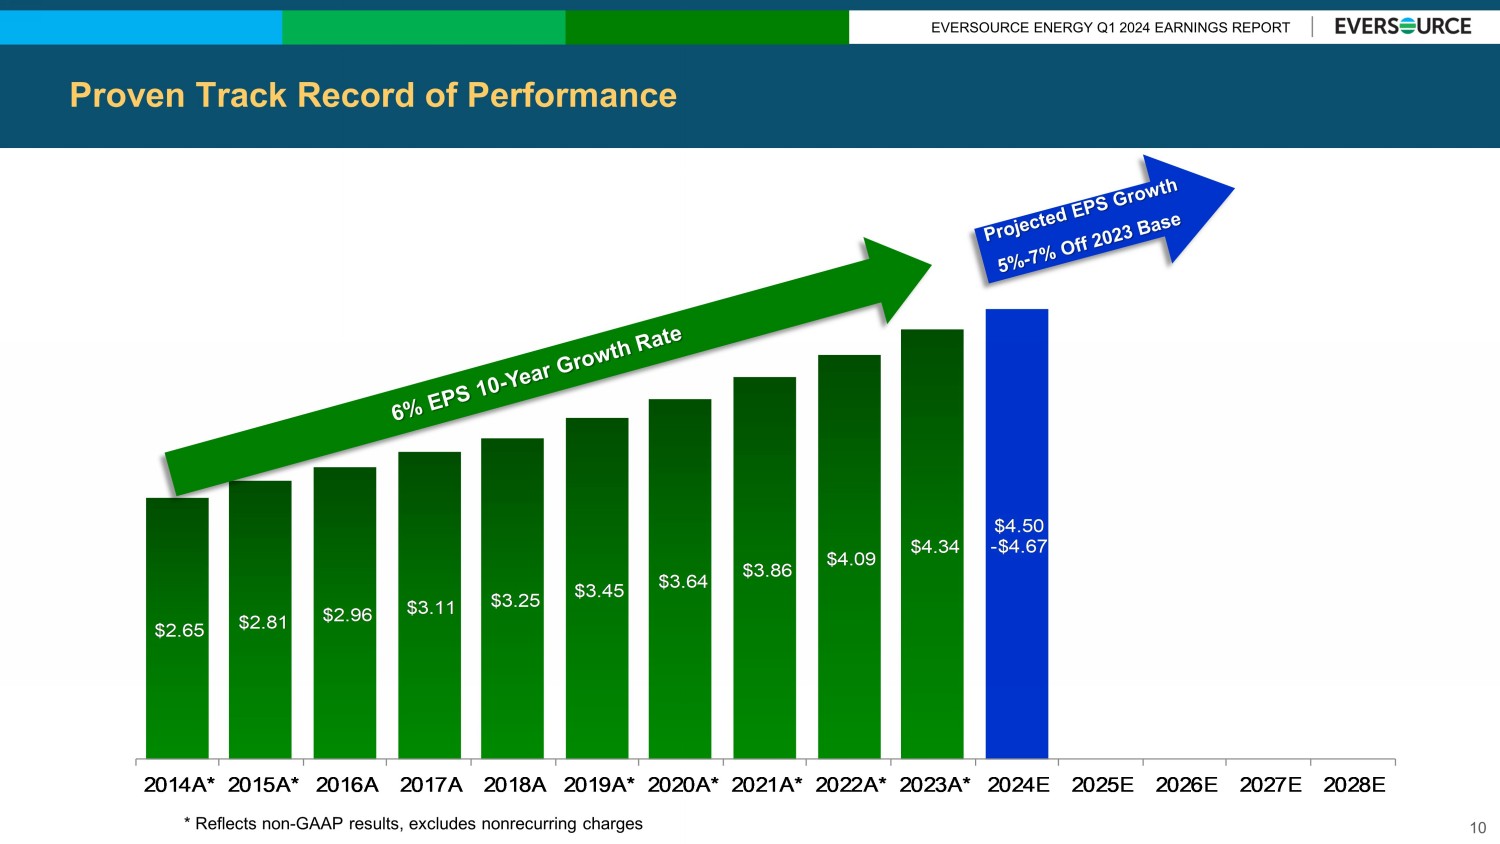
EVERSOURCE ENERGY Q1 2024 EARNINGS REPORT $2.65 $2.81 $2.96 $3.11 $3.25 $3.45 $3.64 $3.86 $4.09 $4.34 $4.50 - $4.67 2014A* 2015A* 2016A 2017A 2018A 2019A* 2020A* 2021A* 2022A* 2023A* 2024E 2025E 2026E 2027E 2028E * Reflects non - GAAP results, excludes nonrecurring charges 10 Proven Track Record of Performance

EVERSOURCE ENERGY Q1 2024 EARNINGS REPORT APPENDIX 11
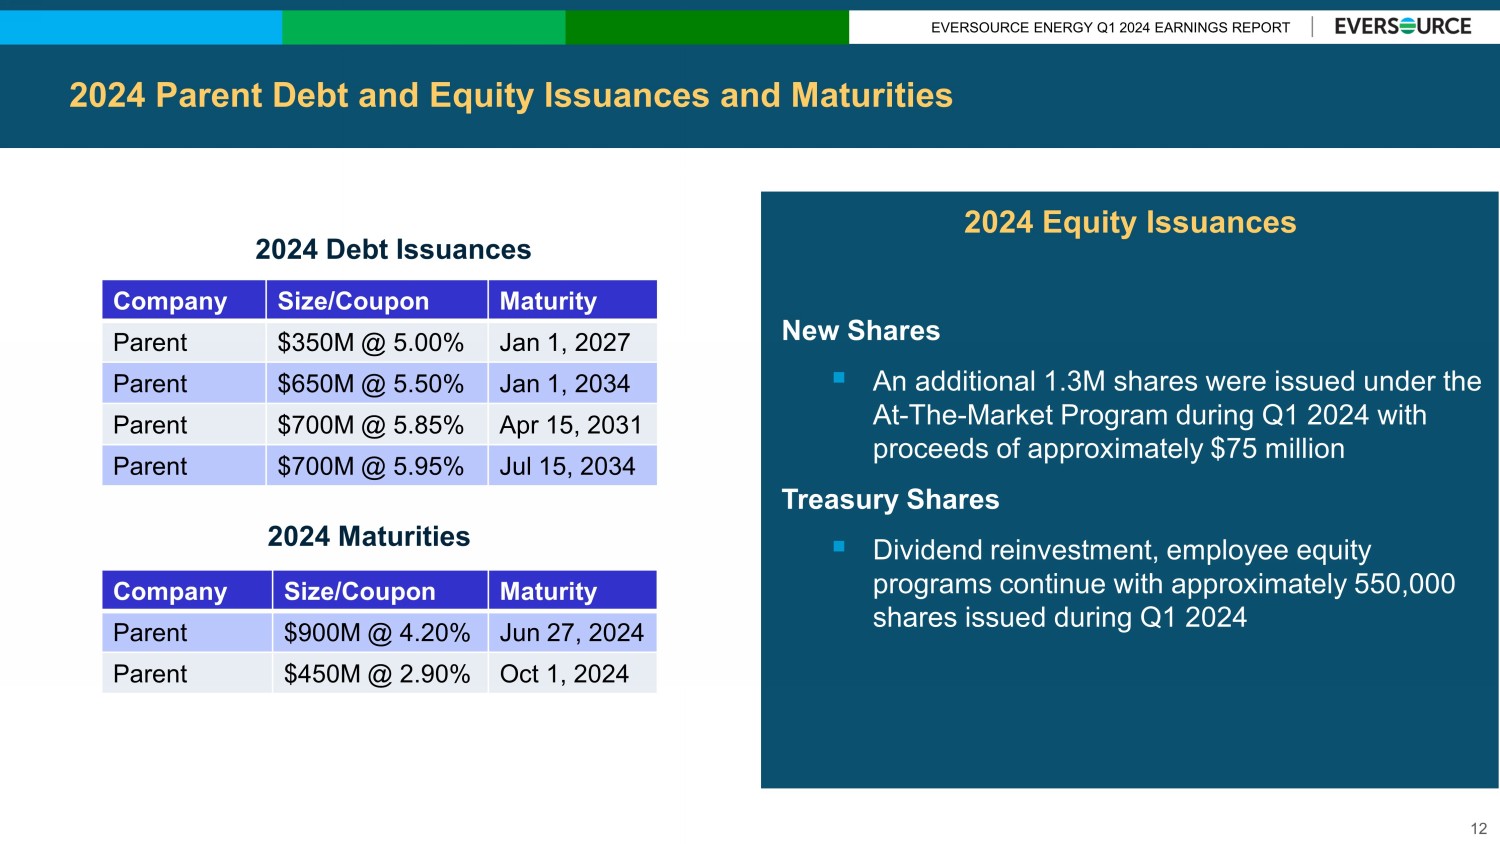
EVERSOURCE ENERGY Q1 2024 EARNINGS REPORT 2024 Parent Debt and Equity Issuances and Maturities Company Size/Coupon Maturity Parent $900M @ 4.20% Jun 27, 2024 Parent $450M @ 2.90% Oct 1, 2024 2024 Debt Issuances 2024 Maturities Company Size/Coupon Maturity Parent $350M @ 5.00% Jan 1, 2027 Parent $650M @ 5.50% Jan 1, 2034 Parent $700M @ 5.85% Apr 15, 2031 Parent $700M @ 5.95% Jul 15, 2034 New Shares ▪ An additional 1.3M shares were issued under the At - The - Market Program during Q1 2024 with proceeds of approximately $75 million Treasury Shares ▪ Dividend reinvestment, employee equity programs continue with approximately 5 50 ,000 shares issued during Q1 2024 2024 Equity Issuances 12

EVERSOURCE ENERGY Q1 2024 EARNINGS REPORT $1,115 $1,207 $1,448 $1,200 $1,207 $1,053 $1,166 $1,146 $1,244 $1,354 $1,772 $2,009 $1,869 $2,051 $2,006 $1,770 $799 $804 $998 $1,044 $1,087 $1,142 $1,089 $1,079 $144 $155 $162 $169 $204 $218 $234 $251 $239 $266 $213 $225 $234 $223 $202 $239 $3,541 $3,786 $4,593 $4,647 $4,601 $4,687 $4,697 $4,485 $0 $500 $1,000 $1,500 $2,000 $2,500 $3,000 $3,500 $4,000 $4,500 $5,000 2021A 2022A 2023A 2024E 2025E 2026E 2027E 2028E Transmission Electric Distribution Natural Gas Distribution Water IT and Facilities $ In Millions $23.1 Billion 2024 - 2028 Projected Capital Expenditures for Core Businesses 13
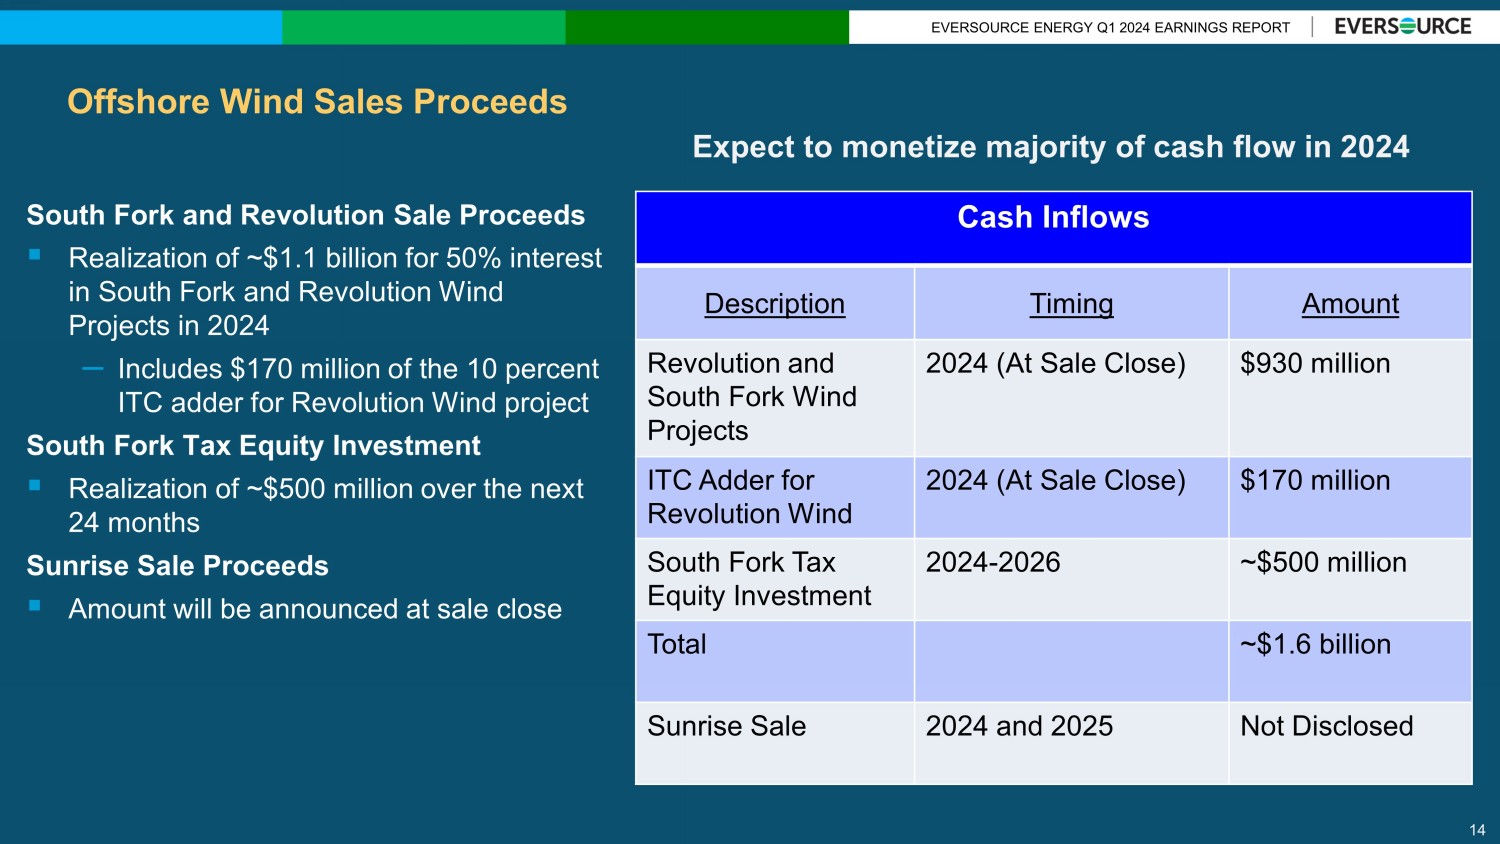
EVERSOURCE ENERGY Q1 2024 EARNINGS REPORT Offshore Wind Sales Proceeds South Fork and Revolution Sale Proceeds ▪ Realization of ~$1.1 billion for 50% interest in South Fork and Revolution Wind Projects in 2024 – Includes $170 million of the 10 percent ITC adder for Revolution Wind project South Fork Tax Equity Investment ▪ Realization of ~$500 million over the next 24 months Sunrise Sale Proceeds ▪ Amount will be announced at sale close 14 Expect to monetize majority of cash flow in 2024 Cash Inflows Description Timing Amount Revolution and South Fork Wind Projects 2024 (At Sale Close) $930 million ITC Adder for Revolution Wind 2024 (At Sale Close) $170 million South Fork Tax Equity Investment 2024 - 2026 ~$500 million Total ~$1.6 billion Sunrise Sale 2024 and 2025 Not Disclosed


