EEI Financial Conference NOVEMBER 10, 2008 Exhibit 99.3 |
2 Safe Harbor Provisions This presentation contains statements concerning NU’s expectations, plans, objectives, future financial performance and other statements that are not historical facts. These statements are “forward-looking statements” within the meaning of the Private Securities Litigation Reform Act of 1995. In some cases, a listener can identify these forward-looking statements by words such as “estimate”, “expect”, “anticipate”, “intend”, “plan”, “believe”, “forecast”, “should”, “could”, and similar expressions. Forward-looking statements involve risks and uncertainties that may cause actual results or outcomes to differ materially from those included in the forward-looking statements. Factors that may cause actual results to differ materially from those included in the forward-looking statements include, but are not limited to, actions or inactions by local, state and federal regulatory bodies; competition and industry restructuring; changes in economic conditions; changes in weather patterns; changes in laws, regulations or regulatory policy; changes in levels or timing of capital expenditures; developments in legal or public policy doctrines; technological developments; changes in accounting standards and financial reporting regulations; fluctuations in the value of our remaining competitive electricity positions; actions of rating agencies; subsequent recognition, derecognition and measurement of tax positions; and other presently unknown or unforeseen factors. Other risk factors are detailed from time to time in our reports to the Securities and Exchange Commission (SEC). Any forward-looking statement speaks only as of the date on which such statement is made, and we undertake no obligation to update the information contained in any forward- looking statements to reflect developments or circumstances occurring after the statement is made. This presentation references our 2008 earnings and 2008 guidance excluding a significant charge associated with a litigation settlement payment made to Consolidated Edison, Inc., which are non-GAAP measures. Due to the nature and significance of the litigation charge, management believes that this non-GAAP presentation is more representative of our performance and provides additional and useful information to investors in analyzing historical and future performance. This presentation also references our 2008 projected and actual EPS by segment, a non-GAAP presentation which management believes is useful to investors to evaluate the actual financial performance and contribution of NU’s business segments. These non-GAAP measures should not be considered as an alternative to NU consolidated net income and EPS determined in accordance with GAAP as an indicator of NU’s operating performance. Please refer to our reports to the SEC for further details concerning the matters described in this presentation. |
3 Overview of Today’s Presentation > 2008: Strong, successful year > 2009: Key transition year for initiatives affecting 2010 and beyond > Public policy priorities create additional opportunities |
4 2008 and 2009 Key Themes > Strong financial results > SW CT transmission projects nearly complete > Favorable FERC rulings > Initial NEEWS applications filed > New legislation that creates new opportunities > NEEWS siting > Merrimack Clean Air Project > Northern Solutions transmission > CL&P, PSNH rate cases 2008 Success On Many Fronts 2009 Moving On Initiatives That Provide Long-Term Benefits |
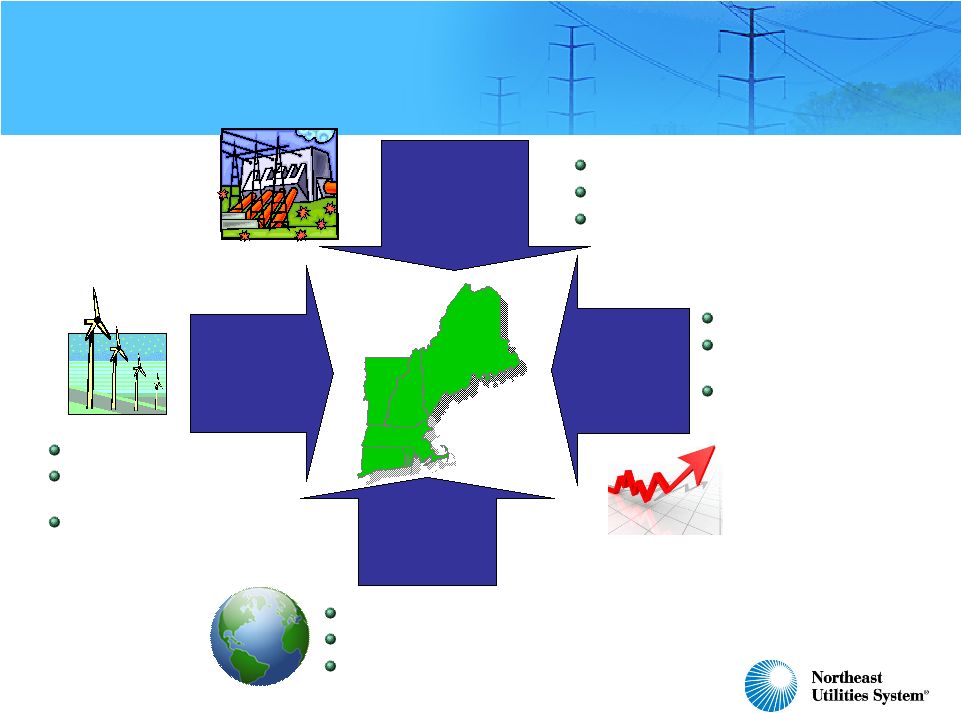
5 Reliability Concerns Continuing Rate Pressure Increasing Environmental Pressure High commodity costs “Peaky” demand growth Infrastructure modernization System reliability Fuel diversity Resource adequacy Energy efficiency Reduced emissions Renewable Portfolio Standards Advancing Technology Renewables Grid communications (AMI/ BPL) Customer networks Beyond 2009: Investment Must Continue to Address Regional Energy Challenges |
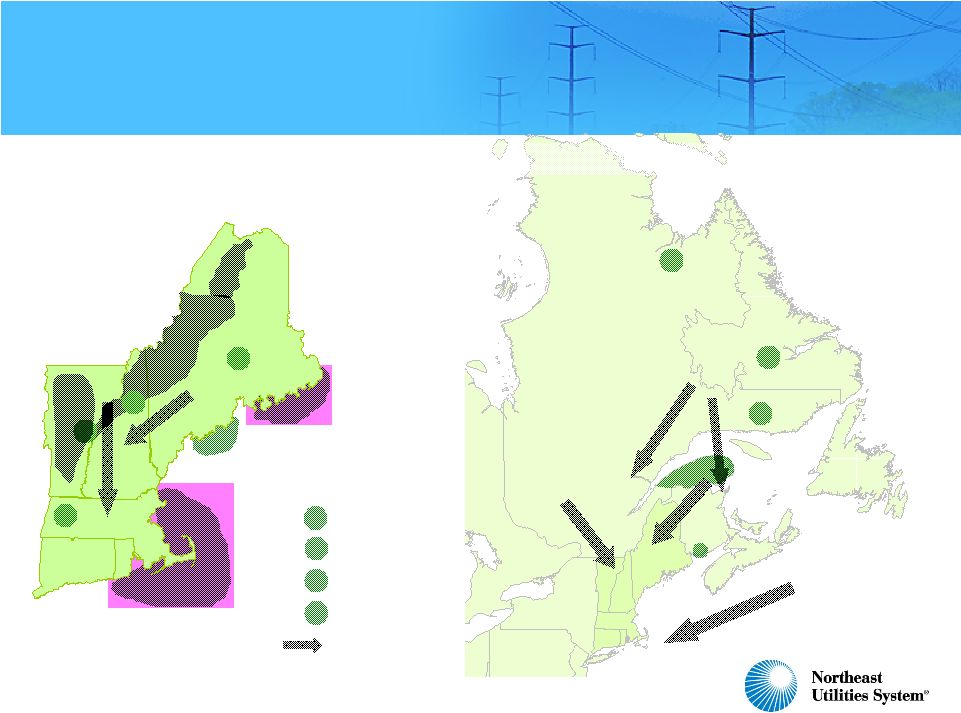
6 Northern New England and Eastern Canada Will Become Valuable Sources to Meet New England’s Needs H N W Hydro Nuclear Wind B Biomass General Movement of Power New England’s Most Attractive Renewable Energy Locations W W W W W B B B B N H H H Quebec Hydro-Quebec plans to develop a portfolio of hydroelectric projects totaling 4,500 MW and integrate 4,000 MW of planned wind power by 2015 Newfoundland & Labrador Exploring development of large hydro facilities New Brunswick Exploring development of 1 or 2 nuclear units W Eastern Canadian Development |
7 State Legislation Shaping Additional Opportunities > 2007 Energy Efficiency Act › Integrated resource plan › Peaking generation › Increased DSM incentives › Required decoupling › Advanced metering › Long-term bilateral contracts › RPS standards increased > 2008 RGGI regulations adopted > 2008 Green Communities Act › Adopted RGGI › Removed caps on utility energy efficiency/demand response › Long-term contracts for renewable resources › Utility-owned solar generation › Smart grid pilot › Green power offering > 2006 Mercury Reduction Bill › Merrimack Clean Air Project > 2007 Renewable Portfolio Standards > 2008 RGGI regulations adopted > 2008 distributed generation authorization |
8 NU: Financial Flexibility and Attractive Opportunities > 2008 › Financings completed › Strong operational and financial results > 2009 › Reduced financing requirements and minimal debt maturities › Improved cash generation › EPS projection comparable to 2008 > 2009 – 2013 › Attractive future opportunities › Financial flexibility and strength |
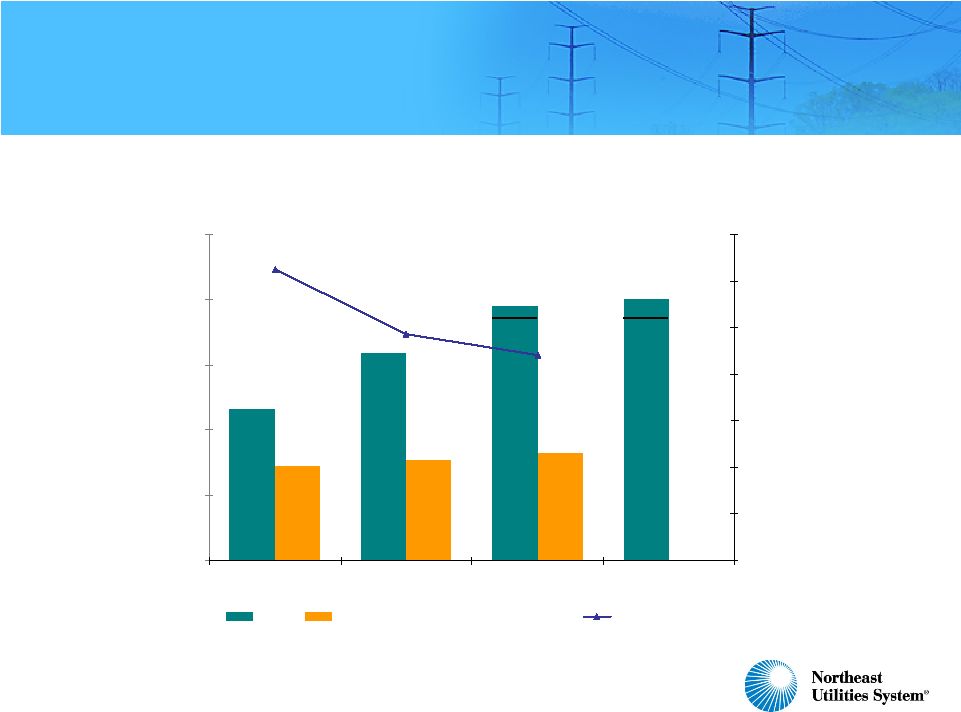
9 NU Dividend Policy Will Target 50% Payout Ratio $0.00 $0.50 $1.00 $1.50 $2.00 $2.50 2006 2007 2008 2009 0% 10% 20% 30% 40% 50% 60% 70% EPS Dividends Paid/Declared Per Share Payout Ratios *Excludes impact of competitive businesses, one-time CL&P tax reduction **Excludes litigation settlement charge $1.16* $1.59 $1.80 - $2.00 $1.80 - $1.95** $0.725 $0.775 $0.825 62.5% 42.3%-45.8% 48.7% |
Regulated Investment Strategy – 2009-2013 |
11 Strong Execution, Efficient Operations and Effective Capital Deployment are the Cornerstones of Our Regulated Investment Strategy > We continue to focus on strong execution of operations and projects, as we have shown with our transmission build-out > Our capital investment plan continues to address needed infrastructure upgrades while creating value for customers and shareholders > Our transmission segment of the business continues to be a major driver of capital outlays and earnings > We are moving forward with the Merrimack Clean Air Project which will preserve a low-cost power supply for PSNH customers > Our capital plan for the five-year period provides flexibility around the level and timing of our distribution capital investment > Natural gas as “the fuel of choice” creates opportunities to grow Yankee Gas business |
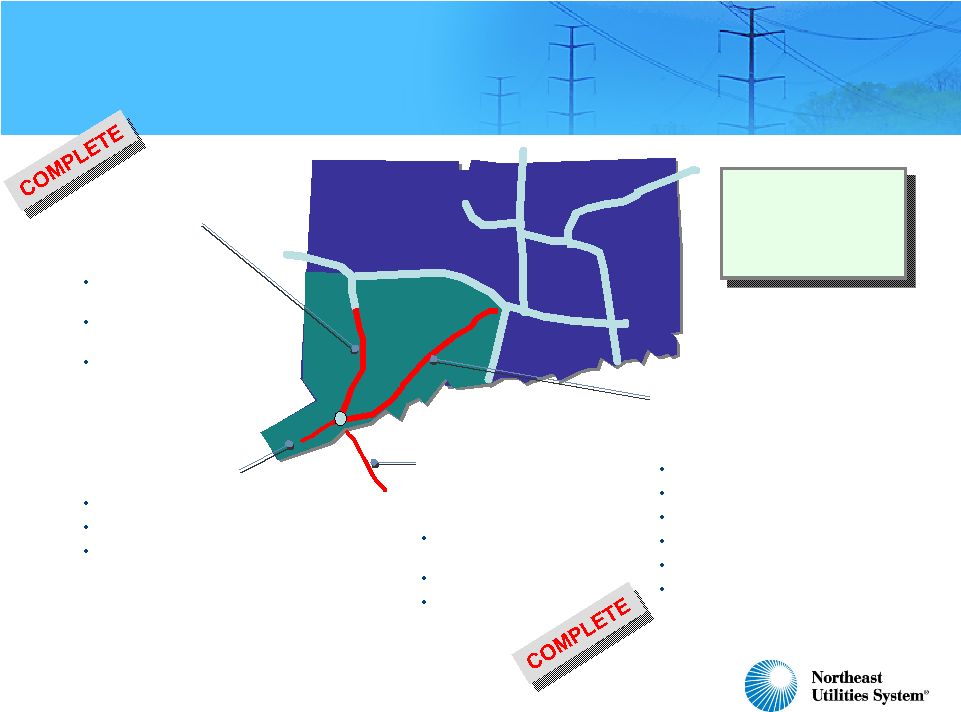
12 Four Major SWCT Transmission Projects – A $1.68 Billion Investment, Nearing Completion Bethel-Norwalk 345-kV underground & overhead $336 Million 21 miles 345-kV (56% underground) 10 miles 115-kV (100% underground) Completed October 2006 Middletown-Norwalk 345-kV underground & overhead ˜$950 Million (NU share) Glenbrook Cables 115-kV underground $239 Million 9 miles 115-kV underground 98% complete Projected in-service date: November 2008 Long Island Cable 138-kV cross-sound $78 Million (NU share) 11 miles 138-kV submarine cable Joint project with LIPA Completed July 2008 69 miles 345-kV (35% underground) 57 miles 115-kV (1% underground) Joint project with United Illuminating 99% complete Overhead placed in service August 2008 Underground projected in-service date Q4 2008/Q1 2009 50% of CT Load Total investment from four projects now estimated at $1.6 billion, nearly $80 million under budget. |
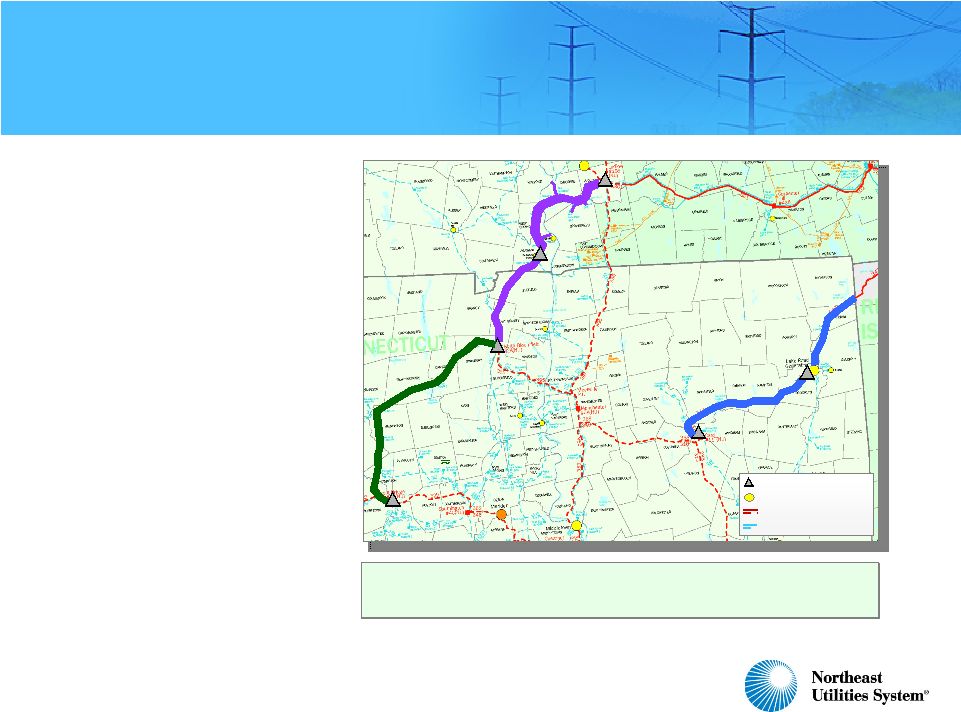
13 The NEEWS Projects are Advancing Into the Siting Phase SPRINGFIELD HARTFORD 345-kV Substation Generation Station 345-kV ROW 115-kV ROW Central Connecticut Reliability Project $315 M Interstate Reliability Project ˜$250 M Greater Springfield Reliability Project ˜$714 M Planning Status • ISO-NE Technical approval received in September Siting Status • GSRP – Municipal Consultations underway; Siting applications filed in October • Interstate – Municipal Consultations underway; Siting applications in late 2008 / early 2009 • CCRP – Municipal Consultations and Siting application in 2009 Financial Incentives FERC Filing • 100% CWIP • Incentive ROE of 13.14% • 100% recovery of prudently incurred costs, if cancelled These major NEEWS projects and related costs of $211 million result in a total cost of $1.49 billion |
14 Estimated Schedules For Major NEEWS Projects 2013 Late 2012 / 2013 Mid-2013 In-service 2011 2010 2010 Construction targeted to start on staggered basis 2010 / Early 2011 Mid / Late 2010 2010 Siting completed 2009 Late 2008 / Early 2009 October 2008 State siting applications filed September 2008 September 2008 September 2008 ISO technical applications approval Central CT Reliability (345-kV) Interstate Reliability (345-kV) Greater Springfield Reliability (115-kV/345-kV) Major NEEWS Projects |
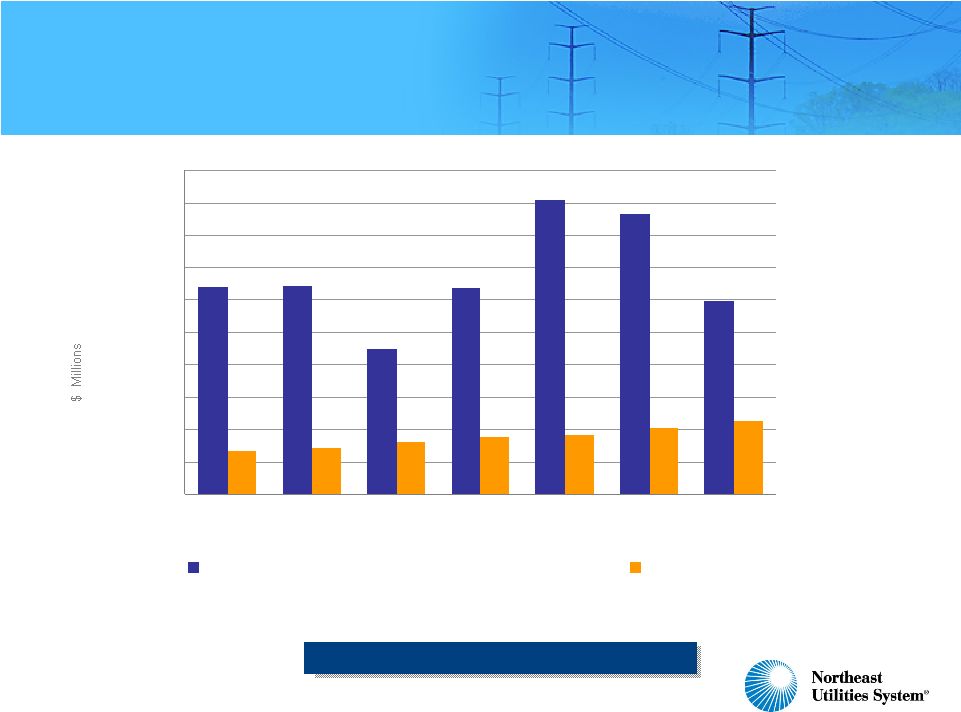
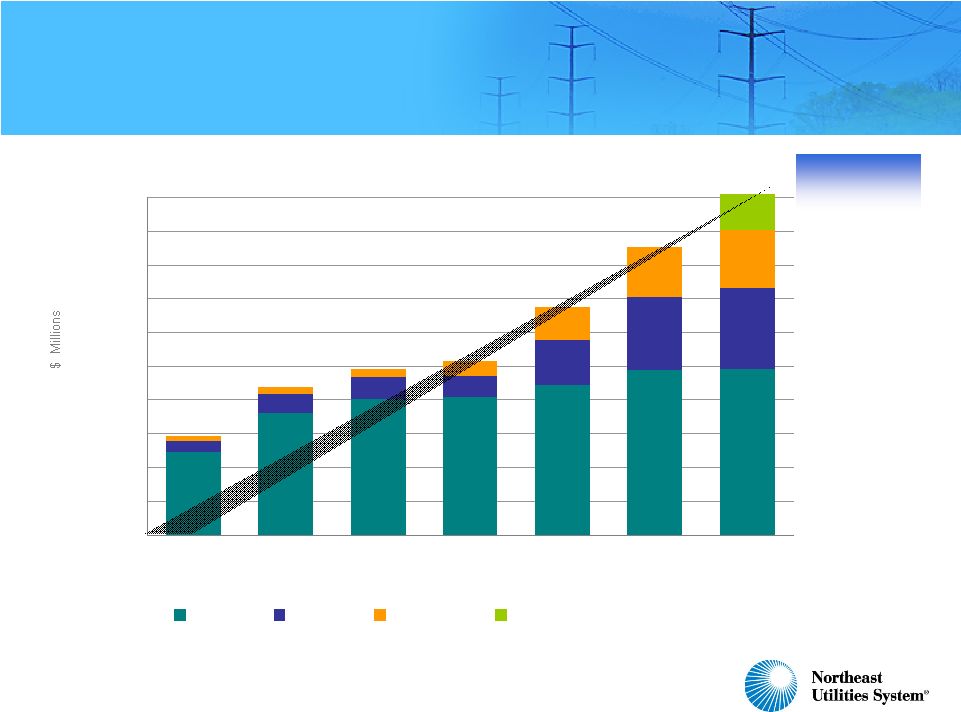
15 2009-2013 Transmission Capital Expenditures Increase By Over 17% From Previous Five-Year Program $0 $200 $400 $600 $800 $1,000 $1,200 Major Southwest CT NEEWS HVDC Line Other Historic Forecast Up To $3.5 Billion $2,523 Million $22 million of major SWCT projects in 2009-2013 forecast period; $1.6 billion in total NEEWS projects estimated at $1.4 billion during the 2009-2013 forecast period $1.5 billion of additional forecasted projects Successful completion of SWCT projects NEEWS projects ramping up US portion conceptually estimated at $700 million with $525 million NU ownership share HVDC Line to Canada Now Added to Forecast |
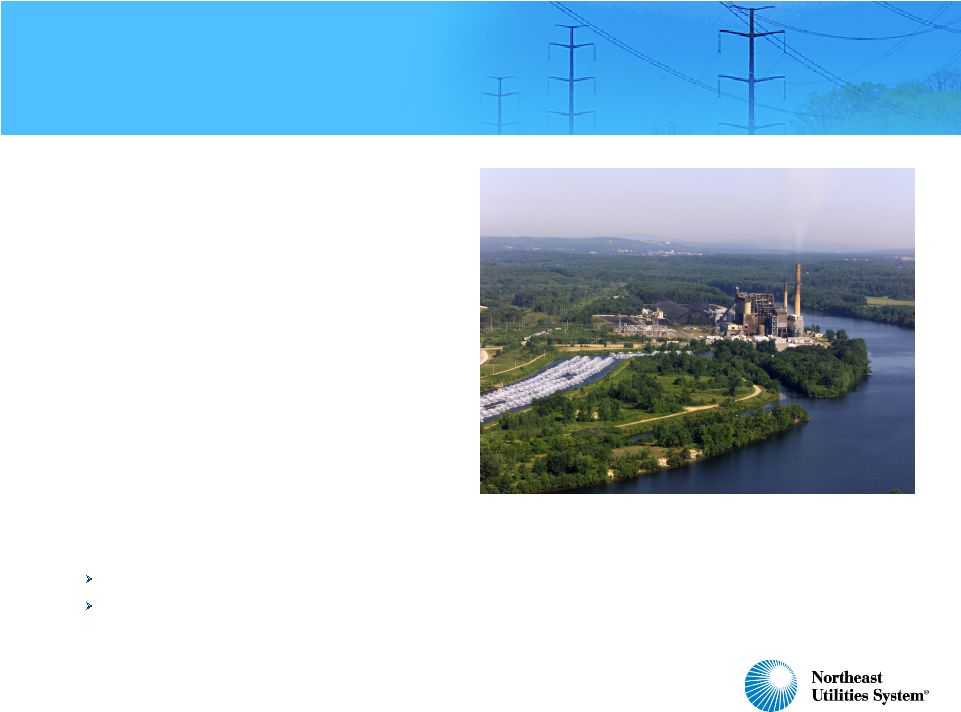
16 Merrimack Clean Air Project Construction Underway • Merrimack a key source of low-cost power for PSNH customers Two coal units supply about 35% of PSNH’s energy requirements PSNH energy costs will remain below region’s rates • Scrubber required by New Hampshire statute to reduce mercury emissions • Revised estimate of $457 million • Engineering, Procurement & Construction (EPC) contract secured • Contracts awarded to major suppliers for Scrubber, Chimney and Waste Water Treatment facility • Estimated project completion: 2012 • Expected to reduce sulfur emissions by more than 90% • Expected to reduce mercury emissions by 85% • Investment to be recovered through PSNH generation rates per legislation |
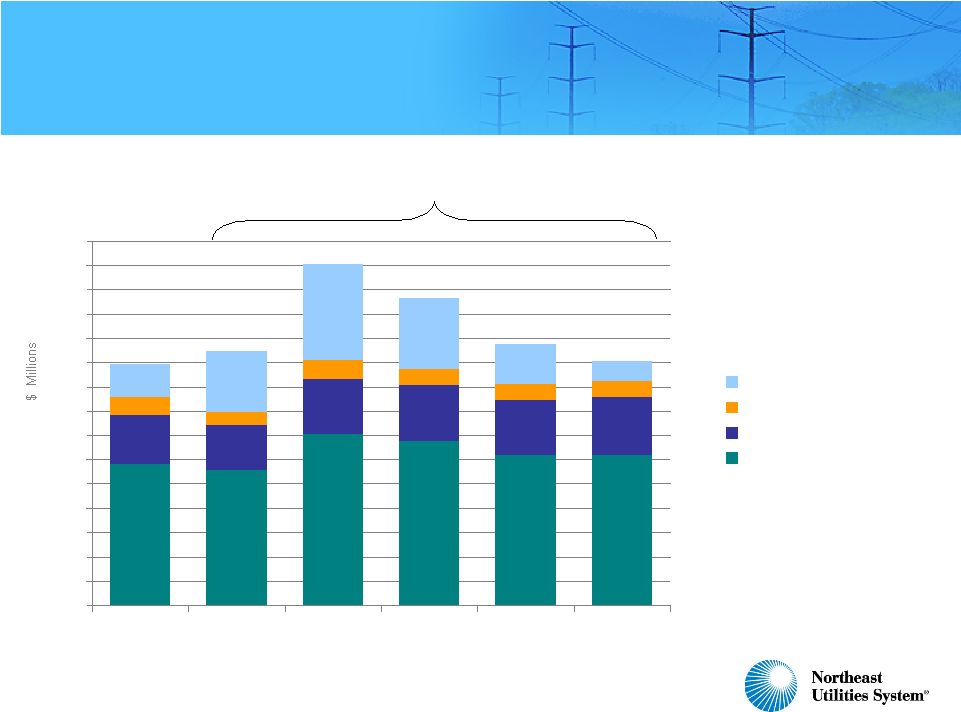
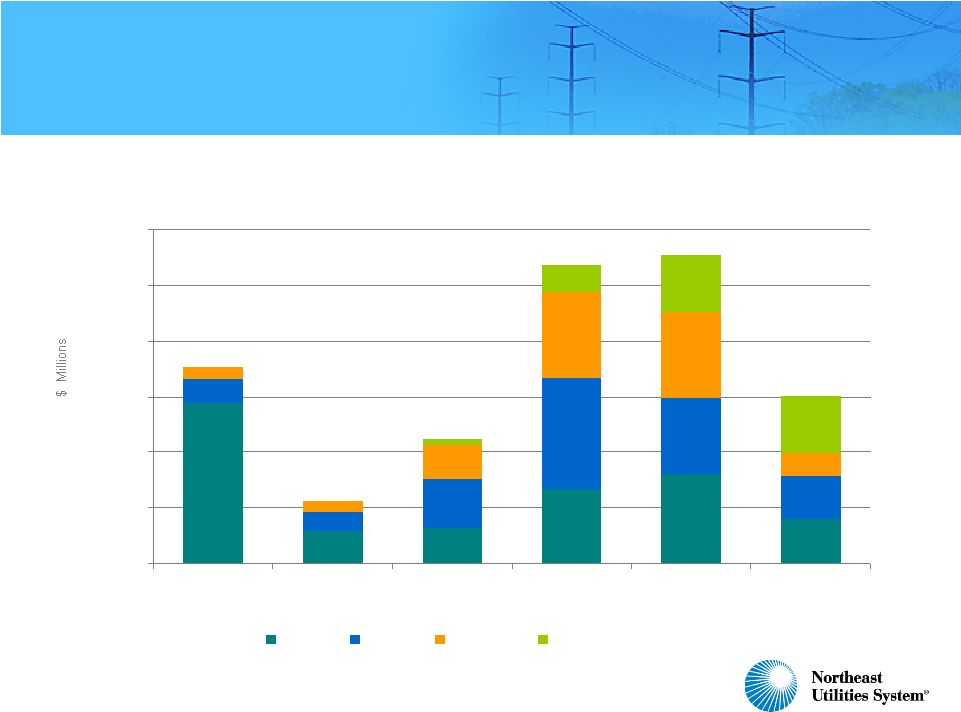
17 292 280 352 338 309 311 101 92 115 117 114 117 35 28 38 33 33 34 69 123 199 144 83 41 0 50 100 150 200 250 300 350 400 450 500 550 600 650 700 750 2008 2009 2010 2011 2012 2013 PSNH - Generation WMECO - Distribution PSNH - Distribution CL&P - Distribution Electric Distribution and Generation Capital Expenditures – By Company 2009-2013 Electric Distribution & Generation Projected Capital Spending $2.9 Billion 497 632 539 503 523 704 |
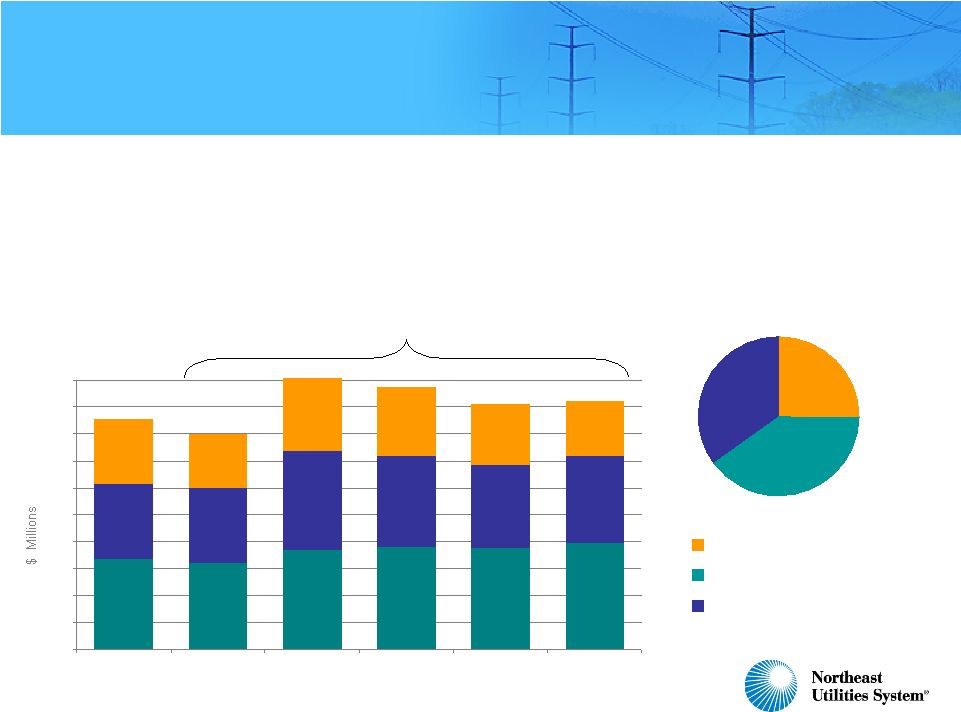
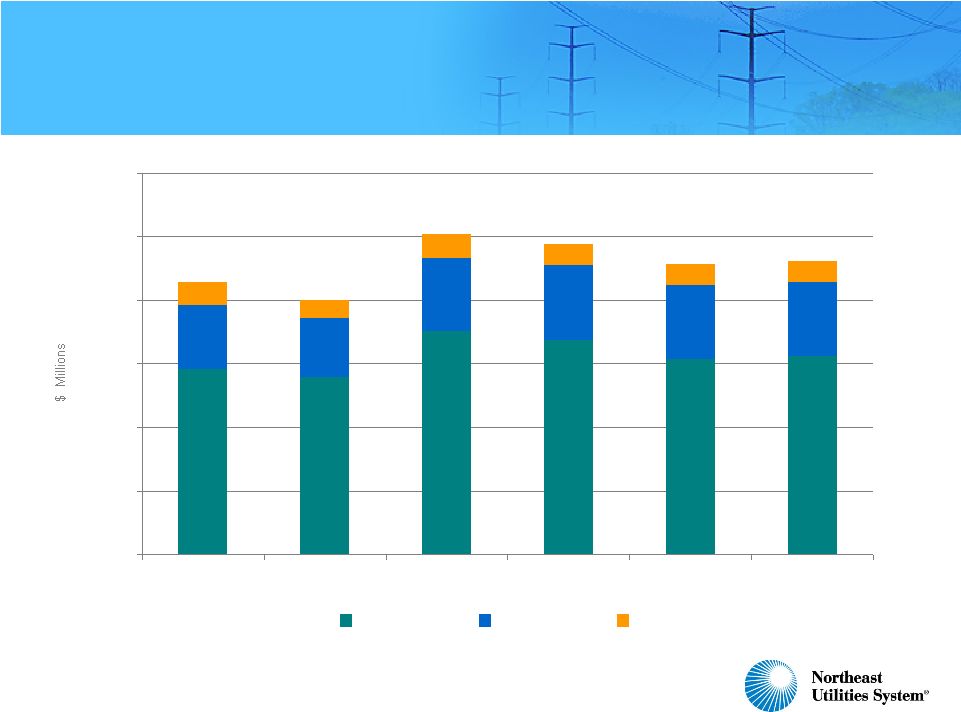
18 • We are developing a plan for distribution capital spending that provides flexibility in the timing and level of capital expenditures • System reliability will be maintained, consistent with respective state regulatory requirements • The current regulatory and economic climate will potentially allow us to reallocate capital to aging infrastructure, while lowering overall investment in distribution 167 160 184 191 188 198 141 140 184 168 155 162 120 100 137 129 113 102 0 50 100 150 200 250 300 350 400 450 500 2008 2009 2010 2011 2012 2013 $581 $921 $809 Aging Infrastructure Basic Business Peak Load / New Business 2009-2013 Electric Distribution Projected Capital Spending $2.3 Billion We are Reviewing Flexible Approaches to Reallocate and Reduce Electric Distribution Capital 25% 35% 40% 428 488 456 462 400 505 |
19 Projected Yankee Gas Capital Expenditures 14.7 24.0 23.1 24.3 25.7 26.7 26.3 22.3 24.6 23.6 27.8 28.7 20.6 22.5 15.9 16.5 17.5 18.1 2.6 26.3 27.8 3.0 3.2 0.0 10.0 20.0 30.0 40.0 50.0 60.0 70.0 80.0 90.0 100.0 2008 2009 2010 2011 2012 2013 Expansion Initiatives Peak Load / New Business Basic Business Aging Infrastructure 2009-2013 Yankee Gas Projected Capital Spending $404 Million 62 92 74 77 90 71 |
20 Wholesale Price of Natural Gas vs. Home Heating Oil [updated Oct 1, 2008] 0.00 5.00 10.00 15.00 20.00 25.00 30.00 Natural Gas Home Heating Oil Yankee Gas Expansion Initiatives • The continued price advantage of natural gas over home heating oil creates opportunities to grow earnings through: • Increased oil to gas conversions • An upgraded gas interconnection from Waterbury to the Meriden/Cheshire service area • Improvements at our LNG facility to enable enhanced peaking capacity and lower contract peaking requirements • Increased number of service plan contracts • Estimated capital expenditures for the initiatives total $63 million Natural Gas Price Advantage Historic Projected |
21 Summary > Our five-year business plan: › Provides significant value for customers and shareholders › Capitalizes on our strong execution of major projects › Includes flexibility in capital deployment > Opportunities exist beyond what we’ve included in this plan › AMI / SmartGrid › Massachusetts Green Communities Act – Solar PV › New Hampshire distributed, renewable generation › Additional transmission opportunities |
Financial |
23 Overview > Current liquidity position and outlook for 2009 are favorable > Strong 2008 year-to-date results; full year earnings projection on guidance > 2009 earnings guidance comparable to 2008 despite projected lower revenues, higher costs, potential equity issuance > New five-year capital program drives rate base growth of 14% and fuels long- term EPS growth of 8-11% > Growth in internally generated cash moderates financing requirements > Management remains focused on total return, including dividend growth |
24 Credit and Liquidity > We have completed our $760 million 2008 financing plan on schedule • Four transactions, weighted average coupon of 5.9% and tenor 8.4 years > We have only one bond maturity between now and 2012 • $50 million at Yankee Gas in April 2009 > Projected capital expenditures for 2009 down significantly from 2008 due to the completion of our major Connecticut transmission projects • 2008 capital expenditures of $1.3 billion versus an estimate of approximately $900 million in 2009 > Debt financing for 2009 expected to be less than half of 2008 • Potential debt issuance of $300 - $350 million • Potential equity financing of $250 - $300 million > Ample liquidity available from our $900 million of revolving credit facilities and cash on hand > We do not utilize commercial paper; we have modest collateral call risk given the nature of our regulated business; our dividend payout ratio is modest > Credit rating outlooks are stable for all NU companies |
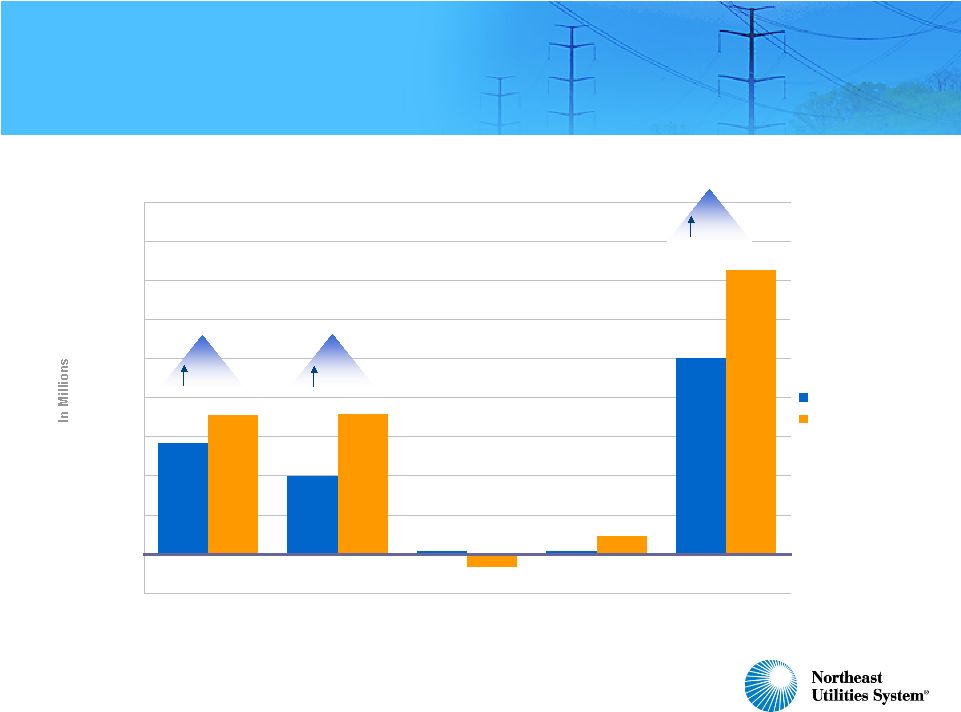
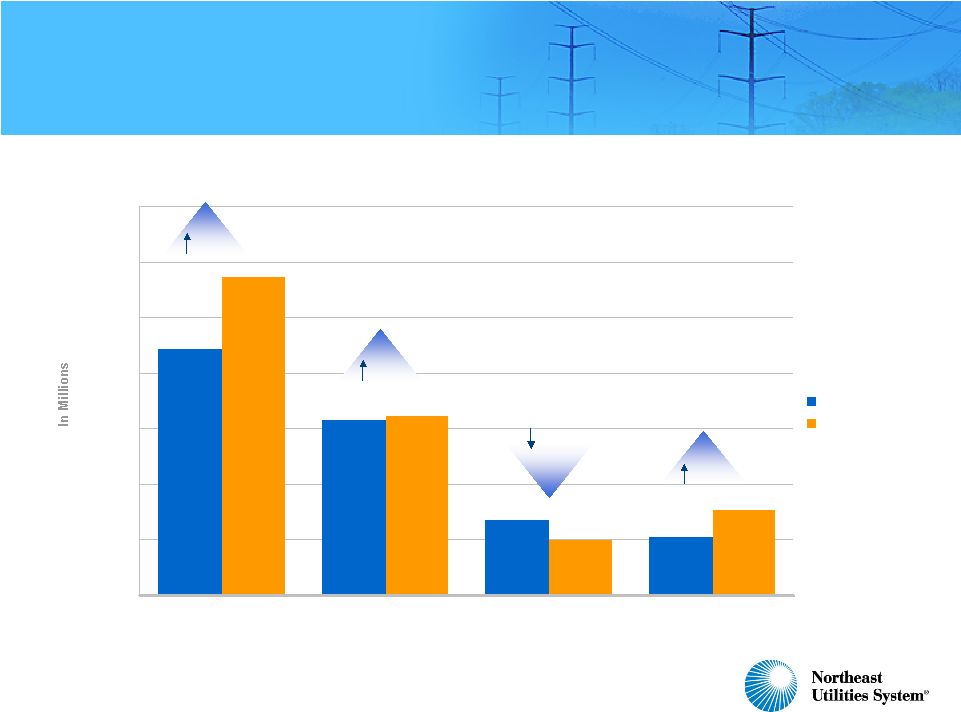
25 $0.7 $20.0 $1.0 $28.5 $50.2 $72.7 $4.6 ($3.3) $35.9 $35.5 ($10) $0 $10 $20 $30 $40 $50 $60 $70 $80 $90 3Q 2007 3Q 2008 2008 Third Quarter Earnings Results - $0.47 Per Share Distribution and Generation Transmission Parent/Other Competitive Total 24.6% 79.5% 44.8% |
26 $8.1 $57.0 $100.1 $173.8 $8.6 $218.7 $8.7 ($8.5) $103.6 $114.9 ($40) ($20) $0 $20 $40 $60 $80 $100 $120 $140 $160 $180 $200 $220 $240 YTD 2007 YTD 2008 2008 Earnings Results Through September 30 – $1.40 Per Share* Distribution and Generation Transmission Parent/Other Competitive Total *Excludes $29.8 million after-tax charge from March 2008 litigation settlement 14.8% 81.8% * 25.8% * |
27 Distribution and Generation Earnings Results Through September 30 $10.5 $31.7 $44.3 $13.6 $15.3 $10.1 $32.3 $57.2 $0 $10 $20 $30 $40 $50 $60 $70 YTD 2007 YTD 2008 CL&P PSNH WMECO Yankee Gas 45.7% 29.1% 1.9% 25.7% |
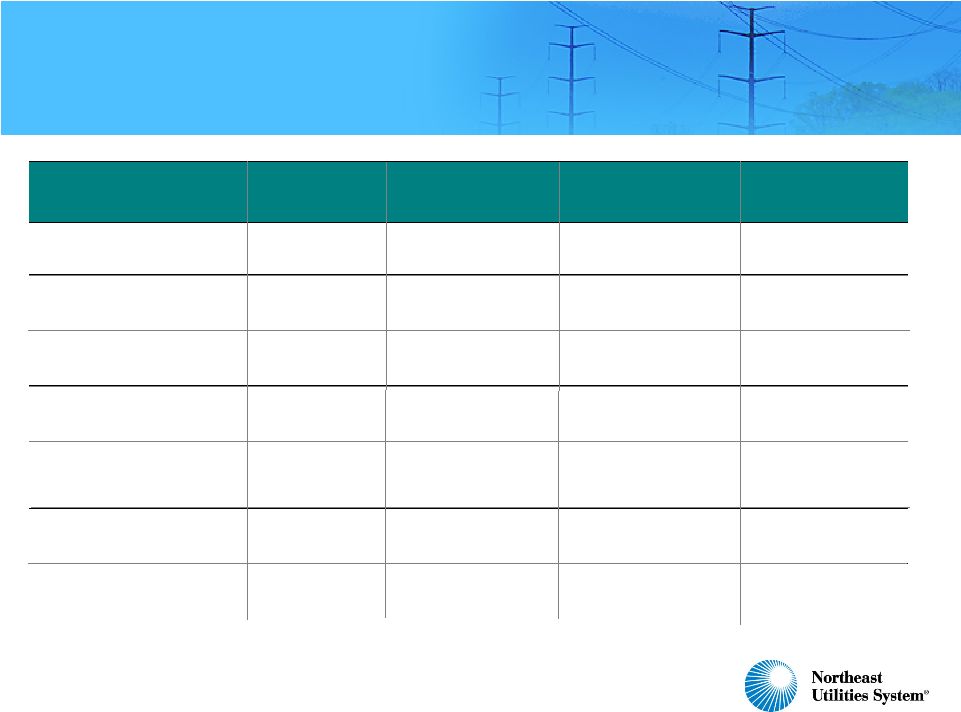
28 2008 – 2009 EPS Guidance $1.80 - $2.00 $1.60 - 1.75 $1.65 - $1.95 $1.59 NU Consolidated ------ ($0.19) N/A N/A Litigation charge $1.80 - $2.00 $0.00 - $0.05 ($0.05) $0.85 - $0.90 $1.00 - $1.10 2009 Projected $1.80 - $1.95 $1.65 - $1.95 $1.59 NU Consolidated excluding litigation charge $0.00 - $0.05 $0.00 $0.08 Competitive ($0.10) ($0.15) – ($0.10) $0.04 NU Parent/Other excluding litigation charge $0.85 - $0.90 $0.70 - $0.80 $0.53 Transmission $1.05 - $1.10 $1.10 – 1.25 $0.94 Distribution/Generation 2008 Current 2008 Initial 2007 Actual |
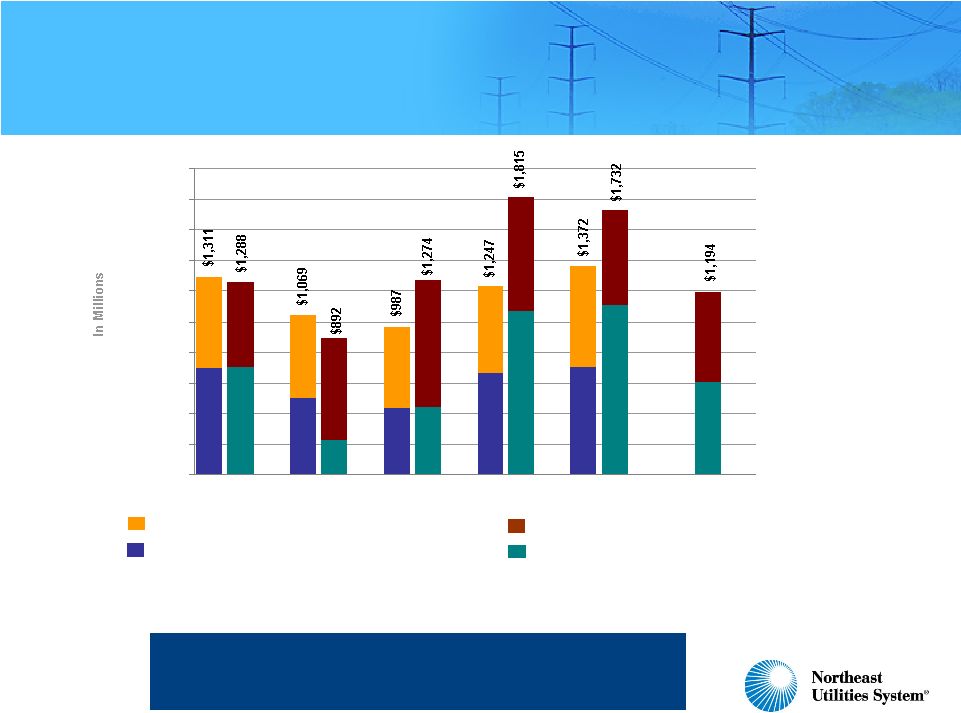
29 2008-2013: New Capital Expenditure Forecast $0 $200 $400 $600 $800 $1,000 $1,200 $1,400 $1,600 $1,800 $2,000 Distribution and Generation Capex (11/07 Forecast) Transmission Capex (11/07 Forecast) Distribution and Generation Capex (11/08 Forecast*) Transmission Capex (11/08 Forecast) 2008 2011 2012 2009 2010 2013 *Totals include capex at corporate service companies on behalf of operating companies of $71 million in 2009, $34 million in 2010, $21 million in 2011, $13 million in 2012, and $12 million in 2013. Five-year 2009-2013 capital spending of up to $7 billion, compared with last year’s 2008-2012 $6 billion plan; 2008-2012 period up by $1 billion. |
30 Elements of 2009-2013 Capex Projections > $425 million to complete Merrimack Clean Air Project > $1.4 billion to complete NEEWS > $525 million for transmission to Canada > $130 million for Northern NH transmission loop > $1.4 billion for additional transmission projects > $2.3 billion for electric distribution > $400 million for natural gas distribution > New PSNH distributed generation > New WMECO solar opportunities > Additional renewable generation > Additional transmission opportunities > Underground portion of NEEWS (if required) > Extensive Smart Grid infrastructure What’s In What’s Not |
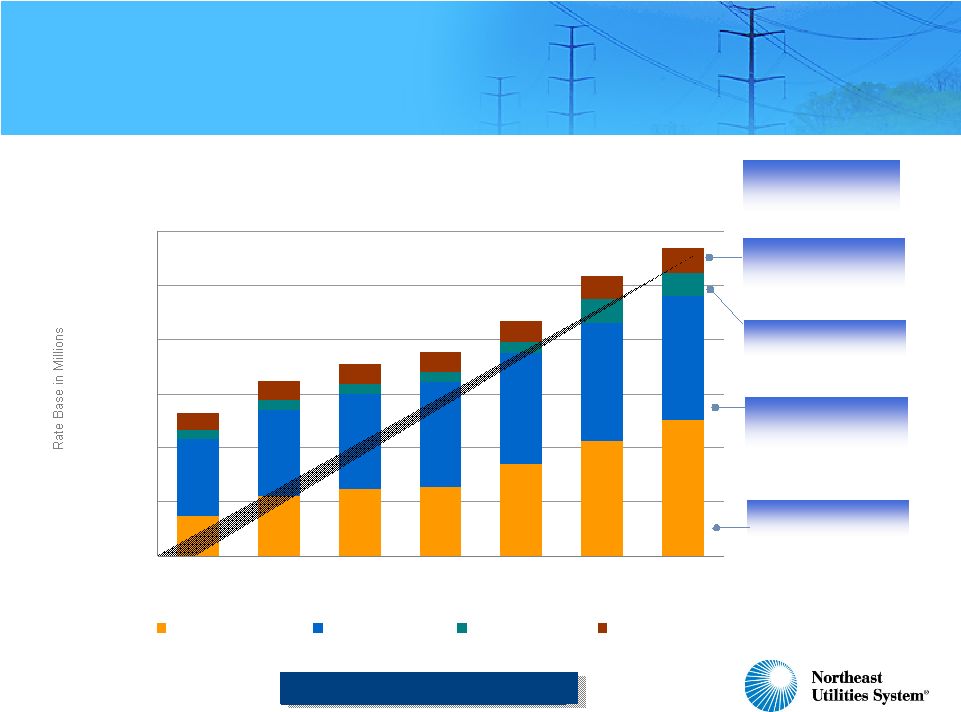
31 Projected Combined Year-End Rate Base $1,476 $2,189 $2,463 $2,576 $3,378 $4,251 $5,044 $2,857 $3,212 $3,535 $3,856 $4,133 $4,371 $4,563 $307 $369 $394 $404 $876 $872 $626 $680 $712 $739 $793 $851 $890 $389 $0 $2,000 $4,000 $6,000 $8,000 $10,000 $12,000 2007 Actual 2008 2009 2010 2011 2012 2013 Transmission Distribution Generation Yankee Gas $6,450 $7,565 $7,099 $8,708 Total Rate Base 2007-2013 CAGR of 14% $5,266 $10,349 Projected Electric Distribution CAGR of 8% Transmission CAGR of 23% $11,369 Projected Generation CAGR of 19% Projected Natural Gas Distribution CAGR of 6% Supports EPS CAGR of 8-11% |
32 Rate Base Composition 2007 Rate Base Composition 2013E Rate Base Composition $5.3 billion $11.4 billion 2007 Rate Base: $1.5 billion ’08-’13E Capex: $4.2 billion 2007 Rate Base: $2.9 billion ’08-’13E Capex: $2.7 billion 2007 Rate Base: $0.6 billion ’08-’13E Capex: $0.5 billion Transmission Electric Distribution Gas Distribution 6% 54% 28% 12% 40% 8% 44% 8% 2007 Rate Base: $0.3 billion ’08-’13E Capex: $0.7 billion Generation Transmission Distribution Generation Gas Transmission Distribution Generation Gas |
33 47.4% 32.6% 36.1% 25.2% 18.1% 21.2% $103.6 $82.5 $28.2 $28.2 $41.1 $59.8 0% 10% 20% 30% 40% 50% 60% 2003 2004 2005 2006* 2007 2008 YTD $0 $20 $40 $60 $80 $100 $120 Transmission’s Share of Earnings Will Continue To Rise *Excludes benefit to CL&P from 2006 tax reduction |
34 Funding The Capital Program and Dividends 2009 - 2013 $3.7 $4.1 $0.6 $8.4 Billion Debt Refinancings New Financings • $250 million - $300 million of equity issuance in 2009 • $300 million - $350 million of debt issuance in 2009 Internally generated cash net of Rate Reduction Bond retirements • Approximately $550 million in 2009 rising to $1 billion by 2013 |
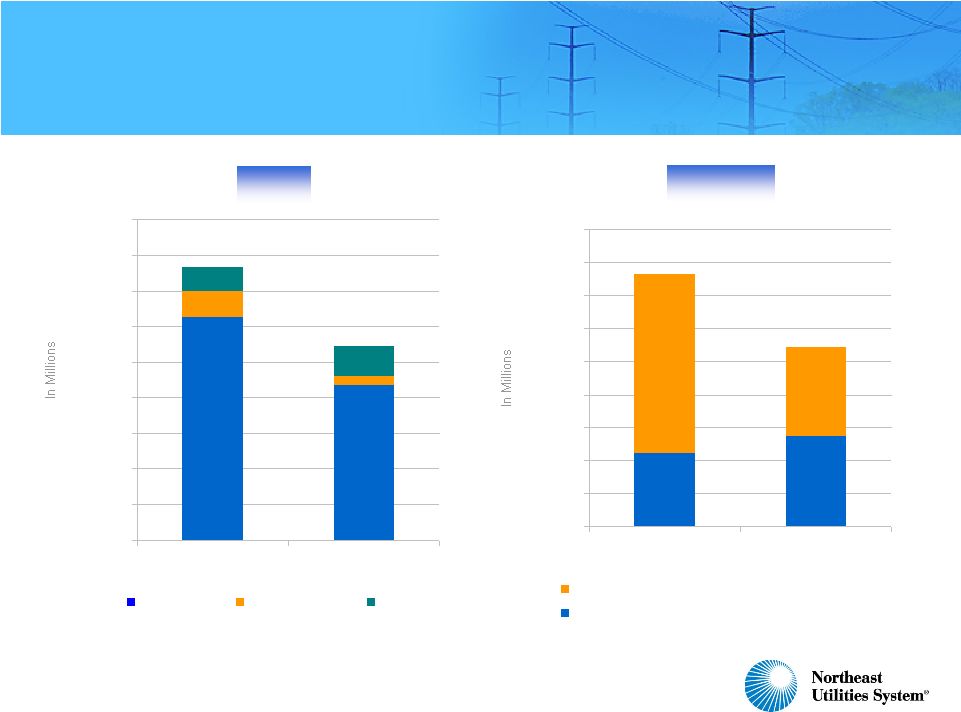
35 $1,250 $870 $150 $50 $130 $170 $0 $200 $400 $600 $800 $1,000 $1,200 $1,400 $1,600 $1,800 2008 2009 Cash capex Debt maturities Other $450 $550 $1,080 $540 $0 $200 $400 $600 $800 $1,000 $1,200 $1,400 $1,600 $1,800 2008 2009 Outside financing net of changes in S-T debt, cash Cash from operations after RRB retirements Cash Requirements Projected To Be Much Lower in 2009 Uses Sources |
36 Summary > We continue to successfully execute our strategic plan to the benefit of customers and investors > We are on track to meet our financial objectives for 2008 > We are well positioned to meet the challenging financial and operating environment for 2009; guidance comparable to 2008 > We have an opportunity to invest up to $7 billion on behalf of our customers over the next five years; drives a 14% rate base growth rate > Management remains focused on total shareholder return • 8-11% earnings growth • Targeting a dividend payout ratio of approximately 50% |
Questions and Answers |
Appendix |
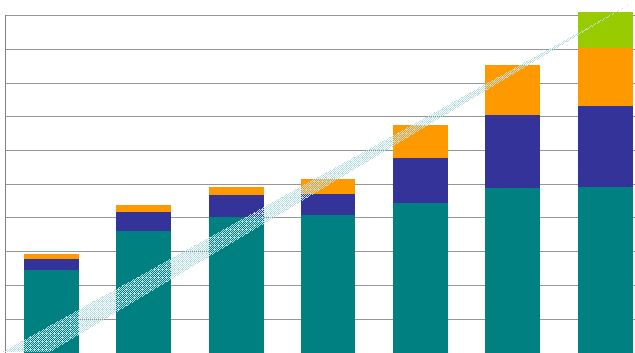
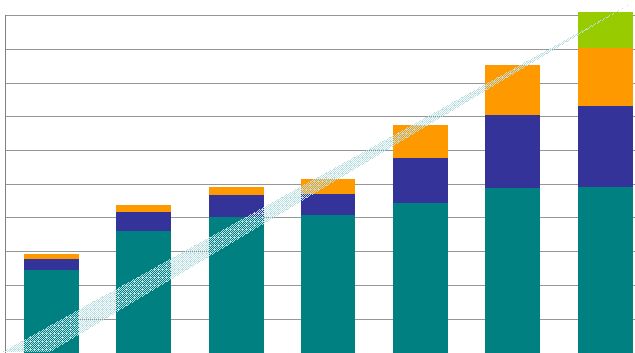
39 Transmission Capital Program and Rate Base Continue to Grow 2006 2007 2008 2009 2010 2011 2012 Fall 2005 EEI Conference Fall 2007 EEI Conference Fall 2006 EEI Conference Five-Year Capital Program -- $2.3 Billion Five-Year Capital Program -- $3.0 Billion Five-Year Capital Program -- $2.4 Billion Annual Plant- in-Service: $ Millions $391 $310 $882 $573 $122 $622 $1189 (Actual) (Projected) 525 0 Line to Canada 5,044 1,476 Total NU 1,189 169 PSNH 876 78 WMECO 2,454 1,229 CL&P Projected 12/31/13 Rate Base ($ Millions) Actual 12/31/07 Rate Base ($ Millions) Operating Company Fall 2008 EEI Conference Five-Year Capital Program -- $3.5 Billion 2013 $1493 |
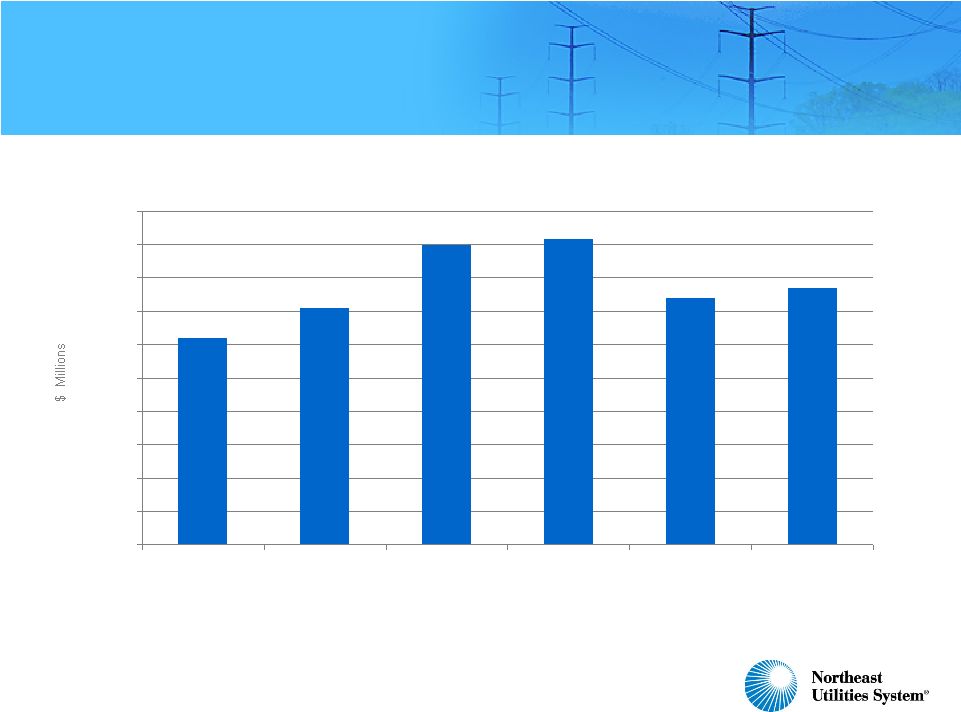
40 2007-2013: Projected Capital Expenditures and Depreciation $1,283 $1,288 $1,815 $1,732 $1,194 $1,274 $892 $456 $410 $369 $351 $327 $282 $265 $0 $200 $400 $600 $800 $1,000 $1,200 $1,400 $1,600 $1,800 $2,000 2007 Actual 2008 2009 2010 2011 2012 2013 Total Capex (incl. cost of removal and AFUDC)* Depreciation *Totals include capex at corporate service companies on behalf of operating companies of $71 million in 2009, $34 million in 2010, $21 million in 2011, $13 million in 2012, and $12 million in 2013. Significant capital spending through 2013 |
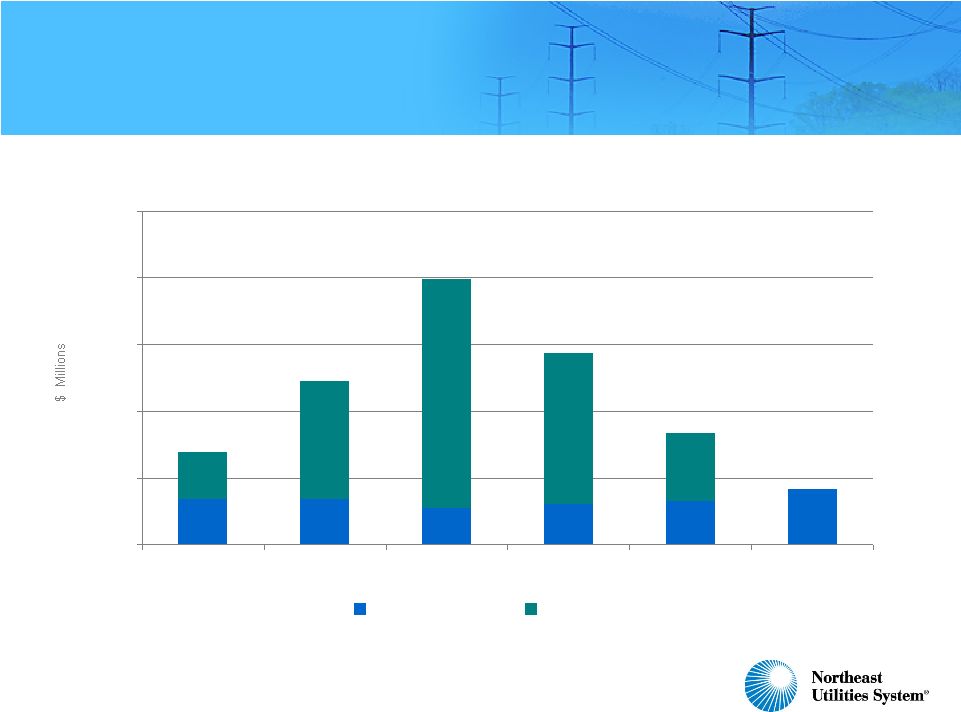
41 $577 $119 $128 $267 $322 $160 $85 $69 $177 $400 $273 $154 $45 $39 $121 $308 $306 $83 $20 $95 $205 $205 $0 $200 $400 $600 $800 $1,000 $1,200 2008 2009 2010 2011 2012 2013 CL&P PSNH WMECO Transmission to Canada Projected Transmission Capital Expenditures $707 $1,070 $1,106 $602 $446 $227 |
42 $292 $280 $352 $338 $309 $311 $101 $92 $115 $117 $114 $117 $35 $28 $38 $33 $33 $34 $0 $100 $200 $300 $400 $500 $600 2008 2009 2010 2011 2012 2013 CL&P PSNH WMECO Projected Distribution Capital Expenditures $428 $505 $400 $456 $488 $462 |
43 $34 $34 $27 $30 $33 $41 $35 $89 $172 $114 $50 $0 $50 $100 $150 $200 $250 2008 2009 2010 2011 2012 2013 Other Clean Air Project Projected Generation Capital Expenditures $69 $199 $123 $83 $144 $41 |
44 $0 $10 $20 $30 $40 $50 $60 $70 $80 $90 $100 2008 2009 2010 2011 2012 2013 Projected Yankee Gas Capital Expenditures $62 $90 $71 $74 $92 $77 |
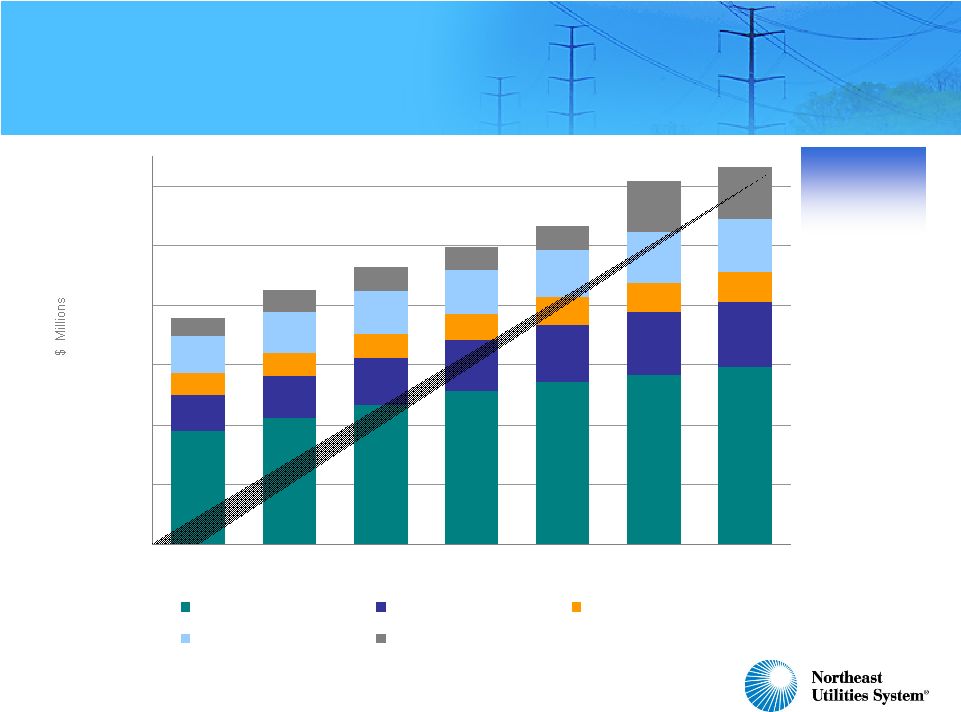
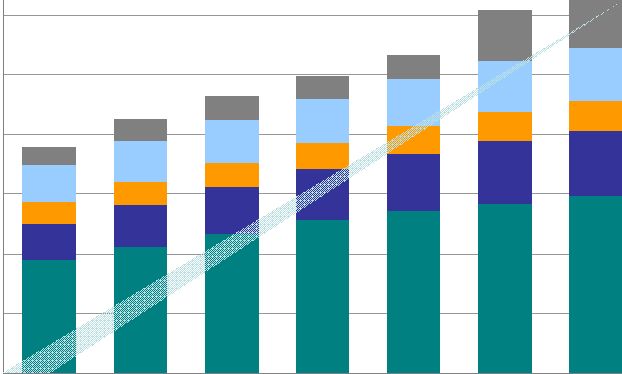
45 Projected Distribution and Generation Year-End Rate Base $1,901 $2,123 $2,351 $2,557 $2,724 $2,851 $2,971 $594 $699 $774 $865 $954 $1,042 $1,095 $362 $390 $410 $434 $455 $478 $497 $626 $680 $712 $739 $793 $851 $890 $307 $369 $389 $394 $404 $876 $872 $0 $1,000 $2,000 $3,000 $4,000 $5,000 $6,000 2007 2008 2009 2010 2011 2012 2013 CL&P Distribution PSNH Distribution WMECO Distribution Yankee Gas PSNH Generation Projected Distribution & Generation Rate Base CAGR of 9% $3,790 $4,636 $4,989 $5,330 $6,098 $6,325 $4,261 |
46 Projected Transmission Year-End Rate Base* $1,229 $2,033 $2,224 $2,433 $2,454 $169 $278 $314 $325 $666 $1,089 $1,189 $78 $99 $125 $218 $488 $876 $1,812 $2,024 $729 $525 $0 $500 $1,000 $1,500 $2,000 $2,500 $3,000 $3,500 $4,000 $4,500 $5,000 2007 Actual 2008 2009 2010 2011 2012 2013 CL&P PSNH WMECO Transmission to Canada Transmission Rate Base CAGR of 23% $1,476 $2,189 $2,576 $3,378 $4,251 $5,044 *100% CWIP assumed for NEEWS projects $2,463 **NU share of this project is depicted as traditional rate base without CWIP during construction ** * * |
47 Strong Liquidity Position $244 $315 $256 $85 $86 $0 $100 $200 $300 $400 $500 $600 Parent Revolver Regulated Revolver Externally Invested Cash Undrawn Drawn/LOCs $54 $4 $4 $267 $305 $0 $50 $100 $150 $200 $250 $300 $350 2009 2010 2011 2012 2013 Liquidity as of November 5, 2008 Long-Term Debt Maturities *Excludes $45 million drawn on regulated revolver and RRBs * |
48 2006 – 2009 NU Consolidating EPS GAAP / Non-GAAP Reconciliation 2006 Actual 2007 Actual 2008 Current Guidance 2009 Projected Guidance Distribution / Generation 0.80 $ 0.94 $ $1.05 - $1.10 $1.00 - $1.10 Transmission 0.39 0.53 0.85 - 0.90 0.85 - 0.90 NU Parent / Other (0.03) 0.04 (0.10) (0.05) Total Regulated and Parent 1.16 $ 1.51 $ $1.80 - $1.90 $1.80 - $1.95 Competitive (0.63) 0.08 0.00 - 0.05 0.00 - 0.05 NU Consolidated Operating Results 0.53 $ 1.59 $ $1.80 - $1.95 $1.80 - $2.00 CL&P Income Tax Reduction 0.48 N/A N/A N/A Gain on Sale of Competitive Generation 2.04 N/A N/A N/A Litigation Charge N/A N/A (0.19) N/A NU Consolidated GAAP 3.05 $ 1.59 $ $1.60 - $1.75 $1.80 - $2.00 |