Exhibit 99

Link to searchable text of slide shown above
Link to searchable text of slide shown above
Link to searchable text of slide shown above
Link to searchable text of slide shown above
Link to searchable text of slide shown above
Link to searchable text of slide shown above
Link to searchable text of slide shown above
Link to searchable text of slide shown above

Link to searchable text of slide shown above
Link to searchable text of slide shown above
Link to searchable text of slide shown above
Link to searchable text of slide shown above
Link to searchable text of slide shown above
Link to searchable text of slide shown above
Link to searchable text of slide shown above
Link to searchable text of slide shown above
Link to searchable text of slide shown above
Link to searchable text of slide shown above

Link to searchable text of slide shown above
Link to searchable text of slide shown above
Link to searchable text of slide shown above
Link to searchable text of slide shown above
Link to searchable text of slide shown above
Link to searchable text of slide shown above
Link to searchable text of slide shown above
Link to searchable text of slide shown above
Link to searchable text of slide shown above
Link to searchable text of slide shown above
Link to searchable text of slide shown above
Link to searchable text of slide shown above
Link to searchable text of slide shown above
Link to searchable text of slide shown above
Link to searchable text of slide shown above
Link to searchable text of slide shown above
Link to searchable text of slide shown above
Link to searchable text of slide shown above
Link to searchable text of slide shown above
Link to searchable text of slide shown above
Link to searchable text of slide shown above
Link to searchable text of slide shown above
Link to searchable text of slide shown above
Link to searchable text of slide shown above
Searchable text section of graphics shown above
Exhibit 99
We Never Left the Basics
[PICTURE]
[LOGO]
Deutsche Bank Securities
2003 Electric Power Conference
New York, NY
Joan S. Freilich
Executive Vice President & Chief Financial Officer
June 10, 2003
2
This presentation contains forward-looking statements, which are statements of future expectations and not facts. Actual results or developments might differ materially from those included in the forward-looking statements because of factors such as competition and industry restructuring, changes in economic conditions, changes in historical weather patterns, changes in laws, regulations or regulatory policies, developments in legal or public policy doctrines, technological developments and other presently unknown or unforeseen factors. Other risk factors are detailed from time to time in the company’s SEC reports.
3
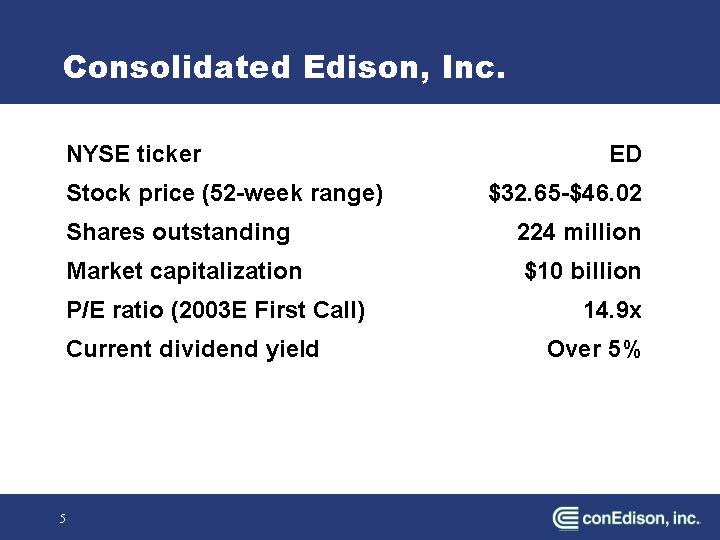
Consolidated Edison, Inc.
• Value as investment
• Core strengths
• Maintaining our edge
• Balance sheet strength and flexibility
4
NYSE ticker |
| ED |
|
Stock price (52-week range) |
| $32.65-$46.02 |
|
Shares outstanding |
| 224 million |
|
Market capitalization |
| $10 billion |
|
P/E ratio (2003E First Call) |
| 14.9 | x |
Current dividend yield |
| Over 5 | % |
5
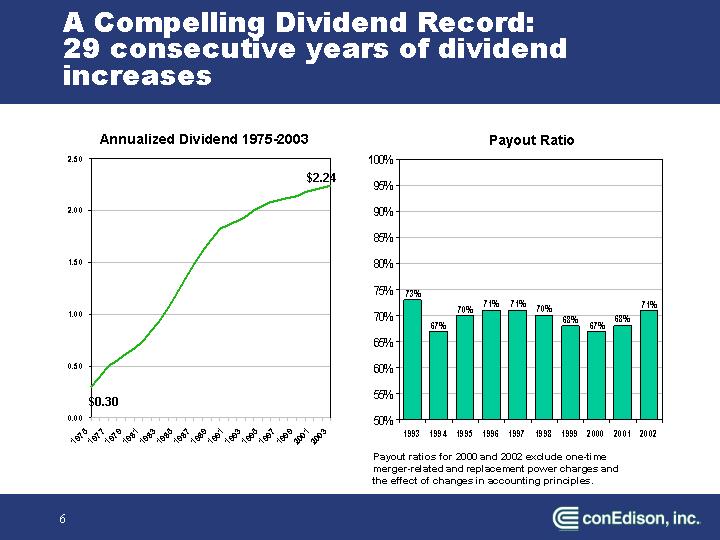
A Compelling Dividend Record:
29 consecutive years of dividend increases
Annualized Dividend 1975-2003
[CHART]
Payout Ratio
Payout ratios for 2000 and 2002 exclude one-time merger-related and replacement power charges and the effect of changes in accounting principles.
6
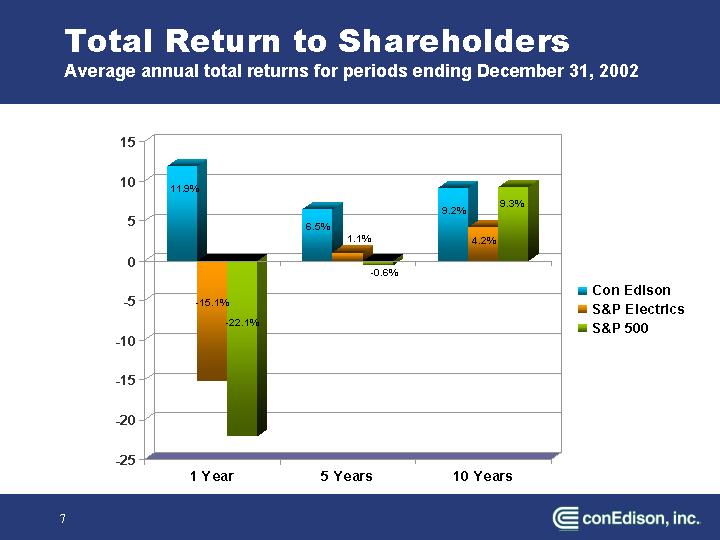
Total Return to Shareholders
Average annual total returns for periods ending December 31, 2002
[CHART]
7
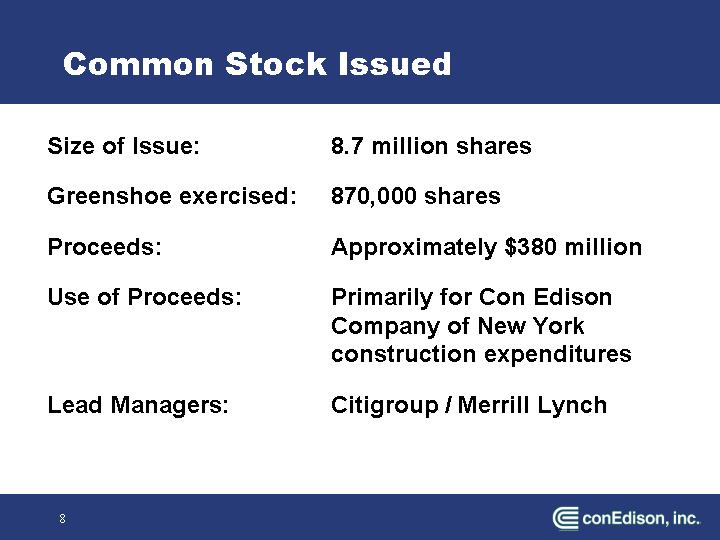
Common Stock Issued
Size of Issue: |
| 8.7 million shares |
|
|
|
Greenshoe exercised: |
| 870,000 shares |
|
|
|
Proceeds: |
| Approximately $380 million |
|
|
|
Use of Proceeds: |
| Primarily for Con Edison Company of New York construction expenditures |
|
|
|
Lead Managers: |
| Citigroup / Merrill Lynch |
8
Keys to Our Success
• Unwavering strategic focus
• Low risk business model
• Constructive regulatory relationships
• Conservative business philosophy that seeks to maintain financial strength
• Disciplined approach to non-regulated business opportunities
• Highest standards of corporate governance and integrity
9
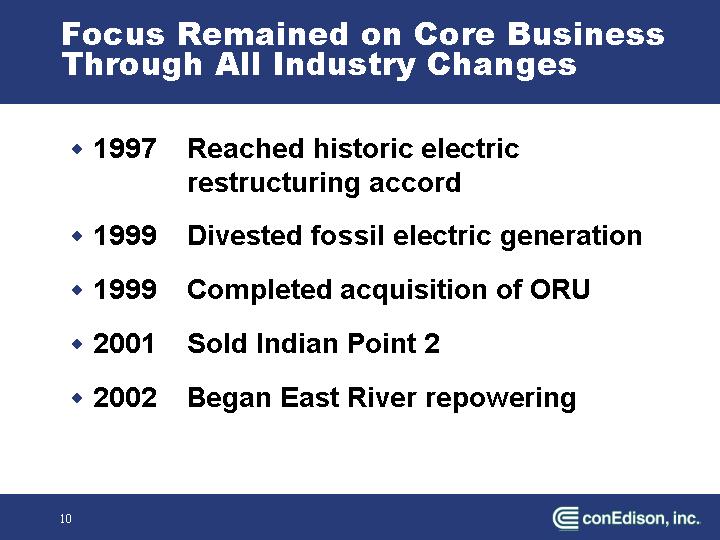
Focus Remained on Core Business Through All Industry Changes
• 1997 Reached historic electric restructuring accord
• 1999 Divested fossil electric generation
• 1999 Completed acquisition of ORU
• 2001 Sold Indian Point 2
• 2002 Began East River repowering
10
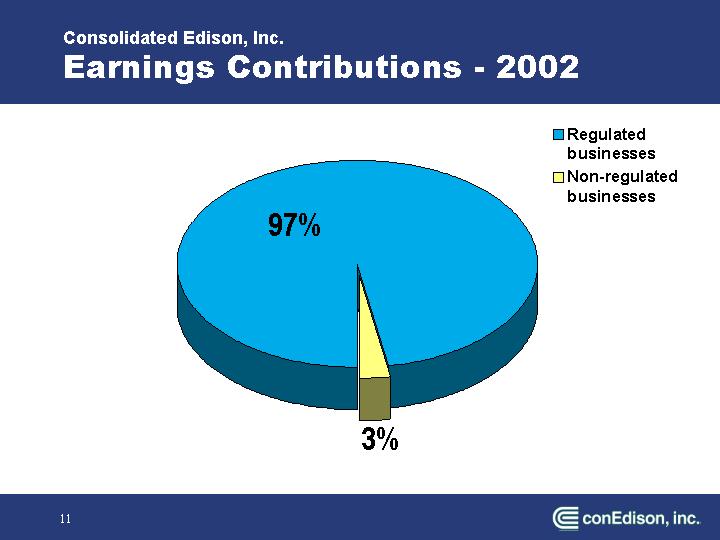
Consolidated Edison, Inc.
Earnings Contributions - 2002
[CHART]
11
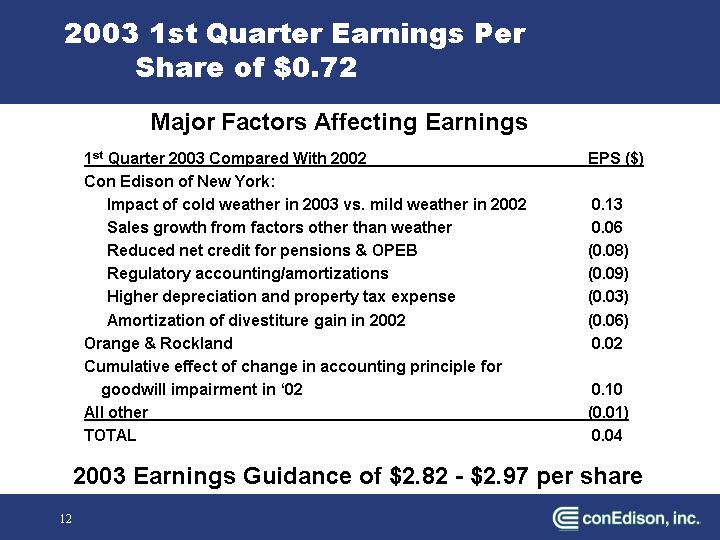
2003 1st Quarter Earnings Per Share of $0.72
Major Factors Affecting Earnings
1st Quarter 2003 Compared With 2002 |
| EPS ($) |
|
Con Edison of New York: |
|
|
|
Impact of cold weather in 2003 vs. mild weather in 2002 |
| 0.13 |
|
Sales growth from factors other than weather |
| 0.06 |
|
Reduced net credit for pensions & OPEB |
| (0.08 | ) |
Regulatory accounting/amortizations |
| (0.09 | ) |
Higher depreciation and property tax expense |
| (0.03 | ) |
Amortization of divestiture gain in 2002 |
| (0.06 | ) |
Orange & Rockland |
| 0.02 |
|
Cumulative effect of change in accounting principle for goodwill impairment in ‘02 |
| 0.10 |
|
All other |
| (0.01 | ) |
TOTAL |
| 0.04 |
|
2003 Earnings Guidance of $2.82 - $2.97 per share
12
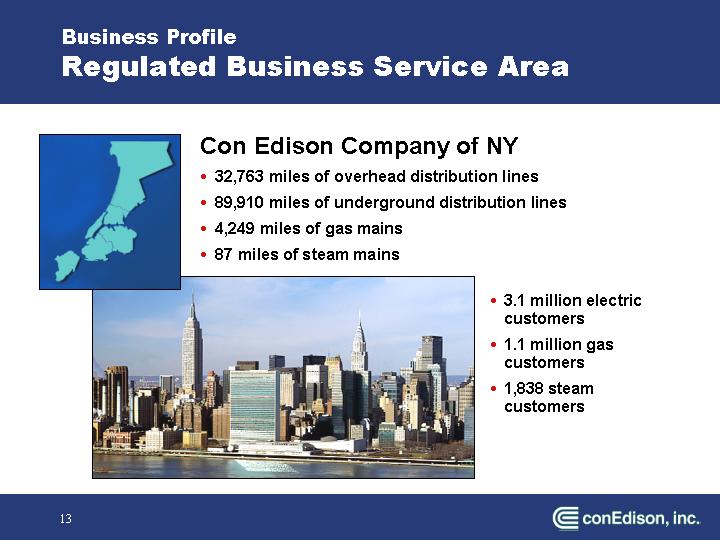
Business Profile
Regulated Business Service Area
[PICTURE]
Con Edison Company of NY
• 32,763 miles of overhead distribution lines
• 89,910 miles of underground distribution lines
• 4,249 miles of gas mains
• 87 miles of steam mains
[PICTURE]
• 3.1 million electric customers
• 1.1 million gas customers
• 1,838 steam customers
13
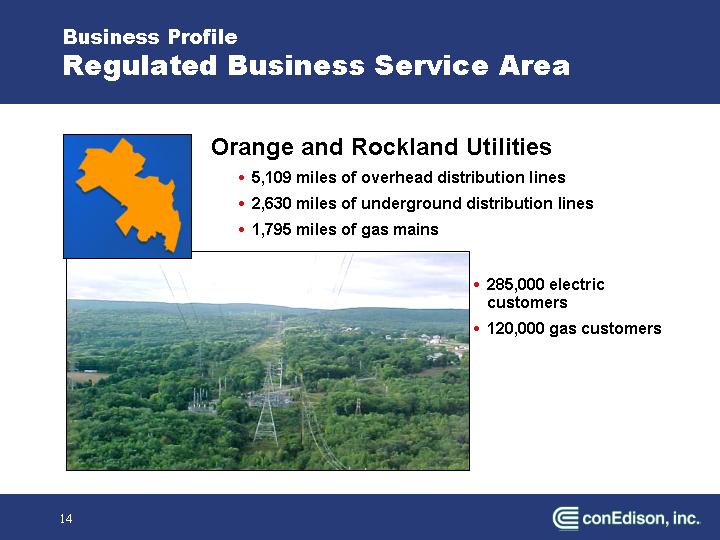
[PICTURE]
Orange and Rockland Utilities
• 5,109 miles of overhead distribution lines
• 2,630 miles of underground distribution lines
• 1,795 miles of gas mains
[PICTURE]
• 285,000 electric customers
• 120,000 gas customers
14
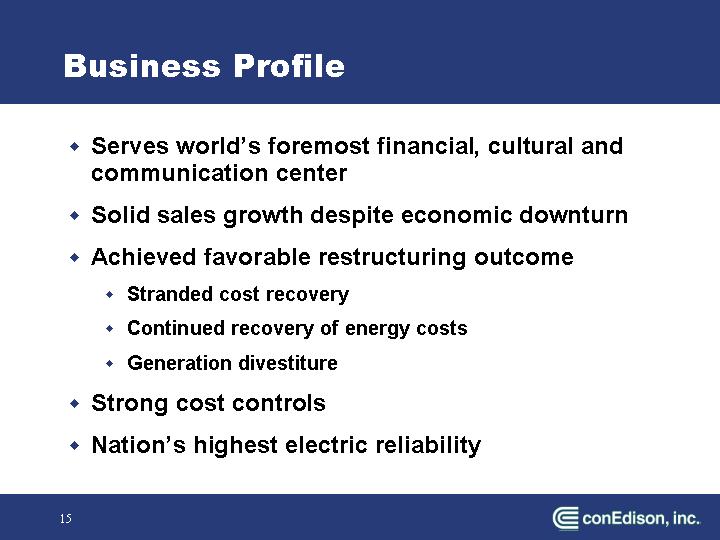
• Serves world’s foremost financial, cultural and communication center
• Solid sales growth despite economic downturn
• Achieved favorable restructuring outcome
• Stranded cost recovery
• Continued recovery of energy costs
• Generation divestiture
• Strong cost controls
• Nation’s highest electric reliability
15
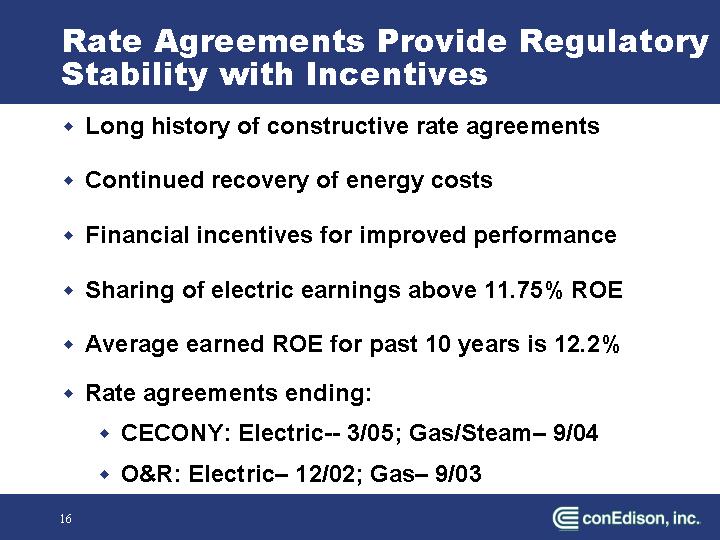
Rate Agreements Provide Regulatory Stability with Incentives
• Long history of constructive rate agreements
• Continued recovery of energy costs
• Financial incentives for improved performance
• Sharing of electric earnings above 11.75% ROE
• Average earned ROE for past 10 years is 12.2%
• Rate agreements ending:
• CECONY: Electric— 3/05; Gas/Steam– 9/04
• O&R: Electric– 12/02; Gas– 9/03
16
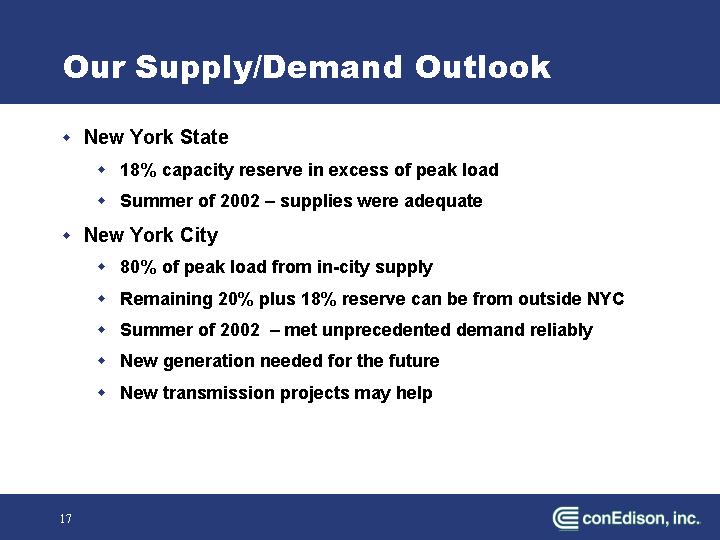
Our Supply/Demand Outlook
• New York State
• 18% capacity reserve in excess of peak load
• Summer of 2002 – supplies were adequate
• New York City
• 80% of peak load from in-city supply
• Remaining 20% plus 18% reserve can be from outside NYC
• Summer of 2002 – met unprecedented demand reliably
• New generation needed for the future
• New transmission projects may help
17
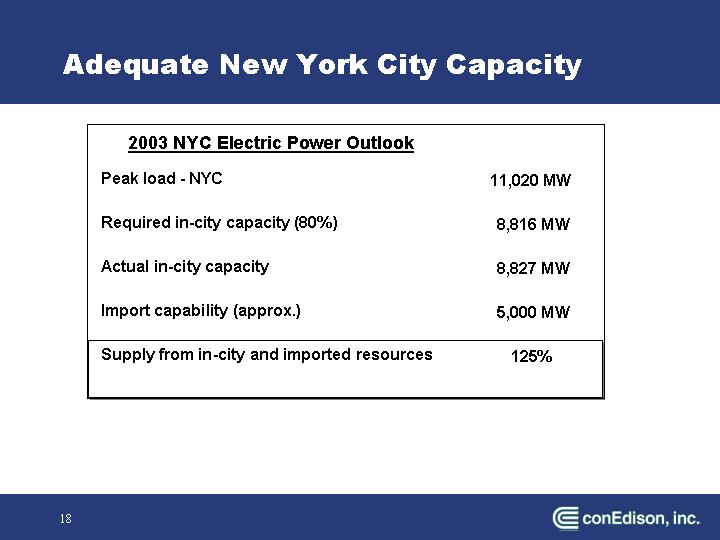
Adequate New York City Capacity
2003 NYC Electric Power Outlook
Peak load - NYC |
| 11,020 | MW |
|
|
|
|
Required in-city capacity (80%) |
| 8,816 | MW |
|
|
|
|
Actual in-city capacity |
| 8,827 | MW |
|
|
|
|
Import capability (approx.) |
| 5,000 | MW |
|
|
|
|
Supply from in-city and imported resources |
| 125 | % |
18
Helping to Ensure Adequate Electric Supply
• December 2002 - Issued RFP for 500 MW of new capacity
• Must be delivered in NYC for up to 10 years beginning May 1, 2006
• Must be in-city and combined-cycle or baseload
• Contract awarded to Astoria Energy
19
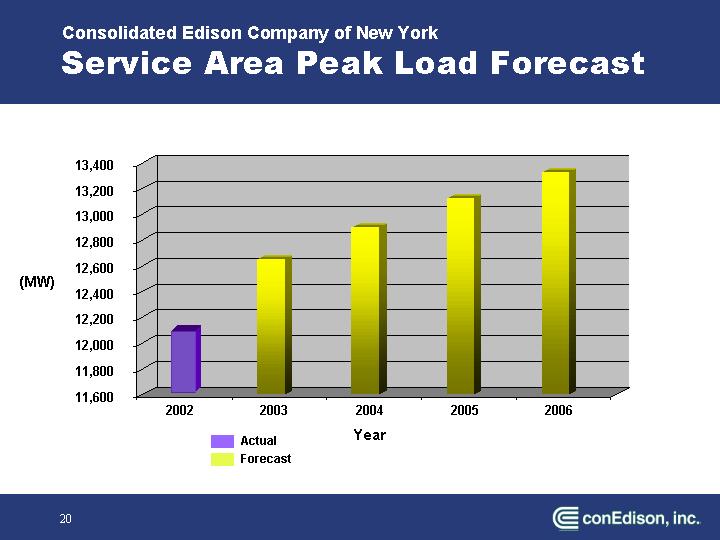
Consolidated Edison Company of New York
Service Area Peak Load Forecast
[CHART]
20
[PICTURE]
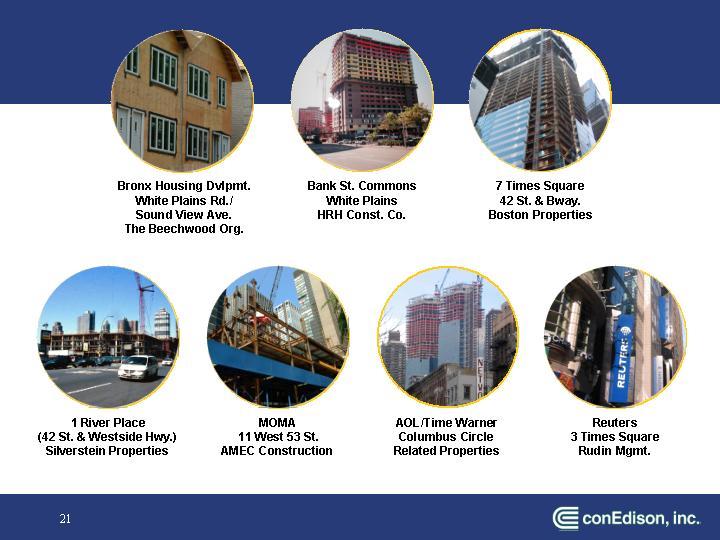
Bronx Housing Dvlpmt.
White Plains Rd./
Sound View Ave.
The Beechwood Org.
[PICTURE]
Bank St. Commons
White Plains
HRH Const. Co.
[PICTURE]
7 Times Square
42 St. & Bway.
Boston Properties
[PICTURE]
1 River Place
(42 St. & Westside Hwy.)
Silverstein Properties
[PICTURE]
MOMA
11 West 53 St.
AMEC Construction
[PICTURE]
AOL/Time Warner
Columbus Circle
Related Properties
[PICTURE]
Reuters
3 Times Square
Rudin Mgmt.
21
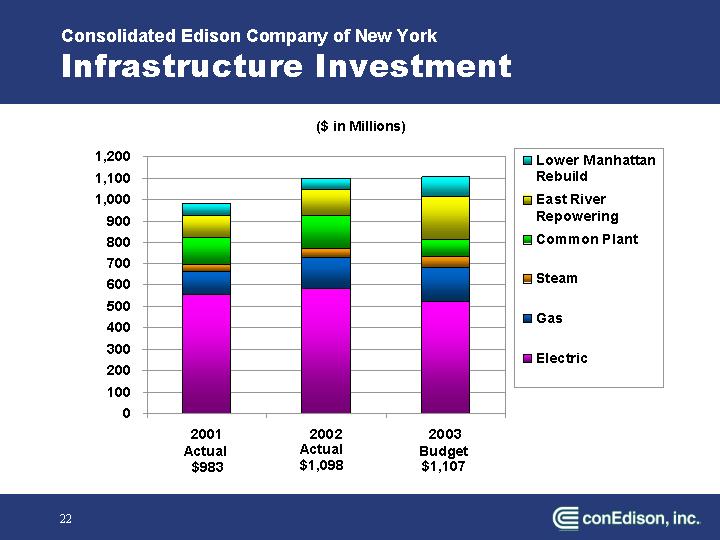
Consolidated Edison Company of New York
Infrastructure Investment
[CHART]
22
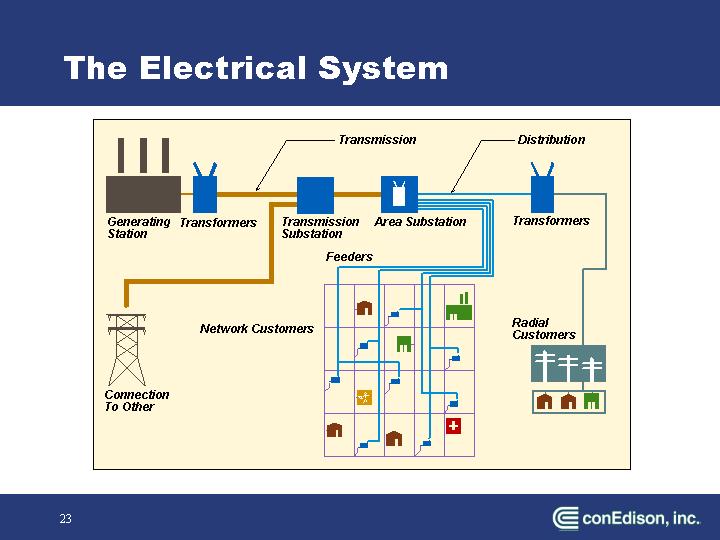
The Electrical System
[GRAPHIC]
23
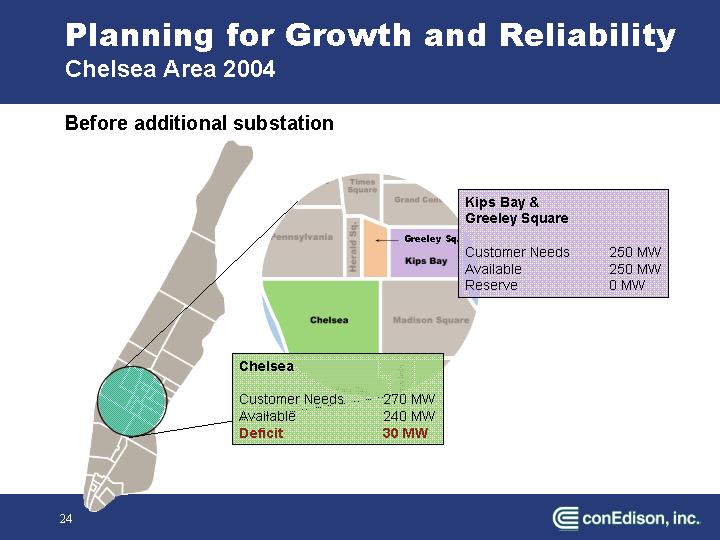
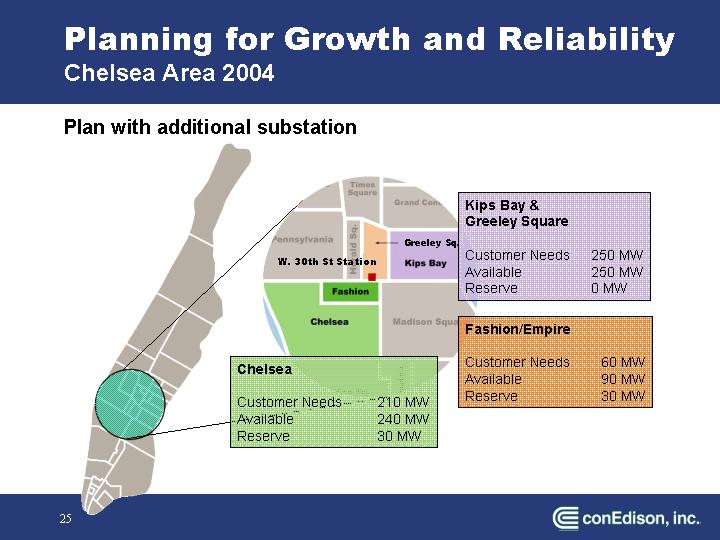
Planning for Growth and Reliability
Chelsea Area 2004
Before additional substation
[GRAPHIC]
24
Plan with additional substation
[GRAPHIC]
25
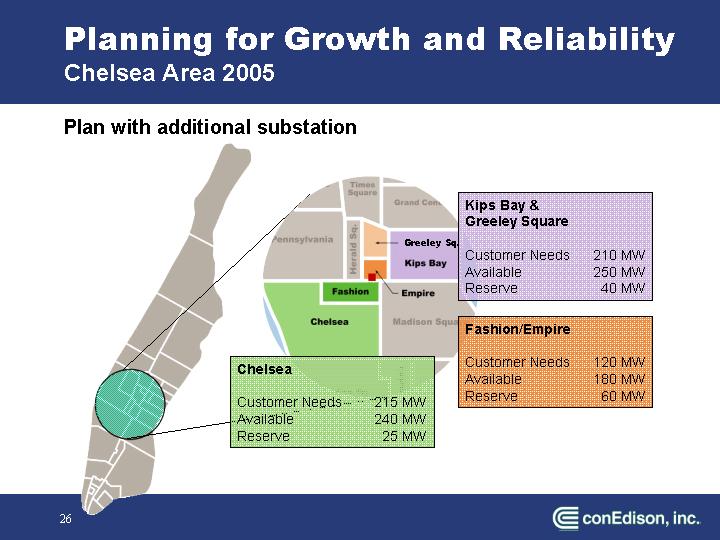
Planning for Growth and Reliability
Chelsea Area 2005
Plan with additional substation
[GRAPHIC]
26
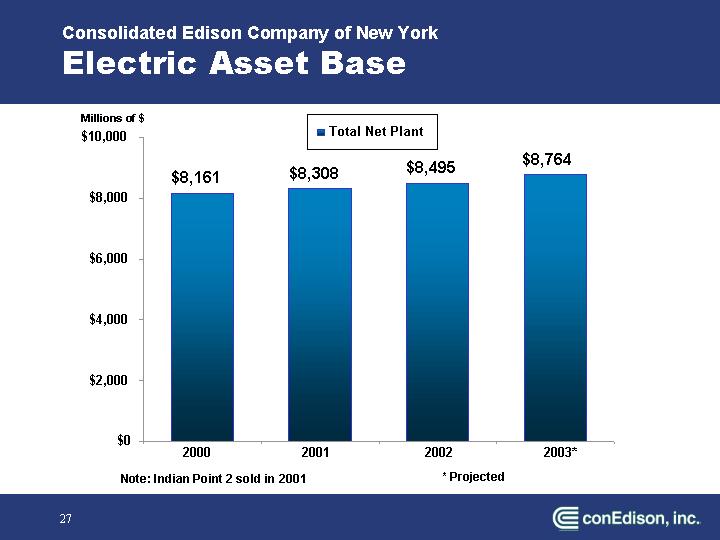
Consolidated Edison Company of New York
Electric Asset Base
[CHART]
27
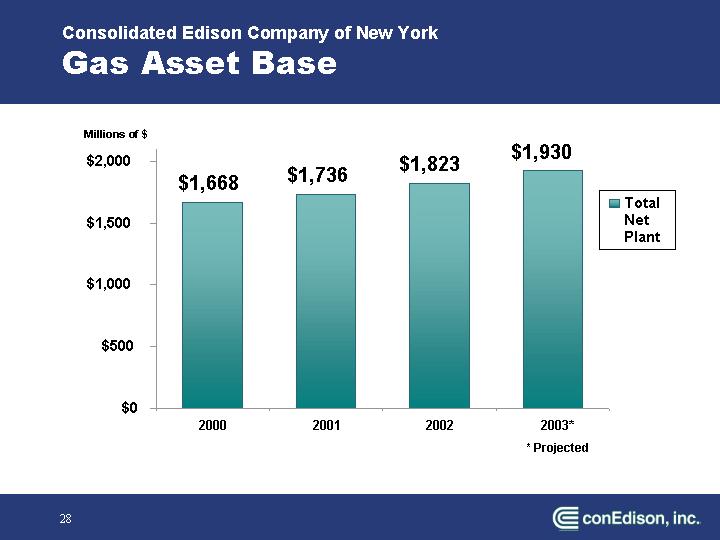
Gas Asset Base
[CHART]
28
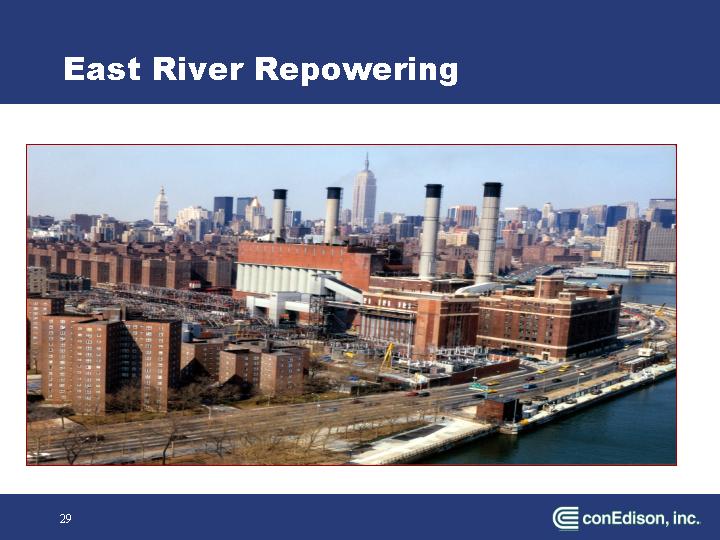
East River Repowering
[PICTURE]
29
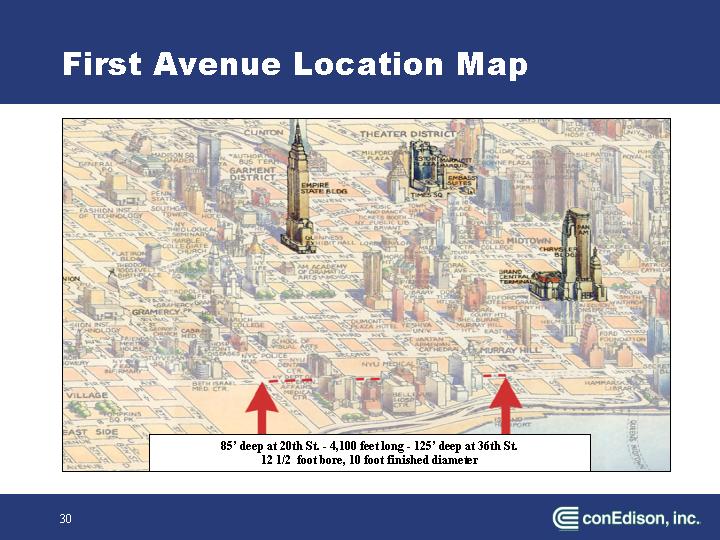
FIRST AVENUE LOCATION MAP
[PICTURE]
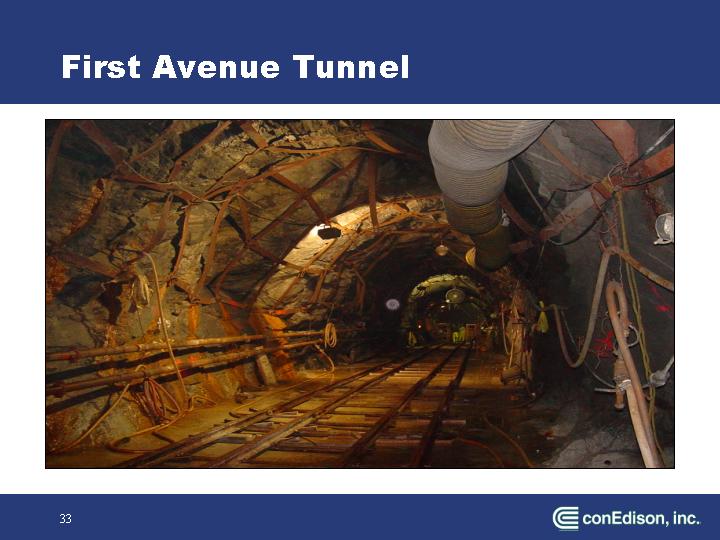
85’ deep at 20th St. - 4,100 feet long - 125’ deep at 36th St.
12 1/2 foot bore, 10 foot finished diameter
30
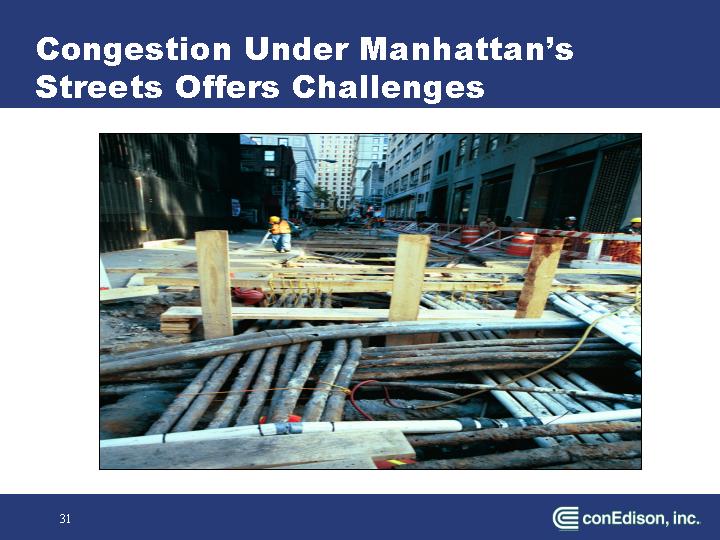
Congestion Under Manhattan’s Streets Offers Challenges
[PICTURE]
31
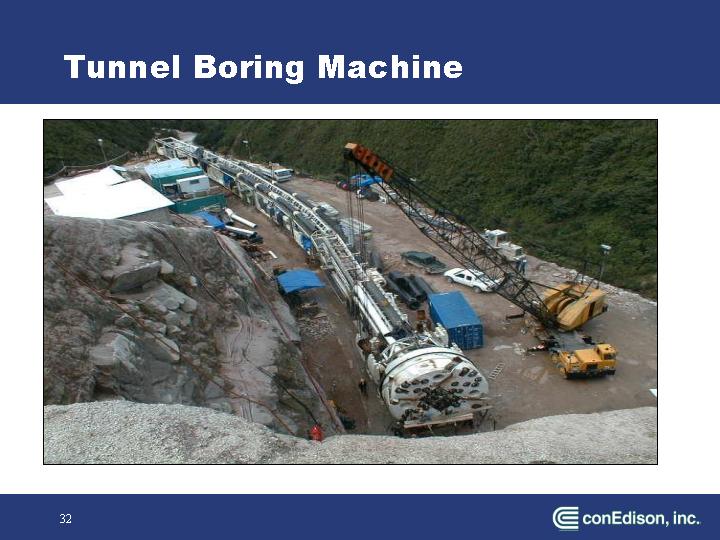
Tunnel Boring Machine
[PICTURE]
32
First Avenue Tunnel
[PICTURE]
33
Lower Manhattan Rebuild
• Cost – mostly capital - includes:
• Emergency response
• Temporary restoration
• Permanent replacement of facilities
• Federal reimbursement has been approved but not yet disbursed
• Cost incurred as of March 31, 2003
• $217 million
34
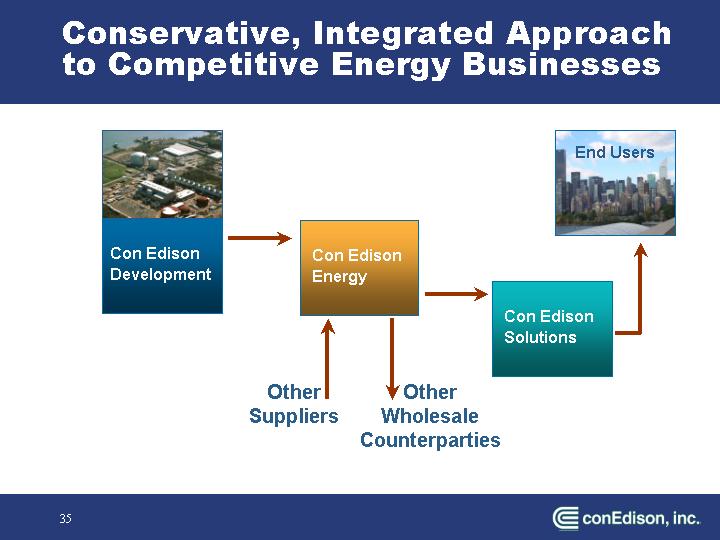
Conservative, Integrated Approach to Competitive Energy Businesses
[CHART]
35
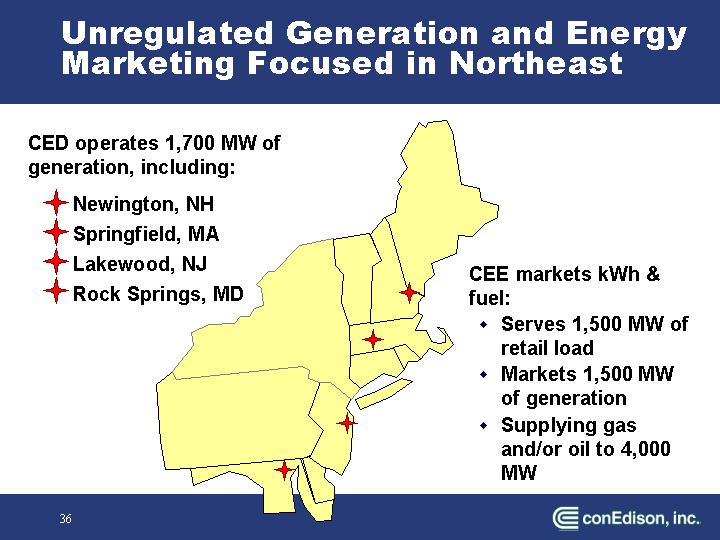
Unregulated Generation and Energy Marketing Focused in Northeast
CED operates 1,700 MW of generation, including:
• Newington, NH
• Springfield, MA
• Lakewood, NJ
• Rock Springs, MD
[GRAPHIC]
CEE markets kWh & fuel:
• Serves 1,500 MW of retail load
• Markets 1,500 MW of generation
• Supplying gas and/or oil to 4,000 MW
36
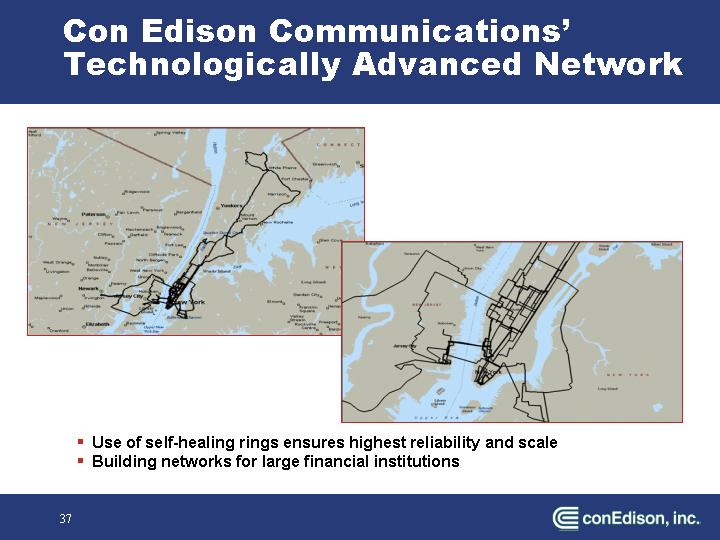
Con Edison Communications’ Technologically Advanced Network
[GRAPHIC]
• Use of self-healing rings ensures highest reliability and scale
• Building networks for large financial institutions
37
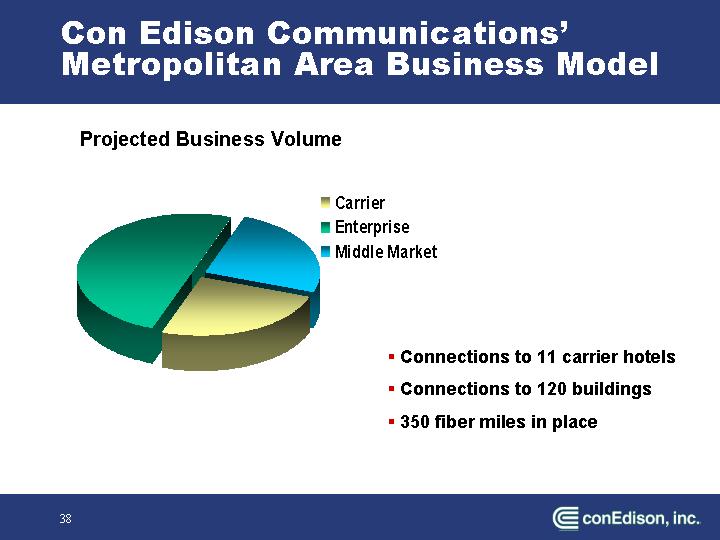
Con Edison Communications’ Metropolitan Area Business Model
Projected Business Volume
[CHART]
• Connections to 11 carrier hotels
• Connections to 120 buildings
• 350 fiber miles in place
38
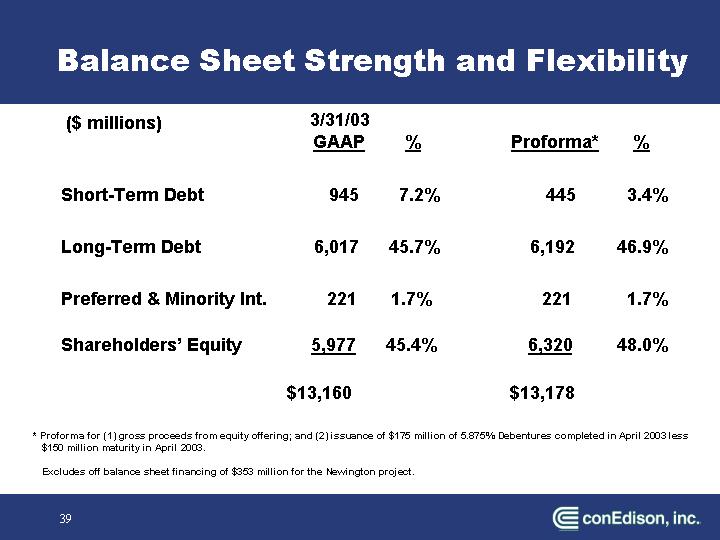
Balance Sheet Strength and Flexibility
($ millions) |
| 3/31/03 |
|
| GAAP |
| % |
| Proforma* |
| % |
| ||
|
|
|
|
|
|
|
|
|
| ||
Short-Term Debt |
| 945 |
| 7.2 | % | 445 |
| 3.4 | % | ||
|
|
|
|
|
|
|
|
|
| ||
Long-Term Debt |
| 6,017 |
| 45.7 | % | 6,192 |
| 46.9 | % | ||
|
|
|
|
|
|
|
|
|
| ||
Preferred & Minority Int. |
| 221 |
| 1.7 | % | 221 |
| 1.7 | % | ||
|
|
|
|
|
|
|
|
|
| ||
Shareholders’ Equity |
| 5,977 |
| 45.4 | % | 6,320 |
| 48.0 | % | ||
|
|
|
|
|
|
|
|
|
| ||
|
| $ | 13,160 |
|
|
| $ | 13,178 |
|
|
|
* Proforma for (1) gross proceeds from equity offering; and (2) issuance of $175 million of 5.875% Debentures completed in April 2003 less $150 million maturity in April 2003.
Excludes off balance sheet financing of $353 million for the Newington project.
39
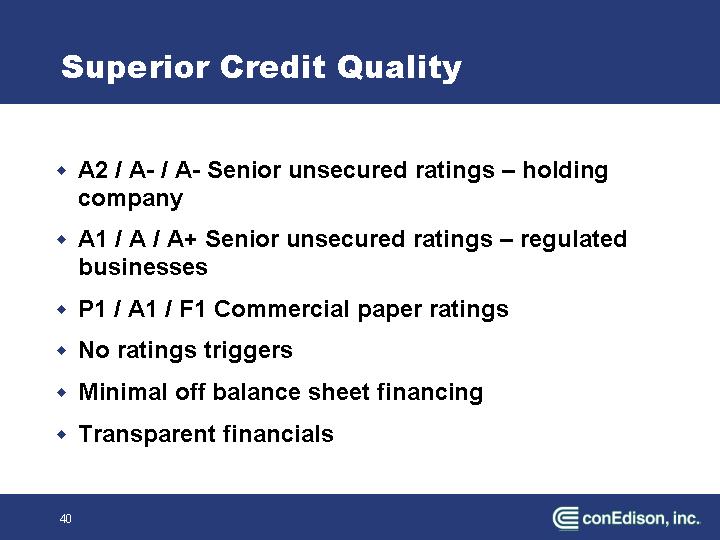
Superior Credit Quality
• A2 / A- / A- Senior unsecured ratings – holding company
• A1 / A / A+ Senior unsecured ratings – regulated businesses
• P1 / A1 / F1 Commercial paper ratings
• No ratings triggers
• Minimal off balance sheet financing
• Transparent financials
40
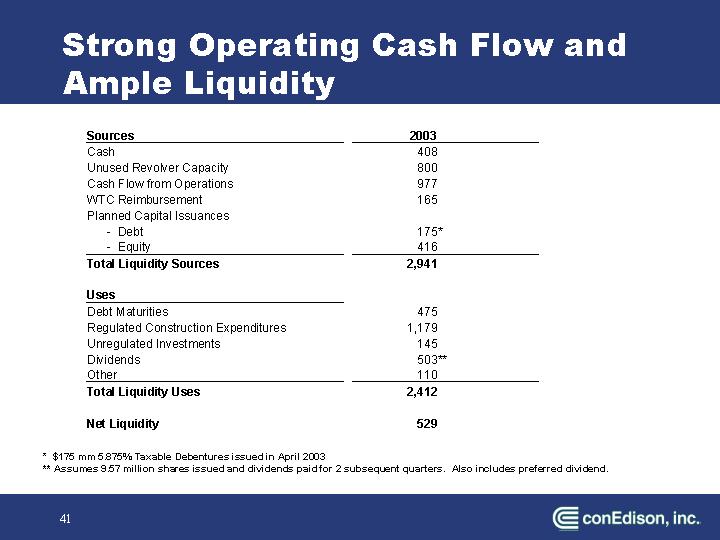
Strong Operating Cash Flow and Ample Liquidity
|
| 2003 |
|
Sources |
|
|
|
Cash |
| 408 |
|
Unused Revolver Capacity |
| 800 |
|
Cash Flow from Operations |
| 977 |
|
WTC Reimbursement |
| 165 |
|
Planned Capital Issuances |
|
|
|
- Debt |
| 175 | * |
- Equity |
| 416 |
|
Total Liquidity Sources |
| 2,941 |
|
|
|
|
|
Uses |
|
|
|
Debt Maturities |
| 475 |
|
Regulated Construction Expenditures |
| 1,179 |
|
Unregulated Investments |
| 145 |
|
Dividends |
| 503 | ** |
Other |
| 110 |
|
Total Liquidity Uses |
| 2,412 |
|
|
|
|
|
Net Liquidity |
| 529 |
|
* $175 mm 5.875% Taxable Debentures issued in April 2003
** Assumes 9.57 million shares issued and dividends paid for 2 subsequent quarters. Also includes preferred dividend.
41
Our Value for Investors
• Most reliable electric delivery system
• Focused investment in infrastructure
• Dependable and predictable earnings stream
• Strong balance sheet and solid credit ratings
• Total return for past 10 years more than double industry average
• Stability in the midst of market uncertainty
• Strong credibility in the market
42