 Barclays Back To School Conference Sean Connolly, CEO Maria Henry, CFO September 5, 2012 Exhibit 99 |
 Forward Looking Statements We caution you that our remarks today may contain forward-looking statements about Hillshire Brands’ future operations, financial performance, and business conditions. These forward-looking statements are based on currently available competitive, financial, and economic data, as well as management’s views and assumptions regarding future events. Such forward-looking statements are inherently uncertain, and investors must recognize that actual results may differ from those expressed or implied in these statements. Consequently, we caution you not to place undue reliance on forward-looking statements. We have provided additional information in past Hillshire Brands’ press releases and the Form 10-K, which we encourage you to review concerning factors that could cause actual results to differ materially from these forward-looking statements. 2 Barclays Back to School Conference |
 FY12 Results Barclays Back to School Conference 3 FY11 FY12 YoY Adjusted Net Sales 3,884 4,039 +4.0% Adjusted Gross Profit 1,173 1,148 (2.1)% Adjusted Gross Margin 30.2% 28.4% (180) Bps Adjusted MAP 122 137 +12.9% Adjusted Op Seg Income 414 396 (4.7)% Adjusted Op Seg Margin 10.7% 9.8% (90) Bps Adjusted Diluted EPS $1.20 $1.47 +23% Continuing operations ($ millions, excludes significant items) Note: Preliminary, pending filing of the 10-K “Adjusted” numbers are non-GAAP financial measures. See our reconciliation to the most directly comparable GAAP measure at the end of this presentation. |
 Pro Forma EPS Reflects Our New Organization and Capital Structure Continuing operations (excludes significant items) 4 Barclays Back to School Conference FY11 FY12 Adjusted Diluted EPS $1.20 $1.47 Exited Businesses (0.02) (0.04) Corporate 0.16 (0.01) Net Interest 0.25 0.17 Tax Rate (0.01) (0.04) Pro Forma Diluted EPS $1.58 $1.55 Note: Preliminary, pending filing of the 10-K “Adjusted” and “Pro Forma” numbers are non-GAAP financial measures. See our reconciliation to the most directly comparable GAAP measure at the end of this presentation. “Pro Forma Diluted EPS” is a non-GAAP financial measure calculated excluding the impact of significant items, exited businesses, and using estimated FY13 assumptions for corporate costs of $70 million, net interest expense of $40 million, and a tax rate of 35%. |
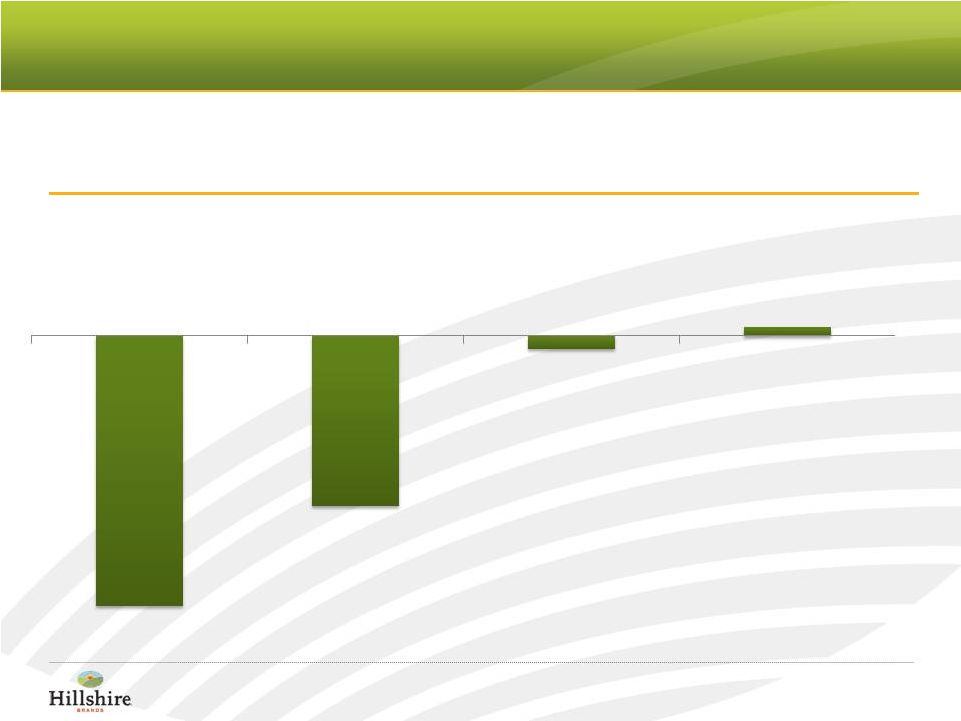 Volumes Stabilized in Second Half Barclays Back to School Conference 5 Organic Volume* YOY% change from FY11 to FY12 * Organic volume excludes exited businesses and non-comparable periods for acquired businesses (6.2)% (3.9)% (0.3)% 0.2% Q1 Q2 Q3 Q4 |
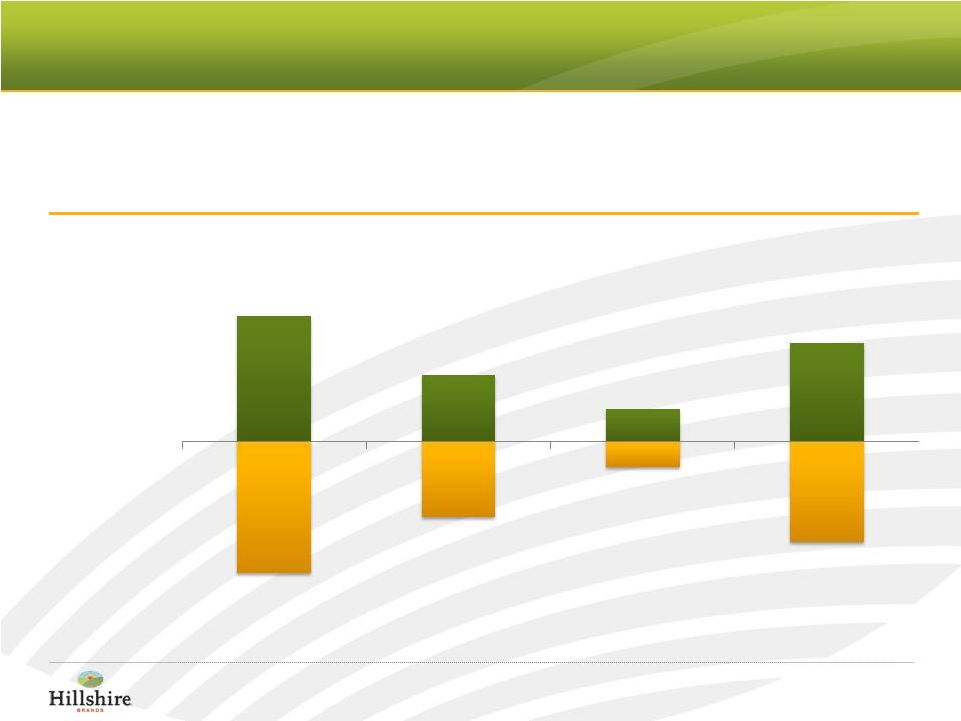 Pricing and Commodities Moderated in Second Half FY11 Excludes Australia (10) (15) +11 (5) Pricing Commodities $ millions 6 Barclays Back to School Conference 208 110 53 162 (218) (125) (42) (167) FY11 FY12 H1 FY12 H2 FY12 |
 FY13 Guidance Barclays Back to School Conference 7 Guidance Perspective Conviction to invest in strategic areas Some weak spots in the portfolio Transition year: more variability in outcome Adjusted EPS $1.40 - $1.55 Net sales in line with FY12 |
 Conservative Capital Structure Barclays Back to School Conference 8 $ millions FY12 YE Cash Balance $235 FY12 YE Debt Balance $944 Legacy Cash Obligation $190-210 Net Interest Expense $35-40 Dividend Payout Ratio 32-36% Note: Dividend payout ratio based on Adjusted EPS Guidance |
 Capital Allocation Barclays Back to School Conference 9 Top priority Expect to increase over time Strategic and opportunistic Not in the near term Low priority Invest in Business Dividends Acquisitions Share Repurchases Pay Down Debt |
 Significant Value Creation Opportunity Barclays Back to School Conference 10 Volume Growth 2-3% Net Sales Growth 4-5% MAP % of Total Revenue 5% Operating Margin 10% 2015 TARGETS |
 Appendix Barclays Back to School Conference 11 |
 ($ in millions) As Reported Impact of Significant Items Disp. Adjusted (1) As Reported Impact of Significant Items Disp. Adjusted (1) Net Sales 4,094 $ - $ 55 $ 4,039 $ 4,019 $ - $ 135 $ 3,884 $ Cost of Sales 2,961 30 40 2,891 2,824 2 112 2,710 Gross Profit 1,133 (30) 15 1,148 1,195 (2) 23 1,174 MAP Expense 137 - - 137 124 - 2 122 SG&A (excluding MAP) 628 6 7 615 656 - 18 638 Net charges for exit activities, asset and business dispositions 17 17 - - 14 14 - - Impairment Charges - - - - 15 15 - - Operating Segment Income 351 $ (53) $ 8 $ 396 $ 386 $ (31) $ 3 $ 414 $ (1) Adjusted numbers are non-GAAP financial measures. Fiscal Year ended June 30, 2012 Fiscal Year ended July 2, 2011 Operating Segment Income Reconciliation – Reported to Adjusted (Fiscal Year 2012) 12 |
 Reconciliation of Earnings per Share – Continuing Ops Barclays Back to School Conference 13 Reconcilation of Earnings per share - Continuing businesses to Adjusted and Proforma ($ in Millions, except EPS) Reported Less: Impact of Significant Items Adjusted(1): Excluding Significant Items Less: Disp. Proforma Adjs Proforma(2) Op Seg Income 351 (53) 404 8 396 Corporate Expenses 277 208 69 - 1 70 Operating Income 74 (261) 335 8 (1) 326 Interest Expense - net 72 - 72 (32) 40 Debt Extinguishment costs 39 (39) - - - Income before Tax (37) (300) 263 8 31 286 Income tax expense/(benefit) (15) (103) 88 3 15 100 Net Income (22) (197) 175 5 16 186 Diluted Shares 119 120 120 120 120 120 Diluted EPS ($0.18) ($1.65) $1.47 $0.04 $0.12 $1.55 Preliminary results pending the filing of the Company's 10-K (2) Proforma EPS is a non-GAAP finanical measure excluding the impact of Significant Items, Exited businesses and using estimated FY13 assumptions for Corporate costs of $70M, Net Interest Expense of $40M and a tax rate of 35% Fiscal Year ended June 30, 2012 (1) Adjusted EPS is a non-GAAP financial measure excluding the impat of Significant Items |
 Reconciliation of Earnings per Share – Continuing Ops Barclays Back to School Conference 14 Reconcilation of Earnings per share - Continuing businesses to Adjusted and Proforma ($ in Millions, except EPS) Reported Less: Impact of Significant Items Adjusted(1): Excluding Significant Items Less: Disp. Proforma Adjs Proforma (2) Op Seg Income 386 (31) 417 3 414 Corporate Expenses 161 60 101 - (31) 70 Operating Income 225 (91) 316 3 31 344 Interest Expense - net 87 - 87 (47) 40 Debt Extinguishment costs 55 55 - - - Income before Tax 83 (146) 229 3 78 304 Income tax expense/(benefit) 27 (53) 80 1 27 106 Net Income 56 (93) 149 2 51 198 Diluted Shares 125 125 125 125 125 125 Diluted EPS $0.45 ($0.75) $1.20 $0.02 $0.40 $1.58 (2) Proforma EPS is a non-GAAP finanical measure excluding the impact of Significant Items, Exited businesses and using estimated FY13 assumptions for Corporate costs of $70M, Net Interest Expense of $40M and a tax rate of 35% Fiscal Year ended July 2, 2011 (1) Adjusted EPS is a non-GAAP financial measure excluding the impat of Significant Items Preliminary results pending the filing of the Company's 10-K |