SECURITIES AND EXCHANGE COMMISSION
Washington, D.C. 20549
FORM 10-K
(Mark One)
| x | ANNUAL REPORT PURSUANT TO SECTION 13 OR 15(d) OF THE SECURITIES EXCHANGE ACT OF 1934 |
For the fiscal year ended December 31, 2005
OR
| ¨ | TRANSITION REPORT PURSUANT TO SECTION 13 OR 15(d) OF THE SECURITIES EXCHANGE ACT OF 1934 |
For the transition period from to
Commission File Number 001-03196
CONSOLIDATED NATURAL GAS COMPANY
(Exact name of registrant as specified in its charter)
| | |
| Delaware | | 54-1966737 |
(State or other jurisdiction of incorporation or organization) | | (I.R.S. Employer Identification No.) |
120 Tredegar Street Richmond, Virginia | | 23219 |
| (Address of principal executive offices) | | (Zip Code) |
(804) 819-2000
(Registrant’s telephone number)
Securities registered pursuant to Section 12(b) of the Act:
| | |
Title of Each Class
| | Name of Each Exchange on Which Registered
|
| 6.0% Debentures due 2010 | | New York Stock Exchange |
| 6.8% Debentures due 2027 | | New York Stock Exchange |
| 6 5/8% Debentures due 2008 | | New York Stock Exchange |
| 6 7/8% Debentures due 2026 | | New York Stock Exchange |
| 6 5/8% Debentures due 2013 | | New York Stock Exchange |
| 7.8% Trust Preferred Securities, $25 Par | | New York Stock Exchange |
Securities registered pursuant to Section 12(g) of the Act:
None
Indicate by check mark whether the registrant is a well-known seasoned issuer as defined in Rule 405 of the Securities Act. Yes ¨ No x
Indicate by check mark if the registrant is not required to file reports pursuant to Section 13 or Section 15(d) of the Exchange Act. Yes ¨ No x
Indicate by check mark whether the registrant (1) has filed all reports required to be filed by Section 13 or 15(d) of the Securities Exchange Act of 1934 during the preceding 12 months (or for such shorter period that the registrant was required to file such reports), and (2) has been subject to such filing requirements for the past 90 days. Yes x No ¨
Indicate by check mark if disclosure of delinquent filers pursuant to Item 405 of Regulation S-K is not contained herein, and will not be contained, to the best of registrant’s knowledge, in definitive proxy or information statements incorporated by reference in Part III of this Form 10-K or any amendment to this Form 10-K. x
Indicate by check mark whether the registrant is a large accelerated filer, an accelerated filer, or a non-accelerated filer. See definition of “accelerated filer and large accelerated filer” in Rule 12b-2 of the Exchange Act.
Large accelerated filer ¨ Accelerated filer ¨ Non-accelerated filer x
Indicate by check mark whether the registrant is a shell company (as defined in Rule 12b-2 of the Exchange Act). Yes ¨ No x
The aggregate market value of the voting stock held by non-affiliates of the registrant as of the last business day of the registrant’s most recently completed second fiscal quarter was zero.
As of February 1, 2006, there were issued and outstanding 100 shares of the registrant’s common stock, without par value, all of which were held, beneficially and of record, by Dominion Resources, Inc.
THE REGISTRANT MEETS THE CONDITIONS SET FORTH IN GENERAL INSTRUCTION I.(1)(a) AND (b) OF FORM 10-K AND IS FILING THIS FORM 10-K UNDER THE REDUCED DISCLOSURE FORMAT.
DOCUMENTS INCORPORATED BY REFERENCE
None
Consolidated Natural Gas Company
Part I
Item 1. Business
The Company
Consolidated Natural Gas Company (CNG) operates in all phases of the natural gas business, explores for and produces oil, and provides a variety of retail energy marketing services. CNG is a wholly owned subsidiary of Dominion Resources, Inc. (Dominion), a fully integrated gas and electric holding company headquartered in Richmond, Virginia.
The terms “CNG,” “we,” “our” and “us” are used throughout this report and, depending on the context of their use, may refer to CNG, one of CNG’s consolidated subsidiaries or operating segments, or the entirety of CNG and its consolidated subsidiaries.
As of December 31, 2005, we had approximately 4,700 full-time employees. Approximately 2,500 employees are subject to collective bargaining agreements. We were incorporated in Delaware in 1999. Our principal executive offices are located at 120 Tredegar Street, Richmond, Virginia 23219 and our telephone number is (804) 819-2000.
Operating Segments
We manage our operations along three primary operating segments: Delivery, Energy and Exploration & Production. We also report our corporate and other functions as a segment. While we manage our daily operations as described below, our assets remain wholly owned by our legal subsidiaries. For additional financial information on business segments and geographic areas, see Notes 1 and 24 to our Consolidated Financial Statements.
Delivery
Delivery includes our regulated gas distribution and customer service operations as well as retail energy marketing operations. Gas distribution operations serve residential, commercial and industrial gas sales and transportation customers in Ohio, Pennsylvania and West Virginia. Retail energy marketing operations include the marketing of gas, electricity and related products and services to residential, industrial and small commercial customers in the Northeast, Mid-Atlantic and Midwest regions.
Competition
Deregulation is at varying stages in the three states in which our gas distribution subsidiaries operate. In Pennsylvania, supplier choice is available for all residential and small commercial customers. In Ohio, legislation has not been enacted to require supplier choice for residential and commercial natural gas consumers. However, we offer an Energy Choice program to customers on our own initiative, in cooperation with the Public Utilities Commission of Ohio (Ohio Commission). West Virginia does not require customer choice in its retail natural gas markets at this time. SeeRegulation—State Regulations for additional information.
Regulation
Our gas distribution service, including the rates we may charge to customers, is regulated by the Ohio Commission, the Pennsylvania Public Utility Commission (Pennsylvania Commission) and the West Virginia Public Service Commission (West Virginia Commission). SeeRegulation—State Regulations for additional information.
Properties
Delivery’s investment in its gas distribution network is located in the states of Ohio, Pennsylvania and West Virginia. The gas distribution network includes approximately 27,000 miles of pipe, exclusive of service pipe. Delivery also operates more than 200 billion cubic feet (bcf) of underground storage capacity in Ohio and Pennsylvania. SeeEnergy—Properties for additional information regarding Delivery’s storage properties.
Sources of Fuel Supply
Delivery is engaged in the sale and storage of natural gas through its operating subsidiaries. Delivery’s natural gas supply for its operations is obtained from various sources including: purchases from major and independent producers in the Mid-Continent and Gulf Coast regions; purchases from local producers in the Appalachian area; purchases from gas marketers; and withdrawals from underground storage fields owned by us or third parties.
Seasonality
Gas sales in the Delivery segment typically vary seasonally based on demand by residential and commercial customers for heating use due to changes in temperature.
Energy
Energy includes the following operations:
| · | | A regulated interstate gas transmission pipeline and storage system, serving our gas distribution businesses and other customers in the Northeast, Mid-Atlantic and Midwest regions; |
| · | | A liquefied natural gas (LNG) import and storage facility in Maryland; |
| · | | Certain natural gas production operations located in the Appalachian basin; and |
| · | | Certain producer services which consist of aggregation of gas supply and related wholesale activities. |
Competition
The Energy segment’s gas transmission operations compete with domestic and Canadian pipeline companies and gas marketers seeking to provide or arrange transportation, storage and other services for customers. Alternative energy sources, such as oil or coal, provide another level of competition. Although competition is based primarily on price, the array of services that can be provided to customers is also an important factor. The combination of capacity rights held on certain longline pipelines, a large storage
1
capability and the availability of numerous receipt and delivery points along our own pipeline system enable us to tailor our services to meet the needs of individual customers.
Regulation
Energy’s natural gas transmission, storage and LNG operations are subject to regulation by the Federal Energy Regulatory Commission (FERC). SeeRegulation—Federal Regulations for additional information.
Properties
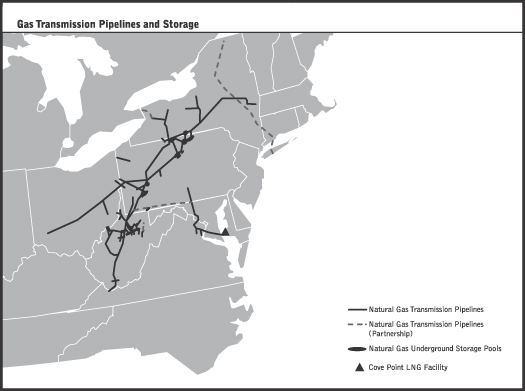
Energy has approximately 7,800 miles of gas transmission, gathering and storage pipelines located in the states of Maryland, New York, Ohio, Pennsylvania, Virginia and West Virginia.We also have storage operations involving both Energy and Delivery. These storage operations include 26 underground gas storage fields located in New York, Ohio, Pennsylvania and West Virginia, with more than 2,000 storage wells and approximately 373,000 acres of operated leaseholds.
The total designed capacity of the underground storage fields is approximately 970 billion cubic feet (bcf) of which approximately 200 bcf is operated by Delivery and 750 bcf is operated by Energy, with the remaining portion being operated by a third party. Six of the 26 storage fields are jointly-owned with other companies and have a capacity of 242 bcf. Energy also has approximately 8 bcf of above ground storage capacity at its Cove Point LNG facility. The Energy and Delivery segments together have more than 100 compressor stations with approximately 688,000 installed compressor horsepower.
The map below illustrates our gas transmission pipelines, storage facilities and LNG facility.
Sources of Energy Supply
Our large underground natural gas storage network and the location of our pipeline system provide a significant link between the country’s major gas pipelines and large markets in the Northeast and Mid-Atlantic regions and on the East Coast. Our pipelines are part of an interconnected gas transmission system, which continues to provide local distribution companies, marketers, power generators and commercial and industrial customers accessibility to supplies nationwide.
Our underground storage facilities play an important part in balancing gas supply with consumer demand and are essential to serving the Northeast, Mid-Atlantic and Midwest regions. In addition, storage capacity is an important element in the effective management of both gas supply and pipeline transport capacity.
Seasonality
The Energy segment is affected by seasonal changes in the prices of commodities that it actively markets.
2
Exploration & Production (E&P)
E&P includes our gas and oil exploration, development and production operations. These operations are located in several major producing basins in the lower 48 states, including the outer continental shelf and deepwater areas of the Gulf of Mexico.
Competition
E&P’s competitors range from major international oil companies to smaller independent producers. E&P faces significant competition in the bidding for federal offshore leases and in obtaining leases and drilling rights for onshore properties. As the operator of a number of properties, E&P also faces competition in securing drilling equipment and supplies for exploration and development.
In terms of its production activities, E&P sells most of its deliverable natural gas and oil into short and intermediate-term markets. E&P faces challenges related to the marketing of its natural gas and oil production due to the contraction of participants in the energy marketing industry. However, E&P owns a large and diverse natural gas and oil portfolio and maintains an active gas and oil marketing presence in its primary production regions which strengthens its knowledge of the marketplace and delivery options.
Regulation
Our operations are subject to regulation by numerous federal and state authorities. The pipeline transportation of our natural gas production is regulated by FERC, and pipelines operating on or across the Outer Continental Shelf are subject to the OuterContinental Shelf Lands Act, which requires open-access, non-discriminatory pipeline facilities. Our production operations in the Gulf of Mexico and most of our operations in the western United States are located on federal gas and oil leases administered by the Minerals Management Service (MMS) or the Bureau of Land Management. These leases are issued through a competitive bidding process and require our compliance with stringent regulations. Offshore production facilities must comply with MMS regulations relating to engineering, construction and operational specifications and the plugging and abandonment of wells. Our operations are also subject to numerous environmental regulations including regulations relating to oil spills into navigable waters of the United States. SeeRegulation—Federal Regulations andRegulation—Environmental Regulation for additional information.
Properties
E&P owns 5.4 trillion cubic feet of proved equivalent natural gas and oil reserves and produces approximately 0.9 bcfe of natural gas per day from its leasehold acreage and facility investments. We, either alone or with partners, hold interests in natural gas and oil lease acreage, wellbores, well facilities, production platforms and gathering systems. E&P also owns or holds rights to seismic data and other tools used in exploration and development drilling activities. E&P’s share of developed leasehold totals 2.3 million acres, with another 1.8 million acres held for future exploration and development drilling opportunities. See also Item 2. Properties for additional information on E&P’s properties.
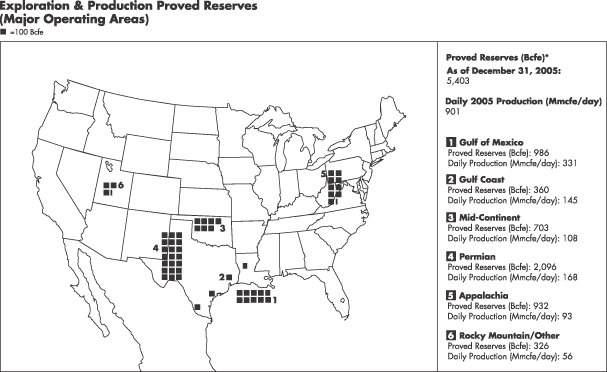
Note: Includes the activities of the E&P segment and the production activity of Dominion Transmission, Inc., which is included in the Energy segment.
Bcfe = billion cubic feet equivalent
Mmcfe = million cubic feet equivalent
3
Seasonality
E&P’s business can be impacted by seasonal changes in the demand for natural gas and oil. Commodity prices, including prices for our unhedged natural gas and oil production, can be impacted by seasonal weather changes and weather effects.
Corporate
We also have a Corporate segment which includes the cost of our corporate and other functions, including the activities of CNG International, our power generating facility and other minor subsidiaries. It also includes specific items attributable to our operating segments that are excluded from the profit measures evaluated by management in assessing segment performance or allocating resources among the segments. (See Notes 1 and 24 to our Consolidated Financial Statements).
Regulation
We are subject to regulation by the Securities and Exchange Commission (SEC), FERC, the Environmental Protection Agency (EPA), the Department of Energy (DOE), the Army Corps of Engineers, and other federal, state and local authorities.
State Regulations
Our gas distribution service is regulated by the Ohio Commission, the Pennsylvania Commission and the West Virginia Commission.
Status of Gas Deregulation
Each of the three states in which we have gas distribution operations has enacted or considered legislation regarding deregulation of natural gas sales at the retail level.
Ohio—Ohio has not enacted legislation requiring supplier choice for residential and commercial natural gas consumers. However, in cooperation with the Ohio Commission, on our own initiative, we offer retail choice to customers. At December 31, 2005, approximately 697,000 of our 1.2 million Ohio customers were participating in this Energy Choice program. Large industrial customers in Ohio also source their own natural gas supplies. In April 2005, we filed an application with the Ohio Commission seeking approval of a plan to improve and expand our Energy Choice Program. Under the current structure, non-Energy Choice customers purchase gas directly from us at a monthly gas recovery cost (GCR) rate that includes true-up adjustments that can change significantly from one quarter to the next. We proposed to replace the GCR with a monthly market price that eliminates those adjustments, making it easier for customers to compare and switch to competitive suppliers. A ruling on this proposal is expected by the end of the first quarter of 2006. By the end of a transition period, and subject to Ohio Commission approval, we plan to exit the gas merchant function in Ohio entirely and have all customers select an alternate gas supplier. We will continue to remain the provider of last resort in the event of default by a supplier.
Pennsylvania—In Pennsylvania, supplier choice is available for all residential and small commercial customers. At December 31, 2005, approximately 75,000 residential and small commercial customers had opted for Energy Choice in our Pennsylvania service area. Nearly all Pennsylvania industrial and large commercial customers buy natural gas from nonregulated suppliers.
West Virginia—At this time, West Virginia has not enacted legislation to require customer choice in its retail natural gas markets. However, the West Virginia Commission has issued regulations to govern pooling services, one of the tools that natural gas suppliers may utilize to provide retail customer choice in the future and has issued rules requiring competitive gas service providers be licensed in West Virginia.
Rate Matters
Our gas distribution subsidiaries are subject to regulation of rates and other aspects of their businesses by the states in which they operate—Pennsylvania, Ohio and West Virginia. When necessary, our gas distribution subsidiaries seek general rate increases on a timely basis to recover increased operating costs. In addition to general rate increases, our gas distribution subsidiaries make routine separate filings with their respective state regulatory commissions to reflect changes in the costs of purchased gas. These purchased gas costs are generally subject to rate recovery through a mechanism that ensures dollar for dollar recovery of prudently incurred costs. Costs that are expected to be recovered in future rates are deferred as regulatory assets. The purchased gas cost recovery filings cover prospective one, three or twelve-month periods. Approved increases or decreases in GCR rates result in increases or decreases in revenues with corresponding increases or decreases in net purchased gas cost expenses.
Ohio—In December 2003, the Ohio Commission approved a joint application filed by us and several other Ohio natural gas companies for recovery of bad debt expense via a rider known as a bad debt tracker. The tracker insulates us from the effect of changes in bad debt expense, which is affected by the volatility of natural gas prices, weather and prices charged by competitive retail natural gas suppliers. The tracker is an adjustable rate that recovers the cost of bad debt in a manner similar to a GCR recovery rate. Instead of recovering bad debt costs through our base rates, we recover all eligible bad debt expenses through the bad debt tracker. Annually, we assess the need to adjust the tracker based on the preceding year’s unrecovered deferred bad debt expense.
Pennsylvania—In July 2004, the Pennsylvania Commission approved a settlement agreement between us and the Office of Consumer Advocate (OCA) in which the OCA agreed to drop its appeal of a previous Pennsylvania Commission order that allowed us to recover approximately $16.5 million in unrecovered purchased gas costs. As part of the settlement, all customer service and delivery charges will be fixed through December 31, 2008. Gas costs will continue to pass through to the customer through the purchased gas cost adjustment mechanism.
West Virginia—In October 2005, the West Virginia Public Service Commission issued a final order approving a $32 million increase in our base and purchased gas cost recovery rates. Under the order, the combined increase for base and purchased gas recovery rates for the 2005/2006 winter is subject to a 20 percent cap. The purchased gas cost recovery rate reflected the effect of the increase effective November 1, 2005 through January 1, 2006. Beginning January 2006, the increase was applied to both base and purchased gas cost recovery rates, with $4 million of the $32 million attributable to the base rate. The order also provides for the recovery of interest costs for any gas cost under-recovery as a result of the cap.
In May 2005, FERC approved a comprehensive rate settlement with our subsidiary, Dominion Transmission, Inc. (DTI), and its customers and interested state commissions. The settlement, which became effective July 1, 2005, reduces our natural
4
gas transportation and storage service revenues by approximately $49 million annually, through a combination of firm transportation rate reductions and reduced fuel retention levels for storage service customers. As part of the settlement, DTI and all signatory parties agreed to a rate moratorium until 2010.
Federal Regulations
Energy Policy Act of 2005 (EPACT)
In August 2005, the President of the United States signed EPACT. Key provisions include the following:
| · | | Repeal of the Public Utility Holding Company Act of 1935 (the 1935 Act); |
| · | | Provision for greater regulatory oversight by other federal and state authorities; |
| · | | Grant of enhanced merger approval authority to FERC; |
| · | | Grant of exclusive authority to FERC to approve applications for construction of LNG facilities; and |
| · | | Improvement of the processes for approval and permitting of interstate pipelines. |
Many of the changes Congress enacted must be implemented through public notice and proposed rule making by the federal agencies affected and this process is ongoing. We will continue to evaluate the effects that EPACT may have on our business.
Public Utility Holding Company Act of 2005
EPACT provided for the repeal of the 1935 Act in February 2006. The 1935 Act and related regulations issued by the SEC governed our activities with respect to the issuance and acquisition of securities, acquisition and sale of utility assets, certain transactions among affiliates, engaging in businesses activities not directly related to the utility or energy business and other matters. Upon the effective date of repeal of the 1935 Act, we will be considered a holding company under the Public Utility Holding Company Act of 2005 (PUHCA 2005), the rules and regulations of which will be administered by FERC. PUHCA 2005 is more limited in scope than the 1935 Act and relates primarily to certain record-keeping requirements and transactions involving public utilities and their affiliates.
Federal Energy Regulatory Commission
FERC regulates the transportation and sale for resale of natural gas in interstate commerce under the Natural Gas Act of 1938 and the Natural Gas Policy Act of 1978, as amended. Under the Natural Gas Act, FERC has authority over rates, terms and conditions of services performed by our interstate gas pipeline subsidiaries, including DTI and Dominion Cove Point LNG, LP. FERC also has jurisdiction over siting, construction and operation of natural gas import facilities and interstate natural gas pipeline facilities.
FERC Order 636 requires transmission pipelines to operate as open-access transporters and provide transportation and storage services on an equal basis for all gas suppliers, whether purchased from us or from another gas supplier.
Our interstate gas transportation and storage activities are conducted in accordance with certificates, tariffs and service agreements on file with FERC.
We are also subject to the Pipeline Safety Act of 2002, which includes new mandates regarding the inspection frequency for interstate and intrastate natural gas transmission and storage pipelines located in areas of high-density population where the consequences of potential pipeline accidents pose the greatest risk to people and their property. We have evaluated our naturalgas transmission and storage properties under the final regulations issued in December 2003 and have developed the required implementation plan including identification, testing and potential remediation activities.
We are also subject to FERC’s Standards of Conduct that govern conduct between interstate transmission gas and electricity providers and their marketing function or their energy related affiliates. The rules define the scope of the affiliates covered by the standards and are designed to prevent transmission providers from giving their marketing functions or affiliates undue preferences.
We implemented various rate filings, tariff changes and negotiated rate service agreements for our FERC-regulated businesses during 2005. In all material respects, these filings were approved by FERC in the form requested by us and were subject to only minor modifications.
Environmental Regulation
Each of our operating segments face substantial regulation and compliance costs with respect to environmental matters. For a discussion of significant aspects of these matters, see Item 3. Legal Proceedings and Note 19 to our Consolidated Financial Statements.
From time to time we may be identified as a potentially responsible party in relation to a Superfund site. The EPA (or a state) can either (a) allow such a party to conduct and pay for a remedial investigation, feasibility study and remedial action or (b) conduct the remedial investigation and action and then seek reimbursement from the parties. Each party can be held jointly, severally and strictly liable for all costs. These parties can also bring contribution actions against each other and seek reimbursement from their insurance companies. As a result, we may be responsible for the costs of remedial investigation and actions under the Superfund Act or other laws or regulations regarding the remediation of waste. We do not believe that any currently identified sites will result in significant liabilities.
We have applied for or obtained the necessary environmental permits for the operation of our regulated facilities. Many of these permits are subject to re-issuance and continuing review.
Recent Developments
On March 1, 2006 we entered into an agreement with Equitable Resources, Inc. to sell two of our wholly-owned regulated gas distribution subsidiaries, The Peoples Natural Gas Company and Hope Gas, Inc. for $969.6 million plus adjustments to reflect capital expenditures and changes in working capital. We expect to complete the transaction by the first quarter of 2007, subject to state regulatory approvals in Pennsylvania and West Virginia as well as approval under the federal Hart-Scott-Rodino Act.
Item 1A. Risk Factors
Our business is influenced by many factors that are difficult to predict, involve uncertainties that may materially affect actual results and are often beyond our control. We have identified a number of these factors below. For other factors that may cause actual results to differ materially from those indicated in any forward-looking statement or projection contained in this report, seeForward-Looking Statements in Item 7. Management’s Discussion and Analysis of Results of Operations (MD&A).
Our operations are weather sensitive. Our results of operations can be affected by changes in the weather. Weather conditions directly influence the demand for electricity and natural gas and affect the price of energy commodities. In addition, severe weather, including hurricanes and winter storms, can
5
be destructive, causing production delays and property damage that require us to incur additional expenses.
We are subject to complex governmental regulation that could adversely affect our operations. Our operations are subject to extensive federal, state and local regulation and may require numerous permits, approvals and certificates from various governmental agencies. We must also comply with environmental legislation and associated regulations. Management believes the necessary approvals have been obtained for our existing operations and that our business is conducted in accordance with applicable laws. However, new laws or regulations, or the revision or reinterpretation of existing laws or regulations, may require us to incur additional expenses.
Costs of environmental compliance, liabilities and litigation could exceed our estimates, which could adversely affect our results of operations. Compliance with federal, state and local environmental laws and regulations may result in increased capital, operating and other costs, including remediation and containment expenses and monitoring obligations. In addition, we may be a responsible party for environmental clean-up at a site identified by a regulatory body. Management cannot predict with certainty the amount and timing of all future expenditures related to environmental matters because of the difficulty of estimating clean-up and compliance costs, and the possibility that changes will be made to the current environmental laws and regulations. There is also uncertainty in quantifying liabilities under environmental laws that impose joint and several liability on all potentially responsible parties.
The use of derivative instruments could result in financial losses and liquidity constraints. We use derivative instruments, including futures, forwards, options and swaps, to manage our commodity and financial market risks. We could recognize financial losses on these contracts as a result of volatility in the market values of the underlying commodities or if a counterparty fails to perform under a contract. In the absence of actively quoted market prices and pricing information from external sources, the valuation of these contracts involves management’s judgment or use of estimates. As a result, changes in the underlying assumptions or use of alternative valuation methods could affect the reported fair value of these contracts.
In addition, we use financial derivatives to hedge future sales of our gas and oil production, which may limit the benefit we would otherwise receive from increases in commodity prices. These hedge arrangements generally include collateral requirements that require us to deposit funds or post letters of credit with counterparties to cover the fair value of covered contracts in excess of agreed upon credit limits. When commodity prices rise to levels substantially higher than the levels where we have hedged future sales, we may be required to use a material portion of our available liquidity and obtain additional liquidity to cover these collateral requirements. In some circumstances, this could have a compounding effect on our financial liquidity and results.
Derivatives designated under hedge accounting to the extent not offset by the hedged transaction can result in ineffectiveness losses. These losses primarily result from differences in the location and specifications of the derivative hedging instrument and the hedged item and could adversely affect our results of operations.
For additional information concerning derivatives and commodity-based contracts, seeMarket Risk Sensitive InstrumentsandRisk Management in Item 7A. Quantitative and Qualitative Disclosures About Market Risk and Notes 2 and 9 to our Consolidated Financial Statements.
Our exploration and production business is dependent on factors that cannot be predicted or controlled and that coulddamage facilities, disrupt production or reduce the book value of our assets. Factors that may affect our financial results include damage to or suspension of operations caused by weather, fire, explosion or other events to our or third party gas and oil facilities, fluctuations in natural gas and crude oil prices, results of future drilling and well completion activities and our ability to acquire additional land positions in competitive lease areas, as well as inherent operational risks that could disrupt production.
Short-term market declines in the prices of natural gas and oil could adversely affect our financial results by causing a permanent write-down of our natural gas and oil properties as required by the full cost method of accounting. Under the full cost method, all direct costs of property acquisition, exploration and development activities are capitalized. If net capitalized costs exceed the present value of estimated future net revenues based on hedge-adjusted period-end prices from the production of proved gas and oil reserves (the ceiling test) at the end of any quarterly period, then a permanent write-down of the assets must be recognized in that period.
We maintain business interruption insurance for offshore operations associated with our exploration and production business. We have placed our insurers on notice that we have suffered substantial property damage and business interruption loss related to Hurricanes Katrina and Rita. Failure to realize the full value of our claims could adversely affect our results of operations. Additionally, the increased level of hurricane activity in the Gulf of Mexico is likely to significantly increase the cost of business interruption insurance and could make it unavailable on commercially reasonable terms. Inability to insure our offshore Gulf of Mexico operations could adversely affect our results of operations.
An inability to access financial markets could affect the execution of our business plan. We rely on access to short-term money markets, longer-term capital markets and banks as significant sources of liquidity for capital requirements and collateral requirements related to hedges of future gas and oil production not satisfied by the cash flows from our operations. Management believes that we will maintain sufficient access to these financial markets based upon current credit ratings. However, certain disruptions outside of our control may increase our cost of borrowing or restrict our ability to access one or more financial markets. Such disruptions could include an economic downturn, the bankruptcy of an unrelated energy company or changes to our credit ratings. Restrictions on our ability to access financial markets may affect our ability to execute our business plan as scheduled.
Changing rating agency requirements could negatively affect our growth and business strategy. As of February 1, 2006, our senior unsecured debt is rated BBB, stable outlook, by Standard & Poor’s Ratings Group (Standard & Poor’s); A3, under review for possible downgrade, by Moody’s Investors Service (Moody’s); and BBB+, stable outlook, by Fitch Ratings Ltd. (Fitch). In order to maintain our current credit ratings in light of existing or future requirements, we may find it necessary to take steps or change our business plans in ways that may adversely affect our growth and earnings. A reduction in our credit ratings by Standard & Poor’s, Moody’s or Fitch could increase our borrowing costs and adversely affect operating results and could require us to post additional collateral in connection with some of our marketing activities.
Potential changes in accounting practices may adversely affect our financial results. We cannot predict the impact that future changes in accounting standards or practices may have on public companies in general, the energy industry or our operations specifically. New accounting standards could be issued that could
6
change the way we record revenues, expenses, assets and liabilities. These changes in accounting standards could adversely affect our reported earnings or could increase reported liabilities.
Failure to retain and attract key executive officers and other skilled professional and technical employees could have anadverse effect on our operations. Implementation of our growth strategy is dependent on our ability to recruit, retain and motivate employees. Competition for skilled employees in some areas is high and the inability to retain and attract these employees could adversely affect our business and future financial condition.
Item 1B. Unresolved Staff Comments
None.
Item 2. Properties
We share our principal office in Richmond, Virginia, with our parent company, Dominion. Such office space is leased. We lease offices in other cities in which our subsidiaries operate. Our assets consist primarily of investments in our subsidiaries, the principal properties of which are described below and in Item 1. Business.
Information detailing our gas and oil operations presented below includes the activities of the E&P segment and the production activity of DTI, which is included in the Energy segment:
Company-Owned Proved Gas and Oil Reserves
Estimated net quantities of proved gas and oil reserves at December 31 of each of the last three years were as follows:
| | | | | | | | | | | | |
| | | 2005 | | 2004 | | 2003 |
| | | Proved
Developed | | Total
Proved | | Proved
Developed | | Total
Proved | | Proved
Developed | | Total
Proved |
Proved gas reserves (bcf) | | 3,059 | | 4,219 | | 3,049 | | 4,202 | | 2,902 | | 4,039 |
Proved oil reserves (000 bbl) | | 144,417 | | 197,284 | | 100,780 | | 142,635 | | 53,776 | | 147,954 |
Total proved gas and oil reserves (bcfe) | | 3,925 | | 5,403 | | 3,654 | | 5,058 | | 3,224 | | 4,927 |
Certain of our subsidiaries file Form EIA-23 with the DOE, which reports gross proved reserves, including the working interest shares of other owners, for properties operated by such subsidiaries. The proved reserves reported in the table above represent our share of proved reserves for all properties, based on our ownership interest in each property. For properties we operate, the difference between the proved reserves reported on Form EIA-23 and the gross reserves associated with the Company-owned proved reserves reported in the table above, does not exceed five percent. Estimated proved reserves as of December 31, 2005 are based upon a study for each of our properties prepared by our staff engineers and reviewed by Ryder Scott Company, L.P. Calculations were prepared using standard geological and engineering methods generally accepted by the petroleum industry and in accordance with SEC guidelines.
Quantities of Gas and Oil Produced
Quantities of gas and oil produced during each of the last three years follow:
| | | | | | |
| | | 2005 | | 2004 | | 2003 |
Gas production (bcf) | | 242 | | 264 | | 281 |
Oil production (000 bbl) | | 14,543 | | 11,117 | | 9,436 |
Total gas and oil production (bcfe) | | 329 | | 331 | | 337 |
The average sales price per thousand cubic feet (mcf) of gas with hedging results (including transfers to other Company operations at market prices) realized during the years 2005, 2004 and 2003 was $5.08, $4.45 and $4.16, respectively. The respective average prices without hedging results per mcf of gas produced were $8.13, $6.01 and $5.32, respectively. The respective average sales prices realized for oil with hedging results were $29.92, $25.28 and $24.60 per barrel and the respectiveaverage prices without hedging results were $50.23, $39.96 and $29.37 per barrel. The average production (lifting) cost per mcf equivalent of gas and oil produced (as calculated per SEC guidelines) during the years 2005, 2004 and 2003 was $1.03, $0.78 and $0.75 respectively.
Acreage
Gross and net developed and undeveloped acreage at December 31, 2005 was:
| | | | | | | | |
| | | Developed Acreage | | Undeveloped Acreage |
| | | Gross | | Net | | Gross | | Net |
| (thousands) | | | | | | | | |
Acreage | | 3,771 | | 2,319 | | 3,224 | | 1,757 |
Net Wells Drilled in the Calendar Year
The number of net wells completed during each of the last three years follows:
| | | | | | |
| | | 2005 | | 2004 | | 2003 |
Exploratory: | | | | | | |
Productive | | 6 | | 7 | | 4 |
Dry | | 6 | | 7 | | 7 |
Total Exploratory | | 12 | | 14 | | 11 |
Development: | | | | | | |
Productive | | 817 | | 830 | | 719 |
Dry | | 34 | | 17 | | 33 |
Total Development | | 851 | | 847 | | 752 |
Total wells drilled (net) | | 863 | | 861 | | 763 |
As of December 31, 2005, 115 gross (75 net) wells were in the process of being drilled, including wells temporarily suspended.
7
As of December 31, 2005, 115 gross (75 net) wells were in the process of being drilled, including wells temporarily suspended.
Productive Wells
The number of productive gas and oil wells in which we had an interest at December 31, 2005, follows:
| | | | |
| | | Gross | | Net |
Total gas wells | | 15,653 | | 10,654 |
Total oil wells | | 3,399 | | 865 |
The number of productive wells includes 208 gross (80 net) multiple completion gas wells and 10 gross (4 net) multiple completion oil wells. Wells with multiple completions are counted only once for productive well count purposes.
Item 3. Legal Proceedings
From time to time, we are alleged to be in violation or in default under orders, statutes, rules or regulations relating to the environment, compliance plans imposed upon or agreed to by us, or permits issued by various local, state and federal agencies for the construction or operation of facilities. Administrative proceedings may also be pending on these matters. In addition, in the ordinary course of business, we are involved in various legal proceedings. We believe that the ultimate resolution of these proceedings will not have a material adverse effect on our financial position, liquidity or results of operations.
SeeRegulation in Item 1. Business and Note 19 to our Consolidated Financial Statements for additional information on rate matters and various regulatory proceedings to which we are a party.
Before being acquired by us, Louis Dreyfus Natural Gas Corp. (Louis Dreyfus) was one of numerous defendants in a lawsuit consolidated and now pending in the 93rd Judicial District Court in Hidalgo County, Texas. The lawsuit alleges that gas wells and related pipeline facilities operated by Louis Dreyfus, and other facilities operated by other defendants, caused an underground hydrocarbon plume in McAllen, Texas. The plaintiffs claim that they have suffered damages, including property damage and lost profits, as a result of the alleged plume and seek compensation for these items.
In July 1997, Jack Grynberg brought suit against us and several of our subsidiaries. The suit seeks damages for alleged fraudulent mismeasurement of gas volumes and underreporting of gas royalties from gas production taken from federal leases. The suit was consolidated with approximately 360 other cases in the U.S. District Court for the District of Wyoming. Parts of Mr. Grynberg’s claims were dismissed on the basis that they overlapped with Mr. Wright’s claims, which are noted below. Mr. Grynberg has filed an appeal. While some of the defendants have been dismissed from the case, the court denied our motion to dismiss and we appealed. The case is stayed pending a ruling, which is not expected until the second quarter of 2006.
In April 1998, Harrold E. (Gene) Wright filed suit against Dominion Exploration & Production, Inc. (formerly known as CNG Producing Company), a subsidiary of CNG, and numerous other companies under the False Claims Act. Wright alleged various fraudulent valuation practices in the payment of royalties due under federal oil and gas leases. Shortly after filing, this case was consolidated under the Federal Multidistrict Litigation rules with the Grynberg case noted above. A substantial portion of the claim against us was resolved by settlement in late 2002. The case was remanded back to the U.S. District Court for the Eastern District of Texas, which denied our motion to dismiss on jurisdictional grounds in January 2005. Discovery in this matter is currently underway.
In September 2005, DTI reached an agreement in principle on a proposed Consent Order and Agreement (COA) with the Pennsylvania Department of Environmental Protection (PADEP) which would supersede a 1990 COA between the parties. The agreement in principle resolves longstanding groundwater contamination issues at several DTI compressor stations in Pennsylvania and includes a penalty and environmental projects of $850,000 to be paid to PADEP and the Pennsylvania Department of Conservation and Natural Resources to resolve alleged violations. Negotiations are ongoing with both agencies to finalize language and payment mechanisms. As of December 31, 2005, DTI has accrued $850,000 for the penalty and environmental projects.
Item 4. Submission of Matters to a Vote of Security Holders
Omitted pursuant to General Instruction I.(2)(c).
8
Part II
Item 5. Market for the Registrant’s Common Equity, Related Stockholder Matters and Issuer Purchases of Equity Securities
Dominion Resources, Inc. owns all of our common stock. We paid quarterly cash dividends on our common stock as follows (in millions):
| | | | | | | | | | | | |
| | | Quarter |
| | | First | | Second | | Third | | Fourth |
2005 | | $ | 214 | | $ | 110 | | $ | 92 | | $ | 159 |
2004 | | $ | 183 | | $ | 88 | | $ | 70 | | $ | 141 |
Restrictions on the payment of dividends by us are discussed in Note 17 to our Consolidated Financial Statements.
Item 6. Selected Financial Data
Omitted pursuant to General Instruction I.(2)(a).
Item 7. Management’s Discussion and Analysis of Results of Operations
Management’s Discussion and Analysis of Results of Operations (MD&A) discusses our results of operations. MD&A should be read in conjunction with our Consolidated Financial Statements. The terms “Company,” “we,” “our” and “us” are used throughout this report and, depending on the context of its use, may represent any of the following: the legal entity, Consolidated Natural Gas Company; one of Consolidated Natural Gas Company’s consolidated subsidiaries or operating segments, or the entirety of Consolidated Natural Gas Company and its consolidated subsidiaries.
Contents of MD&A
The reader will find the following information in this MD&A:
| · | | Forward-Looking Statements |
| · | | Segment Results of Operations |
Forward-Looking Statements
This report contains statements concerning our expectations, plans, objectives, future financial performance and other statements that are not historical facts. These statements are “forward-looking statements” within the meaning of the Private SecuritiesLitigation Reform Act of 1995. In most cases, the reader can identify these forward-looking statements by such words as “anticipate,” “estimate,” “forecast,” “expect,” “believe,” “should,” “could,” “plan,” “may” or other similar words.
We make forward-looking statements with full knowledge that risks and uncertainties exist that may cause actual results to differ materially from predicted results. Factors that may cause actual results to differ are often presented with the forward-looking statements themselves. Additionally, other factors may cause actual results to differ materially from those indicated in any forward-looking statement. These factors include but are not limited to:
| · | | Unusual weather conditions and their effect on energy sales to customers and energy commodity prices; |
| · | | Extreme weather events, including hurricanes and winter storms, that can cause outages, production delays and property damage to our facilities; |
| · | | State and federal legislative and regulatory developments, including deregulation and changes in environmental and other laws and regulations to which we are subject; |
| · | | Cost of environmental compliance; |
| · | | Fluctuations in energy-related commodity prices and the effect these could have on our earnings, liquidity position and the underlying value of our assets; |
| · | | Counterparty credit risk; |
| · | | Capital market conditions, including price risk due to marketable securities held as investments in benefit plan trusts; |
| · | | Fluctuations in interest rates; |
| · | | Changes in rating agency requirements or credit ratings and the effect on availability and cost of capital; |
| · | | Changes in financial or regulatory accounting principles or policies imposed by governing bodies; |
| · | | Employee workforce factors including collective bargaining agreements and labor negotiations with union employees; |
| · | | The risks of operating businesses in regulated industries that are subject to changing regulatory structures; |
| · | | Changes in our ability to recover investments made under traditional regulation through rates; |
| · | | Receipt of approvals for and timing of closing dates for acquisitions and divestitures; |
| · | | Realization of expected business interruption insurance proceeds; and |
| · | | Political and economic conditions, including the threat of domestic terrorism, inflation and deflation. |
Additionally, other risks that could cause actual results to differ from predicted results are set forth in Item 1A. Risk Factors.
Our forward-looking statements are based on our beliefs and assumptions using information available at the time the statements are made. We caution the reader not to place undue reliance on our forward-looking statements because the assumptions, beliefs, expectations and projections about future events may, and often do, differ materially from actual results. We undertake no obligation to update any forward-looking statement to reflect developments occurring after the statement is made.
9
Introduction
CNG operates in all phases of the natural gas business, explores for and produces gas and oil and provides a variety of energy marketing services. We are a wholly owned subsidiary of Dominion Resources, Inc. (Dominion).
We manage our operations through three primary operating segments: Delivery, Energy, and Exploration & Production. The contributions to net income by our primary operating segments are determined based on a measure of profit that we believe represents the segments’ core earnings. As a result, certain specific items attributable to those segments are not included in profit measures evaluated by management in assessing segment performance or allocating resources among the segments. Those specific items are reported in the Corporate segment.
Delivery includes our regulated gas distribution and customer service business as well as nonregulated retail energy marketing operations and related products and services. Our regulated gas distribution business serves residential, commercial and industrial gas sales and transportation customers in Ohio, Pennsylvania and West Virginia. Our nonregulated retail energy marketing operations markets gas, electricity and related products and services to residential, industrial and small commercial customers in the Northeast, Mid-Atlantic and Midwest.
Revenue provided by gas distribution operations is based primarily on rates established by state regulatory authorities and state law. The profitability of this business is dependent on its ability, through the rates it is permitted to charge, to recover costs and earn a reasonable return on its capital investments. Variability relates largely to changes in volumes, which are primarily weather sensitive, and changes in the cost of routine maintenance and repairs (including labor and benefits). Income from retail energy marketing operations varies in connection with changes in weather and commodity prices as well as the acquisition and loss of customers.
Energy includes our tariff-based natural gas transmission pipeline and storage business and the Cove Point liquefied natural gas (LNG) facility. It also includes certain natural gas production located in the Appalachian basin and producer services, which consist of aggregation of gas supply and related wholesale activities. The gas transmission pipeline and storage business serves our gas distribution businesses and other customers in the Northeast, Mid-Atlantic and Midwest.
Revenue provided by regulated gas transmission operations and the LNG facility is based primarily on rates approved by the Federal Energy Regulatory Commission (FERC). The profitability of these businesses is dependent on their ability, through the rates they are permitted to charge, to recover costs and earn a reasonable return on their capital investments. Variability results primarily from changes in rates, the demand for services, which is primarily weather dependent, and operating and maintenance expenditures (including labor and benefits).
Earnings for the Energy segment’s nonregulated businesses are subject to variability associated with changes in commodity prices. Energy’s nonregulated businesses use physical and financial arrangements to attempt to hedge this price risk. Certain hedging activities may require cash deposits to satisfy collateral requirements. Variability also results from changes in operating and maintenance expenditures (primarily labor and benefits).
Exploration & Production (E&P) includes our gas and oil exploration, development and production business. Operations are located in several major producing basins in the lower 48 states, including the outer continental shelf and deepwater areas of the Gulf of Mexico.
E&P generates income from the sale of natural gas and oil we produce from our reserves. Variability relates primarily to changes in commodity prices, which are market-based, and production volumes, which are impacted by numerous factors including drilling success, timing of development projects, and external factors such as storm-related damage caused by hurricanes. We attempt to manage commodity price volatility by hedging a substantial portion of our expected production. These hedging activities may require cash deposits to satisfy collateral requirements. We attempt to mitigate the financial impact of storm-related delays in production by maintaining business interruption insurance for our offshore operations. Our business interruption insurance covers delays caused by damage to both our production facilities and to third-party facilities downstream.
Corporateincludes our corporate and other functions, including the activities of CNG International (CNGI), our power generating facility and other minor subsidiaries. It also includes specific items attributable to our operating segments that are excluded from the profit measures evaluated by management in assessing segment performance or allocating resources among segments. We have sold the majority of CNGI’s assets. See Note 7 to our Consolidated Financial Statements.
Recent Developments
On March 1, 2006 we entered into an agreement with Equitable Resources, Inc. to sell two of our wholly-owned regulated gas distribution subsidiaries, The Peoples Natural Gas Company and Hope Gas, Inc., for $969.6 million plus adjustments to reflect capital expenditures and changes in working capital. We expect to complete the transaction by the first quarter of 2007, subject to state regulatory approvals in Pennsylvania and West Virginia, as well as approval under the federal Hart-Scott-Rodino Act.
Accounting Matters
Critical Accounting Policies and Estimates
We have identified the following accounting policies, including certain inherent estimates, that as a result of the judgments, uncertainties, uniqueness and complexities of the underlying accounting standards and operations involved, could result in material changes to our financial condition or results of operations under different conditions or using different assumptions. We have discussed the development, selection and disclosure of each of these with our Board of Directors that also serves as our Audit Committee.
Accounting for derivative contracts at fair value
We use derivative contracts such as futures, swaps and options to buy and sell energy-related commodities and to manage our commodity and financial markets risks. Derivative contracts, with certain exceptions, are subject to fair value accounting and are reported on our Consolidated Balance Sheets at fair value. Accounting requirements for derivatives and related hedging activities are complex and may be subject to further clarification by standard-setting bodies.
10
Fair value is based on actively quoted market prices, if available. In the absence of actively quoted market prices, we seek indicative price information from external sources, including broker quotes and industry publications. If pricing information from external sources is not available, we must estimate prices based on available historical and near-term future price information and use of statistical methods. For options and contracts with option-like characteristics where pricing information is not available from external sources, we generally use a modified Black-Scholes Model that considers time value, the volatility of the underlying commodities and other relevant assumptions. We use other option models under special circumstances, including a Spread Approximation Model, when contracts include different commodities or commodity locations and a Swing Option Model, when contracts allow either the buyer or seller the ability to exercise within a range of quantities. For contracts with unique characteristics, we estimate fair value using a discounted cash flow approach deemed appropriate in the circumstances and applied consistently from period to period. If pricing information is not available from external sources, judgment is required to develop the estimates of fair value. For individual contracts, the use of different valuation models or assumptions could have a material effect on the contract’s estimated fair value.
For cash flow hedges of forecasted transactions, we must estimate the future cash flows of the forecasted transactions, as well as evaluate the probability of occurrence and timing of such transactions. Changes in conditions or the occurrence of unforeseen events could require discontinuance of hedge accounting or could affect the timing of the reclassification of gains and/or losses on cash flow hedges from accumulated other comprehensive income (loss) (AOCI) into earnings.
Use of estimates in goodwill impairment testing
As of December 31, 2005, we reported $623 million of goodwill on our Consolidated Balance Sheet. The majority of this goodwill is allocated to the E&P reporting unit, with the remainder allocated to the Energy reporting unit. In April of each year, we test our goodwill for potential impairment, and perform additional tests more frequently if impairment indicators are present. The 2005 annual test did not result in the recognition of any goodwill impairment, as the estimated fair values of our reporting units exceeded their respective carrying amounts.
We estimate the fair value of our reporting units by using a combination of discounted cash flow analyses, based on our internal five-year strategic plan, and other valuation techniques that use multiples of earnings for peer group companies and analyses of recent business combinations involving peer group companies. These calculations are dependent on subjective factors such as our estimate of future cash flows, the selection of appropriate discount and growth rates, and the selection of peer group companies and recent transactions. These underlying assumptions and estimates are made as of a point in time; subsequent modifications, particularly changes in discount rates or growth rates inherent in our estimates of future cash flows, could result in a future impairment of goodwill. Although we have consistently applied the same methods in developing the assumptions and estimates that underlie the fair value calculations, such as estimates of future cash flows, and based those estimates on relevant information available at the time, such cash flow estimates are highly uncertain by nature and may vary significantly from actual results. If the estimates of future cash flows used in the 2005 annual test had been 10% lower, the resulting fair values would have still been greater than thecarrying values of each of those reporting units, indicating no impairment was present.
Employee benefit plans
We sponsor and also participate in certain Dominion noncontributory defined benefit pension plans and other postretirement benefit plans for eligible active employees, retirees and qualifying dependents. The costs of providing benefits under these plans are dependent, in part, on historical information such as employee demographics, the level of contributions made to the plans and earnings on plan assets. Assumptions about the future, including the expected rate of return on plan assets, discount rates applied to benefit obligations and the anticipated rate of increase in health care costs and participant compensation, also have a significant impact on employee benefit costs. The impact on pension and other postretirement benefit plan obligations associated with changes in these factors is generally recognized in our Consolidated Statements of Income over the remaining average service period of plan participants rather than immediately.
The selection of expected long-term rates of return on plan assets, discount rates and medical cost trend rates are critical assumptions. We determine the expected long-term rates of return on plan assets for pension plans and other postretirement benefit plans by using a combination of:
| · | | Historical return analysis to determine expected future risk premiums; |
| · | | Forward-looking return expectations derived from the yield on long-term bonds and the price earnings ratios of major stock market indices; |
| · | | Expected inflation and risk-free interest rate assumptions; and investment allocation of plan assets. The strategic target asset allocation for our pension fund is 45% U.S. equity securities, 8% non-U.S. equity securities, 22% debt securities and 25% other, such as real estate and private equity investments. |
Assisted by an independent actuary, we develop assumptions, which are then compared to the forecasts of other independent investment advisors to ensure reasonableness. An internal committee selects the final assumptions. We calculated our pension cost using an expected return on plan assets assumption of 8.75% for 2005, 2004 and 2003. We calculated our other postretirement benefit cost using an expected return on plan assets assumption of 8.0% for 2005, 2004 and 2003. The rate used in calculating other postretirement benefit cost is lower than the rate used in calculating pension cost because of differences in the relative amounts of various types of investments held as plan assets.
Discount rates are determined from analyses performed by a third-party actuarial firm of AA/Aa rated bonds with cash flows matching the expected payments to be made under our plans. The discount rate used to calculate 2005 pension and other postretirement benefit costs was 6.00% compared to the 6.25% and 6.75% discount rates used to calculate 2004 and 2003 pension and other postretirement benefit costs, respectively. Lower long-term bond yields were the primary reason for the decline in the discount rate from 2004 to 2005.
The medical cost trend rate assumption is established based on analyses performed by a third-party actuarial firm of various factors including the specific provisions of our medical plans, actual cost trends experienced and projected, and demographics of plan participants. Our medical cost trend rate assumption as of December 31, 2005 is 9.00% and is expected to gradually decrease to 5.00% in later years.
11
Accounting for regulated operations
The accounting for our regulated gas operations differs from the accounting for nonregulated operations in that we are required to reflect the effect of rate regulation in our Consolidated Financial Statements. Specifically, our regulated businesses record assets and liabilities that nonregulated companies would not report under accounting principles generally accepted in the United States of America. When it is probable that regulators will permit the recovery of current costs through future rates charged to customers, we defer these costs as regulatory assets that otherwise would be expensed by nonregulated companies. Likewise, we recognize regulatory liabilities when it is probable that regulators will require customer refunds through future rates and when revenue is collected from customers for expenditures that are not yet incurred. Regulatory assets are amortized into expense and regulatory liabilities are amortized into income over the recovery period authorized by the regulator.
We evaluate whether or not recovery of our regulatory assets through future regulated rates is probable and make various assumptions in our analyses. The expectations of future recovery are generally based on orders issued by regulatory commissions or historical experience, as well as discussions with applicable regulatory authorities. If recovery of regulatory assets is determined to be less than probable, the regulatory asset will be written off and an expense will be recorded in the period such assessment is made. We currently believe the recovery of our regulatory assets is probable. See Notes 2 and 12 to our Consolidated Financial Statements.
Accounting for gas and oil operations
We follow the full cost method of accounting for gas and oil exploration and production activities prescribed by the Securities and Exchange Commission (SEC). Under the full cost method, all direct costs of property acquisition, exploration and development activities are capitalized and subsequently depreciated using the units-of-production method. The depreciable base of costs includes estimated future costs to be incurred in developing proved gas and oil reserves, as well as capitalized asset retirement costs, net of projected salvage values. Capitalized costs in the depreciable base are subject to a ceiling test prescribed by the SEC. The test limits capitalized amounts to a ceiling—the present value of estimated future net revenues to be derived from the production of proved gas and oil reserves assuming period-end pricing adjusted for cash flow hedges in place. We perform the ceiling test quarterly and would recognize asset impairments to the extent that total capitalized costs exceed the ceiling. In addition, gains or losses on the sale or other disposition of gas and oil properties are not recognized, unless the gain or loss would significantly alter the relationship between capitalized costs and proved reserves of natural gas and oil.
Our estimate of proved reserves requires a large degree of judgment and is dependent on factors such as historical data, engineering estimates of proved reserve quantities, estimates of the amount and timing of future expenditures to develop theproved reserves, and estimates of future production from the proved reserves. Our estimated proved reserves as of December 31, 2005 are based upon studies for each of our properties prepared by our staff engineers and reviewed by Ryder Scott Company, L.P. Calculations were prepared using standard geological and engineering methods generally accepted by the petroleum industry and in accordance with SEC guidelines. Given the volatility of natural gas and oil prices, it is possible that our estimate of discounted future net cash flows from proved natural gas and oil reserves that is used to calculate the ceiling could materially change in the near-term.
The process to estimate reserves is imprecise, and estimates are subject to revision. If there is a significant variance in any of our estimates or assumptions in the future and revisions to the value of our proved reserves are necessary, related depletion expense and the calculation of the ceiling test would be affected and recognition of natural gas and oil property impairments could occur. See Notes 2 and 25 to our Consolidated Financial Statements.
Income taxes
Judgment and the use of estimates are required in developing the provision for income taxes and reporting of tax-related assets and liabilities. The interpretation of tax laws involves uncertainty, since tax authorities may interpret them differently. We establish liabilities for tax-related contingencies in accordance with Statement of Financial Accounting Standards (SFAS) No. 5,Accountingfor Contingencies, and review them in light of changing facts and circumstances. Ultimate resolution of income tax matters may result in favorable or unfavorable impacts to net income and cash flows and adjustments to tax-related assets and liabilities could be material. In addition, deferred income tax assets and liabilities are provided, representing future effects on income taxes for temporary differences between the bases of assets and liabilities for financial reporting and tax purposes. We evaluate quarterly the probability of realizing deferred tax assets by reviewing a forecast of future taxable income and the availability of tax planning strategies that can be implemented, if necessary, to realize deferred tax assets. Failure to achieve forecasted taxable income or successfully implement tax planning strategies may affect the realization of deferred tax assets.
Other
We enter into buy/sell and related agreements primarily as a means to reposition our offshore Gulf of Mexico crude oil production to more liquid marketing locations onshore. We typically enter into either a single or a series of buy/sell transactions in which we sell our crude oil production at the offshore field delivery point and buys similar quantities at Cushing, Oklahoma for sale to third parties. We are able to enhance profitability by selling to a wide array of refiners and/or trading companies at Cushing, one of the largest crude oil markets in the world, versus restricting sales to a limited number of refinery purchasers in the Gulf of Mexico.
12
Under the primary guidance of EITF Issue No. 99-19,Reporting Revenue Gross as a Principal versus Net as an Agent, we present the sales and purchases related to our crude oil buy/sell arrangements on a gross basis in our Consolidated Statements of Income. These transactions require physical delivery of the crude oil and the risks and rewards of ownership are evidenced by title transfer, assumption of environmental risk, transportation scheduling and counterparty nonperformance risk. Amounts currently shown on a gross basis in our Consolidated Statements of Income are summarized below.
| | | | | | | | | |
| Year Ended December 31, | | 2005 | | 2004 | | 2003 |
(millions) | | | | | | | | | |
Sale activity included in operating revenue | | $ | 377 | | $ | 290 | | $ | 181 |
Purchase activity included in operating expenses(1) | | | 362 | | | 271 | | | 163 |
| (1) | | Included in other energy-related commodity purchases |
In September 2005, the FASB ratified the EITF’s consensus on Issue No. 04-13,Accounting for Purchases and Sales of Inventory with the Same Counterparty, that will require buy/sell and related agreements to be presented on a net basis in our Consolidated Statements of Income if they are entered into in contemplation of one another. This new guidance is required to be applied to all new arrangements entered into, and modifications or renewals of existing arrangements, for reporting periods beginning April 1, 2006. We are currently assessing the impact that this new guidance may have on our income statement presentation of these transactions; however, there will be no impact on our results of operations or cash flows. See Note 4 to our Consolidated Financial Statements.
Results of Operations
Segment results include the impact of intersegment revenues and expenses, which may result in intersegment profit or loss. Presented below is a summary of contributions by our operating segments to net income:
| | | | | | | |
| Year Ended December 31, | | 2005 | | | 2004 | |
| (millions) | | | | | | |
Delivery | | $157 | | | $ | 184 | |
Energy | | 234 | | | | 228 | |
Exploration & Production | | 529 | | | | 520 | |
Primary operating segments | | 920 | | | | 932 | |
Corporate | | (367 | ) | | | (65 | ) |
Consolidated | | $553 | | | $ | 867 | |
Overview
2005 vs. 2004
Our 2005 results were significantly impacted by Hurricanes Katrina and Rita, which struck the Gulf Coast area in late August and late September 2005, respectively. Due to the hurricanes, our production assets in the Gulf of Mexico and, to a lesser extent, southern Louisiana were temporarily shut-in. The interruption in gas and oil production resulted in a $272 million after-tax loss related to the discontinuance of hedge accounting for certain gas and oil hedges. Results were also impacted by delays in production caused by damage to third-party downstream infrastructure.
Net income decreased 36% to $553 million as compared to 2004. The combined net income contribution of our primaryoperating segments decreased $12 million. See Note 24 to our Consolidated Financial Statements for more information about our operating segments. This decrease is primarily due to:
| · | | A lower contribution from our delivery operations reflecting higher bad debt, salary and interest expenses for the regulated operations; partially offset by |
| · | | A higher contribution from energy operations primarily reflecting higher gas prices at producer services and increased revenue from our LNG facility resulting from additional storage and increased pipeline capacity; and |
| · | | A higher contribution from exploration and production operations primarily reflecting higher realized prices for gas and oil and the recognition of business interruption insurance revenue associated with Hurricane Ivan partially offset by losses related to the discontinuance of hedge accounting, hedge ineffectiveness expense and higher interest expense. |
We incurred a $357 million after-tax loss in 2005 and a $61 million after-tax loss in 2004 in the Corporate segment related to our exploration and production operations’ discontinuance of hedge accounting for certain gas and oil hedges caused by hurricanes.
Analysis of Consolidated Operations
Presented below are selected amounts related to our results of operations:
| | | | | | | |
| Year Ended December 31, | | 2005 | | | 2004 |
| (millions) | | | | | |
Operating Revenue (1) | | $ | 8,072 | | | $ | 6,581 |
Operating Expenses | | | | | | | |
Electric fuel and energy purchases (1) | | | 341 | | | | 349 |
Purchased gas (1) | | | 3,782 | | | | 2,810 |
Other energy-related commodity purchases | | | 363 | | | | 274 |
Other operations and maintenance (1) | | | 1,547 | | | | 785 |
Depreciation, depletion and amortization | | | 670 | | | | 627 |
Other taxes | | | 302 | | | | 270 |
Other income | | | 30 | | | | 55 |
Interest and related charges (1) | | | 225 | | | | 172 |
Income tax expense | | | 317 | | | | 482 |
Cumulative effect of change in accounting principle, net of tax | | | (2 | ) | | | — |
| (1) | | Includes transactions with other Dominion subsidiaries related to Dominion’s enterprise-wide price risk management and other activities. See Note 22 to our Consolidated Financial Statements for a description of transactions with affiliates. |
An analysis of our results of operations for 2005 compared to 2004 follows:
Operating Revenueincreased 23% to $8.1 billion, primarily reflecting:
| · | | A $666 million increase in nonregulated gas sales largely reflecting a $588 million increase from gas aggregation activities and nonregulated retail energy marketing operations primarily due to higher prices and a $110 million increase from sales of gas purchased by exploration and production operations to facilitate gas transportation and satisfy other agreements. These increases in revenue were largely offset by corresponding increases inPurchased gas expense; |
| · | | A $341 million increase in regulated gas sales primarily related to the recovery of higher gas prices. The effect of this increase was offset by a comparable increase inPurchased gas expense; |
| · | | A $171 million increase in gas and oil production sales reflecting a $140 million increase from oil production sales primarily due to higher volumes and a $31 million increase |
13
| | from gas production sales. The increase in gas production sales was due to higher average realized prices, partially offset by lower volumes, largely resulting from interruptions in Gulf of Mexico production caused by Hurricanes Katrina and Rita; |
| · | | A $141 million increase in other energy-related commodity sales reflecting an $87 million increase in sales of purchased oil by exploration and production operations and a $54 million increase in sales of extracted products principally due to increased prices and volumes. This increase in purchased oil was largely offset by a corresponding increase inOther energy-related commodity purchases expense; |
| · | | A $103 million increase in gas transportation and storage revenue primarily due to additions of pipeline and storage capacity, additional gas transportation contracts, increased gathering and extraction revenue due to higher volumes and higher rates, partially offset by the effects of a rate settlement; and |
| · | | An $85 million increase in other revenue primarily reflecting the recognition of business interruption insurance revenue associated with Hurricane Ivan. |
Operating Expenses
Purchased gas expenseincreased 35% to $3.8 billion, principally resulting from a $522 million increase associated with gas aggregation activities and nonregulated retail energy marketing operations, a $305 million increase associated with regulated gas distribution operations and a $124 million increase related to exploration and production operations, all of which are discussed inOperating Revenue.
Other energy-related commodity purchases expense increased 32% to $363 million, primarily reflecting a $91 million increase related to purchases of oil by our exploration and production operations discussed inOperating Revenue.
Other operations and maintenance expense increased 97% to $1.5 billion, primarily resulting from:
| · | | A $423 million loss related to the discontinuance of hedge accounting for certain gas and oil hedges resulting from an interruption of gas and oil production in the Gulf of Mexico caused by Hurricanes Katrina and Rita; |
| · | | An $81 million increase in costs related to gas and oil production activities attributable to higher production costs and financing fees; |
| · | | A $59 million loss related to the discontinuance of hedge accounting in March 2005 for certain oil hedges primarily resulting from a delay in reaching anticipated production levels in the Gulf of Mexico, and subsequent changes in the fair value of those hedges; |
| · | | A $56 million increase in hedge ineffectiveness expense associated with exploration and production operations, primarily due to an increase in the fair value differential between the delivery location and commodity specifications of our derivative contracts and the delivery location and commodity specifications of our forecasted gas and oil sales; |
| · | | A $48 million increase in salaries, wages and benefits expense primarily due to higher incentive-based compensation and higher wages; |
| · | | A $27 million increase in insurance expense primarily related to exploration and production activities; |
| · | | A $21 million increase in incremental expenses and severance costs associated with Hurricanes Katrina and Rita; |
| · | | A $20 million increase in bad debt expense, primarily related to regulated delivery gas operations; and |
| · | | The net impact of the following items recognized in 2004: |
| | · | | A $120 million benefit due to favorable changes in the fair value of certain oil options related to exploration and production operations; partially offset by |
| | · | | A $96 million loss related to the discontinuance of hedge accounting for certain oil hedges resulting from an interruption of oil production in the Gulf of Mexico caused by Hurricane Ivan, and subsequent changes in the fair value of those hedges during the third quarter. |
Depreciation, depletion and amortization expense (DD&A) increased 7% to $670 million, primarily reflecting higher exploration and production finding and development costs and higher depreciation resulting from property additions.
Other taxes increased 12% to $302 million, primarily due to higher severance taxes associated with increased commodity prices.
Other income decreased 45% to $30 million, primarily reflecting a $31 million benefit in 2004 related to the sale of CNGI’s equity investment in an Australian pipeline business. No comparable benefit was recognized during 2005.
Interest and related chargesincreased 31% to $225 million, primarily due to the impact of additional borrowings and higher interest rates on Dominion money pool borrowings.
Segment Results of Operations
Delivery
Delivery includes our regulated gas distribution and customer service business, as well as our nonregulated retail energy marketing operations and related products and services.
| | | | | | |
| | | 2005 | | 2004 |
Net income contribution (millions) | | $ | 157 | | $ | 184 |
Throughput (bcf): | | | | | | |
Gas sales | | | 131 | | | 127 |
Gas transportation | | | 241 | | | 244 |
Total throughput | | | 372 | | | 371 |
bcf = billion cubic feet
Presented below, on an after-tax basis, are the key factors impacting Delivery’s net income contribution:
2005 vs. 2004
| | | |
| | | Increase
(Decrease) | |
| (millions) | | | |
Regulated operations: | | | |
Interest expense | | $(14 | ) |
Bad debt expense(1) | | (7 | ) |
Salaries, wages and benefits expense | | (8 | ) |
Other gas margins(2) | | (3 | ) |
Other | | (2 | ) |
Weather | | 8 | |
Nonregulated retail energy marketing operations | | (1 | ) |
Change in net income contribution | | $(27 | ) |
| (1) | | Higher bad debt expense primarily reflects the absence of a 2004 reduction in reserves. |
| (2) | | Reflects changes in customer usage and other factors. |
14
Energy
Energy includes our tariff-based natural gas transmission pipeline and storage businesses and an LNG import and storage facility. It also includes certain natural gas production operations and producer services, which consist of aggregation of gas supply and related wholesale activities.
| | | | | | |
| | | 2005 | | 2004 |
Net income contribution (millions) | | $ | 234 | | $ | 228 |
Gas sales (bcf) | | | 226 | | | 234 |
Gas transportation throughput (bcf) | | | 794 | | | 704 |
Presented below, on an after-tax basis, are the key factors impacting Energy’s net income contribution:
2005 vs. 2004
| | | |
| | | Increase
(Decrease) | |
| (millions) | | | |
Producer services(1) | | $ 14 | |
Cove Point(2) | | 13 | |
Gas transmission operations: | | | |
Rate reduction(3) | | (17 | ) |
Salaries, wages and benefits expense | | (6 | ) |
Other | | 2 | |
Change in net income contribution | | $ 6 | |
| (2) | | Reflects the addition of a fifth storage tank in December 2004 and increased pipeline capacity. |
| (3) | | Represents the impact of a comprehensive rate settlement between Dominion Transmission, Inc. and its customers. The settlement, which became effective July 1, 2005, will reduce our natural gas transportation and storage service revenue by approximately $49 million annually. |
E&P
E&P includes our gas and oil exploration, development and production business. Operations are located in several major producing basins in the lower 48 states, including the outer continental shelf and deepwater areas of the Gulf of Mexico.
| | | | | | |
| | | 2005 | | 2004 |
| | | | | |
Net income contribution (millions) | | $ | 529 | | $ | 520 |
Gas production (bcf) | | | 232 | | | 253 |
Oil production (million bbls) | | | 14 | | | 11 |
Average realized prices with hedging results: | | | | | | |
Gas (per mcf)(1) | | $ | 5.03 | | $ | 4.11 |
Oil (per bbl) | | | 29.65 | | | 25.15 |
Average prices without hedging results: | | | | | | |
Gas (per mcf)(1) | | | 8.11 | | | 5.99 |
Oil (per bbl) | | | 50.30 | | | 37.59 |
DD&A (per mcfe) | | $ | 1.50 | | $ | 1.40 |
Average production (lifting) cost (per mcfe) | | | 1.04 | | | .78 |
bbl = barrel
mcf = thousand cubic feet
mcfe = thousand cubic feet equivalent
| (1) | | Excludes $227 million and $223 million of revenue recognized in 2005 and 2004, respectively, under the volumetric production payment agreements described in Note 10 in our Consolidated Financial Statements. |
Presented below, on an after-tax basis, are the key factors impacting E&P’s net income contribution:
2005 vs. 2004
| | | |
| | | Increase
(Decrease) | |
| (millions) | | | |
Gas and oil—prices | | $ 155 | |
Business interruption insurance | | 50 | |
Operations and maintenance(1) | | (144 | ) |
Interest expense | | (28 | ) |
Depreciation, depletion and amortization | | (16 | ) |
Gas and oil—production(2) | | (12 | ) |
Other | | 4 | |
Change in net income contribution | | $ 9 | |
| (1) | | Reflects the impact in 2004 of favorable changes in the fair value of certain oil options, an increase in hedge ineffectiveness expense in 2005 and the discontinuance of hedge accounting for certain oil hedges in March 2005 largely resulting from delays in reaching anticipated production levels in the Gulf of Mexico, and subsequent changes in the fair value of those hedges, partially offset by a benefit reflecting the impact of a decrease in gas and oil prices on hedges that were de-designated following Hurricanes Katrina and Rita. It also reflects increased lifting costs and higher insurance expense. |
| (2) | | Reflects interruptions caused by Hurricanes Katrina and Rita. |
Included below are the volumes and weighted average prices associated with economic hedges in place as of December 31, 2005 by applicable time period. Prior cash flow hedges for which hedge accounting was discontinued due to production interruptions caused by Hurricanes Katrina and Rita, and for which amounts were reclassified from AOCI to earnings upon the discontinuance of hedge accounting, are excluded from the following table:
| | | | | | | | |
| | | Natural Gas | | Oil |
| Year | | Hedged
production
(bcf) | | Average
hedge price
(per mcf) | | Hedged
production
(million bbls) | | Average
hedge price
(per bbl) |
2006 | | 188.4 | | $4.72 | | 12.7 | | $25.25 |
2007 | | 179.6 | | 5.59 | | 10.0 | | 33.41 |
2008 | | 48.1 | | 6.47 | | 5.0 | | 49.36 |
15
Corporate
Corporate includes our corporate and other functions, including the activities of CNGI, our power generating facility and other minor subsidiaries.
Presented below are the Corporate segment’s after-tax results:
| | | | | | | | |
| | | 2005 | | | 2004 | |
| (millions) | | | | | | |
Specific items attributable to operating segments | | $ | (373 | ) | | $ | (61 | ) |
Corporate operations | | | 6 | | | | (4 | ) |
Net expenses | | $ | (367 | ) | | $ | (65 | ) |
Corporate reported net expenses of $367 million for 2005 and net expenses of $65 million for 2004.
The net expenses in 2005 primarily reflect:
| · | | A $556 million loss in 2005 ($357 million after-tax) related to the discontinuance of hedge accounting for certain gas and oil hedges resulting from an interruption in gas and oil production in the Gulf of Mexico caused by Hurricanes Katrina and Rita, and subsequent changes in the fair value of those hedges, attributable to the E&P segment; and |
| · | | A $21 million loss in 2005 ($13 million after-tax) related to incremental operations and maintenance expenses and severance costs associated with Hurricanes Katrina and Rita, attributable to the E&P segment. |
The net expenses in 2004 primarily reflect:
| · | | A $96 million loss in 2004 ($61 million after-tax) related to the discontinuance of hedge accounting for certain oil hedges, resulting from an interruption of oil production in the Gulf of Mexico caused by Hurricane Ivan, and subsequent changes in the fair value of those hedges, attributable to the E&P segment; and |
| · | | A $31 million tax valuation allowance related to certain CNGI investments that were held for sale; partially offset by |
| · | | A $31 million benefit related to the sale of CNGI’s equity investment in an Australian pipeline business. |
Credit Risk
Exposure to potential concentrations of credit risk results primarily from our marketing of natural gas and sales of gas and oil production. Presented below is a summary of our gross and net credit exposure as of December 31, 2005 for these activities. We calculate our gross credit exposure for each counterparty as the unrealized fair value of derivative contracts plus any outstanding receivables (net of payables, where netting agreements exist), prior to the application of collateral.
| | | | | | |
| | | Gross
Credit
Exposure | | Credit
Collateral | | Net
Credit
Exposure |
| (millions) | | | | | | |
Investment grade(1) | | $557 | | $126 | | $431 |
Non-investment grade(2) | | 21 | | — | | 21 |
No external ratings: | | | | | | |
Internally rated—investment grade(3) | | 7 | | — | | 7 |
Internally rated—non-investment grade(4) | | 241 | | — | | 241 |
Total | | $826 | | $126 | | $700 |
| (1) | | Designations as investment grade are based upon minimum credit ratings assigned by Moody’s Investors Service and Standard & Poor’s Rating Group, a division of the McGraw-Hill Companies, Inc. The five largest counterparty exposures, combined, for this category represented approximately 33% of the total net credit exposure. |
| (2) | | The five largest counterparty exposures, combined, for this category represented approximately 3% of the total net credit exposure. |
| (3) | | The five largest counterparty exposures, combined, for this category represented approximately 2% of the total net credit exposure. |
| (4) | | The five largest counterparty exposures, combined, for this category represented approximately 6% of the total net credit exposure. |
Item 7A. Quantitative and Qualitative Disclosures About Market Risk
The matters discussed in this Item may contain “forward-looking statements” as described in the introductory paragraphs under Item 7. MD&A of this Form 10-K. The reader’s attention is directed to those paragraphs and Item 1A. Risk Factors, for discussion of various risks and uncertainties that may affect our future.
Market Risk Sensitive Instruments and Risk Management
Our financial instruments, commodity contracts and related financial derivative instruments are exposed to potential losses due to adverse changes in commodity prices and interest rates as described below. Commodity price risk is present in our gas and oil production and procurement operations and energy marketing operations due to the exposure to market shifts in prices received and paid for natural gas and oil. We use derivative commodity contracts to manage price risk exposures for these operations. Interest rate risk generally is related to our outstanding debt.
The following sensitivity analysis estimates the potential loss of future earnings or fair value from market risk sensitive instruments over a selected time period due to a 10% unfavorable change in commodity prices and interest rates.
Commodity Price Risk
We manage the price risk associated with purchases and sales of natural gas and oil using commodity-based financial derivative instruments, including futures, forwards, options and swaps. For sensitivity analysis purposes, the fair value of our commodity-based financial derivative instruments is determined based on models that consider the market prices of commodities in future periods, the volatility of the market prices in each period, as well as the time value factors of the derivative instruments. Prices and volatility are principally determined based on actively quoted market prices. A hypothetical 10% unfavorable change in commodity prices would have resulted in a decrease of approximately $519 million and $454 million in the fair value of our commodity-based financial derivative instruments as of December 31, 2005 and 2004, respectively.
The impact of a change in energy commodity prices on our commodity-based financial derivative instruments at a point in time is not necessarily representative of the results that will be realized when such contracts are ultimately settled. Net losses from derivative commodity instruments used for hedging purposes, to the extent realized, will generally be offset by recognition of the hedged transaction, such as revenue from sales.
Interest Rate Risk
We manage our interest rate risk exposure predominantly by maintaining a balance of fixed and variable rate debt. We also enter into interest rate sensitive derivatives, including interest rate swap agreements. For financial instruments outstanding at December 31, 2005, a hypothetical 10% increase in market interest rates would decrease annual earnings by approximately $8 million. A hypothetical 10% increase in market interest rates, as determined at December 31, 2004, would have resulted in a decrease in annual earnings of approximately $3 million.
16
Investment Price Risk
We sponsor employee pension and other postretirement benefit plans and participate in plans sponsored by Dominion that hold investments in trusts to fund benefit payments. To the extent that the values of investments held in these trusts decline, the effect will be reflected in our recognition of the periodic cost of such employee benefit plans and the determination of the amount of cash to be contributed by us to the employee benefit plans.
Risk Management Policies
We have operating procedures in place that are administered by experienced management to help ensure that proper internalcontrols are maintained. In addition, Dominion has established an independent function at the corporate level to monitor compliance with the risk management policies of all subsidiaries, including the Company. Dominion maintains credit policies that include the evaluation of a prospective counterparty’s financial condition, collateral requirements where deemed necessary, and the use of standardized agreements which facilitate the netting of cash flows associated with a single counterparty. In addition, Dominion also monitors the financial condition of existing counterparties on an ongoing basis. Based on Dominion’s credit policies and our December 31, 2005 provision for credit losses, management believes that it is unlikely that a material adverse effect on our financial position, results of operations or cash flows would occur as a result of counterparty nonperformance.
17
Item 8. Financial Statements and Supplementary Data
Index
18
Report of Management’s Responsibilities
Because we are not an accelerated filer as defined in Exchange Act Rule 12b-2, we are not required to comply with Securities and Exchange Commission rules implementing Section 404 of the Sarbanes-Oxley Act of 2002 until December 31, 2007.
Our management is responsible for all information and representations contained in the Consolidated Financial Statements and other sections of our annual report on Form 10-K. Our Consolidated Financial Statements, which include amounts based on estimates and judgments of management, have been prepared in conformity with accounting principles generally accepted in the United States of America. Other financial information in the Form 10-K is consistent with that in our Consolidated Financial Statements.
Management maintains a system of internal controls designed to provide reasonable assurance, at a reasonable cost, that our assets are safeguarded against loss from unauthorized use or disposition and that transactions are executed and recorded in accordance with established procedures. Management recognizes the inherent limitations of any system of internal control and, therefore, cannot provide absolute assurance that the objectives of the established internal controls will be met. This system includes written policies, an organizational structure designed to ensure appropriate segregation of responsibilities, careful selection and training of qualified personnel, and internal audits. Management believes that during 2005 the system of internal control was adequate to accomplish the intended objectives.
Our Consolidated Financial Statements have been audited by Deloitte & Touche LLP, independent registered public accounting firm, who have been engaged by Dominion’s Audit Committee which is composed entirely of independent directors. Deloitte & Touche LLP’s audit was conducted in accordance with the standards of the Public Company Accounting Oversight Board (United States).
The Board of Directors also serves as our Audit Committee and meets periodically with the independent registered public accounting firm, the internal auditors and management to discuss auditing, internal accounting control and financial reporting matters and to ensure that each is properly discharging its responsibilities.
Management recognizes its responsibility for fostering a strong ethical climate so that our affairs are conducted according to the highest standards of personal corporate conduct. This responsibility is characterized and reflected in our code of ethics, which addresses potential conflicts of interest, compliance with all domestic and foreign laws, the confidentiality of proprietary information and full disclosure of public information.
March 2, 2006
Report of Independent Registered Public Accounting Firm
To the Shareholder and Board of Directors of
Consolidated Natural Gas Company
We have audited the accompanying consolidated balance sheets of Consolidated Natural Gas Company (a wholly-owned subsidiary of Dominion Resources, Inc.) and subsidiaries (the “Company”) as of December 31, 2005 and 2004, and the related consolidated statements of income, common shareholder’s equity and comprehensive income, and of cash flows for each of the three years in the period ended December 31, 2005. These financial statements are the responsibility of the Company’s management. Our responsibility is to express an opinion on these financial statements based on our audits.
We conducted our audits in accordance with the standards of the Public Company Accounting Oversight Board (United States). Those standards require that we plan and perform the audit to obtain reasonable assurance about whether the financial statements are free of material misstatement. The Company is not required to have, nor were we engaged to perform, an audit of its internal control over financial reporting. Our audits included consideration of internal control over financial reporting as a basis for designing audit procedures that are appropriate in the circumstances, but not for the purpose of expressing an opinion on the effectiveness of the Company’s internal control over financial reporting. Accordingly, we express no such opinion. An audit also includes examining, on a test basis, evidence supporting the amounts and disclosures in the financial statements, assessing the accounting principles used and significant estimates made by management, as well as evaluating the overall financial statement presentation. We believe that our audits provide a reasonable basis for our opinion.
In our opinion, such consolidated financial statements present fairly, in all material respects, the financial position of Consolidated Natural Gas Company and subsidiaries as of December 31, 2005 and 2004, and the results of their operations and their cash flows for each of the three years in the period ended December 31, 2005, in conformity with accounting principles generally accepted in the United States of America.
As discussed in Note 3 to the consolidated financial statements, the Company changed its methods of accounting to adopt new accounting standards for: conditional asset retirement obligations in 2005 and asset retirement obligations, derivative contracts not held for trading purposes, and the consolidation of variable interest entities in 2003.
/s/ Deloitte & Touche LLP
Richmond, Virginia
March 2, 2006
Consolidated Statements of Income
| | | | | | | | | | | |
| Year Ended December 31, | | 2005 | | | 2004 | | 2003 | |
| (millions) | | | | | | | | |
Operating Revenue | | | | | | | | | | | |
External customers | | $ | 6,871 | | | $ | 5,489 | | $ | 4,612 | |
Affiliated customers | | | 1,201 | | | | 1,092 | | | 716 | |
Total operating revenue | | | 8,072 | | | | 6,581 | | | 5,328 | |
Operating Expenses | | | | | | | | | | | |
Purchased gas: | | | | | | | | | | | |
External suppliers | | | 3,104 | | | | 2,283 | | | 1,593 | |
Affiliated suppliers | | | 678 | | | | 527 | | | 613 | |
Electric fuel and energy purchases: | | | | | | | | | | | |
External suppliers | | | 132 | | | | 153 | | | 116 | |
Affiliated suppliers | | | 209 | | | | 196 | | | 80 | |
Other energy-related commodity purchases | | | 363 | | | | 274 | | | 165 | |
Other operations and maintenance: | | | | | | | | | | | |
External suppliers | | | 1,405 | | | | 622 | | | 591 | |
Affiliated suppliers | | | 142 | | | | 163 | | | 158 | |
Depreciation, depletion and amortization | | | 670 | | | | 627 | | | 581 | |
Other taxes | | | 302 | | | | 270 | | | 225 | |
Total operating expenses | | | 7,005 | | | | 5,115 | | | 4,122 | |
Income from operations | | | 1,067 | | | | 1,466 | | | 1,206 | |
Other income (loss) | | | 30 | | | | 55 | | | (32 | ) |
Interest and related charges: | | | | | | | | | | | |
Interest expense | | | 209 | | | | 156 | | | 137 | |
Interest expense—junior subordinated notes payable to affiliated trust | | | 16 | | | | 16 | | | — | |
Distributions—mandatorily redeemable trust preferred securities | | | — | | | | — | | | 16 | |
Total interest and related charges | | | 225 | | | | 172 | | | 153 | |
Income before income tax expense | | | 872 | | | | 1,349 | | | 1,021 | |
Income tax expense | | | 317 | | | | 482 | | | 372 | |
Income before cumulative effect of changes in accounting principles | | | 555 | | | | 867 | | | 649 | |
Cumulative effect of changes in accounting principles (net taxes of $1 in 2005 and $8 in 2003) | | | (2 | ) | | | — | | | (11 | ) |
Net Income | | $ | 553 | | | $ | 867 | | $ | 638 | |
The accompanying notes are an integral part of our Consolidated Financial Statements.
Consolidated Balance Sheets
| | | | | | | | |
| At December 31, | | 2005 | | | 2004 | |
| (millions) | | | | | | |
| ASSETS | | | | | | | | |
| Current Assets | | | | | | | | |
Cash and cash equivalents | | $ | 44 | | | $ | 19 | |
Accounts receivable: | | | | | | | | |
Customers (less allowance for doubtful accounts of $27 and $28) | | | 1,502 | | | | 1,044 | |
Other | | | 110 | | | | 61 | |
Receivables from affiliates | | | 214 | | | | 125 | |
Inventories: | | | | | | | | |
Materials and supplies | | | 29 | | | | 32 | |
Gas stored | | | 337 | | | | 190 | |
Derivative assets | | | 1,991 | | | | 504 | |
Deferred income taxes | | | 510 | | | | 280 | |
Prepayments | | | 122 | | | | 57 | |
Other | | | 569 | | | | 317 | |
Total current assets | | | 5,428 | | | | 2,629 | |
| Investments | | | | | | | | |
Investments in affiliates | | | 210 | | | | 204 | |
Other | | | 95 | | | | 87 | |
Total investments | | | 305 | | | | 291 | |
| Property, Plant and Equipment | | | | | | | | |
Property, plant and equipment | | | 19,126 | | | | 17,220 | |
Accumulated depreciation, depletion and amortization | | | (6,780 | ) | | | (6,170 | ) |
Total property, plant and equipment, net | | | 12,346 | | | | 11,050 | |
| Deferred Charges and Other Assets | | | | | | | | |
Goodwill | | | 623 | | | | 623 | |
Prepaid pension cost | | | 1,086 | | | | 984 | |
Derivative assets | | | 1,403 | | | | 541 | |
Regulatory assets | | | 403 | | | | 369 | |
Other | | | 308 | | | | 235 | |
Total deferred charges and other assets | | | 3,823 | | | | 2,752 | |
Total assets | | $ | 21,902 | | | $ | 16,722 | |
| | | | | | | | |
| At December 31, | | 2005 | | | 2004 | |
| (millions) | | | | | | |
| LIABILITIES AND SHAREHOLDER’S EQUITY | | | | | | | | |
| Current Liabilities | | | | | | | | |
Securities due within one year | | $ | 734 | | | $ | 150 | |
Short-term debt | | | 187 | | | | — | |
Accounts payable | | | 1,438 | | | | 949 | |
Payables to affiliates | | | 151 | | | | 111 | |
Affiliated current borrowings | | | 1,922 | | | | 1,195 | |
Accrued interest, payroll and taxes | | | 250 | | | | 229 | |
Derivative liabilities | | | 3,731 | | | | 1,237 | |
Other | | | 489 | | | | 341 | |
Total current liabilities | | | 8,902 | | | | 4,212 | |
| Long-Term Debt | | | | | | | | |
Long-term debt | | | 2,708 | | | | 3,454 | |
Junior subordinated notes payable to affiliated trust | | | 206 | | | | 206 | |
Total long-term debt | | | 2,914 | | | | 3,660 | |
| Deferred Credits and Other Liabilities | | | | | | | | |
Deferred income taxes | | | 2,311 | | | | 2,310 | |
Deferred investment tax credits | | | 10 | | | | 11 | |
Derivative liabilities | | | 2,706 | | | | 1,234 | |
Regulatory liabilities | | | 147 | | | | 223 | |
Other | | | 621 | | | | 592 | |
Total deferred credits and other liabilities | | | 5,795 | | | | 4,370 | |
Total liabilities | | | 17,611 | | | | 12,242 | |
Commitments and Contingencies (see Note 19) | | | | | | | | |
| Common Shareholder’s Equity | | | | | | | | |
Common stock, no par, 100 shares authorized and outstanding | | | 1,816 | | | | 1,816 | |
Other paid-in capital | | | 3,273 | | | | 2,520 | |
Retained earnings | | | 971 | | | | 993 | |
Accumulated other comprehensive loss | | | (1,769 | ) | | | (849 | ) |
Total common shareholder’s equity | | | 4,291 | | | | 4,480 | |
Total liabilities and shareholder’s equity | | $ | 21,902 | | | $ | 16,722 | |
The accompanying notes are an integral part of our Consolidated Financial Statements.
23
Consolidated Statements of Common Shareholder’s Equity and Comprehensive Income
| | | | | | | | | | | | | | | | | |
| | | Common Stock
| | Other
Paid-In
Capital | | Retained
Earnings | | | Accumulated
Other
Comprehensive
Income (Loss) | | | Total | |
| | | Shares | | Amount | | | | |
| (millions, except shares) | | | | | | |
Balance at December 31, 2002 | | 100 | | $ | 1,816 | | $ | 1,871 | | $420 | | | $(298 | ) | | $3,809 | |
Comprehensive income: | | | | | | | | | | | | | | | | | |
Net income | | | | | | | | | | 638 | | | | | | 638 | |
Unrealized losses on investment securities, net of tax benefit of $0.5 | | | | | | | | | | | | | 1 | | | 1 | |
Foreign currency translation adjustments | | | | | | | | | | | | | 33 | | | 33 | |
Net deferred derivative losses—hedging activities, net of $194 tax benefit | | | | | | | | | | | | | (501 | ) | | (501 | ) |
Amounts reclassified to net income: | | | | | | | | | | | | | | | | | |
Net derivative losses—hedging activities, net of $131 tax benefit | | | | | | | | | | | | | 228 | | | 228 | |
Total comprehensive income | | | | | | | | | | 638 | | | (239 | ) | | 399 | |
Equity contribution by parent | | | | | | | | 606 | | | | | | | | 606 | |
Tax benefit from stock awards and stock options exercised | | | | | | | | 1 | | | | | | | | 1 | |
Dividends | | | | | | | | | | (450 | ) | | | | | (450 | ) |
Balance at December 31, 2003 | | 100 | | | 1,816 | | | 2,478 | | 608 | | | (537 | ) | | 4,365 | |
Comprehensive income: | | | | | | | | | | | | | | | | | |
Net income | | | | | | | | | | 867 | | | | | | 867 | |
Foreign currency translation adjustments | | | | | | | | | | | | | 11 | | | 11 | |
Net deferred derivative losses—hedging activities, net of $431 tax benefit | | | | | | | | | | | | | (744 | ) | | (744 | ) |
Amounts reclassified to net income: | | | | | | | | | | | | | | | | | |
Net derivative losses—hedging activities, net of $269 tax benefit | | | | | | | | | | | | | 465 | | | 465 | |
Foreign currency translation adjustments(1) | | | | | | | | | | | | | (44 | ) | | (44 | ) |
Total comprehensive income | | | | | | | | | | 867 | | | (312 | ) | | 555 | |
Equity contribution by parent | | | | | | | | 41 | | | | | | | | 41 | |
Tax benefit from stock awards and stock options exercised | | | | | | | | 1 | | | | | | | | 1 | |
Dividends | | | | | | | | | | (482 | ) | | | | | (482 | ) |
Balance at December 31, 2004 | | 100 | | | 1,816 | | | 2,520 | | 993 | | | (849 | ) | | 4,480 | |
Comprehensive income: | | | | | | | | | | | | | | | | | |
Net income | | | | | | | | | | 553 | | | | | | 553 | |
Net deferred derivative losses—hedging activities, net of $1,053 tax benefit | | | | | | | | | | | | | (1,842 | ) | | (1,842 | ) |
Amounts reclassified to net income: | | | | | | | | | | | | | | | | | |
Net derivative losses—hedging activities, net of $529 tax benefit | | | | | | | | | | | | | 922 | | | 922 | |
Total comprehensive income (loss) | | | | | | | | | | 553 | | | (920 | ) | | (367 | ) |
Equity contribution by parent | | | | | | | | 750 | | | | | | | | 750 | |
Tax benefit from stock awards and stock options exercised | | | | | | | | 3 | | | | | | | | 3 | |
Dividends | | | | | | | | | | (575 | ) | | | | | (575 | ) |
Balance at December 31, 2005 | | 100 | | $ | 1,816 | | $ | 3,273 | | $971 | | | $(1,769 | ) | | $4,291 | |
| (1) | | Reclassified to earnings due to the sale of CNG International investments. |
The accompanying notes are an integral part of our Consolidated Financial Statements.
Consolidated Statements of Cash Flows
| | | | | | | | | |
| Year Ended December 31, | | 2005 | | | 2004 | | | 2003 | |
| (millions) | | | | | | |
| Operating Activities | | | | | | | | | |
Net income | | $ 553 | | | $ 867 | | | $ 638 | |
Adjustments to reconcile net income to net cash from operating activities: | | | | | | | | | |
Impairment (recovery) of CNG International assets | | — | | | (18 | ) | | 78 | |
Depreciation, depletion and amortization | | 670 | | | 627 | | | 581 | |
Deferred income taxes and investment tax credits, net | | 295 | | | 398 | | | 239 | |
Net realized and unrealized derivative (gains)/losses | | 162 | | | (133 | ) | | 35 | |
Other adjustments to net income | | 89 | | | 16 | | | (50 | ) |
Changes in : | | | | | | | | | |
Accounts receivable | | (487 | ) | | (265 | ) | | (153 | ) |
Affiliated accounts receivable and payable | | (49 | ) | | 208 | | | (228 | ) |
Inventories | | (144 | ) | | 16 | | | (123 | ) |
Deferred purchased gas costs, net | | (133 | ) | | 2 | | | (41 | ) |
Prepaid pension cost | | (102 | ) | | (112 | ) | | (134 | ) |
Accounts payable | | 419 | | | 294 | | | 54 | |
Accrued interest, payroll and taxes | | 24 | | | 57 | | | 28 | |
Deferred revenue | | (227 | ) | | (223 | ) | | (43 | ) |
Margin deposit assets and liabilities | | 194 | | | (29 | ) | | (7 | ) |
Other operating assets and liabilities | | (284 | ) | | (87 | ) | | 41 | |
Net cash provided by operating activities | | 980 | | | 1,618 | | | 915 | |
| Investing Activities | | | | | | | | | |
Additions to gas and oil properties, including acquisitions | | (1,508 | ) | | (1,168 | ) | | (1,166 | ) |
Plant construction and other property additions: | | (423 | ) | | (378 | ) | | (378 | ) |
Proceeds from sales of gas and oil properties | | 93 | | | 413 | | | 291 | |
Other | | (62 | ) | | 47 | | | (67 | ) |
Net cash used in investing activities | | (1,900 | ) | | (1,086 | ) | | (1,320 | ) |
| Financing Activities | | | | | | | | | |
Issuance of long-term debt | | — | | | 400 | | | 200 | |
Repayment of long-term debt | | (150 | ) | | (489 | ) | | (151 | ) |
Short-term borrowings from affiliates, net | | 1,477 | | | 168 | | | 1,065 | |
Issuance (repayment) of short-term debt, net | | 187 | | | (151 | ) | | (246 | ) |
Common dividend payments | | (575 | ) | | (482 | ) | | (450 | ) |
Other | | 6 | | | 2 | | | 4 | |
Net cash provided by (used in) financing activities | | 945 | | | (552 | ) | | 422 | |
Increase (decrease) in cash and cash equivalents | | 25 | | | (20 | ) | | 17 | |
Cash and cash equivalents at beginning of the year | | 19 | | | 39 | | | 22 | |
Cash and cash equivalents at end of the year | | $ 44 | | | $ 19 | | | $ 39 | |
| Supplemental Cash Flow Information | | | | | | | | | |
Cash paid during the year for: | | | | | | | | | |
Interest and related charges, excluding capitalized amounts | | $ 229 | | | $ 191 | | | $ 178 | |
Income taxes | | 153 | | | 14 | | | 80 | |
Noncash financing activities: | | | | | | | | | |
Conversion of short-term borrowings and other amounts payable to parent to other paid-in capital | | 750 | | | 41 | | | 606 | |
The accompanying notes are an integral part of our Consolidated Financial Statements.
Notes to Consolidated Financial Statements
Note 1. Nature of Operations
Consolidated Natural Gas Company (the Company) is a wholly-owned subsidiary of Dominion Resources, Inc. (Dominion).
Our subsidiaries operate in all phases of the natural gas business, explore for and produce natural gas and oil and provide a variety of energy marketing services. Our regulated gas distribution subsidiaries serve approximately 1.7 million residential, commercial and industrial gas sales and transportation customer accounts in Ohio, Pennsylvania and West Virginia and our nonregulated retail energy marketing businesses serve approximately 1.2 million residential, industrial and commercial gas and electric customer accounts in the Northeast, Mid-Atlantic and Midwest. We operate an interstate gas transmission pipeline system and an underground natural gas storage system in the Northeast, Mid-Atlantic and Midwest and a liquefied natural gas (LNG) import and storage facility in Maryland. Our producer services operations involve the aggregation of natural gas supply and related wholesale activities. Our exploration and production operations are located in several major gas and oil producing basins in the United States, both onshore and offshore.
We manage our daily operations through three primary operating segments: Delivery, Energy and Exploration & Production (E&P). In addition, we report our corporate and other functions as a segment. Corporate also includes specific items attributable to our operating segments that are excluded from the profit measures evaluated by management in assessing segment performance or allocating resources among the segments. Our assets remain wholly owned by our legal subsidiaries.
TheDelivery segment includes our regulated gas distribution subsidiaries, The East Ohio Gas Company, The Peoples Natural Gas Company and Hope Gas, Inc., as well as the nonregulated marketing subsidiaries, Dominion Retail, Inc. (Dominion Retail) and Dominion Products and Services, Inc. The regulated gas distribution subsidiaries are subject to price regulation by their respective state utility commissions. Dominion Retail pursues opportunities arising from the deregulation of the energy industry at the retail level.
TheEnergy segment includes Dominion Transmission, Inc. (DTI), Dominion Cove Point, Inc. (DCP) and Dominion Field Services, Inc. (DFS). DTI operates a regional interstate pipeline and storage system and is regulated by the Federal Energy Regulatory Commission (FERC). DCP operates an LNG import and storage facility and is regulated by FERC. DFS is a nonregulated subsidiary engaged in the aggregation of gas supplies and other related wholesale activities.
TheE&P segment includes Dominion Exploration & Production, Inc. and Dominion Oklahoma Texas Exploration & Production, Inc. (DOTEPI). These subsidiaries explore for and produce gas and oil.
The “Company,” “we,” “our” and “us” are used throughout this report and, depending on the context of its use, may represent any of the following: the legal entity, Consolidated Natural Gas Company, one of Consolidated Natural Gas Company’s consolidated subsidiaries or operating segments, or the entirety of Consolidated Natural Gas Company and its consolidated subsidiaries.
Note 2. Significant Accounting Policies
General
We make certain estimates and assumptions in preparing our Consolidated Financial Statements in accordance with accounting principles generally accepted in the United States of America (generally accepted accounting principles). These estimates and assumptions affect the reported amounts of assets and liabilities, the disclosure of contingent assets and liabilities at the date of the financial statements and the reported amounts of revenues and expenses for the periods presented. Actual results may differ from those estimates.
Our Consolidated Financial Statements include, after eliminating intercompany transactions and balances, the accounts of the Company and all majority-owned subsidiaries, and those variable interest entities (VIEs) where we have been determined to be the primary beneficiary.
Certain amounts in the 2004 and 2003 Consolidated Financial Statements and footnotes have been reclassified to conform to the 2005 presentation.
Operating Revenue
Operating revenue is recorded on the basis of services rendered, commodities delivered or contracts settled and includes amounts yet to be billed to customers. Our customer accounts receivable at both December 31, 2005 and 2004 included $133 million of accrued unbilled revenue based on estimated amounts of natural gas delivered but not yet billed to our utility customers. We estimate unbilled utility revenue based on historical usage, applicable customer rates and weather factors.
The primary types of sales and service activities reported as operating revenue include:
| · | | Regulated gas sales consist primarily of state-regulated retail natural gas sales and related distribution services; |
| · | | Nonregulated gas sales consist primarily of sales of natural gas at market-based rates and contracted fixed prices, sales of gas purchased from third parties and other gas marketing activities; |
| · | | Nonregulated electric sales consist primarily of sales of electricity to residential and commercial customers at contracted fixed prices and market-based rates; |
| · | | Other energy related-commodity sales consist primarily of sales of extracted products and sales activity related to agreements used to facilitate the marketing of oil production (buy/sell arrangements) described in Note 4; |
| · | | Gas transportation and storage consists primarily of regulated sales of gathering, transmission, distribution and storage services. Also included are regulated gas distribution charges to retail distribution service customers opting for alternate suppliers; |
| · | | Gas and oil production consists primarily of sales of natural gas, oil and condensate produced by us including the recognition of revenue previously deferred in connection with the volumetric production payment (VPP) transactions described in Note 10. Gas and oil production revenue is reported net of royalties; and |
| · | | Other revenue consists primarily of miscellaneous service revenue from gas distribution operations; gas and oil processing and handling revenue; and business interruption insurance revenue associated with delayed gas and oil production caused by Hurricane Ivan. |
Notes to Consolidated Financial Statements, Continued
Purchased Gas—Deferred Costs
Where permitted by regulatory authorities, the differences between actual purchased gas expenses and the levels of recovery for these expenses in current rates are deferred and matched against recoveries in future periods. The deferral of costs in excess of current period fuel rate recovery is recognized as a regulatory asset, while the recovery of fuel rate revenue in excess of current period expenses is recognized as a regulatory liability.
Income Taxes
We file a consolidated federal income tax return and participate in an intercompany tax allocation agreement with Dominion and its subsidiaries. Our current income taxes are based on our taxable income, determined on a separate company basis. However, prior to the repeal, effective in 2006, of the Public Utility Holding Company Act of 1935 (the 1935 Act), cash payments to Dominion were limited. Statement of Financial Accounting Standards (SFAS) No. 109,Accounting for Income Taxes, requires an asset and liability approach to accounting for income taxes. Deferred income tax assets and liabilities are provided, representing future effects on income taxes for temporary differences between the bases of assets and liabilities for financial reporting and tax purposes. Where permitted by regulatory authorities, the treatment of temporary differences may differ from the requirements of SFAS No. 109. Accordingly, a regulatory asset is recognized if it is probable that future revenues will be provided for the payment of deferred tax liabilities. We establish a valuation allowance when it is more likely than not that all or a portion of a deferred tax asset will not be realized. Deferred investment tax credits are amortized over the service lives of the properties giving rise to the credits. At December 31, 2005, our Consolidated Balance Sheet includes $52 million of current taxes receivable from Dominion (recorded in prepayments). At December 31, 2004, our Consolidated Balance Sheet includes $23 million of current taxes payable to Dominion (recorded in accrued interest, payroll and taxes).
Cash and Cash Equivalents
Current banking arrangements generally do not require checks to be funded until actually presented for payment. At December 31, 2005 and 2004, accounts payable includes $85 million and $67 million, respectively, of checks outstanding but not yet presented for payment. For purposes of our Consolidated Statements of Cash Flows, we consider cash and cash equivalents to include cash on hand, cash in banks and temporary investments purchased with a remaining maturity of three months or less.
Inventories
Materials and supplies inventories are valued primarily using the weighted-average cost method. Stored gas inventory used in local gas distribution operations is valued using the last-in-first-out (LIFO) method. Under the LIFO method, those inventories were valued at $128 million at December 31, 2005 and $59 million at December 31, 2004. Based on the average price of gas purchased during 2005, the cost of replacing the current portion of stored gas inventory exceeded the amount stated on a LIFO basis by approximately $392 million. Stored gas inventory held by certain nonregulated gas operations is valued using the weighted-average cost method.
Gas Imbalances
Natural gas imbalances occur when the actual amount of natural gas delivered from or received by a pipeline system or storage facility differs from the contractual amount of natural gas delivered or received. We value these imbalances due to or from shippers and operators at an appropriate index price, subject to the terms of our tariff for regulated entities. Imbalances are primarily settled in-kind. Imbalances due from others are reported in other current assets and imbalances owed to others are reported in other current liabilities on our Consolidated Balance Sheets.
Derivative Instruments
We use derivative instruments such as futures, swaps, forwards and options to manage the commodity and financial market risks of our business operations.
SFAS No. 133,Accounting for Derivative Instruments and Hedging Activities, requires all derivatives, except those for which an exception applies, to be reported on our Consolidated Balance Sheets at fair value. Derivative contracts representing unrealized gain positions and purchased options are reported as derivative assets. Derivative contracts representing unrealized losses and options sold are reported as derivative liabilities. One of the exceptions to fair value accounting—normal purchases and normal sales—may be elected when the contract satisfies certain criteria, including a requirement that physical delivery of the underlying commodity is probable. Expenses and revenue resulting from deliveries under normal purchase contracts and normal sales contracts, respectively, are included in earnings at the time of contract performance.
We hold certain derivative instruments that are not designated as hedges for accounting purposes. However, to the extent we do not hold offsetting positions for such derivatives, we believe these instruments represent economic hedges that mitigate exposure to fluctuations in commodity prices and interest rates.
Statement of Income Presentation:
| · | | Financially-Settled Derivatives—Not Designated as Hedging Instruments: All unrealized changes in fair value and settlements are presented in other operations and maintenance expense on a net basis. |
| · | | Physically-Settled Derivatives—Not Designated as Hedging Instruments: Effective October 1, 2003, all unrealized changes in fair value and settlements for physical derivative sales contracts are presented in revenue, while all unrealized changes in fair value and settlements for physical derivative purchase contracts are reported in expenses. For periods prior to October 1, 2003, unrealized changes in fair value for physically settled derivative contracts are presented in other operations and maintenance expense on a net basis. |
We recognize revenue or expense from all non-derivative energy-related contracts on a gross basis at the time of contract performance, settlement or termination.
Derivative Instruments Designated as Hedging Instruments
We designate a substantial portion of our derivative instruments as cash flow or fair value hedges for accounting purposes. For all derivatives designated as hedges, the relationship between the
27
Notes to Consolidated Financial Statements, Continued
hedging instrument and the hedged item is formally documented, as well as the risk management objective and strategy for using the hedging instrument. We assess whether the hedging relationship between the derivative and the hedged item is highly effective at offsetting changes in cash flows or fair values, both at the inception of the hedging relationship and on an ongoing basis. Any change in fair value of the derivative that is not effective at offsetting changes in the cash flows or fair values of the hedged item is recognized currently in earnings. Also, we may elect to exclude certain gains or losses on hedging instruments from the measurement of hedge effectiveness, such as gains or losses attributable to changes in the time value of options, thus requiring that such changes be recorded currently in earnings. We discontinue hedge accounting prospectively for derivatives that have ceased to be highly effective hedges.
Cash Flow Hedges—A significant portion of our hedge strategies represents cash flow hedges of the variable price risk associated with the purchase and sale of natural gas and oil. We also use interest rate swaps to hedge our exposure to variable interest rates on long-term debt. For transactions in which we are hedging the variability of cash flows, changes in the fair value of the derivative are reported in accumulated other comprehensive income (loss) (AOCI), to the extent effective at offsetting changes in the hedged item, until earnings are affected by the hedged item. For cash flow hedge transactions, we discontinue hedge accounting if the occurrence of the forecasted transaction is determined to be no longer probable. We reclassify any derivative gains or losses reported in AOCI to earnings when the forecasted item is included in earnings, if it should occur, or earlier, if it becomes probable that the forecasted transaction will not occur.
Fair Value Hedges—We also use fair value hedges to mitigate the fixed price exposure inherent in certain firm commodity commitments. In addition, we have designated interest rate swaps as fair value hedges to manage our interest rate exposure on certain fixed rate long-term debt. For fair value hedge transactions, changes in the fair value of the derivative are generally offset currently in earnings by the recognition of changes in the hedged item’s fair value.
Statement of Income Presentation—Gains and losses on derivatives designated as hedges, when recognized, are included in operating revenue, operating expenses or interest and related charges in our Consolidated Statements of Income. Specific line item classification is determined based on the nature of the risk underlying individual hedge strategies. The portion of gains or losses on hedging instruments determined to be ineffective and the portion of gains or losses on hedging instruments excluded from the measurement of the hedging relationship’s effectiveness, such as gains or losses attributable to changes in the time value of options, are included in other operations and maintenance expense.
Valuation Methods
Fair value is based on actively quoted market prices, if available. In the absence of actively quoted market prices, we seek indicative price information from external sources, including broker quotes and industry publications. If pricing information from external sources is not available, we must estimate prices based on available historical and near-term future price information and certain statistical methods, including regression analysis.
For options and contracts with option-like characteristics where pricing information is not available from external sources, we generally use a modified Black-Scholes Model that considers time value, the volatility of the underlying commodities and other relevant assumptions when estimating fair value. We use other option models under special circumstances, including a Spread Approximation Model, when contracts include different commodities or commodity locations and a Swing Option Model, when contracts allow either the buyer or seller the ability to exercise within a range of quantities. For contracts with unique characteristics, we estimate fair value using a discounted cash flow approach deemed appropriate in the circumstances and applied consistently from period to period. If pricing information is not available from external sources, judgment is required to develop the estimates of fair value. For individual contracts, the use of different valuation models or assumptions could have a material effect on the contract’s estimated fair value.
Property, Plant and Equipment
Property, plant and equipment, including additions and replacements, is recorded at original cost, including labor, materials, asset retirement costs and other direct and indirect costs including capitalized interest. The cost of repairs and maintenance, including minor additions and replacements, is charged to expense as incurred. In 2005, 2004 and 2003, we capitalized interest costs of $57 million, $56 million and $67 million, respectively.
For gas utility and transmission property subject to cost-of-service rate regulation, the depreciable cost of such property, less salvage value, is charged to accumulated depreciation at retirement. Cost of removal collections from utility customers and expenditures not representing asset retirement obligations (AROs) are recorded as regulatory liabilities or regulatory assets. We record gains and losses upon retirement of nonutility property based on the difference between proceeds received, if any, and the property’s undepreciated basis at the retirement date.
Depreciation of property, plant and equipment is computed on the straight-line method based on projected service lives or in the case of gas and oil producing properties, the units-of-production method. Our depreciation rates on utility property, plant and equipment are as follows:
| | | | | | |
| | | 2005 | | 2004 | | 2003 |
| (percent) | | |
Transmission | | 2.49 | | 2.42 | | 2.45 |
Distribution | | 2.37 | | 2.37 | | 2.40 |
Storage | | 3.15 | | 3.04 | | 2.81 |
Gas gathering and processing | | 2.21 | | 2.31 | | 2.39 |
General and other | | 6.89 | | 6.85 | | 6.49 |
Our nonutility property, plant and equipment, excluding exploration and production properties, is depreciated using the straight-line method over the following estimated useful lives:
| | |
| Asset | | Estimated Useful
Lives |
Merchant generation—other | | 36 years |
General and other | | 5 – 25 years |
28
Notes to Consolidated Financial Statements, Continued
We follow the full cost method of accounting for gas and oil exploration and production activities prescribed by the Securities and Exchange Commission (SEC). Under the full cost method, all direct costs of property acquisition, exploration and development activities are capitalized. These capitalized costs are subject to a quarterly ceiling test. Under the ceiling test, amounts capitalized are limited to the present value of estimated future net revenues to be derived from the anticipated production of proved gas and oil reserves, assuming period-end pricing adjusted for cash flow hedges in place. If net capitalized costs exceed the ceiling test at the end of any quarterly period, then a permanent write-down of the assets must be recognized in that period. The ceiling test is performed separately for each cost center, with cost centers established on a country-by-country basis. Approximately 11% of our anticipated production is hedged by qualifying cash flow hedges, for which hedge-adjusted prices were used to calculate estimated future net revenue. Whether period-end market prices or hedge-adjusted prices were used for the portion of production that is hedged, there was no ceiling test impairment as of December 31, 2005. Future cash flows associated with settling AROs that have been accrued on our Consolidated Balance Sheets pursuant to SFAS No. 143,Accounting for Asset Retirement Obligations, are excluded from our calculations under the full cost ceiling test.
Depreciation of gas and oil producing properties is computed using the units-of-production method. Under the full cost method, the depreciable base of costs subject to amortization also includes estimated future costs to be incurred in developing proved gas and oil reserves, as well as capitalized asset retirement costs, net of projected salvage values. The costs of investments in unproved properties are initially excluded from the depreciable base. Until the properties are evaluated, a ratable portion of the capitalized costs is periodically reclassified to the depreciable base, determined on a property by property basis, over terms of underlying leases. Once a property has been evaluated, any remaining capitalized costs are then transferred to the depreciable base. In addition, gains or losses on the sale or other disposition of gas and oil properties are not recognized, unless the gain or loss would significantly alter the relationship between capitalized costs and proved reserves of natural gas and oil attributable to a cost center.
Goodwill and Intangible Assets
We evaluate goodwill for impairment annually, as of April 1st, and whenever an event occurs or circumstances change in the interim that would more likely than not reduce the fair value of a reporting unit below its carrying amount. Intangible assets with finite lives are amortized over their estimated useful lives or as consumed.
Impairment of Long-Lived and Intangible Assets
We perform an evaluation for impairment whenever events or changes in circumstances indicate that the carrying amount of long-lived assets or intangible assets with finite lives may not be recoverable. These assets are written down to fair value if the sum of the expected future undiscounted cash flows is less than the carrying amounts.
Regulatory Assets and Liabilities
For utility operations subject to federal or state cost-of-service rate regulation, regulatory practices that assign costs to accounting periods may differ from accounting methods generallyapplied by nonregulated companies. When it is probable that regulators will permit the recovery of current costs through future rates charged to customers, we defer these costs as regulatory assets that otherwise would be expensed by nonregulated companies. Likewise, we recognize regulatory liabilities when it is probable that regulators will require customer refunds through future rates and when revenue is collected from customers for expenditures that are not yet incurred. Regulatory assets are amortized into expense and regulatory liabilities are amortized into income over the recovery period authorized by the regulator.
Asset Retirement Obligations
We recognize AROs at fair value as incurred or when sufficient information becomes available to determine a reasonable estimate of the fair value of the retirement activities to be performed. These amounts are capitalized as costs of the related tangible long-lived assets. Since relevant market information is not available, we estimate fair value using discounted cash flow analyses. We report the accretion of the AROs due to the passage of time in other operations and maintenance expense.
Amortization of Debt Issuance Costs
We defer and amortize debt issuance costs and debt premiums or discounts over the expected lives of the respective debt issues, considering maturity dates and, if applicable, redemption rights held by others.
Note 3. Newly Adopted Accounting Standards
2005
SFAS No. 153
On July 1, 2005, we adopted SFAS No. 153,Exchanges of Nonmonetary Assets—an amendment of APB Opinion No. 29, which requires that all commercially substantive exchange transactions, for which the fair value of the assets exchanged are reliably determinable, be recorded at fair value, whether or not they are exchanges of similar productive assets. This amends the exception from fair value measurements in APB Opinion No. 29,Accounting for Nonmonetary Transactions, for nonmonetary exchanges of similar productive assets and replaces it with an exception for only those exchanges that do not have commercial substance. There was no impact on our results of operations or financial condition related to our adoption of SFAS No. 153 and we do not expect the ongoing application of SFAS No. 153 to have a material impact on our results of operations or financial condition.
FIN 47
We adopted Financial Accounting Standards Board (FASB) Interpretation No. 47,Accounting for Conditional Asset Retirement Obligations (FIN 47) on December 31, 2005. FIN 47 clarifies that an entity is required to recognize a liability for the fair value of a conditional asset retirement obligation when the obligation is incurred—generally upon acquisition, construction, or development and/or through the normal operation of the asset, if the fair value of the liability can be reasonably estimated. A conditional asset retirement obligation is a legal obligation to perform an asset retirement activity in which the timing and/or method of settlement are conditional on a future event that may or may not be within the control of the entity. Uncertainty about the timing and/or method of settlement is required to be factored into the measurement of the liability when sufficient information exists.
29
Notes to Consolidated Financial Statements, Continued
Our adoption of FIN 47 resulted in the recognition of an after-tax charge of $2 million, representing the cumulative effect of the change in accounting principle.
Presented below are our pro forma net income for 2005, 2004 and 2003 as if we had applied the provisions of FIN 47 as of January 1, 2003.
| | | | | | | | | |
| Year Ended December 31 | | 2005 | | 2004 | | 2003 |
| (millions) | | | | | | |
Net income—as reported | | $ | 553 | | $ | 867 | | $ | 638 |
Net income—pro forma | | | 555 | | | 866 | | | 638 |
If we had applied the provisions of FIN 47 as of January 1, 2003, our asset retirement obligations would have increased by $115 million, $122 million and $130 million at January 1, 2003, December 31, 2003 and December 31, 2004, respectively.
2003
SFAS No. 143
Effective January 1, 2003, we adopted SFAS No. 143, which provides accounting requirements for the recognition and measurement of liabilities associated with the retirement of tangible long-lived assets. The adoption of SFAS No. 143 resulted in an after-tax loss of $5 million, representing the cumulative effect of a change in accounting principle. The impact of adopting SFAS No. 143 for 2003, other than the cumulative effect of a change in accounting principle, was not material.
EITF 03-11
We adopted Emerging Issues Task Force (EITF) Issue No. 03-11,Reporting Realized Gains and Losses on Derivative Instruments That Are Subject to FASB Statement No. 133 and Not “Held for Trading Purposes” as Defined in EITF Issue No. 02-3, on October 1, 2003. EITF 03-11 addresses classification of income statement related amounts for derivative contracts. Income statement amounts related to periods prior to October 1, 2003 are presented as originally reported.
FIN 46R
On December 31, 2003, we adopted FASB Interpretation No. 46 (revised December 2003),Consolidation of Variable Interest Entities (FIN 46R) for our interests in special purpose entities. FIN 46R addresses the consolidation of variable interest entities (VIEs), which are entities that are not controllable through voting interests or in which the VIEs’ equity investors do not bear the residual economic risks and rewards.
Under FIN 46R, we consolidated a special purpose lessor entity through which we had financed and leased a new power generation project. As a result, our Consolidated Balance Sheets as of December 31, 2003 reflects an additional $223 million in net property, plant and equipment and deferred charges and an additional $234 million of related debt. This resulted in additional depreciation expense of approximately $6 million in both 2005 and 2004. The cumulative effect of adopting FIN 46R for our interest in the special purpose entity was an after-tax charge of $6 million, representing depreciation expense associated with the consolidated assets.
In 2001, we established CNG Capital Trust I that sold trust preferred securities to third-party investors. We received the proceeds from the sale of the trust preferred securities in exchange for junior subordinated debt notes issued by the Company to be held by the trust. Upon adoption of FIN 46R, webegan reporting as long-term debt our junior subordinated notes held by the trust rather than the trust preferred securities. As a result, in 2005 and 2004, we reported interest expense on the junior subordinated notes rather than preferred distribution expense on the trust preferred securities.
Note 4. Recently Issued Accounting Standards
SFAS No. 154
In May 2005, the FASB issued SFAS No. 154,Accounting Changes and Error Corrections. SFAS No. 154 applies to all voluntary changes in accounting principle and requires retrospective application to prior periods’ financial statements of a voluntary change in accounting principle unless it is impracticable to determine either the period-specific effects or the cumulative effect of the change. We will apply the provisions of SFAS No. 154 to voluntary accounting changes on or after January 1, 2006.
EITF 04-5
In June 2005, the FASB ratified the consensus reached by the EITF on Issue No. 04-5,Determining Whether a General Partner, or the General Partners as a Group, Controls a Limited Partnership or Similar Entity When the Limited Partners Have Certain Rights. EITF 04-5 provides guidance in assessing when a general partner should consolidate its investment in a limited partnership or similar entity. The provisions of EITF 04-5 were required to be applied beginning June 30, 2005 by general partners of all newly formed limited partnerships and for existing limited partnerships for which the partnership agreements are modified and is effective for general partners in all other limited partnerships beginning January 1, 2006. There was no impact on our results of operations or financial condition, related to our adoption of EITF 04-5.
EITF 04-13
We enter into buy/sell and related agreements primarily as a means to reposition our offshore Gulf of Mexico crude oil production to more liquid marketing locations onshore. We typically enter into either a single or a series of buy/sell transactions in which we sell our crude oil production at the offshore field delivery point and buy similar quantities at Cushing, Oklahoma for sale to third parties. We are able to enhance profitability by selling to a wide array of refiners and/or trading companies at Cushing, one of the largest crude oil markets in the world, versus restricting sales to a limited number of refinery purchasers in the Gulf of Mexico.
Under the primary guidance of EITF Issue No. 99-19,Reporting Revenue Gross as a Principal versus Net as an Agent, we present the sales and purchases related to our crude oil buy/sell arrangements on a gross basis in our Consolidated Statements of Income. These transactions require physical delivery of the crude oil and the risks and rewards of ownership are evidenced by title transfer, assumption of environmental risk, transportation scheduling and counterparty nonperformance risk. Sale activity included in operating revenue was $377 million, $290 million and $181 million in 2005, 2004 and 2003, respectively. Purchase activity included in other energy-related commodity purchases expense was $362 million, $271 million and $163 million in 2005, 2004 and 2003, respectively.
In September 2005, the FASB ratified the EITF’s consensus on Issue No. 04-13,Accounting for Purchases and Sales of
30
Notes to Consolidated Financial Statements, Continued
Inventory with the Same Counterparty, that will require buy/sell and related agreements to be presented on a net basis in our Consolidated Statements of Income if they are entered into in contemplation of one another. This new guidance is required to be applied to all new arrangements entered into, and modifications or renewals of existing arrangements, beginning April 1, 2006. We are currently assessing the impact that this new guidance may have on our income statement presentation of these transactions; however, there will be no impact on our results of operations or cash flows.
Note 5. Acquisition
In July 2005, we completed the acquisition of Craton Energy Corp. (Craton) for approximately $45 million in cash. Craton’s operations are focused on oil and gas property acquisition and development in the eastern Texas region. The operations of Craton are included in the E&P operating segment.
Note 6. Operating Revenue
Our operating revenue consists of the following:
| | | | | | |
| Year Ended December 31, | | 2005 | | 2004 | | 2003 |
| (millions) | | | | | | |
Gas sales: | | | | | | |
Regulated | | $1,763 | | $1,422 | | $1,259 |
Nonregulated: | | | | | | |
External customers | | 1,533 | | 959 | | 876 |
Affiliated customers | | 1,129 | | 1,037 | | 655 |
Nonregulated electric sales | | 374 | | 390 | | 232 |
Other energy-related commodity sales | | 598 | | 457 | | 277 |
Gas transportation and storage | | 922 | | 819 | | 767 |
Gas and oil production | | 1,468 | | 1,297 | | 1,177 |
Other | | 285 | | 200 | | 85 |
Total operating revenue | | $8,072 | | $6,581 | | $5,328 |
Note 7. International Investments
CNG International Corporation (CNGI) was engaged in energy-related activities outside of the continental United States, primarily through equity investments in Australia and Argentina. After Dominion completed the CNG acquisition in 2000, its management committed to a plan to dispose of the entire CNGI operation consistent with its strategy to focus on core businesses.
During 2003, we recognized impairment losses totaling $78 million ($65 million after-tax) related primarily to investments in a pipeline business located in Australia and a small generation facility in Kauai, Hawaii that was sold in December 2003 for cash proceeds of $42 million.
In 2004, we received cash proceeds of $52 million and recognized a benefit in other income of $31 million related to the sale of a portion of the Australian pipeline business.
At December 31, 2005, our remaining CNGI investment is accounted for at its fair value of $2 million. We continue to market this investment for sale.
Note 8. Income Taxes
Details of income tax expense were as follows:
| | | | | | | | | | | | |
| Year Ended December 31, | | 2005 | | | 2004 | | | 2003 | |
| (millions) | | | | | | | | | |
Current expense: | | | | | | | | | | | | |
Federal | | $ | 12 | | | $ | 72 | | | $ | 113 | |
State | | | 9 | | | | 12 | | | | 20 | |
Total current | | | 21 | | | | 84 | | | | 133 | |
Deferred expense: | | | | | | | | | | | | |
Federal | | | 267 | | | | 394 | | | | 228 | |
State | | | 30 | | | | 5 | | | | 13 | |
Total deferred | | | 297 | | | | 399 | | | | 241 | |
Amortization of deferred investment tax credits—net | | | (1 | ) | | | (1 | ) | | | (2 | ) |
Total income tax expense | | $ | 317 | | | $ | 482 | | | $ | 372 | |
The statutory U.S. federal income rate reconciles to our effective income tax rates as follows:
| | | | | | |
| Year Ended December 31, | | 2005 | | 2004 | | 2003 |
U.S. statutory rate | | 35.0% | | 35.0% | | 35.0% |
Increases (reductions) resulting from: | | | | | | |
Amortization of investment tax credits | | (0.2) | | (0.1) | | (0.1) |
State taxes, net of federal benefit | | 2.9 | | 0.8 | | 2.2 |
Employee benefits | | (1.5) | | (0.8) | | (1.5) |
Valuation allowance | | — | | 1.6 | | 1.5 |
Other, net | | 0.1 | | (0.7) | | (0.6) |
Effective tax rate | | 36.3% | | 35.8% | | 36.5% |
Deferred income taxes reflect the net tax effects of temporary differences between the carrying amounts of assets and liabilities for financial reporting purposes and the amounts used for income tax purposes.
Our net deferred income taxes consist of the following:
| | | | | | | | |
| At December 31, | | 2005 | | | 2004 | |
| (millions) | | | | | | |
Deferred income tax assets: | | | | | | | | |
Other comprehensive income | | $ | 1,015 | | | $ | 491 | |
Derivative contract losses | | | 133 | | | | 63 | |
Other | | | 151 | | | | 139 | |
Loss and credit carryforwards | | | 317 | | | | 227 | |
Valuation allowance | | | (38 | ) | | | (50 | ) |
Total deferred income tax assets | | | 1,578 | | | | 870 | |
Deferred income tax liabilities: | | | | | | | | |
Depreciation method and plant basis differences | | | 613 | | | | 640 | |
Partnership basis differences | | | 58 | | | | 46 | |
Gas and oil exploration and production related differences | | | 1,907 | | | | 1,556 | |
Pension benefits | | | 381 | | | | 345 | |
Deferred state income taxes | | | 291 | | | | 219 | |
Other | | | 129 | | | | 94 | |
Total deferred income tax liabilities | | | 3,379 | | | | 2,900 | |
Total net deferred income tax liabilities | | $ | 1,801 | | | $ | 2,030 | |
At December 31, 2005, we had the following loss and credit carryforwards:
| · | | Federal loss carryforwards of $237 million that expire if unutilized during the period 2006 through 2024. A valuation allowance on $103 million in carryforwards has been established due to the uncertainty of realizing these future deductions; |
31
Notes to Consolidated Financial Statements, Continued
| · | | State loss carryforwards of $972 million that expire if unutilized during the period 2006 through 2025. A valuation allowance on $122 million in carryforwards has been established due to the uncertainty of realizing these future deductions; and |
| · | | Federal minimum tax credits of $179 million that do not expire. |
We are routinely audited by federal and state tax authorities. The interpretation of tax laws involves uncertainty, since tax authorities may interpret them differently. We establish liabilities for tax-related contingencies in accordance with SFAS No. 5, Accounting for Contingencies, and review them in light of changing facts and circumstances. Ultimate resolution of income tax matters may result in favorable or unfavorable adjustments that could be material. At December 31, 2005 and 2004, our Consolidated Balance Sheets included no significant income tax-related contingent liabilities.
American Jobs Creation Act of 2004 (the Jobs Act)
The Jobs Act has several provisions for energy companies, including a deduction related to taxable income derived from qualified production activities. Our electric generation and oil and gas extraction activities qualify as production activities under the Jobs Act. The Jobs Act limits the deduction to the lesser of taxable income derived from qualified production activities or the consolidated federal taxable income of Dominion and its subsidiaries. Our qualified production activities deduction for 2005 is limited to a minimal amount.
Note 9. Hedge Accounting Activities
We are exposed to the impact of market fluctuations in the price of natural gas and oil and to the interest rate risks of our business operations. We use derivative instruments to manage our exposure to these risks and designate certain derivative instruments as fair value or cash flow hedges for accounting purposes as allowed by SFAS No. 133. Selected information about our hedge accounting activities follows:
| | | | | | | | | | | |
| Year ended December 31, | | 2005 | | | 2004 | | | 2003 | |
| (millions) | | | | | | | | | |
Portion of gains (losses) on hedging instruments determined to be ineffective and included in net income: | | | | | | | | | | | |
Fair value hedges | | $ | 2 | | | $ | (2 | ) | | $(1 | ) |
Cash flow hedges(1) | | | (57 | ) | | | (1 | ) | | (1 | ) |
Net ineffectiveness | | $ | (55 | ) | | $ | (3 | ) | | $(2 | ) |
Portion of gains (losses) on hedging instruments excluded from measurement of effectiveness and included in net income: | | | | | | | | | | | |
Fair value hedges | | $ | (1 | ) | | $ | 1 | | | $— | |
Cash flow hedges(2) | | | (1 | ) | | | 103 | | | 6 | |
Total | | $ | (2 | ) | | $ | 104 | | | $6 | |
| (1) | | Represents an increase in hedge ineffectiveness expense primarily due to an increase in the fair value differential between the delivery location and commodity specifications of derivatives held by our exploration and production operations and the delivery location and commodity specifications of our forecasted gas and oil sales. |
| (2) | | Amounts relate to changes in options’ time value. |
The following table presents selected information related to cash flow hedges included in AOCI in our Consolidated Balance Sheet at December 31, 2005:
| | | | | | | | |
| | | AOCI After Tax | | | Portion Expected
to be Reclassified
to Earnings
during the Next
12 Months After Tax | | | Maximum
Term |
| (dollar amount in millions) | | | | | | | | |
Commodities: | | | | | | | | |
Gas | | $(1,221 | ) | | $(652 | ) | | 60 months |
Oil | | (547 | ) | | (313 | ) | | 36 months |
Interest rate | | (1 | ) | | — | | | 107 months |
Total | | $(1,769 | ) | | $(965 | ) | | |
The amounts that will be reclassified from AOCI to earnings will generally be offset by the recognition of the hedged transactions (e.g., anticipated sales) in earnings, thereby achieving the realization of prices contemplated by the underlying risk management strategies and will vary from the anticipated amounts presented above as a result of changes in market prices and interest rates.
Due to interruptions in the Gulf of Mexico oil production caused by Hurricane Ivan, we discontinued hedge accounting for certain cash flow hedges in September 2004 since it became probable that the forecasted sales of oil would not occur. In connection with the discontinuance of hedge accounting for these contracts, we reclassified $71 million of pre-tax losses from AOCI to earnings in September 2004.
As a result of a delay in reaching anticipated production levels in the Gulf of Mexico, we discontinued hedge accounting for certain cash flow hedges in March 2005 since it became probable that the forecasted sales of oil would not occur. In connection with the discontinuance of hedge accounting for these contracts, we reclassified $30 million ($19 million after-tax) of losses from AOCI to earnings in March 2005. Through December 31, 2005, we have recognized additional losses of $29 million ($19 million after-tax) due to subsequent changes in the fair value of these contracts.
Additionally, due to interruptions in Gulf of Mexico and southern Louisiana gas and oil production caused by Hurricanes Katrina and Rita, we discontinued hedge accounting for certain cash flow hedges in August and September 2005 since it became probable that the forecasted sales of gas and oil would not occur. In connection with the discontinuance of hedge accounting for these contracts, we reclassified $423 million ($272 million after-tax) of losses from AOCI to earnings in the third quarter of 2005. Through December 31, 2005, we have recognized additional losses of $12 million ($8 million after-tax) due to subsequent changes in the fair value of these contracts. Losses related to the discontinuance of hedge accounting are reported in other operations and maintenance expense in our Consolidated Statements of Income.
32
Notes to Consolidated Financial Statements, Continued
Note 10. Property, Plant and Equipment
Major classes of property, plant and equipment and their respective balances are:
| | | | |
| At December 31, | | 2005 | | 2004 |
| (millions) | | | | |
Utility: | | | | |
Transmission | | $1,899 | | $1,829 |
Distribution | | 2,070 | | 1,999 |
Storage | | 947 | | 1,023 |
Gas gathering and processing | | 433 | | 418 |
General and other | | 185 | | 166 |
Plant under construction | | 317 | | 163 |
Total utility | | 5,851 | | 5,598 |
Nonutility: | | | | |
Exploration and production properties being amortized: | | | | |
Proved | | 10,855 | | 9,346 |
Unproved | | 1,121 | | 1,029 |
Unproved exploration and production properties not being amortized | | 956 | | 919 |
Other—including plant under construction | | 343 | | 328 |
Total nonutility | | 13,275 | | 11,622 |
Total property, plant and equipment | | $19,126 | | $17,220 |
Costs of unproved properties capitalized under the full cost method of accounting that were excluded from amortization at December 31, 2005 and the years in which the excluded costs were incurred, are as follows:
| | | | | | | | | | | | | | | |
| | | Total | | 2005 | | 2004 | | 2003 | | Years
Prior |
| (millions) | | | | | | | | | | |
Property acquisition costs | | $ | 593 | | $ | 74 | | $ | 25 | | $ | 20 | | $ | 474 |
Exploration costs | | | 203 | | | 84 | | | 64 | | | 16 | | | 39 |
Capitalized interest | | | 160 | | | 44 | | | 38 | | | 44 | | | 34 |
Total | | $ | 956 | | $ | 202 | | $ | 127 | | $ | 80 | | $ | 547 |
There were no significant properties under development, as defined by the SEC, excluded from amortization at December 31, 2005. As gas and oil reserves are proved through drilling or as properties are deemed to be impaired, excluded costs and any related reserves are transferred on an ongoing, well-by-well basis into the amortization calculation.
Amortization rates for capitalized costs under the full cost method of accounting in thousand cubic feet (mcf) equivalent were $1.46, $1.35 and $1.26 for 2005, 2004 and 2003, respectively.
Volumetric Production Payment Transactions
In 2005, the Company and Dominion Energy, Inc. (DEI), a wholly-owned subsidiary of Dominion, received $86 million and $338 million, respectively, for the sale of fixed-term overriding royalty interests in certain natural gas reserves for the period March 2005 through February 2009. The sale reduced the proved natural gas reserves of the Company and DEI by approximately 15 billion cubic feet (bcf) and 61 bcf, respectively. While the Company and DEI are obligated under the agreement to deliver to the purchaser its portion of future natural gas production from the properties, the Company and DEI retain control of the properties and rights to future development drilling. If total production from the properties subject to the sale is inadequate to deliver the approximately 76 bcf of natural gas scheduled for delivery to the purchaser, the Company and DEI have no obligation to make up the shortfall. A production shortfall against scheduled production for one group of properties subject to the sale, however, may be required to be made up in whole or in part from additional production in excess of scheduled production quantities from other properties subject to the sale. We recorded our portion of the cash proceeds received from this VPP transaction as deferred revenue and will recognize revenue from the transaction as natural gas is produced and delivered to the purchaser. We previously entered into VPP transactions in 2004 and 2003 for approximately 83 bcf for the period May 2004 through April 2008 and 66 bcf for the period August 2003 through July 2007, respectively.
Note 11. Goodwill and Intangible Assets
There was no impairment of or material change to the carrying amount or segment allocation of goodwill in 2005.
All of our intangible assets, other than goodwill, are subject to amortization. Amortization expense for intangible assets was $22 million, $22 million and $18 million for 2005, 2004 and 2003, respectively. There were no material acquisitions of intangible assets in 2005. Intangible assets are included in other assets on our Consolidated Balance Sheets. The components of our intangible assets are as follows:
| | | | | | | | | |
| At December 31, | | 2005 | | 2004 |
| | | Gross Carrying Amount | | Accumulated Amortization | | Gross Carrying Amount | | Accumulated Amortization |
| (millions) | | | | |
Software and software licenses | | $234 | | $116 | | | $208 | | $96 |
Other | | 26 | | 14 | | | 27 | | 17 |
Total | | $260 | | $130 | | | $235 | | $113 |
Annual amortization expense for intangible assets is estimated to be $25 million for 2006, $24 million for 2007, $21 million for 2008, $17 million for 2009 and $12 million for 2010.
33
Notes to Consolidated Financial Statements, Continued
Note 12. Regulatory Assets and Liabilities
Our regulatory assets and liabilities include the following:
| | | | | | |
| At December 31, | | 2005 | | 2004 |
| (millions) | | | | |
Regulatory assets: | | | | | | |
Unrecovered gas costs | | $ | 179 | | $ | 52 |
Regulatory assets—current(1) | | | 179 | | | 52 |
Other postretirement benefit costs(2) | | | 45 | | | 48 |
Income taxes recoverable through future rates(3) | | | 213 | | | 199 |
Customer bad debts(4) | | | 70 | | | 73 |
Other | | | 75 | | | 49 |
Regulatory assets—non-current | | | 403 | | | 369 |
Total regulatory assets | | $ | 582 | | $ | 421 |
Regulatory liabilities: | | | | | | |
Amounts payable to customers | | $ | 5 | | $ | 2 |
Estimated rate contingencies and refunds(5) | | | 4 | | | 13 |
Regulatory liabilities—current(6) | | | 9 | | | 15 |
Provision for future cost of removal(7) | | | 128 | | | 221 |
Other | | | 19 | | | 2 |
Regulatory liabilities—non-current | | | 147 | | | 223 |
Total regulatory liabilities | | $ | 156 | | $ | 238 |
| (1) | | Reported in other current assets. |
| (2) | | Pending the recognition in rates of costs recognized under SFAS No. 106,Employers’ Accounting for Postretirement Benefits Other Than Pensions, our rate-regulated subsidiaries deferred the differences between SFAS No. 106 costs and amounts included in rates. |
| (3) | | Income taxes recoverable through future rates resulting from the recognition of additional deferred income taxes, not recognized under ratemaking practices. |
| (4) | | Instead of recovering bad debt costs through our base rates, the Public Utilities Commission of Ohio (Ohio Commission) allows us to recover all eligible bad debt expenses through a bad debt tracker. Annually, we assess the need to adjust the tracker based on the preceding year’s unrecovered deferred bad debt expense. The Ohio Commission also has authorized the collection of previously deferred costs associated with certain uncollectible customer accounts from 2001 over five years through the tracker rider. Remaining costs to be recovered totaled $35 million at December 31, 2005. |
| (5) | | Estimated rate contingencies and refunds are associated with certain increases in prices by our rate regulated utilities and other ratemaking issues that are subject to final modification in regulatory proceedings. |
| (6) | | Reported in other current liabilities. |
| (7) | | Rates charged to customers by our regulated businesses include a provision for the cost of future activities to remove assets that are expected to be incurred at the time of retirement. |
At December 31, 2005, approximately $300 million of our regulatory assets represented past expenditures on which we do not earn a return. These expenditures consist primarily of unrecovered gas costs and customer bad debts. Unrecovered gas costs and the ongoing portion of bad debts are recovered within two years. The previously deferred bad debts will be recovered over a 3-year period.
Note 13. Asset Retirement Obligations
Our AROs are primarily associated with dismantlement and removal of gas and oil wells and platforms. However, in 2005 we recognized additional AROs due to the adoption of FIN 47, which clarified when sufficient information is available to reasonably estimate the fair value of conditional AROs. These additional AROs totaled $144 million and relate to interim retirements of natural gas gathering, transmission, distribution and storage pipeline components and the retirement of certain nonutility offshore natural gas pipelines. These obligations result from certain safety and environmental activities we are required to perform when any pipeline is abandoned.
We also have AROs related to the retirement of the approximately 2,300 gas storage wells in our underground natural gas storage network and our LNG processing and storage facilities. We currently do not have sufficient information to estimate a reasonable range of expected retirement dates for any of these assets. Thus, AROs for these assets will not be reflected in our Consolidated Financial Statements until sufficient information becomes available to determine a reasonable estimate of the fair value of the activities to be performed. Generally, this will occur when the expected retirement or abandonment dates are determined by our operational planning. The changes to our AROs during 2005 were as follows:
| | | |
| | | Amount | |
| (millions) | | | |
Asset retirement obligations at December 31, 2004(1) | | $253 | |
Obligations incurred during the period | | 8 | |
Obligations settled during the period | | (8 | ) |
Accretion expense | | 13 | |
Revisions in estimated cash flows | | (2 | ) |
Obligations recognized upon adoption of FIN 47 | | 144 | |
Other | | (10 | ) |
Asset retirement obligations at December 31, 2005(2) | | $398 | |
| (1) | | Consists of $251 million reported in other non-current liabilities and $2 million reported in other current liabilities. |
| (2) | | Consists of $392 million reported in other non-current liabilities and $6 million reported in other current liabilities. |
Note 14. Short-Term Debt and Credit Agreements
Joint Credit Facility
We use short-term debt, primarily commercial paper, to fund working capital requirements and as a bridge to long-term debt financing. The level of our borrowings may vary significantly during the course of the year, depending upon the timing and amount of cash requirements not satisfied by cash from operations. In addition, we utilize cash and letters of credit to fund collateral requirements under our commodities hedging program. Collateral requirements are impacted by commodity prices, hedging levels and the credit quality of our companies and their counterparties. In May 2005, we entered into a $2.5 billion five-year revolving credit facility with Dominion and Virginia Electric and Power Company (Virginia Power), a wholly owned subsidiary of Dominion, that replaced our $1.5 billion three-year facility dated May 2004 and our $750 million three-year facility dated May 2002. This credit facility can also be used to support up to $1.25 billion of letters of credit. In February 2006, this facility was replaced by a $3.0 billion five-year credit facility that terminates in February 2011.
At December 31, 2005, total outstanding commercial paper supported by the joint credit facility was $1.6 billion, of which our borrowings were $187 million, with a weighted average interest rate of 4.53%. At December 31, 2004, total outstanding commercial paper supported by previous credit agreements was $573 million, none of which were our borrowings.
At December 31, 2005 and 2004, total outstanding letters of credit supported by the joint credit facilities were $892 million and $183 million, respectively, all of which were issued on behalf of other Dominion subsidiaries.
34
Notes to Consolidated Financial Statements, Continued
Other Credit Facilities
In August 2005, we entered into a $1.75 billion five-year revolving credit facility that replaced our $1.5 billion three-year facility dated August 2004. This credit facility supports our issuance of commercial paper and letters of credit to provide collateral required by counterparties on derivative financial contracts used by us in our risk management strategies for our gas and oil production. In February 2006, the facility limit was reduced to $1.70 billion. At December 31, 2005 and 2004, outstanding letters of credit under this facility totaled $1.2 billion and $555 million, respectively.
We have also entered into several bilateral credit facilities, in addition to the facilities above, in order to provide collateral required on derivative contracts used in our risk management strategies for gas and oil production operations. Collateral requirements have increased significantly in 2005 as a result of escalating commodity prices. At December 31, 2005, we had the following letter of credit facilities:
| | | | | | | | | |
Facility
Limit | | | Outstanding
Letters of
Credit | | Facility
Capacity
Remaining | | Facility Inception Date | | Facility Maturity Date |
| (millions) | | | | | | | | | |
| $ 100 | | | $ 100 | | $ — | | June 2004 | | June 2007 |
| 100 | | | 100 | | — | | August 2004 | | August 2009 |
| 200 | (1) | | — | | 200 | | December 2005 | | December 2010 |
| 550 | (2) | | 550 | | — | | October 2004 | | April 2006 |
| 1,900 | (1)(3) | | 625 | | 1,275 | | August 2005 | | February 2006 |
| $2,850 | | | $1,375 | | $1,475 | | | | |
| (1) | | This facility can also be used to support commercial paper borrowings. |
| (2) | | In February 2006, the facility limit was reduced to $150 million. |
| (3) | | In February 2006, we replaced this facility with a $1.05 billion 364-day credit facility. |
In connection with our commodity hedging activities, we are required to provide collateral to counterparties under some circumstances. Under certain collateral arrangements, we may satisfy these requirements by electing to either deposit cash, post letters of credit or, in some cases, utilize other forms of security. From time to time, we vary the form of collateral provided to counterparties after weighing the costs and benefits of various factors associated with the different forms of collateral. These factors include short-term borrowing and short-term investment rates, the spread over these short-term rates at which we can issue commercial paper, balance sheet impacts, the costs and fees of alternative collateral postings with these and other counterparties and overall liquidity management objectives.
Note 15. Long-Term Debt
| | | | | | | | | | | | |
| | | 2005
Weighted
Average
Coupon(1) | | | | | |
| At December 31, | | | | | 2005 | | | 2004 | |
| (millions) | | | | | | | | | | |
Unsecured Senior Notes: | | | | | | | | | | | | |
5.375% to 7.375%, due 2005 to 2010 | | 5.96% | | | | $ | 1,050 | | | $ | 1,200 | |
5.0% to 6.85%, due 2011 to 2027 | | 6.14% | | | | | 2,000 | | | | 2,000 | |
6.875%, due 2026(2) | | | | | | | 150 | | | | 150 | |
| | | | | | | | 3,200 | | | | 3,350 | |
Secured Bank Debt, Variable Rate, due 2006(3) | | 3.87% | | | | | 234 | | | | 234 | |
Junior Subordinated Notes Payable to Affiliated Trust 7.8%, due 2041 | | | | | | | 206 | | | | 206 | |
| | | | | | | | 3,640 | | | | 3,790 | |
Fair value hedge valuation(4) | | | | | | | 11 | | | | 21 | |
Amount due within one year | | 4.89% | | | | | (734 | ) | | | (150 | ) |
Unamortized discount and premium, net | | | | | | | (3 | ) | | | (1 | ) |
Total long-term debt | | | | | | $ | 2,914 | | | $ | 3,660 | |
| (1) | | Represents weighted-average coupon rate for debt outstanding as of December 31, 2005. |
| (2) | | At the option of holders in October 2006, $150 million of our 6.875% senior notes due 2026 are subject to redemption at 100% of the principal amount plus accrued interest. In the event of an early redemption, we have the intent and ability to refinance this security under our long-term credit facilities. Accordingly, this security remains classified as long-term debt in our Consolidated Balance Sheets. |
| (3) | | Represents debt associated with a special purpose lessor entity that is consolidated in accordance with FIN 46R. The debt is nonrecourse to us and is secured by the entity’s property, plant and equipment of $207 million and $214 million at December 31, 2005 and 2004, respectively. |
| (4) | | Represents changes in fair value of certain fixed-rate long-term debt associated with fair value hedges. |
Based on stated maturity dates rather than early redemption dates that could be elected by the instrument holders, the scheduled principal payments of long-term debt at December 31, 2005 were as follows (in millions):
| | | | | | | | | | | | |
| 2006 | | 2007 | | 2008 | | 2009 | | 2010 | | Thereafter | | Total |
$734 | | $200 | | $150 | | — | | $200 | | $2,356 | | $3,640 |
Our long-term debt agreements contain customary covenants and default provisions. As of December 31, 2005, there were no events of default under our covenants.
Junior Subordinated Notes Payable to Affiliated Trust
In 2001, Dominion CNG Capital Trust I (trust), a finance subsidiary of the Company, which holds 100% of the voting interests, sold 8 million 7.8% trust preferred securities for $200 million, representing preferred beneficial interests and 97% beneficial ownership in the assets held by the trust. In exchange for the $200 million realized from the sale of the trust preferred securities and $6 million of common securities that represent the remaining 3% beneficial ownership interest in the assets held by the trust, we issued $206 million of our 2001 7.8% junior subordinated notes due October 31, 2041. The junior subordinated notes constitute 100% of the trust’s assets. The trust must redeem the trust preferred securities when the junior subordinated notes are repaid or if redeemed prior to maturity.
Under previous accounting guidance, we consolidated the trust in the preparation of our Consolidated Financial Statements. In accordance with FIN 46R, we ceased to consolidate the trust as of December 31, 2003 and instead report as long-term debt on our Consolidated Balance Sheets the junior subordinated notes issued by us and held by the trust.
35
Notes to Consolidated Financial Statements, Continued
Distribution payments on the trust preferred securities are considered to be fully and unconditionally guaranteed by us when all of the related agreements are taken into consideration. Each guarantee agreement only provides for the guarantee of distribution payments on the trust preferred securities to the extent that the trust has funds legally and immediately available to make distributions. The trust’s ability to pay amounts when they are due on the trust preferred securities is dependent solely upon the payment of amounts when they are due on the junior subordinated notes. If the payment on the junior subordinated notes is deferred, we may not make distributions related to our capital stock, including dividends, redemptions, repurchases, liquidation payments or guarantee payments. Also, during the deferral period, we may not make any payments or redeem or repurchase any debt securities that are equal in right of payment with, or subordinated to, the junior subordinated notes.
Note 16. Shareholder’s Equity
In 2005, we received a $750 million equity contribution from Dominion related to outstanding Dominion money pool borrowings and in 2004, we received a $41 million equity contribution from Dominion in exchange for a reduction in amounts payable to Dominion. At December 31, 2005 and 2004, our AOCI was $1.8 billion and $849 million, respectively, related to net unrealized losses on derivatives, net of tax.
Note 17. Dividend Restrictions
The 1935 Act and related regulations issued by the SEC impose restrictions on the transfer and receipt of funds by a registered holding company from its subsidiaries, including a general prohibition against loans or advances being made by the subsidiaries to benefit the registered holding company. Under the 1935 Act, registered holding companies and their subsidiaries may pay dividends only from retained earnings, unless the SEC specifically authorizes payments from other capital accounts. We received dividends from our subsidiaries of $575 million, $481 million and $405 million in 2005, 2004, and 2003, respectively.
At December 31, 2005, our consolidated subsidiaries had approximately $2.0 billion in capital accounts other than retained earnings, representing capital stock, other paid-in capital and AOCI. We had approximately $3.3 billion in capital accounts other than retained earnings at December 31, 2005. Generally such amounts are not available for the payment of dividends by affected subsidiaries, or by us, without specific authorization by the SEC.
In response to a Dominion request, the SEC granted relief in 2000, authorizing payment of dividends by us from other capital accounts to Dominion in amounts of up to $1.6 billion, representing our retained earnings prior to Dominion’s acquisition of us. The SEC granted further relief in 2004, authorizing our nonutility subsidiaries to pay dividends out of capital or unearned surplus in situations where such subsidiary has received excess cash from an asset sale, engaged in a restructuring, or is returning capital to an associate company. We are not bound by the foregoing restrictions on dividends imposed by the 1935 Act as of February 8, 2006, the effective date on which the 1935 Act was repealed under the Energy Policy Act of 2005.
Certain agreements associated with our joint credit facility with Dominion and Virginia Power contain restrictions on the ratio of our debt to total capitalization. These limitations did not restrict our ability to pay dividends to Dominion or receive dividends from our subsidiaries at December 31, 2005.
See Note 15 for a description of potential restrictions on our dividend payments in connection with the deferral of distribution payments on trust preferred securities.
Note 18. Employee Benefit Plans
We provide certain benefits to eligible active employees, retirees and qualifying dependents. Under the terms of our benefit plans, we reserve the right to change, modify or terminate the plans. From time to time in the past, benefits have changed, and some of these changes have reduced benefits.
Pension benefits, for our employees not represented by recognized bargaining units, are covered by Dominion’s pension plan, which provides benefits to multiple Dominion subsidiaries. We recognized $44 million, $50 million and $63 million of net periodic pension credits in 2005, 2004 and 2003, respectively, related to the plan. We made no contributions to the plan in 2005, 2004 or 2003.
We sponsor qualified pension plans that cover employee groups represented by collective bargaining units. Retirement benefits payable under all plans are based primarily on years-of-service, age and compensation. Our contributions to the plans are generally determined in accordance with the provisions of the Employment Retirement Income Security Act of 1974.
The measurement date for the majority of our employee benefit plans is December 31. We use a market-related value of pension plan assets to determine the expected return on pension plan assets, a component of net periodic pension cost. The market-related value recognizes changes in fair value on a straight-line basis over a four-year period. Changes in fair value are measured as the difference between the expected and actual plan asset returns, including dividends, interest and realized and unrealized investment gains and losses.
Retiree health care and life insurance benefits, for our employees not represented by recognized bargaining units, are covered by Dominion’s other postretirement benefit plans. We sponsor other postretirement benefit plans that cover employee groups represented by collective bargaining units. Annual employee premiums are based on several factors such as age, retirement date and years of service.
On December 8, 2003, the Medicare Prescription Drug, Improvement and Modernization Act of 2003 (the Medicare Act) was signed into law. The Medicare Act introduces a prescription drug benefit under Medicare (Medicare Part D) as well as a federal subsidy to sponsors of retiree health care benefit plans that provide a benefit that is at least actuarially equivalent to Medicare Part D. Based on an analysis performed by a third-party actuary, we have determined that the prescription drug benefit offered under our other postretirement benefit plans is at least actuarially equivalent to Medicare Part D and therefore we expect to receive the federal subsidy offered under the Medicare Act.
We expect to receive subsidies, for employees represented by collective bargaining units, of approximately $1 million annually for the years 2006 through 2010 and expect to receive approximately $8 million for the period beginning 2011 through 2015.
36
Notes to Consolidated Financial Statements, Continued
We considered the passage of the Medicare Act a significant event requiring remeasurement of the accumulated postretirement benefit obligation on December 8, 2003. We will amortize the unrecognized actuarial gains associated with the benefits of the subsidy over the average remaining service period of plan participants in accordance with SFAS No. 106.
The following table summarizes information for our pension and other postretirement benefit plans for employees represented by collective bargaining units, including the changes in the pension and other postretirement benefit plan obligations and plan assets and includes a statement of the plans’ funded status:
| | | | | | | | | | | | | | |
| | | Pension Benefits | | | Other Postretirement Benefits | |
| Year Ended December 31, | | 2005 | | | 2004 | | | 2005 | | | 2004 | |
| (millions) | | | | | | |
Change in benefit obligation: | | | | | | | | | | | | | | |
Benefit obligation at beginning of year | | $ | 527 | | | $ | 491 | | | $ 402 | | | $ 427 | |
Service cost | | | 12 | | | | 11 | | | 14 | | | 17 | |
Interest cost | | | 31 | | | | 30 | | | 23 | | | 26 | |
Plan amendments | | | — | | | | 5 | | | (23 | ) | | (2 | ) |
Actuarial (gain) loss | | | 29 | | | | 22 | | | 52 | | | (42 | ) |
Benefits paid | | | (30 | ) | | | (32 | ) | | (23 | ) | | (24 | ) |
Benefit obligation at end of year | | $ | 569 | | | $ | 527 | | | $ 445 | | | $ 402 | |
Change in plan assets: | | | | | | | | | | | | | | |
Fair value of plan assets at beginning of year | | $ | 1,200 | | | $ | 1,108 | | | $ 204 | | | $ 173 | |
Actual return on plan assets | | | 121 | | | | 124 | | | 13 | | | 15 | |
Employer contributions | | | — | | | | — | | | 29 | | | 38 | |
Benefits paid from plan assets | | | (30 | ) | | | (32 | ) | | (21 | ) | | (22 | ) |
Fair value of plan assets at end of year | | $ | 1,291 | | | $ | 1,200 | | | $ 225 | | | $ 204 | |
Funded status | | $ | 722 | | | $ | 673 | | | $(220 | ) | | $(198 | ) |
Unrecognized net transition obligation | | | — | | | | — | | | 27 | | | 46 | |
Unrecognized net actuarial (gain) loss | | | (70 | ) | | | (80 | ) | | 155 | | | 106 | |
Unamortized prior service cost | | | 16 | | | | 17 | | | (14 | ) | | (3 | ) |
Prepaid (accrued) benefit cost | | $ | 668 | | | $ | 610 | | | $ (52 | ) | | $ (49 | ) |
Amounts recognized in our Consolidated Balance Sheets at December 31(1): | | | | | | | | | | | | | | |
Prepaid pension cost | | $ | 1,086 | | | $ | 984 | | | — | | | — | |
Accrued benefit liability | | | — | | | | — | | | $ (96 | ) | | $ (97 | ) |
| (1) | | Amounts represent all benefit plans in which we participate, including benefit plans covering multiple Dominion subsidiaries. |
The accumulated benefit obligation for defined benefit pension plans for employees represented by collective bargaining units was $527 million and $482 million at December 31, 2005 and 2004, respectively. Under our funding policies, we evaluate plan funding requirements annually, usually in the fourth quarter after receiving updated plan information from our actuary. Based on the funded status of each plan and other factors, we determine the amount of contributions for the current year, if any, at that time.
The following benefit payments, which reflect expected future service, as appropriate, are expected to be paid for employees represented by collective bargaining units:
| | | | |
| | | Pension
Benefits | | Other
Postretirement
Benefits |
| (millions) | | | | |
2006 | | $ 31 | | $ 24 |
2007 | | 31 | | 26 |
2008 | | 31 | | 27 |
2009 | | 31 | | 28 |
2010 | | 32 | | 29 |
2011-2015 | | 183 | | 157 |
37
Notes to Consolidated Financial Statements, Continued
Our overall objective for investing pension and other postretirement plan assets is to achieve the best possible long-term rates of return commensurate with prudent levels of risk. To minimize risk, funds are broadly diversified among asset classes, investment strategies and investment advisors. The strategic target asset allocation for our pension funds is 45% U.S. equity securities; 8% non-U.S. equity securities; 22% debt securities; and 25% other, such as real estate and private equity investments. Financial derivatives may be used to obtain or manage market exposures and to hedge assets and liabilities. Our asset allocations for pension plans and other postretirement benefit plans for employees represented by collective bargaining units follow:
| | | | | | | | | | | | | | | | | | | | |
| | | Pension Plans | | Other Postretirement Plans |
| At December 31, | | 2005 | | 2004 | | 2005 | | 2004 |
| | | Fair
Value | | % of Total | | Fair Value | | % of Total | | Fair Value | | % of Total | | Fair Value | | % of Total |
| (millions) | | | | |
Equity securities: | | | | | | | | | | | | | | | | | | | | |
U.S. | | $ | 521 | | 40 | | $ | 522 | | 44 | | $ | 95 | | 42 | | $ | 89 | | 44 |
International | | | 180 | | 14 | | | 155 | | 13 | | | 23 | | 11 | | | 20 | | 10 |
Debt securities | | | 289 | | 22 | | | 280 | | 23 | | | 90 | | 40 | | | 82 | | 40 |
Real estate | | | 101 | | 8 | | | 88 | | 7 | | | 3 | | 1 | | | 3 | | 1 |
Other | | | 200 | | 16 | | | 155 | | 13 | | | 14 | | 6 | | | 10 | | 5 |
Total | | $ | 1,291 | | 100 | | $ | 1,200 | | 100 | | $ | 225 | | 100 | | $ | 204 | | 100 |
The components of the provision for net periodic benefit cost were as follows:
| | | | | | | | | | | | | | | | | | | | | |
| | | Pension Benefits | | | Other Postretirement Benefits | |
| Year Ended December 31, | | 2005 | | | 2004 | | | 2003 | | | 2005 | | | 2004 | | | 2003 | |
| (millions) | | | | | | |
Service cost | | $ | 12 | | | $ | 11 | | | $ | 9 | | | $ 14 | | | $ 17 | | | $ 15 | |
Interest cost | | | 31 | | | | 30 | | | | 30 | | | 23 | | | 26 | | | 25 | |
Expected return on assets | | | (103 | ) | | | (100 | ) | | | (99 | ) | | (16 | ) | | (13 | ) | | (10 | ) |
Prior service cost amortization | | | 2 | | | | 1 | | | | 1 | | | — | | | — | | | — | |
Transition obligation (asset) amortization | | | — | | | | (3 | ) | | | (3 | ) | | 6 | | | 6 | | | 5 | |
Amortization of net (gain) loss | | | — | | | | (1 | ) | | | (9 | ) | | 6 | | | 10 | | | 10 | |
Net periodic benefit cost (credit) | | $ | (58 | ) | | $ | (62 | ) | | $ | (71 | ) | | $ 33 | | | $ 46 | | | $ 45 | |
Company’s net periodic benefit cost (credit)(1) | | $ | (102 | ) | | $ | (112 | ) | | $ | (134 | ) | | $ 48 | | | $ 63 | | | $ 65 | |
| (1) | | Amounts represent all benefit plans in which we participate, including benefit plans covering multiple Dominion subsidiaries. |
Significant assumptions used in determining the net periodic cost for our pension and other postretirement benefit plans for employees represented by collective bargaining units recognized in our Consolidated Statements of Income were as follows, on a weighted-average basis:
| | | | | | | | | | | | |
| | | Pension Benefits | | Other Postretirement Benefits |
| Year Ended December 31, | | 2005 | | 2004 | | 2003 | | 2005 | | 2004 | | 2003 |
Discount rate | | 6.00% | | 6.25% | | 6.75% | | 6.00% | | 6.25% | | 6.75% |
Expected return on plan assets | | 8.75% | | 8.75% | | 8.75% | | 8.00% | | 8.00% | | 8.00% |
Rate of increase for compensation | | 4.00% | | 4.00% | | 4.00% | | 4.00% | | 4.00% | | 4.00% |
Medical cost trend rate(1) | | | | | | | | 9.00% | | 9.00% | | 9.00% |
| (1) | | The medical cost trend rate for 2005 is assumed to gradually decrease to 5.00% by 2009 and continues at that rate for years thereafter. |
Significant assumptions used in determining the projected benefit obligations for our pension and other postretirement benefit plans for employees represented by collective bargaining units recognized in our Consolidated Balance Sheets were as follows, on a weighted-average basis:
| | | | | | | | |
| | | Pension Benefits | | Other Postretirement Benefits |
| At December 31, | | 2005 | | 2004 | | 2005 | | 2004 |
Discount rate | | 5.60% | | 6.00% | | 5.50% | | 6.00% |
Rate of increase for compensation | | 4.00% | | 4.00% | | 4.00% | | 4.00% |
We determine the expected long-term rates of return on plan assets for pension plans and other postretirement benefit plans by using a combination of:
| · | Historical return analysis to determine expected future risk premiums; |
| · | Forward-looking return expectations derived from the yield on long-term bonds and the price earnings ratios of major stock market indices; |
| · | Expected inflation and risk-free interest rate assumptions, and |
| · | The types of investments expected to be held by the plans. |
38
Notes to Consolidated Financial Statements, Continued
Assisted by an independent actuary, we develop assumptions, which are then compared to the forecasts of other independent investment advisors to ensure reasonableness. An internal committee selects the final assumptions. Discount rates are determined from analyses performed by a third party actuarial firm of AA/Aa rated bonds with cash flows matching the expected payments to be made under our plans.
Assumed health care cost trend rates have a significant effect on the amounts reported for our retiree health care plans. A one-percentage-point change in the assumed health care cost trend rate would have had the following effects on postretirement benefit plans for employees represented by collective bargaining units:
| | | | | | | |
| | | Other Postretirement Benefits | |
| | | One Percentage Point Increase | | One Percentage Point Decrease | |
| (millions) | | | | | |
Effect on total service and interest cost components for 2005 | | $ | 7 | | $ | (5 | ) |
Effect on postretirement benefit obligation at December 31, 2005 | | | 55 | | | (46 | ) |
We also participate in Dominion-sponsored employee savings plans that cover substantially all employees. Employer matching contributions of $9 million, $8 million and $8 million were incurred in 2005, 2004 and 2003, respectively.
Certain regulatory authorities have held that amounts recovered in rates for other postretirement benefits in excess of benefits actually paid during the year must be deposited in trust funds dedicated for the sole purpose of paying such benefits. Accordingly, certain of our subsidiaries fund postretirement benefit costs through Voluntary Employees’ Beneficiary Associations. Our remaining subsidiaries do not prefund postretirement benefit costs but instead pay claims as presented.
Note 19. Commitments and Contingencies
As the result of issues generated in the ordinary course of business, we are involved in legal, tax and regulatory proceedings before various courts, regulatory commissions and governmental agencies, some of which involve substantial amounts of money. We believe that the final disposition of these proceedings will not have a material effect on our financial position, liquidity or results of operations.
Long-Term Purchase Agreements
At December 31, 2005, we had the following long-term commitments that are noncancelable or are cancelable only under certain conditions, and that third parties have used to secure financing for the facilities that will provide the contracted goods or services:
| | | | | | | | | | | | | | |
| | | 2006 | | 2007 | | 2008 | | 2009 | | 2010 | | Later Years | | Total |
| (millions) | | | | |
Production handling for gas and oil production operations(1) | | $54 | | $51 | | $36 | | $22 | | $14 | | $13 | | $190 |
| (1) | | Payments under this contract, which ends in 2012, totaled $52 million, $22 million and $10 million for 2005, 2004 and 2003, respectively. |
Lease Commitments
We lease various facilities, onshore and offshore drilling rigs, vehicles and equipment primarily under operating leases. Payments under certain leases are escalated based on an index such as the consumer price index. Future minimum lease payments under noncancelable operating and capital leases that have initial or remaining lease terms in excess of one year as of December 31, 2005 are as follows:
| | | | | | | | | | | | |
| 2006 | | 2007 | | 2008 | | 2009 | | 2010 | | Thereafter | | Total |
| (millions) | | | | | | | | | | | | |
| $36 | | $54 | | $64 | | $62 | | $39 | | $173 | | $428 |
Rental expense totaled $54 million, $50 million, and $40 million for 2005, 2004 and 2003, respectively, the majority of which is reflected in other operations and maintenance expense.
Environmental Matters
We are subject to costs resulting from a steadily increasing number of federal, state and local laws and regulations designed to protect human health and the environment. These laws and regulations affect future planning and existing operations and can result in increased capital, operating and other costs as a result of our compliance, remediation, containment and monitoring obligations. We may sometimes seek recovery of environmental-related expenditures through regulatory proceedings.
Before being acquired by Dominion in 2001, Louis Dreyfus Natural Gas Corp. (Louis Dreyfus) was one of numerous defendants in a lawsuit consolidated and pending in the 93rd Judicial District Court in Hidalgo County, Texas. The lawsuit alleges that gas wells and related pipeline facilities operated by Louis Dreyfus and facilities operated by other defendants caused an underground hydrocarbon plume in McAllen, Texas. The plaintiffs claim that they have suffered damages, including property damage and lost profits as a result of the alleged plume. Although the results of litigation are inherently unpredictable, we do not expect the ultimate outcome of the case to have a material adverse impact on our financial position or results of operations, cash flows or financial position.
We have determined that we are associated with 16 former manufactured gas plant sites. Studies conducted by other utilities at their former manufactured gas plants have indicated that their sites contain coal tar and other potentially harmful materials. None of the 16 former sites with which we are associated is under investigation by any state or federal environmental agency, and no investigation or action is currently anticipated. At this time, it is not known to what degree these sites may contain environmental contamination. We are not able to estimate the cost, if any, that may be required for the possible remediation of these sites.
Guarantees, Letters of Credit and Surety Bonds
In 2005, we, along with two other gas and oil exploration and production companies, entered into a four-year drilling contract related to a new, ultra-deepwater drilling rig that is expected to be delivered in mid-2008. The contract has a four-year primary term, plus four one-year extension options. Our minimum commitment under the agreement, which is reflected in the lease commitments table, is for approximately $99 million over the four-year term; however, we are jointly and severally liable for up to $394 million to the contractor if the other parties fail to pay the contractor for their obligations under the primary term of the agreement, which we view as highly unlikely. We have not recognized any significant liabilities related to this guarantee arrangement.
39
Notes to Consolidated Financial Statements, Continued
We also enter into guarantee arrangements on behalf of our consolidated subsidiaries primarily to facilitate their commercial transactions with third parties. To the extent that a liability subject to a guarantee has been incurred by one of our consolidated subsidiaries, that liability is included in our Consolidated Financial Statements. We are not required to recognize liabilities for guarantees issued on behalf of our subsidiaries unless it becomes probable that we will have to perform under the guarantees. No such liabilities have been recognized as of December 31, 2005. We believe it is unlikely that we would be required to perform or otherwise incur any losses associated with guarantees of our subsidiaries’ obligations. At December 31, 2005, we had issued the following subsidiary guarantees:
| | | | | | |
| | | Stated
Limit | | Value(1) |
(millions) | | | | | | |
Subsidiary debt(2) | | $ | 201 | | $ | 201 |
Offshore drilling commitments | | | 300 | | | 300 |
Commodity transactions(3) | | | 1,252 | | | 767 |
Miscellaneous | | | 343 | | | 254 |
Total subsidiary obligations | | $ | 2,096 | | $ | 1,522 |
| (1) | | Represents the estimated portion of the guarantee’s stated limit that is utilized as of December 31, 2005 based upon prevailing economic conditions and fact patterns specific to each guarantee arrangement. For those guarantees related to obligations that are recorded as liabilities by our subsidiaries, the value includes the recorded amount. |
| (2) | | Guarantees of debt of Dominion Oklahoma Texas Exploration and Production Inc. In the event of default by this subsidiary, we would be obligated to repay such amounts. |
| (3) | | Guarantees of contract payments for certain subsidiaries involved in natural gas and oil production, natural gas delivery and energy marketing activities. These guarantees were provided to counterparties in order to facilitate physical and financial transactions in gas, pipeline capacity, transportation, oil, electricity and related commodities and services. If any of these subsidiaries fail to perform or pay under the contracts and the counterparties seek performance or payment, we would be obligated to satisfy such obligation. We and our subsidiaries receive similar guarantees as collateral for credit extended to others. The value provided includes certain guarantees that do not have stated limits. |
Additionally, as of December 31, 2005 we had purchased $44 million of surety bonds and authorized the issuance of standby letters of credit by financial institutions of $2.6 billion to facilitate commercial transactions by our subsidiaries with third parties.
Indemnifications
As part of commercial contract negotiations in the normal course of business, we may sometimes agree to make payments to compensate or indemnify other parties for possible future unfavorable financial consequences resulting from specified events. The specified events may involve an adverse judgment in a lawsuit or the imposition of additional taxes due to a change in tax law or interpretation of the tax law. We are unable to develop an estimate of the maximum potential amount of future payments under these contracts because events that would obligate us have not yet occurred or, if any such event has occurred, we have not been notified of its occurrence. However, at December 31, 2005, we believe future payments, if any, that could ultimately become payable under these contract provisions, would not have a material impact on our results of operations, cash flows or financial position.
Note 20. Fair Value of Financial Instruments
Substantially all of our financial instruments are recorded at fair value, with the exception of the following instruments that arereported at historical cost. Fair values have been determined using available market information and valuation methodologies considered appropriate by management. The financial instruments’ carrying amounts and fair values are as follows:
| | | | | | | | | | | | |
| At December 31, | | 2005 | | 2004 |
| | | Carrying Amount | | Estimated Fair Value(1) | | Carrying Amount | | Estimated Fair Value(1) |
| (millions) | | | | |
Long-term debt(2) | | $ | 3,442 | | $ | 3,572 | | $ | 3,604 | | $ | 3,825 |
Junior subordinated notes payable to affiliated trust | | | 206 | | | 210 | | | 206 | | | 221 |
| (1) | | Fair value is estimated using market prices, where available, and interest rates currently available for issuance of debt with similar terms and remaining maturities. The carrying amount of debt issues with short-term maturities and variable rates refinanced at current market rates is a reasonable estimate of their fair value. |
| (2) | | Includes securities due within one year. |
Note 21. Credit Risk
Credit risk is our risk of financial loss if counterparties fail to perform their contractual obligations. In order to minimize overall credit risk, Dominion and its subsidiaries, including us, maintain credit policies, including the evaluation of counterparty financial condition, collateral requirements and the use of standardized agreements that facilitate the netting of cash flows associated with a single counterparty. In addition, counterparties may make available collateral, including letters of credit or cash held as margin deposits, as a result of exceeding agreed-upon credit limits, or may be required to prepay the transaction. Amounts reported as margin deposit liabilities represent funds held by us that resulted from various trading counterparties exceeding agreed-upon credit limits established by us. Amounts reported as margin deposit assets represent funds held on deposit by various trading counterparties that resulted from us exceeding agreed-upon credit limits established by the counterparties. As of December 31, 2005 and 2004, we had margin deposit assets (reported in other current assets) of $20 million and $88 million, respectively. We had margin deposit liabilities (reported in other current liabilities) of $126 million as of December 31, 2005. We had no margin deposit liabilities as of December 31, 2004.
We maintain a provision for credit losses based on factors surrounding the credit risk of our customers, historical trends and other information. We believe, based on our credit policies and our December 31, 2005 provision for credit losses, that it is unlikely that a material adverse effect on our financial position, results of operations or cash flows would occur as a result of counterparty nonperformance.
We sell natural gas and provide distribution services to residential, commercial and industrial customers and provide transmission services to utilities and other energy companies. In addition, we enter into contracts with various companies in the energy industry for purchases and sales of energy-related commodities, including natural gas and oil. Except for gas and oil exploration and production business activities, these transactions principally occur in the Northeast, Midwest and Mid-Atlantic regions of the United States. We do not believe that this geographic concentration contributes significantly to our overall exposure to credit risk. Credit risk associated with trade accounts receivable from energy consumers is limited due to the large number of customers.
40
Notes to Consolidated Financial Statements, Continued
Our exposure to credit risk is concentrated primarily within our sales of gas and oil production and energy marketing, including our hedging activities, as we transact with a smaller, less diverse group of counterparties and transactions may involve large notional volumes and potentially volatile commodity prices. At December 31, 2005, gross credit exposure related to these transactions totaled $826 million, reflecting the unrealized gains for contracts carried at fair value plus any outstanding receivables (net of payables, where netting agreements exist), prior to the application of collateral. After the application of collateral, our credit exposure is reduced to $700 million. Of this amount, investment grade counterparties represent 63% and no single counterparty exceeded 17%.
Note 22. Related Party Transactions
We engage in related party transactions primarily with affiliates (Dominion subsidiaries). Our accounts receivable and payable balances with affiliates are settled based on contractual terms on a monthly basis, depending on the nature of the underlying transactions. We are included in Dominion’s consolidated federal income tax return and participate in certain Dominion benefit plans. The significant related party transactions are disclosed below.
Transactions with Affiliates
We transact with affiliates for certain quantities of natural gas and other commodities at market prices in the ordinary course of business. We also enter into certain derivative commodity contracts with affiliates. We use these contracts, which are principally comprised of commodity swaps and options, to manage commodity price risks associated with the purchases and sales of natural gas. We designate the majority of these contracts as cash flow hedges for accounting purposes.
Presented below are affiliated transactions, including net realized gains and losses on affiliated commodity derivative contracts, recorded in operating revenue and operating expenses:
| | | | | | | | | |
| Year Ended December 31, | | 2005 | | 2004 | | 2003 |
| (millions) | | | | |
Sales of natural gas to affiliates | | $ | 1,129 | | $ | 1,037 | | $ | 655 |
Gas transportation and storage services provided to affiliates | | | 32 | | | 19 | | | 29 |
Sales of electricity to affiliates | | | 40 | | | 34 | | | 27 |
Purchases of natural gas from affiliates | | | 678 | | | 527 | | | 613 |
Purchases of electric fuel and energy from affiliates | | | 209 | | | 196 | | | 80 |
At December 31, 2005 and 2004, our Consolidated Balance Sheets include derivative assets with affiliates of $431 million and $249 million, respectively, and derivative liabilities with affiliates of $120 million and $49 million, respectively. Unrealized gains or losses, representing the effective portion of the changes in fair value of those derivative contracts that had been designated as hedges, are included in AOCI on our Consolidated Balance Sheets. In 2005, we also recognized a benefit of $38 million related to financially-settled derivative contracts entered into with affiliates in other operations and maintenance expense.
Dominion Resources Services (Dominion Services) provides certain administrative and technical services to us. We provide certain services to other affiliates, including technical services to other Dominion subsidiaries. The cost of these services is as follows:
| | | | | | | | | |
| Year Ended December 31, | | 2005 | | 2004 | | 2003 |
| (millions) | | | | |
Services provided by Dominion Services | | $ | 188 | | $ | 168 | | $ | 159 |
Services provided to other affiliates | | | 10 | | | 9 | | | 10 |
Transactions with Dominion
We have borrowed funds from Dominion under short-term borrowing arrangements. The short-term demand note borrowings were $163 million at December 31, 2004. In February 2005, borrowings by certain of our subsidiaries from Dominion under short-term demand notes were converted to borrowings from the Dominion money pool. In September 2005, $750 million of the outstanding Dominion money pool borrowings were converted to contributed capital. At December 31, 2005 and 2004, our subsidiaries had $1.9 billion and $1.0 billion of outstanding borrowings, respectively, under the Dominion money pool. We incurred interest charges related to these borrowings of $58 million, $15 million and $13 million in 2005, 2004 and 2003, respectively.
In connection with the reduction in amounts payable to Dominion, we recognized $41 million of other paid-in capital in 2004.
Other Related Party Transactions
Upon adoption of FIN 46R for our interests in special purpose entities on December 31, 2003, we ceased to consolidate the Dominion CNG Capital Trust I, a finance subsidiary of the Company. The junior subordinated notes issued by us and held by the trust are reported as long-term debt. We reported $16 million each year for interest expense on the junior subordinated notes payable to affiliated trust in 2005 and 2004 and distributions on mandatorily redeemable trust preferred securities in 2003.
Equity Method Investments
At December 31, 2005 and 2004, our equity method investments totaled $210 million and $204 million, respectively and equity earnings on these investments totaled $16 million in 2005, $14 million in 2004 and $21 million in 2003. Our equity method investments are reported in investments in affiliates, with the exception of approximately $2 million in 2005 and 2004, which are classified as part of assets held for sale in other current assets. We received dividends from these investments of $12 million, $9 million and $7 million in 2005, 2004, and 2003, respectively. Equity earnings on these investments are reported in other income (loss) in our Consolidated Statements of Income.
41
Notes to Consolidated Financial Statements, Continued
Note 23. Condensed Consolidating Financial Information
We have fully and unconditionally guaranteed $200 million of senior notes issued by our wholly-owned subsidiary, DOTEPI. The senior notes mature in December 2007. In the event of a default by this subsidiary, Consolidated Natural Gas Company would be obligated to repay such amounts. Condensed consolidating financial information for the Company, DOTEPI and our other subsidiaries is presented below:
Condensed Consolidating Statement of Income Information
(millions)
| | | | | | | | | | | | | | |
| Year Ended December 31, 2005 | | CNG (Parent
Company) | | | DOTEPI | | Other Subsidiaries | | | Adjustments &
Eliminations | | | Consolidated | |
Operating revenue | | $ — | | | $724 | | $7,984 | | | $(636 | ) | | $8,072 | |
Operating expenses | | 3 | | | 448 | | 7,158 | | | (604 | ) | | 7,005 | |
Income (loss) from operations | | (3 | ) | | 276 | | 826 | | | (32 | ) | | 1,067 | |
Other income | | 209 | | | — | | 33 | | | (212 | ) | | 30 | |
Interest and related charges | | 203 | | | 62 | | 171 | | | (211 | ) | | 225 | |
Income before income tax expense | | 3 | | | 214 | | 688 | | | (33 | ) | | 872 | |
Income tax expense (benefit) | | (2 | ) | | 75 | | 256 | | | (12 | ) | | 317 | |
Income before cumulative effect of change in accounting principle | | 5 | | | 139 | | 432 | | | (21 | ) | | 555 | |
Equity in earnings of subsidiaries | | 548 | | | — | | — | | | (548 | ) | | — | |
Cumulative effect of change in accounting principle | | — | | | — | | (2 | ) | | — | | | (2 | ) |
Net income | | $553 | | | $139 | | $ 430 | | | $(569 | ) | | $ 553 | |
| | | | | | | | | | | | |
| Year Ended December 31, 2004 | | CNG (Parent
Company) | | | DOTEPI | | Other Subsidiaries | | Adjustments &
Eliminations | | | Consolidated |
Operating revenue | | $ — | | | $642 | | $6,439 | | $(500 | ) | | $6,581 |
Operating expenses | | 1 | | | 362 | | 5,227 | | (475 | ) | | 5,115 |
Income (loss) from operations | | (1 | ) | | 280 | | 1,212 | | (25 | ) | | 1,466 |
Other income | | 187 | | | — | | 51 | | (183 | ) | | 55 |
Interest and related charges | | 197 | | | 42 | | 117 | | (184 | ) | | 172 |
Income (loss) before income tax expense | | (11 | ) | | 238 | | 1,146 | | (24 | ) | | 1,349 |
Income tax expense (benefit) | | (5 | ) | | 72 | | 425 | | (10 | ) | | 482 |
Equity in earnings of subsidiaries | | 873 | | | — | | — | | (873 | ) | | — |
Net income | | $867 | | | $166 | | $ 721 | | $(887 | ) | | $ 867 |
| | | | | | | | | | | | | | |
| Year Ended December 31, 2003 | | CNG (Parent
Company) | | | DOTEPI | | Other Subsidiaries | | | Adjustments &
Eliminations | | | Consolidated | |
Operating revenue | | $ — | | | $620 | | $5,185 | | | $(477 | ) | | $5,328 | |
Operating expenses | | (1 | ) | | 381 | | 4,179 | | | (437 | ) | | 4,122 | |
Income from operations | | 1 | | | 239 | | 1,006 | | | (40 | ) | | 1,206 | |
Other income (loss) | | 189 | | | — | | (21 | ) | | (200 | ) | | (32 | ) |
Interest and related charges | | 199 | | | 33 | | 122 | | | (201 | ) | | 153 | |
Income (loss) before income tax expense | | (9 | ) | | 206 | | 863 | | | (39 | ) | | 1,021 | |
Income tax expense (benefit) | | (12 | ) | | 71 | | 327 | | | (14 | ) | | 372 | |
Income before cumulative effect of changes in accounting principles | | 3 | | | 135 | | 536 | | | (25 | ) | | 649 | |
Equity in earnings of subsidiaries | | 635 | | | — | | — | | | (635 | ) | | — | |
Cumulative effect of changes in accounting principles | | — | | | 1 | | (12 | ) | | — | | | (11 | ) |
Net income | | $638 | | | $136 | | $ 524 | | | $(660 | ) | | $ 638 | |
42
Notes to Consolidated Financial Statements, Continued
Condensed Consolidating Balance Sheet Information
(millions)
| | | | | | | | | | | |
| At December 31, 2005 | | CNG (Parent
Company) | | DOTEPI | | Other
Subsidiaries | | Adjustments &
Eliminations | | | Consolidated |
| Assets | | | | | | | | | | | |
Current assets | | $2,019 | | $ 539 | | $ 6,529 | | $ (3,659 | ) | | $ 5,428 |
Investment in affiliates | | 3,697 | | — | | 147 | | (3,634 | ) | | 210 |
Loans to affiliates | | 2,188 | | — | | — | | (2,188 | ) | | — |
Property, plant, and equipment, net | | — | | 4,079 | | 8,370 | | (103 | ) | | 12,346 |
Deferred charges and other assets | | 373 | | 555 | | 3,621 | | (631 | ) | | 3,918 |
Total assets | | 8,277 | | 5,173 | | 18,667 | | (10,215 | ) | | 21,902 |
| Liabilities & Shareholder’s Equity | | | | | | | | | | | |
Current liabilities | | 1,026 | | 2,646 | | 10,210 | | (4,980 | ) | | 8,902 |
Long-term debt | | 2,508 | | 200 | | — | | — | | | 2,708 |
Notes payable to affiliates | | 206 | | — | | 865 | | (865 | ) | | 206 |
Deferred credits and other liabilities | | 246 | | 1,231 | | 5,004 | | (686 | ) | | 5,795 |
Common shareholder’s equity | | 4,291 | | 1,096 | | 2,588 | | (3,684 | ) | | 4,291 |
Total liabilities and shareholder’s equity | | $8,277 | | $5,173 | | $18,667 | | $(10,215 | ) | | $21,902 |
| | | | | | | | | | | | |
| At December 31, 2004 | | CNG (Parent
Company) | | DOTEPI | | Other
Subsidiaries | | Adjustments &
Eliminations | | | Consolidated |
| Assets | | | | | | | | | | | | |
Current assets | | $1,866 | | $ | 341 | | $ 3,047 | | $(2,625 | ) | | $ 2,629 |
Investment in affiliates | | 3,891 | | | — | | 141 | | (3,828 | ) | | 204 |
Loans to affiliates | | 2,202 | | | — | | — | | (2,202 | ) | | — |
Property, plant and equipment, net | | — | | | 3,619 | | 7,506 | | (75 | ) | | 11,050 |
Deferred charges and other assets | | 225 | | | 532 | | 2,450 | | (368 | ) | | 2,839 |
Total assets | | $8,184 | | $ | 4,492 | | $13,144 | | $(9,098 | ) | | $16,722 |
| Liabilities & Shareholder’s Equity | | | | | | | | | | | | |
Current liabilities | | $ 379 | | $ | 1,047 | | $ 5,408 | | $(2,622 | ) | | $ 4,212 |
Long-term debt | | 3,014 | | | 206 | | 234 | | — | | | 3,454 |
Notes payable to affiliates | | 206 | | | 1,089 | | 1,113 | | (2,202 | ) | | 206 |
Deferred credits and other liabilities | | 105 | | | 1,093 | | 3,582 | | (410 | ) | | 4,370 |
Common shareholder’s equity | | 4,480 | | | 1,057 | | 2,807 | | (3,864 | ) | | 4,480 |
Total liabilities and shareholder’s equity | | $8,184 | | $ | 4,492 | | $13,144 | | $(9,098 | ) | | $16,722 |
Condensed Consolidating Statement of Cash Flow Information
(millions)
| | | | | | | | | | | | | | | |
| Year Ended December 31, 2005 | | CNG (Parent
Company) | | | DOTEPI | | | Other
Subsidiaries | | | Adjustments &
Eliminations | | | Consolidated | |
Net cash provided by operating activities | | $ 575 | | | $ 467 | | | $ 737 | | | $(799 | ) | | $ 980 | |
Net cash used in investing activities | | (37 | ) | | (655 | ) | | (1,254 | ) | | 46 | | | (1,900 | ) |
Net cash provided by (used in) financing activities | | (538 | ) | | 193 | | | 537 | | | 753 | | | 945 | |
| | | | | | |
| Year Ended December 31, 2004 | | CNG (Parent
Company) | | | DOTEPI | | | Other
Subsidiaries | | | Adjustments &
Eliminations | | | Consolidated | |
Net cash provided by operating activities | | $ 448 | | | $ 175 | | | $1,476 | | | $(481 | ) | | $ 1,618 | |
Net cash provided by (used in) investing activities | | 188 | | | (374 | ) | | (829 | ) | | (71 | ) | | (1,086 | ) |
Net cash provided by (used in) financing activities | | (636 | ) | | 192 | | | (660 | ) | | 552 | | | (552 | ) |
| | | | | |
| Year Ended December 31, 2003 | | CNG (Parent
Company) | | | DOTEPI | | | Other
Subsidiaries | | | Adjustments &
Eliminations | | | Consolidated | |
Net cash provided by operating activities | | $ 365 | | | $ 484 | | | $ 470 | | | $(404 | ) | | $ 915 | |
Net cash provided by (used in) investing activities | | 240 | | | (299 | ) | | (961 | ) | | (300 | ) | | (1,320 | ) |
Net cash provided by (used in) financing activities | | (605 | ) | | (176 | ) | | 497 | | | 706 | | | 422 | |
Notes to Consolidated Financial Statements, Continued
Note 24. Operating Segments
Our company is organized primarily on the basis of products and services sold in the United States. We manage our operations through the following segments:
Delivery includes our regulated gas distribution and customer service business which are subject to cost-of-service rate regulation and accordingly, applies SFAS No. 71,Accounting for the Effects of Certain Types of Regulation. It also includes our nonregulated retail energy marketing operations.
Energy includes our tariff-based natural gas transmission pipeline and underground natural gas storage businesses and an LNG facility which are subject to cost-of-service rate regulation and accordingly, applies SFAS No. 71. It also includes certain natural gas production and producer services, which consist of aggregation of gas supply and related wholesale activities.
E&P includes our gas and oil exploration, development and production operations. Operations are located in several major producing basins in the lower 48 states, including the outer continental shelf and deepwater areas of the Gulf of Mexico.
Corporateincludes our corporate and other functions, including the activities of CNGI, our power generating facility and other minor subsidiaries. In addition, the contribution to net income by our primary operating segments is determined based on a measure of profit that executive management believes represents our segments’ core earnings. As a result, certain specific items attributable to those segments are not included in profit measures evaluated by executive management in assessing the segment’s performance or allocating resources among the segments and are instead reported in the Corporate segment.
In 2005, we reported net expenses of $372 million in the Corporate segment attributable to our operating segments. The net expenses in 2005 primarily related to the impact of the following:
| · | | A $556 million loss ($357 million after-tax) related to the discontinuance of hedge accounting in August and September 2005 for certain gas and oil hedges resulting from an interruption of gas and oil production in the Gulf of Mexico caused by Hurricanes Katrina and Rita and subsequent changes in the fair value of those hedges during the third quarter, attributable to the E&P segment; and |
| · | | $21 million ($13 million after-tax) of incremental operations and maintenance expenses and severance costs associated with Hurricanes Katrina and Rita, attributable to the E&P segment. |
In 2004, we reported net expenses of $61 million in the Corporate segment attributable to our operating segments. The net expenses in 2004 resulted from a $96 million loss ($61 million after-tax) related to the discontinuance of hedge accounting in September 2004 for certain oil hedges resulting from an interruption of oil production in the Gulf of Mexico caused by Hurricane Ivan and subsequent changes in the fair value of those hedges during the third quarter, attributable to the E&P segment.
In 2003, we reported net expenses of $9 million in the Corporate segment attributable to our operating segments. The net expenses in 2003 primarily related to the impact of the following:
| · | | $5 million net after-tax loss representing the cumulative effect of adopting SFAS No. 143, as described in Note 3 to our Consolidated Financial Statements, attributable to the Energy segment; and |
| · | | $6 million of severance costs ($4 million after-tax) for workforce reductions during the first quarter of 2003, including $2 million, $3 million and $1 million, attributable to the Delivery, Energy and E&P segments, respectively. |
Intersegment sales and transfers are based on underlying contractual arrangements and agreements and may result in intersegment profit or loss.
44
Notes to Consolidated Financial Statements, Continued
The following table presents segment information pertaining to our operations:
| | | | | | | | | | | | | | | | |
| Year Ended December 31, | | Delivery | | Energy | | E&P | | | Corporate | | | Adjustments &
Eliminations | | | Consolidated Total | |
| (millions) | | | | | | | | | | | | | | | | |
2005 | | | | | | | | | | | | | | | | |
Operating revenue: | | | | | | | | | | | | | | | | |
External customers | | $3,121 | | $1,371 | | $2,379 | | | $ — | | | $ — | | | $ 6,871 | |
Affiliated customers | | 2 | | 1,140 | | 19 | | | 40 | | | — | | | 1,201 | |
Intersegment revenue | | 30 | | 288 | | 207 | | | — | | | (525 | ) | | — | |
Total operating revenue | | 3,153 | | 2,799 | | 2,605 | | | 40 | | | (525 | ) | | 8,072 | |
Interest and related charges | | 68 | | 36 | | 119 | | | 213 | | | (211 | ) | | 225 | |
Interest income | | 11 | | 2 | | 5 | | | 206 | | | (211 | ) | | 13 | |
Depreciation, depletion and amortization | | 82 | | 87 | | 495 | | | 6 | | | — | | | 670 | |
Equity in earnings of equity method investees | | 1 | | 13 | | 2 | | | — | | | — | | | 16 | |
Income tax expense (benefit) | | 75 | | 160 | | 289 | | | (207 | ) | | — | | | 317 | |
Cumulative effect of change in accounting principle, net of tax | | — | | — | | — | | | (2 | ) | | — | | | (2 | ) |
Net income (loss) | | 157 | | 234 | | 529 | | | (367 | ) | | — | | | 553 | |
Investment in equity method investees | | 14 | | 95 | | 36 | | | 65 | | | — | | | 210 | |
Capital expenditures | | 142 | | 267 | | 1,522 | | | — | | | — | | | 1,931 | |
Total assets | | 5,000 | | 3,515 | | 13,846 | | | 5,062 | | | (5,521 | ) | | 21,902 | |
2004 | | | | | | | | | | | | | | | | |
Operating revenue: | | | | | | | | | | | | | | | | |
External customers | | $2,627 | | $ 949 | | $1,913 | | | $ — | | | $ — | | | $ 5,489 | |
Affiliated customers | | 2 | | 1,046 | | — | | | 44 | | | — | | | 1,092 | |
Intersegment revenue | | 63 | | 214 | | 132 | | | — | | | (409 | ) | | — | |
Total operating revenue | | 2,692 | | 2,209 | | 2,045 | | | 44 | | | (409 | ) | | 6,581 | |
Interest and related charges | | 46 | | 31 | | 76 | | | 202 | | | (183 | ) | | 172 | |
Interest income | | 7 | | 1 | | 2 | | | 181 | | | (183 | ) | | 8 | |
Depreciation, depletion and amortization | | 82 | | 80 | | 459 | | | 6 | | | — | | | 627 | |
Equity in earnings (losses) of equity method investees | | 3 | | 12 | | (2 | ) | | 1 | | | — | | | 14 | |
Income tax expense (benefit) | | 84 | | 143 | | 263 | | | (8 | ) | | — | | | 482 | |
Net income (loss) | | 184 | | 228 | | 520 | | | (65 | ) | | — | | | 867 | |
Investment in equity method investees | | 13 | | 93 | | 33 | | | 65 | | | — | | | 204 | |
Capital expenditures | | 132 | | 234 | | 1,180 | | | — | | | — | | | 1,546 | |
Total assets | | 4,127 | | 2,866 | | 9,794 | | | 4,743 | | | (4,808 | ) | | 16,722 | |
2003 | | | | | | | | | | | | | | | | |
Operating revenue: | | | | | | | | | | | | | | | | |
External customers | | $2,197 | | $ 892 | | $1,494 | | | $ 29 | | | $ — | | | $ 4,612 | |
Affiliated customers | | 3 | | 682 | | — | | | 31 | | | — | | | 716 | |
Intersegment revenue | | 47 | | 216 | | 121 | | | — | | | (384 | ) | | — | |
Total operating revenue | | 2,247 | | 1,790 | | 1,615 | | | 60 | | | (384 | ) | | 5,328 | |
Interest and related charges | | 42 | | 28 | | 68 | | | 199 | | | (184 | ) | | 153 | |
Interest income | | 6 | | 1 | | 2 | | | 182 | | | (184 | ) | | 7 | |
Depreciation, depletion and amortization | | 78 | | 70 | | 433 | | | — | | | — | | | 581 | |
Equity in earnings of equity method investees | | 1 | | 14 | | 5 | | | 1 | | | — | | | 21 | |
Income tax expense (benefit) | | 78 | | 141 | | 175 | | | (22 | ) | | — | | | 372 | |
Cumulative effect of changes in accounting principles, net of tax | | — | | — | | — | | | (11 | ) | | — | | | (11 | ) |
Net income | | 177 | | 213 | | 317 | | | (69 | ) | | — | | | 638 | |
As of December 31, 2005 and 2004, less than 1% of our total long-lived assets were associated with international operations. For the years ended December 31, 2005, 2004 and 2003, less than 1% of our operating revenues were associated with international operations.
Notes to Consolidated Financial Statements, Continued
Note 25. Gas and Oil Producing Activities (Unaudited)
Capitalized Costs
The aggregate amounts of costs capitalized for gas and oil producing activities and related aggregate amounts of accumulated depreciation, depletion and amortization follow:
| | | | | | |
| At December 31, | | 2005 | | 2004 |
| (millions) | | | | |
Capitalized costs: | | | | | | |
Proved properties | | $ | 10,855 | | $ | 9,346 |
Unproved properties | | | 2,077 | | | 1,948 |
| | | | 12,932 | | | 11,294 |
Accumulated depletion: | | | | | | |
Proved properties | | | 4,367 | | | 3,859 |
Unproved properties | | | 291 | | | 291 |
| | | | 4,658 | | | 4,150 |
Net capitalized costs | | $ | 8,274 | | $ | 7,144 |
Total Costs Incurred
The following costs were incurred in gas and oil producing activities:
| | | | | | | | | |
| Year Ended December 31, | | 2005 | | 2004 | | 2003 |
| (millions) | | | | |
Property acquisition costs: | | | | | | | | | |
Proved properties | | $ | 87 | | $ | 19 | | $ | 178 |
Unproved properties | | | 126 | | | 101 | | | 124 |
| | | | 213 | | | 120 | | | 302 |
Exploration costs | | | 231 | | | 197 | | | 268 |
Development costs(1) | | | 1,090 | | | 811 | | | 570 |
Total | | $ | 1,534 | | $ | 1,128 | | $ | 1,140 |
| (1) | | Development costs incurred for proved undeveloped reserves were $281 million, $162 million and $177 million for 2005, 2004 and 2003, respectively. |
Results of Operations
We caution that the following standardized disclosures required by the FASB do not represent the results of operations based on our historical financial statements. In addition to requiring different determinations of revenue and costs, the disclosures exclude the impact of interest expense and corporate overhead.
| | | | | | | | | |
| Year Ended December 31, | | 2005 | | 2004 | | 2003 |
| (millions) | | | | |
Revenue (net of royalties) from: | | | | | | | | | |
Sales to nonaffiliated companies | | $ | 1,352 | | $ | 1,169 | | $ | 1,207 |
Transfers to other operations | | | 234 | | | 167 | | | 159 |
Total | | | 1,586 | | | 1,336 | | | 1,366 |
Less: | | | | | | | | | |
Production (lifting) costs | | | 339 | | | 259 | | | 252 |
Depreciation, depletion and amortization | | | 492 | | | 457 | | | 425 |
Income tax expense | | | 281 | | | 243 | | | 248 |
Results of operations | | $ | 474 | | $ | 377 | | $ | 441 |
Notes to Consolidated Financial Statements, Continued
Company-Owned Reserves
Estimated net quantities of proved gas and oil (including condensate) reserves in the United States at December 31, 2005, 2004 and 2003, and changes in the reserves during those years, are shown in the two schedules that follow:
| | | | | | | | | |
| | | 2005 | | | 2004 | | | 2003 | |
| (billion cubic feet) | | | | | | |
Proved developed and undeveloped reserves—Gas | | | | | | | | | |
At January 1 | | 4,202 | | | 4,039 | | | 3,600 | |
Changes in reserves: | | | | | | | | | |
Extensions, discoveries and other additions | | 224 | | | 325 | | | 731 | |
Revisions of previous estimates | | 21 | | | 177 | | | (19 | ) |
Production | | (242 | ) | | (264 | ) | | (281 | ) |
Purchases of gas in place | | 36 | | | 10 | | | 131 | |
Sales of gas in place | | (22 | ) | | (85 | ) | | (123 | ) |
At December 31 | | 4,219 | | | 4,202 | | | 4,039 | |
Proved developed reserves—Gas | | | | | | | | | |
At January 1 | | 3,049 | | | 2,902 | | | 2,807 | |
At December 31 | | 3,059 | | | 3,049 | | | 2,902 | |
Proved developed and undeveloped reserves—Oil | | | | | | | | | |
| (thousands of barrels) | | | | | | |
At January 1 | | 142,635 | | | 147,954 | | | 148,663 | |
Changes in reserves: | | | | | | | | | |
Extensions, discoveries and other additions | | 5,400 | | | 7,699 | | | 7,887 | |
Revisions of previous estimates(1) | | 65,146 | | | (1,749 | ) | | 5,069 | |
Production | | (14,543 | ) | | (11,117 | ) | | (9,436 | ) |
Purchases of oil in place | | 69 | | | 666 | | | 380 | |
Sales of oil in place | | (1,423 | ) | | (818 | ) | | (4,609 | ) |
At December 31 | | 197,284 | | | 142,635 | | | 147,954 | |
Proved developed reserves—Oil | | | | | | | | | |
At January 1 | | 100,780 | | | 53,776 | | | 57,570 | |
At December 31 | | 144,417 | | | 100,780 | | | 53,776 | |
| (1) | | The 2005 revision is primarily due to an increase in plant liquids that resulted from a contractual change for a portion of our gas processed by third parties. We now take title to and market the natural gas liquids extracted from this gas. |
Standardized Measure of Discounted Future Net Cash Flows and Changes Therein
The following tabulation has been prepared in accordance with the FASB’s rules for disclosure of a standardized measure of discounted future net cash flows relating to proved gas and oil reserve quantities that we own:
| | | | | | | | | |
| | | 2005 | | 2004 | | 2003 |
| (millions) | | | | |
Future cash inflows(1) | | $ | 54,510 | | $ | 32,115 | | $ | 29,049 |
Less: | | | | | | | | | |
Future development costs(2) | | | 1,795 | | | 1,436 | | | 1,325 |
Future production costs | | | 6,534 | | | 4,676 | | | 4,198 |
Future income tax expense | | | 16,559 | | | 8,856 | | | 7,615 |
Future net cash flows | | | 29,622 | | | 17,147 | | | 15,911 |
Less annual discount (10% a year) | | | 16,573 | | | 9,286 | | | 8,632 |
Standardized measure of discounted future net cash flows | | $ | 13,049 | | $ | 7,861 | | $ | 7,279 |
| (1) | | Amounts exclude the effect of derivative instruments designated as hedges of future sales of production at year-end. |
| (2) | | Estimated future development costs, excluding abandonment, for proved undeveloped reserves are estimated to be $545 million, $315 million and $163 million for 2006, 2007 and 2008, respectively. |
In the foregoing determination of future cash inflows, sales prices for gas and oil were based on contractual arrangements or market prices at year-end. Future costs of developing and producing the proved gas and oil reserves reported at the end of each year shown were based on costs determined at each such year-end, assuming the continuation of existing economic conditions. Future income taxes were computed by applying the appropriate year-end or future statutory tax rate to future pre-tax net cash flows, less the tax basis of the properties involved, and giving effect to tax deductions, permanent differences and tax credits.
It is not intended that the FASB’s standardized measure of discounted future net cash flows represent the fair market value of our proved reserves. We caution that the disclosures shown are based on estimates of proved reserve quantities and future production schedules which are inherently imprecise and subject to revision, and the 10% discount rate is arbitrary. In addition, costs and prices as of the measurement date are used in the determinations, and no value may be assigned to probable or possible reserves.
Notes to Consolidated Financial Statements, Continued
The following tabulation is a summary of changes between the total standardized measure of discounted future net cash flows at the beginning and end of each year:
| | | | | | | | | | | | |
| | | 2005 | | | 2004 | | | 2003 | |
| (millions) | | | | | | |
Standardized measure of discounted future net cash flows at January 1 | | $ | 7,861 | | | $ | 7,279 | | | $ | 6,166 | |
Changes in the year resulting from: | | | | | | | | | | | | |
Sales and transfers of gas and oil produced during the year, less production costs | | | (2,244 | ) | | | (1,647 | ) | | | (1,460 | ) |
Prices and production and development costs related to future production | | | 7,459 | | | | 1,327 | | | | 511 | |
Extensions, discoveries and other additions, less production and development costs | | | 1,090 | | | | 948 | | | | 1,677 | |
Previously estimated development costs incurred during the year | | | 281 | | | | 162 | | | | 177 | |
Revisions of previous quantity estimates | | | 26 | | | | (102 | ) | | | (522 | ) |
Accretion of discount | | | 1,187 | | | | 1,075 | | | | 908 | |
Income taxes | | | (3,189 | ) | | | (551 | ) | | | (554 | ) |
Other purchases and sales of proved reserves in place, net | | | 71 | | | | (386 | ) | | | 72 | |
Other (principally timing of production) | | | 507 | | | | (244 | ) | | | 304 | |
Standardized measure of discounted future net cash flows at December 31 | | $ | 13,049 | | | $ | 7,861 | | | $ | 7,279 | |
Note 26. Quarterly Financial Data (Unaudited)
A summary of our quarterly results of operations for the years ended December 31, 2005 and 2004 follows. Amounts shown reflect all adjustments, consisting of only normal recurring accruals, necessary in the opinion of management for a fair statement of the results for the interim periods. Because a major portion of the gas sold or transported by our distribution operations is ultimately used for space heating, both revenue and earnings are subject to seasonal fluctuations. Seasonal fluctuations may be further influenced by the timing of rate relief granted under regulation to compensate for the increased cost of providing service to customers.
| | | | | | | | | | | | | |
| | | 2005 |
| | | First
Quarter | | Second
Quarter | | Third
Quarter | | | Fourth
Quarter |
| (millions) | | | | | | | | | |
Operating revenue | | $ | 2,376 | | $ | 1,577 | | $ | 1,477 | | | $ | 2,642 |
Income (loss) from operations | | | 501 | | | 436 | | | (404 | ) | | | 534 |
Income (loss) before cumulative effect of change in accounting principle | | | 287 | | | 251 | | | (299 | ) | | | 316 |
Net income (loss) | | | 287 | | | 251 | | | (299 | ) | | | 314 |
| | | | | | | | | | | | | | |
| | | 2004 |
| | | First
Quarter | | Second
Quarter | | Third
Quarter | | | Fourth
Quarter |
| (millions) | | | | | | | | | |
Operating revenue | | $ | 2,083 | | $ | 1,305 | | $ | 1,252 | | | $ | 1,941 |
Income from operations | | | 495 | | | 326 | | | 189 | | | | 456 |
Net income | | | 311 | | | 182 | | | 100 | | | | 274 |
Our 2005 results include the impact of the following significant items:
| · | | First quarter results include $31 million of after-tax losses related to the discontinuance of hedge accounting for certain oil hedges, resulting from a delay in reaching anticipated production levels in the Gulf of Mexico, and subsequent changes in the fair value of those hedges and a $28 million after-tax benefit due to the recognition of business interruption insurance revenue associated with the recovery of delayed gas and oil production due to Hurricane Ivan. |
| · | | Second quarter results include an $86 million after-tax benefit due to the final settlement of business interruption insurance claims associated with Hurricane Ivan. |
| · | | Third quarter results include a $357 million after-tax loss related to the discontinuance of hedge accounting for certain gas and oil hedges, resulting from an interruption of gas and oil production in the Gulf of Mexico caused by Hurricanes Katrina and Rita, and subsequent changes in the fair value of those hedges. |
| · | | Fourth quarter results include a $77 million after-tax benefit reflecting the impact of a decrease in gas and oil prices on hedges that were de-designated following Hurricanes Katrina and Rita. |
48
Notes to Consolidated Financial Statements, Continued
Our 2004 results include the impact of the following significant items:
| · | | First quarter results reflect an $18 million benefit for an adjustment to the carrying amount of CNGI’s investment in an Australian pipeline business based on an agreement, whereby a portion of the pipeline assets was sold for an amount in excess of what we had previously estimated. |
| · | | Second quarter results reflect an increase in an income tax valuation allowance related to CNGI investments, partially offset by an $8 million gain on the sale of a portion of CNGI’s investment in an Australian pipeline business in June 2004. |
| · | | Third quarter results include a $61 million after-tax loss related to the discontinuance of hedge accounting for certain oil hedges, resulting from an interruption of oil production in the Gulf of Mexico caused by Hurricane Ivan, and subsequent changes in the fair value of those hedges in the third quarter. |
| · | | Fourth quarter results include a $61 million after-tax benefit due to the recognition of business interruption insurance revenue associated with the recovery of delayed gas and oil production due to Hurricane Ivan. |
Note 27. Subsequent Event
On March 1, 2006, we entered into an agreement with Equitable Resources, Inc., to sell two of our wholly-owned regulated gas distribution subsidiaries, The Peoples Natural Gas Company and Hope Gas, Inc, for $969.6 million plus adjustments to reflect capital expenditures and changes in working capital. The transaction is expected to close by the first quarter of 2007, subject to state regulatory approvals in Pennsylvania and West Virginia, as well as approval under the federal Hart-Scott-Rodino Act. The carrying amounts of the major classes of assets and liabilities to be disposed of are as follows:
| | | | | | |
| At December 31, | | 2005 | | 2004 |
(millions) | | | | | | |
Assets | | | | | | |
Current assets | | $ | 438 | | $ | 291 |
Property, plant and equipment, net | | | 694 | | | 662 |
Deferred charges and other assets | | | 107 | | | 89 |
Total assets | | $ | 1,239 | | $ | 1,042 |
| | | | | | | |
Liabilities | | | | | | |
Current liabilities | | $ | 323 | | $ | 200 |
Deferred credits and other liabilities | | | 209 | | | 194 |
Total liabilities | | $ | 532 | | $ | 394 |
Item 9. Changes in and Disagreements with Accountants on Accounting and Financial Disclosure
None.
Item 9A. Controls and Procedures
Senior management, including our Chief Executive Officer and Chief Financial Officer, evaluated the effectiveness of our Company’s disclosure controls and procedures as of the end of the period covered by this report. Based on this evaluation process, our Chief Executive Officer and Chief Financial Officer have concluded that our Company’s disclosure controls and procedures are effective. There were no changes in our Company’s internal control over financial reporting that occurred during the last fiscal quarter that have materially affected, or are reasonably likely to materially affect, our Company’s internal control over financial reporting.
On December 31, 2003, we adopted FIN 46R for our interests in special purpose entities referred to as SPEs. As a result, we have included in our consolidated financial statements the SPE described in Note 3 to the Consolidated Financial Statements. Our Consolidated Balance Sheet as of December 31, 2005 reflects $208 million of net property, plant and equipment and deferred charges and $234 million of related debt attributable to the SPE. As this SPE is owned by unrelated parties, we do not have the authority to dictate or modify, and therefore cannot assess, the disclosure controls and procedures in place at this entity.
Item 9B. Other Information
None.
49
Part III
Item 10. Directors and Executive Officers of the Registrant
Omitted pursuant to General Instruction I.(2)(c).
We have adopted a Code of Ethics that applies to our principal executive, financial and accounting officers as well as our employees. This Code of Ethics is available at the corporate governance section of Dominion’s website (www.dom.com). You may also request a copy of the Code of Ethics, free of charge, by writing or telephoning us at: Corporate Secretary, 120 Tredegar Street, Richmond, Virginia 23219, Telephone (804) 819-2000. Any waivers or changes to our Code of Ethics will be posted on the Dominion website.
Item 11. Executive Compensation
Omitted pursuant to General Instruction I.(2)(c).
Item 12. Security Ownership of Certain Beneficial Owners and Management and Related Stockholder Matters
Omitted pursuant to General Instruction I.(2)(c).
Item 13. Certain Relationships and Related Transactions
Omitted pursuant to General Instruction I.(2)(c).
Item 14. Principal Accountant Fees and Services
The following table presents fees paid to Deloitte & Touche LLP for the fiscal year ended December 31, 2005 and 2004.
| | | | | | |
| Type of Fees | | 2005 | | 2004 |
| (millions) | | | | |
Audit fees | | $ | 1.51 | | $ | 1.33 |
Audit-related | | | 0.40 | | | 0.28 |
Tax fees | | | 0.02 | | | 0.05 |
All other fees | | | — | | | — |
| | | $ | 1.93 | | $ | 1.66 |
Audit Fees are for the audit and review of our financial statements in accordance with generally accepted auditing standards, including comfort letters, statutory and regulatory audits, consents and services related to Securities and Exchange Commission matters.
Audit-Related Fees are for assurance and related services that are related to the audit or review of our financial statements, including employee benefit plan audits, due diligence services and financial accounting and reporting consultation.
Tax Fees are for tax compliance services.
In 2003, the Board adopted a pre-approval policy for Deloitte & Touche LLP services and fees. Attached to the policy is a schedule that details the services to be provided and an estimated range of fees to be charged for such services. In December 2005, Dominion’s Audit Committee approved the services and fees for 2006.
Part IV
Item 15. Exhibits and Financial Statement Schedules
(a) Certain documents are filed as part of this Form 10-K and are incorporated by reference and found on the pages noted.
1. Financial Statements
See Index on page 18.
2. Financial Statement Schedules
| | |
| | | Page |
Report of Independent Registered Public Accounting Firm | | 53 |
Schedule I—Condensed Financial Information of Registrant | | 54 |
All other schedules are omitted because they are not applicable, or the required information is either not material or is shown in the financial statements or the related notes.
3. Exhibits
| | |
| 3.1 — | | Certificate of Incorporation of Consolidated Natural Gas Company (Exhibit (3A)(i) to Form 10-K for the fiscal year ended December 31, 1999, File No. 1-3196, incorporated by reference). |
| |
| 3.2 — | | Certificate of Amendment of Certificate of Incorporation, dated January 28, 2000 (Exhibit (3A)(ii) to Form 10-K for the fiscal year ended December 31, 1999, File No. 1-3196, incorporated by reference). |
| |
| 3.3 — | | Bylaws as in effect on December 15, 2000 (Exhibit 3B to Form 10-K for the fiscal year ended December 31, 2000, File No. 1-3196, incorporated by reference). |
| |
| 4 — | | Consolidated Natural Gas Company agrees to furnish to the Securities and Exchange Commission upon request any other instrument with respect to long-term debt as to which the total amount of securities authorized does not exceed 10% of its total consolidated assets. |
| |
| 4.1 — | | Indenture, dated as of May 1, 1971, between Consolidated Natural Gas Company and JP Morgan Chase Bank (formerly The Chase Manhattan Bank and Manufacturers Hanover Trust Company) (Exhibit (5) to Certificate of Notification at Commission File No. 70-5012, incorporated by reference); Fifteenth Supplemental Indenture dated as of October 1, 1989 (Exhibit (5) to Certificate of Notification at Commission File No. 70-7651, incorporated by reference); Seventeenth Supplemental Indenture dated as of August 1, 1993 (Exhibit (4) to Certificate of Notification at Commission File No. 70-8167, incorporated by reference); Eighteenth Supplemental Indenture dated as of December 1, 1993 (Exhibit (4) to Certificate of Notification at Commission File No. 70-8167, incorporated by reference); Nineteenth Supplemental Indenture dated as of January 28, 2000 (Exhibit (4A)(iii), Form 10-K for the fiscal year ended December 31, 1999, File No. 1-3196, incorporated by reference); Twentieth Supplemental Indenture dated as of March 19, 2001 (Exhibit 4, Form 10-Q for the quarter ended September 30, 2003, File No. 1-3196, incorporated by reference). |
| |
| 4.2 — | | Indenture, dated as of April 1, 1995, between Consolidated Natural Gas Company and The Bank of New York (as successor trustee to United States Trust Company of New York) (Exhibit (4) to Certificate of Notification at Commission File No. 70-8107); First Supplemental Indenture dated January 28, 2000 (Exhibit (4 A)(ii), Form 10-K for the fiscal year ended December 31, 1999, File No. 1-3196, incorporated by reference); Securities Resolution No. 1 effective as of April 12, 1995 (Exhibit 2 to Form 8-A filed April 21, 1995 under File No. 1-3196 and relating to the 7 3/8% Debentures Due April 1, 2005); Securities Resolution No. 2 effective as of October 16, 1996 (Exhibit 2 to Form 8-A filed October 18, 1996 under file No. 1-3196 and relating to the 6 7/8% Debentures Due October 15, 2026); Securities Resolution No. 3 effective as of December 10, 1996 (Exhibit 2 to Form 8-A filed December 12, 1996 under file No. 1-3196 and relating to the 6 5/8% Debentures Due December 1, 2008); Securities Resolution No. 4 effective as of December 9, 1997 (Exhibit 2 to Form 8-A filed December 12, 1997 under file No. 1-3196 and relating to the 6.80% Debentures Due December 15, 2027); Securities Resolution No. 5 effective as of October 20, 1998 (Exhibit 2 to Form 8-A filed October 22, 1998 under file No. 1-3196 and relating to the 6% Debentures Due October 15, 2010); Securities Resolution No. 6 effective as of September 21, 1999 (Exhibit 4A(iv), Form 10-K for the fiscal year ended December 31, 1999, File No. 1-3196, and relating to the 7 1/4% Notes Due October 1, 2004, incorporated by reference). |
| |
| 4.3 — | | Indenture, dated April 1, 2001, between Consolidated Natural Gas Company and Bank One Trust Company, National Association (Exhibit 4.1, Form S-3 File No. 333-52602, as filed on December 22, 2000, incorporated by reference); as supplemented by the Form of First Supplemental Indenture, dated April 1, 2001 (Exhibit 4.2, Form 8-K, File dated April 12, 2001, File No. 1-3196 incorporated by reference); Second Supplemental Indenture, dated October 25, 2001 (Exhibit 4.1, Form 8-K, dated October 23, 2001, File No. 1-3196, incorporated by reference); Third Supplemental Indenture, dated October 25, 2001 (Exhibit 4.3, Form 8-K, dated October 23, 2001, File No. 1-3196, incorporated by reference); Fourth Supplemental Indenture, dated May 1, 2002 (Exhibit 4.4, Form 8-K, dated May 22, 2002, Form 1-3196, incorporated by reference); Form of Fifth Supplemental Indenture (Exhibit 4.2, Form 8-K, filed November 25, 2003, Form 1-3196, incorporated by reference); Form of Sixth Supplemental Indenture (Exhibit 4.2, Form 8-K filed November 16, 2004, File No. 1-3196, incorporated by reference). |
| |
| 4.4 — | | Form of Indenture for Junior Subordinated Debentures, dated October 1, 2001, between Consolidated Natural Gas Company and Bank One Trust Company, National Association (Exhibit 4.2, Form S-3 Registration No. 333-52602, as filed on December 22, 2000, incorporated by reference); as supplemented by the First Supplemental Indenture, dated October 23, 2001 (Exhibit 4.7, Form 8-K, dated October 16, 2001, File No. 1-3196, incorporated by reference). |
| | |
| 4.5 — | | Indenture, dated as of December 11, 1997, between Louis Dreyfus Natural Gas Corp., Dominion Oklahoma Texas Exploration & Production, Inc., and La Salle Bank National Association (formerly LaSalle National Bank) (Exhibit 4.14, Form 10-K for the fiscal year ended December 31, 2001, File No. 1-8489, incorporated by reference); as supplemented by the First Supplemental Indenture, dated as of November 1, 2001 (Exhibit 4.9, Form 10-Q for the quarter ended September 30, 2001, incorporated by reference). |
| |
| 10.1 — | | $2.5 billion Five-Year Revolving Credit Agreement, dated as of May 12, 2005, among Dominion Resources, Inc., Virginia Electric and Power Company, Consolidated Natural Gas Company and JPMorgan Chase Bank, N.A., as Administrative Agent, Citibank, N.A., as Syndication Agent, Barclays Bank PLC, The Bank of Nova Scotia and Wachovia Bank, National Association, as Co-Documentation Agents, and other lenders as named herein (Exhibit 10.1, Form 8-K filed May 18, 2005, File No. 1-3196, incorporated by reference). |
| |
| 10.2 — | | $1.75 billion Five-Year Credit Agreement, dated as of August 17, 2005, among Consolidated Natural Gas Company and Barclays Bank PLC as Administrative Agent and Syndication Agent, KeyBank National Association as Syndication Agent, SunTrust Bank, The Bank of Nova Scotia and ABN Amro Bank NV as Co-Documentation Agents, and other lenders as named (Exhibit 10.1, Form 8-K filed August 18, 2005, File No. 1-3196, incorporated by reference). |
| |
| 10.3 — | | $1.9 billion Credit Agreement, dated as of January 11, 2006 among Dominion Resources, Inc., Consolidated Natural Gas Company, Wachovia Bank, National Association, as Administrative Agent, JP Morgan Chase Bank, N.A., as Syndication Agent, Barclays Bank PLC, as Documentation Agent, and other lenders as named therein (Exhibit 10.1, Form 8-K, filed January 13, 2006, File No. 1-3196, incorporated by reference). |
| |
| 12 — | | Ratio of earnings to fixed charges (filed herewith). |
| |
| 23.1 — | | Consent of Deloitte & Touche LLP (filed herewith). |
| |
| 23.2 — | | Consent of Ryder Scott Company, L.P. (filed herewith). |
| |
| 31.1 — | | Certification by Registrant’s Chief Executive Officer pursuant to Section 302 of the Sarbanes-Oxley Act of 2002 (filed herewith). |
| |
| 31.2 — | | Certification by Registrant’s Chief Financial Officer pursuant to Section 302 of the Sarbanes-Oxley Act of 2002 (filed herewith). |
| |
| 32 — | | Certification to the Securities and Exchange Commission by Registrant’s Chief Executive Officer and Chief Financial Officer, as required by Section 906 of the Sarbanes-Oxley Act of 2002 (furnished herewith). |
52
Report of Independent Registered Public Accounting Firm
To the Shareholder and Board of Directors of
Consolidated Natural Gas Company
We have audited the consolidated financial statements of Consolidated Natural Gas Company (a wholly-owned subsidiary of Dominion Resources, Inc.) and subsidiaries (the “Company”) as of December 31, 2005 and 2004, and for each of the three years in the period ended December 31, 2005, and have issued our report thereon dated March 1, 2006 (which report expresses an unqualified opinion and includes an explanatory paragraph as to changes in accounting principles for: conditional asset retirement obligations in 2005 and asset retirement obligations, derivative contracts not held for trading purposes, and the consolidation of variable interest entities in 2003); such report is included elsewhere in this Form 10-K. Our audits also included the financial statement schedule of the Company listed in Item 15. This financial statement schedule is the responsibility of the Company’s management. Our responsibility is to express an opinion based on our audits. In our opinion, such financial statement schedule, when considered in relation to the basic consolidated financial statements taken as a whole, presents fairly, in all material respects, the information set forth therein.
Consolidated Natural Gas Company (Parent Company)
Schedule I—Condensed Financial Information of Registrant
Condensed Statements of Income
| | | | | | | | | | | | |
| Year Ended December 31, | | 2005 | | | 2004 | | | 2003 | |
| (millions) | | | | | | | | | |
Operating Expenses | | $ | 3 | | | $ | 1 | | | $ | (1 | ) |
Income (loss) from operations | | | (3 | ) | | | (1 | ) | | | 1 | |
Other income: | | | | | | | | | | | | |
Affiliated interest income | | | 203 | | | | 180 | | | | 182 | |
Other | | | 6 | | | | 7 | | | | 7 | |
Total other income | | | 209 | | | | 187 | | | | 189 | |
Interest and related charges | | | 203 | | | | 197 | | | | 199 | |
Income (loss) before income taxes | | | 3 | | | | (11 | ) | | | (9 | ) |
Income tax benefit | | | 2 | | | | 5 | | | | 12 | |
Equity in earnings of affiliates | | | 548 | | | | 873 | | | | 635 | |
Net Income | | $ | 553 | | | $ | 867 | | | $ | 638 | |
The accompanying notes are an integral part of the Condensed Financial Statements.
54
Consolidated Natural Gas Company (Parent Company)
Schedule I—Condensed Financial Information of Registrant
Condensed Balance Sheets
| | | | | | | | |
| At December 31, | | 2005 | | | 2004 | |
| (millions) | | | | | | |
| ASSETS | | | | | | | | |
| Current Assets | | | | | | | | |
Receivables and advances due from affiliates | | $ | 1,710 | | | $ | 1,647 | |
Loans to affiliates | | | 14 | | | | 15 | |
Affiliated derivative assets | | | 285 | | | | 186 | |
Other | | | 1 | | | | 16 | |
Prepayments | | | 9 | | | | 2 | |
Total current assets | | | 2,019 | | | | 1,866 | |
| Investments | | | | | | | | |
Investment in affiliates | | | 3,697 | | | | 3,891 | |
Loans to affiliates | | | 2,188 | | | | 2,202 | |
Other | | | 94 | | | | 86 | |
Total investments | | | 5,979 | | | | 6,179 | |
| Deferred Charges and Other Assets | | | | | | | | |
Affiliated derivative assets | | | 241 | | | | 102 | |
Other | | | 38 | | | | 37 | |
Total charges and other assets | | | 279 | | | | 139 | |
Total assets | | $ | 8,277 | | | $ | 8,184 | |
| | |
| LIABILITIES AND SHAREHOLDER’S EQUITY | | | | | | | | |
| Current Liabilities | | | | | | | | |
Securities due within a year | | $ | 500 | | | $ | 150 | |
Short-term debt | | | 187 | | | | — | |
Payables and short-term borrowings due to affiliates | | | 7 | | | | 3 | |
Derivative liabilities | | | 286 | | | | 186 | |
Other | | | 46 | | | | 40 | |
Total current liabilities | | | 1,026 | | | | 379 | |
| Long-Term Debt | | | | | | | | |
Long-term debt | | | 2,508 | | | | 3,014 | |
Notes payable to affiliates | | | 206 | | | | 206 | |
Total long-term debt | | | 2,714 | | | | 3,220 | |
| Deferred Credits and Other Liabilities | | | | | | | | |
Derivative liabilities | | | 243 | | | | 102 | |
Other | | | 3 | | | | 3 | |
Total deferred credits and other liabilities | | | 246 | | | | 105 | |
Total liabilities | | | 3,986 | | | | 3,704 | |
| Common Shareholder’s Equity | | | | | | | | |
Common stock, no par value, 100 shares authorized and outstanding | | | 1,816 | | | | 1,816 | |
Other paid-in capital | | | 3,273 | | | | 2,520 | |
Retained earnings | | | 971 | | | | 993 | |
Accumulated other comprehensive loss | | | (1,769 | ) | | | (849 | ) |
Total common shareholder’s equity | | | 4,291 | | | | 4,480 | |
Total liabilities and shareholder’s equity | | $ | 8,277 | | | $ | 8,184 | |
The accompanying notes are an integral part of the Condensed Financial Statements.
55
Consolidated Natural Gas Company (Parent Company)
Schedule I—Condensed Financial Information of Registrant
Condensed Statements of Cash Flows
| | | | | | | | | | | | |
| Year Ended December 31, | | 2005 | | | 2004 | | | 2003 | |
| (millions) | | | | | | | | | |
Net Cash Provided by Operating Activities | | $ | 575 | | | $ | 448 | | | $ | 365 | |
Investing Activities | | | | | | | | | | | | |
Advances to (from) affiliates, net of repayments | | | (52 | ) | | | 108 | | | | 34 | |
Loans to affiliates | | | — | | | | (190 | ) | | | — | |
Repayment of loans by affiliates | | | 15 | | | | 272 | | | | 208 | |
Other | | | — | | | | (2 | ) | | | (2 | ) |
Net cash provided by (used in) investing activities | | | (37 | ) | | | 188 | | | | 240 | |
Financing Activities | | | | | | | | | | | | |
Issuance of long-term debt | | | — | | | | 400 | | | | 200 | |
Repayment of long-term debt | | | (150 | ) | | | (400 | ) | | | (150 | ) |
Short-term borrowings from parent, net | | | — | | | | — | | | | 37 | |
Issuance (repayment) of short-term debt, net | | | 187 | | | | (151 | ) | | | (246 | ) |
Dividends paid | | | (575 | ) | | | (482 | ) | | | (450 | ) |
Other | | | — | | | | (3 | ) | | | 4 | |
Net cash used in financing activities | | | (538 | ) | | | (636 | ) | | | (605 | ) |
Increase in cash and cash equivalents | | | — | | | | — | | | | —- | |
Cash and cash equivalents at beginning of the year | | | — | | | | — | | | | — | |
Cash and cash equivalents at end of the year | | $ | — | | | $ | — | | | $ | — | |
Supplemental Cash Flow Information | | | | | | | | | | | | |
Noncash transactions from investing and financing activities: | | | | | | | | | | | | |
Conversion of amounts receivable from subsidiaries to investment in subsidiaries | | $ | 750 | | | $ | 41 | | | $ | 4 | |
Conversion of short-term borrowings and other amounts payable to parent to other paid-in capital | | | 750 | | | | 41 | | | | 606 | |
The accompanying notes are an integral part of the Condensed Financial Statements.
56
Consolidated Natural Gas Company (Parent Company)
Schedule I—Condensed Financial Information of Registrant
Notes to Condensed Financial Statements
Note 1. Basis of Presentation
Pursuant to rules and regulations of the Securities and Exchange Commission (SEC), the unconsolidated condensed financial statements of Consolidated Natural Gas Company (the Company) do not reflect all of the information and notes normally included with financial statements prepared in accordance with accounting principles generally accepted in the United States of America. Therefore, these financial statements should be read in conjunction with the Consolidated Financial Statements and related notes included in the 2005 Form 10-K, Part II, Item 8.
Accounting for Subsidiaries—We have accounted for the earnings of our subsidiaries under the equity method in the unconsolidated condensed financial statements.
Income Taxes—We and our subsidiaries file a consolidated federal income tax return and participate in an intercompany tax allocation agreement with Dominion Resources, Inc. (Dominion) and its subsidiaries. Our current income taxes are based on our taxable income, determined on a separate company basis. Our Balance Sheets at December 31, 2005 and 2004, include current taxes payable to Dominion of $9 million and $4 million, respectively.
Note 2. Long-Term Debt
| | | | | | | | | |
| | | 2005
Weighted
Average
Coupon |
(1) | | | |
At December 31, | | | 2005 | | | 2004 | |
| (millions) | | | | | | | | | |
Unsecured Senior Notes: | | | | | | | | | |
5.375% to 7.375%, due 2005 to 2010 | | 5.74% | | | $ 850 | | | $1,000 | |
5.0% to 6.85%, due 2011 to 2027 | | 6.14% | | | 2,000 | | | 2,000 | |
6.875%, due 2026(2) | | | | | 150 | | | 150 | |
| | | | | | 3,000 | | | 3,150 | |
Junior Subordinated Notes Payable to Affiliated Trust 7.8%, due 2041 | | | | | 206 | | | 206 | |
| | | | | | 3,206 | | | 3,356 | |
Fair value hedge valuation(3) | | | | | 15 | | | 21 | |
Amount due within one year | | | | | (500 | ) | | (150 | ) |
Unamortized discount and premium, net | | | | | (7 | ) | | (7 | ) |
Total long-term debt | | | | | $2,714 | | | $3,220 | |
| (1) | | Represents weighted-average coupon rate for debt outstanding as of December 31, 2005. |
| (2) | | At the option of holders in October 2006, these notes are subject to redemption at 100% of the principal amount plus accrued interest. In the event of an early redemption, we have the intent and ability to refinance this security under our long-term credit facilities. Accordingly, this security remains classified as long-term debt in our Consolidated Balance Sheets. |
| (3) | | Represents changes in fair value of certain fixed-rate long-term debt associated with fair value hedges. |
Based on stated maturity dates rather than early redemption dates that could be elected by the instrument holders, the scheduled principal payments of long-term debt at December 31, 2005 were as follows (in millions):
| | | | | | | | | | | | |
| 2006 | | 2007 | | 2008 | | 2009 | | 2010 | | Thereafter | | Total |
$500 | | — | | $150 | | — | | $200 | | $2,356 | | $3,206 |
Our long-term debt agreements contain customary covenants and default provisions. As of December 31, 2005, there were no events of default under those covenants.
Note 3. Guarantees, Letters of Credit and Surety Bonds
Guarantees
As of December 31, 2005, we had issued the following types of guarantees on behalf of our subsidiaries:
| | | | |
| | | Stated
Limit | | Value(1) |
(millions) | | | | |
Subsidiary debt(2) | | $ 201 | | $ 201 |
Offshore drilling commitments | | 300 | | 300 |
Commodity transactions(3) | | 1,252 | | 767 |
Miscellaneous | | 343 | | 254 |
Total subsidiary obligations | | $2,096 | | $1,522 |
| (1) | | Represents the estimated portion of the guarantee’s stated limit that is utilized as of December 31, 2005 based upon prevailing economic conditions and fact patterns specific to each guarantee arrangement. For those guarantees related to obligations that are recorded as liabilities by our subsidiaries, the value includes the recorded amount. |
| (2) | | Guarantees of debt of Dominion Oklahoma Texas Exploration and Production Inc. In the event of default by this subsidiary, we would be obligated to repay such amounts. |
| (3) | | Guarantees of contract payments for certain subsidiaries involved in natural gas and oil production, natural gas delivery and energy marketing activities. These guarantees were provided to counterparties in order to facilitate physical and financial transactions in gas, pipeline capacity, transportation, oil, electricity and related commodities and services. If any of these subsidiaries fail to perform or pay under the contracts and the counterparties seek performance or payment, we would be obligated to satisfy such obligation. We receive similar guarantees from counterparties as collateral for credit extended by us. The value provided includes certain guarantees that do not have stated limits. |
Surety Bonds and Letters of Credit
At December 31, 2005, we had purchased $44 million of surety bonds and authorized the issuance of standby letters of credit by financial institutions of $2.6 billion. We enter into these arrangements to facilitate commercial transactions by our subsidiaries with third parties. As of December 31, 2005, no amounts had been presented for payment under the letters of credit.
57
Consolidated Natural Gas Company (Parent Company)
Schedule I—Condensed Financial Information of Registrant
Notes to Condensed Financial Statements, Continued
Indemnifications
As part of commercial contract negotiations in the normal course of business, we may sometimes agree to make payments to compensate or indemnify other parties for possible future unfavorable financial consequences resulting from specified events. The specified events may involve an adverse judgment in a lawsuit or the imposition of additional taxes due to a change in tax law or interpretation of the tax law. We are unable to develop an estimate of the maximum potential amount of future payments under these contracts because events that would obligate us have not yet occurred or, if any such event has occurred, we have not been notified of its occurrence. However, as of December 31, 2005, we believe future payments, if any, that could ultimately become payable under these contract provisions, would not have a material impact on our results of operations, cash flows or financial position.
Note 4. Dividend Restrictions
We received dividends from our consolidated subsidiaries in the amounts of $575 million, $481 million and $405 million in 2005, 2004 and 2003, respectively.
The Public Utility Holding Company Act of 1935 (1935 Act) and related regulations issued by the SEC impose restrictions on the transfer and receipt of funds by a registered holding company from its subsidiaries, including a general prohibition against loans or advances being made by the subsidiaries to benefit the registered holding company. Under the 1935 Act, registered holding companies and their subsidiaries may pay dividends only from retained earnings, unless the SEC specifically authorizes payments from other capital accounts. In response to a Dominion request, the SEC granted relief in 2000, authorizing payment of dividends by us from other capital accounts to Dominion in amounts of up to $1.6 billion, representing our retained earnings prior to Dominion’s acquisition of us. The SEC granted further relief in 2004, authorizing our nonutility subsidiaries to pay dividends out of capital or unearned surplus in situations where such subsidiary has received excess cash from an asset sale, engaged in a restructuring, or is returning capital to an associate company. We are not bound by the foregoing restrictions on dividends imposed by the 1935 Act as of February 8, 2006, the effective date on which such Act was repealed under the Energy Policy Act of 2005.
58
Signatures
Pursuant to the requirements of Section 13 or 15(d) of the Securities Exchange Act of 1934, the registrant has duly caused this report to be signed on its behalf by the undersigned, thereunto duly authorized.
| | |
CONSOLIDATED NATURAL GAS COMPANY |
| |
| By: | | /s/ THOMAS F. FARRELL, II
|
| | | (Thomas F. Farrell, II, Chairman of the Board of Directors, President and Chief Executive Officer) |
Date: March 2, 2006
Pursuant to the requirements of the Securities Exchange Act of 1934, this report has been signed below by the following persons on behalf of the registrant and in the capacities indicated on the 2nd day of March, 2006.
| | |
| Signature | | Title |
| |
/s/ THOMAS F. FARRELL, II
Thomas F. Farrell, II | | Chairman of the Board of Directors, President and Chief Executive Officer |
| |
/s/ THOMAS N. CHEWNING
Thomas N. Chewning | | Director, Executive Vice President and Chief Financial Officer |
| |
/s/ STEVEN A. ROGERS
Steven A. Rogers | | Vice President and Controller (Principal Accounting Officer) |
59