Exhibit_99.1
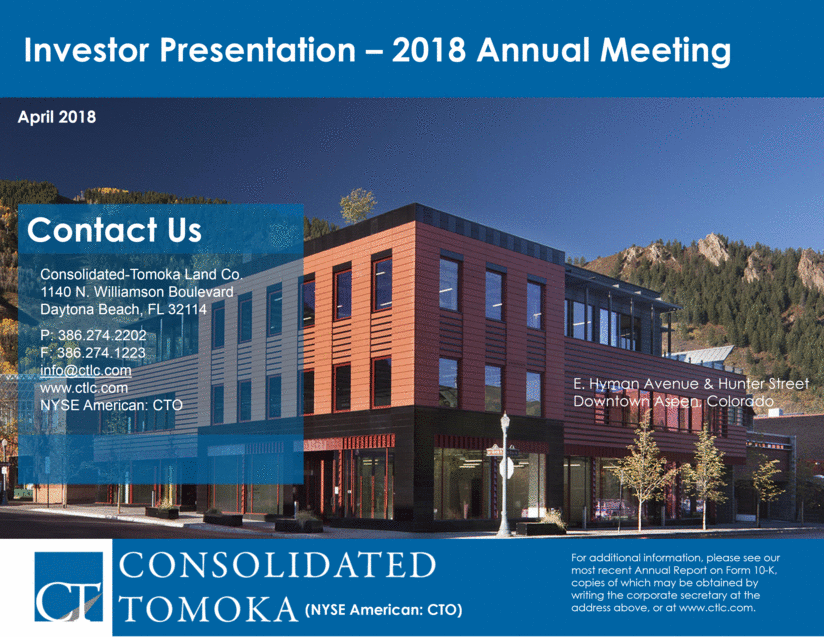
| Investor Presentation – 2018 Annual Meeting April 2018 E. Hyman Avenue & Hunter Street Downtown Aspen, Colorado (NYSE American: CTO) |
| 2 Forward–Looking Statements If we refer to “we,” “us,” “our,” or “the Company,” we mean Consolidated-Tomoka Land Co. and its consolidated subsidiaries. Certain statements contained in this presentation (other than statements of historical fact) are forward-looking statements. Words such as “believe,” “estimate,” “expect,” “intend,” “anticipate,” “will,” “could,” “may,” “should,” “plan,” “potential,” “predict,” “forecast,” “project,” and similar expressions and variations thereof identify certain of such forward-looking statements, which speak only as of the dates on which they were made. Although forward-looking statements are made based upon management’s expectations and beliefs concerning future Company actions and developments and their potential effect upon the Company, a number of factors could cause the Company’s actual results to differ materially from those set forth in the forward-looking statements. Such factors may include uncertainties associated with the closing of pending land transactions or other dispositions of assets, including the likelihood, timing, and final transaction terms thereof, the estimate of the cost of completing improvements affiliated with certain investments, the impact of permitting or other transactional activities on the total estimated gain for land sales, as well as the timing of the recognition of such gains, our ability to obtain necessary governmental approvals for our land transactions or to satisfy other closing conditions, the ability to execute share repurchase transactions, the completion of 1031 transactions, the ability for the Company to convert to a real estate investment trust, the costs of improvements for the Golf Operations assets, the ability to achieve certain leasing activity including the timing and terms thereof, as well as the uncertainties and risk factors discussed in our Annual Report on Form 10-K for the fiscal year ended December 31, 2017, filed with the Securities and Exchange Commission. There can be no assurance that future developments will be in accordance with management’s expectations or that the effect of future developments on the Company will be those anticipated by management. Endnote references (A) through (H) provided in this presentation are defined on Slide 46 Forward Looking Statements |
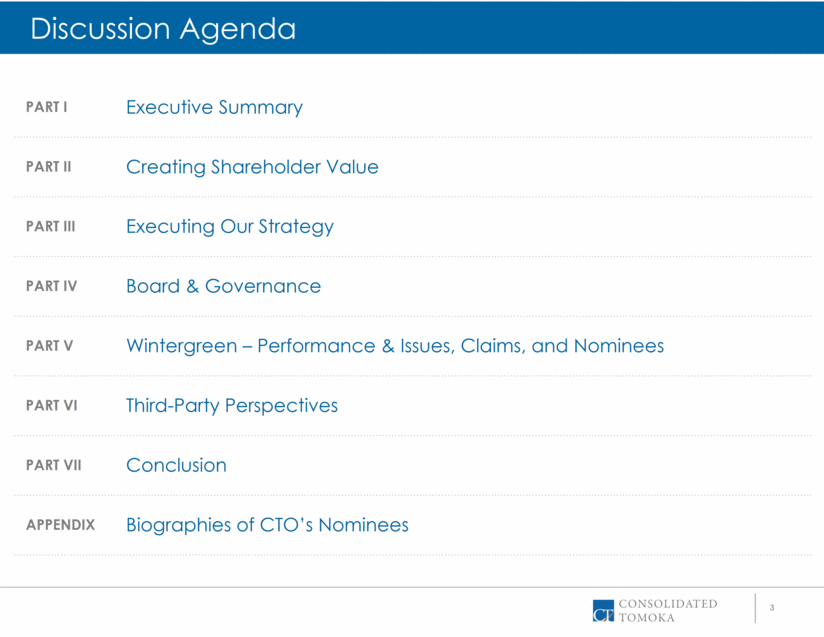
| 3 PART I Executive Summary PART II Creating Shareholder Value PART III Executing Our Strategy PART IV Board & Governance PART V Wintergreen – Performance & Issues, Claims, and Nominees PART VI Third-Party Perspectives PART VII Conclusion APPENDIX Biographies of CTO’s Nominees Discussion Agenda |
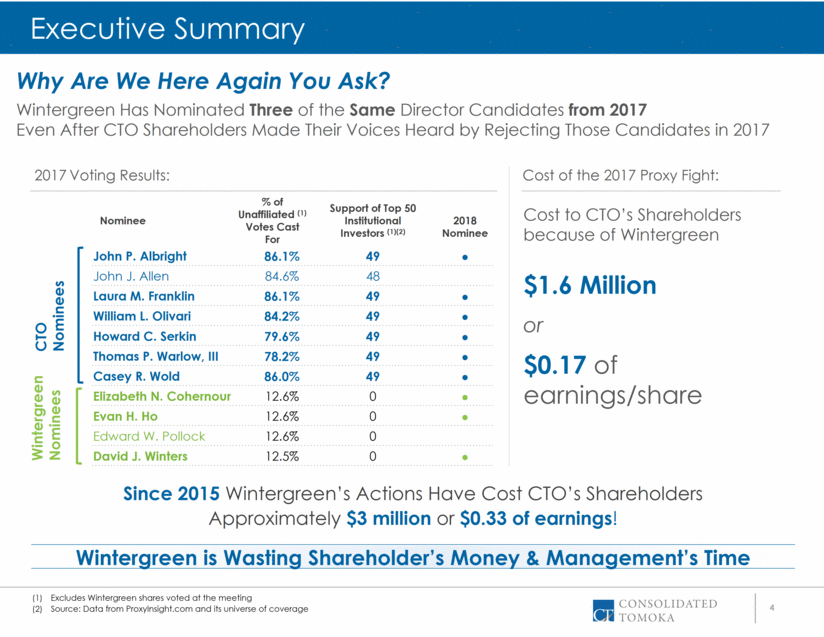
| 4 Wintergreen is Wasting Shareholder’s Money & Management’s Time Executive Summary Why Are We Here Again You Ask? Nominee % of Unaffiliated (1) Votes Cast For Support of Top 50 Institutional Investors (1)(2) 2018 Nominee John P. Albright 86.1% 49 John J. Allen 84.6% 48 Laura M. Franklin 86.1% 49 William L. Olivari 84.2% 49 Howard C. Serkin 79.6% 49 Thomas P. Warlow, III 78.2% 49 Casey R. Wold 86.0% 49 Elizabeth N. Cohernour 12.6% 0 Evan H. Ho 12.6% 0 Edward W. Pollock 12.6% 0 David J. Winters 12.5% 0 2017 Voting Results: Cost to CTO’s Shareholders because of Wintergreen $1.6 Million or $0.17 of earnings/share CTO Nominees Wintergreen Nominees Cost of the 2017 Proxy Fight: Wintergreen Has Nominated Three of the Same Director Candidates from 2017 Even After CTO Shareholders Made Their Voices Heard by Rejecting Those Candidates in 2017 Excludes Wintergreen shares voted at the meeting Source: Data from ProxyInsight.com and its universe of coverage Since 2015 Wintergreen’s Actions Have Cost CTO’s Shareholders Approximately $3 million or $0.33 of earnings! |
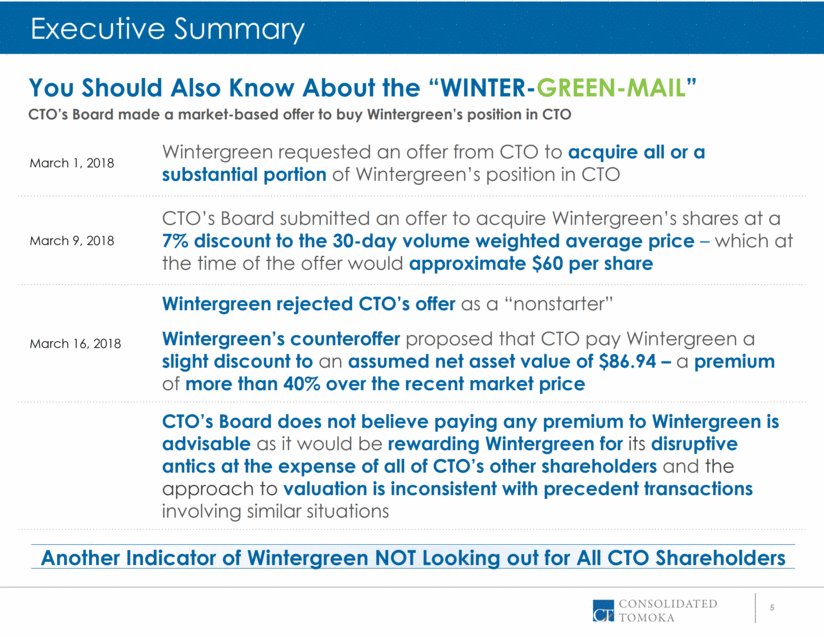
| 5 Another Indicator of Wintergreen NOT Looking out for All CTO Shareholders Executive Summary You Should Also Know About the “WINTER-GREEN-MAIL” CTO’s Board made a market-based offer to buy Wintergreen’s position in CTO March 1, 2018 Wintergreen requested an offer from CTO to acquire all or a substantial portion of Wintergreen’s position in CTO March 9, 2018 CTO’s Board submitted an offer to acquire Wintergreen’s shares at a 7% discount to the 30-day volume weighted average price – which at the time of the offer would approximate $60 per share March 16, 2018 Wintergreen rejected CTO’s offer as a “nonstarter” Wintergreen’s counteroffer proposed that CTO pay Wintergreen a slight discount to an assumed net asset value of $86.94 – a premium of more than 40% over the recent market price CTO’s Board does not believe paying any premium to Wintergreen is advisable as it would be rewarding Wintergreen for its disruptive antics at the expense of all of CTO’s other shareholders and the approach to valuation is inconsistent with precedent transactions involving similar situations |
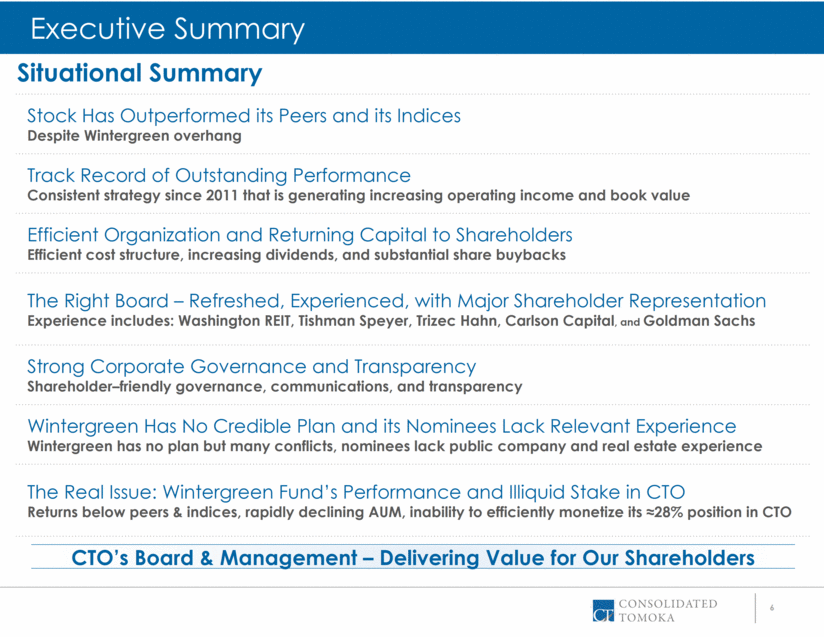
| 6 CTO’s Board & Management – Delivering Value for Our Shareholders Stock Has Outperformed its Peers and its Indices Despite Wintergreen overhang Track Record of Outstanding Performance Consistent strategy since 2011 that is generating increasing operating income and book value Efficient Organization and Returning Capital to Shareholders Efficient cost structure, increasing dividends, and substantial share buybacks The Right Board – Refreshed, Experienced, with Major Shareholder Representation Experience includes: Washington REIT, Tishman Speyer, Trizec Hahn, Carlson Capital, and Goldman Sachs Strong Corporate Governance and Transparency Shareholder–friendly governance, communications, and transparency Wintergreen Has No Credible Plan and its Nominees Lack Relevant Experience Wintergreen has no plan but many conflicts, nominees lack public company and real estate experience The Real Issue: Wintergreen Fund’s Performance and Illiquid Stake in CTO Returns below peers & indices, rapidly declining AUM, inability to efficiently monetize its ≈28% position in CTO Executive Summary Situational Summary |
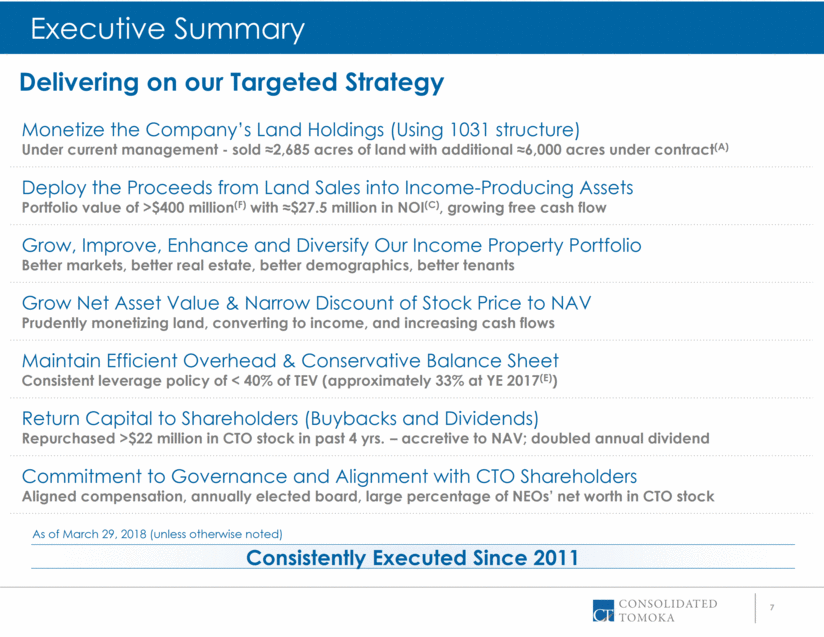
| 7 Consistently Executed Since 2011 Monetize the Company’s Land Holdings (Using 1031 structure) Under current management - sold ≈2,685 acres of land with additional ≈6,000 acres under contract(A) Deploy the Proceeds from Land Sales into Income-Producing Assets Portfolio value of >$400 million(F) with ≈$27.5 million in NOI(C), growing free cash flow Grow, Improve, Enhance and Diversify Our Income Property Portfolio Better markets, better real estate, better demographics, better tenants Grow Net Asset Value & Narrow Discount of Stock Price to NAV Prudently monetizing land, converting to income, and increasing cash flows Maintain Efficient Overhead & Conservative Balance Sheet Consistent leverage policy of < 40% of TEV (approximately 33% at YE 2017(E)) Return Capital to Shareholders (Buybacks and Dividends) Repurchased >$22 million in CTO stock in past 4 yrs. – accretive to NAV; doubled annual dividend Commitment to Governance and Alignment with CTO Shareholders Aligned compensation, annually elected board, large percentage of NEOs’ net worth in CTO stock Delivering on our Targeted Strategy Executive Summary As of March 29, 2018 (unless otherwise noted) |
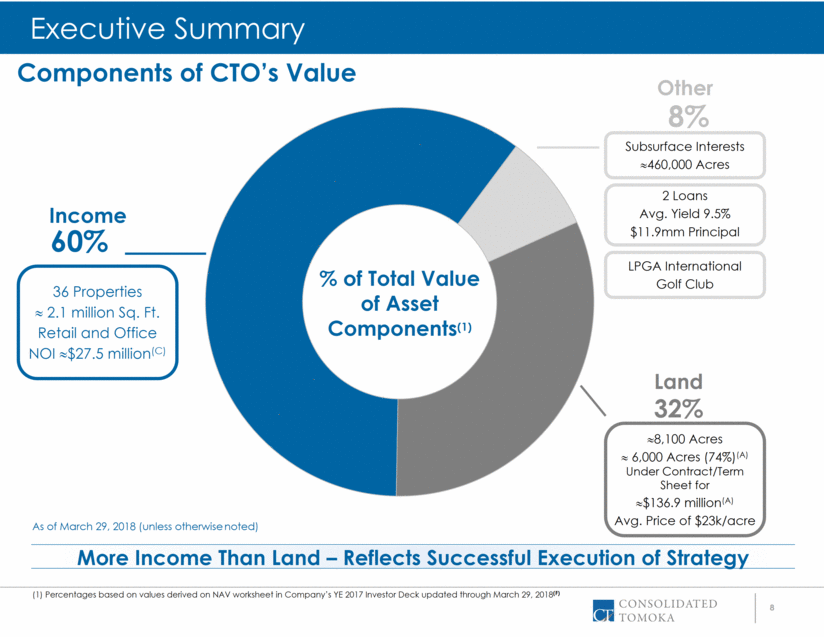
| 8 (1) Percentages based on values derived on NAV worksheet in Company’s YE 2017 Investor Deck updated through March 29, 2018(F) 36 Properties 2.1 million Sq. Ft. Retail and Office NOI $27.5 million(C) Subsurface Interests 460,000 Acres 2 Loans Avg. Yield 9.5% $11.9mm Principal 8,100 Acres 6,000 Acres (74%)(A) Under Contract/Term Sheet for $136.9 million(A) Avg. Price of $23k/acre % of Total Value of Asset Components(1) As of March 29, 2018 (unless otherwise noted) Income Land Other LPGA International Golf Club More Income Than Land – Reflects Successful Execution of Strategy Components of CTO’s Value Executive Summary 60% 8% 32% |
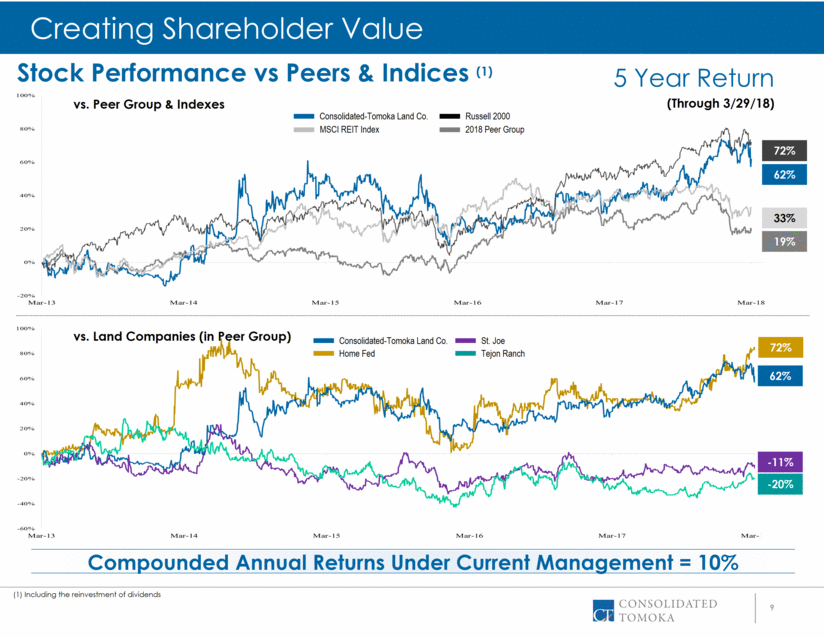
| 9 Compounded Annual Returns Under Current Management = 10% 5 Year Return (Through 3/29/18) vs. Peer Group & Indexes vs. Land Companies (in Peer Group) Consolidated-Tomoka Land Co. 2018 Peer Group MSCI REIT Index Russell 2000 62% 33% 72% 19% Creating Shareholder Value Stock Performance vs Peers & Indices (1) (1) Including the reinvestment of dividends Consolidated-Tomoka Land Co. St. Joe Home Fed Tejon Ranch 62% -20% 72% -11% |
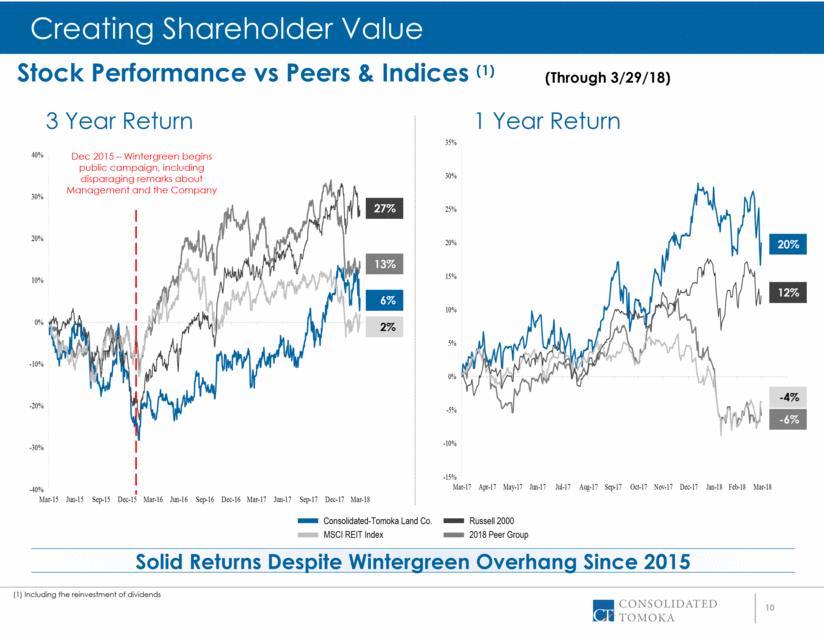
| 10 Solid Returns Despite Wintergreen Overhang Since 2015 3 Year Return 1 Year Return Creating Shareholder Value (Through 3/29/18) Consolidated-Tomoka Land Co. 2018 Peer Group MSCI REIT Index Russell 2000 Stock Performance vs Peers & Indices (1) (1) Including the reinvestment of dividends Dec 2015 – Wintergreen begins public campaign, including disparaging remarks about Management and the Company 6% 2% 27% 13% -4% 12% -6% 20% |
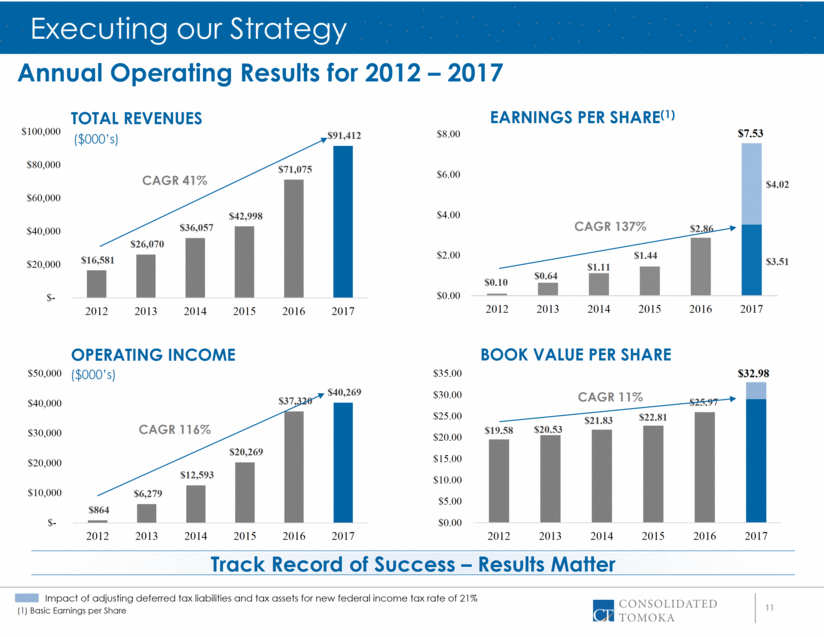
| OPERATING INCOME 11 CAGR 41% ($000’s) Annual Operating Results for 2012 – 2017 ($000’s) (1) Basic Earnings per Share Impact of adjusting deferred tax liabilities and tax assets for new federal income tax rate of 21% $7.53 $32.98 CAGR 137% CAGR 116% CAGR 11% Track Record of Success – Results Matter Executing our Strategy TOTAL REVENUES EARNINGS PER SHARE(1) BOOK VALUE PER SHARE $864 $6,279 $12,593 $20,269 $37,320 $40,269 $- $10,000 $20,000 $30,000 $40,000 $50,000 2012 2013 2014 2015 2016 2017 $16,581 $26,070 $36,057 $42,998 $71,075 $91,412 $- $20,000 $40,000 $60,000 $80,000 $100,000 2012 2013 2014 2015 2016 2017 $19.58 $20.53 $21.83 $22.81 $25.97 $0.00 $5.00 $10.00 $15.00 $20.00 $25.00 $30.00 $35.00 2012 2013 2014 2015 2016 2017 $0.00 $2.00 $4.00 $6.00 $8.00 2012 2013 2014 2015 2016 2017 $0.10 $0.64 $1.11 $1.44 $2.86 $3.51 $4.02 |
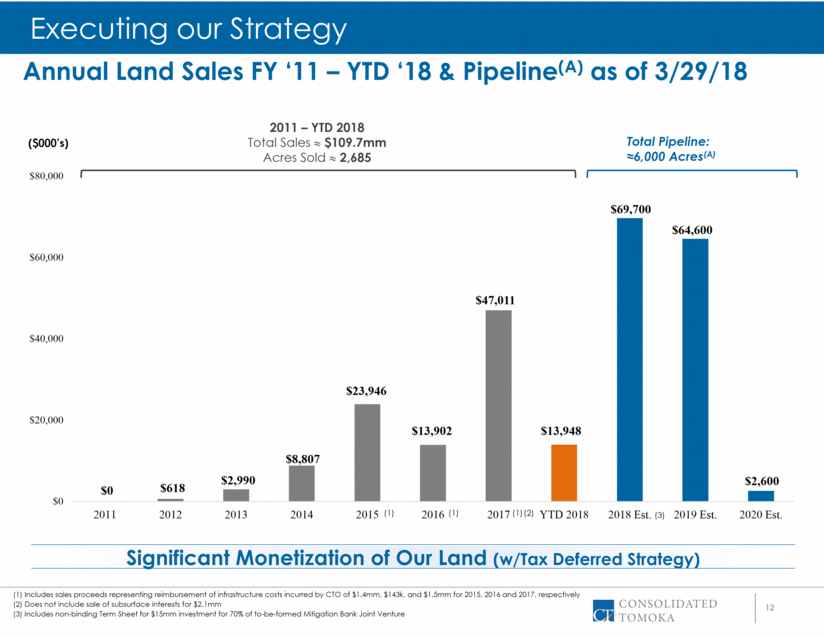
| 12 ($000’s) 2011 – YTD 2018 Total Sales $109.7mm Acres Sold 2,685 (1) Includes sales proceeds representing reimbursement of infrastructure costs incurred by CTO of $1.4mm, $143k, and $1.5mm for 2015, 2016 and 2017, respectively (2) Does not include sale of subsurface interests for $2.1mm (3) Includes non-binding Term Sheet for $15mm investment for 70% of to-be-formed Mitigation Bank Joint Venture (3) (2) Annual Land Sales FY ‘11 – YTD ‘18 & Pipeline(A) as of 3/29/18 Total Pipeline: ≈6,000 Acres(A) (1) (1) (1) Significant Monetization of Our Land (w/Tax Deferred Strategy) Executing our Strategy $0 $618 $2,990 $8,807 $23,946 $13,902 $47,011 $13,948 $69,700 $64,600 $2,600 $0 $20,000 $40,000 $60,000 $80,000 2011 2012 2013 2014 2015 2016 2017 YTD 2018 2018 Est. 2019 Est. 2020 Est. |
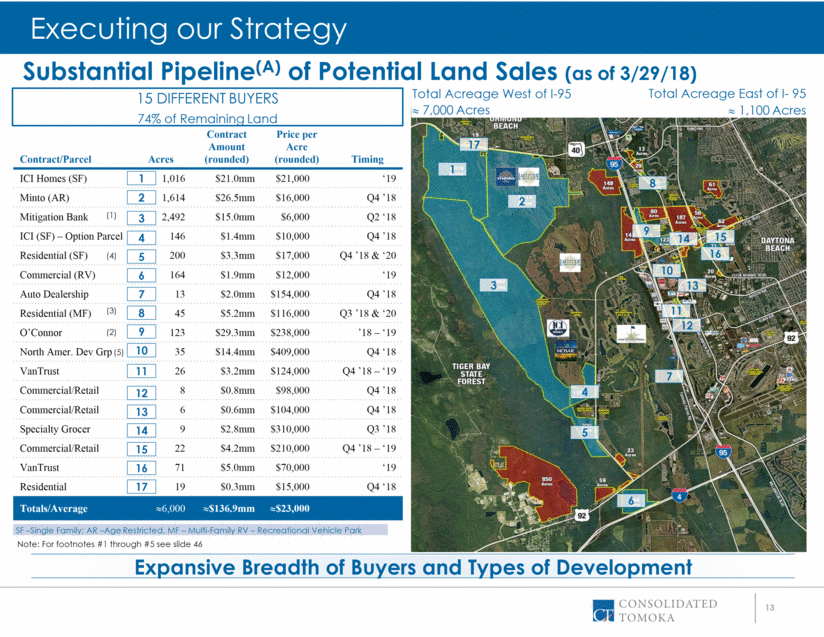
| 13 Expansive Breadth of Buyers and Types of Development Substantial Pipeline(A) of Potential Land Sales (as of 3/29/18) Executing our Strategy SF –Single Family; AR –Age Restricted, MF – Multi-Family RV – Recreational Vehicle Park Total Acreage East of I- 95 1,100 Acres Total Acreage West of I-95 7,000 Acres 1 12 2 3 4 8 9 11 10 5 Note: For footnotes #1 through #5 see slide 46 Contract/Parcel Acres Contract Amount (rounded) Price per Acre (rounded) Timing ICI Homes (SF) 1,016 $21.0mm $21,000 ‘19 Minto (AR) 1,614 $26.5mm $16,000 Q4 ’18 Mitigation Bank 2,492 $15.0mm $6,000 Q2 ‘18 ICI (SF) – Option Parcel 146 $1.4mm $10,000 Q4 ’18 Residential (SF) 200 $3.3mm $17,000 Q4 ’18 & ‘20 Commercial (RV) 164 $1.9mm $12,000 ‘19 Auto Dealership 13 $2.0mm $154,000 Q4 ’18 Residential (MF) 45 $5.2mm $116,000 Q3 ’18 & ‘20 O’Connor 123 $29.3mm $238,000 ’18 – ‘19 North Amer. Dev Grp 35 $14.4mm $409,000 Q4 ‘18 VanTrust 26 $3.2mm $124,000 Q4 ’18 – ‘19 Commercial/Retail 8 $0.8mm $98,000 Q4 ’18 Commercial/Retail 6 $0.6mm $104,000 Q4 ’18 Specialty Grocer 9 $2.8mm $310,000 Q3 ’18 Commercial/Retail 22 $4.2mm $210,000 Q4 ’18 – ‘19 VanTrust 71 $5.0mm $70,000 ‘19 Residential 19 $0.3mm $15,000 Q4 ‘18 Totals/Average 6,000 $136.9mm $23,000 6 7 13 14 15 16 17 (1) (3) (2) (4) 11 2 3 4 5 6 7 8 10 9 12 13 14 15 16 17 1 (5) 15 DIFFERENT BUYERS 74% of Remaining Land |
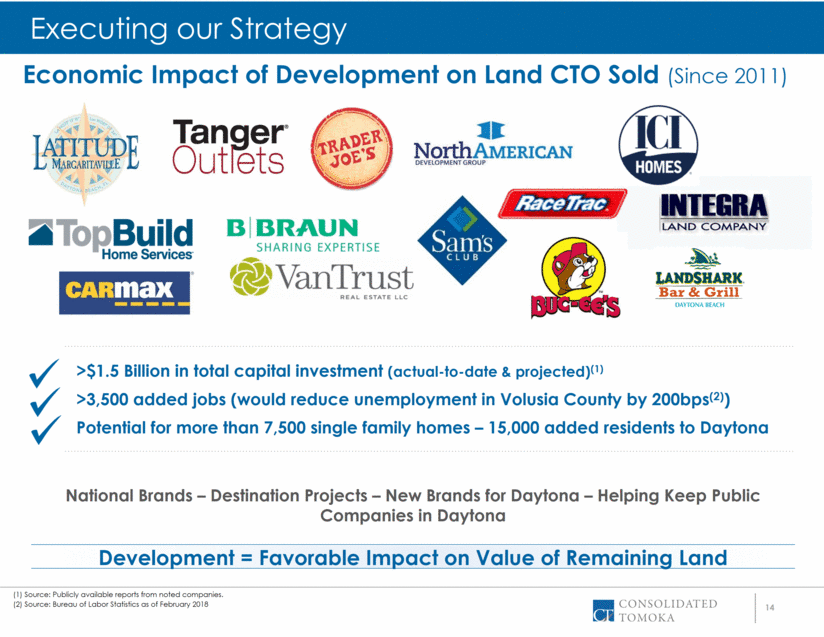
| 14 Economic Impact of Development on Land CTO Sold (Since 2011) Development = Favorable Impact on Value of Remaining Land Executing our Strategy >$1.5 Billion in total capital investment (actual-to-date & projected)(1) >3,500 added jobs (would reduce unemployment in Volusia County by 200bps(2)) Potential for more than 7,500 single family homes – 15,000 added residents to Daytona National Brands – Destination Projects – New Brands for Daytona – Helping Keep Public Companies in Daytona (1) Source: Publicly available reports from noted companies. (2) Source: Bureau of Labor Statistics as of February 2018 |
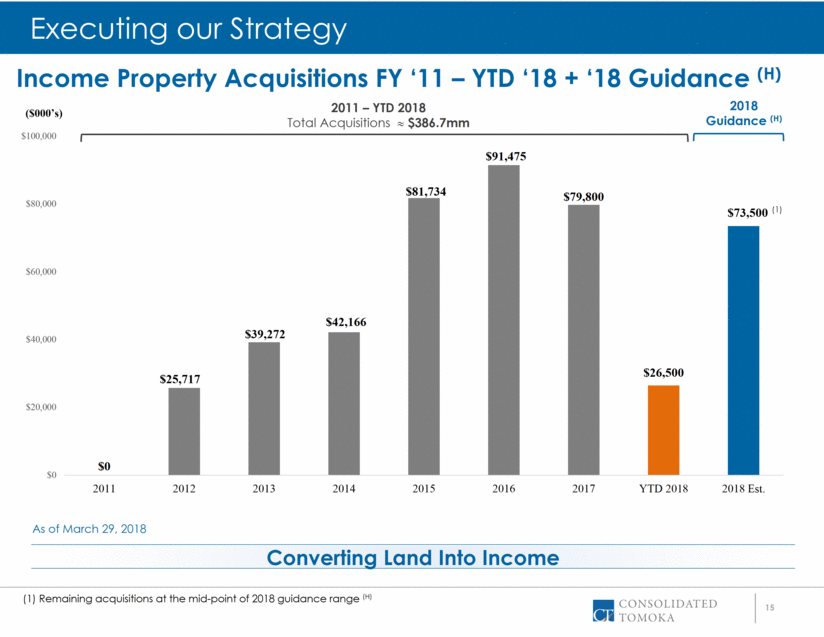
| 15 ($000’s) 2011 – YTD 2018 Total Acquisitions $386.7mm Income Property Acquisitions FY ‘11 – YTD ‘18 + ‘18 Guidance (H) (1) Remaining acquisitions at the mid-point of 2018 guidance range (H) (1) Converting Land Into Income Executing our Strategy As of March 29, 2018 2018 Guidance (H) $0 $25,717 $39,272 $42,166 $81,734 $91,475 $79,800 $26,500 $73,500 $0 $20,000 $40,000 $60,000 $80,000 $100,000 2011 2012 2013 2014 2015 2016 2017 YTD 2018 2018 Est. |
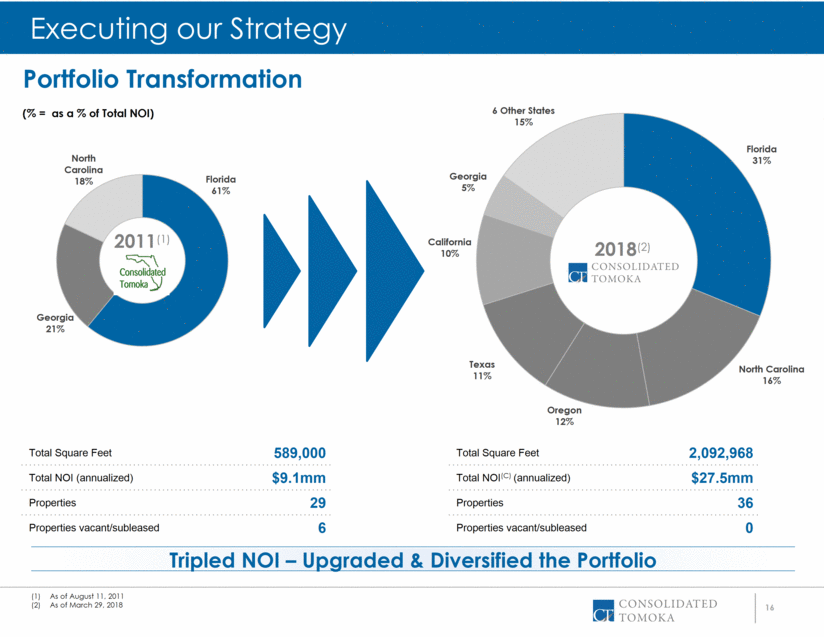
| 16 Portfolio Transformation Tripled NOI – Upgraded & Diversified the Portfolio Total Square Feet 589,000 Total NOI (annualized) $9.1mm Properties 29 Properties vacant/subleased 6 As of August 11, 2011 As of March 29, 2018 2011(1) 2018(2) Total Square Feet 2,092,968 Total NOI(C) (annualized) $27.5mm Properties 36 Properties vacant/subleased 0 Executing our Strategy (% = as a % of Total NOI) Florida 61% Georgia 21% North Carolina 18% Florida 31% North Carolina 16% Oregon 12% Texas 11% California 10% Georgia 5% 6 Other States 15% |
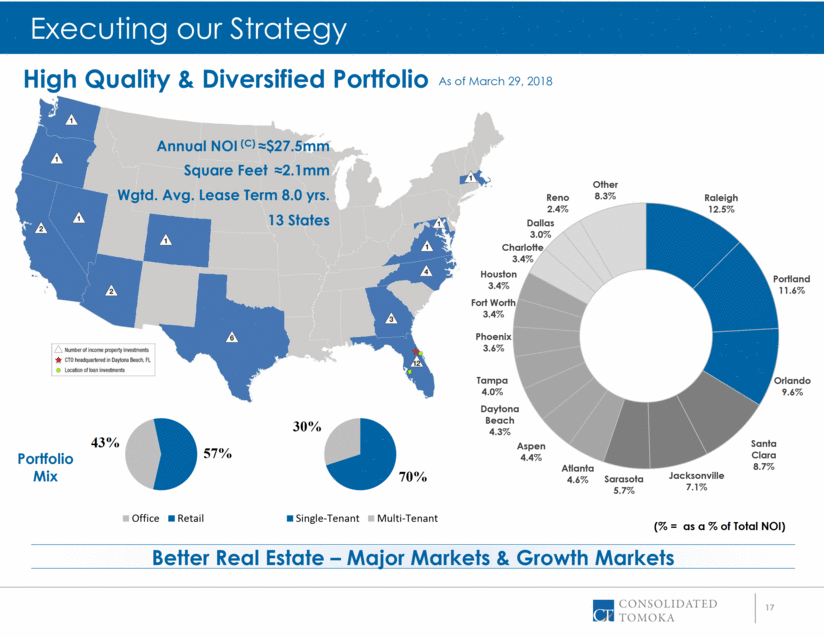
| 17 High Quality & Diversified Portfolio Better Real Estate – Major Markets & Growth Markets As of March 29, 2018 Portfolio Mix Executing our Strategy Annual NOI (C) ≈$27.5mm Wgtd. Avg. Lease Term 8.0 yrs. 13 States Square Feet ≈2.1mm (% = as a % of Total NOI) 43% 57% Office Retail 70% 30% Single-Tenant Multi-Tenant Raleigh 12.5% Portland 11.6% Orlando 9.6% Santa Clara 8.7% Jacksonville 7.1% Sarasota 5.7% Atlanta 4.6% Aspen 4.4% Daytona Beach 4.3% Tampa 4.0% Phoenix 3.6% Fort Worth 3.4% Houston 3.4% Charlotte 3.4% Dallas 3.0% Reno 2.4% Other 8.3% |
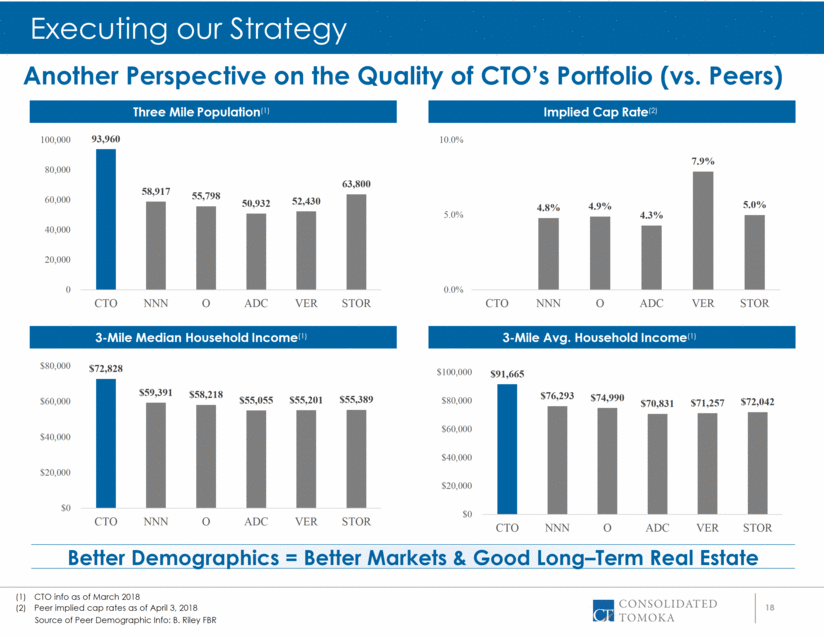
| 18 Another Perspective on the Quality of CTO’s Portfolio (vs. Peers) Better Demographics = Better Markets & Good Long–Term Real Estate Executing our Strategy Three Mile Population(1) Implied Cap Rate(2) 3-Mile Median Household Income(1) 3-Mile Avg. Household Income(1) Source of Peer Demographic Info: B. Riley FBR CTO info as of March 2018 Peer implied cap rates as of April 3, 2018 93,960 58,917 55,798 50,932 52,430 63,800 0 20,000 40,000 60,000 80,000 100,000 CTO NNN O ADC VER STOR 4.8% 4.9% 4.3% 7.9% 5.0% 0.0% 5.0% 10.0% CTO NNN O ADC VER STOR $72,828 $59,391 $58,218 $55,055 $55,201 $55,389 $0 $20,000 $40,000 $60,000 $80,000 CTO NNN O ADC VER STOR $91,665 $76,293 $74,990 $70,831 $71,257 $72,042 $0 $20,000 $40,000 $60,000 $80,000 $100,000 CTO NNN O ADC VER STOR |
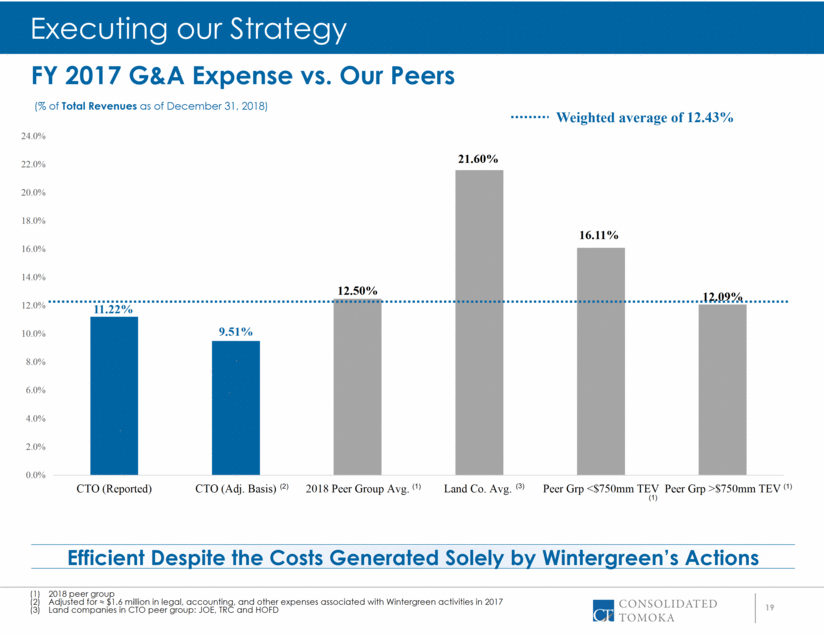
| 19 Efficient Despite the Costs Generated Solely by Wintergreen’s Actions FY 2017 G&A Expense vs. Our Peers (% of Total Revenues as of December 31, 2018) 2018 peer group Adjusted for ≈ $1.6 million in legal, accounting, and other expenses associated with Wintergreen activities in 2017 Land companies in CTO peer group: JOE, TRC and HOFD (1) (2) (1) (1) (3) Executing our Strategy (1) Weighted average of 12.43% 11.22% 9.51% 12.50% 21.60% 16.11% 12.09% 0.0% 2.0% 4.0% 6.0% 8.0% 10.0% 12.0% 14.0% 16.0% 18.0% 20.0% 22.0% 24.0% CTO (Reported) CTO (Adj. Basis) 2018 Peer Group Avg. Land Co. Avg. Peer Grp <$750mm TEV Peer Grp >$750mm TEV |
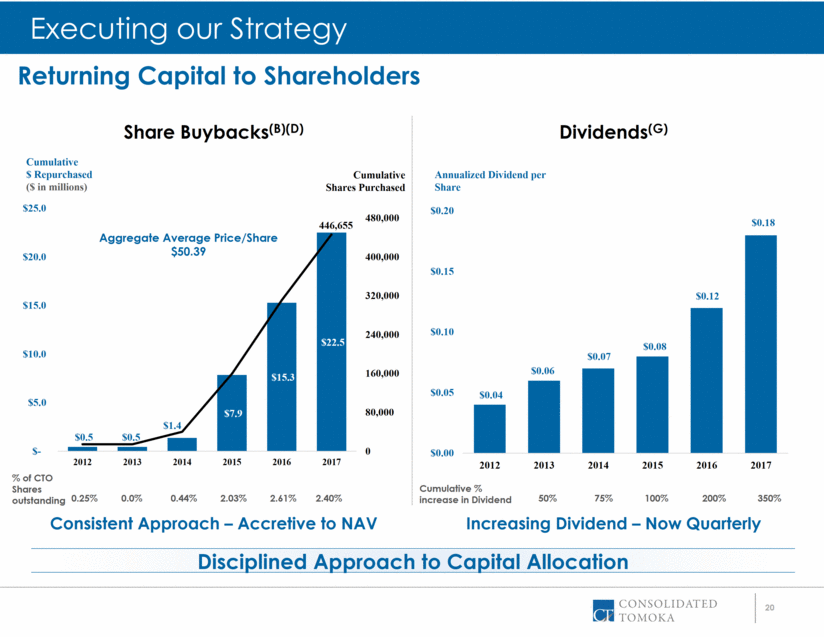
| 20 Cumulative Shares Purchased Returning Capital to Shareholders Cumulative $ Repurchased ($ in millions) Aggregate Average Price/Share $50.39 Disciplined Approach to Capital Allocation Executing our Strategy Annualized Dividend per Share Consistent Approach – Accretive to NAV Increasing Dividend – Now Quarterly Share Buybacks(B)(D) Dividends(G) % of CTO Shares outstanding 0.25% 0.0% 0.44% 2.03% 2.61% 2.40% Cumulative % increase in Dividend 50% 75% 100% 200% 350% $0.5 $0.5 $1.4 $7.9 $15.3 $22.5 446,655 0 80,000 160,000 240,000 320,000 400,000 480,000 $- $5.0 $10.0 $15.0 $20.0 $25.0 2012 2013 2014 2015 2016 2017 $0.04 $0.06 $0.07 $0.08 $0.12 $0.18 $0.00 $0.05 $0.10 $0.15 $0.20 2012 2013 2014 2015 2016 2017 |
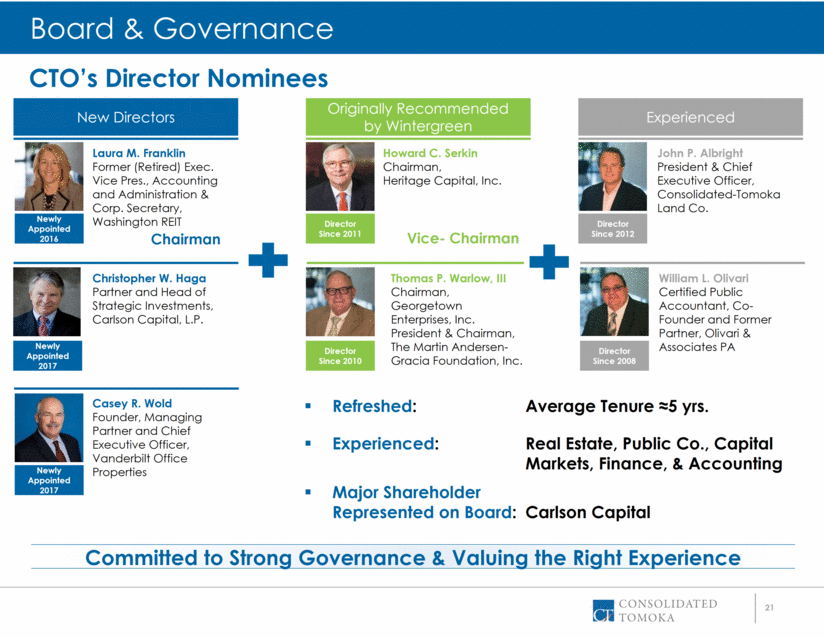
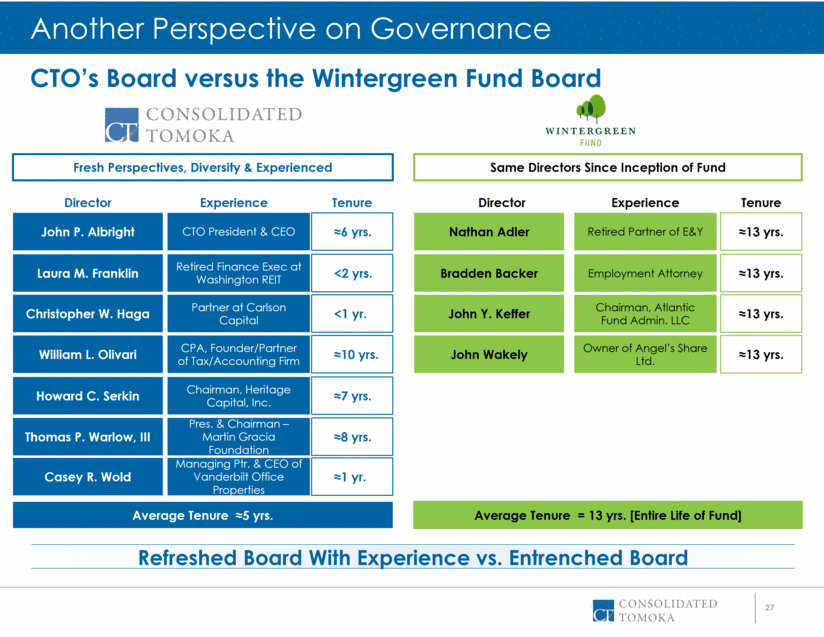
| 21 Laura M. Franklin Former (Retired) Exec. Vice Pres., Accounting and Administration & Corp. Secretary, Washington REIT Experienced New Directors Originally Recommended by Wintergreen Christopher W. Haga Partner and Head of Strategic Investments, Carlson Capital, L.P. Director Since 2012 John P. Albright President & Chief Executive Officer, Consolidated-Tomoka Land Co. Director Since 2008 William L. Olivari Certified Public Accountant, Co-Founder and Former Partner, Olivari & Associates PA Director Since 2011 Howard C. Serkin Chairman, Heritage Capital, Inc. Director Since 2010 Thomas P. Warlow, III Chairman, Georgetown Enterprises, Inc. President & Chairman, The Martin Andersen-Gracia Foundation, Inc. Newly Appointed 2016 Newly Appointed 2017 Casey R. Wold Founder, Managing Partner and Chief Executive Officer, Vanderbilt Office Properties Newly Appointed 2017 Committed to Strong Governance & Valuing the Right Experience CTO’s Director Nominees Board & Governance Chairman Vice- Chairman Refreshed: Experienced: Major Shareholder Represented on Board: Average Tenure ≈5 yrs. Real Estate, Public Co., Capital Markets, Finance, & Accounting Carlson Capital |
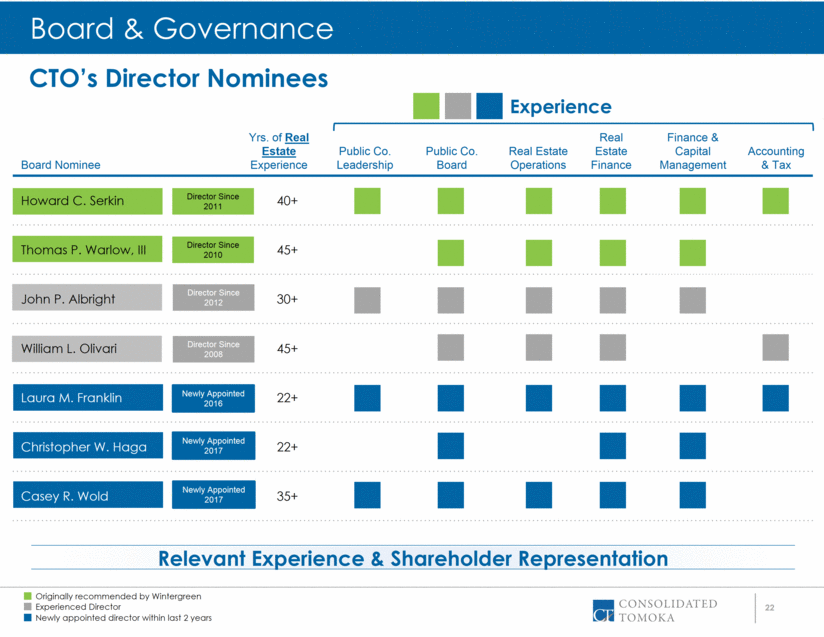
| 22 Board Nominee Yrs. of Real Estate Experience Public Co. Leadership Public Co. Board Real Estate Operations Real Estate Finance Finance & Capital Management Accounting & Tax Howard C. Serkin 40+ Thomas P. Warlow, III 45+ John P. Albright 30+ William L. Olivari 45+ Laura M. Franklin 22+ Christopher W. Haga 22+ Casey R. Wold 35+ Director Since 2011 Director Since 2010 Newly Appointed 2016 Newly Appointed 2017 CTO’s Director Nominees Director Since 2008 Director Since 2012 Newly Appointed 2017 Relevant Experience & Shareholder Representation Board & Governance Experience Originally recommended by Wintergreen Experienced Director Newly appointed director within last 2 years |
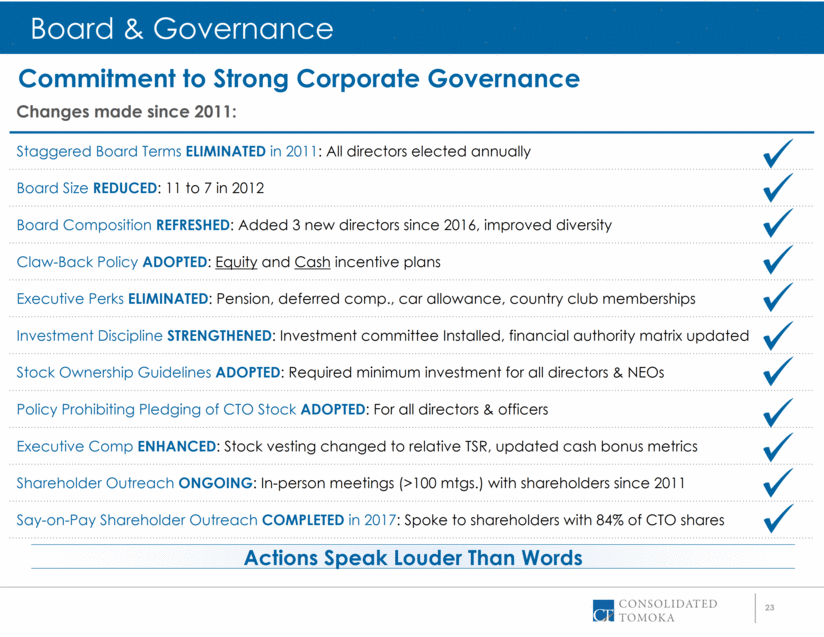
| 23 Actions Speak Louder Than Words Changes made since 2011: Staggered Board Terms ELIMINATED in 2011: All directors elected annually Board Size REDUCED: 11 to 7 in 2012 Board Composition REFRESHED: Added 3 new directors since 2016, improved diversity Claw-Back Policy ADOPTED: Equity and Cash incentive plans Executive Perks ELIMINATED: Pension, deferred comp., car allowance, country club memberships Investment Discipline STRENGTHENED: Investment committee Installed, financial authority matrix updated Stock Ownership Guidelines ADOPTED: Required minimum investment for all directors & NEOs Policy Prohibiting Pledging of CTO Stock ADOPTED: For all directors & officers Executive Comp ENHANCED: Stock vesting changed to relative TSR, updated cash bonus metrics Shareholder Outreach ONGOING: In-person meetings (>100 mtgs.) with shareholders since 2011 Say-on-Pay Shareholder Outreach COMPLETED in 2017: Spoke to shareholders with 84% of CTO shares Commitment to Strong Corporate Governance Board & Governance |
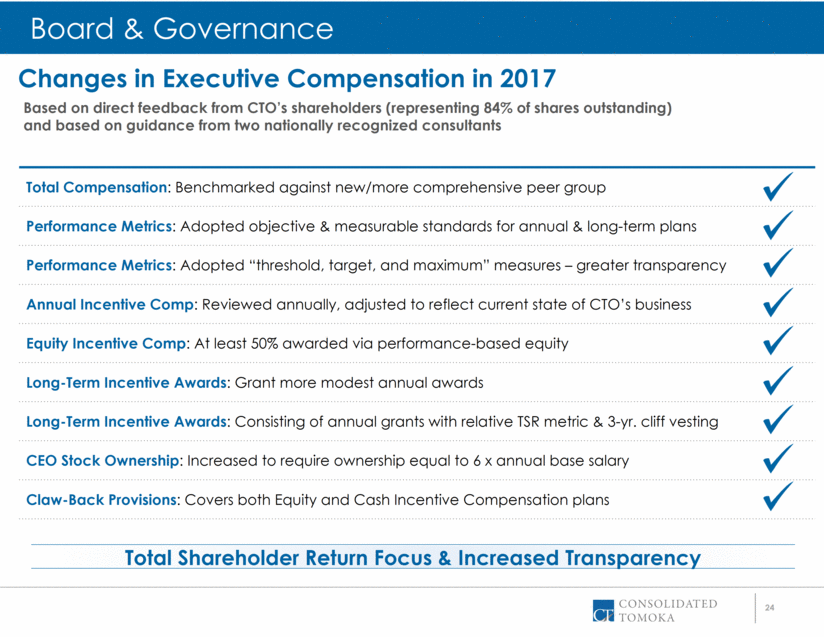
| 24 Total Shareholder Return Focus & Increased Transparency Total Compensation: Benchmarked against new/more comprehensive peer group Performance Metrics: Adopted objective & measurable standards for annual & long-term plans Performance Metrics: Adopted “threshold, target, and maximum” measures – greater transparency Annual Incentive Comp: Reviewed annually, adjusted to reflect current state of CTO’s business Equity Incentive Comp: At least 50% awarded via performance-based equity Long-Term Incentive Awards: Grant more modest annual awards Long-Term Incentive Awards: Consisting of annual grants with relative TSR metric & 3-yr. cliff vesting CEO Stock Ownership: Increased to require ownership equal to 6 x annual base salary Claw-Back Provisions: Covers both Equity and Cash Incentive Compensation plans Changes in Executive Compensation in 2017 Board & Governance Based on direct feedback from CTO’s shareholders (representing 84% of shares outstanding) and based on guidance from two nationally recognized consultants |
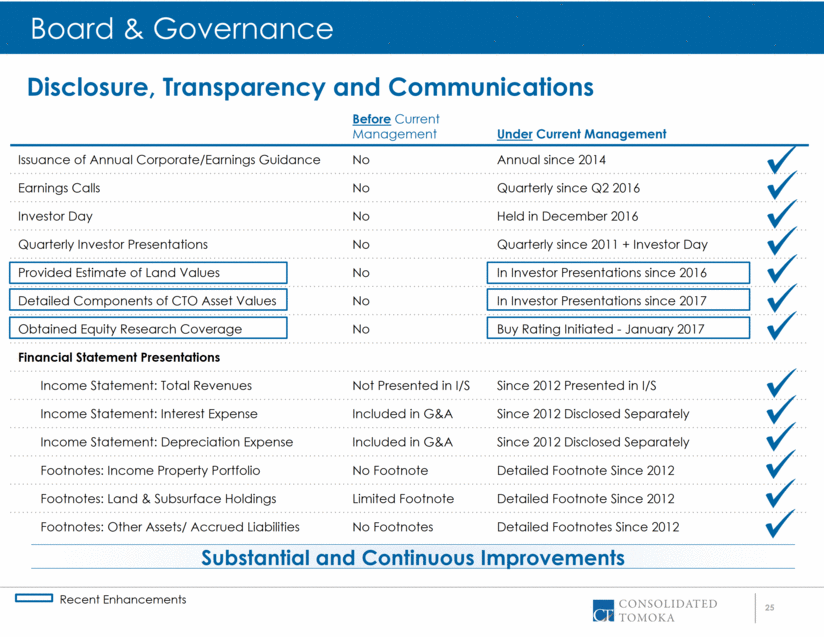
| 25 Substantial and Continuous Improvements Disclosure, Transparency and Communications Before Current Management Under Current Management Issuance of Annual Corporate/Earnings Guidance No Annual since 2014 Earnings Calls No Quarterly since Q2 2016 Investor Day No Held in December 2016 Quarterly Investor Presentations No Quarterly since 2011 + Investor Day Provided Estimate of Land Values No In Investor Presentations since 2016 Detailed Components of CTO Asset Values No In Investor Presentations since 2017 Obtained Equity Research Coverage No Buy Rating Initiated - January 2017 Financial Statement Presentations Income Statement: Total Revenues Not Presented in I/S Since 2012 Presented in I/S Income Statement: Interest Expense Included in G&A Since 2012 Disclosed Separately Income Statement: Depreciation Expense Included in G&A Since 2012 Disclosed Separately Footnotes: Income Property Portfolio No Footnote Detailed Footnote Since 2012 Footnotes: Land & Subsurface Holdings Limited Footnote Detailed Footnote Since 2012 Footnotes: Other Assets/ Accrued Liabilities No Footnotes Detailed Footnotes Since 2012 Board & Governance Recent Enhancements |
| 26 What Has Changed? – Could it be the Wintergreen Fund’s Challenges? “CTO has righted its ship and is busy growing shareholder value” “The actions taken by CTO’s management team and board over past four years have put the company in position to benefit from this [Daytona Beach] market rebound” “Wintergreen’s involvement with CTO has put a strong lineup of directors on CTO’s Board the Board in turn hired a very capable management team, which has transformed the Company into the profitable and growing enterprise it is today” “..without the right people running the company, there is little chance of that asset value [re: CTO’s land] ever accruing to shareholders under guidance from the new Board, the new management team...developed plans to attract new developers to Daytona Beach” “They [the new management team] have grown and diversified their income property portfolio and increased outreach to potential investors” “We believe the best is yet to come for CTO” In David Winters’ Own Words Excerpts From Wintergreen Letter to Wintergreen Fund Investors in March 2015 Emphasis added. Ringing Endorsement of CTO – by Wintergreen |
| 27 Refreshed Board With Experience vs. Entrenched Board CTO’s Board versus the Wintergreen Fund Board Another Perspective on Governance John P. Albright William L. Olivari Laura M. Franklin Christopher W. Haga Casey R. Wold Thomas P. Warlow, III Howard C. Serkin Chairman, Heritage Capital, Inc. Pres. & Chairman – Martin Gracia Foundation Retired Finance Exec at Washington REIT Partner at Carlson Capital CPA, Founder/Partner of Tax/Accounting Firm CTO President & CEO Managing Ptr. & CEO of Vanderbilt Office Properties Bradden Backer John Wakely Nathan Adler John Y. Keffer <2 yrs. ≈6 yrs. <1 yr. ≈10 yrs. ≈7 yrs. ≈8 yrs. ≈1 yr. ≈13 yrs. ≈13 yrs. ≈13 yrs. ≈13 yrs. Average Tenure ≈5 yrs. Average Tenure = 13 yrs. [Entire Life of Fund] Same Directors Since Inception of Fund Fresh Perspectives, Diversity & Experienced Director Experience Tenure Retired Partner of E&Y Chairman, Atlantic Fund Admin. LLC Owner of Angel’s Share Ltd. Employment Attorney Director Experience Tenure |
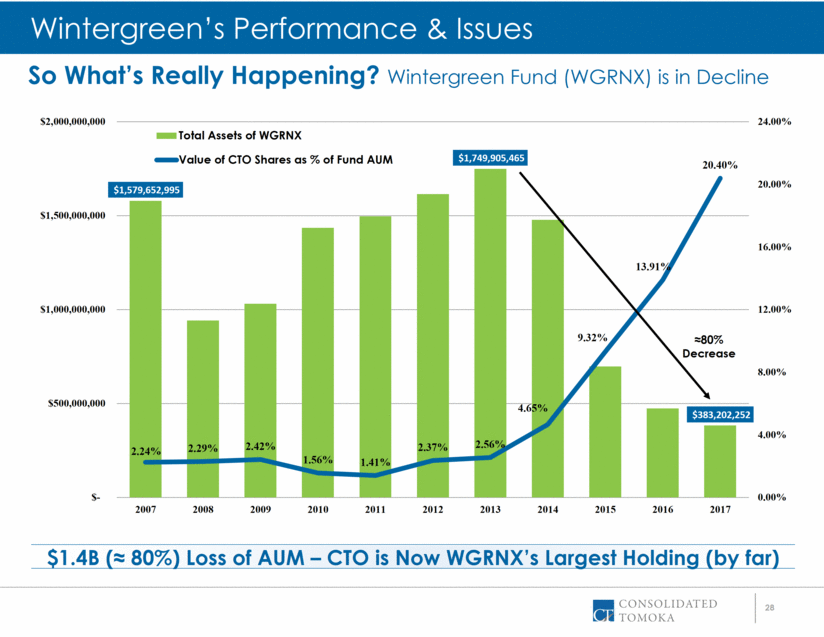
| 28 $1.4B (≈ 80%) Loss of AUM – CTO is Now WGRNX’s Largest Holding (by far) So What’s Really Happening? Wintergreen Fund (WGRNX) is in Decline Wintergreen’s Performance & Issues ≈80% Decrease $1,579,652,995 $1,749,905,465 $383,202,252 2.24% 2.29% 2.42% 1.56% 1.41% 2.37% 2.56% 4.65% 9.32% 13.91% 20.40% 0.00% 4.00% 8.00% 12.00% 16.00% 20.00% 24.00% $- $500,000,000 $1,000,000,000 $1,500,000,000 $2,000,000,000 2007 2008 2009 2010 2011 2012 2013 2014 2015 2016 2017 Total Assets of WGRNX Value of CTO Shares as % of Fund AUM |
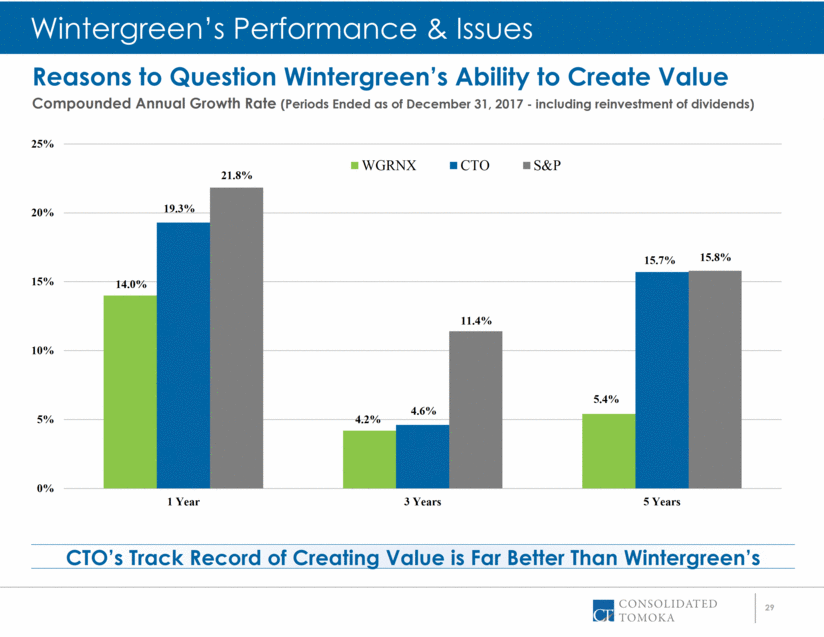
| 29 CTO’s Track Record of Creating Value is Far Better Than Wintergreen’s Reasons to Question Wintergreen’s Ability to Create Value Compounded Annual Growth Rate (Periods Ended as of December 31, 2017 - including reinvestment of dividends) Wintergreen’s Performance & Issues 14.0% 4.2% 5.4% 19.3% 4.6% 15.7% 21.8% 11.4% 15.8% 0% 5% 10% 15% 20% 25% 1 Year 3 Years 5 Years WGRNX CTO S&P |
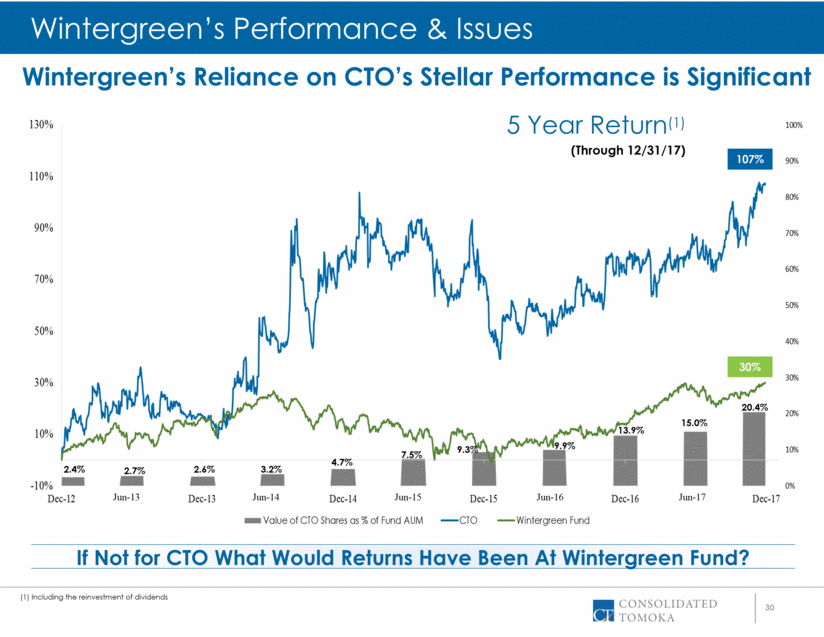
| 30 Wintergreen’s Performance & Issues If Not for CTO What Would Returns Have Been At Wintergreen Fund? 107% 30% 2.4% 2.7% 2.6% 3.2% 4.7% 7.5% 9.3% 9.9% 13.9% 15.0% 20.4% Wintergreen’s Reliance on CTO’s Stellar Performance is Significant 5 Year Return(1) (Through 12/31/17) (1) Including the reinvestment of dividends Jun-13 Jun-14 Jun-15 Jun-16 Jun-17 |
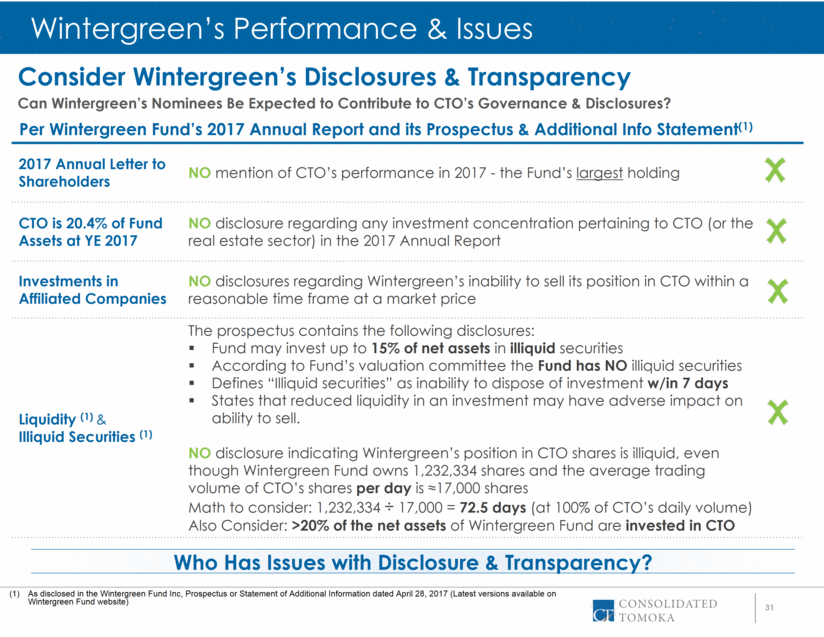
| 31 Who Has Issues with Disclosure & Transparency? Consider Wintergreen’s Disclosures & Transparency Can Wintergreen’s Nominees Be Expected to Contribute to CTO’s Governance & Disclosures? Wintergreen’s Performance & Issues 2017 Annual Letter to Shareholders NO mention of CTO’s performance in 2017 - the Fund’s largest holding CTO is 20.4% of Fund Assets at YE 2017 NO disclosure regarding any investment concentration pertaining to CTO (or the real estate sector) in the 2017 Annual Report Investments in Affiliated Companies NO disclosures regarding Wintergreen’s inability to sell its position in CTO within a reasonable time frame at a market price Liquidity (1) & Illiquid Securities (1) The prospectus contains the following disclosures: Fund may invest up to 15% of net assets in illiquid securities According to Fund’s valuation committee the Fund has NO illiquid securities Defines “Illiquid securities” as inability to dispose of investment w/in 7 days States that reduced liquidity in an investment may have adverse impact on ability to sell. NO disclosure indicating Wintergreen’s position in CTO shares is illiquid, even though Wintergreen Fund owns 1,232,334 shares and the average trading volume of CTO’s shares per day is ≈17,000 shares Math to consider: 1,232,334 ÷ 17,000 = 72.5 days (at 100% of CTO’s daily volume) Also Consider: >20% of the net assets of Wintergreen Fund are invested in CTO As disclosed in the Wintergreen Fund Inc, Prospectus or Statement of Additional Information dated April 28, 2017 (Latest versions available on Wintergreen Fund website) Per Wintergreen Fund’s 2017 Annual Report and its Prospectus & Additional Info Statement(1) |
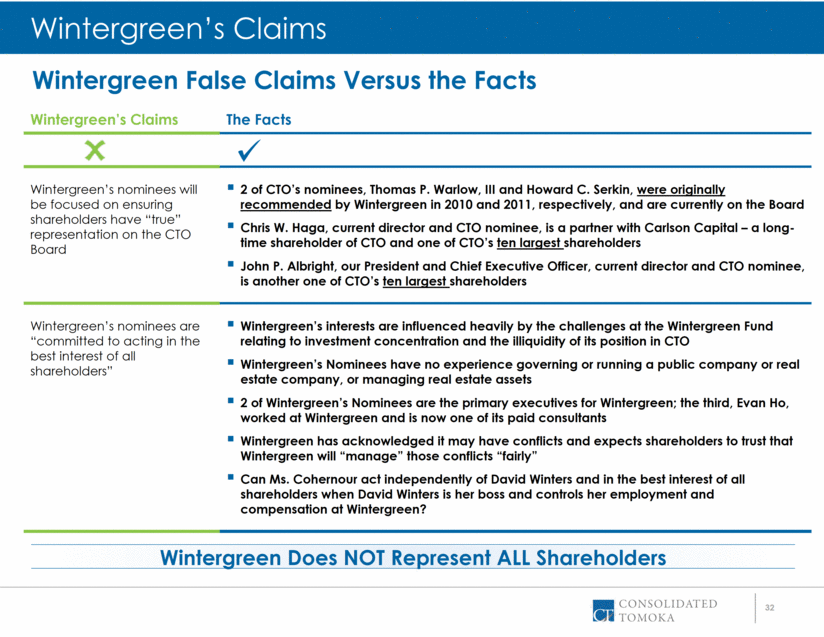
| 32 Wintergreen Does NOT Represent ALL Shareholders Wintergreen’s Claims The Facts Wintergreen’s nominees will be focused on ensuring shareholders have “true” representation on the CTO Board 2 of CTO’s nominees, Thomas P. Warlow, III and Howard C. Serkin, were originally recommended by Wintergreen in 2010 and 2011, respectively, and are currently on the Board Chris W. Haga, current director and CTO nominee, is a partner with Carlson Capital – a long-time shareholder of CTO and one of CTO’s ten largest shareholders John P. Albright, our President and Chief Executive Officer, current director and CTO nominee, is another one of CTO’s ten largest shareholders Wintergreen’s nominees are “committed to acting in the best interest of all shareholders” Wintergreen’s interests are influenced heavily by the challenges at the Wintergreen Fund relating to investment concentration and the illiquidity of its position in CTO Wintergreen’s Nominees have no experience governing or running a public company or real estate company, or managing real estate assets 2 of Wintergreen’s Nominees are the primary executives for Wintergreen; the third, Evan Ho, worked at Wintergreen and is now one of its paid consultants Wintergreen has acknowledged it may have conflicts and expects shareholders to trust that Wintergreen will “manage” those conflicts “fairly” Can Ms. Cohernour act independently of David Winters and in the best interest of all shareholders when David Winters is her boss and controls her employment and compensation at Wintergreen? Wintergreen’s Claims Wintergreen False Claims Versus the Facts |
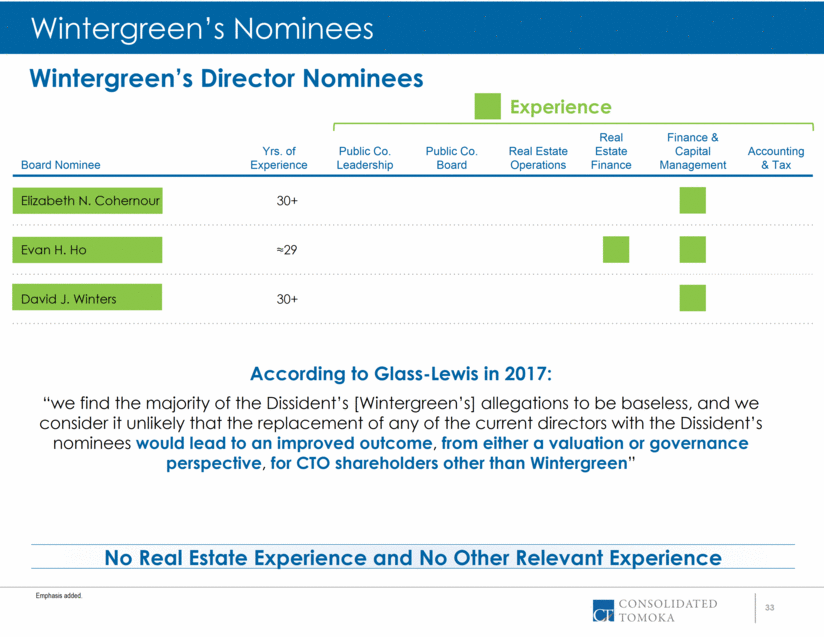
| 33 Wintergreen’s Nominees Board Nominee Yrs. of Experience Public Co. Leadership Public Co. Board Real Estate Operations Real Estate Finance Finance & Capital Management Accounting & Tax Elizabeth N. Cohernour 30+ Evan H. Ho ≈29 David J. Winters 30+ Wintergreen’s Director Nominees No Real Estate Experience and No Other Relevant Experience Experience According to Glass-Lewis in 2017: “we find the majority of the Dissident’s [Wintergreen’s] allegations to be baseless, and we consider it unlikely that the replacement of any of the current directors with the Dissident’s nominees would lead to an improved outcome, from either a valuation or governance perspective, for CTO shareholders other than Wintergreen” Emphasis added. |
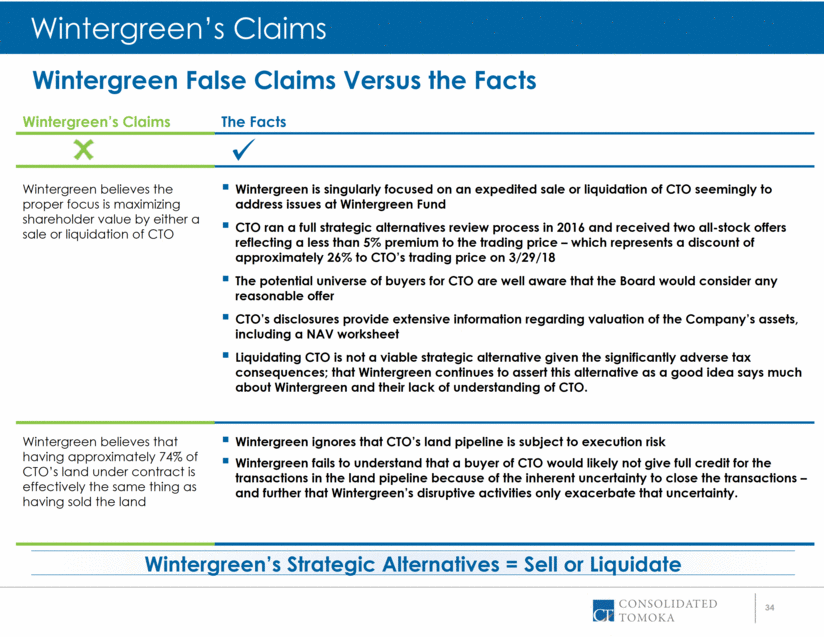
| 34 Wintergreen’s Strategic Alternatives = Sell or Liquidate Wintergreen’s Claims The Facts Wintergreen believes the proper focus is maximizing shareholder value by either a sale or liquidation of CTO Wintergreen is singularly focused on an expedited sale or liquidation of CTO seemingly to address issues at Wintergreen Fund CTO ran a full strategic alternatives review process in 2016 and received two all-stock offers reflecting a less than 5% premium to the trading price – which represents a discount of approximately 26% to CTO’s trading price on 3/29/18 The potential universe of buyers for CTO are well aware that the Board would consider any reasonable offer CTO’s disclosures provide extensive information regarding valuation of the Company’s assets, including a NAV worksheet Liquidating CTO is not a viable strategic alternative given the significantly adverse tax consequences; that Wintergreen continues to assert this alternative as a good idea says much about Wintergreen and their lack of understanding of CTO. Wintergreen believes that having approximately 74% of CTO’s land under contract is effectively the same thing as having sold the land Wintergreen ignores that CTO’s land pipeline is subject to execution risk Wintergreen fails to understand that a buyer of CTO would likely not give full credit for the transactions in the land pipeline because of the inherent uncertainty to close the transactions – and further that Wintergreen’s disruptive activities only exacerbate that uncertainty. Wintergreen’s Claims Wintergreen False Claims Versus the Facts |
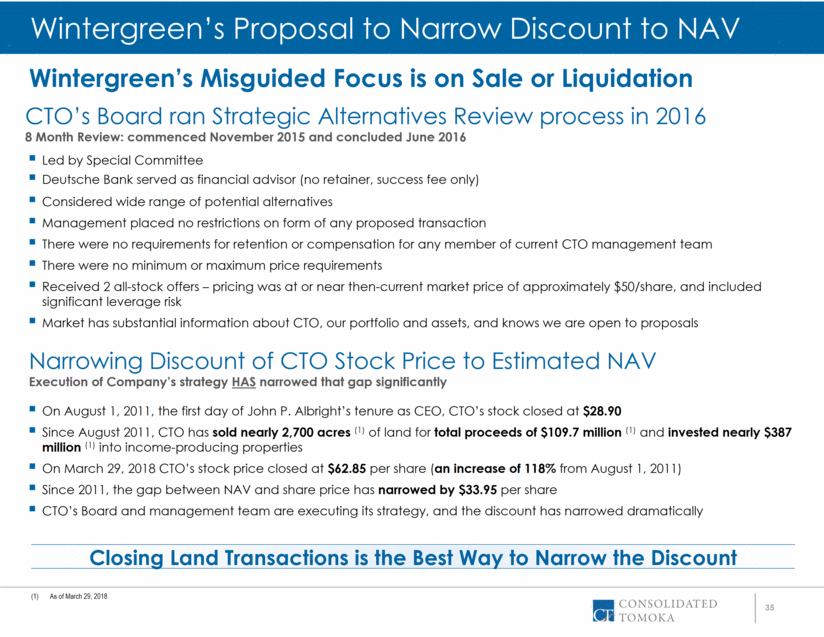
| 35 Wintergreen’s Proposal to Narrow Discount to NAV Wintergreen’s Misguided Focus is on Sale or Liquidation Closing Land Transactions is the Best Way to Narrow the Discount CTO’s Board ran Strategic Alternatives Review process in 2016 8 Month Review: commenced November 2015 and concluded June 2016 Led by Special Committee Deutsche Bank served as financial advisor (no retainer, success fee only) Considered wide range of potential alternatives Management placed no restrictions on form of any proposed transaction There were no requirements for retention or compensation for any member of current CTO management team There were no minimum or maximum price requirements Received 2 all-stock offers – pricing was at or near then-current market price of approximately $50/share, and included significant leverage risk Market has substantial information about CTO, our portfolio and assets, and knows we are open to proposals Narrowing Discount of CTO Stock Price to Estimated NAV Execution of Company’s strategy HAS narrowed that gap significantly On August 1, 2011, the first day of John P. Albright’s tenure as CEO, CTO’s stock closed at $28.90 Since August 2011, CTO has sold nearly 2,700 acres (1) of land for total proceeds of $109.7 million (1) and invested nearly $387 million (1) into income-producing properties On March 29, 2018 CTO’s stock price closed at $62.85 per share (an increase of 118% from August 1, 2011) Since 2011, the gap between NAV and share price has narrowed by $33.95 per share CTO’s Board and management team are executing its strategy, and the discount has narrowed dramatically As of March 29, 2018 |
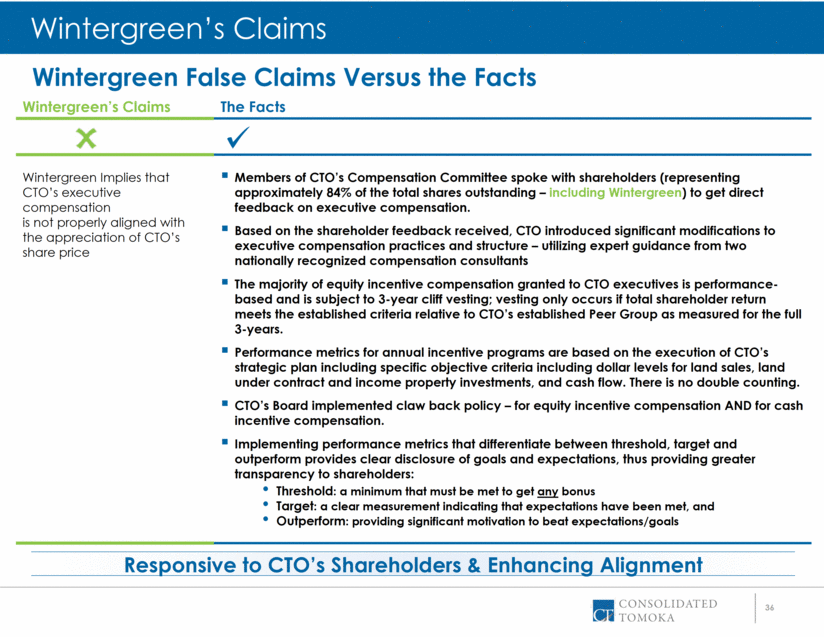
| 36 Responsive to CTO’s Shareholders & Enhancing Alignment Wintergreen’s Claims The Facts Wintergreen Implies that CTO’s executive compensation is not properly aligned with the appreciation of CTO’s share price Members of CTO’s Compensation Committee spoke with shareholders (representing approximately 84% of the total shares outstanding – including Wintergreen) to get direct feedback on executive compensation. Based on the shareholder feedback received, CTO introduced significant modifications to executive compensation practices and structure – utilizing expert guidance from two nationally recognized compensation consultants The majority of equity incentive compensation granted to CTO executives is performance-based and is subject to 3-year cliff vesting; vesting only occurs if total shareholder return meets the established criteria relative to CTO’s established Peer Group as measured for the full 3-years. Performance metrics for annual incentive programs are based on the execution of CTO’s strategic plan including specific objective criteria including dollar levels for land sales, land under contract and income property investments, and cash flow. There is no double counting. CTO’s Board implemented claw back policy – for equity incentive compensation AND for cash incentive compensation. Implementing performance metrics that differentiate between threshold, target and outperform provides clear disclosure of goals and expectations, thus providing greater transparency to shareholders: Threshold: a minimum that must be met to get any bonus Target: a clear measurement indicating that expectations have been met, and Outperform: providing significant motivation to beat expectations/goals Wintergreen’s Claims Wintergreen False Claims Versus the Facts |
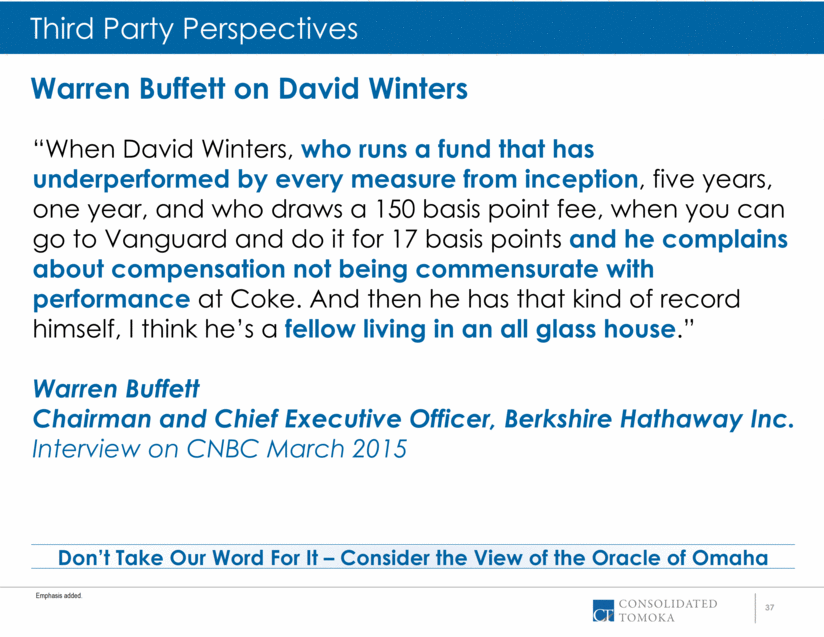
| 37 Don’t Take Our Word For It – Consider the View of the Oracle of Omaha Third Party Perspectives “When David Winters, who runs a fund that has underperformed by every measure from inception, five years, one year, and who draws a 150 basis point fee, when you can go to Vanguard and do it for 17 basis points and he complains about compensation not being commensurate with performance at Coke. And then he has that kind of record himself, I think he’s a fellow living in an all glass house.” Warren Buffett Chairman and Chief Executive Officer, Berkshire Hathaway Inc. Interview on CNBC March 2015 Warren Buffett on David Winters Emphasis added. |
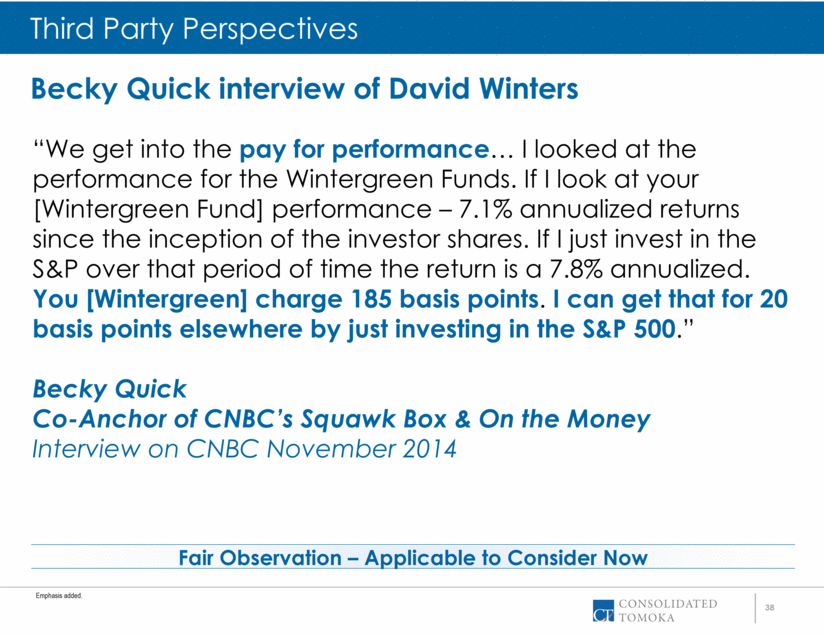
| 38 Fair Observation – Applicable to Consider Now Third Party Perspectives “We get into the pay for performance I looked at the performance for the Wintergreen Funds. If I look at your [Wintergreen Fund] performance – 7.1% annualized returns since the inception of the investor shares. If I just invest in the S&P over that period of time the return is a 7.8% annualized. You [Wintergreen] charge 185 basis points. I can get that for 20 basis points elsewhere by just investing in the S&P 500.” Becky Quick Co-Anchor of CNBC’s Squawk Box & On the Money Interview on CNBC November 2014 Becky Quick interview of David Winters Emphasis added. |
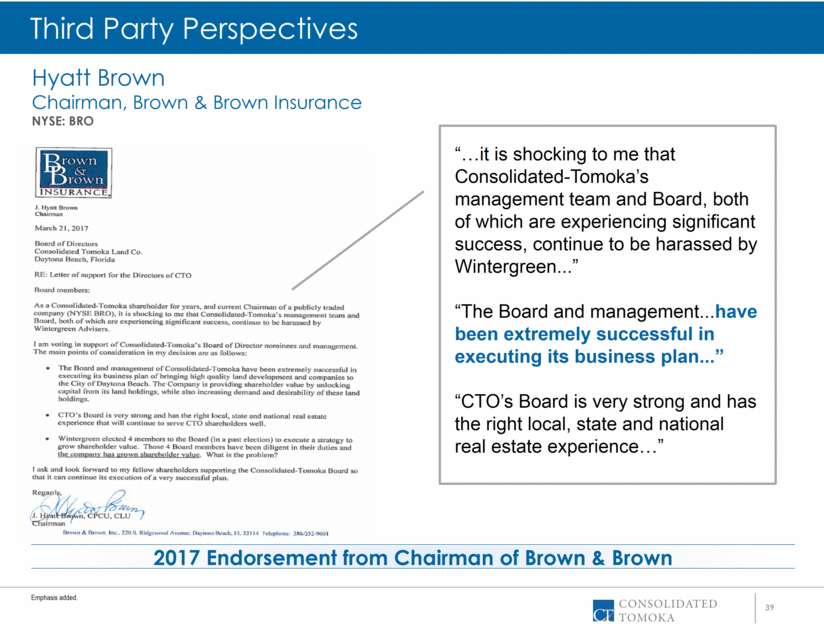
| 39 2017 Endorsement from Chairman of Brown & Brown “ it is shocking to me that Consolidated-Tomoka’s management team and Board, both of which are experiencing significant success, continue to be harassed by Wintergreen...” “The Board and management...have been extremely successful in executing its business plan...” “CTO’s Board is very strong and has the right local, state and national real estate experience ” Hyatt Brown Chairman, Brown & Brown Insurance NYSE: BRO Emphasis added. Third Party Perspectives |
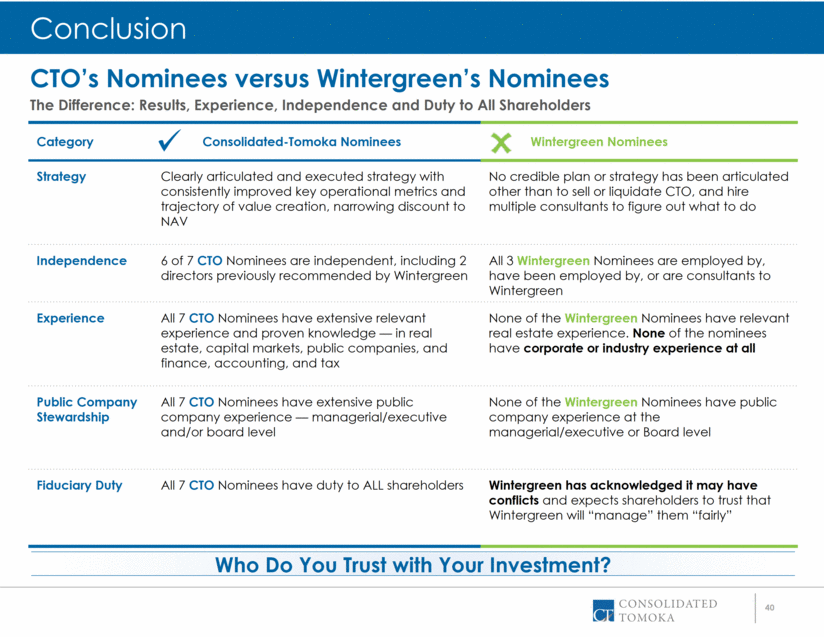
| 40 Who Do You Trust with Your Investment? CTO’s Nominees versus Wintergreen’s Nominees The Difference: Results, Experience, Independence and Duty to All Shareholders Category Consolidated-Tomoka Nominees Wintergreen Nominees Strategy Clearly articulated and executed strategy with consistently improved key operational metrics and trajectory of value creation, narrowing discount to NAV No credible plan or strategy has been articulated other than to sell or liquidate CTO, and hire multiple consultants to figure out what to do Independence 6 of 7 CTO Nominees are independent, including 2 directors previously recommended by Wintergreen All 3 Wintergreen Nominees are employed by, have been employed by, or are consultants to Wintergreen Experience All 7 CTO Nominees have extensive relevant experience and proven knowledge — in real estate, capital markets, public companies, and finance, accounting, and tax None of the Wintergreen Nominees have relevant real estate experience. None of the nominees have corporate or industry experience at all Public Company Stewardship All 7 CTO Nominees have extensive public company experience — managerial/executive and/or board level None of the Wintergreen Nominees have public company experience at the managerial/executive or Board level Fiduciary Duty All 7 CTO Nominees have duty to ALL shareholders Wintergreen has acknowledged it may have conflicts and expects shareholders to trust that Wintergreen will “manage” them “fairly” Conclusion |
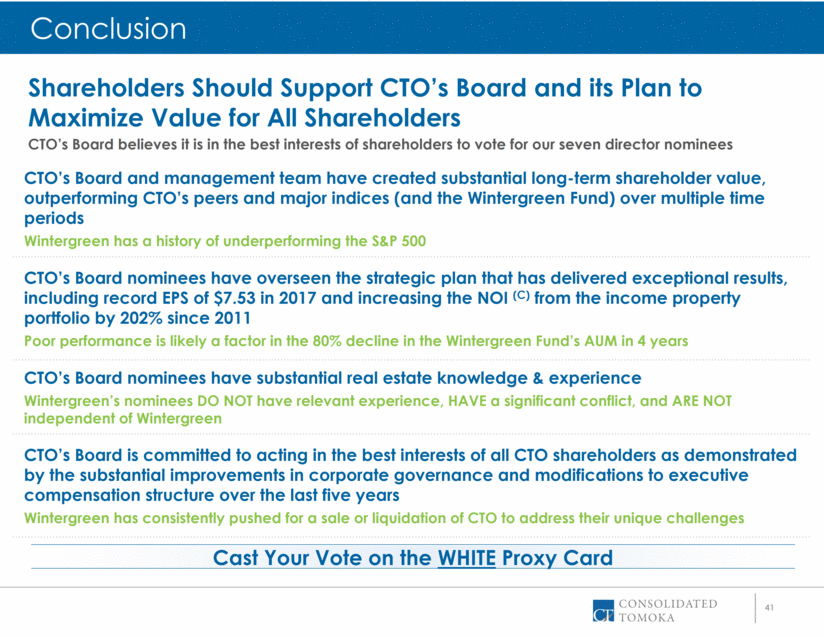
| 41 Cast Your Vote on the WHITE Proxy Card Conclusion Shareholders Should Support CTO’s Board and its Plan to Maximize Value for All Shareholders CTO’s Board believes it is in the best interests of shareholders to vote for our seven director nominees CTO’s Board and management team have created substantial long-term shareholder value, outperforming CTO’s peers and major indices (and the Wintergreen Fund) over multiple time periods Wintergreen has a history of underperforming the S&P 500 CTO’s Board nominees have overseen the strategic plan that has delivered exceptional results, including record EPS of $7.53 in 2017 and increasing the NOI (C) from the income property portfolio by 202% since 2011 Poor performance is likely a factor in the 80% decline in the Wintergreen Fund’s AUM in 4 years CTO’s Board nominees have substantial real estate knowledge & experience Wintergreen’s nominees DO NOT have relevant experience, HAVE a significant conflict, and ARE NOT independent of Wintergreen CTO’s Board is committed to acting in the best interests of all CTO shareholders as demonstrated by the substantial improvements in corporate governance and modifications to executive compensation structure over the last five years Wintergreen has consistently pushed for a sale or liquidation of CTO to address their unique challenges |
| Appendix 42 |
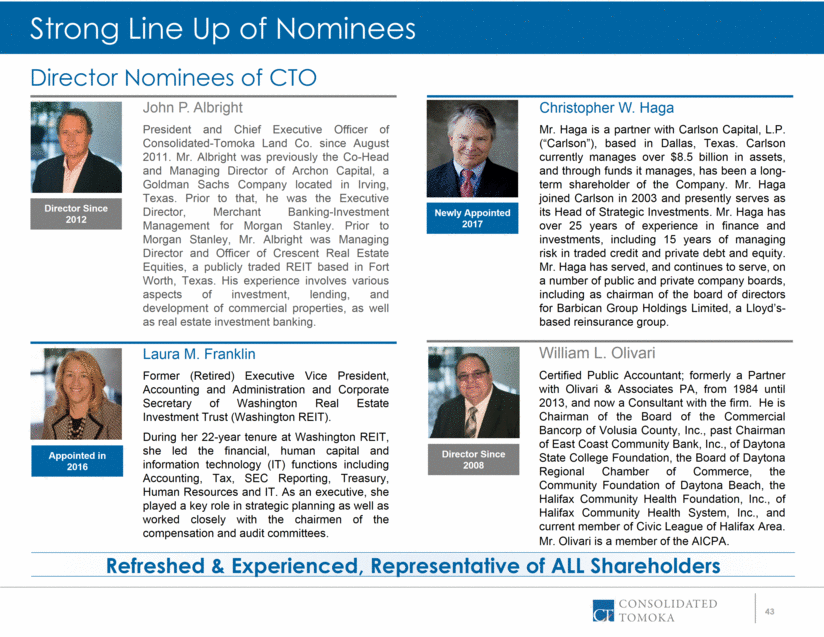
| 43 John P. Albright President and Chief Executive Officer of Consolidated-Tomoka Land Co. since August 2011. Mr. Albright was previously the Co-Head and Managing Director of Archon Capital, a Goldman Sachs Company located in Irving, Texas. Prior to that, he was the Executive Director, Merchant Banking-Investment Management for Morgan Stanley. Prior to Morgan Stanley, Mr. Albright was Managing Director and Officer of Crescent Real Estate Equities, a publicly traded REIT based in Fort Worth, Texas. His experience involves various aspects of investment, lending, and development of commercial properties, as well as real estate investment banking. Director Nominees of CTO Director Since 2012 Laura M. Franklin Former (Retired) Executive Vice President, Accounting and Administration and Corporate Secretary of Washington Real Estate Investment Trust (Washington REIT). During her 22-year tenure at Washington REIT, she led the financial, human capital and information technology (IT) functions including Accounting, Tax, SEC Reporting, Treasury, Human Resources and IT. As an executive, she played a key role in strategic planning as well as worked closely with the chairmen of the compensation and audit committees. Appointed in 2016 Christopher W. Haga Mr. Haga is a partner with Carlson Capital, L.P. (“Carlson”), based in Dallas, Texas. Carlson currently manages over $8.5 billion in assets, and through funds it manages, has been a long-term shareholder of the Company. Mr. Haga joined Carlson in 2003 and presently serves as its Head of Strategic Investments. Mr. Haga has over 25 years of experience in finance and investments, including 15 years of managing risk in traded credit and private debt and equity. Mr. Haga has served, and continues to serve, on a number of public and private company boards, including as chairman of the board of directors for Barbican Group Holdings Limited, a Lloyd’s-based reinsurance group. Newly Appointed 2017 William L. Olivari Certified Public Accountant; formerly a Partner with Olivari & Associates PA, from 1984 until 2013, and now a Consultant with the firm. He is Chairman of the Board of the Commercial Bancorp of Volusia County, Inc., past Chairman of East Coast Community Bank, Inc., of Daytona State College Foundation, the Board of Daytona Regional Chamber of Commerce, the Community Foundation of Daytona Beach, the Halifax Community Health Foundation, Inc., of Halifax Community Health System, Inc., and current member of Civic League of Halifax Area. Mr. Olivari is a member of the AICPA. Director Since 2008 Strong Line Up of Nominees Refreshed & Experienced, Representative of ALL Shareholders |
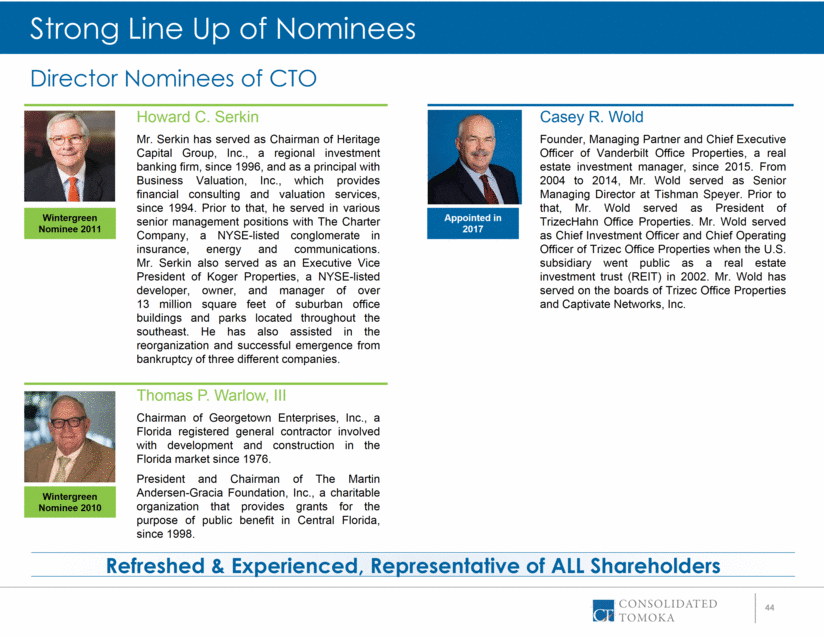
| 44 Howard C. Serkin Mr. Serkin has served as Chairman of Heritage Capital Group, Inc., a regional investment banking firm, since 1996, and as a principal with Business Valuation, Inc., which provides financial consulting and valuation services, since 1994. Prior to that, he served in various senior management positions with The Charter Company, a NYSE-listed conglomerate in insurance, energy and communications. Mr. Serkin also served as an Executive Vice President of Koger Properties, a NYSE-listed developer, owner, and manager of over 13 million square feet of suburban office buildings and parks located throughout the southeast. He has also assisted in the reorganization and successful emergence from bankruptcy of three different companies. Wintergreen Nominee 2011 Thomas P. Warlow, III Chairman of Georgetown Enterprises, Inc., a Florida registered general contractor involved with development and construction in the Florida market since 1976. President and Chairman of The Martin Andersen-Gracia Foundation, Inc., a charitable organization that provides grants for the purpose of public benefit in Central Florida, since 1998. Wintergreen Nominee 2010 Director Nominees of CTO Casey R. Wold Founder, Managing Partner and Chief Executive Officer of Vanderbilt Office Properties, a real estate investment manager, since 2015. From 2004 to 2014, Mr. Wold served as Senior Managing Director at Tishman Speyer. Prior to that, Mr. Wold served as President of TrizecHahn Office Properties. Mr. Wold served as Chief Investment Officer and Chief Operating Officer of Trizec Office Properties when the U.S. subsidiary went public as a real estate investment trust (REIT) in 2002. Mr. Wold has served on the boards of Trizec Office Properties and Captivate Networks, Inc. Appointed in 2017 Strong Line Up of Nominees Refreshed & Experienced, Representative of ALL Shareholders |
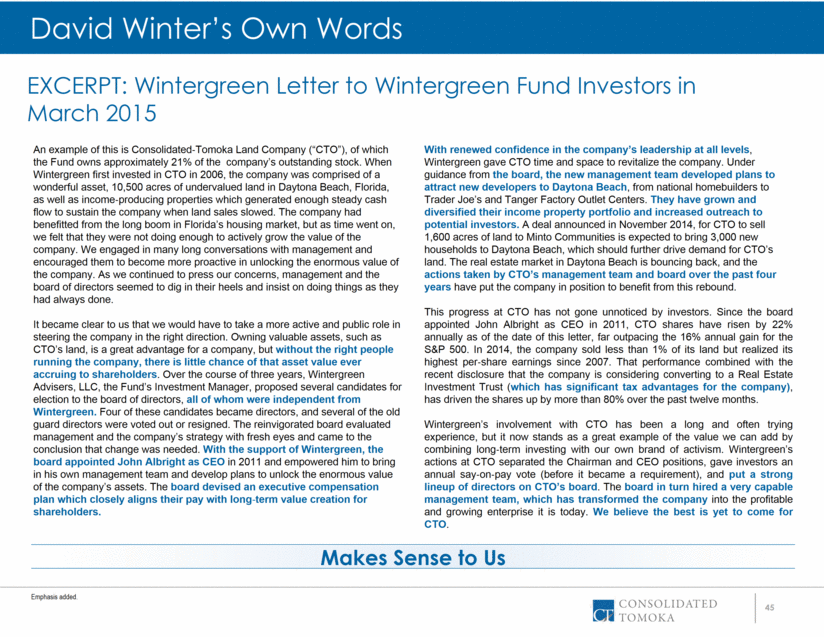
| 45 Makes Sense to Us EXCERPT: Wintergreen Letter to Wintergreen Fund Investors in March 2015 Emphasis added. An example of this is Consolidated‐Tomoka Land Company (“CTO”), of which the Fund owns approximately 21% of the company’s outstanding stock. When Wintergreen first invested in CTO in 2006, the company was comprised of a wonderful asset, 10,500 acres of undervalued land in Daytona Beach, Florida, as well as income‐producing properties which generated enough steady cash flow to sustain the company when land sales slowed. The company had benefitted from the long boom in Florida’s housing market, but as time went on, we felt that they were not doing enough to actively grow the value of the company. We engaged in many long conversations with management and encouraged them to become more proactive in unlocking the enormous value of the company. As we continued to press our concerns, management and the board of directors seemed to dig in their heels and insist on doing things as they had always done. It became clear to us that we would have to take a more active and public role in steering the company in the right direction. Owning valuable assets, such as CTO’s land, is a great advantage for a company, but without the right people running the company, there is little chance of that asset value ever accruing to shareholders. Over the course of three years, Wintergreen Advisers, LLC, the Fund’s Investment Manager, proposed several candidates for election to the board of directors, all of whom were independent from Wintergreen. Four of these candidates became directors, and several of the old guard directors were voted out or resigned. The reinvigorated board evaluated management and the company’s strategy with fresh eyes and came to the conclusion that change was needed. With the support of Wintergreen, the board appointed John Albright as CEO in 2011 and empowered him to bring in his own management team and develop plans to unlock the enormous value of the company’s assets. The board devised an executive compensation plan which closely aligns their pay with long‐term value creation for shareholders. With renewed confidence in the company’s leadership at all levels, Wintergreen gave CTO time and space to revitalize the company. Under guidance from the board, the new management team developed plans to attract new developers to Daytona Beach, from national homebuilders to Trader Joe’s and Tanger Factory Outlet Centers. They have grown and diversified their income property portfolio and increased outreach to potential investors. A deal announced in November 2014, for CTO to sell 1,600 acres of land to Minto Communities is expected to bring 3,000 new households to Daytona Beach, which should further drive demand for CTO’s land. The real estate market in Daytona Beach is bouncing back, and the actions taken by CTO’s management team and board over the past four years have put the company in position to benefit from this rebound. This progress at CTO has not gone unnoticed by investors. Since the board appointed John Albright as CEO in 2011, CTO shares have risen by 22% annually as of the date of this letter, far outpacing the 16% annual gain for the S&P 500. In 2014, the company sold less than 1% of its land but realized its highest per‐share earnings since 2007. That performance combined with the recent disclosure that the company is considering converting to a Real Estate Investment Trust (which has significant tax advantages for the company), has driven the shares up by more than 80% over the past twelve months. Wintergreen’s involvement with CTO has been a long and often trying experience, but it now stands as a great example of the value we can add by combining long‐term investing with our own brand of activism. Wintergreen’s actions at CTO separated the Chairman and CEO positions, gave investors an annual say‐on‐pay vote (before it became a requirement), and put a strong lineup of directors on CTO’s board. The board in turn hired a very capable management team, which has transformed the company into the profitable and growing enterprise it is today. We believe the best is yet to come for CTO. David Winter’s Own Words |
| 46 IMPORTANT ADDITIONAL INFORMATION AND WHERE TO FIND IT The Company, its directors and certain of its executive officers may be deemed to be participants in the solicitation of proxies from the Company’s shareholders in connection with the matters to be considered at the Company’s 2018 annual meeting of shareholders to be held on April 25, 2018. On March 12, 2018, the Company filed a definitive proxy statement (the “Proxy Statement”) with the U.S. Securities and Exchange Commission (the “SEC”) in connection with the solicitation of proxies from the Company’s shareholders for the 2018 annual meeting. INVESTORS AND SHAREHOLDERS ARE STRONGLY ENCOURAGED TO READ THE PROXY STATEMENT AND ACCOMPANYING WHITE PROXY CARD WITH RESPECT TO THE 2018 ANNUAL MEETING, AND OTHER DOCUMENTS FILED WITH THE SEC, CAREFULLY AND IN THEIR ENTIRETY AS THEY WILL CONTAIN IMPORTANT INFORMATION. Shareholders may obtain the Proxy Statement, any amendments or supplements to the Proxy Statement and other documents filed by the Company with the SEC for no charge at the SEC’s website at www.sec.gov. Copies will also be available at no charge at the Investor Relations section of our corporate website at www.ctlc.com. End Notes references utilized in this presentation Certain transactions require the Company to incur the cost to provide mitigation credits necessary for applicable regulatory permits for the buyer. There can be no assurances regarding the value ultimately received for the Company’s assets, or in the case of the transactions under contract or subject to a non-binding term sheet, the likelihood that such transactions will close or the timing or final terms thereof. There can be no assurances regarding the likelihood or timing of future execution of the Company’s share repurchase program. Net operating income (“NOI”) relates to our Income Property Operations segment and is calculated based on our current portfolio as of March 29, 2018 reflecting: (i) expected estimated annualized rents and costs as of and for the twelve months ended December 31, 2018; (ii) excluding non-cash items including straight-line rent and amortization of lease intangibles and depreciation; plus (iii) annual revenue from billboard leases. As of the date of this presentation, the Company meets the required coverage ratio in the Credit Facility for repurchases of stock and anticipates, subject to customary restrictions on share repurchases, to be able to continue to make repurchases. Debt amount includes the face value of the Convertible Notes as of December 31, 2017. There can be no assurance that the cap rate range is the proper range for the Company’s portfolio of income properties or that such cap rate range would equate to an appropriate valuation range that the Company might achieve should the income property portfolio be sold as a portfolio, individually, or as part of more than one smaller portfolios comprising the entirety of the Company’s portfolio. Dividends are set by the Board of Directors and declared on a quarterly basis, there can be no assurances as to the likelihood or amount of dividends in the future. There can be no assurances regarding the amount of our total investment or the timing of such investment. Additional Info & End Notes Footnotes for Slide #13 The amount for the Mitigation Bank represents the amount set forth in the term sheet for the buyer’s acquisition of approximately 70% of a to-be-formed joint venture that would own the Mitigation Bank, with the Company retaining 30%. Land sales transaction that requires the Company to incur the cost to provide the mitigation credits necessary for obtaining the applicable regulatory permits for the buyer, with such costs representing either our basis in credits that we own or the incurrence of costs to acquire the credits potentially equaling 5%-10% of the contract amount noted. The acres and amount include the buyer’s option to acquire 19 acres for approximately $2.0 million, in addition to the base contract of 26 acres for approximately $3.2 million The acres and amount include the buyer’s option to acquire 71 acres for approximately $574,000, in addition to the base contract of 129 acres for approximately $2.75 million Includes, pursuant to the contract, reimbursement of infrastructure costs incurred by CTO plus interest through December 31, 2017. |
| April 2018 Consolidated-Tomoka Land Co. 1140 N. Williamson Boulevard Daytona Beach, FL 32114 P: 386.274.2202 F: 386.274.1223 info@ctlc.com www.ctlc.com NYSE American: CTO Contact Us For additional information, please see our most recent Annual Report on Form 10-K, copies of which may be obtained by writing the corporate secretary at the address above, or at www.ctlc.com. (NYSE American: CTO) Investor Presentation – 2018 Annual Meeting E. Hyman Avenue & Hunter Street Downtown Aspen, Colorado |
