Exhibit 99.1
NYSE American: CTO 2019 REITWEEK PRESENTATION Falls Church, Virginia Winston Salem, North Carolina CTO’s 50TH YEAR on the NYSE |
FORWARD LOOKING STATEMENTS CONSOLIDATED TOMOKA If we refer to “we,” “us,” “our,” or “the Company,” we mean Consolidated-Tomoka Land Co. and its consolidated subsidiaries. Certain statements contained in this presentation (other than statements of historical fact) are forward-looking statements. Words such as “believe,” “estimate,” “expect,” “intend,” “anticipate,” “will,” “could,” “may,” “should,” “plan,” “potential,” “predict,” “forecast,” “project,” and similar expressions and variations thereof identify certain of such forward-looking statements, which speak only as of the dates on which they were made. Although forward-looking statements are made based upon management’s expectations and beliefs concerning future Company actions and developments and their potential effect upon the Company, a number of factors could cause the Company’s actual results to differ materially from those set forth in the forward-looking statements. Such factors may include uncertainties associated with the following: closing of pending land transactions or other dispositions of assets, including the likelihood, timing, and final transaction terms thereof; the estimate of the cost of completing improvements affiliated with certain investments; the impact of permitting or other transactional activities on the total estimated gain for land sales, as well as the timing of the recognition of such gains;, our ability to obtain necessary governmental approvals for our land transactions or to satisfy other closing conditions; the risks associated with development activities including potential tax ramifications; the ability to execute share repurchase transactions; the completion of 1031 transactions; the ability for the Company to convert to a real estate investment trust; the costs of improvements for the Golf Operations assets; the ability to achieve certain leasing activity including the timing and terms thereof; the Company’s determination to pay future dividends; as well as the uncertainties and risk factors discussed in our Annual Report on Form 10-K for the year ended December 31, 2018, filed with the Securities and Exchange Commission. There can be no assurance that future developments will be in accordance with management’s expectations or that the effect of future developments on the Company will be those anticipated by management. 2 ENDNOTE REFERENCES (A) THROUGH (J) USED THROUGHOUT THIS PRESENTATION ARE FOUND ON SLIDE 45 |
CTO SNAPSHOT CONSOLIDATED TOMOKA As of May 31, 2019 (unless otherwise noted) Portfolio Quality Organic Capital Source Discount to NAV 3 INCOME PROPERTIES 47 14 2.3mm $32.8mm STATES SQUARE FEET ANNUALIZED NOI (C) TOTAL ACRES REMAINING 5,300+ 3,200 $180.0mm ACRES UNDER CONTRACT (A) TOTAL ESTIMATED VALUE (1) EQUITY MARKET CAP $296mm $244mm $540mm NET DEBT (AT FACE VALUE) TOTAL ENTERPRISE VALUE Q1 2019 EARNINGS PER SHARE $1.21 $39.72 45% Q1 2019 BOOK VALUE PER SHARE DEBT/TEV INCOME PROPERTIES LAND HOLDINGS TOTAL ENTERPRISE VALUE (TEV) FINANCIAL METRICS Total estimated value for all 5,300 acres based on NAV worksheet on Slide #7 SHARES OUTSTANDING 4,950,565 FIDELITY, ALBUQUERQUE, NM 210,067 SF WELLS FARGO, RALEIGH, NC 450,393 SF ASPEN DEVELOPMENT, ASPEN, CO 19,596 SF 24 HOUR, FALLS CHURCH, VA 46,000 SF |
YTD 2019 HIGHLIGHTS CONSOLIDATED TOMOKA Continuing to Execute Our Strategy 4 MONETIZING LAND HARVEST MULTI-TENANT REDEPLOY PROCEEDS INTO SINGLE-TENANT RETAIL TOTAL SALES PRICE: $7.0 million ACRES: ≈60.5 PRICE PER ACRE: $116,000 GAIN: $4.8mm ($0.70/share, net of tax) TOTAL SALES PRICE: $42.9 million LOCATIONS: Sarasota FL, Winter Park FL GAIN: $9.6mm ($1.37/share, net of tax) WGTD. AVG. EXIT CAP RATE: 5.82% SHARE BUYBACK RETURNING CAPITAL TO SHAREHOLDERS INVESTED CAPITAL: $29.6 million TOTAL SHARES: 508,309 AVG. PRICE/SHARE: $58.33 INVESTING IN INCOME AGGREGATE PRICE: $29.3 million AGGREGATE SQUARE FEET: 101,000 WGTD. AVG. CAP RATE: 6.47% AGGREGATE NOI: $1.9mm As of May 31, 2019 |
’14 – ’18 CAGR 29% ’14 – ’18 CAGR 52% ’14 – ’18 CAGR 50% ’14 – ’18 CAGR 16% ($000’s) TRACK RECORD OF STRONG OPERATING RESULTS CONSOLIDATED TOMOKA Annual Results for 2014 –2018, 1st Quarter for 2019 ($000’s) Consistent Growth in Key Metrics (1) Basic Earnings per Share including from discontinued operations (2) Annual Results as of December 31 and 2019 as of 3/31/19 (3) Prior periods adjusted to reflect reclassification of Golf Operations as a discontinued operation 5 Total Revenues (3) Operating Income (3) Book Value Per Share Earnings Per Share (1) (2) $30,932 $37,755 $65,885 $86,317 $86,689 $14,259 $- $20,000 $40,000 $60,000 $80,000 $100,000 2014 2015 2016 2017 2018 Q1 2019 $11,947 $20,882 $37,982 $39,256 $63,493 $11,724 $- $10,000 $20,000 $30,000 $40,000 $50,000 $60,000 $70,000 2014 2015 2016 2017 2018 Q1 2019 $21.83 $22.81 $25.97 $32.98 $38.95 $39.72 $0.00 $5.00 $10.00 $15.00 $20.00 $25.00 $30.00 $35.00 $40.00 $45.00 2014 2015 2016 2017 2018 Q1 2019 $0.00 $2.00 $4.00 $6.00 $8.00 2014 2015 2016 2017 2018 Q1 2019 $1.11 $1.44 $2.86 $7.53 $6.76 $1.21 |
COMPONENTS OF CTO’S VALUE CONSOLIDATED TOMOKA A Lot More Income than Land Percentages based on values derived on NAV worksheet on Slide #7 Excluding Cash & Restricted Cash 47 Properties 2.3 million Sq. Ft. Retail and Office NOI $32.8 million (C) Subsurface Interests >450,000 Acres 5,300 Total Acres 3,187 Acres (60%)(A) Under Contract for $90.0 million(A) Avg. Price of $28k/acre % of Total Value of Asset Components (1) As of May 31, 2019 (unless otherwise noted) 6 Income Land Other 71% 3% 26% |
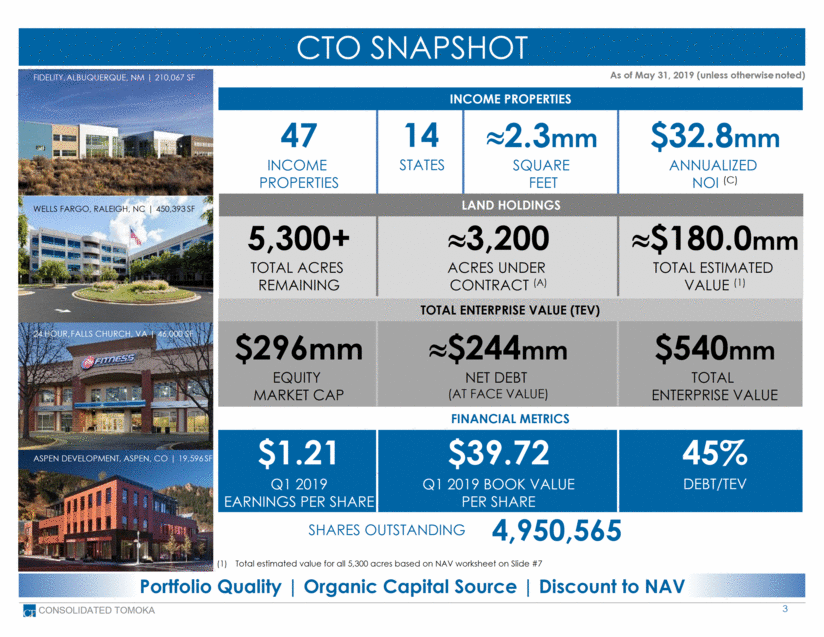
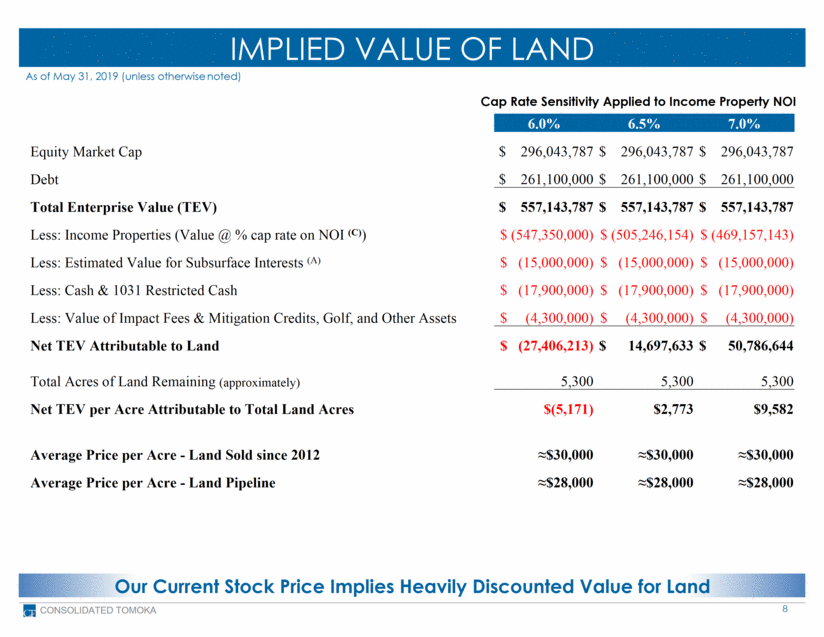
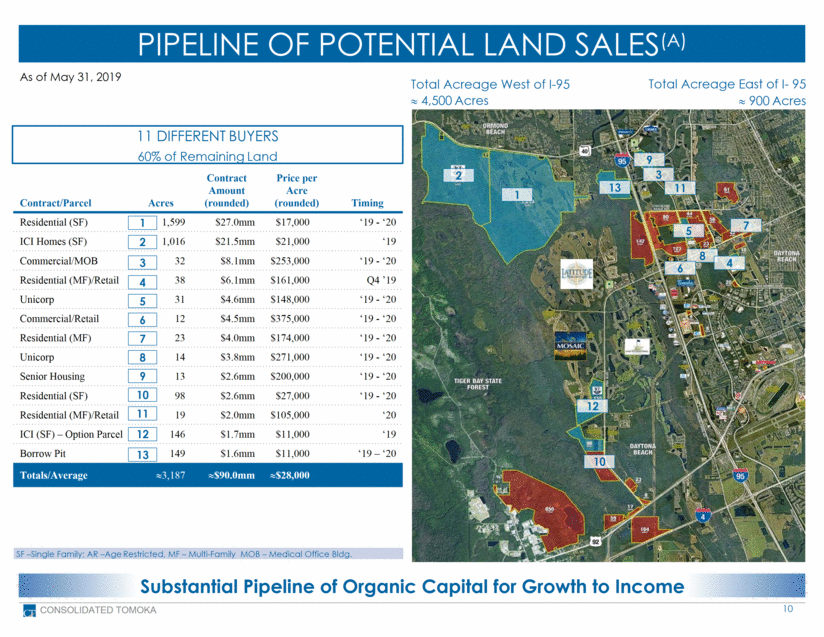
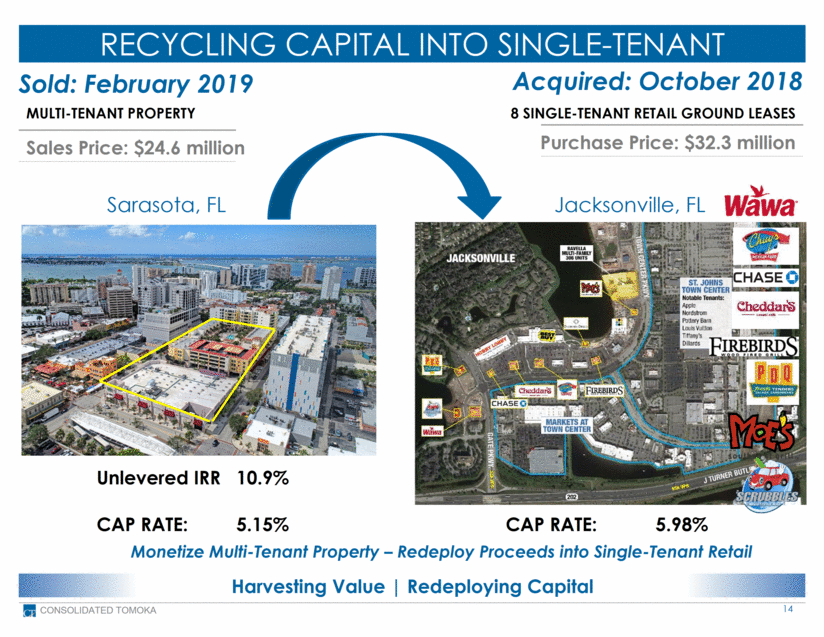
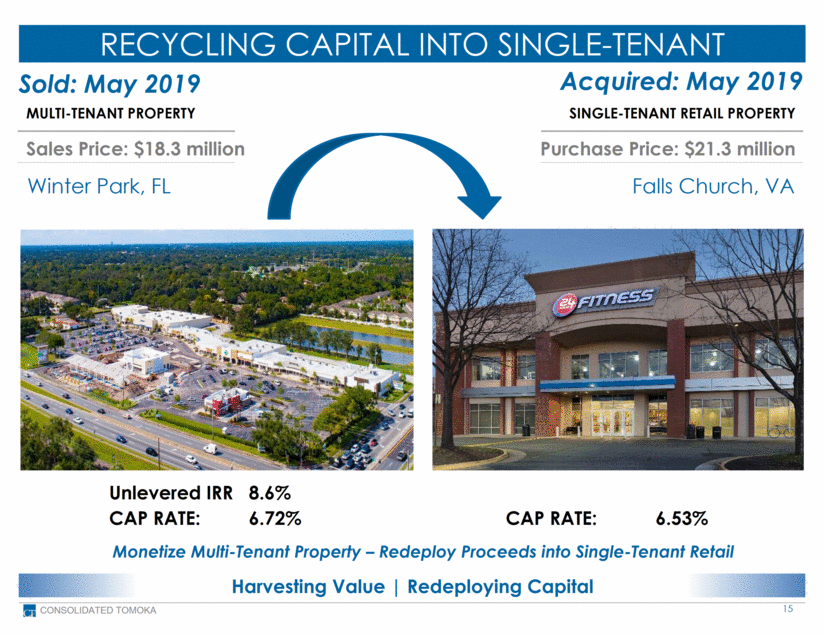
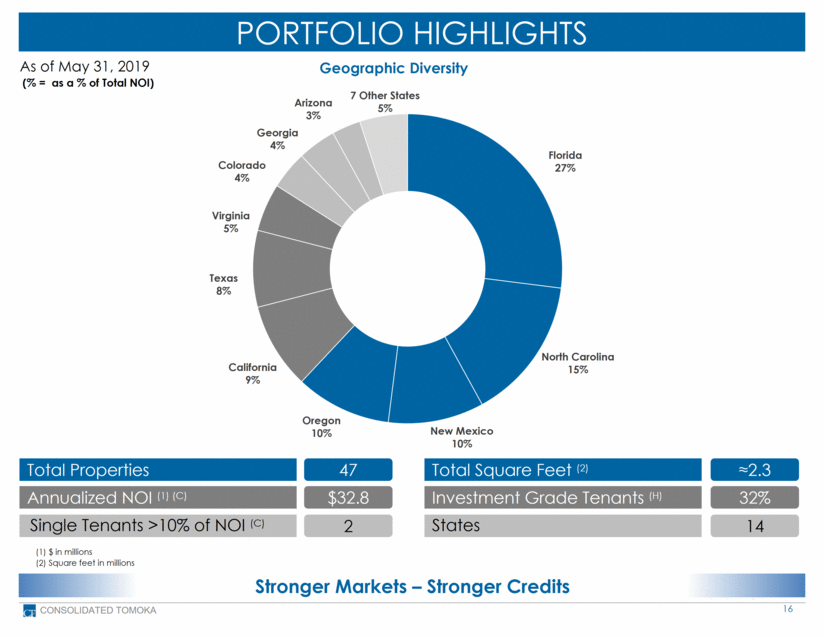
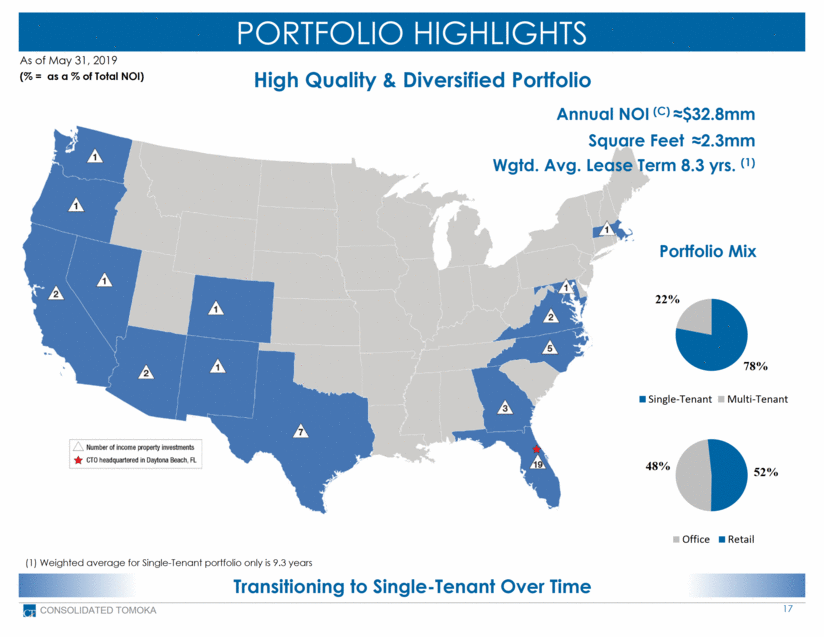
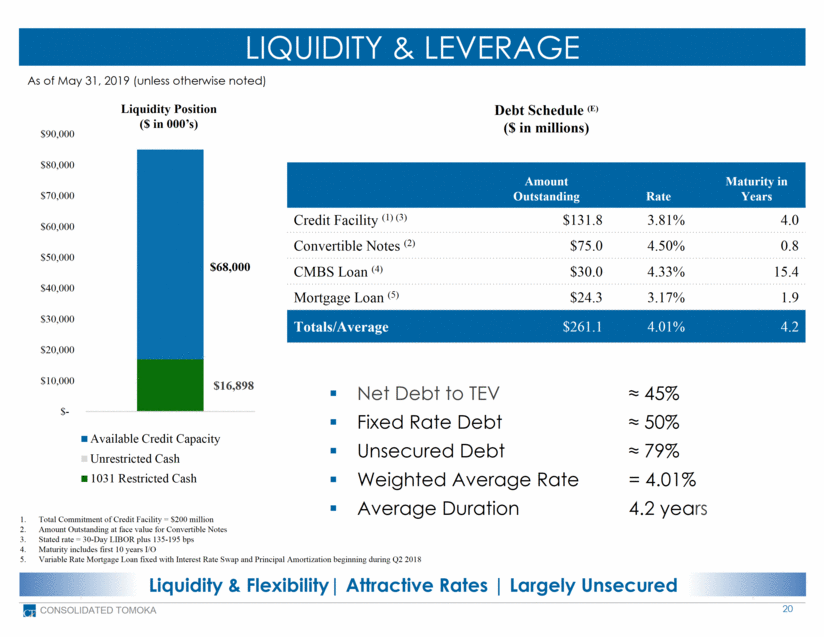
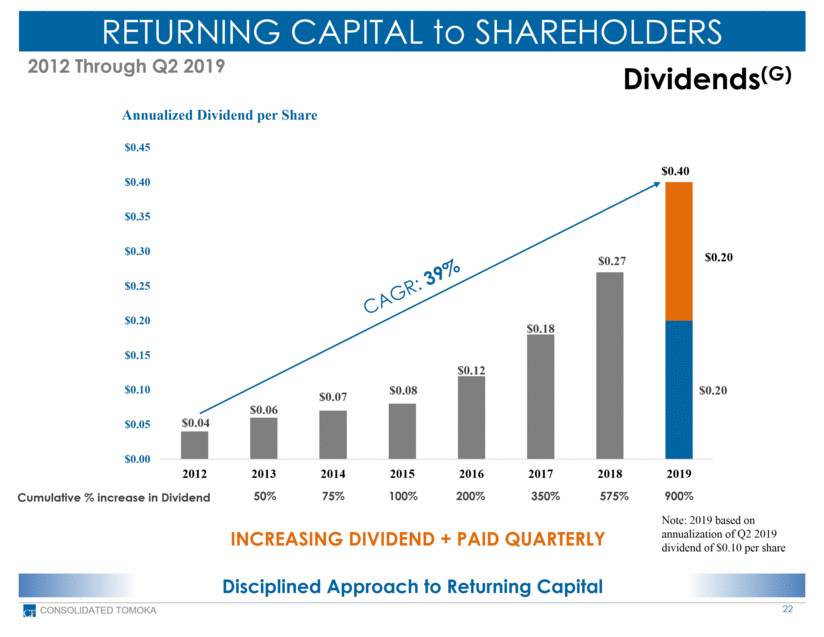
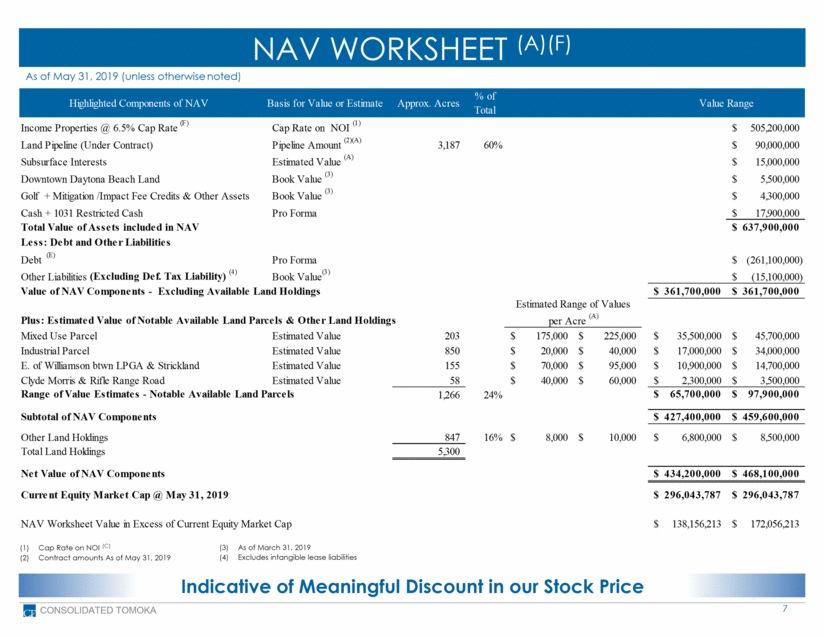
NAV WORKSHEET (A)(F) CONSOLIDATED TOMOKA Indicative of Meaningful Discount in our Stock Price 7 Cap Rate on NOI (C) Contract amounts As of May 31, 2019 As of March 31, 2019 Excludes intangible lease liabilities As of May 31, 2019 (unless otherwise noted) Highlighted Components of NAV Basis for Value or Estimate Approx. Acres % of Total Income Properties @ 6.5% Cap Rate (F) Cap Rate on NOI (1) 505,200,000 $ Land Pipeline (Under Contract) Pipeline Amount (2)(A) 3,187 60% 90,000,000 $ Subsurface Interests Estimated Value (A) 15,000,000 $ Downtown Daytona Beach Land Book Value (3) 5,500,000 $ Golf + Mitigation /Impact Fee Credits & Other Assets Book Value (3) 4,300,000 $ Cash + 1031 Restricted Cash Pro Forma 17,900,000 $ Total Value of Assets included in NAV 637,900,000 $ Less: Debt and Other Liabilities Debt (E) Pro Forma (261,100,000) $ Other Liabilities (Excluding Def. Tax Liability) (4) Book Value (3) (15,100,000) $ Value of NAV Components - Excluding Available Land Holdings 361,700,000 $ 361,700,000 $ Plus: Estimated Value of Notable Available Land Parcels & Other Land Holdings Mixed Use Parcel Estimated Value 203 175,000 $ 225,000 $ 35,500,000 $ 45,700,000 $ Industrial Parcel Estimated Value 850 20,000 $ 40,000 $ 17,000,000 $ 34,000,000 $ E. of Williamson btwn LPGA & Strickland Estimated Value 155 70,000 $ 95,000 $ 10,900,000 $ 14,700,000 $ Clyde Morris & Rifle Range Road Estimated Value 58 40,000 $ 60,000 $ 2,300,000 $ 3,500,000 $ Range of Value Estimates - Notable Available Land Parcels 1,266 24% 65,700,000 $ 97,900,000 $ Subtotal of NAV Components 427,400,000 $ 459,600,000 $ Other Land Holdings 847 16% 8,000 $ 10,000 $ 6,800,000 $ 8,500,000 $ Total Land Holdings 5,300 Net Value of NAV Components 434,200,000 $ 468,100,000 $ Current Equity Market Cap @ May 31, 2019 296,043,787 $ 296,043,787 $ NAV Worksheet Value in Excess of Current Equity Market Cap 138,156,213 $ 172,056,213 $ Estimated Range of Values per Acre (A) Value Range |
IMPLIED VALUE OF LAND CONSOLIDATED TOMOKA Our Current Stock Price Implies Heavily Discounted Value for Land 8 As of May 31, 2019 (unless otherwise noted) Cap Rate Sensitivity Applied to Income Property NOI 6.0% 6.5% 7.0% Equity Market Cap $ 296,043,787 $ 296,043,787 $ 296,043,787 Debt $ 261,100,000 $ 261,100,000 $ 261,100,000 Total Enterprise Value (TEV) $ 557,143,787 $ 557,143,787 $ 557,143,787 Less: Income Properties (Value @ % cap rate on NOI (C)) $ (547,350,000) $ (505,246,154) $ (469,157,143) Less: Estimated Value for Subsurface Interests (A) $ (15,000,000) $ (15,000,000) $ (15,000,000) Less: Cash & 1031 Restricted Cash $ (17,900,000) $ (17,900,000) $ (17,900,000) Less: Value of Impact Fees & Mitigation Credits, Golf, and Other Assets $ (4,300,000) $ (4,300,000) $ (4,300,000) Net TEV Attributable to Land $ (27,406,213) $ 14,697,633 $ 50,786,644 Total Acres of Land Remaining (approximately) 5,300 5,300 5,300 Net TEV per Acre Attributable to Total Land Acres $(5,171) $2,773 $9,582 Average Price per Acre - Land Sold since 2012 ≈$30,000 ≈$30,000 ≈$30,000 Average Price per Acre - Land Pipeline ≈$28,000 ≈$28,000 ≈$28,000 |
MOMENTUM MONETIZING LAND CONSOLIDATED TOMOKA Monetizing Land With Tax Deferred Strategy (Land Sales in $000’s) Dramatic Acceleration Monetizing Land Annual Land Sales: 2013 –2018, YTD 2019 & Pipeline(A) as of 5/31/19 9 (2) (1) (1) ACRES SOLD 11.7 99.6 114.0 707.6 1,700.9 2,697.3 2013 – 2018 and YTD 2019 Total Sales $161.1mm Acres Sold 5,392 Total Pipeline(A) : ≈3,187 Acres Proceeds ≈$90.0mm (1) (1) Includes sales proceeds representing reimbursement of infrastructure costs incurred by CTO of $1.4mm, $143k, $1.5mm and $1.6mm for 2015, 2016, 2017, and 2018, respectively (2) Includes proceeds of $15.3mm from the sale of 70% interest in mitigation bank joint venture (1) $62,390 $69,400 60.5 $2,990 $8,807 $23,946 $13,902 $47,011 $59,019 $7,010 $0 $15,000 $30,000 $45,000 $60,000 $75,000 $90,000 2013 2014 2015 2016 2017 2018 2019 |
Contract/Parcel Acres Contract Amount (rounded) Price per Acre (rounded) Timing Residential (SF) 1,599 $27.0mm $17,000 ‘19 - ‘20 ICI Homes (SF) 1,016 $21.5mm $21,000 ‘19 Commercial/MOB 32 $8.1mm $253,000 ‘19 - ‘20 Residential (MF)/Retail 38 $6.1mm $161,000 Q4 ’19 Unicorp 31 $4.6mm $148,000 ‘19 - ‘20 Commercial/Retail 12 $4.5mm $375,000 ‘19 - ‘20 Residential (MF) 23 $4.0mm $174,000 ‘19 - ‘20 Unicorp 14 $3.8mm $271,000 ‘19 - ‘20 Senior Housing 13 $2.6mm $200,000 ‘19 - ‘20 Residential (SF) 98 $2.6mm $27,000 ‘19 - ‘20 Residential (MF)/Retail 19 $2.0mm $105,000 ‘20 ICI (SF) – Option Parcel 146 $1.7mm $11,000 ‘19 Borrow Pit 149 $1.6mm $11,000 ‘19 – ‘20 Totals/Average 3,187 $90.0mm $28,000 PIPELINE OF POTENTIAL LAND SALES(A) As of May 31, 2019 SF –Single Family; AR –Age Restricted, MF – Multi-Family MOB – Medical Office Bldg. Substantial Pipeline of Organic Capital for Growth to Income CONSOLIDATED TOMOKA 10 Total Acreage East of I- 95 900 Acres Total Acreage West of I-95 4,500 Acres 11 2 3 4 5 6 7 8 10 9 1 11 DIFFERENT BUYERS 60% of Remaining Land 12 13 1 2 3 7 11 8 9 5 10 6 4 12 13 |
INCOME PROPERTY INVESTMENTS Converting into Income ($000’s) Total Acquisitions for 2013 – 2018, YTD 2019 and Est. for Remainder of 2019 (J) Diversified Markets Higher Quality Properties Net of master tenant purchase contribution of $1.5 million for acquisition of income property in Aspen, CO in Q1 2018 Includes the investment of approximately $4.7 million for the acquisition of properties in downtown Daytona Beach, Florida in opportunity zone 11 2012 – 2018 Total Income Property Acquisitions $499.3mm (J) As of May 31, 2019 (1)(2) $100,000 $80,675 $29,325 $39,272 $42,166 $81,734 $91,475 $79,800 $109,800 $0 $20,000 $40,000 $60,000 $80,000 $100,000 $120,000 2013 2014 2015 2016 2017 2018 2019 Est. |
SINGLE-TENANT OFFICE INVESTMENT CONSOLIDATED TOMOKA Long Term Lease – Strong Retail Corridor 12 Single Tenant Retail 7.6 Acres 11-year Lease Term Rent Escalations every 5 yrs. Year Built 2015 Investment basis $147/SF Acquisition Cap Rate 6.30% Investment $8.1 Million 11-Year NNN Lease 55,000 Square Feet Acquired May 2019 Winston Salem, NC |
SINGLE-TENANT OFFICE INVESTMENT CONSOLIDATED TOMOKA Strong Demographics – Infill Location 13 Single Tenant Retail 3.09 Acres 9-year Lease Term Rent Escalations every 5 yrs. Renovated 2012 6 miles from the Pentagon FAR estimated at 3.0x – ability to develop 400k sf of density and approved for multiple residential and commercial uses Acquisition Cap Rate 6.53% Investment $21.3 Million 9-Year NNN Lease 46,000 Square Feet Acquired May 2019 Falls Church, VA |
RECYCLING CAPITAL INTO SINGLE-TENANT CONSOLIDATED TOMOKA Sales Price: $24.6 million Sarasota, FL MULTI-TENANT PROPERTY Harvesting Value Redeploying Capital 14 Monetize Multi-Tenant Property – Redeploy Proceeds into Single-Tenant Retail Jacksonville, FL CAP RATE: 5.98% Purchase Price: $32.3 million 8 SINGLE-TENANT RETAIL GROUND LEASES CAP RATE: 5.15% Acquired: October 2018 Sold: February 2019 Unlevered IRR 10.9% |
RECYCLING CAPITAL INTO SINGLE-TENANT CONSOLIDATED TOMOKA Sales Price: $18.3 million Winter Park, FL MULTI-TENANT PROPERTY Harvesting Value Redeploying Capital 15 Monetize Multi-Tenant Property – Redeploy Proceeds into Single-Tenant Retail Falls Church, VA CAP RATE: 6.53% Purchase Price: $21.3 million SINGLE-TENANT RETAIL PROPERTY CAP RATE: 6.72% Acquired: May 2019 Sold: May 2019 Unlevered IRR 8.6% |
PORTFOLIO HIGHLIGHTS CONSOLIDATED TOMOKA Stronger Markets – Stronger Credits 16 (% = as a % of Total NOI) As of May 31, 2019 Total Square Feet (2) Investment Grade Tenants (H) ≈2.3 32% States 14 Total Properties Annualized NOI (1) (C) 47 $32.8 Single Tenants >10% of NOI (C) 2 Geographic Diversity (1) $ in millions (2) Square feet in millions Florida 27% North Carolina 15% New Mexico 10% Oregon 10% California 9% Texas 8% Virginia 5% Colorado 4% Georgia 4% Arizona 3% 7 Other States 5% |
PORTFOLIO HIGHLIGHTS As of May 31, 2019 CONSOLIDATED TOMOKA Transitioning to Single-Tenant Over Time 17 Portfolio Mix (% = as a % of Total NOI) (1) Weighted average for Single-Tenant portfolio only is 9.3 years Annual NOI (C) ≈$32.8mm Wgtd. Avg. Lease Term 8.3 yrs. (1) Square Feet ≈2.3mm High Quality & Diversified Portfolio 48% 52% Office Retail 78% 22% Single-Tenant Multi-Tenant |
TOP TENANTS VERSUS PEERS CONSOLIDATED TOMOKA Which Would You Rather Own? 18 BBB 3.4% BBB- 3.3% BBB 3.0% BBB 2.6% B- 5.5% 8.9 46% 63%/37%/0% Discount -2% Stock Price vs NAV(1)(4) Avg. Lease Term (1)(4) Leverage Level (1) (4) Retail/Office/Other (4) 14.0 32% 83%/17%/0% Premium 25% B+ 2.4% NR 1.7% NR 1.6% NR 2.7% 10.2 23% 100%/0%/0% Premium 31% BBB 5.9% AA 3.6% BBB 4.6% NR 3.4% A+ 3.3% 9.3 45% 52%/48%/0% Discount -35% BB+ 5.5% NR 4.0% NR 4.2% AG Hill A 18.0% BBB 6.1% AA- 5.4% BBB 4.0% BBB 4.7% B+ 3.6% 9.2 25% 82%/16%/2% Premium 30% NR 3.9% NR 3.3% NR 3.2% B- 3.6% NR 4.5% 14.0 26% 100%/0%/0% Premium 24% AA- 5.3% B- 4.4% NR 3.9% B 3.6% B+ 4.4% 11.5 29% 100%/0%/0% Premium 21% NR 10.4% CTO info as of May 31, 2019 and Discount to NAV from B Reilly FBR NAV as of January 11, 2019; CTO Avg. Lease Term is STNL properties only BLUE Letters denote S&P Investment Grade ratings % per tenant is as % of NOI for CTO, as of May 31, 2019, % of Base Rent (for ADC, VEREIT, NNN, O, EPRT), Rent + Interest for STOR - as of March 31, 2019 Source for Peers: Janney Montgomery Scott LLC and BMO as of May 31, 2019 NR 2.2% |
HOW CTO’S PORTFOLIO STACKS UP CONSOLIDATED TOMOKA Stronger Demographics = Better Markets & Long-Term Real Estate 19 Three Mile Population(1)(3) Implied Cap Rate(2) 3-Mile Avg. Household Income(1)(3) CTO info as of May 31, 2019 Peer implied cap rates info from Janney Montgomery Scott LLC as of May 31, 2019 Peer Demographic Info: B. Riley FBR as of 2018 Based on 6.5% cap rate for NOI – see slide #8 Another Perspective on the Quality of CTO’s Portfolio (vs. Peers) CTO Stock Price at 5/31/19 $59.80 Implied Value of Land/Acre (based on est. NAV) (4) $2,800 Avg. Price/Acre of Land Under Contract $28,000 Avg. Price/Acre of 5,400 Acres Sold since 2012 $30,000 86,220 58,917 55,798 50,932 52,430 63,800 0 20,000 40,000 60,000 80,000 100,000 CTO NNN O ADC VER STOR 5.4% 5.0% 4.5% 6.6% 5.5% 0.0% 5.0% 10.0% CTO NNN O ADC VER STOR $90,491 $76,293 $74,990 $70,831 $71,257 $72,042 $0 $20,000 $40,000 $60,000 $80,000 $100,000 CTO NNN O ADC VER STOR |
LIQUIDITY & LEVERAGE CONSOLIDATED TOMOKA Net Debt to TEV ≈ 45% Fixed Rate Debt ≈ 50% Unsecured Debt ≈ 79% Weighted Average Rate = 4.01% Average Duration 4.2 years As of May 31, 2019 (unless otherwise noted) Debt Schedule (E) ($ in millions) Liquidity Position ($ in 000’s) Total Commitment of Credit Facility = $200 million Amount Outstanding at face value for Convertible Notes Stated rate = 30-Day LIBOR plus 135-195 bps Maturity includes first 10 years I/O Variable Rate Mortgage Loan fixed with Interest Rate Swap and Principal Amortization beginning during Q2 2018 Amount Outstanding Rate Maturity in Years Credit Facility (1) (3) $131.8 3.81% 4.0 Convertible Notes (2) $75.0 4.50% 0.8 CMBS Loan (4) $30.0 4.33% 15.4 Mortgage Loan (5) $24.3 3.17% 1.9 Totals/Average $261.1 4.01% 4.2 Liquidity & Flexibility Attractive Rates Largely Unsecured 20 $- $10,000 $20,000 $30,000 $40,000 $50,000 $60,000 $70,000 $80,000 $90,000 $16,898 $68,000 Available Credit Capacity Unrestricted Cash 1031 Restricted Cash |
RETURNING CAPITAL to SHAREHOLDERS (B)(D) CONSOLIDATED TOMOKA Cumulative From 2013 Through 5/31/19 Consistent Approach Accretive to NAV 21 Cumulative Shares Purchased Cumulative $ Repurchased ($ in millions) Share Buybacks(B)(D) % of CTO Shares outstanding 0.00% 0.44% 2.05% 2.60% 2.32% 2.89% (1) Includes repurchase of 320,741 shares on 4/10/19 from CTO’s largest shareholder, which was completed outside of the new $10 million buyback program Totals Since 2012 Shares Repurchased 1,123,566 Average Price/Share $55.18 % of Total Shares Outstanding >19% 8.72% $0.5 $1.4 $7.9 $15.3 $22.5 $32.3 $62.0 0 250,000 500,000 750,000 1,000,000 1,250,000 $- $10.0 $20.0 $30.0 $40.0 $50.0 $60.0 $70.0 2013 2014 2015 2016 2017 2018 2019 |
RETURNING CAPITAL to SHAREHOLDERS CONSOLIDATED TOMOKA 2012 Through Q2 2019 Disciplined Approach to Returning Capital 22 Annualized Dividend per Share INCREASING DIVIDEND + PAID QUARTERLY Dividends(G) Cumulative % increase in Dividend 50% 75% 100% 200% 350% 575% Note: 2019 based on annualization of Q2 2019 dividend of $0.10 per share CAGR: 39% $0.20 $0.40 900% $0.04 $0.06 $0.07 $0.08 $0.12 $0.18 $0.27 $0.20 $0.00 $0.05 $0.10 $0.15 $0.20 $0.25 $0.30 $0.35 $0.40 $0.45 2012 2013 2014 2015 2016 2017 2018 2019 |
2019 GUIDANCE CONSOLIDATED TOMOKA Monetizing Land Growing Free Cash Flow Recycling Capital 23 FY2019 Guidance Q1 2019 Actual (unless otherwise noted) Earnings Per Share (Basic) (1)(2) $6.75 - $7.50 $0.25 Incremental EPS (Basic) From Dispositions (2) $2.25 - $2.75 $0.96 Acquisition of Income-Producing Assets (3) $80mm - $120mm $29.3mm Target Investment Yield (Initial Yield – Unlevered) (3) 5.75% - 7.25% 6.47% Disposition of Income Properties (2) (3) $50mm - $100 mm $42.9mm Target Disposition Yield (2) (3) 7.50% - 8.50% 5.82% Land Transactions (Sales Value) (3) $50mm - $70mm $7.0mm Leverage Target (as % of Total Enterprise Value) (3) < 40% of TEV 45% Reaching full year target heavily dependent upon closing of certain land transactions Incremental EPS from Dispositions not included in EPS Guidance As of 5/31/19 |
CONSOLIDATED TOMOKA 24 APPENDIX |
CONSOLIDATED TOMOKA (1) Two properties Single-Tenant Portfolio (C) APPENDIX 25 As of May 31, 2019 (C) Lease contains rent escalations (1) Tenant/Building S&P Credit Rating Location Property Type Asset Type Rentable Square Feet Remaining Lease Term % of NOI Fidelity N/A Albuquerque, NM Office Single Tenant 210,067 9.5 10.4% Wells Fargo A+ Portland, OR Office Single Tenant 211,863 6.6 9.6% Wells Fargo A+ Raleigh, NC Office Single Tenant 450,393 5.3 8.4% Hilton Grand Vacations BB+ Orlando, FL Office Single Tenant 133,914 7.5 5.5% 24 Hour Fitness B Falls Church, VA Retail Single Tenant 46,000 8.6 4.2% AG Hill N/A Aspen, CO Retail Single Tenant 19,596 18.7 4.0% Lowe's BBB+ Katy, TX Retail Single Tenant 131,644 7.7 2.8% LA Fitness B+ Brandon, FL Retail Single Tenant 45,000 12.9 2.6% Harris Teeter BBB Charlotte, NC Retail Single Tenant 45,089 8.9 2.2% Landshark Bar & Grill NR Daytona Beach, FL Retail Single Tenant 6,264 13.7 2.2% CVS BBB Dallas, TX Retail Single Tenant 10,340 22.7 2.1% At Home B+ Raleigh, NC Retail Single Tenant 116,334 10.3 2.0% Reno Riverside BB Reno, NV Retail Single Tenant 52,474 0.5 2.0% Container Store NR Phoenix, AZ Retail Single Tenant 23,329 10.7 1.9% Rite Aid B Renton, WA Retail Single Tenant 16,280 7.1 1.7% Hobby Lobby N/A Winston-Salem, NC Retail Single Tenant 55,000 10.8 1.5% Dick's Sporting Goods NR McDonough, GA Retail Single Tenant 46,315 4.7 1.4% Jo-Ann Fabric B Saugus, MA Retail Single Tenant 22,500 9.7 1.4% Best Buy BBB McDonough, GA Retail Single Tenant 30,038 1.7 1.3% Big Lots BBB- Germantown, MD Retail Single Tenant 25,589 4.7 1.1% |
CONSOLIDATED TOMOKA Single-Tenant Portfolio (C) APPENDIX 26 As of May 31, 2019 (C) Lease contains rent escalations (1) Property formerly leased to Barnes & Noble, now subject to Ground Lease with WaWa, rent expected to commence in 2020 (1) Tenant/Building S&P Credit Rating Location Property Type Asset Type Rentable Square Feet Remaining Lease Term % of NOI Big Lots BBB- Glendale, AZ Retail Single Tenant 34,512 3.7 1.1% Walgreens BBB Alpharetta, GA Retail Single Tenant 15,120 6.4 1.1% Cocina214 NR Daytona Beach, FL Retail Single Tenant 5,780 13.7 1.1% Chuys N/A Jacksonville, FL Retail Single Tenant 7,950 13.3 1.1% Wawa N/A Jacksonville, FL Retail Single Tenant 6,267 18.6 1.1% Walgreens BBB Clermont, FL Retail Single Tenant 13,650 9.8 1.0% Firebirds N/A Jacksonville, FL Retail Single Tenant 6,948 8.4 0.9% Bank of America A+ Monterey, CA Retail Single Tenant 32,692 1.5 0.9% Staples B+ Sarasota, FL Retail Single Tenant 18,120 2.7 0.9% Outback BB Charlottesville, VA Retail Single Tenant 7,216 12.3 0.9% Chase A+ Jacksonville, FL Retail Single Tenant 3,614 18.3 0.8% Outback BB Charlotte, NC Retail Single Tenant 6,297 12.3 0.6% Outback BB Austin, TX Retail Single Tenant 6,176 12.3 0.6% Cheddars N/A Jacksonville, FL Retail Single Tenant 8,146 8.3 0.5% Scrubbles N/A Jacksonville, FL Retail Single Tenant 4,512 18.4 0.5% Carrabas BB Austin, TX Retail Single Tenant 6,528 12.3 0.5% Moes N/A Jacksonville, FL Retail Single Tenant 3,111 18.5 0.5% PDQ N/A Jacksonville, FL Retail Single Tenant 3,366 8.2 0.5% Macaroni Grill N/A Arlington, TX Retail Single Tenant 8,123 15.0 0.4% Wawa N/A Winter Park, FL Retail Single Tenant 6,119 19.7 0.4% Wawa NR Daytona Beach, FL Retail Single Tenant Total Single Tenant 1,902,276 9.3 83.8% Under Development |
CONSOLIDATED TOMOKA Multi-Tenant Portfolio APPENDIX 27 (C) As of May 31, 2019 (C) Lease contains rent escalations Tenant/Building S&P Credit Rating Location Property Type Asset Type Rentable Square Feet Remaining Lease Term % of NOI 3600 Peterson NR Santa Clara, CA Office Multi-Tenant 75,841 2.8 7.5% 245 Riverside Ave N/A Jacksonville, FL Office Multi-Tenant 136,856 2.8 6.3% Westcliff Shopping Center B Ft. Worth, TX Retail Multi-Tenant 136,185 3.2 1.5% Fuzzy's/World of Beer NR Brandon, FL Retail Multi-Tenant 6,715 5.4 0.5% 7-Eleven / Vacant AA- Dallas, TX Retail Multi-Tenant 4,685 5.3 0.3% Total - Multi-Tenant 360,282 3.0 16.2% |
CONSOLIDATED TOMOKA Top 10 Income Property APPENDIX 28 As of May 31, 2019 Albuquerque, New Mexico Asset Type Single-Tenant Office Tenant Fidelity Real Estate S&P Rating NR % of Portfolio NOI 10.4% Square Feet 210,067 Acres 25.34 Remaining Term 9.5 Year Built 2009 Purchase Date Oct 2018 Occupancy 100% Demographics 3-mile Population 3,820 3-mile Avg. HHI $54,109 3-mile Median HHI $33,589 |
CONSOLIDATED TOMOKA Top 10 Income Property APPENDIX 29 As of May 31, 2019 Hillsboro, Oregon Asset Type Single-Tenant Office Tenant Wells Fargo Bank, N.A. S&P Rating A+ % of Portfolio NOI 9.6% Square Feet 211,863 Acres 18.92 Remaining Term 6.6 Year Built 1978/2009 Purchase Date Oct 2017 Occupancy 100% Demographics 3-mile Population 154,454 3-mile Avg. HHI $101,832 3-mile Median HHI $86,312 |
CONSOLIDATED TOMOKA Top 10 Income Property APPENDIX 30 As of May 31, 2019 Raleigh, North Carolina Asset Type Single-Tenant Office Tenant Wells Fargo Bank, N.A. S&P Rating A+ % of Portfolio NOI 8.4% Square Feet 450,393 Acres 40.56 Remaining Term 5.3 Year Built 1996/1997 Purchase Date Nov 2015 Occupancy 100% Demographics 3-mile Population 66,925 3-mile Avg. HHI $85,716 3-mile Median HHI $65,931 |
|
|
CONSOLIDATED TOMOKA Top 10 Income Property APPENDIX 31 As of May 31, 2019 Santa Clara, California Asset Type Multi-Tenant Office Tenant Adesto Technologies Centrify Corp. S&P Rating NR % of Portfolio NOI 7.5% Square Feet 75,841 Acres 5.42 Remaining Term 2.8 Year Built 1978/2015 Purchase Date Oct 2016 Occupancy 100% Demographics 3-mile Population 188,131 3-mile Avg. HHI $154,090 3-mile Median HHI $125,045 |
CONSOLIDATED TOMOKA Top 10 Income Property APPENDIX 32 As of May 31, 2019 Jacksonville, Florida Asset Type Multi-Tenant Office Tenant Raymond James Northwestern Mutual S&P Rating NR % of Portfolio NOI 6.3% Square Feet 136,856 Acres 3.40 Remaining Term 2.8 Year Built 2003 Purchase Date Jul 2015 Occupancy 95% Demographics 3-mile Population 83,987 3-mile Avg. HHI $58,787 3-mile Median HHI $43,629 |
CONSOLIDATED TOMOKA Top 10 Income Property APPENDIX 33 As of May 31, 2019 Orlando, Florida Asset Type Single-Tenant Office Tenant Hilton Grand Vacations S&P Rating BB+ % of Portfolio NOI 5.5% Square Feet 133,914 Acres 14.84 Remaining Term 7.5 Year Built 1988/2000 Purchase Date Jan 2013 Occupancy 100% Demographics 3-mile Population 112,600 3-mile Avg. HHI $70,102 3-mile Median HHI $50,640 |
CONSOLIDATED TOMOKA Top 10 Income Property APPENDIX 34 As of May 31, 2019 Falls Church, Virginia Asset Type Single-Tenant Retail Tenant 24-Hour Fitness S&P Rating NR % of Portfolio NOI 4.2% Square Feet 46,000 Acres 3.09 Remaining Term 8.6 Year Built 2012 Purchase Date May 2019 Occupancy 100% Demographics 3-mile Population 205,499 3-mile Avg. HHI $162,587 3-mile Median HHI $126,254 |
CONSOLIDATED TOMOKA Top 10 Income Property APPENDIX 35 As of May 31, 2019 Aspen, Colorado Asset Type Single-Tenant Retail Tenant A.G. Hill S&P Rating NR % of Portfolio NOI 4.0% Square Feet 19,596 Acres n/a Remaining Term 18.7 Year Built 2015 Purchase Date Feb 2018 Occupancy 100% Demographics 3-mile Population 8,619 3-mile Avg. HHI $137,278 3-mile Median HHI $84,894 |
CONSOLIDATED TOMOKA Top 10 Income Property APPENDIX 36 As of May 31, 2019 Katy, Texas Asset Type Single-Tenant Retail Tenant Lowe’s S&P Rating BBB+ % of Portfolio NOI 2.8% Square Feet 131,644 Acres 15.48 Remaining Term 7.7 Year Built 1997 Purchase Date Apr 2014 Occupancy 100% Demographics 3-mile Population 111,404 3-mile Avg. HHI $114,158 3-mile Median HHI $90,712 |
CONSOLIDATED TOMOKA Top 10 Income Property APPENDIX 37 As of May 31, 2019 Brandon, Florida Asset Type Single-Tenant Retail Tenant LA Fitness S&P Rating B+ % of Portfolio NOI 2.6% Square Feet 45,000 Acres 5.28 Remaining Term 12.9 Year Built 2006 Purchase Date Apr 2017 Occupancy 100% Demographics 3-mile Population 96,694 3-mile Avg. HHI $73,403 3-mile Median HHI $58,003 |
APPENDIX CONSOLIDATED TOMOKA The Map 38 |
APPENDIX CONSOLIDATED TOMOKA > 700 Homes Sold Since Opening in Q4 2017 Active Adult Community – 3,400 Total Homes Planned Development in Progress on Land Sold by CTO 39 Commercial/Retail Development LPGA Blvd New Phases Amenities Under Construction |
APPENDIX CONSOLIDATED TOMOKA At Tomoka Town Center 276-Unit Luxury Rental Community Development in Progress on Land Sold by CTO 40 Projected development costs $39 million Leasing Commencement Q1 2019 |
APPENDIX CONSOLIDATED TOMOKA Membership Wholesale Club Only New Development of Sam’s Club in U.S. Development in Progress on Land Sold by CTO 41 Opening July 2019 |
APPENDIX CONSOLIDATED TOMOKA New Distribution Center & New Office Development in Progress on Land Sold by CTO 42 Last Mile Distribution Center for Amazon Future Home of Costa Del Mar |
APPENDIX CONSOLIDATED TOMOKA New Multi-Family Location 300 Unit Multi-Family Property 43 Development in Progress on Land Sold by CTO LPGA Blvd |
APPENDIX CONSOLIDATED TOMOKA Williamson Blvd. & Mason Avenue Self Storage Property 44 Development in Progress on Land Sold by CTO |
END NOTES CONSOLIDATED TOMOKA 45 End Notes references utilized in this presentation There can be no assurances regarding the value ultimately received for the Company’s assets, or in the case of the transactions under contract, the likelihood that such transactions will close or the timing or final terms thereof. Certain transactions require the Company to incur the cost to provide mitigation credits necessary for applicable regulatory permits for the buyer. There can be no assurances regarding the likelihood or timing of future execution of the Company’s share repurchase program. Net operating income (“NOI”) relates to our Income Property Operations segment and is calculated based on our current portfolio as of May 31, 2019 reflecting: (i) expected estimated annualized rents and costs as of and for the twelve months ending May 31, 2019; (ii) excluding non-cash items including straight-line rent and amortization of lease intangibles and depreciation; plus (iii) annual revenue from billboard leases. As of the date of this presentation, the Company meets the required coverage ratio in the Credit Facility for repurchases of stock and anticipates, subject to customary restrictions on share repurchases, to be able to continue to make repurchases. Debt amount includes the face value of the Convertible Notes and the Credit Facility balance as of 5/31/19. There can be no assurance that the cap rate range is the proper range for the Company’s portfolio of income properties or that such cap rate range would equate to an appropriate valuation range that the Company might achieve should the income property portfolio be sold as a portfolio, individually, or as part of more than one smaller portfolios comprising the entirety of the Company’s portfolio. Dividends are set by the Board of Directors and declared on a quarterly basis, there can be no assurances as to the likelihood or amount of dividends in the future. Investment grade tenants are defined as tenants with a credit rating of BBB- or higher from the S&P rating agency and is based on our annualized rental revenue that is generated from income properties leased to investment grade tenants, including properties leased to subsidiaries of investment grade companies. There can be no assurances regarding the likelihood of achieving the potential net operating cash flow. There can be no assurances regarding the amount of our total investments or the timing of such investments. |
NYSE American: CTO 2019 REITWEEK PRESENTATION Falls Church, Virginia Winston Salem, North Carolina CTO’s 50TH YEAR on the NYSE Contact Us Investor Relations: Mark E. Patten P: 386.944.5643 mpatten@ctlc.com For additional information, please see our most recent Annual Report on Form 10-K, copies of which may be obtained by writing the corporate secretary at the address noted, or at www.ctlc.com. 1140 N. Williamson Boulevard, Suite 140 Daytona Beach, FL 32114 P: 386.274.2202 Info@ctlc.com www.ctlc.com |