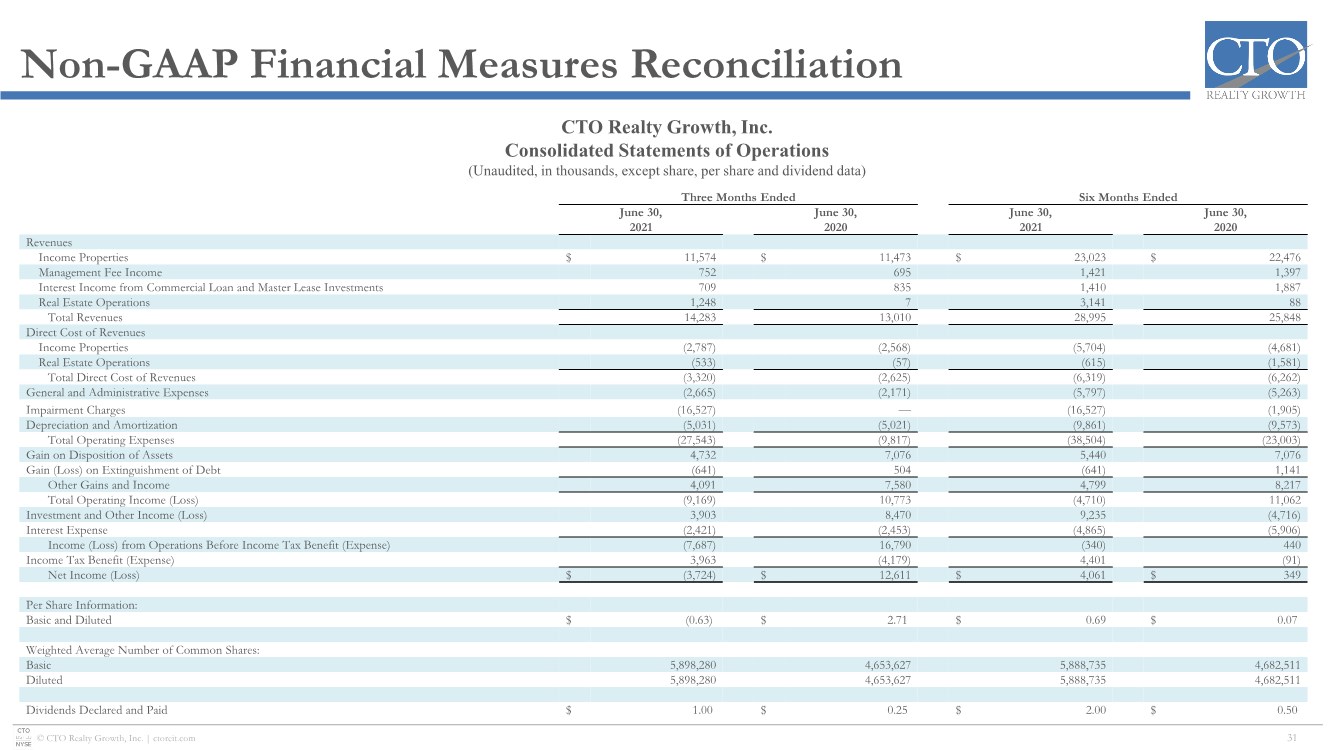
| © CTO Realty Growth, Inc. | ctoreit.com Non-GAAP Financial Measures Reconciliation 31 Three Months Ended Six Months Ended June 30, 2021 June 30, 2020 June 30, 2021 June 30, 2020 Revenues Income Properties $ 11,574 $ 11,473 $ 23,023 $ 22,476 Management Fee Income 752 695 1,421 1,397 Interest Income from Commercial Loan and Master Lease Investments 709 835 1,410 1,887 Real Estate Operations 1,248 7 3,141 88 Total Revenues 14,283 13,010 28,995 25,848 Direct Cost of Revenues Income Properties (2,787) (2,568) (5,704) (4,681) Real Estate Operations (533) (57) (615) (1,581) Total Direct Cost of Revenues (3,320) (2,625) (6,319) (6,262) General and Administrative Expenses (2,665) (2,171) (5,797) (5,263) Impairment Charges (16,527) —(16,527) (1,905) Depreciation and Amortization (5,031) (5,021) (9,861) (9,573) Total Operating Expenses (27,543) (9,817) (38,504) (23,003) Gain on Disposition of Assets 4,732 7,076 5,440 7,076 Gain (Loss) on Extinguishment of Debt (641) 504 (641) 1,141 Other Gains and Income 4,091 7,580 4,799 8,217 Total Operating Income (Loss) (9,169) 10,773 (4,710) 11,062 Investment and Other Income (Loss) 3,903 8,470 9,235 (4,716) Interest Expense (2,421) (2,453) (4,865) (5,906) Income (Loss) from Operations Before Income Tax Benefit (Expense) (7,687) 16,790 (340) 440 Income Tax Benefit (Expense) 3,963 (4,179) 4,401 (91) Net Income (Loss) $ (3,724) $ 12,611 $ 4,061 $ 349 Per Share Information: Basic and Diluted $ (0.63) $ 2.71 $ 0.69 $ 0.07 Weighted Average Number of Common Shares: Basic 5,898,280 4,653,627 5,888,735 4,682,511 Diluted 5,898,280 4,653,627 5,888,735 4,682,511 Dividends Declared and Paid $ 1.00 $ 0.25 $ 2.00 $ 0.50 CTO Realty Growth, Inc. Consolidated Statements of Operations (Unaudited, in thousands, except share, per share and dividend data) |